Embed Size (px)
Citation preview
Hindawi Publishing CorporationJournal of Biomedicine and BiotechnologyVolume 2010, Article ID 853916, 19 pagesdoi:10.1155/2010/853916
Review Article
Uncovering the Complexity of Transcriptomes with RNA-Seq
Valerio Costa,1 Claudia Angelini,2 Italia De Feis,2 and Alfredo Ciccodicola1
1 Institute of Genetics and Biophysics “A. Buzzati-Traverso”, IGB-CNR, 80131 Naples, Italy2 Istituto per le Applicazioni del Calcolo “Mauro Picone”, IAC-CNR, 80131 Naples, Italy
Correspondence should be addressed to Valerio Costa, [email protected]
Received 22 February 2010; Accepted 7 April 2010
Academic Editor: Momiao Xiong
Copyright © 2010 Valerio Costa et al. This is an open access article distributed under the Creative Commons Attribution License,which permits unrestricted use, distribution, and reproduction in any medium, provided the original work is properly cited.
In recent years, the introduction of massively parallel sequencing platforms for Next Generation Sequencing (NGS) protocols,able to simultaneously sequence hundred thousand DNA fragments, dramatically changed the landscape of the genetics studies.RNA-Seq for transcriptome studies, Chip-Seq for DNA-proteins interaction, CNV-Seq for large genome nucleotide variationsare only some of the intriguing new applications supported by these innovative platforms. Among them RNA-Seq is perhaps themost complex NGS application. Expression levels of specific genes, differential splicing, allele-specific expression of transcripts canbe accurately determined by RNA-Seq experiments to address many biological-related issues. All these attributes are not readilyachievable from previously widespread hybridization-based or tag sequence-based approaches. However, the unprecedented levelof sensitivity and the large amount of available data produced by NGS platforms provide clear advantages as well as new challengesand issues. This technology brings the great power to make several new biological observations and discoveries, it also requires aconsiderable effort in the development of new bioinformatics tools to deal with these massive data files. The paper aims to give asurvey of the RNA-Seq methodology, particularly focusing on the challenges that this application presents both from a biologicaland a bioinformatics point of view.
1. Introduction
It is commonly known that the genetic information isconveyed from DNA to proteins via the messenger RNA(mRNA) through a finely regulated process. To achievesuch a regulation, the concerted action of multiple cis-acting proteins that bind to gene flanking regions—“core”and “auxiliary” regions—is necessary [1]. In particular,core elements, located at the exons’ boundaries, are strictlyrequired for initiating the pre-mRNA processing events,whereas auxiliary elements, variable in number and location,are crucial for their ability to enhance or inhibit the basalsplicing activity of a gene.
Until recently—less than 10 years ago—the centraldogma of genetics indicated with the term “gene” a DNAportion whose corresponding mRNA encodes a protein.According to this view, RNA was considered a “bridge” inthe transfer of biological information between DNA andproteins, whereas the identity of each expressed gene, andof its transcriptional levels, were commonly indicated as“transcriptome” [2]. It was considered to mainly consist of
ribosomal RNA (80–90%, rRNA), transfer RNA (5–15%,tRNA), mRNA (2–4%) and a small fraction of intragenic(i.e., intronic) and intergenic noncoding RNA (1%, ncRNA)with undefined regulatory functions [3]. Particularly, bothintragenic and intergenic sequences, enriched in repetitiveelements, have long been considered genetically inert, mainlycomposed of “junk” or “selfish” DNA [4]. More recentlyit has been shown that the amount of noncoding DNA(ncDNA) increases with organism complexity, ranging from0.25% of prokaryotes’ genome to 98.8% of humans [5].These observations have strengthened the evidence thatncDNA, rather than being junk DNA, is likely to representthe main driving force accounting for diversity and biologicalcomplexity of living organisms.
Since the dawn of genetics, the relationship betweenDNA content and biological complexity of living organismshas been a fruitful field of speculation and debate [6]. Todate, several studies, including recent analyses performedduring the ENCODE project, have shown the pervasivenature of eukaryotic transcription with almost the full lengthof nonrepeat regions of the genome being transcribed [7].
2 Journal of Biomedicine and Biotechnology
The unexpected level of complexity emerging with thediscovery of endogenous small interfering RNA (siRNA) andmicroRNA (miRNA) was only the tip of the iceberg [8].Long interspersed noncoding RNA (lincRNA), promoter-and terminator-associated small RNA (PASR and TASR,resp.), transcription start site-associated RNA (TSSa-RNA),transcription initiation RNA (tiRNA) and many others [8]represent part of the interspersed and crosslinking piecesof a complicated transcription puzzle. Moreover, to causefurther difficulties, there is the evidence that most of thepervasive transcripts identified thus far, have been foundonly in specific cell lines (in most of cases in mutant cell lines)with particular growth conditions, and/or particular tissues.In light of this, discovering and interpreting the complexityof a transcriptome represents a crucial aim for understandingthe functional elements of such a genome. Revealing thecomplexity of the genetic code of living organisms byanalyzing the molecular constituents of cells and tissues, willdrive towards a more complete knowledge of many biologicalissues such as the onset of disease and progression.
The main goal of the whole transcriptome analyses isto identify, characterize and catalogue all the transcriptsexpressed within a specific cell/tissue—at a particular stage—with the great potential to determine the correct splicingpatterns and the structure of genes, and to quantify thedifferential expression of transcripts in both physio- andpathological conditions [9].
In the last 15 years, the development of the hybridiza-tion technology, together with the tag sequence-basedapproaches, allowed to get a first deep insight into thisfield, but, beyond a shadow of doubt, the arrival on themarketplace of the NGS platforms, with all their “Seq” appli-cations, has completely revolutionized the way of thinkingthe molecular biology.
The aim of this paper is to give an overview of theRNA-Seq methodology, trying to highlight all the challengesthat this application presents from both the biological andbioinformatics point of view.
2. Next Generation Sequencing Technologies
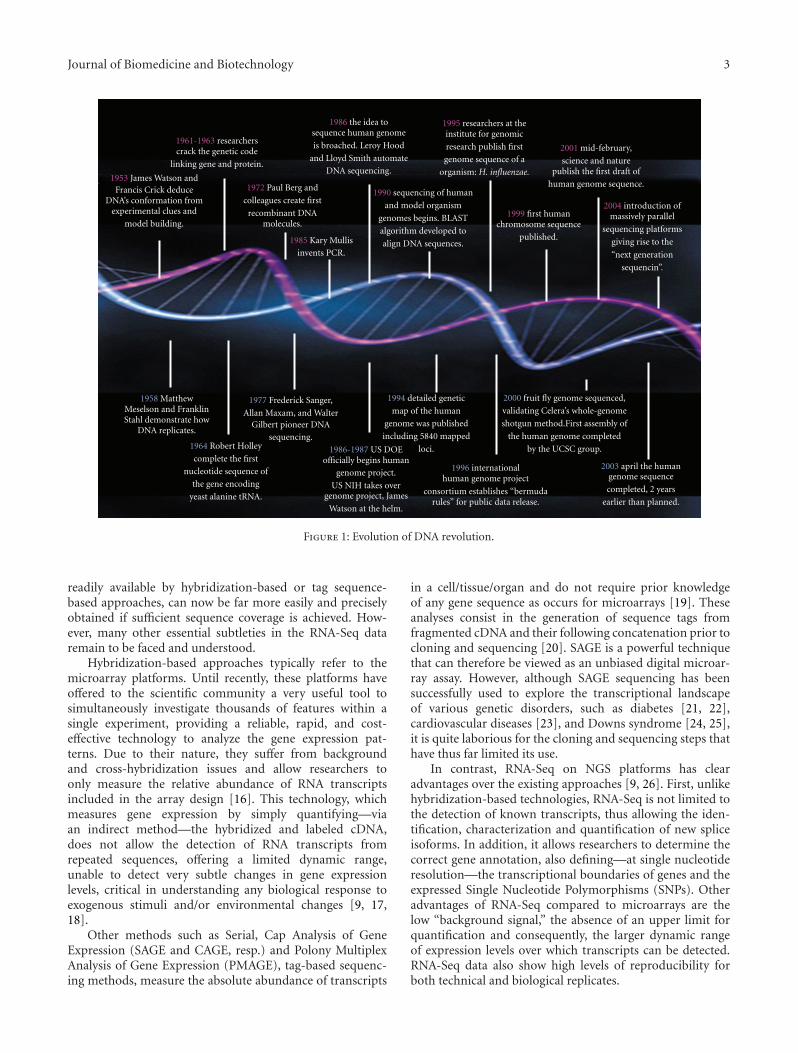
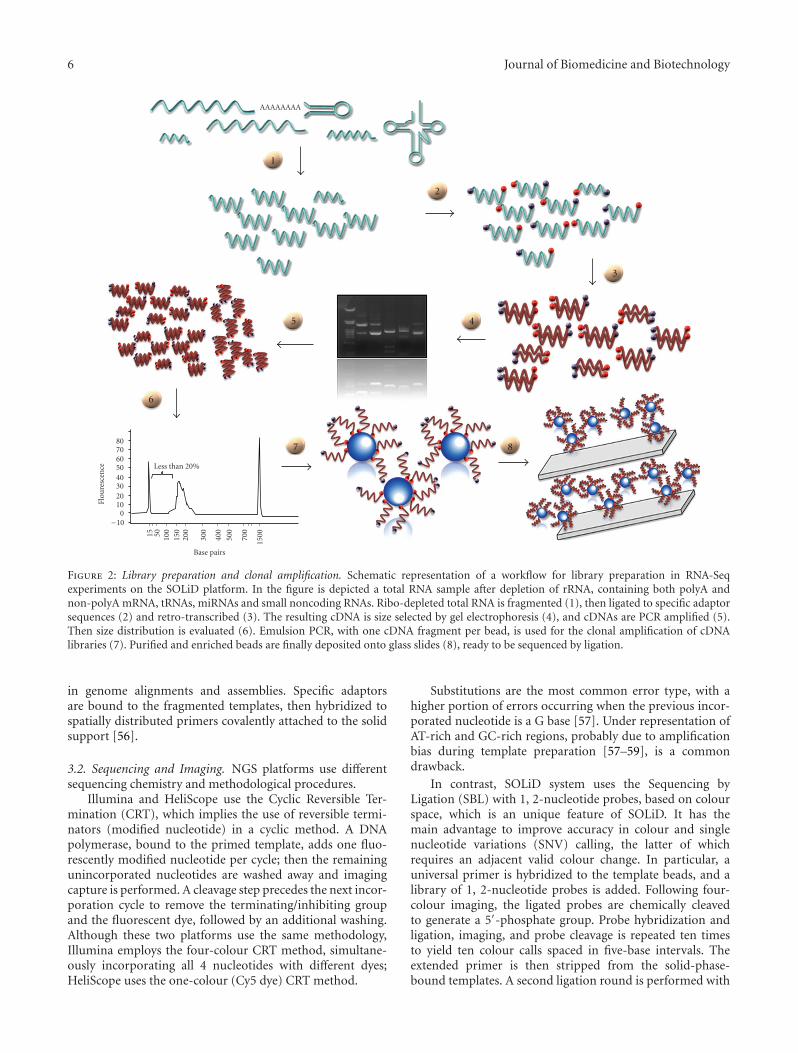
Since the first complete nucleotide sequence of a gene, pub-lished in 1964 by Holley [10] and the initial developmentsof Maxam and Gilbert [11] and Sanger et al. [12] in the1970s (see Figure 1), the world of nucleic acid sequencingwas a RNA world and the history of nucleic acid sequencingtechnology was largely contained within the history of RNAsequencing.
In the last 30 years, molecular biology has undergonegreat advances and 2004 will be remembered as the yearthat revolutionized the field; thanks to the introductionof massively parallel sequencing platforms, the Next Gen-eration Sequencing-era, [13–15], started. Pioneer of theseinstruments was the Roche (454) Genome Sequencer (GS)in 2004 (http://www.454.com/), able to simultaneouslysequence several hundred thousand DNA fragments, witha read length greater than 100 base pairs (bp). The cur-rent GS FLX Titanium produces greater than 1 million
reads in excess of 400 bp. It was followed in 2006 bythe Illumina Genome Analyzer (GA) (http://www.illumina.com/) capable to generate tens of millions of 32-bp reads.Today, the Illumina GAIIx produces 200 million 75–100 bpreads. The last to arrive in the marketplace was the AppliedBiosystems platform based on Sequencing by Oligo Ligationand Detection (SOLiD) (http://www3.appliedbiosystems.com/AB Home/index.htm), capable of producing 400 mil-lion 50-bp reads, and the Helicos BioScience HeliS-cope (http://www.helicosbio.com/), the first single-moleculesequencer that produces 400 millions 25–35 bp reads.
While the individual approaches considerably vary intheir technical details, the essence of these systems is theminiaturization of individual sequencing reactions. Each ofthese miniaturized reactions is seeded with DNA molecules,at limiting dilutions, such that there is a single DNA moleculein each, which is first amplified and then sequenced. To bemore precise, the genomic DNA is randomly broken intosmaller sizes from which either fragment templates or mate-pair templates are created. A common theme among NGStechnologies is that the template is attached to a solid surfaceor support (immobilization by primer or template) or indi-rectly immobilized (by linking a polymerase to the support).The immobilization of spatially separated templates allowssimultaneous thousands to billions of sequencing reactions.The physical design of these instruments allows for anoptimal spatial arrangement of each reaction, enabling anefficient readout by laser scanning (or other methods) formillions of individual sequencing reactions onto a standardglass slide. While the immense volume of data generated isattractive, it is arguable that the elimination of the cloningstep for the DNA fragments to sequence is the greatest benefitof these new technologies. All current methods allow thedirect use of small DNA/RNA fragments not requiring theirinsertion into a plasmid or other vector, thereby removinga costly and time-consuming step of traditional Sangersequencing.
It is beyond a shadow of doubt that the arrival ofNGS technologies in the marketplace has changed the waywe think about scientific approaches in basic, applied andclinical research. The broadest application of NGS may be theresequencing of different genomes and in particular, humangenomes to enhance our understanding of how geneticdifferences affect health and disease. Indeed, these platformshave been quickly applied to many genomic contexts givingrise to the following “Seq” protocols: RNA-Seq for transcrip-tomics, Chip-Seq for DNA-protein interaction, DNase-Seqfor the identification of most active regulatory regions, CNV-Seq for copy number variation, and methyl-Seq for genomewide profiling of epigenetic marks.
3. RNA-Seq
RNA-Seq is perhaps one of the most complex next-generation applications. Expression levels, differential splic-ing, allele-specific expression, RNA editing and fusion tran-scripts constitute important information when comparingsamples for disease-related studies. These attributes, not
Journal of Biomedicine and Biotechnology 3
1961-1963 researcherscrack the genetic code
linking gene and protein.
1953 James Watson andFrancis Crick deduce
DNA’s conformation fromexperimental clues and
model building.
1972 Paul Berg and
colleagues create first
recombinant DNAmolecules.
1985 Kary Mullis
invents PCR.
1986 the idea tosequence human genome
is broached. Leroy Hood
and Lloyd Smith automate
DNA sequencing.
1990 sequencing of human
and model organism
genomes begins. BLAST
algorithm developed to
align DNA sequences.
1995 researchers at theinstitute for genomic
research publish first
genome sequence of a
organism: H. influenzae.
1999 first humanchromosome sequence
published.
2001 mid-february,
science and naturepublish the first draft of
human genome sequence.
2004 introduction ofmassively parallel
sequencing platforms
giving rise to the
“next generation
sequencin”.
1958 MatthewMeselson and FranklinStahl demonstrate how
DNA replicates.
1964 Robert Holley
complete the first
nucleotide sequence of
the gene encoding
yeast alanine tRNA.
1977 Frederick Sanger,
Allan Maxam, and WalterGilbert pioneer DNA
sequencing.
1986-1987 US DOEofficially begins human
genome project.
US NIH takes overgenome project, James
Watson at the helm.
1994 detailed genetic
map of the human
genome was published
including 5840 mapped
loci.
1996 internationalhuman genome project
consortium establishes “bermudarules” for public data release.
2000 fruit fly genome sequenced,
validating Celera’s whole-genome
shotgun method.First assembly of
the human genome completed
by the UCSC group.
2003 april the humangenome sequence
completed, 2 years
earlier than planned.
Figure 1: Evolution of DNA revolution.
readily available by hybridization-based or tag sequence-based approaches, can now be far more easily and preciselyobtained if sufficient sequence coverage is achieved. How-ever, many other essential subtleties in the RNA-Seq dataremain to be faced and understood.
Hybridization-based approaches typically refer to themicroarray platforms. Until recently, these platforms haveoffered to the scientific community a very useful tool tosimultaneously investigate thousands of features within asingle experiment, providing a reliable, rapid, and cost-effective technology to analyze the gene expression pat-terns. Due to their nature, they suffer from backgroundand cross-hybridization issues and allow researchers toonly measure the relative abundance of RNA transcriptsincluded in the array design [16]. This technology, whichmeasures gene expression by simply quantifying—viaan indirect method—the hybridized and labeled cDNA,does not allow the detection of RNA transcripts fromrepeated sequences, offering a limited dynamic range,unable to detect very subtle changes in gene expressionlevels, critical in understanding any biological response toexogenous stimuli and/or environmental changes [9, 17,18].
Other methods such as Serial, Cap Analysis of GeneExpression (SAGE and CAGE, resp.) and Polony MultiplexAnalysis of Gene Expression (PMAGE), tag-based sequenc-ing methods, measure the absolute abundance of transcripts
in a cell/tissue/organ and do not require prior knowledgeof any gene sequence as occurs for microarrays [19]. Theseanalyses consist in the generation of sequence tags fromfragmented cDNA and their following concatenation prior tocloning and sequencing [20]. SAGE is a powerful techniquethat can therefore be viewed as an unbiased digital microar-ray assay. However, although SAGE sequencing has beensuccessfully used to explore the transcriptional landscapeof various genetic disorders, such as diabetes [21, 22],cardiovascular diseases [23], and Downs syndrome [24, 25],it is quite laborious for the cloning and sequencing steps thathave thus far limited its use.
In contrast, RNA-Seq on NGS platforms has clearadvantages over the existing approaches [9, 26]. First, unlikehybridization-based technologies, RNA-Seq is not limited tothe detection of known transcripts, thus allowing the iden-tification, characterization and quantification of new spliceisoforms. In addition, it allows researchers to determine thecorrect gene annotation, also defining—at single nucleotideresolution—the transcriptional boundaries of genes and theexpressed Single Nucleotide Polymorphisms (SNPs). Otheradvantages of RNA-Seq compared to microarrays are thelow “background signal,” the absence of an upper limit forquantification and consequently, the larger dynamic rangeof expression levels over which transcripts can be detected.RNA-Seq data also show high levels of reproducibility forboth technical and biological replicates.
4 Journal of Biomedicine and Biotechnology
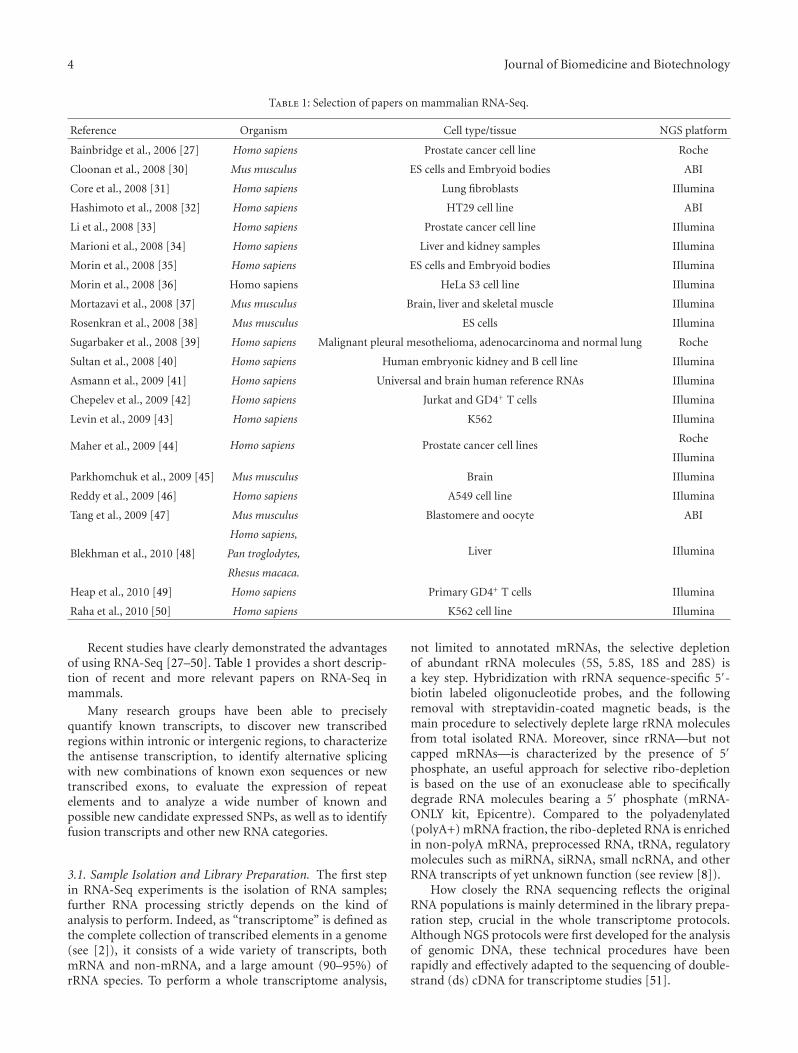
Table 1: Selection of papers on mammalian RNA-Seq.
Reference Organism Cell type/tissue NGS platform
Bainbridge et al., 2006 [27] Homo sapiens Prostate cancer cell line Roche
Cloonan et al., 2008 [30] Mus musculus ES cells and Embryoid bodies ABI
Core et al., 2008 [31] Homo sapiens Lung fibroblasts IIlumina
Hashimoto et al., 2008 [32] Homo sapiens HT29 cell line ABI
Li et al., 2008 [33] Homo sapiens Prostate cancer cell line IIlumina
Marioni et al., 2008 [34] Homo sapiens Liver and kidney samples IIlumina
Morin et al., 2008 [35] Homo sapiens ES cells and Embryoid bodies IIlumina
Morin et al., 2008 [36] Homo sapiens HeLa S3 cell line IIlumina
Mortazavi et al., 2008 [37] Mus musculus Brain, liver and skeletal muscle IIlumina
Rosenkran et al., 2008 [38] Mus musculus ES cells IIlumina
Sugarbaker et al., 2008 [39] Homo sapiens Malignant pleural mesothelioma, adenocarcinoma and normal lung Roche
Sultan et al., 2008 [40] Homo sapiens Human embryonic kidney and B cell line IIlumina
Asmann et al., 2009 [41] Homo sapiens Universal and brain human reference RNAs IIlumina
Chepelev et al., 2009 [42] Homo sapiens Jurkat and GD4+ T cells IIlumina
Levin et al., 2009 [43] Homo sapiens K562 IIlumina
Maher et al., 2009 [44] Homo sapiens Prostate cancer cell linesRoche
IIlumina
Parkhomchuk et al., 2009 [45] Mus musculus Brain IIlumina
Reddy et al., 2009 [46] Homo sapiens A549 cell line IIlumina
Tang et al., 2009 [47] Mus musculus Blastomere and oocyte ABI
Blekhman et al., 2010 [48]
Homo sapiens,
Liver IIluminaPan troglodytes,
Rhesus macaca.
Heap et al., 2010 [49] Homo sapiens Primary GD4+ T cells IIlumina
Raha et al., 2010 [50] Homo sapiens K562 cell line IIlumina
Recent studies have clearly demonstrated the advantagesof using RNA-Seq [27–50]. Table 1 provides a short descrip-tion of recent and more relevant papers on RNA-Seq inmammals.
Many research groups have been able to preciselyquantify known transcripts, to discover new transcribedregions within intronic or intergenic regions, to characterizethe antisense transcription, to identify alternative splicingwith new combinations of known exon sequences or newtranscribed exons, to evaluate the expression of repeatelements and to analyze a wide number of known andpossible new candidate expressed SNPs, as well as to identifyfusion transcripts and other new RNA categories.
3.1. Sample Isolation and Library Preparation. The first stepin RNA-Seq experiments is the isolation of RNA samples;further RNA processing strictly depends on the kind ofanalysis to perform. Indeed, as “transcriptome” is defined asthe complete collection of transcribed elements in a genome(see [2]), it consists of a wide variety of transcripts, bothmRNA and non-mRNA, and a large amount (90–95%) ofrRNA species. To perform a whole transcriptome analysis,
not limited to annotated mRNAs, the selective depletionof abundant rRNA molecules (5S, 5.8S, 18S and 28S) isa key step. Hybridization with rRNA sequence-specific 5′-biotin labeled oligonucleotide probes, and the followingremoval with streptavidin-coated magnetic beads, is themain procedure to selectively deplete large rRNA moleculesfrom total isolated RNA. Moreover, since rRNA—but notcapped mRNAs—is characterized by the presence of 5′
phosphate, an useful approach for selective ribo-depletionis based on the use of an exonuclease able to specificallydegrade RNA molecules bearing a 5′ phosphate (mRNA-ONLY kit, Epicentre). Compared to the polyadenylated(polyA+) mRNA fraction, the ribo-depleted RNA is enrichedin non-polyA mRNA, preprocessed RNA, tRNA, regulatorymolecules such as miRNA, siRNA, small ncRNA, and otherRNA transcripts of yet unknown function (see review [8]).
How closely the RNA sequencing reflects the originalRNA populations is mainly determined in the library prepa-ration step, crucial in the whole transcriptome protocols.Although NGS protocols were first developed for the analysisof genomic DNA, these technical procedures have beenrapidly and effectively adapted to the sequencing of double-strand (ds) cDNA for transcriptome studies [51].
Journal of Biomedicine and Biotechnology 5
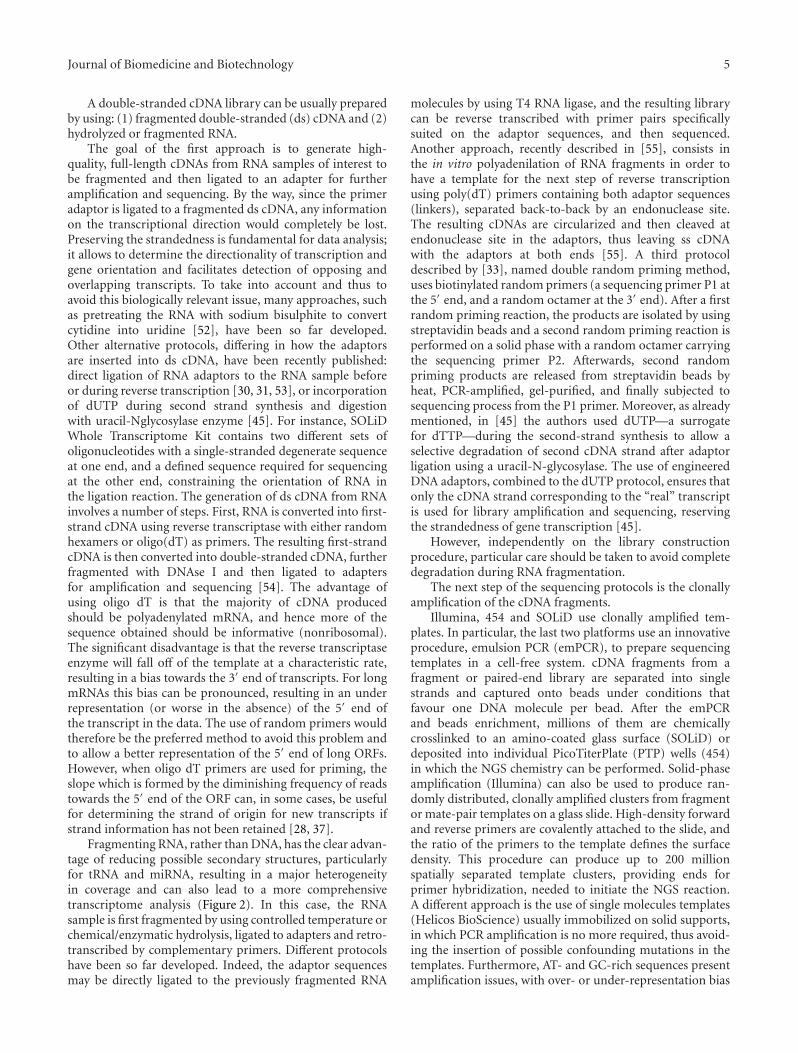
A double-stranded cDNA library can be usually preparedby using: (1) fragmented double-stranded (ds) cDNA and (2)hydrolyzed or fragmented RNA.
The goal of the first approach is to generate high-quality, full-length cDNAs from RNA samples of interest tobe fragmented and then ligated to an adapter for furtheramplification and sequencing. By the way, since the primeradaptor is ligated to a fragmented ds cDNA, any informationon the transcriptional direction would completely be lost.Preserving the strandedness is fundamental for data analysis;it allows to determine the directionality of transcription andgene orientation and facilitates detection of opposing andoverlapping transcripts. To take into account and thus toavoid this biologically relevant issue, many approaches, suchas pretreating the RNA with sodium bisulphite to convertcytidine into uridine [52], have been so far developed.Other alternative protocols, differing in how the adaptorsare inserted into ds cDNA, have been recently published:direct ligation of RNA adaptors to the RNA sample beforeor during reverse transcription [30, 31, 53], or incorporationof dUTP during second strand synthesis and digestionwith uracil-Nglycosylase enzyme [45]. For instance, SOLiDWhole Transcriptome Kit contains two different sets ofoligonucleotides with a single-stranded degenerate sequenceat one end, and a defined sequence required for sequencingat the other end, constraining the orientation of RNA inthe ligation reaction. The generation of ds cDNA from RNAinvolves a number of steps. First, RNA is converted into first-strand cDNA using reverse transcriptase with either randomhexamers or oligo(dT) as primers. The resulting first-strandcDNA is then converted into double-stranded cDNA, furtherfragmented with DNAse I and then ligated to adaptersfor amplification and sequencing [54]. The advantage ofusing oligo dT is that the majority of cDNA producedshould be polyadenylated mRNA, and hence more of thesequence obtained should be informative (nonribosomal).The significant disadvantage is that the reverse transcriptaseenzyme will fall off of the template at a characteristic rate,resulting in a bias towards the 3′ end of transcripts. For longmRNAs this bias can be pronounced, resulting in an underrepresentation (or worse in the absence) of the 5′ end ofthe transcript in the data. The use of random primers wouldtherefore be the preferred method to avoid this problem andto allow a better representation of the 5′ end of long ORFs.However, when oligo dT primers are used for priming, theslope which is formed by the diminishing frequency of readstowards the 5′ end of the ORF can, in some cases, be usefulfor determining the strand of origin for new transcripts ifstrand information has not been retained [28, 37].
Fragmenting RNA, rather than DNA, has the clear advan-tage of reducing possible secondary structures, particularlyfor tRNA and miRNA, resulting in a major heterogeneityin coverage and can also lead to a more comprehensivetranscriptome analysis (Figure 2). In this case, the RNAsample is first fragmented by using controlled temperature orchemical/enzymatic hydrolysis, ligated to adapters and retro-transcribed by complementary primers. Different protocolshave been so far developed. Indeed, the adaptor sequencesmay be directly ligated to the previously fragmented RNA
molecules by using T4 RNA ligase, and the resulting librarycan be reverse transcribed with primer pairs specificallysuited on the adaptor sequences, and then sequenced.Another approach, recently described in [55], consists inthe in vitro polyadenilation of RNA fragments in order tohave a template for the next step of reverse transcriptionusing poly(dT) primers containing both adaptor sequences(linkers), separated back-to-back by an endonuclease site.The resulting cDNAs are circularized and then cleaved atendonuclease site in the adaptors, thus leaving ss cDNAwith the adaptors at both ends [55]. A third protocoldescribed by [33], named double random priming method,uses biotinylated random primers (a sequencing primer P1 atthe 5′ end, and a random octamer at the 3′ end). After a firstrandom priming reaction, the products are isolated by usingstreptavidin beads and a second random priming reaction isperformed on a solid phase with a random octamer carryingthe sequencing primer P2. Afterwards, second randompriming products are released from streptavidin beads byheat, PCR-amplified, gel-purified, and finally subjected tosequencing process from the P1 primer. Moreover, as alreadymentioned, in [45] the authors used dUTP—a surrogatefor dTTP—during the second-strand synthesis to allow aselective degradation of second cDNA strand after adaptorligation using a uracil-N-glycosylase. The use of engineeredDNA adaptors, combined to the dUTP protocol, ensures thatonly the cDNA strand corresponding to the “real” transcriptis used for library amplification and sequencing, reservingthe strandedness of gene transcription [45].
However, independently on the library constructionprocedure, particular care should be taken to avoid completedegradation during RNA fragmentation.
The next step of the sequencing protocols is the clonallyamplification of the cDNA fragments.
Illumina, 454 and SOLiD use clonally amplified tem-plates. In particular, the last two platforms use an innovativeprocedure, emulsion PCR (emPCR), to prepare sequencingtemplates in a cell-free system. cDNA fragments from afragment or paired-end library are separated into singlestrands and captured onto beads under conditions thatfavour one DNA molecule per bead. After the emPCRand beads enrichment, millions of them are chemicallycrosslinked to an amino-coated glass surface (SOLiD) ordeposited into individual PicoTiterPlate (PTP) wells (454)in which the NGS chemistry can be performed. Solid-phaseamplification (Illumina) can also be used to produce ran-domly distributed, clonally amplified clusters from fragmentor mate-pair templates on a glass slide. High-density forwardand reverse primers are covalently attached to the slide, andthe ratio of the primers to the template defines the surfacedensity. This procedure can produce up to 200 millionspatially separated template clusters, providing ends forprimer hybridization, needed to initiate the NGS reaction.A different approach is the use of single molecules templates(Helicos BioScience) usually immobilized on solid supports,in which PCR amplification is no more required, thus avoid-ing the insertion of possible confounding mutations in thetemplates. Furthermore, AT- and GC-rich sequences presentamplification issues, with over- or under-representation bias
6 Journal of Biomedicine and Biotechnology
1
2
3
45
6
7 8
AAAAAAAAFl
oure
scen
ce
−100
1020304050607080
Base pairs
15 50 100
150
200
300
400
500
700
1500
Less than 20%
Figure 2: Library preparation and clonal amplification. Schematic representation of a workflow for library preparation in RNA-Seqexperiments on the SOLiD platform. In the figure is depicted a total RNA sample after depletion of rRNA, containing both polyA andnon-polyA mRNA, tRNAs, miRNAs and small noncoding RNAs. Ribo-depleted total RNA is fragmented (1), then ligated to specific adaptorsequences (2) and retro-transcribed (3). The resulting cDNA is size selected by gel electrophoresis (4), and cDNAs are PCR amplified (5).Then size distribution is evaluated (6). Emulsion PCR, with one cDNA fragment per bead, is used for the clonal amplification of cDNAlibraries (7). Purified and enriched beads are finally deposited onto glass slides (8), ready to be sequenced by ligation.
in genome alignments and assemblies. Specific adaptorsare bound to the fragmented templates, then hybridized tospatially distributed primers covalently attached to the solidsupport [56].
3.2. Sequencing and Imaging. NGS platforms use differentsequencing chemistry and methodological procedures.
Illumina and HeliScope use the Cyclic Reversible Ter-mination (CRT), which implies the use of reversible termi-nators (modified nucleotide) in a cyclic method. A DNApolymerase, bound to the primed template, adds one fluo-rescently modified nucleotide per cycle; then the remainingunincorporated nucleotides are washed away and imagingcapture is performed. A cleavage step precedes the next incor-poration cycle to remove the terminating/inhibiting groupand the fluorescent dye, followed by an additional washing.Although these two platforms use the same methodology,Illumina employs the four-colour CRT method, simultane-ously incorporating all 4 nucleotides with different dyes;HeliScope uses the one-colour (Cy5 dye) CRT method.
Substitutions are the most common error type, with ahigher portion of errors occurring when the previous incor-porated nucleotide is a G base [57]. Under representation ofAT-rich and GC-rich regions, probably due to amplificationbias during template preparation [57–59], is a commondrawback.
In contrast, SOLiD system uses the Sequencing byLigation (SBL) with 1, 2-nucleotide probes, based on colourspace, which is an unique feature of SOLiD. It has themain advantage to improve accuracy in colour and singlenucleotide variations (SNV) calling, the latter of whichrequires an adjacent valid colour change. In particular, auniversal primer is hybridized to the template beads, and alibrary of 1, 2-nucleotide probes is added. Following four-colour imaging, the ligated probes are chemically cleavedto generate a 5′-phosphate group. Probe hybridization andligation, imaging, and probe cleavage is repeated ten timesto yield ten colour calls spaced in five-base intervals. Theextended primer is then stripped from the solid-phase-bound templates. A second ligation round is performed with
Journal of Biomedicine and Biotechnology 7
a n − 1 primer, which resets the interrogation bases and thecorresponding ten colour calls one position to the left. Tenligation cycles ensue, followed by three rounds of ligationcycles. Colour calls from the five-ligation rounds are thenordered into a linear sequence (the csfasta colour space) andaligned to a reference genome to decode the sequence. Themost common error type observed by using this platform aresubstitutions, and, similar to Illumina, SOLiD data have alsorevealed an under representation of AT- and GC-rich regions[58].
Another approach is pyrosequencing (on 454), a non-electrophoretic bioluminescence method, that unlike theabove-mentioned sequencing approaches is able to measurethe release of pyrophosphate by proportionally convertingit into visible light after enzymatic reactions. Upon incor-poration of the complementary dNTP, DNA polymeraseextends the primer and pauses. DNA synthesis is reinitiatedfollowing the addition of the next complementary dNTP inthe dispensing cycle. The enzymatic cascade generates a lightrecorded as a flowgram with a series of picks correspondingto a particular DNA sequence. Insertions and deletions arethe most common error types.
An excellent and detailed review about the biotechnolog-ical aspects of NGS platforms can be found in [15].
3.3. From Biology to Bioinformatics. The unprecedented levelof sensitivity in the data produced by NGS platforms bringswith it the power to make many new biological observations,at the cost of a considerable effort in the development of newbioinformatics tools to deal with these massive data files.
First of all, the raw image files from one run of somenext generation sequencers can require terabytes of storage,meaning that simply moving the data off the machine canrepresent a technical challenge for the computer networksof many research centers. Moreover, even when the dataare transferred from the machine for subsequent processing,common desktop computer will be hopelessly outmatchedby the volume of data from a single run. As a result, the use ofa small cluster of computers is extremely beneficial to reducecomputational bottleneck.
Another issue is the availability of software required toperform downstream analysis. Indeed after image and signalprocessing the output of a RNA-Seq experiment consists of10–400 millions of short reads (together with their base-call quality values), typically of 30–400 bp, depending on theDNA sequencing technology used, its version and the totalcost of the experiments.
NGS data analysis heavily relies on proper mapping ofsequencing reads to corresponding reference genomes oron their efficient de novo assembly. Mapping NGS readswith high efficiency and reliability currently faces severalchallenges. As noticed by [60], differences between thesequencing platforms in samples preparation, chemistry,type and volume of raw data, and data formats are verylarge, implying that each platform produces data affectedby characteristic error profiles. For example the 454 systemcan produce reads with insertion or deletion errors duringhomopolymer runs and generate fewer, but longer, sequences
in fasta like format allowing to adapt classical alignmentalgorithms; the Illumina has an increased likelihood toaccumulate sequence errors toward the end of the read andproduce fasta reads, but they are shorter, hence requiringspecific alignment algorithms; the SOLiD also tends toaccumulate bias at the end of the reads, but uses di-baseencoding strategy and each sequence output is encoded ina colour space csfasta format. Hence, some sequence errorsare correctable, providing better discrimination betweensequencing error and polymorphism, at the cost of requiringanalysis tools explicitly built for handling this aspect of thedata. It is not surprising that there are no “box standard”software available for end-users, hence the implementationof individualized data processing pipelines, combining thirdpart packages and new computational methods, is the onlyadvisable approach. While some existing packages are alreadyenabling to solve general aspects of RNA-Seq analysis, theyalso require a time consuming effort due to the lack of cleardocumentation in most of the algorithms and the varietyof the formats. Indeed, a much clear documentation of thealgorithms is needed to ensure a full understanding of theprocessed data. Community adoption of input/output dataformats for reference alignments, assemblies and detectedvariants is also essential for ease the data managementproblem. Solving these issues may simply shift the softwaregap from sequence processing (base-calling, alignment orassembly, positional counting and variant detection) tosequence analysis (annotation and functional impact).
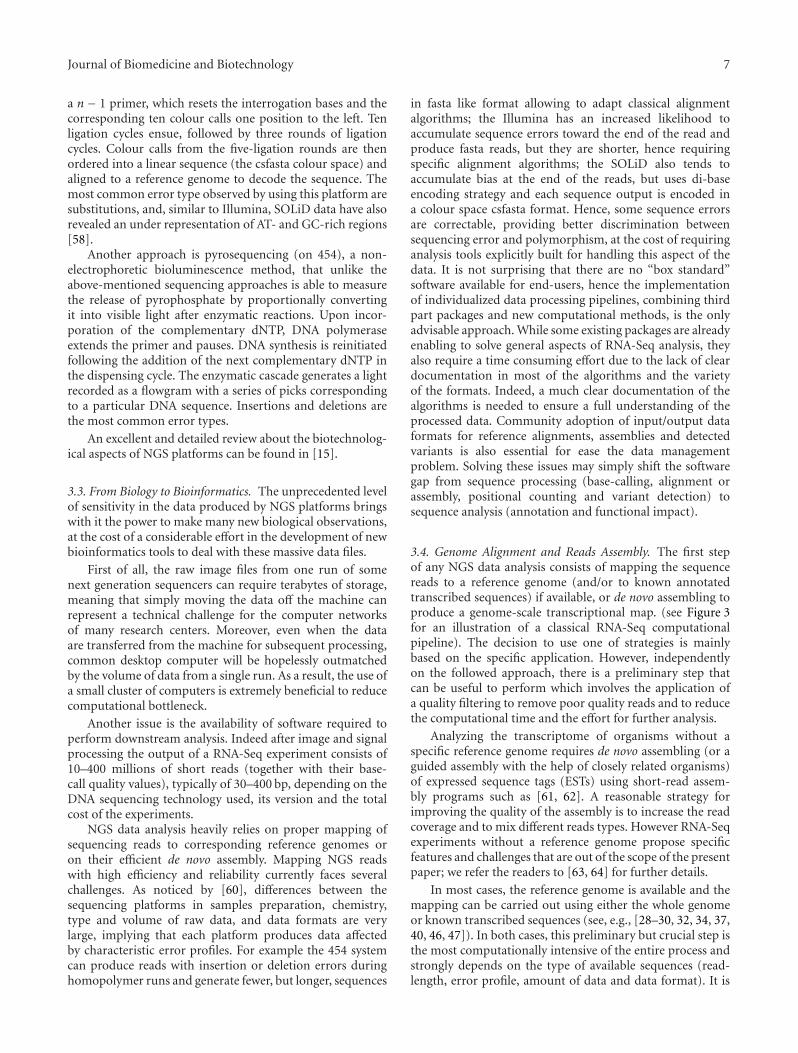
3.4. Genome Alignment and Reads Assembly. The first stepof any NGS data analysis consists of mapping the sequencereads to a reference genome (and/or to known annotatedtranscribed sequences) if available, or de novo assembling toproduce a genome-scale transcriptional map. (see Figure 3for an illustration of a classical RNA-Seq computationalpipeline). The decision to use one of strategies is mainlybased on the specific application. However, independentlyon the followed approach, there is a preliminary step thatcan be useful to perform which involves the application ofa quality filtering to remove poor quality reads and to reducethe computational time and the effort for further analysis.
Analyzing the transcriptome of organisms without aspecific reference genome requires de novo assembling (or aguided assembly with the help of closely related organisms)of expressed sequence tags (ESTs) using short-read assem-bly programs such as [61, 62]. A reasonable strategy forimproving the quality of the assembly is to increase the readcoverage and to mix different reads types. However RNA-Seqexperiments without a reference genome propose specificfeatures and challenges that are out of the scope of the presentpaper; we refer the readers to [63, 64] for further details.
In most cases, the reference genome is available and themapping can be carried out using either the whole genomeor known transcribed sequences (see, e.g., [28–30, 32, 34, 37,40, 46, 47]). In both cases, this preliminary but crucial step isthe most computationally intensive of the entire process andstrongly depends on the type of available sequences (read-length, error profile, amount of data and data format). It is
8 Journal of Biomedicine and Biotechnology
Referencegenome
Junctionslibrary
Alignment/mapping software
Short reads files
Quality files
Uniquely mappablereads (UMRs)
Multi-locationmappable reads
(MMRs)
”Unmatched” reads
Quantification on target regions
Gene expression Novel transcripts Isoformsdetection
Isoformsabundance
Statistical tests for differential expression
Figure 3: RNA-Seq computational pipeline.
not surprising that such nodal point still constitutes a veryprominent area of research (see, e.g., [65–67] for a review)and has produced a great number of different algorithms inthe last couple of years (e.g., [68–78]). Clearly, not all of themcompletely support the available platforms or are scalablefor all amount of throughput or genome size. Nevertheless,the sequencing technologies are still in a developing phasewith a very fast pace of increase in throughput, reads lengthand data formats after few months. Consequently, the alreadyavailable mapping/assembly software are continuously underevolution in order to adapt themselves to the new dataformats, to scale with the amount of data and to reduce theircomputational demand. New softwares are also continuouslycomplementing the panorama. Moreover, the alignmentphase of reads from RNA-Seq experiments presents manyother subtleties to be considered; standard mapping algo-rithms are not able to fully exploit the complexity of thetranscriptome, requiring to be modified or adapted in orderto account for splicing events in eucaryotes.
The easiest way to handle such difficulty is to map thereads directly on known transcribed sequences, with theobvious drawback of missing new transcripts. Alternatively,
the reads can be mapped continuously to the genome, butwith the added opportunity of mapping reads that crosssplice junctions. In this case, the algorithms differ fromwhether they require or not junctions’s model. Algorithmssuch as Erange [37] or RNA-mate [79] require libraryof junctions constructed using known splice junctionsextracted from data-bases and also supplemented with anyset of putative splice junctions obtained, for instance, using acombinatorial approach on genes’ model or ESTs sequences.Clearly, such approaches do not allow to map junctionsnot previously assembled in the junctions’ library. On theother hand, algorithms like the WT [69], QPALMA [80],TopHat [81], G.Mo.R-Se [63], and PASS [78] potentiallyallow to detect new splice isoforms, since they use a moresophisticated mapping strategy. For instance, WT [69] splitsthe reads in left and right pieces, aligns each part to thegenome, then attempts to extend each alignment on theother side to detect the junction. Whereas TopHat [81]first maps the reads against the whole reference genomeusing [77], second aggregates the mapped reads in islandsof candidate exons on which compute a consensus measure,then generates potential donor/acceptor splice sites using
Journal of Biomedicine and Biotechnology 9
neighboring exons, and finally tries to align the reads,unmapped to the genome, to these splice junction sequences.
Most of the RNA-Seq packages are built on top ofoptimized short read core mappers [68, 69, 72, 77] andthe mapping strategy is carried out by performing multipleruns or cycles. At the end of each cycle the unmatchedreads are trimmed from one extreme and another step ofalignment is attempted (see, e.g., [79]). Specific tolerancescan be set for each alignment in order to increase the amountof mappable data. Obviously the simplest core approach is tomap the sequence reads across the genome allowing the userto specify only the number of tolerated mismatches, althoughother methods allow to use also gapped alignment. Suchflexibility can be beneficial for the rest of the analysis sinceboth sequencing errors, that usually increase with the lengthof the sequence, and SNPs may cause substitutions andinsertion/deletion of nucleotides in the reads. On the otherhand, increasing the mapping flexibility also introduces ahigher level of noise in the data. The compromise betweenthe number of mapped reads and the quality of the resultingmapping is a very time consuming process without anoptimal solution.
At the end of the mapping algorithm one can distinguishbetween three types of reads: reads that map uniquely tothe genome or to the splice junctions (Uniquely MappableReads, UMR), reads with multiple (equally or similarlylikely) locations either to the genome or to the splicejunctions (Multilocation Mappable Reads, MMR) and readswithout a specific mapping location. MMRs arise predomi-nantly from conserved domains of paralogous gene familiesand from repeats. The fraction of mappable reads that areMMRs depends on the length of the read, the genome underinvestigation, and the expression in the individual sample;however it is typically between 10–40% for mammalianderived libraries [30, 37]. Most of the studies [28, 34]usually discarded MMRs from further analysis, limiting theattention only to UMRs. Clearly, this omission introducesexperimental bias, decreases the coverage and reduces thepossibility of investigating expressed regions such as activeretrotransposons and gene families. An alternative strategyfor the removal of the MMRs is to probabilistically assignthem to each genomic location they map to. The simplestassignment considers equal probabilities. However, far betterresults have been obtained using a guilt-by-associationstrategy that calculates the probability of a MMRs originatingfrom a particular locus. In [82], the authors proposedto proportionally assign MMRs to each of their mappinglocations based on unique coincidences with either UMRsand other MMRs. Such a technique was later adopted in [79].By contrast, in [83], the authors computed the probabilityas the ratio between the number of UMRs occurring in anominal window surrounding each locus occupied by theconsidered MMR and the total number of UMRs proximalto all loci associated with that MMR. Similarly, in [37] theMMRs were fractionally assigned to their different possiblelocations considering the expression levels of their respectivegene models. All these rescue strategies lead to substantiallyhigher transcriptome coverage and give expression estimatesin better agreement with microarrays than those using only
UMRs (see, [37, 83]). Very recently, a more sophisticatedapproach was proposed in [84]. The authors introducedlatent random variables representing the true mappings,with the parameters of the graphical model correspond-ing to isoform expression levels, read distributions acrosstranscripts, and sequencing error. They allocated MMRs bymaximizing the likelihood of the expression levels usingan Expectation-Maximization (EM) algorithm. Additionally,they also showed that previous rescue methods introducedin [37, 82] are roughly equivalent to one iteration of EM.Independently on the specific proposal, we observe that allthe above mentioned techniques work much better withdata that preserve RNA strandedness. Alternatively, the useof paired-end protocols should help to alleviate the MMRsproblem. Indeed, when one of the paired reads maps to ahighly repetitive element in the genome but the second doesnot, it allows both reads to be unambiguously mapped to thereference genome. This is accomplished by first matching thefirst nonrepeat read uniquely to a genomic position and thenlooking within a size window, based on the known size rangeof the library fragments, for a match for the second read. Theusefulness of this approach was demonstrated to improveread matching from 85% (single reads) to 93% (pairedreads) [70], allowing a significant improvement in genomecoverage, particularly in repeat regions. Currently, all ofthe next generation sequencing technologies are capable forgenerating data from paired-end reads, but unfortunately,till now only few RNA-Seq software support the use ofpaired-end reads in conjunction with the splice junctionsmapping.
One of the possible reasons for reads not mappingto the genome and splice junctions is the presence ofhigher sequencing errors in the sequence. Other reasons canbe identified in higher polymorphisms, insertion/deletion,complex exon-exon junctions, miRNA and small ncRNA:such situations could potentially be recovered by moresophisticated or combined alignment strategy.
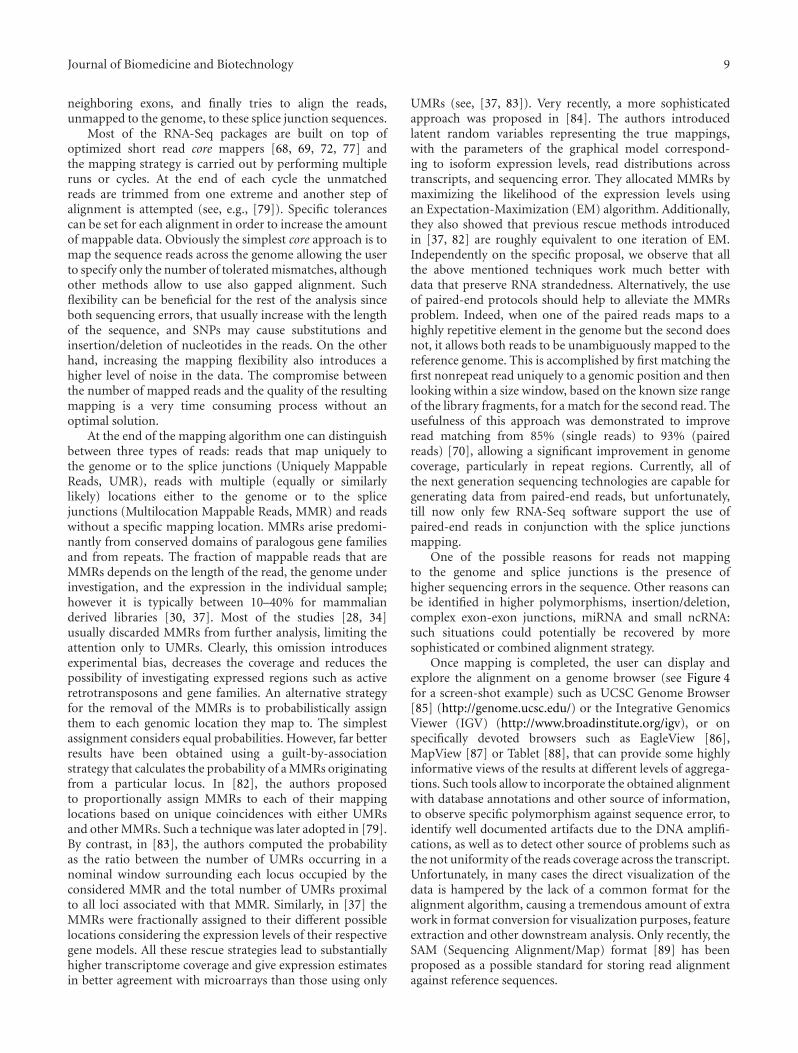
Once mapping is completed, the user can display andexplore the alignment on a genome browser (see Figure 4for a screen-shot example) such as UCSC Genome Browser[85] (http://genome.ucsc.edu/) or the Integrative GenomicsViewer (IGV) (http://www.broadinstitute.org/igv), or onspecifically devoted browsers such as EagleView [86],MapView [87] or Tablet [88], that can provide some highlyinformative views of the results at different levels of aggrega-tions. Such tools allow to incorporate the obtained alignmentwith database annotations and other source of information,to observe specific polymorphism against sequence error, toidentify well documented artifacts due to the DNA amplifi-cations, as well as to detect other source of problems such asthe not uniformity of the reads coverage across the transcript.Unfortunately, in many cases the direct visualization of thedata is hampered by the lack of a common format for thealignment algorithm, causing a tremendous amount of extrawork in format conversion for visualization purposes, featureextraction and other downstream analysis. Only recently, theSAM (Sequencing Alignment/Map) format [89] has beenproposed as a possible standard for storing read alignmentagainst reference sequences.
10 Journal of Biomedicine and Biotechnology
Scalechr 19
60.5
Strand +
162.5
Stand −
1
DNM2DNM2DNM2DNM2DNM2DNM2DNM2TMED1
| 10942000 | 10942500 | 10943000 | 10943500 | 10944000 | 10944500 | 10945000 | 10945500 | 10946000 | 10946500 | 10947000 |2 kb
UCSC genes based on refseq, uniprot, genbank, CCDS and comparative genomics
(a)
p13.3 p13.2 p13.13 p13.11 p12 p11 q11 q12 q13.11 q13.12 q13.2 q13.31 q13.33 q13.41 q13.43
943.100 bp 10.943.200 bp 10.943.300 bp 10.943.400 bp 10.943.500 bp 10.943.600 bp 10.943.700 bp678 bp
TMED1
(b)
p13.3 p13.2 p13.13 p13.11 p12 p11 q11 q12 q13.11 q13.12 q13.2 q13.31 q13.33 q13.41 q13.43
10.943.140 bp 10.943.150 bp 10.943.160 bp 10.943.170 bp 10.943.180 bp 10.943.190 bp 10.943.200 bp 10.943.210 bp
83 bp
TMED1
(c)
Figure 4: Strand-Specific Read Distribution in UCSC Genome Browser and IGV. (a) UCSC Genome Browser showing an example of strandedsequences generated by RNA-Seq experiment on NGS platform. In particular, the screenshot—of a characteristic “tail to tail” orientationof two human genes—clearly shows the specific expression in both strands where these two genes overlap, indicating that the strandednessof reads is preserved. (b) The same genomic location in the IGV browser, showing the reads (coloured blocks) distribution along TMED1gene. The grey arrows indicate the sense of transcription. The specific expression in both strands where the genes overlap, indicates that thestrandedness of reads is preserved. In (c) a greater magnification of the reads mapping to the same region at nucleotide level, useful to SNPanalysis. The chromosome positions are shown at the top and genomic loci of the genes are shown at the bottom of each panel.
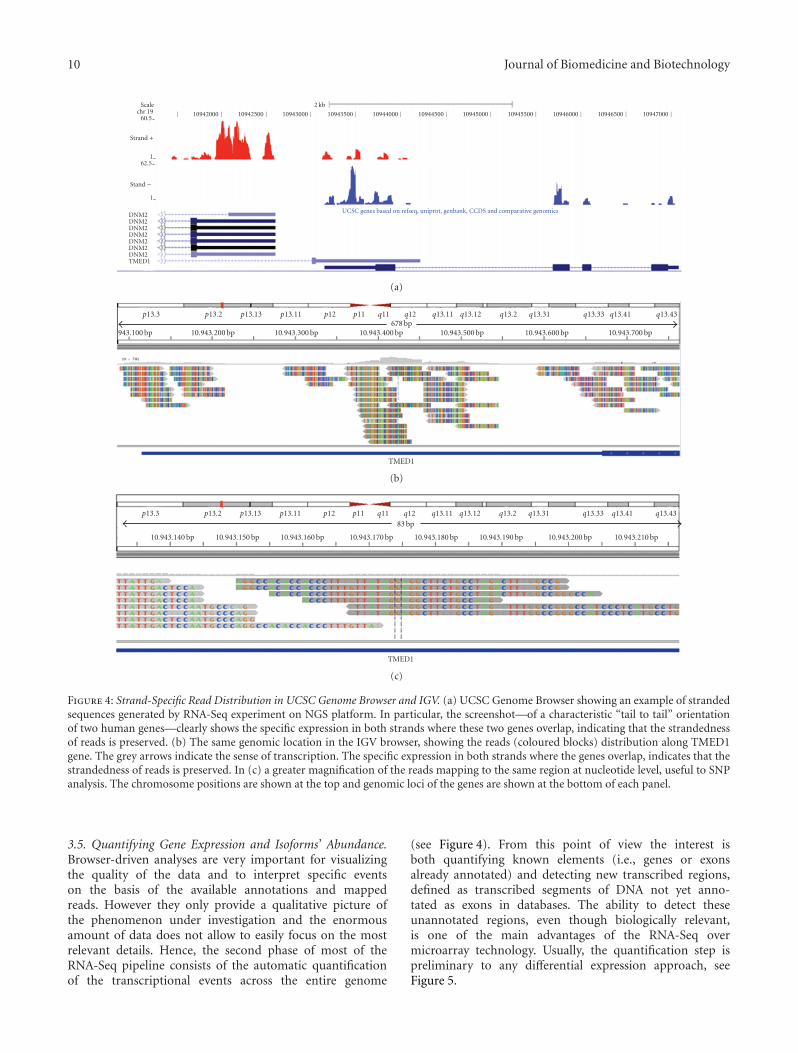
3.5. Quantifying Gene Expression and Isoforms’ Abundance.Browser-driven analyses are very important for visualizingthe quality of the data and to interpret specific eventson the basis of the available annotations and mappedreads. However they only provide a qualitative picture ofthe phenomenon under investigation and the enormousamount of data does not allow to easily focus on the mostrelevant details. Hence, the second phase of most of theRNA-Seq pipeline consists of the automatic quantificationof the transcriptional events across the entire genome
(see Figure 4). From this point of view the interest isboth quantifying known elements (i.e., genes or exonsalready annotated) and detecting new transcribed regions,defined as transcribed segments of DNA not yet anno-tated as exons in databases. The ability to detect theseunannotated regions, even though biologically relevant,is one of the main advantages of the RNA-Seq overmicroarray technology. Usually, the quantification step ispreliminary to any differential expression approach, seeFigure 5.
Journal of Biomedicine and Biotechnology 11
Exon
Intron
Sequence read
Signal from annoted exons
Non-exonic signal
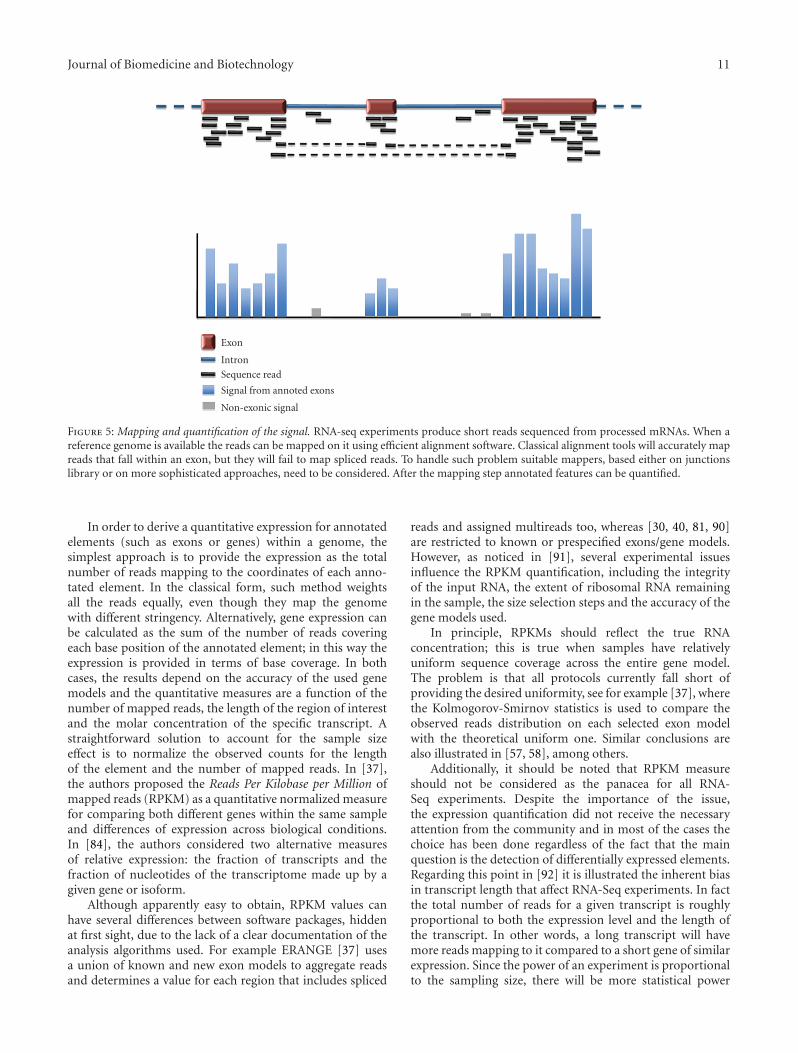
Figure 5: Mapping and quantification of the signal. RNA-seq experiments produce short reads sequenced from processed mRNAs. When areference genome is available the reads can be mapped on it using efficient alignment software. Classical alignment tools will accurately mapreads that fall within an exon, but they will fail to map spliced reads. To handle such problem suitable mappers, based either on junctionslibrary or on more sophisticated approaches, need to be considered. After the mapping step annotated features can be quantified.
In order to derive a quantitative expression for annotatedelements (such as exons or genes) within a genome, thesimplest approach is to provide the expression as the totalnumber of reads mapping to the coordinates of each anno-tated element. In the classical form, such method weightsall the reads equally, even though they map the genomewith different stringency. Alternatively, gene expression canbe calculated as the sum of the number of reads coveringeach base position of the annotated element; in this way theexpression is provided in terms of base coverage. In bothcases, the results depend on the accuracy of the used genemodels and the quantitative measures are a function of thenumber of mapped reads, the length of the region of interestand the molar concentration of the specific transcript. Astraightforward solution to account for the sample sizeeffect is to normalize the observed counts for the lengthof the element and the number of mapped reads. In [37],the authors proposed the Reads Per Kilobase per Million ofmapped reads (RPKM) as a quantitative normalized measurefor comparing both different genes within the same sampleand differences of expression across biological conditions.In [84], the authors considered two alternative measuresof relative expression: the fraction of transcripts and thefraction of nucleotides of the transcriptome made up by agiven gene or isoform.
Although apparently easy to obtain, RPKM values canhave several differences between software packages, hiddenat first sight, due to the lack of a clear documentation of theanalysis algorithms used. For example ERANGE [37] usesa union of known and new exon models to aggregate readsand determines a value for each region that includes spliced
reads and assigned multireads too, whereas [30, 40, 81, 90]are restricted to known or prespecified exons/gene models.However, as noticed in [91], several experimental issuesinfluence the RPKM quantification, including the integrityof the input RNA, the extent of ribosomal RNA remainingin the sample, the size selection steps and the accuracy of thegene models used.
In principle, RPKMs should reflect the true RNAconcentration; this is true when samples have relativelyuniform sequence coverage across the entire gene model.The problem is that all protocols currently fall short ofproviding the desired uniformity, see for example [37], wherethe Kolmogorov-Smirnov statistics is used to compare theobserved reads distribution on each selected exon modelwith the theoretical uniform one. Similar conclusions arealso illustrated in [57, 58], among others.
Additionally, it should be noted that RPKM measureshould not be considered as the panacea for all RNA-Seq experiments. Despite the importance of the issue,the expression quantification did not receive the necessaryattention from the community and in most of the cases thechoice has been done regardless of the fact that the mainquestion is the detection of differentially expressed elements.Regarding this point in [92] it is illustrated the inherent biasin transcript length that affect RNA-Seq experiments. In factthe total number of reads for a given transcript is roughlyproportional to both the expression level and the length ofthe transcript. In other words, a long transcript will havemore reads mapping to it compared to a short gene of similarexpression. Since the power of an experiment is proportionalto the sampling size, there will be more statistical power
12 Journal of Biomedicine and Biotechnology
to detect differential expression for longer genes. Therefore,short transcripts will always be at a statistical disadvantagerelative to long transcripts in the same sample. RPKM-type measures provide an expression level normalized bythe length of the gene and this only apparently solves theproblem; it gives an unbiased measure of the expressionlevel, but also changes the variance of the data in a lengthdependent manner, resulting in the same bias to differentialexpression estimation. In order to account for such aninherent bias, in [92] the authors proposed to use a fixedlength window approach, with a window size smaller thanthe smallest gene. This method can calculate aggregatedtag counts for each window and consequently assess themfor differential expression. However, since the analysis isperformed at the window level some proportion of the datawill be discarded; moreover such an approach suffers for areduced power and highly expressed genes are more likely tobe detected due to the fact that the sample variance decreaseswith the expression level. Indeed, it should be noticed thatthe sample variance depends on both the transcript lengthand the expression level.
Finally, we observe that annotation files are ofteninaccurate; boundaries are not always mapped precisely,ambiguities and overlaps among transcripts often occur andare not yet completely solved. Concerning this issue in [93]the authors proposed a method based on the definitionof “union-intersection genes” to define the genomic regionof interest and normalized absolute and relative expressionmeasures within. Also, in this case we observe that allstrategies work much better with data that preserve RNAstrandedness, which is an extremely valuable informationfor transcriptome annotation, especially for regions withoverlapping transcription from opposite directions.
The quantification methods described above do notaccount for new transcribed region. Although several studieshave already demonstrated that RNA-Seq experiments, withtheir high resolution and sensitivity have great potentialityin revealing many new transcribed regions, unidentifiableby microarrays, the detection of new transcribed regions ismainly obtained by means of a sliding window and heuristicapproaches. In [94] stretches of contiguous expression inintergenic regions are identified after removing all UTRsfrom the intergenic search space by using a combinationof information arising from tiling-chip and sequence dataand visual inspection and manual curation. The procedureis quite complex and is mainly due to the lack of strand-edness information in their experiment. On the contrary,the hybridization data are less affected by these issuesbecause they distinguish transcriptional direction and do notshow any 5′ bias (see [94] for further details). Then, newtranscribed regions are required to have a length of at least70 bp and an average sequence coverage of 5 reads per bp.A similar approach, with different choices of the thresholdand the window, was proposed in [40], where the authorsinvestigated either intergenic and intronic regions. Thechoices of the parameters are assessed by estimating noiselevels by means of a Poisson model of the noncoding partof the genome. In [45] the whole genome is split into 50 bpwindows (non-overlapping). A genomic region is defined
as a new transcribed region if it results from the union oftwo consecutive windows, with at least two sequence readsmapped per window. Additionally, the gap between eachnew transcribed regions should be at least 50 bp, and thegap between a new transcribed region and an annotatedgene (with the same strand) at least 100 bp. A slightly moresophisticated approach is used in ERANGE [37]. Reads thatdo not fall within known exons are aggregated into candidateexons by requiring regions with at least 15 reads, whose startsare not separated by more than 30 bp. Most of the candidateexons are assigned to neighboring gene models when they arewithin a specifiable distance of the model.
These studies, among others, reveal many of these newtranscribed regions. Unfortunately, most of them do notseem to encode any protein, and hence their functionsremain often to be determined. In any case, these newtranscribed regions, combined with many undiscovered newsplicing variants, suggest that there is considerably moretranscript complexity than previously appreciated. Conse-quently further RNA-Seq experiments and more sophisti-cated analysis methods can disclose it.
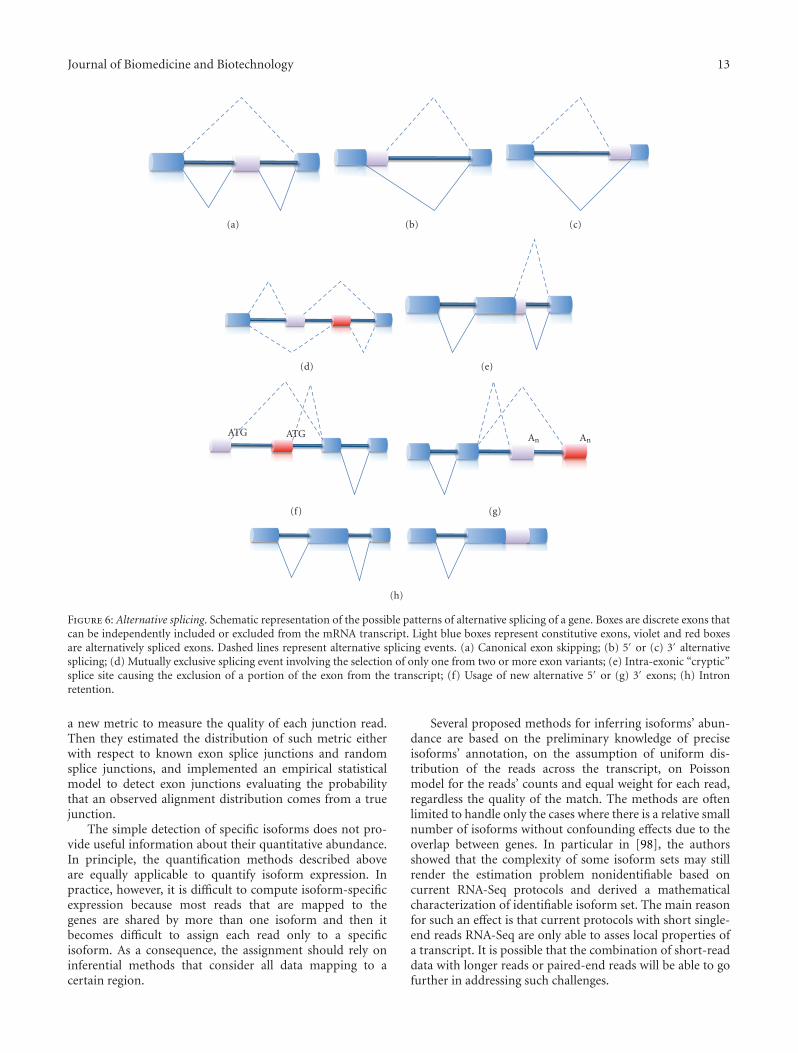
The complexity of mammalian transcriptomes is alsocompounded by alternative splicing which allows one geneto produce multiple transcript isoforms. Alternative splicingincludes events such as exon skipping, alternative 5′ or3′ splicing, mutually exclusive exons, intron retention, and“cryptic” splice sites (see Figure 6). The frequency of occur-rence of alternative splicing events is still underestimated.However it is well known that multiple transcript isoformsproduced from a single gene can lead to protein isoformswith distinct functions, and that alternative splicing iswidely involved in different physiological and pathologicalprocesses. One of the most important advantages of theRNA-Seq experiments is the possibility of understandingand comparing the transcriptome at the isoform level (see[95, 96]). In this context, two computational problems needto be solved: the detection of different isoforms and theirquantification in terms of transcript abundance.
Initial proposals for solving these problems were essen-tially based on a gene-by-gene manual inspection usuallyfocusing the attention to the detection of the presence ofalternative splicing forms rather than to their quantification.For example, the knowledge of exon-exon junction reads andof junctions that fall into some isoform-specific regions canprovide useful information for identifying different isoforms.The reliability of a splicing junction is usually assessed bycounting features like the number of reads mapping to thejunction, the number of mismatches on each mapped read,the mapping position on the junction and the mismatcheslocation in a sort of heuristic approach. Unfortunately, thesetechniques cannot be scaled to the genome level and they areaffected by a high false positive and false negative rate.
Following the above mentioned ideas, in [40] the authorsdetected junctions by computing the probability of a randomhits for a read of length R on the splice junctions of length Jwith at most a certain number of mismatches. In [95], theauthors used several information similar to those describedabove to train classifiers based on logistic regression forsplicing junction detection. In [97], the authors introduced
Journal of Biomedicine and Biotechnology 13
(a) (b) (c)
(d) (e)
ATG ATG
(f)
An An
(g)
(h)
Figure 6: Alternative splicing. Schematic representation of the possible patterns of alternative splicing of a gene. Boxes are discrete exons thatcan be independently included or excluded from the mRNA transcript. Light blue boxes represent constitutive exons, violet and red boxesare alternatively spliced exons. Dashed lines represent alternative splicing events. (a) Canonical exon skipping; (b) 5′ or (c) 3′ alternativesplicing; (d) Mutually exclusive splicing event involving the selection of only one from two or more exon variants; (e) Intra-exonic “cryptic”splice site causing the exclusion of a portion of the exon from the transcript; (f) Usage of new alternative 5′ or (g) 3′ exons; (h) Intronretention.
a new metric to measure the quality of each junction read.Then they estimated the distribution of such metric eitherwith respect to known exon splice junctions and randomsplice junctions, and implemented an empirical statisticalmodel to detect exon junctions evaluating the probabilitythat an observed alignment distribution comes from a truejunction.
The simple detection of specific isoforms does not pro-vide useful information about their quantitative abundance.In principle, the quantification methods described aboveare equally applicable to quantify isoform expression. Inpractice, however, it is difficult to compute isoform-specificexpression because most reads that are mapped to thegenes are shared by more than one isoform and then itbecomes difficult to assign each read only to a specificisoform. As a consequence, the assignment should rely oninferential methods that consider all data mapping to acertain region.
Several proposed methods for inferring isoforms’ abun-dance are based on the preliminary knowledge of preciseisoforms’ annotation, on the assumption of uniform dis-tribution of the reads across the transcript, on Poissonmodel for the reads’ counts and equal weight for each read,regardless the quality of the match. The methods are oftenlimited to handle only the cases where there is a relative smallnumber of isoforms without confounding effects due to theoverlap between genes. In particular in [98], the authorsshowed that the complexity of some isoform sets may stillrender the estimation problem nonidentifiable based oncurrent RNA-Seq protocols and derived a mathematicalcharacterization of identifiable isoform set. The main reasonfor such an effect is that current protocols with short single-end reads RNA-Seq are only able to asses local properties ofa transcript. It is possible that the combination of short-readdata with longer reads or paired-end reads will be able to gofurther in addressing such challenges.
14 Journal of Biomedicine and Biotechnology
Recently, in [90] the authors proposed a statisticalmethod where, similar to [34], the count of reads falling intoan annotated gene with multiple isoforms is modeled as aPoisson variable. They inferred the expression of each indi-vidual isoform using maximum likelihood approach, whosesolution has been obtained by solving a convex optimizationproblem. In order to quantify the degree of uncertainty ofthe estimates, they carried out statistical inferences about theparameters from the posterior distribution by importancesampling. Interestingly, they showed that their method canbe viewed as an extension of the RPKM concept and reducesto the RPKM index when there is only one isoform. Anattempt to relax the assumption of uniform reads samplingis proposed in [84]. In this paper, the authors unified thenotions of reads that map to multiple locations, that is,that could be potentially assigned to several genes, withthose of reads that map to multiple isoforms through theintroduction of latent random variables representing the truemappings. Then, they estimated the isoforms’ abundanceas the maximum likelihood expression levels using theEM algorithm. The Poisson distribution is also the mainassumption in [99], where a comprehensive approach to theproblem of alternative isoforms prediction is presented. Inparticular, the presence of alternative splicing event withinthe same sample is assessed by using Pearson’s chi-square teston the parameter of a multinomial distribution and the EMalgorithm is used to estimate the abundance of each isoform.
3.6. Differential Expression. The final goal in the majority oftranscriptome studies is to quantify differences in expressionacross multiple samples in order to capture differential geneexpression, to identify sample-specific alternative splicingisoforms and their differential abundance.
Mimicking the methods used for microarray analysis,researchers started to approach such crucial question usingstatistical hypothesis’ tests combined with multiple compar-isons error procedures on the observed counts (or on theRPKM values) at the gene, isoform or exon level. Indeed, in[30] the authors applied the empirical Bayes moderated t-test proposed in [100] to the normalized RPKM. Howeverin microarray experiments, the abundance of a particulartranscript is measured as a fluorescence intensity, that canbe effectively modeled as a continuous response, whereas forRNA-Seq data the abundance is usually a count. Therefore,procedures that are successful for microarrays do not seemto be appropriate for dealing with such type of data.
One of the pioneering works to handle such differenceis [34], where the authors modeled the aggregated readscount for each gene using Poisson distribution. One canprove that the number of reads observed from a gene(or transcript isoform) follows a binomial distribution thatcan be approximated by a Poisson distribution, under theassumption that RNA-Seq reads follow a random samplingprocess, in which each read is sampled independently anduniformly from every possible nucleotide in the sample.In this set-up, in [34] the authors used a likelihood ratiotest to test for significant differences between the twoconditions. The Poisson model was also employed by [40],
where the authors used the method proposed in [101] todetermine the significance of differential expression. Onthe contrary, in [83], the authors simply estimated thedifference in expression of a gene between two conditionsthrough the difference of the count proportions p1 andp2 computed using a classical Z-test statistics. In [18], theauthors employed the Fishers exact test to better weigh thegenes with relatively small counts. Similarly in [99] theauthors used Poisson model and Fishers exact test to detectalternative exon usage between conditions.
Recently, more sophisticated approaches have been pro-posed in [102, 103]. In [102], the authors proposed anempirical Bayesian approach, based on the negative binomialdistribution; it results very flexible and reduces to the Poissonmodel for a particular choice of the hyperparameter. Theycarried out differential expression testing using a moderatedBayes approach similar in the spirit to the one described in[100], but adapted for data that are counts. We observedthat the method is designed for finding changes betweentwo or more groups when at least one of the groups hasreplicated measurements. In [103], the observed counts ofreads mapped to a specific gene obtained from a certainsample was modeled using Binomial distribution. Undersuch assumption, it can be proved that the log ratio betweenthe two samples conditioned to the intensity signal (i.e.,the average of the two logs counts) follows an approximatenormal distribution, that is used for assessing the significanceof the test. All the above-mentioned methods assume thatthe quantification of the features of interest under theexperimental conditions has been already done and eachread has been assigned to only one elements, hence themethods are directly applicable to detect genes or exonsdifferences provided that overlapping elements are properlyfiltered out. By contrast the above described methods are notdirectly suited for detecting isoforms’ differences unless thequantification of the isoform abundance has been carriedout using specific approaches. To handle such difficulties,in [104], the authors proposed a hierarchical Bayesianmodel to directly infer the differential expression level ofeach transcript isoform in response to two conditions. Thedifference in expression of each isoform is modeled bymeans of an inverse gamma model and a latent variable isintroduced for guiding the isoform’s selection. The modelcan handle the heteroskedasticity of the sequence readcoverage and inference is carried out using Gibbs sampler.
It should be noticed that although these techniquesalready provide interesting biological insights, they havenot been sufficiently validated on several real data-setswhere different type of replicates are available, neithersufficiently compared each others in terms of advantagesand disadvantages. As with any new biotechnology it isimportant to carefully study the different sources of variationthat can affect measure of the biological effects of interestand to statistically asses the reproducibility of the biologicalfindings in a rigorous way, and to date this has been oftenomitted. Indeed, it should be considered that there are avariety of experimental effects that could possibly increasethe variability, the bias, or be confounded with sequencing-based measures, causing miss-understanding of the results.
Journal of Biomedicine and Biotechnology 15
Unfortunately, such problems have received little of attentionuntil now. In order to fill this gap, in [93] the authorspresented a statistical inference framework for transcriptomeanalysis using RNA-Seq mapped read data. In particular,they proposed a new statistical method based on log-linear regression for investigating relationships between readcounts and biological and experimental variables describinginput samples as well as genomic regions of interest. Themain advantage of the log-linear regression approach is thatit allows to account both for biological effect and a variety ofexperimental effects. Their paper represents one of the fewattempts of looking at the analysis of RNA-Seq data from ageneral point of view.
4. Challenges and Perspective for NGS
From the development of the Sanger method to the com-pletion of the HGP, genetics has made significant advancestowards the understanding of gene content and function.Even though significant achievements were reached byHuman Genome, HapMap and ENCODE Projects [7, 105,106], we are far from an exhaustive comprehension of thegenomic diversity among humans and across the species,and from understanding gene expression variations and itsregulation in both physio and pathological conditions. Sincethe appearance of first NGS platforms in the 2004, it wasclear that understanding this diversity at a cost of around $5–10 million per genome sequence [107], placed it outside thereal possibilities of most research laboratories, and very farfrom single individual economical potential. To date, we arein the “$1,000 genome” era, and, although this importantbarrier has not yet been broken, its a current assumptionthat this target is going to be reached within the end of2010. It is likely that the rapid evolution of DNA sequencingtechnology, able to provide researchers with the ability togenerate data about genetic variation and patterns of geneexpression at an unprecedented scale, will become a routinetool for researchers and clinicians within just a few years.
As we can see, the number of applications and the greatamount of biological questions that can be addressed by“Seq” experiments on NGS platforms is leading a revolutionin the landscape of molecular biology, but the imbalancebetween the pace at which technology innovations areintroduced in the platforms and the biological discoveriesderivable from them is growing up. The risk is the creationof a glut of “under-used” information that in few monthsbecomes of no use because the new one is produced. It isnecessary to invest in an equivalent development of newcomputational strategies and expertise to deal with thevolumes of data created by the current generation of newsequencing instruments, to maximize their potential benefit.
These platforms are creating a new world to explore, notonly in the definition of experimental/technical proceduresof large-scale analyses, but also in the downstream compu-tational analysis and in the bioinformatics infrastructuressupport required for high-quality data generation and fortheir correct biological interpretation. In practice, they haveshifted the bottleneck from the generation of experimental
data to their management and to their statistical andcomputational analysis. There are few key points to consider.The first one is the data management: downstream com-putational analysis becomes difficult without appropriateInformation Technology (IT) infrastructure. The terabytes ofdata produced by each sequencing run requires conspicuousstorage and backup capacity, which increases considerablythe experimental costs. The second one regards the protocolsused for the production of raw data: each platform has itspeculiarity in both sample preparation and type and volumeof raw data produced, hence they require individualizedlaboratory expertise and data processing pipelines. Third,beside vendor specific and commercial software, severalother open-source analysis tools are continuously appearing.Unfortunately, there is often an incomplete documentationand it is easy to spend more time in evaluating softwaresuites than in analyzing the output data. Whichever softwareis used, the most important question is to understandits limitations and assumptions. Community adoption ofinput/output data standards is also essential to efficientlyhandle the data management problem. Till now the efforthas been mainly devoted to the technological developmentrather than to the methodological counterpart. The choiceof a careful experimental design has been also not alwaysadequately considered.
As regards the RNA-Seq, we have still to face severalcritical issues either from a biological and computationalpoint of view. RNA-seq protocols are extremely sensitive andneed a very careful quality control for each wet laboratorystep. For instance, the contamination of reagents with RNAseand the degradation of RNA, even partial, must be avoidedduring all the technical procedures. The quality of totalisolated RNA is the first, and probably the most crucialpoint for an RNA-Seq experiment. Poor yield of polyAenrichment or low efficiency of total RNA ribodepletion arealso critical issues for preparing high-quality RNA towardsthe library construction. It is clear that, independently onthe library construction procedure, particular care shouldbe taken to avoid complete degradation of RNA during thecontrolled RNA fragmentation step. Furthermore, in order tocorrectly determine the directionality of gene transcriptionand to facilitate the detection of opposing and overlappingtranscripts within gene-dense genomic regions, particularcare should be taken to preserve the strandedness of RNAfragments during the library preparation. In addition, toprovide a more uniform coverage throughout the transcriptlength, random priming for reverse transcription proto-cols, rather than oligo dT priming (with the bias of lowcoverage at the 5′ ends), should be done after removalof rRNA. Finally, it should be considered that for theplatforms based on CRT and SBL, substitutions and underrepresentation of AT-rich and GC-rich regions, probably dueto amplification bias during template preparation, are themost common error type. In contrast, for pyrosequencingplatforms, insertions and deletions represent a commondrawback.
For what concern the data analysis, to the above-mentioned points, we should note that most of the availablesoftware for read alignment are designed for genomic
16 Journal of Biomedicine and Biotechnology
mapping hence they are not fully capable to discover exonjunctions. The classical extension for handling RNA-Seq datainvolves the preconstruction of junction libraries reducingthe possibility of discovering new junctions. It would bedesirable to develop new methods that allow either newjunction detection and also the use of paired-end reads,that are particularly promising for more accurate study.Additionally further developments are required to assess thesignificance of new transcribed regions, the constructionof new putative genes and the precise quantification ofeach isoform, for which there is still a lack of statisticalmethodologies. For what concerns the detection of differ-ential expression, existing techniques were not sufficientlyvalidated on biological data and compared in terms ofspecificity and sensitivity. Moreover, of potentially greatimpact, is the lack of biological replicates which precludesgauging the magnitude of individual effects in relation totechnical effects. Biological replicates is essential in a RNA-Seq experiment to draw generalized conclusions about the“real” differences observed between two or more biologicalgroups.
Facing such multidisciplinary challenges will be the keypoint for a fruitful transfer from laboratory studies to clinicalapplications. Indeed, the availability of low-cost, efficientand accurate technologies for gene expression and genomesequencing will be useful in providing pathological geneexpression profiles in a wide number of common geneticdisorders including type II diabetes, cardiovascular disease,Parkinson disease and Downs syndrome. Moreover, theapplication of NGS to the emerging disciplines of phar-macogenomics and nutrigenomics will allow to understanddrug response and nutrient-gene interactions on the basis ofindividual patient’s genetic make-up, leading in turn to thedevelopment of targeted therapies for many human diseasesor tailored nutrient supplementation [108].
Acknowledgment
We are grateful to the anonymous referees whose valuablecomments helped to substantially improve the paper. Thiswork was supported by the CNR-Bioinformatics Project.
References
[1] D. D. Licatalosi and R. B. Darnell, “RNA processing and itsregulation: global insights into biological networks,” NatureReviews Genetics, vol. 11, no. 1, pp. 75–87, 2010.
[2] V. E. Velculescu, L. Zhang, W. Zhou, et al., “Characterizationof the yeast transcriptome,” Cell, vol. 88, no. 2, pp. 243–251,1997.
[3] J. Lindberg and J. Lundeberg, “The plasticity of the mam-malian transcriptome,” Genomics, vol. 95, no. 1, pp. 1–6,2010.
[4] W. F. Doolittle and C. Sapienza, “Selfish genes, the phenotypeparadigm and genome evolution,” Nature, vol. 284, no. 5757,pp. 601–603, 1980.
[5] R. J. Taft, M. Pheasant, and J. S. Mattick, “The relationshipbetween non-protein-coding DNA and eukaryotic complex-ity,” BioEssays, vol. 29, no. 3, pp. 288–299, 2007.
[6] T. Cavalier-Smith, “Cell volume and the evolution ofeukaryote genome size,” in The Evolution of Genome Size,T. Cavalier-Smith, Ed., pp. 105–184, John Wiley & Sons,Chichester, UK, 1985.
[7] E. Birney, J. A. Stamatoyannopoulos, A. Dutta, et al.,“Identification and analysis of functional elements in 1% ofthe human genome by the ENCODE pilot project,” Nature,vol. 447, no. 7146, pp. 799–816, 2007.
[8] A. Jacquier, “The complex eukaryotic transcriptome: unex-pected pervasive transcription and novel small RNAs,”Nature Reviews Genetics, vol. 10, no. 12, pp. 833–844, 2009.
[9] Z. Wang, M. Gerstein, and M. Snyder, “RNA-Seq: a revolu-tionary tool for transcriptomics,” Nature Reviews Genetics,vol. 10, no. 1, pp. 57–63, 2009.
[10] R. W. Holley, “Alanine transfer RNA,” in Nobel Lectures inMolecular Biology 1933–1975, pp. 285–300, Elsevier NorthHolland, New York, NY, USA, 1977.
[11] A. M. Maxam and W. Gilbert, “A new method for sequencingDNA,” Proceedings of the National Academy of Sciences of theUnited States of America, vol. 74, no. 2, pp. 560–564, 1977.
[12] F. Sanger, S. Nicklen, and A. R. Coulson, “DNA sequenc-ing with chain-terminating inhibitors,” Proceedings of theNational Academy of Sciences of the United States of America,vol. 74, no. 12, pp. 5463–5467, 1977.
[13] E. R. Mardis, “Next-generation DNA sequencing methods,”Annual Review of Genomics and Human Genetics, vol. 9, pp.387–402, 2008.
[14] J. Shendure and H. Ji, “Next-generation DNA sequencing,”Nature Biotechnology, vol. 26, no. 10, pp. 1135–1145, 2008.
[15] M. L. Metzker, “Sequencing technologies the next genera-tion,” Nature Reviews Genetics, vol. 11, no. 1, pp. 31–46, 2010.
[16] R. A. Irizarry, D. Warren, F. Spencer, et al., “Multiple-laboratory comparison of microarray platforms,” NatureMethods, vol. 2, no. 5, pp. 345–349, 2005.
[17] P. A. C. ’t Hoen, Y. Ariyurek, H. H. Thygesen, et al., “Deepsequencing-based expression analysis shows major advancesin robustness, resolution and inter-lab portability over fivemicroarray platforms,” Nucleic Acids Research, vol. 36, no. 21,article e141, 2008.
[18] J. S. Bloom, Z. Khan, L. Kruglyak, M. Singh, and A. A.Caudy, “Measuring differential gene expression by shortread sequencing: quantitative comparison to 2-channel geneexpression microarrays,” BMC Genomics, vol. 10, article 221,2009.
[19] M. Harbers and P. Carninci, “Tag-based approaches fortranscriptome research and genome annotation,” NatureMethods, vol. 2, no. 7, pp. 495–502, 2005.
[20] M. P. Horan, “Application of serial analysis of gene expressionto the study of human genetic disease,” Human Genetics, vol.126, no. 5, pp. 605–614, 2009.
[21] H. Misu, T. Takamura, N. Matsuzawa, et al., “Genes involvedin oxidative phosphorylation are coordinately upregulatedwith fasting hyperglycaemia in livers of patients with type 2diabetes,” Diabetologia, vol. 50, no. 2, pp. 268–277, 2007.
[22] T. Takamura, H. Misu, T. Yamashita, and S. Kaneko, “SAGEapplication in the study of diabetes,” Current PharmaceuticalBiotechnology, vol. 9, no. 5, pp. 392–399, 2008.
[23] D. V. Gnatenko, J. J. Dunn, S. R. McCorkle, D. Weissmann,P. L. Perrotta, and W. F. Bahou, “Transcript profiling ofhuman platelets using microarray and serial analysis of geneexpression,” Blood, vol. 101, no. 6, pp. 2285–2293, 2003.
Journal of Biomedicine and Biotechnology 17
[24] C. A. Sommer, E. C. Pavarino-Bertelli, E. M. Goloni-Bertollo,and F. Henrique-Silva, “Identification of dysregulated genesin lymphocytes from children with Down syndrome,”Genome, vol. 51, no. 1, pp. 19–29, 2008.
[25] W. Malago Jr., C. A. Sommer, C. Del Cistia Andrade, etal., “Gene expression profile of human Down syndromeleukocytes,” Croatian Medical Journal, vol. 46, no. 4, pp. 647–656, 2005.
[26] B. T. Wilhelm and J.-R. Landry, “RNA-Seq-quantitativemeasurement of expression through massively parallel RNA-Sequencing,” Methods, vol. 48, no. 3, pp. 249–257, 2009.
[27] M. N. Bainbridge, R. L. Warren, M. Hirst, et al., “Analysisof the prostate cancer cell line LNCaP transcriptome usinga sequencing-by-synthesis approach,” BMC Genomics, vol. 7,article 246, 2006.
[28] U. Nagalakshmi, Z. Wang, K. Waern, et al., “The tran-scriptional landscape of the yeast genome defined by RNAsequencing,” Science, vol. 320, no. 5881, pp. 1344–1349, 2008.
[29] T. T. Torres, M. Metta, B. Ottenwalder, and C. Schlotterer,“Gene expression profiling by massively parallel sequencing,”Genome Research, vol. 18, no. 1, pp. 172–177, 2008.
[30] N. Cloonan, A. R. R. Forrest, G. Kolle, et al., “Stem celltranscriptome profiling via massive-scale mRNA sequenc-ing,” Nature Methods, vol. 5, no. 7, pp. 613–619, 2008.
[31] L. J. Core, J. J. Waterfall, and J. T. Lis, “Nascent RNA sequenc-ing reveals widespread pausing and divergent initiation athuman promoters,” Science, vol. 322, no. 5909, pp. 1845–1848, 2008.
[32] S.-I. Hashimoto, W. Qu, B. Ahsan, et al., “High-resolutionanalysis of the 5′-end transcriptome using a next generationDNA sequencer,” PLoS ONE, vol. 4, no. 1, article e4108, 2009.
[33] H. Li, M. T. Lovci, Y.-S. Kwon, M. G. Rosenfeld, X.-D. Fu, andG. W. Yeo, “Determination of tag density required for digitaltranscriptome analysis: application to an androgen-sensitiveprostate cancer model,” Proceedings of the National Academyof Sciences of the United States of America, vol. 105, no. 51, pp.20179–20184, 2008.
[34] J. C. Marioni, C. E. Mason, S. M. Mane, M. Stephens, and Y.Gilad, “RNA-Seq: an assessment of technical reproducibilityand comparison with gene expression arrays,” GenomeResearch, vol. 18, no. 9, pp. 1509–1517, 2008.
[35] R. D. Morin, M. D. O’Connor, M. Griffith, et al., “Applicationof massively parallel sequencing to microRNA profiling anddiscovery in human embryonic stem cells,” Genome Research,vol. 18, no. 4, pp. 610–621, 2008.
[36] R. D. Morin, M. Bainbridge, A. Fejes, et al., “Profiling theHeLa S3 transcriptome using randomly primed cDNA andmassively parallel short-read sequencing,” BioTechniques, vol.45, no. 1, pp. 81–94, 2008.
[37] A. Mortazavi, B. A. Williams, K. McCue, L. Schaeffer, andB. Wold, “Mapping and quantifying mammalian transcrip-tomes by RNA-Seq,” Nature Methods, vol. 5, no. 7, pp. 621–628, 2008.
[38] R. Rosenkranz, T. Borodina, H. Lehrach, and H. Himmel-bauer, “Characterizing the mouse ES cell transcriptome withIllumina sequencing,” Genomics, vol. 92, no. 4, pp. 187–194,2008.
[39] D. J. Sugarbaker, W. G. Richards, G. J. Gordon, et al., “Tran-scriptome sequencing of malignant pleural mesotheliomatumors,” Proceedings of the National Academy of Sciences ofthe United States of America, vol. 105, no. 9, pp. 3521–3526,2008.
[40] M. Sultan, M. H. Schulz, H. Richard, et al., “A global viewof gene activity and alternative splicing by deep sequencingof the human transcriptome,” Science, vol. 321, no. 5891, pp.956–960, 2008.
[41] Y. W. Asmann, E. W. Klee, E. A. Thompson, et al., “3′
tag digital gene expression profiling of human brain anduniversal reference RNA using Illumina Genome Analyzer,”BMC Genomics, vol. 10, article 531, 2009.
[42] I. Chepelev, G. Wei, Q. Tang, and K. Zhao, “Detection ofsingle nucleotide variations in expressed exons of the humangenome using RNA-Seq,” Nucleic Acids Research, vol. 37, no.16, article e106, 2009.
[43] J. Z. Levin, M. F. Berger, X. Adiconis, et al., “Targeted next-generation sequencing of a cancer transcriptome enhancesdetection of sequence variants and novel fusion transcripts,”Genome Biology, vol. 10, no. 10, article R115, 2009.
[44] C. A. Maher, N. Palanisamy, J. C. Brenner, et al., “Chimerictranscript discovery by paired-end transcriptome sequenc-ing,” Proceedings of the National Academy of Sciences of theUnited States of America, vol. 106, no. 30, pp. 12353–12358,2009.
[45] D. Parkhomchuk, T. Borodina, V. Amstislavskiy, et al.,“Transcriptome analysis by strand-specific sequencing ofcomplementary DNA,” Nucleic Acids Research, vol. 37, no. 18,article e123, 2009.
[46] T. E. Reddy, F. Pauli, R. O. Sprouse, et al., “Genomic deter-mination of the glucocorticoid response reveals unexpectedmechanisms of gene regulation,” Genome Research, vol. 19,no. 12, pp. 2163–2171, 2009.
[47] F. Tang, C. Barbacioru, Y. Wang, et al., “mRNA-Seq whole-transcriptome analysis of a single cell,” Nature Methods, vol.6, no. 5, pp. 377–382, 2009.
[48] R. Blekhman, J. C. Marioni, P. Zumbo, M. Stephens, and Y.Gilad, “Sex-specific and lineage-specific alternative splicingin primates,” Genome Research, vol. 20, no. 2, pp. 180–189,2010.
[49] G. A. Heap, J. H. M. Yang, K. Downes, et al., “Genome-wide analysis of allelic expression imbalance in human pri-mary cells by high-throughput transcriptome resequencing,”Human Molecular Genetics, vol. 19, no. 1, pp. 122–134, 2010.
[50] D. Raha, Z. Wang, Z. Moqtaderi, et al., “Close association ofRNA polymerase II and many transcription factors with PolIII genes,” Proceedings of the National Academy of Sciences ofthe United States of America, vol. 107, no. 8, pp. 3639–3644,2010.
[51] S. Marguerat and J. Bahler, “RNA-Seq: from technology tobiology,” Cellular and Molecular Life Sciences, vol. 67, no. 4,pp. 569–579, 2010.
[52] Y. He, B. Vogelstein, V. E. Velculescu, N. Papadopoulos, andK. W. Kinzler, “The antisense transcriptomes of human cells,”Science, vol. 322, no. 5909, pp. 1855–1857, 2008.
[53] R. Lister, R. C. O’Malley, J. Tonti-Filippini, et al., “Highlyintegrated single-base resolution maps of the epigenome inArabidopsis,” Cell, vol. 133, no. 3, pp. 523–536, 2008.
[54] B. T. Wilhelm, S. Marguerat, I. Goodhead, and J. Bahler,“Defining transcribed regions using RNA-Seq,” Nature Pro-tocols, vol. 5, no. 2, pp. 255–266, 2010.
[55] N. T. Ingolia, S. Ghaemmaghami, J. R. S. Newman, and J.S. Weissman, “Genome-wide analysis in vivo of translationwith nucleotide resolution using ribosome profiling,” Science,vol. 324, no. 5924, pp. 218–223, 2009.
18 Journal of Biomedicine and Biotechnology
[56] T. D. Harris, P. R. Buzby, H. Babcock, et al., “Single-moleculeDNA sequencing of a viral genome,” Science, vol. 320, no.5872, pp. 106–109, 2008.
[57] J. C. Dohm, C. Lottaz, T. Borodina, and H. Himmelbauer,“Substantial biases in ultra-short read data sets from high-throughput DNA sequencing,” Nucleic Acids Research, vol.36, no. 16, article e105, 2008.
[58] O. Harismendy, P. C. Ng, R. L. Strausberg, et al., “Evaluationof next generation sequencing platforms for populationtargeted sequencing studies,” Genome Biology, vol. 10, no. 3,article R32, 2009.
[59] L. W. Hillier, G. T. Marth, A. R. Quinlan, et al., “Whole-genome sequencing and variant discovery in C. elegans,”Nature Methods, vol. 5, no. 2, pp. 183–188, 2008.
[60] J. D. McPherson, “Next-generation gap,” Nature Methods,vol. 6, no. 11S, pp. S2–S5, 2009.
[61] D. R. Zerbino and E. Birney, “Velvet: algorithms for denovo short read assembly using de Bruijn graphs,” GenomeResearch, vol. 18, no. 5, pp. 821–829, 2008.
[62] I. Birol, S. D. Jackman, C. B. Nielsen, et al., “De novotranscriptome assembly with ABySS,” Bioinformatics, vol. 25,no. 21, pp. 2872–2877, 2009.
[63] F. Denoeud, J.-M. Aury, C. Da Silva, et al., “Annotatinggenomes with massive-scale RNA sequencing,” GenomeBiology, vol. 9, no. 12, article R175, 2008.
[64] M. Yassoura, T. Kaplana, H. B. Fraser, et al., “Ab initioconstruction of a eukaryotic transcriptome by massivelyparallel mRNA sequencing,” Proceedings of the NationalAcademy of Sciences of the United States of America, vol. 106,no. 9, pp. 3264–3269, 2009.
[65] C. Trapnell and S. L. Salzberg, “How to map billions of shortreads onto genomes,” Nature Biotechnology, vol. 27, no. 5, pp.455–457, 2009.
[66] P. Flicek and E. Birney, “Sense from sequence reads: methodsfor alignment and assembly,” Nature Methods, vol. 6, supple-ment 11, pp. S6–S12, 2009.
[67] D. S. Horner, G. Pavesi, T. Castrignano, et al., “Bioinformat-ics approaches for genomics and post genomics applicationsof next-generation sequencing,” Briefings in Bioinformatics,vol. 11, no. 2, pp. 181–197, 2009.
[68] A. Cox, “ELAND: efficient local alignment of nucleotidedata,” unpublished, http://bioit.dbi.udel.edu/howto/eland.
[69] “Applied Biosystems mappread and whole transcriptomesoftware tools,” http://www.solidsoftwaretools.com/.
[70] H. Li, J. Ruan, and R. Durbin, “Mapping short DNAsequencing reads and calling variants using mapping qualityscores,” Genome Research, vol. 18, no. 11, pp. 1851–1858,2008.
[71] A. D. Smith, Z. Xuan, and M. Q. Zhang, “Using quality scoresand longer reads improves accuracy of Solexa read mapping,”BMC Bioinformatics, vol. 9, article 128, 2008.
[72] R. Li, Y. Li, K. Kristiansen, and J. Wang, “SOAP: shortoligonucleotide alignment program,” Bioinformatics, vol. 24,no. 5, pp. 713–714, 2008.
[73] R. Li, C. Yu, Y. Li, et al., “SOAP2: an improved ultrafast toolfor short read alignment,” Bioinformatics, vol. 25, no. 15, pp.1966–1967, 2009.
[74] B. D. Ondov, A. Varadarajan, K. D. Passalacqua, and N. H.Bergman, “Efficient mapping of Applied Biosystems SOLiDsequence data to a reference genome for functional genomicapplications,” Bioinformatics, vol. 24, no. 23, pp. 2776–2777,2008.
[75] H. Jiang and W. H. Wong, “SeqMap: mapping massiveamount of oligonucleotides to the genome,” Bioinformatics,vol. 24, no. 20, pp. 2395–2396, 2008.
[76] H. Lin, Z. Zhang, M. Q. Zhang, B. Ma, and M. Li, “ZOOM!Zillions of oligos mapped,” Bioinformatics, vol. 24, no. 21, pp.2431–2437, 2008.
[77] B. Langmead, C. Trapnell, M. Pop, and S. L. Salzberg,“Ultrafast and memory-efficient alignment of short DNAsequences to the human genome,” Genome Biology, vol. 10,no. 3, article R25, 2009.
[78] D. Campagna, A. Albiero, A. Bilardi, et al., “PASS: a programto align short sequences,” Bioinformatics, vol. 25, no. 7, pp.967–968, 2009.
[79] N. Cloonan, Q. Xu, G. J. Faulkner, et al., “RNA-MATE:a recursive mapping strategy for high-throughput RNA-sequencing data,” Bioinformatics, vol. 25, no. 19, pp. 2615–2616, 2009.
[80] F. De Bona, S. Ossowski, K. Schneeberger, and G. Ratsch,“Optimal spliced alignments of short sequence reads,” Bioin-formatics, vol. 24, no. 16, pp. i174–i180, 2008.
[81] C. Trapnell, L. Pachter, and S. L. Salzberg, “TopHat: discov-ering splice junctions with RNA-Seq,” Bioinformatics, vol. 25,no. 9, pp. 1105–1111, 2009.
[82] G. J. Faulkner, A. R. R. Forrest, A. M. Chalk, et al., “A rescuestrategy for multimapping short sequence tags refines surveysof transcriptional activity by CAGE,” Genomics, vol. 91, no. 3,pp. 281–288, 2008.
[83] T. Hashimoto, M. J. L. de Hoon, S. M. Grimmond, C.O. Daub, Y. Hayashizaki, and G. J. Faulkner, “Probabilisticresolution of multi-mapping reads in massively parallelsequencing data using MuMRescueLite,” Bioinformatics, vol.25, no. 19, pp. 2613–2614, 2009.
[84] B. Li, V. Ruotti, R. M. Stewart, J. A. Thomson, and C.N. Dewey, “RNA-Seq gene expression estimation with readmapping uncertainty,” Bioinformatics, vol. 26, no. 4, pp. 493–500, 2009.
[85] W. J. Kent, C. W. Sugnet, T. S. Furey, et al., “The humangenome browser at UCSC,” Genome Research, vol. 12, no. 6,pp. 996–1006, 2002.
[86] W. Huang and G. Marth, “EagleView: a genome assem-bly viewer for next-generation sequencing technologies,”Genome Research, vol. 18, no. 9, pp. 1538–1543, 2008.
[87] H. Bao, H. Guo, J. Wang, R. Zhou, X. Lu, and S. Shi,“MapView: visualization of short reads alignment on adesktop computer,” Bioinformatics, vol. 25, no. 12, pp. 1554–1555, 2009.
[88] I. Milne, M. Bayer, L. Cardle, et al., “Tablet-next generationsequence assembly visualization,” Bioinformatics, vol. 26, no.3, pp. 401–402, 2010.
[89] H. Li, B. Handsaker, A. Wysoker, et al., “The sequencealignment/map format and SAMtools,” Bioinformatics, vol.25, no. 16, pp. 2078–2079, 2009.
[90] H. Jiang and W. H. Wong, “Statistical inferences for isoformexpression in RNA-Seq,” Bioinformatics, vol. 25, no. 8, pp.1026–1032, 2009.
[91] S. Pepke, B. Wold, and A. Mortazavi, “Computation forChIP-Seq and RNA-Seq studies,” Nature Methods, vol. 6, no.11S, pp. S22–S32, 2009.
[92] A. Oshlack and M. J. Wakefield, “Transcript length bias inRNA-Seq data confounds systems biology,” Biology Direct,vol. 4, article 14, 2009.
Journal of Biomedicine and Biotechnology 19
[93] J. H. Bullard, E. A. Purdom, K. D. Hansen, S. Durinck, and S.Dudoit, “Statistical inference in mRNA-Seq: exploratory dataanalysis and differential expression,” Tech. Rep. 247/2009,University of California, Berkeley, 2009.
[94] B. T. Wilhelm, S. Marguerat, S. Watt, et al., “Dynamicrepertoire of a eukaryotic transcriptome surveyed at single-nucleotide resolution,” Nature, vol. 453, no. 7199, pp. 1239–1243, 2008.
[95] Q. Pan, O. Shai, L. J. Lee, B. J. Frey, and B. J. Blencowe,“Deep surveying of alternative splicing complexity in thehuman transcriptome by high-throughput sequencing,”Nature Genetics, vol. 40, no. 12, pp. 1413–1415, 2008.
[96] E. T. Wang, R. Sandberg, S. Luo, et al., “Alternative isoformregulation in human tissue transcriptomes,” Nature, vol. 456,no. 7221, pp. 470–476, 2008.
[97] L. Wang, Y. Xi, J. Yu, L. Dong, L. Yen, and W. Li, “A statisticalmethod for the detection of alternative splicing using RNA-Seq,” PLoS ONE, vol. 5, no. 1, article e8529, 2010.
[98] D. Hiller, H. Jiang, W. Xu, and W. H. Wong, “Identifiability ofisoform deconvolution from junction arrays and RNA-Seq,”Bioinformatics, vol. 25, no. 23, pp. 3056–3059, 2009.
[99] H. Richard, M. H. Schulz, M. Sultan, et al., “Prediction ofalternative isoforms from exon expression levels in RNA-Seqexperiments,” Nucleic Acids Research, vol. 38, no. 10, p. e112,2010.
[100] G. K. Smyth, “Linear models and empirical Bayes methodsfor assessing differential expression in microarray exper-iments,” Statistical Applications in Genetics and MolecularBiology, vol. 3, no. 1, article 3, 2004.
[101] S. Audic and J.-M. Claverie, “The significance of digital geneexpression profiles,” Genome Research, vol. 7, no. 10, pp. 986–995, 1997.
[102] M. D. Robinson, D. J. McCarthy, and G. K. Smyth, “edgeR:a bioconductor package for differential expression analysis ofdigital gene expression data,” Bioinformatics, vol. 26, no. 1,pp. 139–140, 2010.
[103] L. Wang, Z. Feng, X. Wang, X. Wang, and X. Zhang,“DEGseq: an R package for identifying differentiallyexpressed genes from RNA-Seq data,” Bioinformatics, vol. 26,no. 1, pp. 136–138, 2009.
[104] S. Zheng and L. Chen, “A hierarchical Bayesian modelfor comparing transcriptomes at the individual transcriptisoform level,” Nucleic Acids Research, vol. 37, no. 10, articlee75, 2009.
[105] F. S. Collins, E. S. Lander, J. Rogers, and R. H. Waterson,“Finishing the euchromatic sequence of the human genome,”Nature, vol. 431, no. 7011, pp. 931–945, 2004.
[106] International Human Genome Sequencing Consortium, “Ahaplotype map of the human genome,” Nature, vol. 437, no.7063, pp. 1299–1320, 2005.
[107] E. R. Mardis, “Anticipating the 1,000 dollar genome,” GenomeBiology, vol. 7, no. 7, article 112, 2006.
[108] V. Costa, A. Casamassimi, and A. Ciccodicola, “Nutritionalgenomics era: opportunities toward a genome-tailored nutri-tional regimen,” The Journal of Nutritional Biochemistry, vol.21, no. 6, pp. 457–467, 2010.

Submit your manuscripts athttp://www.hindawi.com
Hindawi Publishing Corporationhttp://www.hindawi.com Volume 2014
Anatomy Research International
PeptidesInternational Journal of
Hindawi Publishing Corporationhttp://www.hindawi.com Volume 2014
Hindawi Publishing Corporation http://www.hindawi.com
International Journal of
Volume 2014
Zoology
Hindawi Publishing Corporationhttp://www.hindawi.com Volume 2014
Molecular Biology International
GenomicsInternational Journal of
Hindawi Publishing Corporationhttp://www.hindawi.com Volume 2014
The Scientific World JournalHindawi Publishing Corporation http://www.hindawi.com Volume 2014
Hindawi Publishing Corporationhttp://www.hindawi.com Volume 2014
BioinformaticsAdvances in
Marine BiologyJournal of
Hindawi Publishing Corporationhttp://www.hindawi.com Volume 2014
Hindawi Publishing Corporationhttp://www.hindawi.com Volume 2014
Signal TransductionJournal of
Hindawi Publishing Corporationhttp://www.hindawi.com Volume 2014
BioMed Research International
Evolutionary BiologyInternational Journal of
Hindawi Publishing Corporationhttp://www.hindawi.com Volume 2014
Hindawi Publishing Corporationhttp://www.hindawi.com Volume 2014
Biochemistry Research International
ArchaeaHindawi Publishing Corporationhttp://www.hindawi.com Volume 2014
Hindawi Publishing Corporationhttp://www.hindawi.com Volume 2014
Genetics Research International
Hindawi Publishing Corporationhttp://www.hindawi.com Volume 2014
Advances in
Virolog y
Hindawi Publishing Corporationhttp://www.hindawi.com
Nucleic AcidsJournal of
Volume 2014
Stem CellsInternational
Hindawi Publishing Corporationhttp://www.hindawi.com Volume 2014
Hindawi Publishing Corporationhttp://www.hindawi.com Volume 2014
Enzyme Research
Hindawi Publishing Corporationhttp://www.hindawi.com Volume 2014
International Journal of
Microbiology