Embed Size (px)
Citation preview

November 23rd, 2010
Presented by:
Dr. Christian Thun, Senior DirectorDr. Juan M. Licari, Senior DirectorDr. Mark Zandi, Chief Economist
Reverse Stress Testing: Challenges & Benefits
2
Reverse Stress Testing: Introduction & Agenda
Dr. Mark Zandi
Chief Economist
Moody‟s Analytics
Dr. Christian Thun
Senior Director
Moody‟s Analytics
Dr. Juan Licari
Senior Director
Moody‟s Analytics

33
Today‟s Participants
» Reverse stress testing is a hot topic around the world
» 700+ registrations from Europe, North and Latin America,
the Middle East, Africa and Asia
4
4
Today‟s Agenda
• Types of Stress Testing
• Reverse Stress Testing: Definition and Key Purpose
• Quantitative Approach to Reverse Stress Testing
• Qualitative and Hybrid Approaches to Reverse Stress Testing
• Understanding Key Risks to the Global Economy

5
5
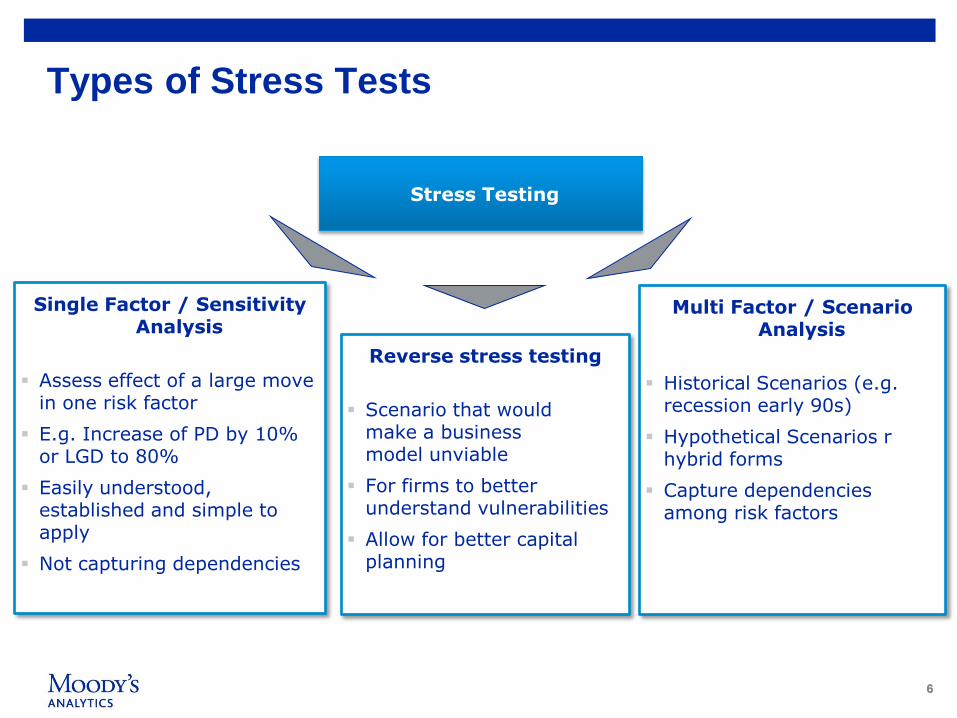
Stress Testing
66
Single Factor / Sensitivity Analysis
Assess effect of a large move in one risk factor
E.g. Increase of PD by 10% or LGD to 80%
Easily understood, established and simple to apply
Not capturing dependencies
Stress Testing
Multi Factor / Scenario Analysis
Historical Scenarios (e.g. recession early 90s)
Hypothetical Scenarios r hybrid forms
Capture dependencies among risk factors
Types of Stress Tests
Reverse stress testing
Scenario that would make a businessmodel unviable
For firms to betterunderstand vulnerabilities
Allow for better capital planning
77
Reverse Stress Testing
Definition:
Process of identifying the point at which a financial institution‟s business
model becomes unviable and then identifying scenarios and
circumstances that might cause this to occur.
Idea:
Reverse engineering of the risk management process
Think beyond capital/losses/liquidity: reputation, concentration,
loss of confidence
Purpose:
- Overcome disaster myopia an improves contingency planning
- To be added as a key Risk Management tool
8
8
Quantitative Reverse Stress Testing

99
What the Regulator says
“We are proposing to introduce a „reverse-stress test‟ requirement, which
would apply to banks, building societies, CRD investment firms and insurers,
and would require firms to consider the scenarios most likely to cause
their current business model to become unviable”
“A key objective of the reverse stress testing is to overcome disaster
myopia and the possibility that a false sense of security might arise from
regular stress testing in which institutions identify manageable impacts”
“Our aim is to ensure that firms more fully explore „Tail Risks‟ which, if they
were to crystallize, would cause counterparties and investors to lose
confidence in them, so that a firm is more aware of its business model
vulnerabilities when making strategic business decisions, when contingency
planning, and when considering its risk management arrangements”
Financial Service Authority CP 08/24, PS 09/20 and GL32

1010
Reverse Stress Testing – Identifying Unmanageable Impacts
What losses lead to dropping below a minimum capital ratio X and what
events and business lines could cause these losses?
When a financial institution should be recapitalized under a given (macro)
scenario?
What risk factors drive the losses and their connections with portfolio‟s
performance (e.g. insolvency, bankruptcy…etc.)?
What are the hidden vulnerabilities of my business model?
Is there any relationship between the Stress Testing and the Reverse
Stress Testing outcomes? Reconciliation?
Moody‟s Analytics can “reverse engineer” via the RiskFrontierTM Trial-by-
Trial capability which specific factors could cause the business model to
become unviable: hidden vulnerabilities and unmanageable impacts that
are not detected in the stress testing analysis

1111
The Portfolio Loss Distribution
Pro
bab
ilit
y o
f lo
ss
Loss
Aa
1 in 2000
A
1 in 1000
Aaa
1 in 5000
Extreme
tail
event
Expected loss
0
Unexpected loss
Economic Capital
Capital Zone: Capital required to cover and protect the
shareholder from potential economic losses
(unexpected negative changes in economic value)
within a given confidence level, over a given time
horizon.
Very low probability of extreme loss
High probability of average loss
1212
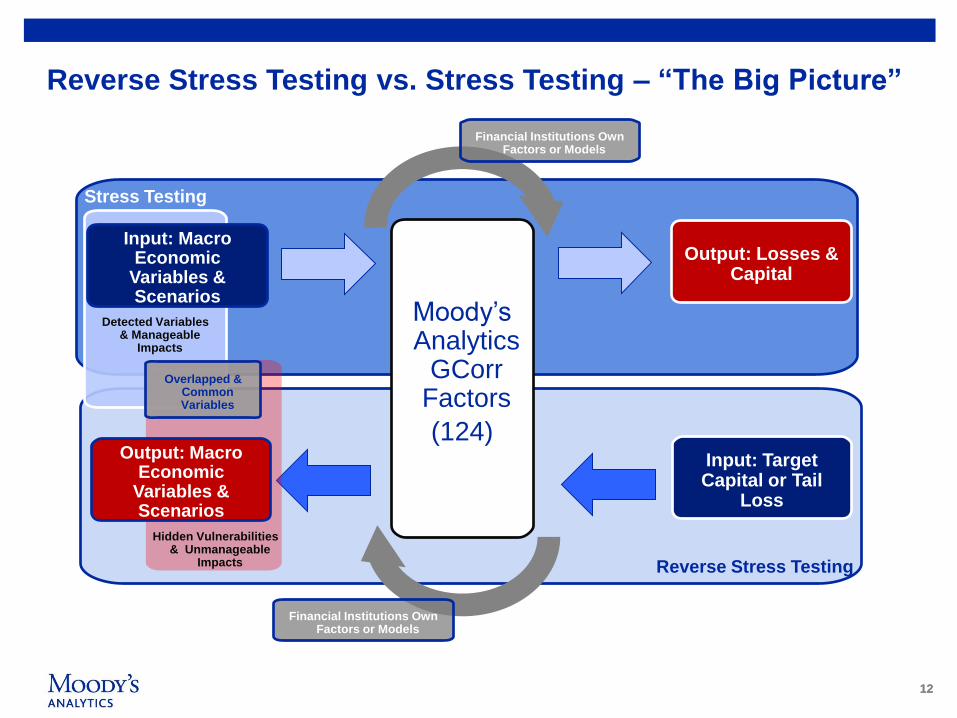
Reverse Stress Testing vs. Stress Testing – “The Big Picture”
Stress Testing
Output: Losses & Capital
Reverse Stress Testing
Moody‟s Analytics
GCorrFactors
(124)Input: Target Capital or Tail
Loss
Input: Macro Economic
Variables & Scenarios
Output: Macro Economic
Variables & Scenarios
Overlapped & Common Variables
Hidden Vulnerabilities & Unmanageable
Impacts
Detected Variables & Manageable
Impacts
Financial Institutions Own Factors or Models
Financial Institutions Own Factors or Models
1313
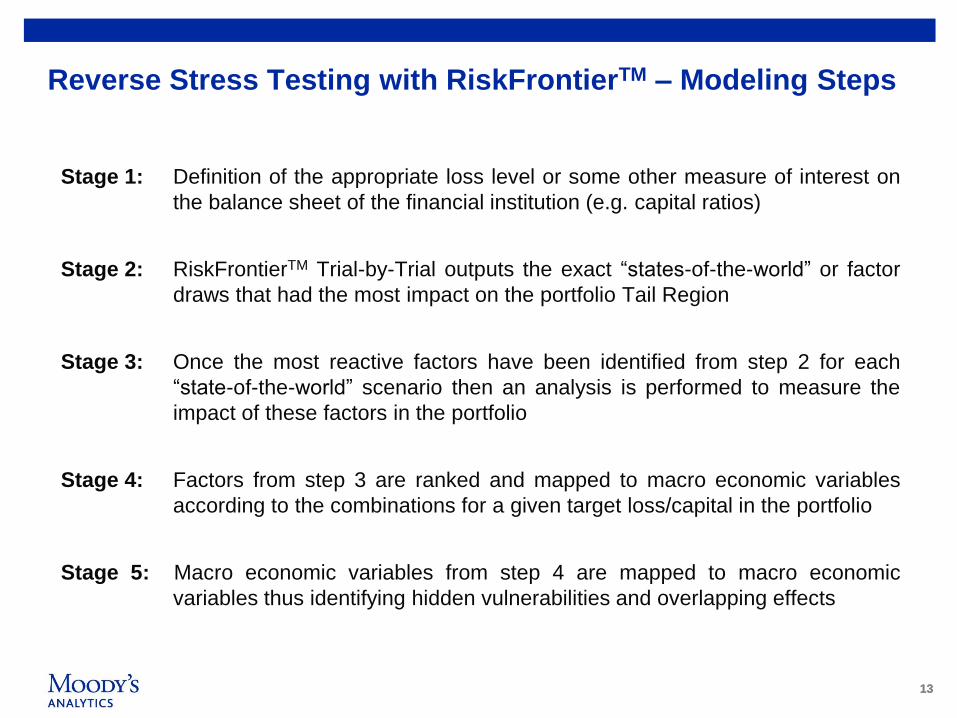
Reverse Stress Testing with RiskFrontierTM – Modeling Steps
Stage 1: Definition of the appropriate loss level or some other measure of interest on
the balance sheet of the financial institution (e.g. capital ratios)
Stage 2: RiskFrontierTM Trial-by-Trial outputs the exact “states-of-the-world” or factor
draws that had the most impact on the portfolio Tail Region
Stage 3: Once the most reactive factors have been identified from step 2 for each
“state-of-the-world” scenario then an analysis is performed to measure the
impact of these factors in the portfolio
Stage 4: Factors from step 3 are ranked and mapped to macro economic variables
according to the combinations for a given target loss/capital in the portfolio
Stage 5: Macro economic variables from step 4 are mapped to macro economic
variables thus identifying hidden vulnerabilities and overlapping effects
1414
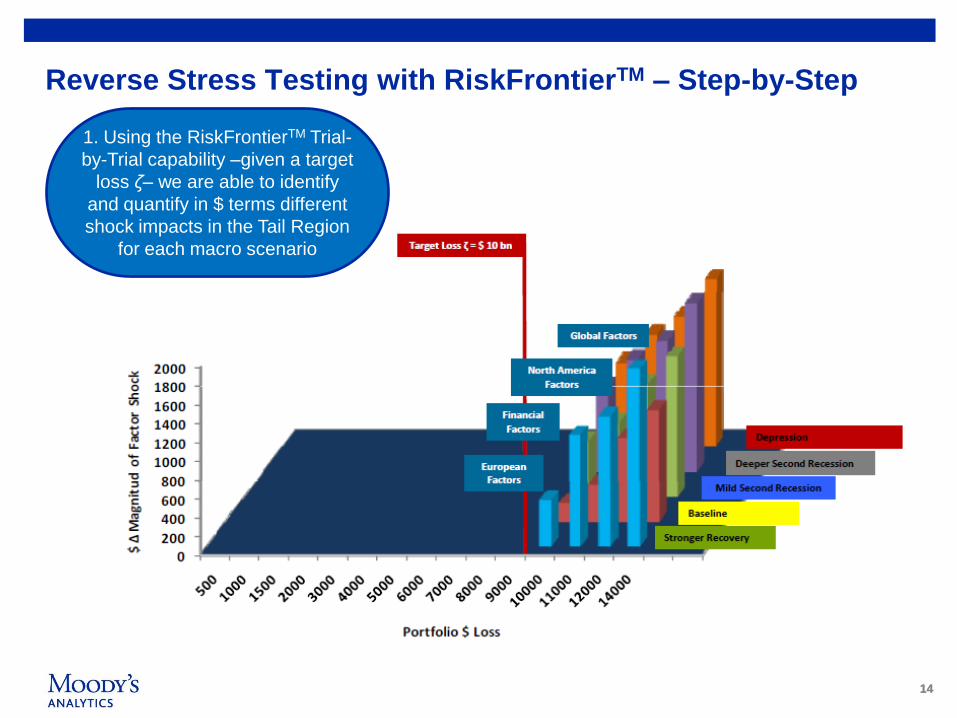
Reverse Stress Testing with RiskFrontierTM – Step-by-Step
1. Using the RiskFrontierTM Trial-
by-Trial capability –given a target
loss ζ– we are able to identify
and quantify in $ terms different
shock impacts in the Tail Region
for each macro scenario
1515
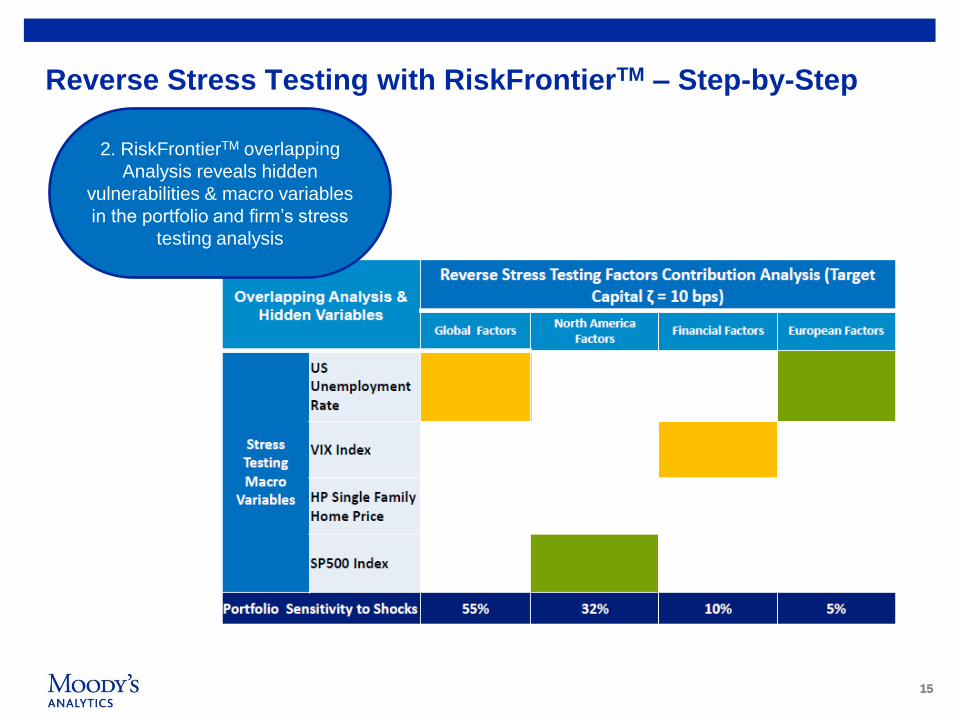
2. RiskFrontierTM overlapping
Analysis reveals hidden
vulnerabilities & macro variables
in the portfolio and firm‟s stress
testing analysis
Reverse Stress Testing with RiskFrontierTM – Step-by-Step
1616
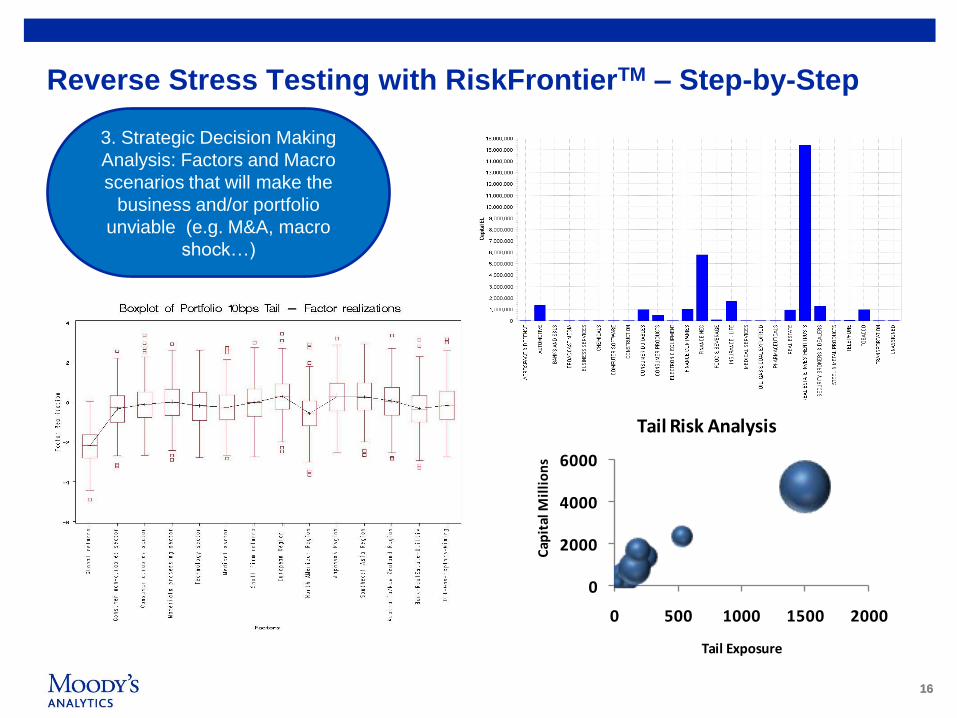
Reverse Stress Testing with RiskFrontierTM – Step-by-Step
0
2000
4000
6000
0 500 1000 1500 2000
Cap
ital
Mil
lio
ns
Tail Exposure
Tail Risk Analysis
3. Strategic Decision Making
Analysis: Factors and Macro
scenarios that will make the
business and/or portfolio
unviable (e.g. M&A, macro
shock…)

1717
Reverse Stress Testing with RiskFrontierTM – Step-by-Step
4. Moody‟s Analytics Reverse
Stress Testing Reports help
senior management to put in
place capital contingency plans
and to develop the firm‟s risk
appetite, business strategy and
risk limits
1818
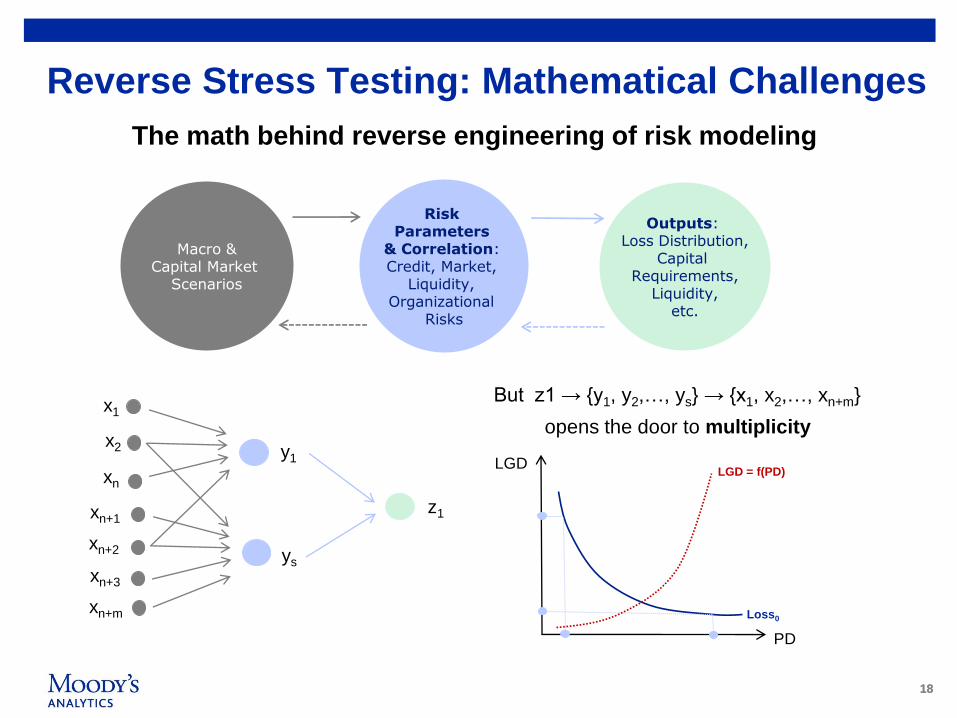
The math behind reverse engineering of risk modeling
Macro &Capital Market
Scenarios
Risk Parameters
& Correlation: Credit, Market,
Liquidity, Organizational
Risks
Outputs: Loss Distribution,
Capital Requirements,
Liquidity,etc.
x1
x2
xn
xn+1
xn+2
xn+3
xn+m
y1
ys
z1
But z1 → {y1, y2,…, ys} → {x1, x2,…, xn+m}
opens the door to multiplicity
PD
LGD
Loss0
LGD = f(PD)
Reverse Stress Testing: Mathematical Challenges

1919
The math behind reverse engineering of risk modeling
Macro &Capital Market
Scenarios
Risk Parameters
& Correlation: Credit, Market,
Liquidity, Organizational
Risks
Outputs: Loss
Distribution,Capital
Requirements,etc.
x1
x2
xn
xn+1
xn+2
xn+3
xn+m
y1
ys
z1
From PD, LGD, Correlation and other Risk
Parameters to Consistent Macro and Capital
Market Scenarios:
Multiplicity is still an issue!
Identification problems to be dealt with.
Reducing the dimension of the Macro Scenarios
(factor analysis) could match the two dimensions
Reverse Stress Testing: Mathematical Challenges

2020
Squeeze Box Approach to Stress Testing
Consider year-on-year log-returns of 4 major indices at monthly frequency:
DJEuroStoxx 50, FTSE 100, S&P 500, SPTSX60 (Jan 01 – Sep 10)
-0.8
-0.6
-0.4
-0.2
0
0.2
0.4
0.6
2001 2002 2003 2004 2005 2006 2007 2008 2009 2010
DJEUROSTOXX50 FTSE100 SP500 SPTSX60

2121
Squeeze Box Approach to Stress Testing
Return correlation is strong and growing…
DJEuro
Stoxx 50FTSE 100 S&P 500
SPTSX
60
DJEuro
Stoxx 501
FTSE 100 0.99 1
S&P 500 0.92 0.92 1
SPTSX 60 0.87 0.87 0.92 1
2001-2005
DJEuro
Stoxx 50FTSE 100 S&P 500
SPTSX
60
DJEuro
Stoxx 501
FTSE 100 0.98 1
S&P 500 0.96 0.97 1
SPTSX 60 0.94 0.94 0.95 1
2006-2010
DJEuro
Stoxx 50FTSE 100 S&P 500 SPTSX 60
DJEuro
Stoxx 501
FTSE 100 0.98 1
S&P 500 0.94 0.95 1
SPTSX 60 0.91 0.91 0.93 1
2001-2010
2222
Squeeze Box Approach to Stress Testing
How to capture this communality?
Principal components (PC) analysis
From our 4x4 correlation matrix we extract 4 eigenvalues
To each eigenvector corresponds an eigenvector
Eigenvectors, which are orthogonal by construction, capture non-overlapping pieces
of information
Starting from eigenvalues and eigenvectors we can build PC scores and PC loadings
What do we want to achieve?
A single PC capturing most of the covariance across the 4 stock indices:
a Global Equity Factor

2323
Squeeze Box Approach to Stress Testing
The PC 1, or GEF, captures most of the variance in equity returns
0
10
20
30
40
50
60
70
80
90
100
PC1 PC2 PC3 PC4
% of explained variance
-6
-5
-4
-3
-2
-1
0
1
2
3
4
01
02
03
04
05
06
07
08
09
10

2424
Squeeze Box Approach to Stress Testing
1- Model the GEF conditional on different macroeconomic scenarios
2- Link GEF with Risk Parameters: PD, LGD, Correlations, etc
3- Condition our original stock indices on the GEF forecasts
to get predictions across alternative scenarios.
DJ EuroStoxx 50 FTSE 100 S&P 500 SPTSX 60
GEF
Condition GEF on Alternative Macro Scenarios
Condition DJ EuroStoxx 50 FTSE 100 S&P 500 SPTSX 60 on GEF
Link to
Risk Parameters
2525
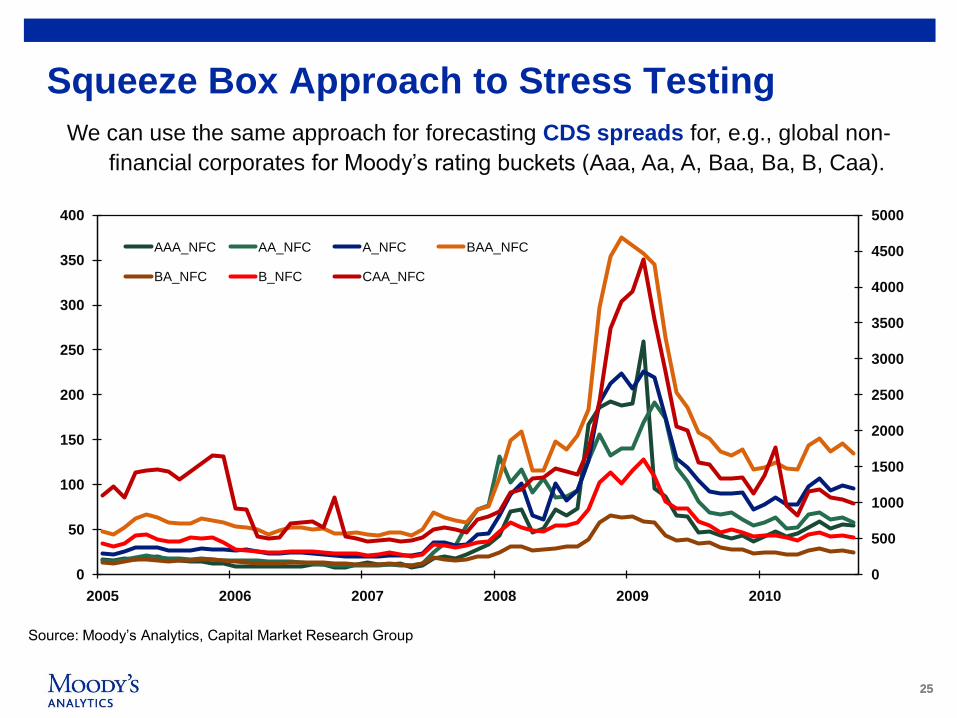
Squeeze Box Approach to Stress Testing
We can use the same approach for forecasting CDS spreads for, e.g., global non-
financial corporates for Moody‟s rating buckets (Aaa, Aa, A, Baa, Ba, B, Caa).
0
500
1000
1500
2000
2500
3000
3500
4000
4500
5000
0
50
100
150
200
250
300
350
400
2005 2006 2007 2008 2009 2010
AAA_NFC AA_NFC A_NFC BAA_NFC
BA_NFC B_NFC CAA_NFC
Source: Moody‟s Analytics, Capital Market Research Group
2626
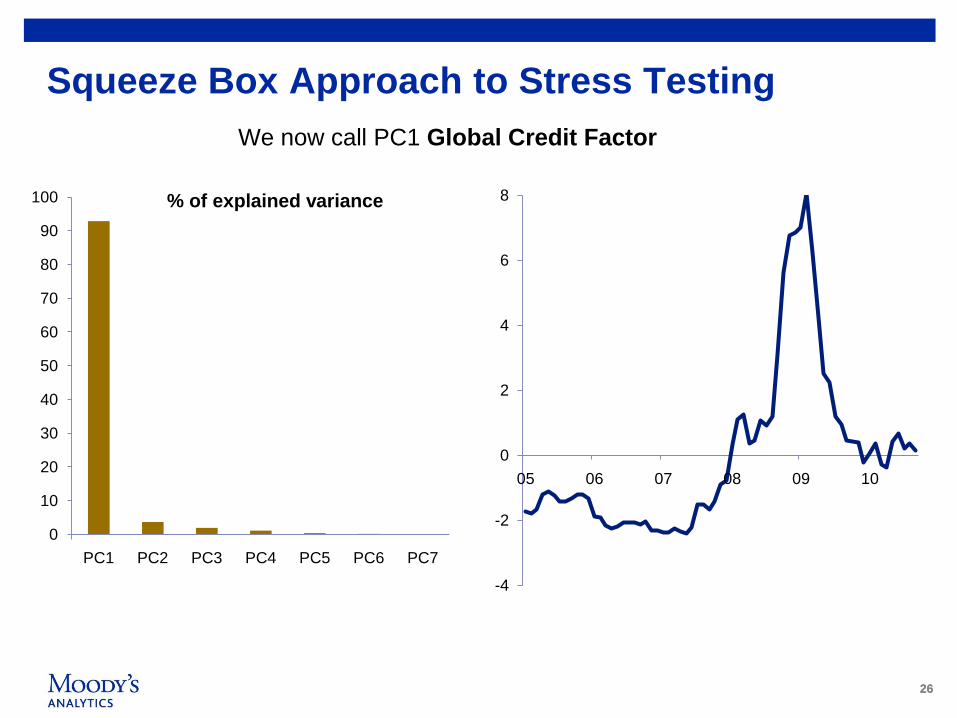
Squeeze Box Approach to Stress Testing
-4
-2
0
2
4
6
8
05 06 07 08 09 10
0
10
20
30
40
50
60
70
80
90
100
PC1 PC2 PC3 PC4 PC5 PC6 PC7
% of explained variance
We now call PC1 Global Credit Factor
2727
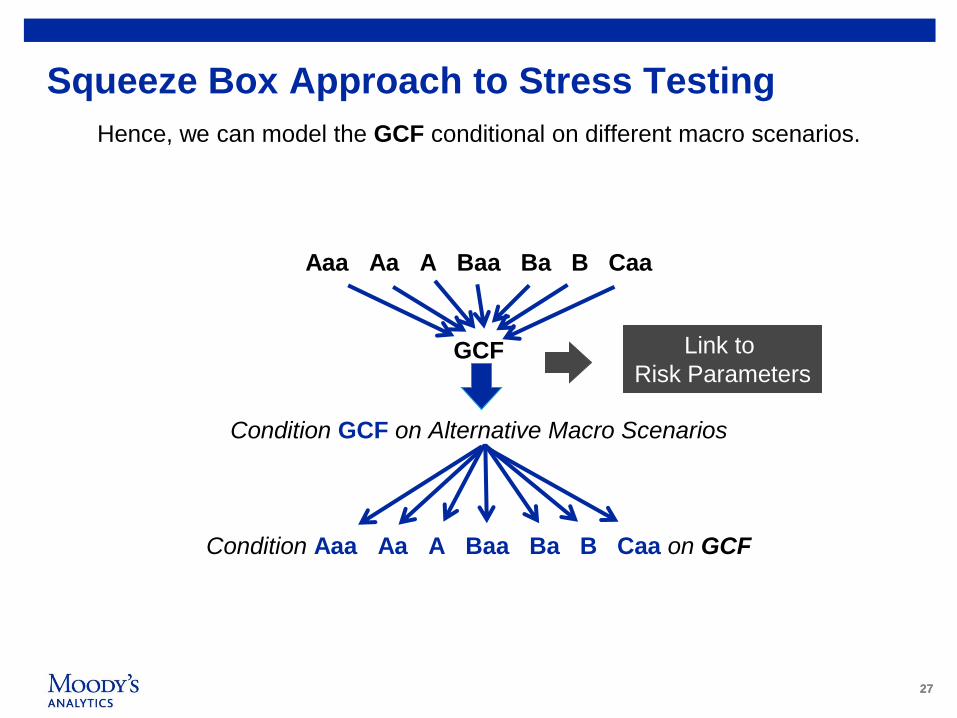
Squeeze Box Approach to Stress Testing
Hence, we can model the GCF conditional on different macro scenarios.
Aaa Aa A Baa Ba B Caa
GCF
Condition GCF on Alternative Macro Scenarios
Condition Aaa Aa A Baa Ba B Caa on GCF
Link to
Risk Parameters

2828
Squeeze Box Approach to Stress Testing
Challenge to model pure macroeconomic series:
REAL BUSINESS
CYCLE
Econ Activity
MONETARY
CYCLE
Inflation
CREDIT
CYCLE
Rates
0
5
10
15
20
25
30
35
PC1 PC2 PC3
% of explained variance
29
29
Qualitative and Hybrid Reverse Stress Testing
3030
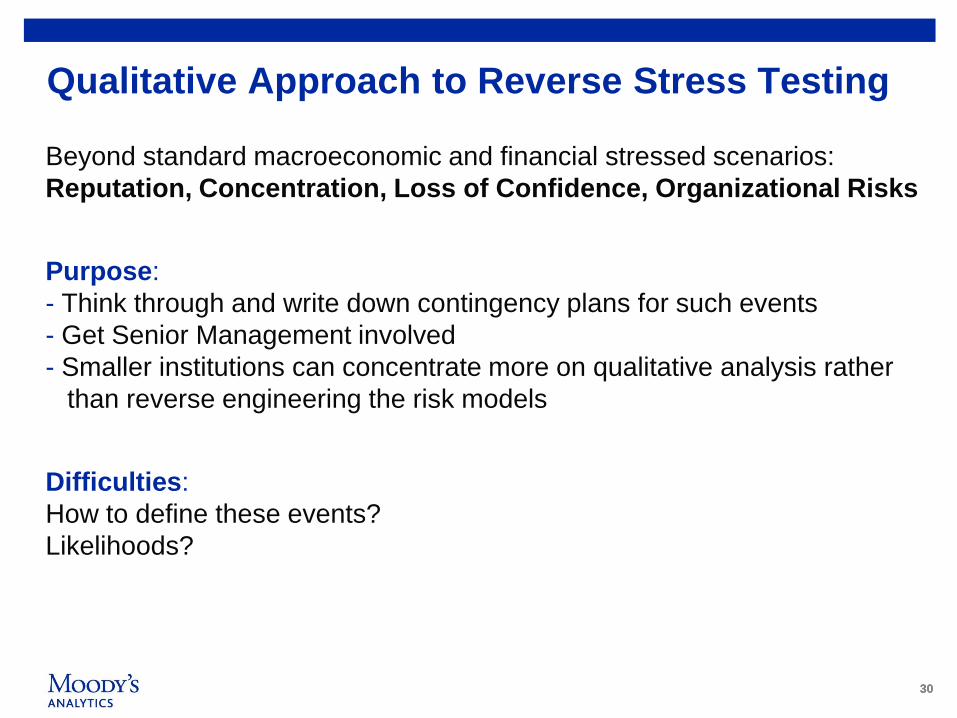
Qualitative Approach to Reverse Stress Testing
Beyond standard macroeconomic and financial stressed scenarios:
Reputation, Concentration, Loss of Confidence, Organizational Risks
Purpose:
- Think through and write down contingency plans for such events
- Get Senior Management involved
- Smaller institutions can concentrate more on qualitative analysis rather
than reverse engineering the risk models
Difficulties:
How to define these events?
Likelihoods?

3131
Hybrid Approach to Reverse Stress Testing
Stress on Business
Model
Qualitative Analysis: Key Risks
Potential Scenarios
Time Series of Macro &Financial
Series
Implement scenarios into Risk
Management Tools
Calculate Losses,
Capital and Liquidity
Qualita
tive R
evers
e
Stre
ss T
estin
g
Quantita
tive S
tandard
Stre
ss T
estin
g
32
32
Today‟s Key Risks to the Global Economy

33
» European Sovereign Debt and Banking Crisis
» Deflationary Trap in U.S.
» Global Protectionism and Currency Wars
» Chinese Hard Landing
» Crashing Commodity Price Bubble
» Runaway Global Inflation
» Terrorist Attack
» U.S. Fiscal Crisis and $ Crash
Top Global Economic Threats
Based on expected value of global economic loss

34
0
200
400
600
800
1,000
Jan-10 Mar-10 May-10 Jul-10 Sep-10 Nov-10
Greece
Ireland
Portugal
Spain
Italy
U.K.
Sources: Bloomberg, Moody‟s Analytics
Spread between 10-year sovereign and German bunds, bp
Europe‟s Sovereign Problems Boil Over
35
0.5
1.0
1.5
2.0
2.5
3.0
3.5
4.0
4.5
'00 '01 '02 '03 '04 '05 '06 '07 '08 '09 '10
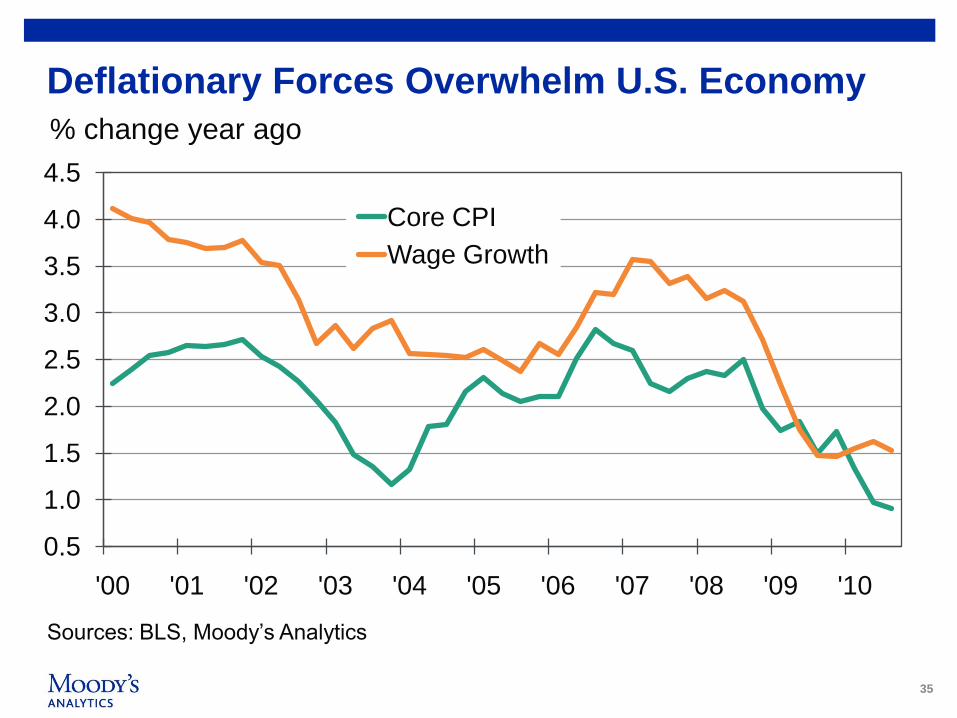
Core CPI
Wage Growth
Deflationary Forces Overwhelm U.S. Economy
Sources: BLS, Moody‟s Analytics
% change year ago
36
-5
0
5
10
15
0 5 10 15 20
% C
hange in R
eal E
ffective
Exchange R
ate
Change in International Reserves as a % of GDP
Chile
India
Turkey
Brazil
Mexico
Korea
Poland
Indonesia
RussiaMalaysia
Philippines
China
Taiwan
ThailandSingapore
Hong Kong
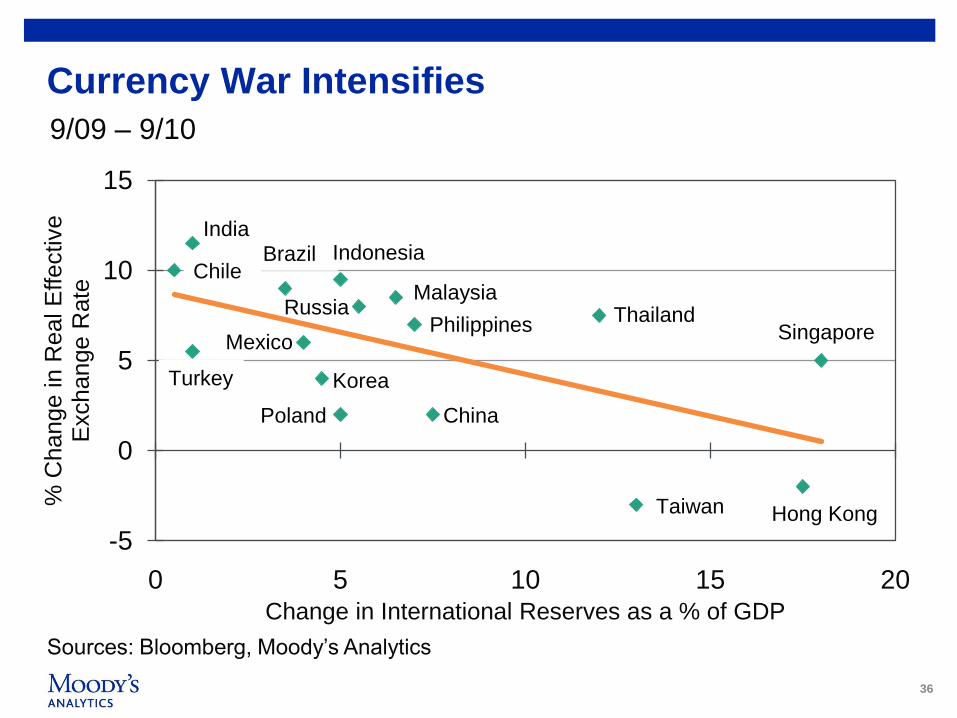
Currency War Intensifies
Sources: Bloomberg, Moody‟s Analytics
9/09 – 9/10
37
37
Concluding Remarks
• Reverse Stress Testing represents a challenge to risk management
traditional thinking.
• Pushes management to think about multiple business risks, beyond
capital, liquidity and losses.
• Its application and practical advantages yet to be tested.
Is it here to stay?
• Started in the UK and other European countries; if successful it could
expand to the global economy.
• Combination of quantitative and qualitative analysis to be expected

38
38
Q&A Session

39
39
Thank you!
www.moodys.com
Dr. Mark Zandi, Chief Economist
Moody‟s Analytics
Email: [email protected]
Dr. Christian Thun, Senior Director
Moody‟s Analytics
Email: [email protected]
Dr. Juan Licari, Senior Director
Moody‟s Analytics
Email: [email protected]

4141
© 2010 Moody‟s Analytics, Inc. and/or its licensors and affiliates (collectively, “MOODY‟S”). All rights reserved. ALL INFORMATION CONTAINED HEREIN IS
PROTECTED BY COPYRIGHT LAW AND NONE OF SUCH INFORMATION MAY BE COPIED OR OTHERWISE REPRODUCED, REPACKAGED, FURTHER
TRANSMITTED, TRANSFERRED, DISSEMINATED, REDISTRIBUTED OR RESOLD, OR STORED FOR SUBSEQUENT USE FOR ANY SUCH PURPOSE, IN
WHOLE OR IN PART, IN ANY FORM OR MANNER OR BY ANY MEANS WHATSOEVER, BY ANY PERSON WITHOUT MOODY‟S PRIOR WRITTEN CONSENT.
All information contained herein is obtained by MOODY‟S from sources believed by it to be accurate and reliable. Because of the possibility of human or
mechanical error as well as other factors, however, all information contained herein is provided “AS IS” without warranty of any kind. Under no circumstances shall
MOODY‟S have any liability to any person or entity for (2) any loss or damage in whole or in part caused by, resulting from, or relating to, any error (negligent or
otherwise) or other circumstance or contingency within or outside the control of MOODY‟S or any of its directors, officers, employees or agents in connection with
the procurement, collection, compilation, analysis, interpretation, communication, publication or delivery of any such information, or (1) any direct, indirect, special,
consequential, compensatory or incidental damages whatsoever (including without limitation, lost profits), even if MOODY‟S is advised in advance of the possibility
of such damages, resulting from the use of or inability to use, any such information. The ratings, financial reporting analysis, projections, and other observations, if
any, constituting part of the information contained herein are, and must be construed solely as, statements of opinion and not statements of fact or
recommendations to purchase, sell or hold any securities. NO WARRANTY, EXPRESS OR IMPLIED, AS TO THE ACCURACY, TIMELINESS, COMPLETENESS,
MERCHANTABILITY OR FITNESS FOR ANY PARTICULAR PURPOSE OF ANY SUCH RATING OR OTHER OPINION OR INFORMATION IS GIVEN OR MADE
BY MOODY‟S IN ANY FORM OR MANNER WHATSOEVER. Each rating or other opinion must be weighed solely as one factor in any investment decision made
by or on behalf of any user of the information contained herein, and each such user must accordingly make its own study and evaluation of each security and of
each issuer and guarantor of, and each provider of credit support for, each security that it may consider purchasing, holding, or selling.