Embed Size (px)
DESCRIPTION
Reverse engineering of regulatory networks. Dirk Husmeier & Adriano Werhli. Systems biology Learning signalling pathways and regulatory networks from postgenomic data. Reverse Engineering of Regulatory Networks. Can we learn the network structure from postgenomic data themselves? - PowerPoint PPT Presentation
Citation preview

Reverse engineering of regulatory networks
Dirk Husmeier & Adriano Werhli
Systems biology
Learning signalling pathways and regulatory networks from
postgenomic data

Reverse Engineering of Regulatory Networks
• Can we learn the network structure from postgenomic data themselves?
• Statistical methods to distinguish between– Direct correlations– Indirect correlations
• Challenge: Distinguish between– Correlations– Causal interactions
• Breaking symmetries with active interventions:– Gene knockouts (VIGs, RNAi)

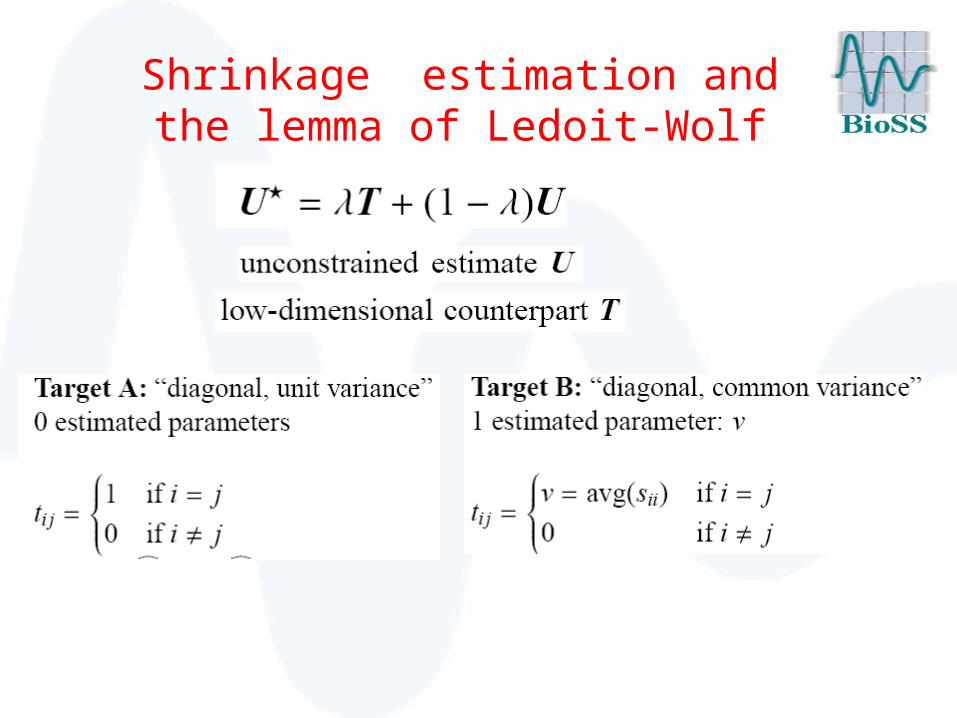
Shrinkage estimation and the lemma of Ledoit-Wolf

Shrinkage estimation and the lemma of Ledoit-Wolf

Shrinkage estimation and the lemma of Ledoit-Wolf
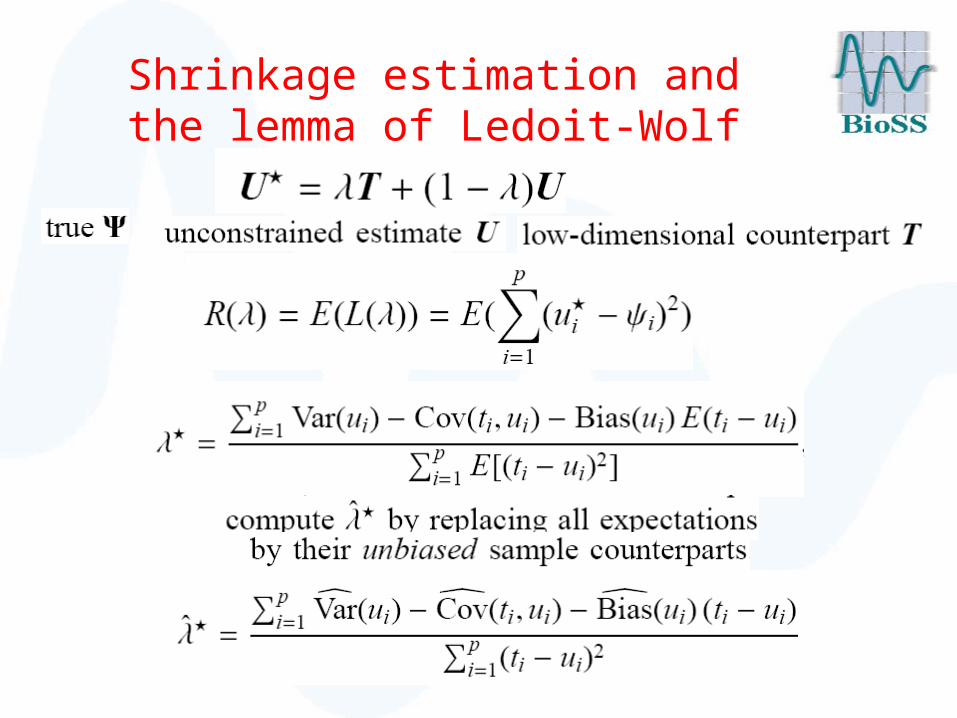
Shrinkage estimation and the lemma of Ledoit-Wolf

Shrinkage estimation and the lemma of Ledoit-Wolf

Bayesian networks versus Graphical Gaussian models
Directed versus undirected graphs
Score based versus constrained based inference

Evaluation
• On real experimental data, using the gold standard network from the literature
• On synthetic data simulated from the gold-standard network


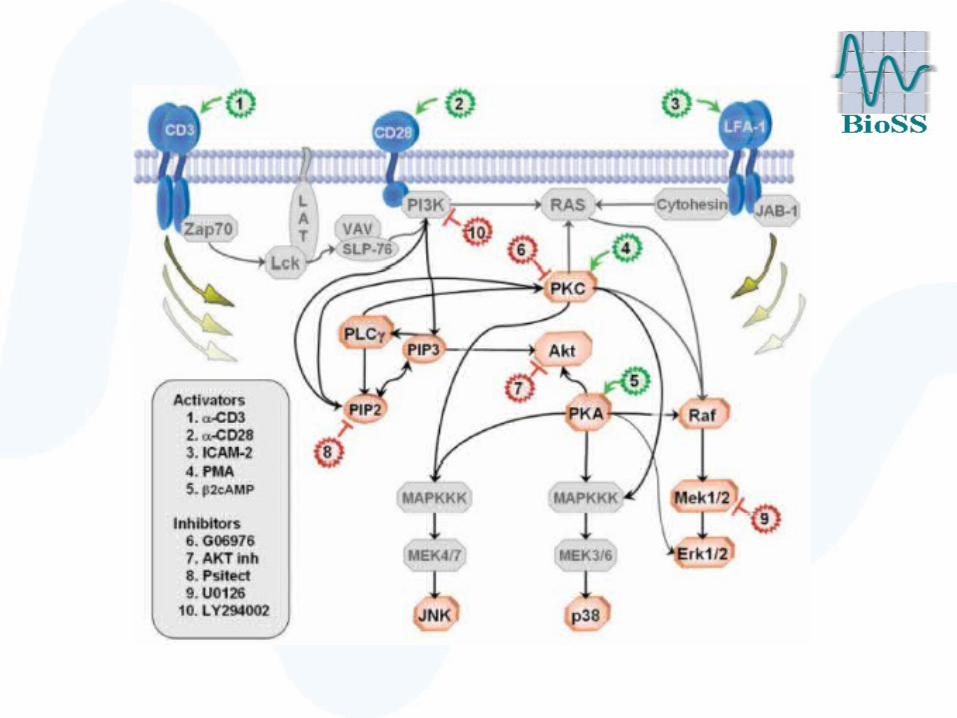
Evaluation: Raf signalling pathway
• Cellular signalling network of 11 phosphorylated proteins and phospholipids in human immune systems cell
• Deregulation carcinogenesis
• Extensively studied in the literature gold standard network
Data
• Laboratory data from cytometry experiments
• Down-sampled to 100 measurements
• Sample size indicative of microarray experiments


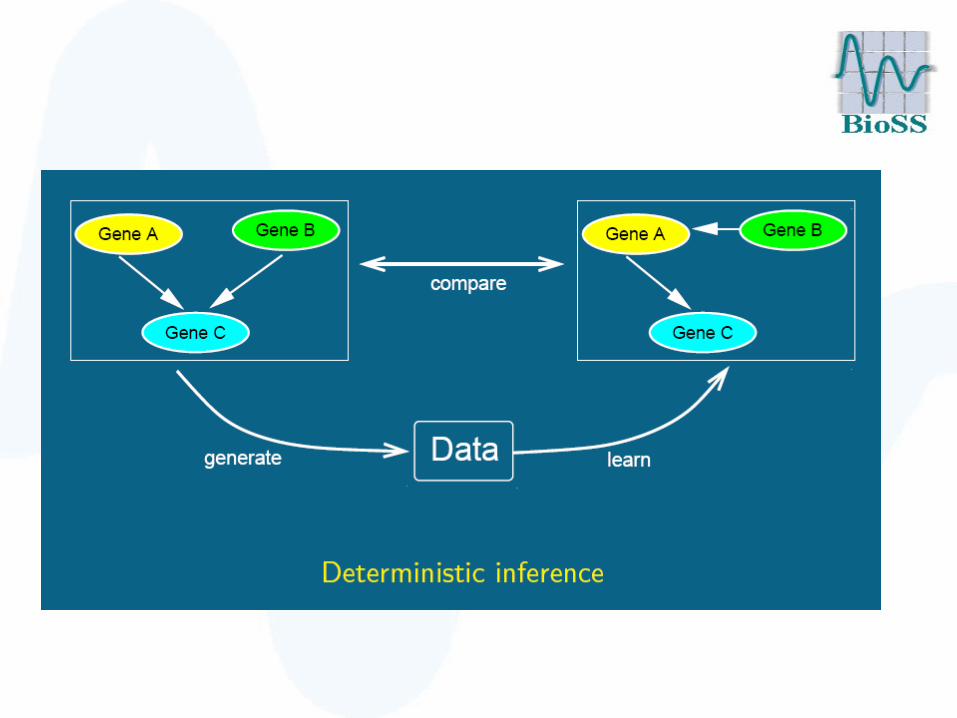
Two types of experiments

Evaluation
• On real experimental data, using the gold standard network from the literature
• On synthetic data simulated from the gold-standard network

Comparison with simulated data 1

Raf pathway

Comparison with simulated data 2
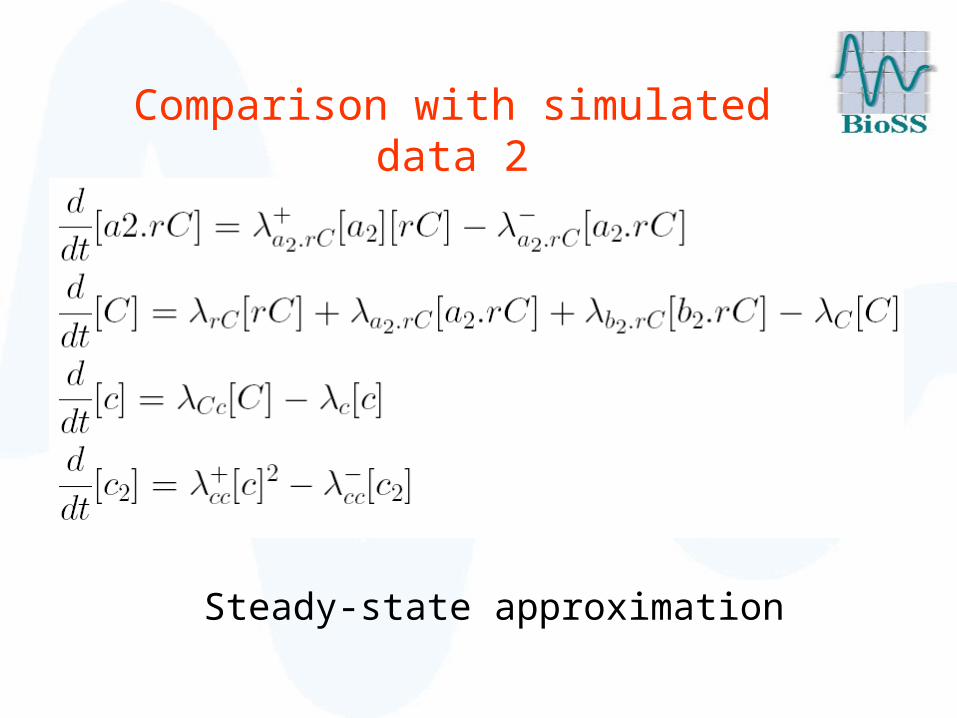
Comparison with simulated data 2
Steady-state approximation


Evaluation 1: AUC scores

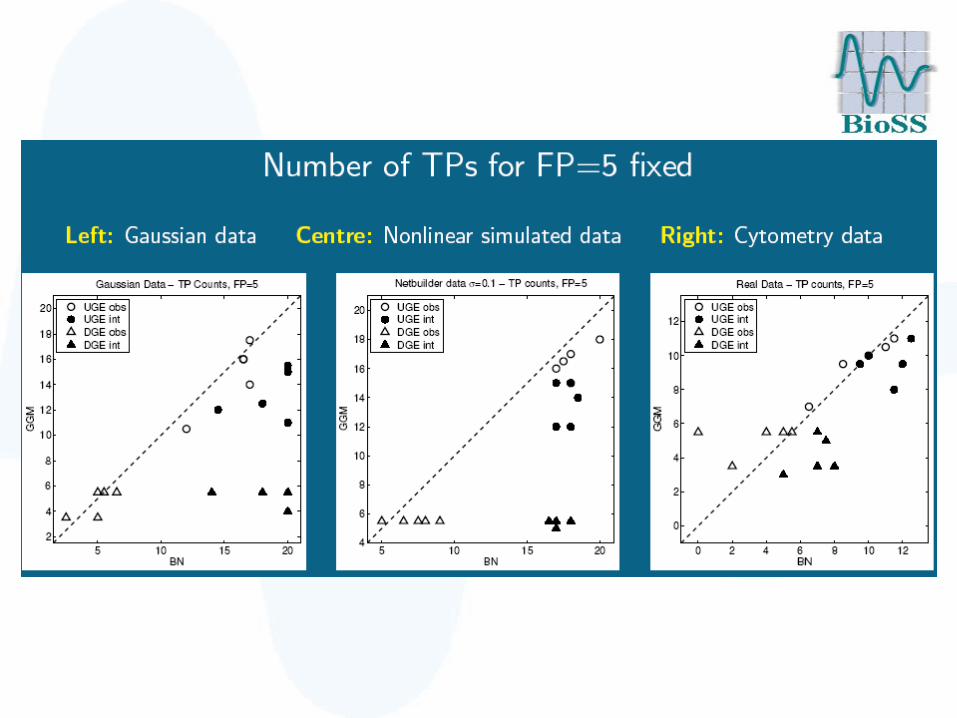
Evaluation 2: TP scores
We set the threshold such that we obtained 5 spurious edges (5 FPs) and counted the corresponding number of true edges (TP count).

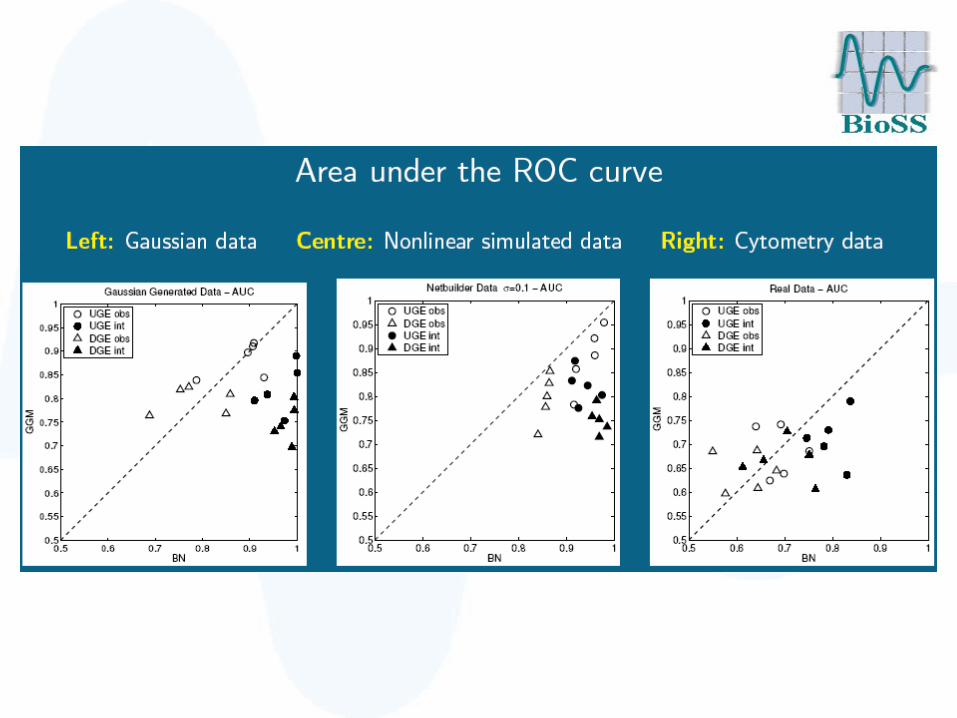

AUC scores

TP scores
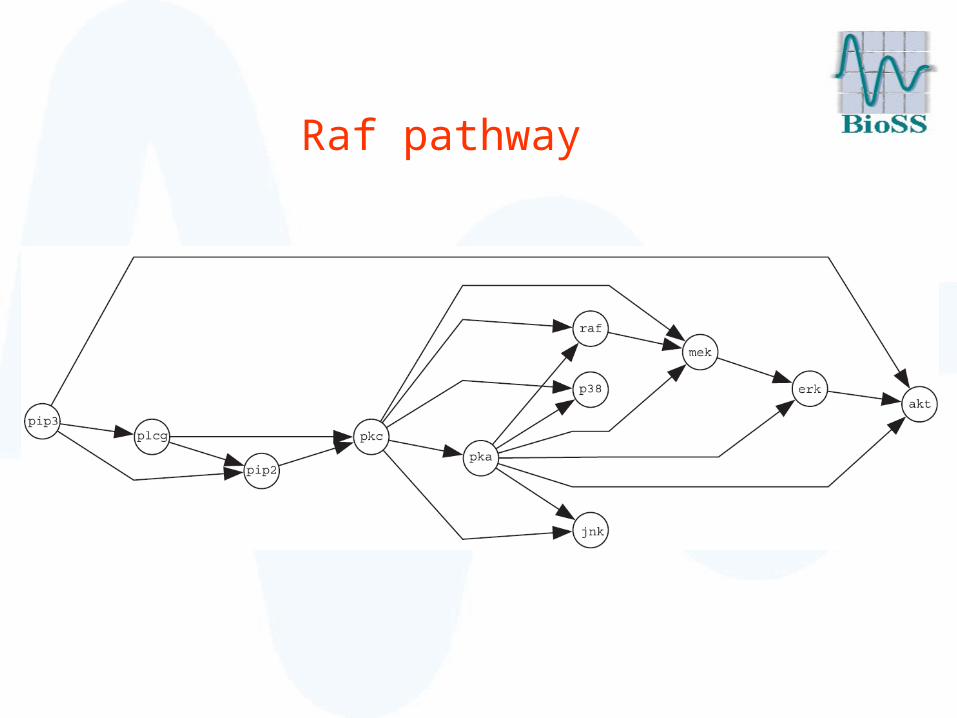
Raf pathway

Conclusions 1
• BNs and GGMs outperform RNs, most notably on Gaussian data.
• No significant difference between BNs and GGMs on observational data.
• For interventional data, BNs clearly outperform GGMs and RNs, especially when taking the edge direction (DGE score) rather than just the skeleton (UGE score) into account.

Conclusions 2
Performance on synthetic data better than on real data:
• Real data: more complex• Real interventions are not ideal• Errors in the gold-standard
network

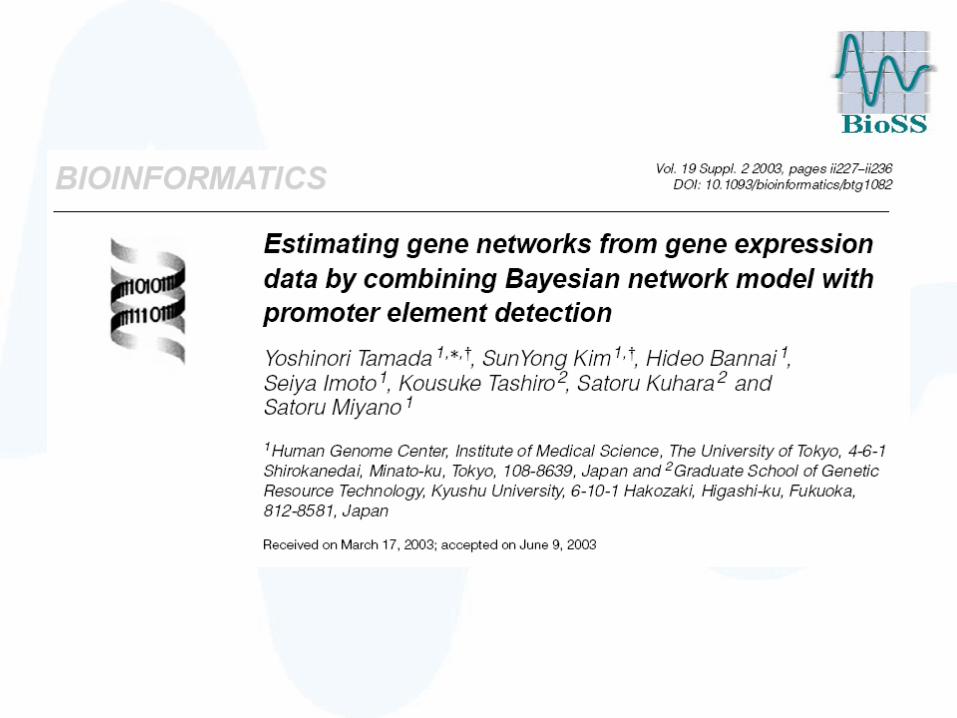
Reconstructing gene regulatory networks with Bayesian networks by combining
microarray data with biological prior knowledge

MOTIVATION
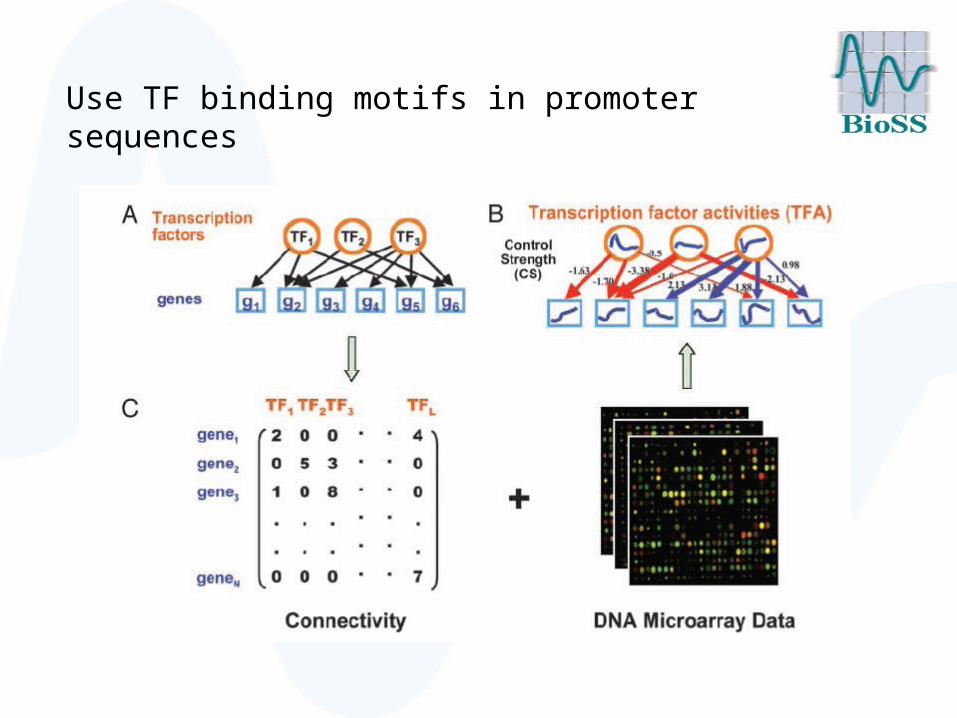
Use TF binding motifs in promoter sequences

Use prior knowledge from KEGG

Prior knowledge

Biological prior knowledge matrix
Biological Prior Knowledge
Indicates some knowledge aboutthe relationship between genes i and j

Biological prior knowledge matrix
Biological Prior Knowledge
Define the energy of a Graph G
Indicates some knowledge aboutthe relationship between genes i and j

Prior distribution over networks
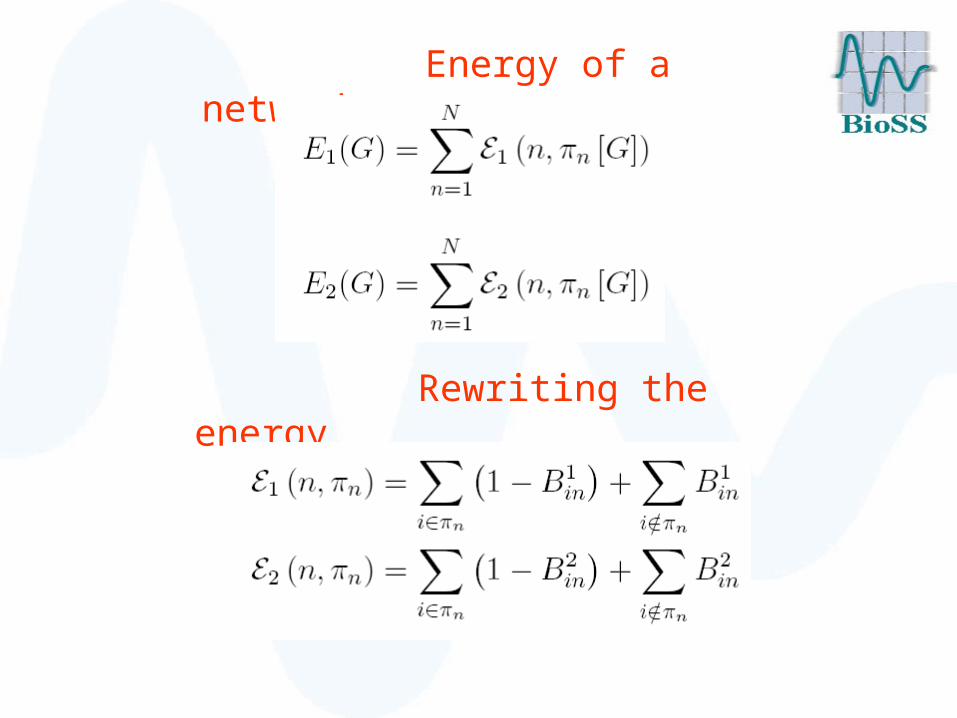
Energy of a network

Rewriting the energy
Energy of a network

Approximation of the partition function

Multiple sources of prior knowledge
Rewriting the energy
Energy of a network

Approximation of the partition function

MCMC sampling scheme

Sample networks and hyperparameters from the posterior distribution
Metropolis-Hastings scheme
Proposal probabilities

Metropolis-Hastings scheme

Metropolis-Hastings scheme

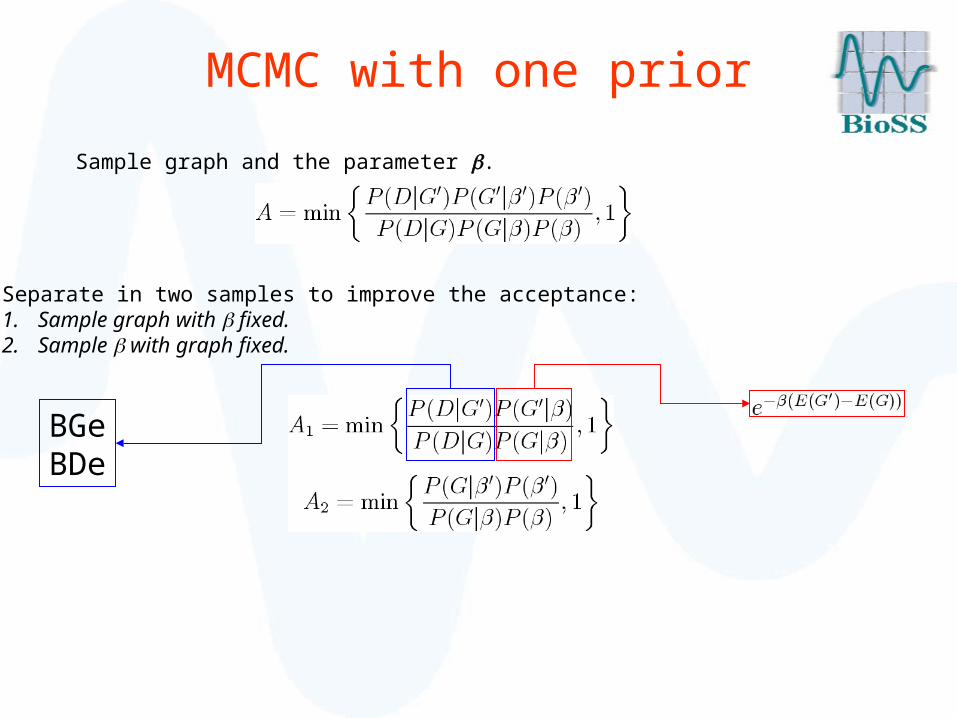
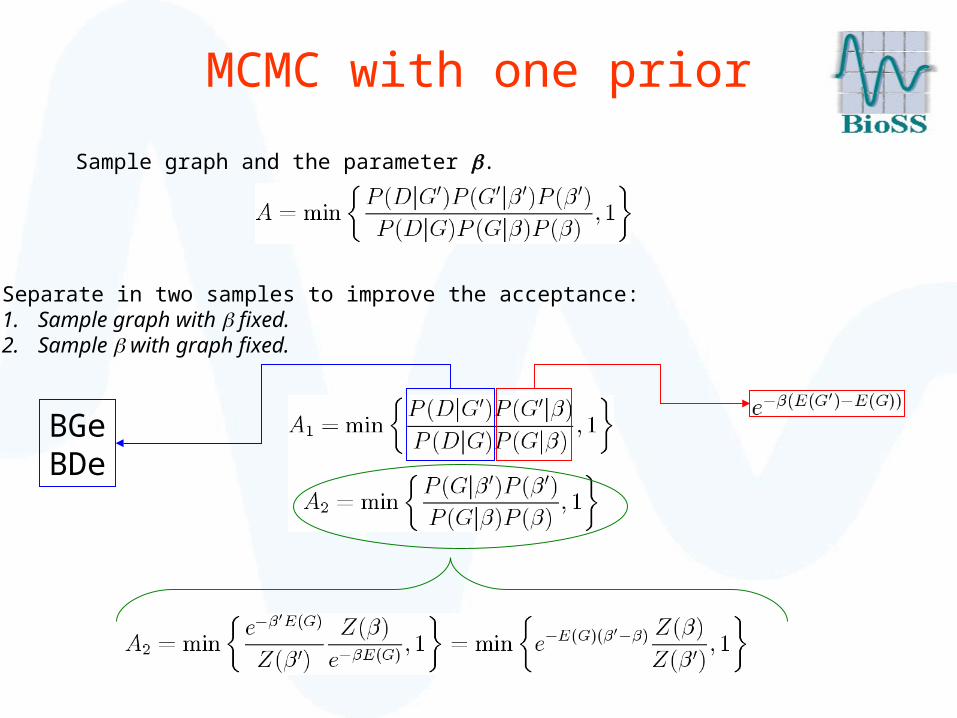
MCMC with one prior
Sample graph and the parameter .
Separate in two samples to improve the acceptance:1. Sample graph with fixed.2. Sample with graph fixed.

Sample graph and the parameter .
BGeBDe
MCMC with one prior
Separate in two samples to improve the acceptance:1. Sample graph with fixed.2. Sample with graph fixed.
Sample graph and the parameter .
BGeBDe
MCMC with one prior
Separate in two samples to improve the acceptance:1. Sample graph with fixed.2. Sample with graph fixed.
Sample graph and the parameter .
BGeBDe
MCMC with one prior
Separate in two samples to improve the acceptance:1. Sample graph with fixed.2. Sample with graph fixed.

Sample graph and the parameter .
BGeBDe
MCMC with one prior
Separate in two samples to improve the acceptance:1. Sample graph with fixed.2. Sample with graph fixed.

Approximation of the partition function

MCMC with two priors
Sample graph and the parameters and 2
Separate in three samples to improve the acceptance:1. Sample graph with 1 and 2 fixed.2. Sample 1 with graph and 2 fixed.3. Sample 2 with graph and 1 fixed.
Application to real data

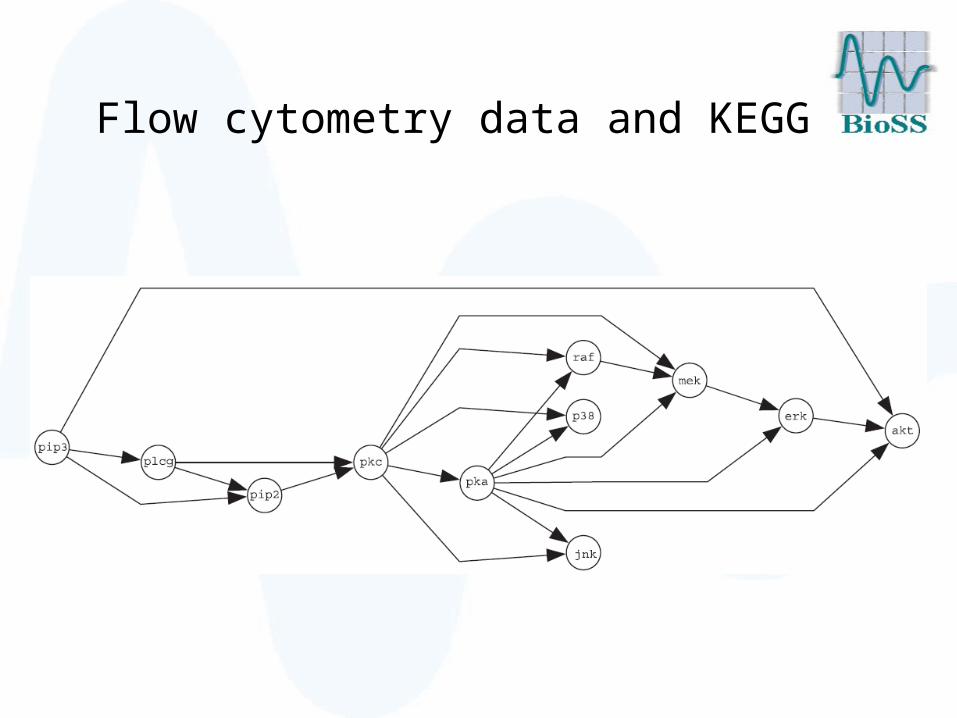
Flow cytometry data and KEGG
Flow cytometry data and KEGG

Flow cytometry data and KEGG
• Data available:
– Intracellular multicolour flow cytometry.
– Measured protein concentrations.
– 1200 data points.
• We sample 5 data sets with 100 data points each.

Flow cytometry data and KEGG
KEGG PATHWAYS are a collection of manually drawn pathway maps representing our knowledge of molecular interactions and reaction networks.

Flow cytometry data and KEGG

Prior distribution

Sampled values of the
hyperparameters

Idealized network population

Idealized network population
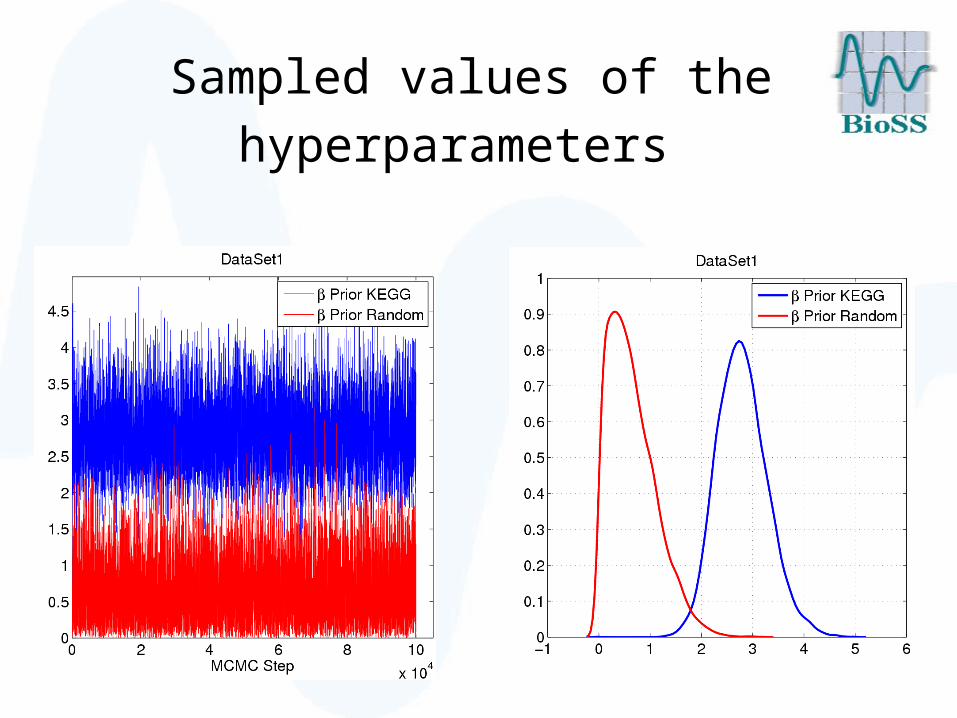
Sampled values of the
hyperparameters
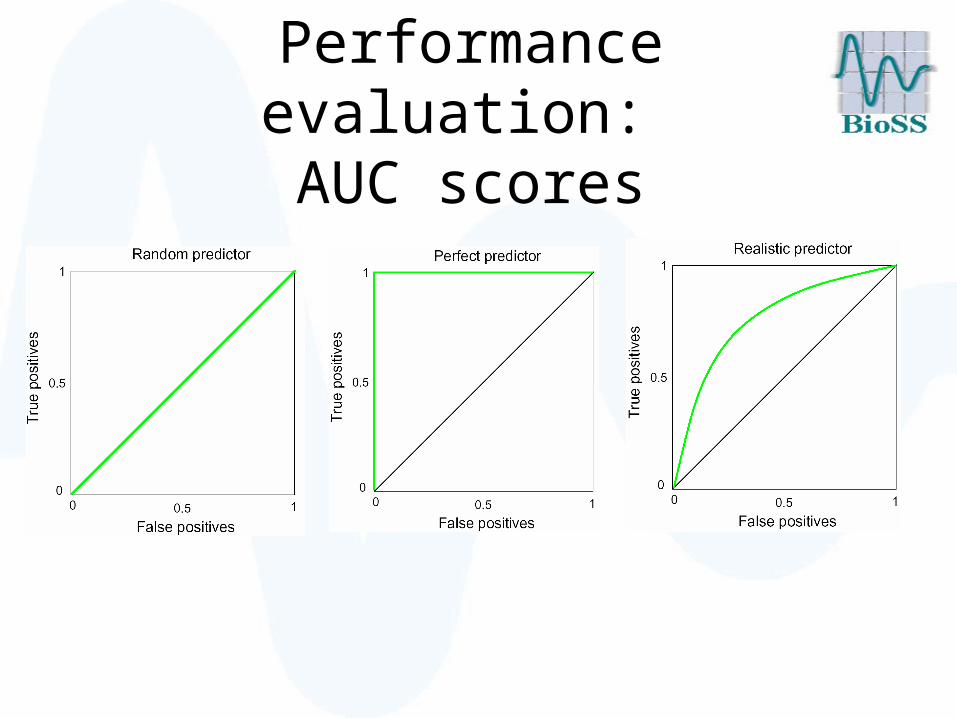
Performance evaluation: AUC scores

Flow cytometry data and KEGG
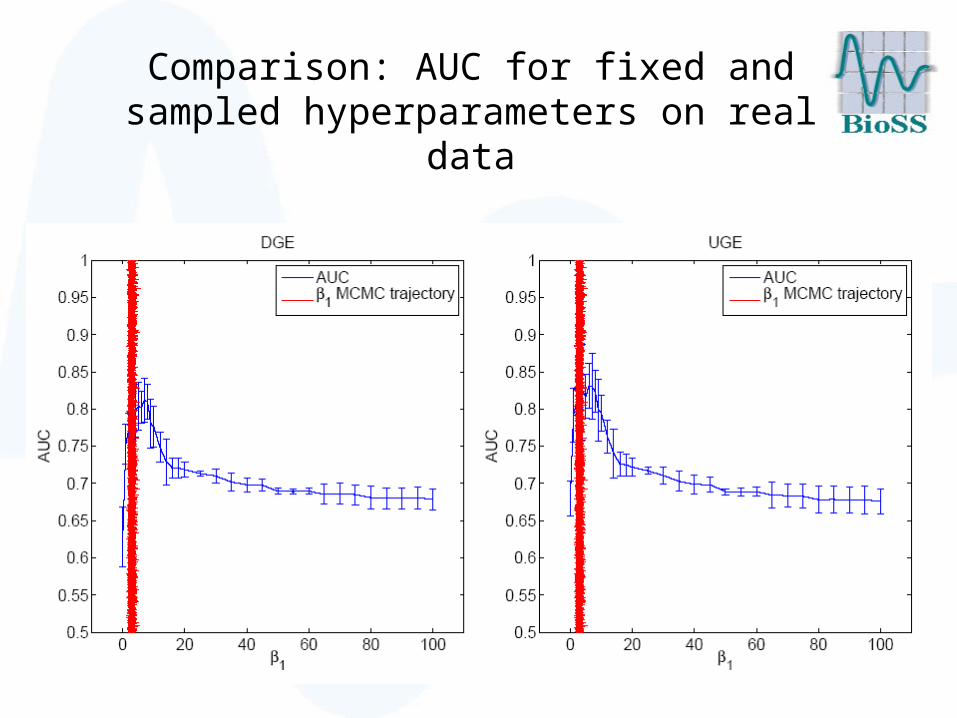
Comparison: AUC for fixed and sampled hyperparameters on real data

Comparison: AUC for fixed and sampled hyperparameters on synthetic data
Future work


Thank you