Embed Size (px)
Citation preview
P r e s e n t e d b y :S u m e e t G h o d k e ( R e g . N o . - 1 2 2 0 9 0 0 0 5 )& M a h e s h A w a t i ( R e g . N o . - 1 2 2 0 9 0 1 0 4 )M . T e c h ( M a c h i n e D e s i g n ) V e e r m a t a J i j a b a i T e c h n o l o g i c a l I n s t i t u t e , M a t u n g a , M u m b a i - 4 0 0 0 1 9 .

Table of Contents1. Abstract...............................................................................................................................4
2. Introduction........................................................................................................................5
3. Reasons for reverse engineering........................................................................................9
4. Reverse engineering of mechanical devices.....................................................................10
5. COMPUTER-AIDED REVERSE ENGINEERING.....................................................................12
6. OBTAINING THE PART GEOMETRY...................................................................................13
7. General Constraints of Data Acquisition Techniques.......................................................17
8. Legality..............................................................................................................................20
United States....................................................................................................................20
European Union...............................................................................................................20
9. EXPERIMENTAL STUDY 1:..................................................................................................22
10. EXPERIMENTAL STUDY 2:..............................................................................................26
11. Reverse engineering for military applications..............................................................34
12. CONCLUSION.................................................................................................................35
13. REFERENCES..................................................................................................................36

Table of Figure
Figure 1: Computer-added reverse engineering framework.......................................................6Figure 2: The sequence of steps required for the reconstruction of a model from multiple overlapping scans........................................................................................................................8Figure 3: Classification of data acquisition techniques used in contact and non-contact approaches for reverse engineering systems............................................................................13Figure 4: Reverse engineering of separator body (a) original part, (b) original part with markers, (c) clou of points, (d) CAD model................................................................................23Figure 5:Falcon 20.....................................................................................................................26Figure 6: detail coverage, of the actual surface.........................................................................29Figure 7: Surface in a predefined coordinate system, with various positions of the movable control surfaces and the pre-processing to allow an efficient downstream process.................29Figure 8: Application of the markers on the plane....................................................................30Figure 9: Marker and reconstructed camera positions..............................................................30Figure 10: Digitizing of the object using the ATOS II system......................................................31Figure 11: Individual ATOS scans...............................................................................................32Figure 12: ATOS II projected pattern and resulting point cloud with high data resolution at the skin seams.................................................................................................................................32Figure 13: Generated CAD model..............................................................................................33Figure 14: Different views in CAD..............................................................................................33

1. AbstractReverse engineering is the process of discovering the technological principles of a
device, object, or system through analysis of its structure, function, and operation. It
often involves taking something (a mechanical device, electronic component, computer
program, or biological, chemical, or organic matter) apart and analyzing its workings in
detail to be used in maintenance, or to try to make a new device or program that does
the same thing without using or simply duplicating (without understanding) the
original.
Reverse engineering has its origins in the analysis of hardware for commercial or
military advantage. The purpose is to deduce design decisions from end products with
little or no additional knowledge about the procedures involved in the original
production. The same techniques are subsequently being researched for application to
legacy software systems, not for industrial or defence ends, but rather to replace
incorrect, incomplete, or otherwise unavailable documentation.

2. IntroductionEngineering is a growing field that continues to evolve to suit the rapid changes of the
21st century. Engineering fields are constantly improving upon current designs and
methods to make life simple and easier. When referring to technology, simple and easy
can be directly related to fast and accurate. Simple meaning that, you do not use up
valuable time in assembly or doing a specific task. Easy meaning how many times you
will have to do the process or task.
When we think of engineering we think of the general meaning of designing a product
from a blue print or plan. Engineering is described as “the application of scientific and
mathematical principles to practical ends such as the design, manufacture, and
operation of efficient and economical structures, machines, processes, and systems”.
This type of engineering is more commonly known as Forward Engineering. An
emerging engineering concept is utilizing forward engineering in a reverse way. This
method is more commonly referred to as Reverse Engineering.
“Reverse Engineering is the practice of studying a finished product, a physical device
or a software package, in order to learn something about how it works or how it was
manufactured.”
Reverse engineering is the opposite of forward engineering. It takes an existing
product, and creates a CAD model, for modification or reproduction to the design
aspect of the product. It can also be defined as the process or duplicating an existing
component by capturing the components physical dimensions. Reverse engineering is
usually undertaken in order to redesign the system for better maintainability or to
produce a copy of a system without access to the design from which it was originally
produced.
With this knowledge, computer vision applications have been tailor to compete in the
area of reverse engineering. Computer vision is a computer process concerned with
artificial intelligence and image processing of real world images. Typically, computer
vision requires a combination of low-level image processing to enhance the image
quality (e.g. remove noise, increase contrast) and higher level pattern recognition and
image understanding to recognize features present in the image. Three-dimensional

(3D) computer vision uses two-dimensional (2D), images to generate a 3D model of a
scene or object.
There has been a mandatory need for 3D reconstruction of scenes and objects by the
manufacturing industry, medical industry, military branches and research facilities.
Manufacturing industry utilizes reverse engineering for its fast rapid prototyping
abilities and accuracy associated with the production of new parts. This fast prototyping
is done through the use of CAD model designs for inspection purposes. Military
branches also utilize reverse engineering to perform inspection task that are associated
with safety.
The goal of reverse engineering an object is to successfully generate a 3D CAD model
of an object that can be used for future modelling of parts where there exists no CAD
model.
To generate clean, smooth 3D models which requires a strong, robust image acquisition
system that can acquire data with a high level of accuracy in a sufficient time frame.
Our system uses range and intensity images of objects as input. The output is
transformed data that is represented as 3D reconstructions of geometric primitives.
Figure 1: Computer-added reverse engineering framework
There are several building blocks or steps, which determine the process of building a
complete 3D model from range and intensity data. These steps, listed in Figure 1 show
the format of how range image data is acquired, transformed and generated. This

flowchart can be characterized as a generic basic principle for reverse engineering. The
steps shown often overlap during the process of each stage.
There are many different approaches to acquiring 3D data of objects of various
structural shapes. All 3D-based machine vision systems ultimately acquire and operate
on image data. Acquisition can be based on collecting the Z-axis data using linear area,
laser radar laser scanning techniques, point detectors, or other approaches. These
systems incorporate the computer power to manage process and analyze the data
acquired. In addition to these tasks, make decisions relating the data to the application
without operator intervention. This characterizes what is meant by the term ‘‘3D-based
machine vision”.
Traditional processes for reverse engineering of objects and structures from 3D datasets
have been initial data (e.g. triangulated models) and parametric surface (e.g. quadratic
surface) driven. These approaches have been successful for simple parts, but have
resulted in reconstructions that have errors when dealing with more complex structures.
Typical errors arise from noisy data or missing data from the surface of the part. Other
errors can also consist of incorrect relative positions of the object. Industries are
looking for a method to improve upon these errors and migrated toward a fast efficient
way of modelling parts for inspection purposes. Traditional practices use CMMs, which
are coordinate measuring machines that have a touch probe to model the surface for
inspection. Today’s industries are moving toward the improvement of better accuracy
and faster inspection time. This can be improved through the integration of laser range
scanning.
When implementing a non-contact measurement solution, the end user has a large array
of commercial systems to select from. To emphasis the use of this project we have
chosen two different commercial systems with two different approaches to modeling
3D objects using vision based technology. Our approaches will be using data
acquisition systems that are fairly robust to noise and yield high accuracy
measurements. The two different techniques consist of using laser lighting and
structured lighting techniques. The first system is the IVP Range Laser Scanning
System and the second is the Genex 3D FaceCam System.
Although both systems primary focus is reconstruction of real world objects and scene,
we will investigate the limitation of both systems. Although the structured lighting
system is not designed for reverse engineering use, we will compare the modeling

aspects of this system for reverse engineering of automotive parts to the laser range
system.
Figure 2: The sequence of steps required for the reconstruction of a model from multiple overlapping scans
Figure 2 describes the data flow of our approach applied to both systems. While the
approaches are similar, the steps taken may vary for each system.
Figure 2 is a more detailed description of Figure 1. The blue area best describes the data
capturing section, while the yellow and orange highlights the data pre and post-
processing steps and the final outcome is a 3D CAD model. In the data segmentation
stage several steps are taken to generate noise free, smooth models of the part. In data
reduction, data such as the noise, outlier or erroneous background information is
eliminated. Outliers are false data points that are captured during acquisition. Surface
smoothing and multi-view registration are included in data integration. Surface
smoothing is an additional feature to eliminate noisy data and make the surface of the
object more uniform in texture. This can be performed both before and/or after several
views of the part are merged. After all the steps are complete a final 3D CAD model is
generated.

3. Reasons for reverse engineering
Interoperability.
Lost documentation: Reverse engineering often is done because the documentation
of a particular device has been lost (or was never written), and the person who built
it is no longer available.
Integrated circuits often seem to have been designed on obsolete, proprietary
systems, which means that the only way to incorporate the functionality into new
technology is to reverse-engineer the existing chip and then re-design it.
Product analysis. To examine how a product works, what components it consists
of, estimate costs, and identify potential patent infringement.
Digital update/correction. To update the digital version (e.g. CAD model) of an
object to match an "as-built" condition.
Security auditing.
Military or commercial espionage. Learning about an enemy's or competitor's latest
research by stealing or capturing a prototype and dismantling it.
Removal of copy protection, circumvention of access restrictions.
Creation of unlicensed/unapproved duplicates.
Academic/learning purposes.
Curiosity
Competitive technical intelligence (understand what your competitor is actually
doing versus what they say they are doing)
Learning: learn from others' mistakes. Do not make the same mistakes that others
have already made and subsequently corrected.

4. Reverse engineering of mechanical devices
As computer-aided design (CAD) has become more popular, reverse engineering has
become a viable method to create a 3D virtual model of an existing physical part for
use in 3D CAD, CAM, CAE and other software. The reverse-engineering process
involves measuring an object Testing and then reconstructing it as a 3D model. The
physical object can be measured using 3D scanning technologies like CMMs, laser
scanners, structured light digitizers or computed tomography. The measured data alone,
usually represented as a point cloud, lacks topological information and is therefore
often processed and modelled into a more usable format such as a triangular-faced
mesh, a set of NURBS surfaces or a CAD model.
The point clouds produced by 3D scanners are usually not used directly since they are
very large unwieldy data sets, although for simple visualization and measurement in the
architecture and construction world, points may suffice. Most applications instead use
polygonal 3D models, NURBS surface models, or editable feature-based CAD models .
The process of converting a point cloud into a usable 3D model in any of the forms
described above is called “modelling”.
POLYGON MESH MODELS: In a polygonal representation of a shape, a curved
surface is modeled as many small faceted flat surfaces (think of a sphere modeled as a
disco ball). Polygon models -- also called Mesh models, are useful for visualization, for
some CAM (i.e., machining), but are generally "heavy" ( i.e., very large data sets), and
are relatively un-editable in this form. Reconstruction to polygonal model involves
finding and connecting adjacent points with straight lines in order to create a
continuous surface. Many applications are available for this purpose (eg. kubit
PointCloud for AutoCAD, photomodeler, imagemodel, PolyWorks, Rapidform,
Geomagic, Imageware, Rhino, etc.).
SURFACE MODELS: The next level of sophistication in modelling involves using a
quilt of curved surface patches to model our shape. These might be NURBS, TSplines
or other representations of curved topology using higher ordered polynomials (i.e,
curved, not straight). Using NURBS, our sphere is a true mathematical sphere. Some
applications offer patch layout by hand but the best in class offer both automated patch
layout and manual layout. These patches have the advantage of being lighter and more
manipulable when exported to CAD. Surface models are somewhat editable, but only in
a sculptural sense of pushing and pulling to deform the surface. This representation
lends itself well to modeling organic and artistic shapes. Providers of surface modelers
include NX, Imageware, Rapidform, Geomagic, Rhino, Maya, T-Splines etc.
SOLID CAD MODELS: From an engineering/manufacturing perspective, the ultimate
representation of a digitized shape is the editable, parametric CAD model. After all,
CAD is the common "language" of industry to describe, edit and maintain the shape of
the enterprise's assets. In CAD, our sphere is described by parametric features which
are easily edited by changing a value (e.g., centerpoint and radius).
These CAD models describe not simply the envelope or shape of the object, but CAD
models also embody the "design intent" (i.e., critical features and their relationship to
other features). An example of design intent not evident in the shape alone might be a
brake drum's lug bolts, which must be concentric with the hole in the center of the
drum. This knowledge would drive the sequence and method of creating the CAD
model; a designer with an awareness of this relationship would not design the lug bolts
referenced to the outside diameter, but instead, to the center. A modeler creating a CAD
model will want to include both Shape and design intent in the complete CAD model.
Vendors offer different approaches to getting to the parametric CAD model. Some
export the NURBS surfaces and leave it to the CAD designer to complete the model in
CAD(e.g., Geomagic, Imageware, Rhino). Others use the scan data to create an editable
and verifiable feature based model that is imported into CAD with full feature tree
intact, yielding a complete, native CAD model, capturing both shape and design intent
(e.g. Rapidform). Still other CAD applications are robust enough to manipulate limited
points or polygon models within the CAD environment (e.g., Catia).

5. COMPUTER-AIDED REVERSE ENGINEERING
Reverse Engineering originally emerged as the answer to provide spares for replacing
broken or worn out parts for which no technical data was available. This can be the case
if the part was originally imported (without drawings) or the drawings being misplaced
or lost. Reengineering or reverse engineering such parts can be a less expensive option
compared to re-importing, not only for immediate replacement, but also to create
additional spares to maintain the product over a longer period.
Reverse Engineering has been defined as a process for obtaining the technical data of a
critical spare component. Computer-aided reverse engineering relies on the use of
computer-aided tools for obtaining the part geometry, identifying its material,
improving the design, tooling fabrication, manufacturing planning and physical
realization (Figure 1). A solid model of the part is the backbone for computer-aided
reverse engineering. The model data can be exported from or imported into
CAD/CAE/CAM systems using standard formats such as IGES, STL, VDA and STEP.
The three most important sets of data in reverse engineering activities relate to the CAD
model generation, material identification and rapid manufacturing. These are described
in the following sections.
6. OBTAINING THE PART GEOMETRY
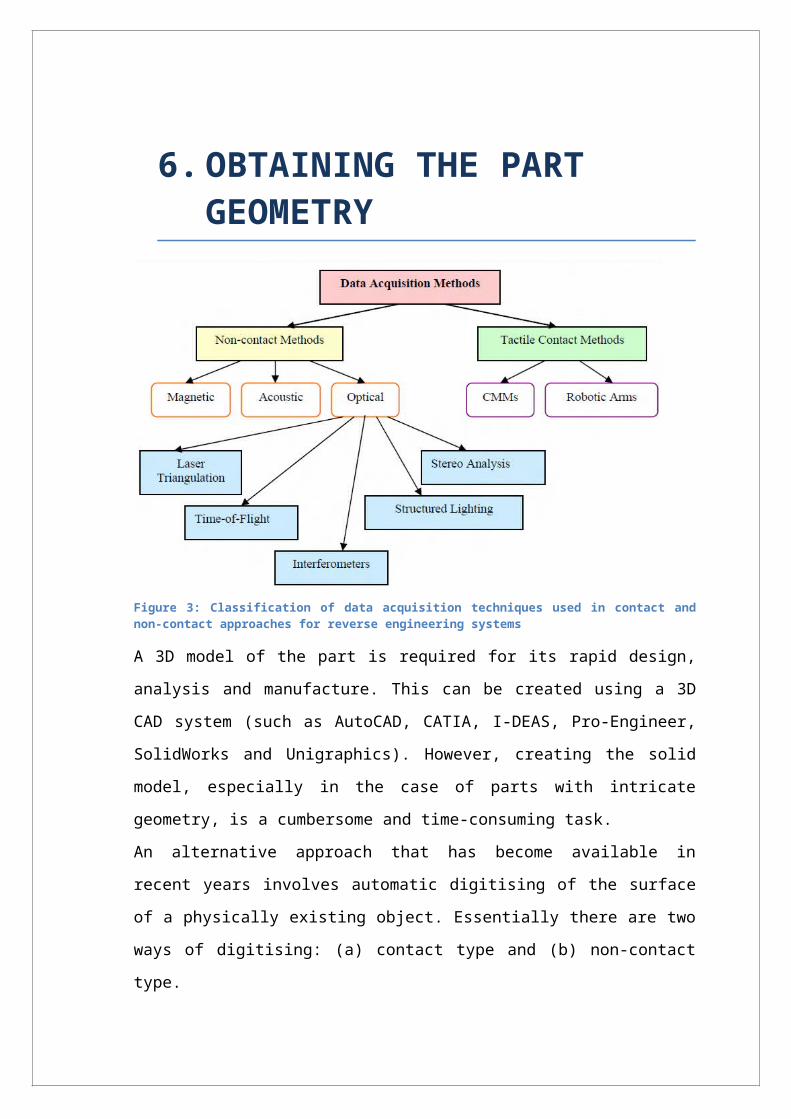
Figure 3: Classification of data acquisition techniques used in contact and non-contact approaches for reverse engineering systems
A 3D model of the part is required for its rapid design, analysis and manufacture. This
can be created using a 3D CAD system (such as AutoCAD, CATIA, I-DEAS, Pro-
Engineer, SolidWorks and Unigraphics). However, creating the solid model, especially
in the case of parts with intricate geometry, is a cumbersome and time-consuming task.
An alternative approach that has become available in recent years involves automatic
digitising of the surface of a physically existing object. Essentially there are two ways
of digitising: (a) contact type and (b) non-contact type.
Contact type:
In this method, there is physical contact between the measuring instrument and the
surface being measured to record as many dimensions as possible. The simplest
approach involves manual measurement of a model's dimensions. Hand tools such as
micrometers, vernier calipers and gages are used to capture the critical dimensions
needed to generate a part drawing. A more sophisticated approach is to use a coordinate
measuring machine (CMM).

Non-contact Method:
Non-contact digitising techniques are those where the data acquisition device does not
physically touch the part. There are two classes of non-contact methods: active and
passive. Active methods need the use of structured lighting and reflection from the
object, where as passive methods work with the ambient light. There are various types
of non-contact scanners such as Laser Scanner, Computer Assisted Tomography, Moiré
Interferometry and White Light Triangulation.
Laser scanning: includes a probe that emits low energy laser beams, a scanning
mechanism that projects the laser beam onto the surface being digitised, and optic
receptors with collecting lenses for detecting the reflected laser beam. A narrow beam
of laser light is projected onto the surface of the object with a laser line-of-sight (LOS)
angled approximately 30 to 45 degrees with respect to the receiving sensor LOS. The
triangulation technique is used to determine the coordinate position of that point on the
surface. This method generates one (x, y, z) data point per measurement.
Computed Assisted Tomography (CT): utilizes an x-ray with multiple sensors to
create a picture of a thin slice of an object along with the associated dimensional data,
similar to medical CT scanning. The equipment repetitively scans the object, one cross-
sectional slice at a time, building a dense point cloud in each plane. By measuring how
much X-ray energy is absorbed by the part, the shape of the part and its interior can be
estimated. The distance between the slices is decided based on the amount of detail
required. A 3D CAD model can be generated by combining the 2D slices using suitable
software (such as Mimics from Materialise, Inc.). The main advantage of this process is
its ability to capture internal features, including anomalies. The entire geometry,
regardless of complexity, can be obtained in one scan, eliminating the need for merging
different point clouds.
Moiré interferometry uses structured lighting. It is an optical technique based on
interference fringes between incident and reflected light. The shape and distribution of
the fringes give information about the shape of the part. Typically, this method projects
a fringe pattern of light (white bands and dark shadows) onto an object, which is then
viewed through a similar reference pattern. The projected pattern, when viewed by an
operator appears to ‘pulse’ with the reference pattern creating a Moiré pattern. If the
object is relatively flat, this Moiré pattern appears uniform in structure. If the object has

surface variations, the Moiré pattern will have distortions that can be related to the
shape of the object.
White light triangulation is a passive method using an optical technique based on
stereovision. The underlying principle is similar to laser scanning. Measurement is
based on the angle of the projected light, the angle of the reflection captured, and the
positions of the source and the camera. In white light triangulation, the source emits
white light. The main advantage of this process over laser scanning is that a grid of
points are all scanned (triangulated) and measured in parallel. Various views of the
object are statically captured.
With large objects or objects with complex surfaces, several measurement views from
varying angles are recorded. These views are transformed and merged to create one
three-dimensional point cloud. This process is much faster and more accurate than laser
scanning because there is much less movement due the static capture of each of the
views.
The result of all digitising methods is point cloud data, (or cloud of points, COPs),
which are random and unstructured collection of x, y, z coordinates. It is difficult to
handle such huge point data sets directly in CAD software. Reverse engineering
software such as Geomagics, Imageware Surfacer, Magics, Pro/Scan Tools, Rapidform
and STRIM are specially developed for this purpose. Part features can be extracted by
partitioning the 3D data into non-intersecting homogenous regions; which is referred to
as segmentation. After this, conventional CAD software is employed to fit various
types of surfaces to segmented data.
3D scanner
A 3D scanner is a device that analyzes a real-world object or environment to collect
data on its shape and possibly its appearance (i.e. color). The collected data can then be
used to construct digital, three dimensional models useful for a wide variety of
applications. These devices are used extensively by the entertainment industry in the
production of movies and video games.
Other common applications of this technology include industrial design, orthotics and
prosthetics, reverse engineering and prototyping, quality control/inspection and
documentation of cultural artifacts.
Many different technologies can be used to build these 3D scanning devices; each
technology comes with its own limitations, advantages and costs. It should be
remembered that many limitations in the kind of objects that can be digitized are still

present: for example optical technologies encounter many difficulties with shiny,
mirroring or transparent objects.
The purpose of a 3D scanner is usually to create a point cloud of geometric samples on
the surface of the subject. These points can then be used to extrapolate the shape of the
subject (a process called reconstruction). If color information is collected at each point,
then the colors on the surface of the subject can also be determined.
3D scanners are very analogous to cameras. Like cameras, they have a cone-like field
of view, and like cameras, they can only collect information about surfaces that are not
obscured. While a camera collects color information about surfaces within its field of
view, 3D scanners collect distance information about surfaces within its field of view.
The “picture” produced by a 3D scanner describes the distance to a surface at each
point in the picture. If a spherical coordinate system is defined in which the scanner is
the origin and the vector out from the front of the scanner is φ=0 and θ=0, then each
point in the picture is associated with a φ and θ. Together with distance, which
corresponds to the r component, these spherical coordinates fully describe the three
dimensional position of each point in the picture, in a local coordinate system relative
to the scanner.
For most situations, a single scan will not produce a complete model of the subject.
Multiple scans, even hundreds, from many different directions are usually required to
obtain information about all sides of the subject. These scans have to be brought in a
common reference system, a process that is usually called alignment or registration,
and then merged to create a complete model. This whole process, going from the single
range map to the whole model, is usually known as the 3D scanning pipeline.
7. General Constraints of Data Acquisition Techniques
There are many practical problems with acquiring useable data, the major ones being:
a. Calibration
b. Accuracy
c. Accessibility
d. Occlusion
e. Fixture (placement)
f. Multiple views
g. Noise and incomplete data
h. Statistical distributions of parts
i. Surface finish
Calibration is an essential part of setting up and operating a position-measuring device.
Systematic sensing errors can occur through lens distortions, non-linear electronics in
cameras, and similar sources. Any sensing must be calibrated so as to, first, accurately
determine parameters such as camera points and orientations, and second, to model and
allow for as accurately as possible systematic sources of error. Most of the papers cited
present some discussion of accuracy ranges for the various types of scanners, but all
methods of data acquisition require accurate calibration. Optical scanners' accuracies
typically depend largely on the resolution of the video system used. Distance from the
measured surface and accuracy of the moving parts of the scanning system all
contribute to the overall measurement error.
Accessibility is the issue of scanning data that is not easily acquired due to the
configuration or topology of the part. This usually requires multiple scans but can also
make some data impossible to acquire with certain methods. Through holes are typical
examples of inaccessible surfaces.
Occlusion is the blocking of the scanning medium due to shadowing or obstruction.
This is primarily a problem with optical scanners. However, acoustic and magnetic
scanners may also have this problem. Multiple scanning devices are one approach to
obviate this problem. As well as self-occlusion, occlusion may also arise due to
fixtures-typically parts must be clamped before scanning. The geometry of the fixture
used, becomes a part of the scan data. Elimination of fixture data is difficult and often
requires multiple views.
Also central gravity of the part makes most surfaces of the object difficult to scan.
Multiple views introduce errors in acquired data because of registration problems (see
more details later).
Noise elimination in data samples is a difficult issue. Noise can be introduced in a
multitude of ways, from extraneous vibrations, specular reflections, etc. There are many
different filtering approaches that can be used. An important question is whether to
eliminate the noise before, after, or during the model building stage. There are times
when the noise should not be eliminated at all. Noise filtering, though, is often an
unavoidable step in reverse engineering, but note, that this also destroys the "sharpness"
of the data i.e. typically sharp edges disappear and are replaced by smooth blends,
which in some cases may be desirable, but in other cases may lead to serious problems
in identifying features.
A similar problem is restoration of missing data. This is partly necessary due to the
above-mentioned inaccessibility and occlusion problems. Moreover, because of the
nature of optical and even tactile scanning, the data close to sharp edges is also fairly
unreliable. Finally there are situations where only parts of a certain surface can be
measured, there are missing parts or parts obscured by other elements, but we need to
reconstruct the whole surface from just the visible parts. Further ideas on surface
extensions, intersections and patching holes are given in the last part of the paper.
Statistical distribution of parts deals with the fact that any given part, which is scanned,
only represents one sample in a distributed population. When reverse engineering
methods attempt to reproduce a given shape, the tolerance distribution of the scanned
part must be considered. This gives rise to multiple part scans and the averaging of the
resulting data. However, it may be somewhat impractical to attempt to sample many
parts from a population, and indeed, often only one is available.
The final issue we bring up is surface finish of the part being measured. Smoothness
and material coatings can dramatically affect the data acquisition process. Tactile or
optical methods will produce more noise with a rough surface than a smooth one.
Reflective coatings also can affect optical methods.
Imagine an ideal scanner: the object is 'floating' in 3D spaces, so it is accessible from
all directions. The data is captured in one coordinate system with high accuracy, with
no need for noise filtering and registration. Possibly, the measurement is adaptive, i.e.

more points are collected at highly curved surface portions, etc. Unfortunately, such a
device does not exist at present. But, despite the practical problems discussed, it is
possible to obtain large amounts of surface data in reasonably short periods of time
even today using the methods described. Once the measured data is acquired, the
process of recognition and model building can begin. The imperfect nature of the data,
particularly inaccuracy and incompleteness, however, makes these steps fairly difficult
as will be seen in the following sections.

8. LegalityUnited States
In the United States even if an artifact or process is protected by trade secrets, reverse-
engineering the artifact or process is often lawful as long as it is obtained legitimately.
Patents, on the other hand, need a public disclosure of an invention, and therefore,
patented items do not necessarily have to be reverse-engineered to be studied.
(However, an item produced fewer than one or more patents could also include other
technology that is not patented and not disclosed.) One common motivation of reverse
engineering is to determine whether a competitor's product contains patent
infringements or copyright infringements.
The reverse engineering of software in the US is generally a breach of contract as most
EULAs specifically prohibit it, and courts have found such contractual prohibitions to
override the copyright law which expressly permits it; see Bowers v. Baystate
Technologies.
European Union
Article 6 of the 1991 EU Computer Programs Directive allows reverse engineering for
the purposes of interoperability, but prohibits it for the purposes of creating a
competing product, and also prohibits the public release of information obtained
through reverse engineering of software.
In 2009, the EU Computer Program Directive was superseded and the directive now
states:
The unauthorised reproduction, translation, adaptation or transformation of the form of
the code in which a copy of a computer program has been made available constitutes an
infringement of the exclusive rights of the author. Nevertheless, circumstances may
exist when such a reproduction of the code and translation of its form are indispensable
to obtain the necessary information to achieve the interoperability of an independently
created program with other programs. It has therefore to be considered that, in these
limited circumstances only, performance of the acts of reproduction and translation by

or on behalf of a person having a right to use a copy of the program is legitimate and
compatible with fair practice and must therefore be deemed not to require the
authorisation of the rightholder. An objective of this exception is to make it possible to
connect all components of a computer system, including those of different
manufacturers, so that they can work together. Such an exception to the author's
exclusive rights may not be used in a way which prejudices the legitimate interests of
the rightholder or which conflicts with a normal exploitation of the program.

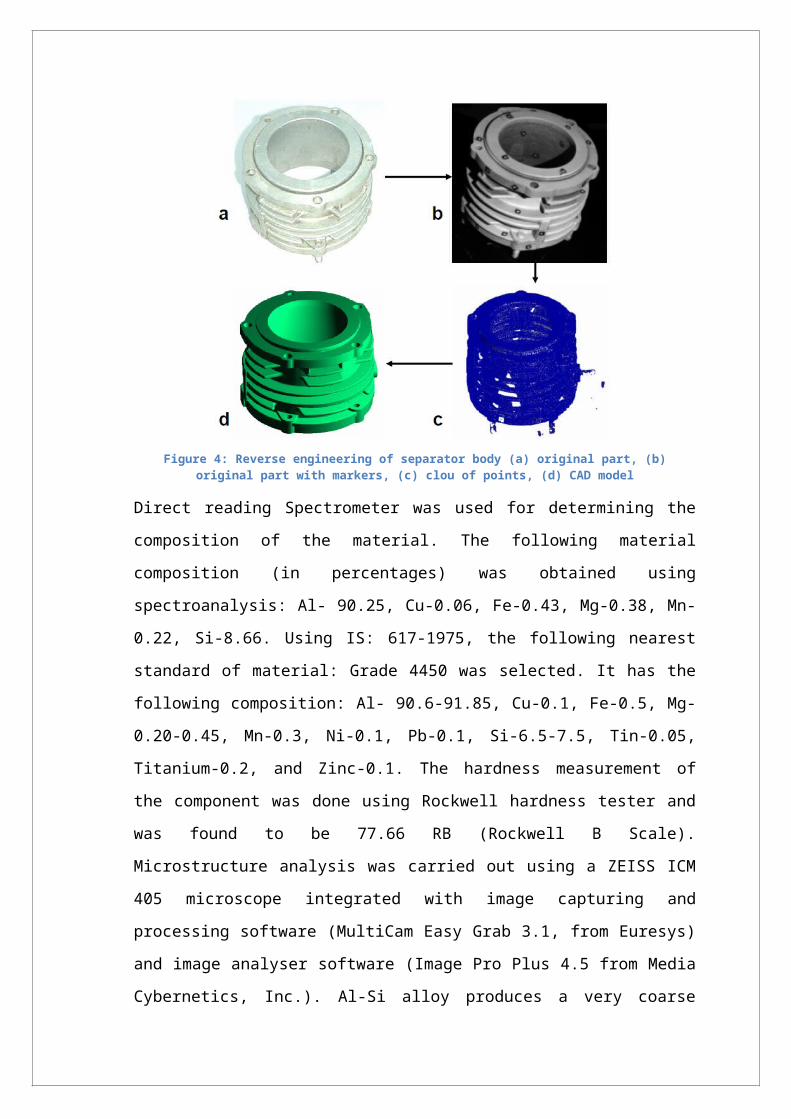
9. EXPERIMENTAL STUDY 1:A separator body (Figure 4a) of a hydraulic oil filter assembly belonging to army
special vehicle was chosen for studying the application of computer-aided technologies
for rapid development of one-off intricate parts required for replacement purposes. The
part had no drawings or any other data related to its manufacturing. The investigation
involved mainly three steps: design data generation (part geometry by 3D scanning, and
material identification by spectrometry), tooling fabrication (using rapid prototyping)
and investment casting (after process planning and simulation). The part model
generated by reverse engineering was the connecting link between all activities.
6.1 Part Geometry
For obtaining the geometry of the separator body part an ATOS II Optical Digital
scanner available at the Indian Institute of Technology, Kanpur was used, shown in
Figure 4.
It uses Moiré interferometry principle explained in a previous section. In this scanner,
several images of the part are taken from different angles; markers are placed on the
part for creating references for merging the images later. The images are automatically
triangulated by the scanner software and bundled together producing a highly accurate
reference file of the marker centres (X, Y & Z) for accurate scan patch placement in the
global reference system.
After scanning the part, the software polygonising module generates the point cloud
based on a user defined density or resolution. This data can then be exported in ASCII,
STL, IGES or VDA formats.
For the separator body, 50 markers were used (Figure 4b). A total of 33 shots (pictures)
were taken from different angles, taking about 4 hours for scanning the entire part to
obtain a cloud of points or COPs (Figure 4c). The 3D CAD model (Figure 4d) was
automatically generated from the COPs by surface fitting using Imageware Surfacer
software.
This involved fitting 1017 surface patches (consisting of 5967 curves and polylines) on
the cloud point data. The surfaces were then ‘stitched’ together to obtain a ‘water tight’
CAD model of the part. An allowance of 3 mm on all machined surfaces and shrinkage
allowance of 7% (metal and wax included) were added to obtain the CAD model of the
casting. The part model was used for fabricating a prototype, whereas the casting model
was used for fabricating wax patterns for investment casting.
There were no hidden features in the separator body. Otherwise, the sample part would
have to be cut in a plane passing through the internal features to enable their scanning.
This however, leads to destruction of the sample. External surfaces must therefore be
scanned first before cutting the sample.
6.2 Material analysis
Figure 4: Reverse engineering of separator body (a) original part, (b) original part with markers, (c) clou of points, (d) CAD model
Direct reading Spectrometer was used for determining the composition of the material.
The following material composition (in percentages) was obtained using
spectroanalysis: Al- 90.25, Cu-0.06, Fe-0.43, Mg-0.38, Mn-0.22, Si-8.66. Using IS:
617-1975, the following nearest standard of material: Grade 4450 was selected. It has
the following composition: Al- 90.6-91.85, Cu-0.1, Fe-0.5, Mg-0.20-0.45, Mn-0.3, Ni-
0.1, Pb-0.1, Si-6.5-7.5, Tin-0.05, Titanium-0.2, and Zinc-0.1. The hardness
measurement of the component was done using Rockwell hardness tester and was
found to be 77.66 RB (Rockwell B Scale). Microstructure analysis was carried out
using a ZEISS ICM 405 microscope integrated with image capturing and processing
software (MultiCam Easy Grab 3.1, from Euresys) and image analyser software (Image
Pro Plus 4.5 from Media Cybernetics, Inc.). Al-Si alloy produces a very coarse
microstructure, in which the eutectic comprises large plates and needles of silicon in a
continuous aluminium matrix, as shown in the microstructure analysis in Figure 4.
6.3 Process Planning
The 3D CAD model of the casting part was used for designing the methoding and
simulating the casting process, using AutoCAST software as shown in Figure 4. The
main inputs are part model available as an STL file (ASCII or Binary format) created
by a solid modelling software; cast metal selected from a library that includes grey
iron, ductile iron, steel, alloy steel, and alloys of aluminium, magnesium, copper and
zinc; and process which includes sand, shell and permanent mould (gravity die). Based
on these inputs, the software suggests casting orientation, parting position, feeder
location and size, and gating design. The user can override these suggestions. The solid
models of casting elements (feeder, gating, etc.) are automatically created based on the
design. Then the process is simulated to predict internal defects (such as shrinkage
porosity and inclusions). The user can modify the casting design and simulate the
process until internal defects are minimized and yield is maximized. The summary of
solidification analysis of the separator body is as follows:
(a) Preliminary analysis (without a feeder) showed a circular zone of shrinkage porosity
in the left side of the casting (with respect to the figure).
(b) Two side feeders (height 50 mm, dia 34 mm top, 38 mm bottom, neck 12 mm x 24
mm) were modeled and attached to casting. Solidification analysis was performed and
different casting sections were checked. A hot spot region at the top was still visible.
(c) A top feeder (same height and dia; neck 30 mm x 14 mm) was modeled and
attached. The results are better, but the neck size can be further increased depending on
the results of the first trial.
6.4 Prototype Part and Casting Pattern
The Stereolithography (SLA) rapid prototyping process was used for fabricating the
prototype (Figure 6a) of the part in photo curable resin material on an SLA5000
machine.
Layer thickness was set to 0.1 mm. The fabrication took 22 hours. This was followed
by clearing the supports using acetone, drying in an air stream and treating with ultra
violet light for two hours for improving the strength.
Two investment casting patterns were made using SLA QuickCast and Thermojet RP
processes. A layer thickness of 0.1 mm was used in both processes.
The fabrication took less than 12 hours for each pattern. The QuickCast process is a
variation of the Stereolithography process giving a hollow honeycomb structure of
photo curable resin material. The Thermojet material is closer to the wax used in
investment casting process and is also more economical than QuickCast patterns. It was
therefore chosen to fabricate the separator body by investment casting process.

10. EXPERIMENTAL STUDY 2:
Aerospace: Digitizing of a Full Scale Falcon 20 "Zero G" Jet Aircraft
The National Research Council (NRC) Institute for Aerospace Research had a
requirement to digitize their Falcon 20 parabolic aircraft to capture its "As Built"
condition for CFD analysis, moveable aero surfaces positions and aircraft symmetry
checks.
Figure 5:Falcon 20
The National Research Council (NRC) Institute for Aerospace Research had a
requirement to digitize their Falcon 20 parabolic aircraft to capture it's "As Built"
condition for CFD analysis, moveable aero surfaces positions and aircraft symmetry
checks.
The NRC Falcon 20 was only available for a 2.5 day period for the data acquisition
process. Previous to the Falcon 20 project the team at NRC had already worked with
"point cloud" data which was acquired on a different aircraft. Knowing their
downstream surfacing processes, NRC wanted both a dense scan data to support rapid

surfacing techniques (surfacing on STL data) and on surface measured data (versus data
collected with an offset from the surface) to expedite downstream processing. Capture
3D utilized two complimentary non-contact data acquisition devices, ATOS II
Structured White Light and TRITOP Digital Photogrammetry, to capture the Falcon 20
in the allotted 2.5 days. This article describes the process and displays various images
of the resultant large scale scan project.
NRC's Falcon 20 Parabolic Flight Aircraft
The Falcon 20 supports the Canadian Space Agency by providing near "Zero G"
conditions for a limited time-span.
A few interesting specifications: Manufactured by Dassault (France):
• Span 16.3m (53ft 6in), Length 17.15m (56ft 3in), Height 5.32m (17ft 5in)
• 18 - 22 seconds of near zero "G" time
• Usual engagement includes four parabolas
• Three minutes between parabolas
• Usual flight test duration 45 minutes
• 10,000 Ft altitude drop and rise
• Fuel and hydraulic systems modified for zero G
• Materials such as high quality glass and super-conducting materials created in absence
of gravity have unique properties
NRC Project Goals
The NRC Institute for Aerospace Research - Aerodynamics Laboratory in Ottawa,
Canada, specializes in various stages of flight testing and training. They perform
onboard experiments, scale-model wind tunnel testing and computer physics
simulation. To ensure a valid computer simulation, NRC's input data for the simulations
needs to match the physical experimental set up. "As Built" data acquisition and

Reverse Engineering play key roles as the link between the physical and the digital
model environment.
NRC has performed Reverse Engineering projects in the past to generate CFD and
CAD models. Prior approaches involved contact metrology techniques (portable CMMs
or laser trackers) which provided data points offset from the actual aircraft surface.
Offsetting the data of complex areas of an aircraft can be a time-consuming and a
quality-limiting task sometimes subject to the CAD designer's interpretation. In an
ongoing process improvement effort the NRC wanted to increase data collection
throughput and acquired surface data definition and reduce post processing time and
effort.
NCR investigated the metrology marketplace to find the tools that would help them to
improve on the previous aircraft data acquisition and post processing effort. They
selected Capture 3D Inc. with their ATOS II and TRITOP Digital Photogrammetry
systems to capture the full exterior aero surfaces for digital definition creation.
The goals of the data acquisition process:
• Full aero surfaces for CFD model creation - aircraft on jacks with bay doors closed
• Scan past centerline - assuming aircraft symmetry, checks done for validation
• Symmetry check - key features measured on "Non Master" side to perform symmetry
checks
• On aircraft scan data required - On surface data eliminated the offset of data
requirement
• Full definition of complex blended surfaces - ensure wing to fuselage mates fully
captured
• Confidence of full definition of aircraft - Real time visualization displays project
status
• Measure the full aircraft in one coordinate system - supports digital assembly
• Capture various positions of the moveable control surfaces
• Fast and easy integration into downstream processing requirements - creation of STL
file to support rapid surfacing
• Time effective data acquisition process - Aggressive 2.5 day window to capture the
Falcon 20
• Cost effective process needed - Reduced data acquisition cost over previous
Project

Figure 6: detail coverage, of the actual surface
Falcon 20 Data Acquisition Process
Due to the size of the object being scanned, Capture 3D performed a two step data
acquisition process (TRITOP Digital Photogrammetry and ATOS II Optical Scan) to
complete the scanning task.
This was done to both expedite the project and deliver the highest accuracy of data. The
Falcon 20 was put on jacks and all bay doors were closed to create the required aero
surfaces configuration. The movable aero surfaces were set at a certain position for the
initial scan. The moveable aero surfaces will be repositioned at various degrees and
measured after the initial scan.
Figure 7: Surface in a predefined coordinate system, with various positions of the movable control surfaces and the pre-processing to allow an efficient downstream process.

TRITOP Digital Photogrammetry Process
Once the aircraft was stabilized on jacks the Capture 3D team placed markers on the
aircraft, which will be utilized for both, the TRITOP and ATOS II scan process. A
TRITOP session is performed via the use of a hand held high resolution digital camera.
The user takes multiple pictures from varying positions around the aircraft, camera
locations depicted in yellow (Figure 8).
Figure 8: Application of the markers on the plane.
These images are then automatically triangulated and bundled together producing a
highly accurate reference file of the marker centers (X,Y & Z) to be utilized by the
ATOS II scanner for accurate and automatic scan patch placement. The TRITOP
process utilizes uniquely coded markers that are automatically identified by the
processing software. These markers are the reference grid for the individual ATOS
scans needed to cover the full surface.
Figure 9: Marker and reconstructed camera positions.

ATOS II Optical Scanning Process
The Falcon 20 aero surfaces were captured utilizing the Dual 1.3M pixel ATOS II
Optical Scanning system, mounted on the articulating stand or on a cherry picker. The
ATOS system utilized the TRITOP generated reference file for automatic scan patch
orientation. A TRITOP value add is the ability to scan at various locations on the
aircraft and having the scan data placed in the appropriate location via the TRITOP
generated global reference system.
Figure 10: Digitizing of the object using the ATOS II system
The ATOS II has a variable scanning envelope to ensure proper scan data resolution,
point density / spacing, for the object being scanned. The Falcon 20 was scanned
utilizing a 1.2 x 0.96 x 0.96 M (approx. 47 x 37 x 37 in) per scan measuring volume
capable of delivering a point spacing of typically 1 mm (0.037 in). The same system
can be increased to a 1.7 x 1.3 x 1.3 M (approx. 67 x 53 x 53 in) per scan volume all the
way down to a 45 x 36 x 25 mm (approx. 1.8 x 1.6 x 1.0 in) per scan volume if
necessary to accommodate part feature capture.
As each scan is taken the ATOS software responds with information on the quality of
the scan and the fit of the scan patch in the global reference system. This lets the user
know if the part has moved or flexed and if there has been environmental condition
changes during that scan. The system will then automatically merge that scan into the
reference system and existing point cloud.
The user sees a real-time build of the point cloud on the screen as the Falcon 20 is
scanned. This helps to ensure complete and effective scanning. After the aircraft has
been scanned, the ATOS polygonizing module will fine tune the alignment and
generate the point cloud STL file in the requested density / resolution. This data can
then be processed in various ways and exported out in ASCII, STL, IGES or VDA
formats.

Figure 11: Individual ATOS scans
Figure 12: ATOS II projected pattern and resulting point cloud with high data resolution at the skin seams
Aircraft Symmetry Check and Movable Aero Surfaces Position Check
The NRC requested that areas on the opposite "non master" side of the Falcon 20 be
scanned to perform aircraft symmetry checks as well as the movable control surfaces be
captured in various positions. This required the TRITOP session to be performed
encompassing both the entire wings and tail section from tip to tip. The movable aero
surfaces were captured in each position and referenced back to the original global
reference system to perform the range of motion studies. Figure 8 and 9 are showing
both the data acquired for the symmetry check and the various positions of the movable
aero surfaces of the plane.

Figure 13: Generated CAD model
Resulting Images from the Scanning of the Falcon Test Plane
Figure 14: Different views in CAD
11. Reverse engineering for military applications
Reverse engineering is often used by militaries in order to copy other nations'
technologies, devices or information that have been obtained by regular troops in the
fields or by intelligence operations. It was often used during the Second World War and
the Cold War. Well-known examples from WWII and later include
· Jerry can: British and American forces noticed that the Germans had gasoline cans
with an excellent design. They reverse-engineered copies of those cans. The cans were
popularly known as "Jerry cans".
· Tupolev Tu-4 : Three American B-29 bombers on missions over Japan were forced to
land in the USSR. The Soviets, who did not have a similar strategic bomber, decided to
copy the B-29. Within a few years, they had developed the Tu-4, a near-perfect copy.
· V2 Rocket: Technical documents for the V2 and related technologies were captured
by the Western Allies at the end of the war. Soviet and captured German engineers had
to reproduce technical documents and plans, working from captured hardware, in order
to make their clone of the rocket, the R-1, which began the postwar Soviet rocket
program that led to the R-7 and the beginning of the space race.
· K-13/R-3S missile ( NATO reporting name AA-2 'Atoll ) , a Soviet reverse-
engineered copy of the AIM-9 Sidewinder, made possible after a Taiwanese AIM-9B
hit a Chinese MiG-17 without exploding; amazingly, the missile became lodged within
the airframe, the pilot returning to base with what Russian scientists would describe as
a university course in missile development.
· BGM-71 TOW Missile: In May 1975, negotiations between Iran and Hughes Missile
Systems on co-production of the TOW and Maverick missiles stalled over
disagreements in the pricing structure, the subsequent 1979 revolution ending all plans
for such coproduction. Iran was later successful in reverse-engineering the missile and
are currently producing their own copy: the Toophan.
· China has reversed many examples of Occidental countries and Russian hardware,
from fighter aircraft to missiles and HMMWV cars.

12. CONCLUSIONThere is an increasing interest in reverse engineering of parts whose drawings
(geometric, material and manufacturing details) are not available, especially those
required one-off or in a few numbers, such as for replacement of broken and worn-out
parts. It is facilitated by the availability of technologies such as non-contact scanning,
rapid tool manufacturing (using rapid prototyping and rapid tooling methods) and
process parameter optimisation through simulation. This investigation focussed on
integrating these technologies, to achieve a dramatic reduction in manufacturing time
and associated costs for one-off products compared to conventional routes. This has
been demonstrated by rapid development of a separator body of a hydraulic filter
assembly belonging to special army vehicle, which had no drawings or any other data
related to its manufacturing. An exhaustive benchmarking exercise of all possible
routes for rapid manufacturing was beyond the scope of this current investigation and is
a subject for further study. We hope that this work will motivate the defence R&D
establishments to explore and adopt computer-aided reverse engineering for indigenous
development and further refinement of even complex parts.

13. REFERENCES1. Ingle, Kathryn A., Reverse Engineering, McGraw-Hill, Inc., 1994, p.1-35.
2. Puntambenkar, N.; Jablokow, A. & Sommer, H., A unified review of 3D model
generation for reverse engineering. Computer Integrated Manufacturing Systems, 1994,
7, 259-268.
3. Alrashdan A.; Motavalli, S. & Fallahi, B., Automatic segmentation of digitized data
for reverse engineering applications. IIE transactions, Jan 2000, 32(1), 59-69.
4. Chua, C. K. & Leong, K. F., Rapid Prototyping: Principles & Application in
Manufacturing. John Wiley & Sons Inc., Singapore, 1997, p.17-24.
5. Xue, Y. & Gu, P., A review of rapid prototyping technologies and systems.
Computer Aided Design, 28(4), 1996, 307-318.
6. Michelle Griffith & John Lamancusa, S., Rapid Prototyping Technologies, Rapid
Prototyping, 1998. http://www.me.psu.edu/lamancusa/me415/rpintro2.pdf (Accessed
05/01/2004).
7. Akarte, M.M. & Ravi, B., RP/RT Route Selection for Casting Pattern Development.
Manufacturing Technology, Proc. of 19th AIMTDR Conf, 2000, 699-706.
8. Reg G., Rapid prototyping: A tool for casting design and verification. Modern
Casting, 1996, 44-47.