Embed Size (px)
Citation preview

REVENUES, EXPENDITURES, AND DEBT
OF MINNESOTA COUNTIES
FOR THE YEAR ENDED DECEMBER 31, 1999
This document is made available electronically by the Minnesota Legislative Reference Library as part of an ongoing digital archiving project. http://www.leg.state.mn.us/lrl/lrl.asp
The Office of the State Auditor is an office created by the state constitution. It serves as a watchdog for Minnesota taxpayers by helping to ensure financial integrity, accountability, and cost-effectiveness in local governments throughout the state.
Through financial, compliance, and special audits, the Office of the State Auditor oversees and ensures that local government funds are used for the purposes intended by law and that local governments hold themselves to the highest standards of financial accountability.
The Office performs approximately 250 financial and compliance audits per year. The State Auditor has oversight responsibilities for over 4,300 local units of government throughout the state. The Office maintains seven divisions:
• Audit Practice - conducts financial and legal compliance audits for local governments; • Pension Oversight - monitors investment, financial, and actuarial reporting for over
700 public pension funds; • Special Investigations - investigates allegations of misfeasance, malfeasance, and
nonfeasance in local government; • Tax Increment Financing (TIF) - promotes compliance and accountability in local
governments' use of TIF through financial and compliance audits; • Government Information - collects and analyzes financial information for cities, towns,
counties, and special districts; • Legal - provides legal analysis and counsel to the Office and responds to outside
inquiries about Minnesota local government law; and • Constitutional - provides senior management for the Office and supports the State
Auditor's administrative and official operations.
The State Auditor serves on the State Executive Council, State Board of Investment, Land Exchange Board, Public Employee's Retirement Association Board, Minnesota Housing Finance Agency, Board of Government Innovation and Cooperation, and Rural Finance Administration Board.
liQ Printed on recycled paper, ½¢1 20% post-consumer
Office of the State Auditor 525 Park Street, Suite 400
Saint Paul, Minnesota 55103 (651) 296-2551
stateauditor@osa. state. mn. us www. osa. state. mn. us
An Equal Opportunity Employer
r \
I
[
[

Revenues, Expenditures, and Debt of Minnesota Counties
For the Year Ended December 31, 1999
August 28, 2001
Government Information Division Office of the State Auditor State of Minnesota
525 Park Street, Suite 400, St. Paul, MN 55103 [email protected]. us www.osa.state.mn.us
This document can be made available in alternative formats upon request. Call 651-296-2551 [voice] or 1-800-627-3529 [relay service] for assistance; or visit the OSA web site: www.osa.state.mn.us.

. This page left blank intentionally

TABLE OF CONTENTS
SCOPE .............................................................. 1
OVERVIEW
Total Governmental Revenues ............................................ 3 Total Governmental Expenditures ........................................ 4 Growth in Government . . . . . . . . . . . . . . . . . . . . . . . . . . . . . . . . . . . . . . . . . . . . . . . . . . 5 Capital Outlays ........................................................ 6 Public Service Enterprises ............................................... 7 Outstanding Long-Term Indebtedness ..................................... 8 Unreserved Fund Balances of the General Fund and Special Revenue Funds ..... 9
GOVERNMENTAL TABLES
Table 1 - Summary of Revenues and Expenditures Five-Year Change ......... 12 Table 2 - Classification of County Revenues ............................... 16 Table 3 - Classification of County Expenditures ............................ 17
PUBLIC SERVICE ENTERPRISE TABLES
Table 4 - Analysis of Hospital Operations ................................. 44 Table 5 - Analysis of Nursing Home Operations ............................ 45 Table 6 - Analysis of Nursing Services Operations .......................... 46 Table 7 - Analysis of Sanitation Operations ................................ 47 Table 8 - Analysis of Other Enterprise Operations ......................... 49
ENTERPRISE FUND FOOTNOTES ..................................... 51
Table 9 - Outstanding Indebtedness of Counties ............................ 54
Table 10 -Percent Change of Unreserved Fund Balances in the General Fund and Special Revenue Funds 1998 to 1999 - and 1999 Unreserved Fund Balances as a Percent of Total Current Expenditures .................. 58
APPENDIX A - Factors Influencing County Finances ...................... 63
APPENDIX B = County General and Special Revenue Unreserved Fund Balances .................................................. 69
GLOSSARY ............................................................... 73

This page left blank intentionally

Scope
This publication is intended to facilitate an understanding of county financial operations by citizens, policy makers and local government officials. The report summarizes, through data tables and charts, the financial operations of Minnesota counties for calendar year 1999.
The data presented in this report is divided into governmental funds and proprietary funds. The governmental funds consist of the General, Special Revenue, Capital Projects, and Debt Service Funds. The financial operations of these funds are summarized in Table 1. Tables 2 and 3 present the data by individual county. Appendix A discusses factors that affect county finances.
The enterprise or proprietary funds of counties are presented separately from the governmental funds. Minnesota counties operate many types of public service enterprises. The enterprises furnish a variety of services and operate wholly or in large part with revenues derived from the sale of goods or services. The financial operations of the municipal public service enterprises are presented in Tables 4 through 8. Footnotes used in the analysis of the enterprise operations are described at the end of the enterprise fund section.
Table 9 lists by individual county the bonded and other long-term debt outstanding as of December 31, 1999. Other long-term debt refers to liabilities such as long-term lease agreements, installment purchase contracts, and notes.
Table 10 presents an analysis of the 1998 and 1999 unreserved fund balances in the General and Special Revenue Funds of counties. The table details the actual unreserved fund balances, the percentage change in unreserved fund balances from 1998 to 1999, and a comparison to 1999 total current expenditures. Appendix B provides a more detailed discussion of fund balances.
To provide additional insight into the relative spending level of counties, the Office of the State Auditor (OSA) publishes a separate report that lists counties based on their per capita expenditures and long-term debt. This report may be obtained by contacting the OSA or by visiting the OSA web site at www.osa.state.mn.us.
In addition to this publication, the Office of the State Auditor maintains an interactive database containing several years of data that can be accessed through the OSA web site. The database allows users to customize the presentation of data to their individual needs. For example, a citizen can select a group of counties to compare, and then choose the years and the categories of revenues and expenditures on which to compare them. The query can then be viewed on screen or saved to a file for downloading. The OSA web site address is www.osa.state.mn.us.
1

This page left blank intentionally

Overview
Total Governmental Revenues
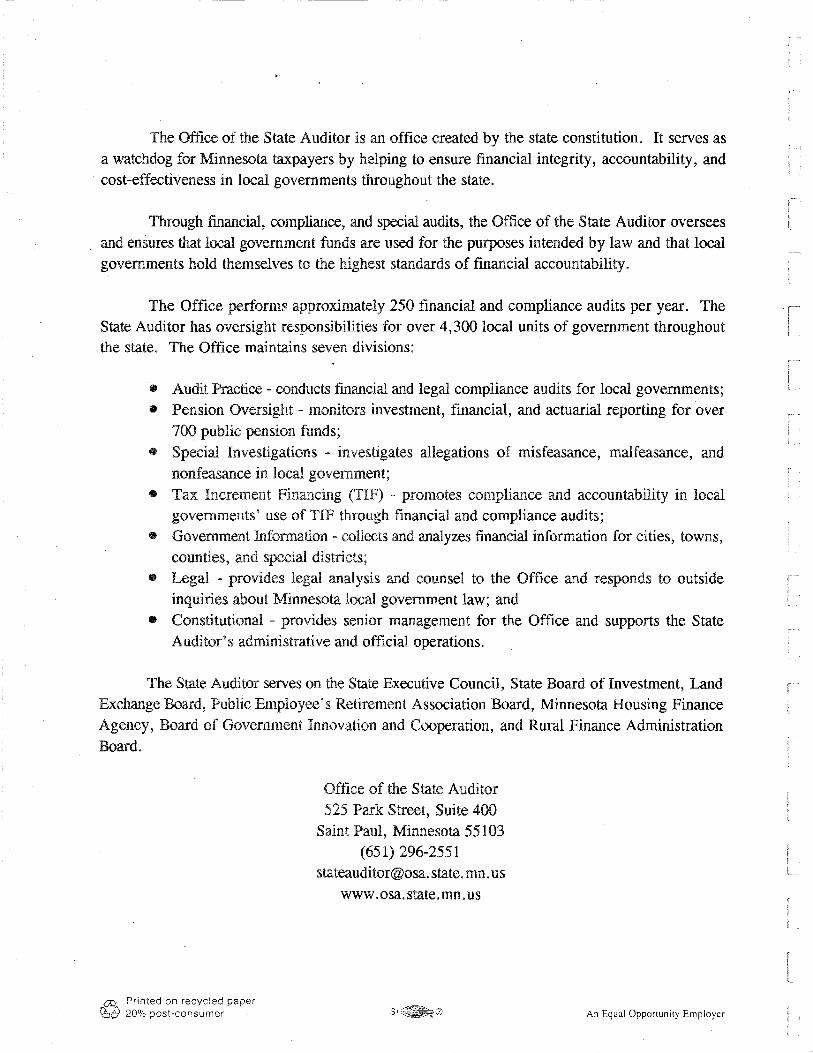
In 1999, Minnesota counties raised total governmental revenues of $3.71 billion to fmance county services. This represents an increase of 4.0 percent over the amount raised in 1998.
The funding sources for counties generally vary only slightly from year to year. Over time, there have been some shifts in the composition of revenues. The two largest sources of revenues for counties continue to be taxes and state intergovernmental revenues. However, since 1995, state intergovernmental revenue as a share of total revenues has steadily risen. In 1995, state intergovernmental revenue accounted for 28.2 percent of total revenues compared to 32.9 percent in 1999. Part of the increased share for state intergovernmental revenues is the result of an accounting change. Certain federal human services grants were reclassified as state human services grants. As a result, there has been a corresponding decrease in the share of total revenues derived from federal grants. To further examine five-year trends in revenues, refer to Table 1.
Figure 1 shows the relative shares of total governmental revenues by source. The underlying data for this pie chart is detailed in Table 1.
Figure 1: Total Governmental Revenues
$3,712,408,090
State Grants 32.9%
Charges for Services 9.6%
Taxes 39.6% *
Licenses & Permits 0.5% Special Assessments 0. 7% Fines & Forfeits 0.7% Local Unit Grants 1.0% Interest Earnings 1.8%
Federal Grants 8.8%
* This category includes property, sales, gravel taxes as well as tax increments.
3

Total Governmental Expenditures
Counties provide a variety of services to their citizens. Most services are accounted for in Governmental Funds. The Governmental Funds are made up of the General, Special Revenue, Capital Projects, and Debt Service Funds. In 1999, Minnesota counties expended $3.95 billion from Governmental Funds to provide county services. This represents an increase of 7.0 percent over 1998 total governmental expenditures.
The relative shares of total governmental expenditures change very little from year to year. However, as the priorities of counties change over time, the relative shares of total spending shift to reflect these new priorities. From 1995 to 1999, public safety and debt service expenditures steadily increased their proportion of county governmental expenditures. Conversely, the expenditure categories of general government, human services, and streets and highways accounted for a smaller proportion of total governmental expenditures. To examine these and other changes over the five-year period, refer to Table 1.
Figure 2 shows the relative shares of total governm~ntal expenditures by function. The underlying data for this pie chart is detailed in Table 1.
Figure 2: Total Governmental Expenditures *
$3,954,130,781
Public Safety 17.5%
Streets & Highways 15.4%
Economic Development 1.1 % All Other Expenditures 1.2% Conservation of Natural Resources 1.8%
Sanitation 1.9%
Culture & Recreation 3.2 %
Debt Service 6.0%
General Government 15.0%
Includes current expenditures, capital outlays, and debt service.
4

Growth in Government
During the five-year period of 1995 to 1999, total governmental revenues and total current expenditures increased every year except 1995.1 The rate at which they changed varied from a negative 1.3 percent to 7.6 percent. To place this growth in perspective, Figure 3 below includes a trend line for the growth in per capita personal income for Minnesotans.2 Per capita income is an indicator of the ability of citizens to pay for governmental spending. When expenditures grow faster than per capita personal income, citizens must spend a greater proportion of their income on governmental services.
Figure 3 compares the growth in total current expenditures and total governmental revenues to the change in Minnesota per capita personal income. Total current expenditures grew faster than per capita income for three of the five years. Per capita income grew faster than total revenues for three of the five years.
Figure 3: Percentage Change - Total Governmental Revenues, Total
Current Expenditures, and Per Capita Income - 1995 to 1999 8%~----------------------------
It// It" It'
It II# ~-······· I 1-1 I
Cl) 0, C 4% -+---------Jt---..--------------"k:----------=';?JI;. ca .c 0 ..... C
.. ..
~ 2% -+----~ .... ________________________ _
Cl) a..
0%-f-=-------------------~..-.,,_~------
.. .. Per Capita Income
Total Governmental Revenues
Total Current Expenditures -2% -+-------~------~--------------
1995 1996 1997 1998 1999
The chart excludes capital outlays as this category is more prone to yearly fluctuations. The chart also excludes revenues derived from borrowing because counties are prohibited from borrowing for current expenditures. Most capital projects are funded through the issuance of bonds or other types of borrowing such as certificates of participation.
2 Per capita income is calculated by dividing Minnesota total personal income by its total midyear population. The figure is calculated by the Bureau of Economic Analysis which is a part of the U.S. Census Bureau.
5

Capital Outlays
Counties expended $569.0 million on capital investments in 1999. This represents an increase of 15.8 percent over the level expended in 1998. Capital outlays are more likely than current expenditures to vary significantly from one year to the next. The reason for this is that capital projects tend to be large in size but infrequent in nature. Some of the factors that influence the level of capital investments include: the need for infrastructure improvements; public safety concerns; demands for public meeting places and facilities; the need to replace aging infrastructure; and damage to public facilities caused by fire, floods, and storms.
Figure 4 illustrates the trend in capital spending for the years 1995 through 1999.
Figure 4: Total Capital Outlay Expenditures, 1995 to 1999 $600.0 ~--------------------
$550.0 -!--------------------
1:'-l $450.0 --+-------
= = i $400.0
= ~ $350.0
$300.0
$250.0
$200.0
1995 1996 1997 1998
6
1999

Public Service Enterprises
In addition to Governmental Funds, many counties establish Enterprise Funds to account for services that are financed and operated in a manner similar to private business enterprises. These enterprises are intended to be self-sustaining through fees and user charges. Although some enterprises generate net income, most have the objective of breaking even. Enterprise Fund accounting is also used to provide more detailed fmancial information on operations where there are public policy, accountability, management control, and other concerns. The most common enterprises created by counties include hospitals, nursing homes, nursing services, and solid waste. Other enterprises include recreation facilities, housing, and economic development.
Public service enterprises provide a good or service for a charge. Most enterprises are designed to recoup the costs of providing the service through charges to the user. Many county enterprises, however, do not recoup all the costs of the service and need to supplement the operating revenues with transfers from other funds and non-operating revenues such as taxes and intergovernmental revenues. In 1999, the operating losses of county enterprises totaled $19.9 million. Counties provided transfers and non-operating revenues of$43.8 million to cover operating losses in county enterprises. After the inclusion of non-operating revenues, county enterprises posted a net income of $13.0 million in 1999. Tables 4 through 8 provide detailed fmancial information on Enterprise Fund operations.
Figure 5 examines the five-year trend in the operating income and net income or loss of municipal enterprises. The gap between the operating income line and the net income line shows the amount that counties contributed in the form of non-operating revenues to county enterprises.
Figure 5: Net Income and Operating Income of Municipal Enterprises,
1995 to 1999 $20,000
.a = ; ($10,000) -t------------------------
e /4, Operating Income ~ ii"~--~--~--~.:,-----··-···-----------·-·-·--····---··-----------··-···--------···-------·--·--·-·---··--
~ ($30,000) -t---------------",__---=--=----------
($40,000)
1995 1996
7
1997 1998 1999

Outstanding Long-Term Indebtedness
Counties incur long-term debt through the issuance of bonds and notes, certificates of indebtedness, and tax anticipation certificates. Long-term lease agreements are also classified as long-term debt. Counties may only borrow to fmance capital projects and purchases. They are restricted by law from borrowing for current expenditures. The amount of outstanding debt affects a county's expenditures because counties must make principal and interest payments to service the debt.
Counties reported a total of $1.31 billion in outstanding long-term debt at the end of 1999. The most common type oflong-term debt is bonds. At the close of the 1999 fiscal year, counties had $1.06 billion in outstanding bonds and $253 .2 million in other long-term debt. This represented a decrease in long-term debt of 1.3 percent from 1998. Table 9 details outstanding debt by individual county.
Figure 6 shows the five-year trend of outstanding long-term debt for Minnesota counties.
Figure 6: Outstanding Long-Term Indebtedness as of December 31, 1999 *
$1,400.0
fl.I $1,250.0
g 1 $1,200.0
~ $1,150.0
$1,100.0
$1,050.0
$1,000.0
1995 1996 1997 1998
* Includes bonds and other types of debt such as certificates of participation, long-term leases, and notes.
8
1999

Unreserved Fund Balances of the General Fund and Special Revenue Funds
Counties maintain cash reserves for several reasons. Counties should have relatively large fund balances at the end of the year because they must rely on them to meet expenditures during the first five months of the next fiscal year until they receive the first property tax and state aid payments. Additional reasons include contingency funds for unforseen needs and setting aside resources for future capital investments. The unreserved fund balances of counties' General and Special Revenue Funds totaled $1.42 billion in 1999. 3 This represents an increase of 2.6. percent over the level in 1998.
Comparing counties' unreserved fund balances to their total current expenditures helps put the fund balances in perspective and provides insight on the relative financial health of Minnesota's counties. County unreserved fund balances as a percent of total current expenditures averaged 45.0 percent in· 1999. Among individual counties, unreserved fund balances as a percent of total current expenditures ranged from 22.2 percent to 143.4 percent. Figure 7 shows the five-year trend of unreserved fund balances as a percent of total current expenditures.
Figure 7: Unreserved Fund Balances of the General and Special Revenue
Percent Funds as a Percent of Total Current Expenditures, 1995 to 1999 50.0% ~--------------------------
47.5% -+---------------------------
----------·------··-············-----··-------------·············-·····--·---------------·--·-···--------------------········ .
45.0%-+---------------------~-------=--·
42.5% -+---------------------------
40.0% -+------------1,----------~----,1--------,1---~----,1
1995 1996 1997 1998 1999
3 Although this section discusses only two types of fund balances, Minnesota counties actually report three different classifications of fund balances in the General and Special Revenue Funds. The unreserved, undesignated fund balances include all funds remaining at the close of the fiscal year for which no legally-binding commitment has been made, nor has the governing body passed a resolution designating those funds for a specific purpose. The unreserved, designated fund balances include all funds remaining at the close of the fiscal year for which no legally-binding commitment has been made; however, these funds have been designated by the governing body for a specific future use. The reserved fund balances include all funds remaining at the close of the fiscal year for which there is a legallybinding external commitment of those funds, such as a signed contract for services or equipment.
9

This page left blank intentionally

GOVERNMENTAL TABLES
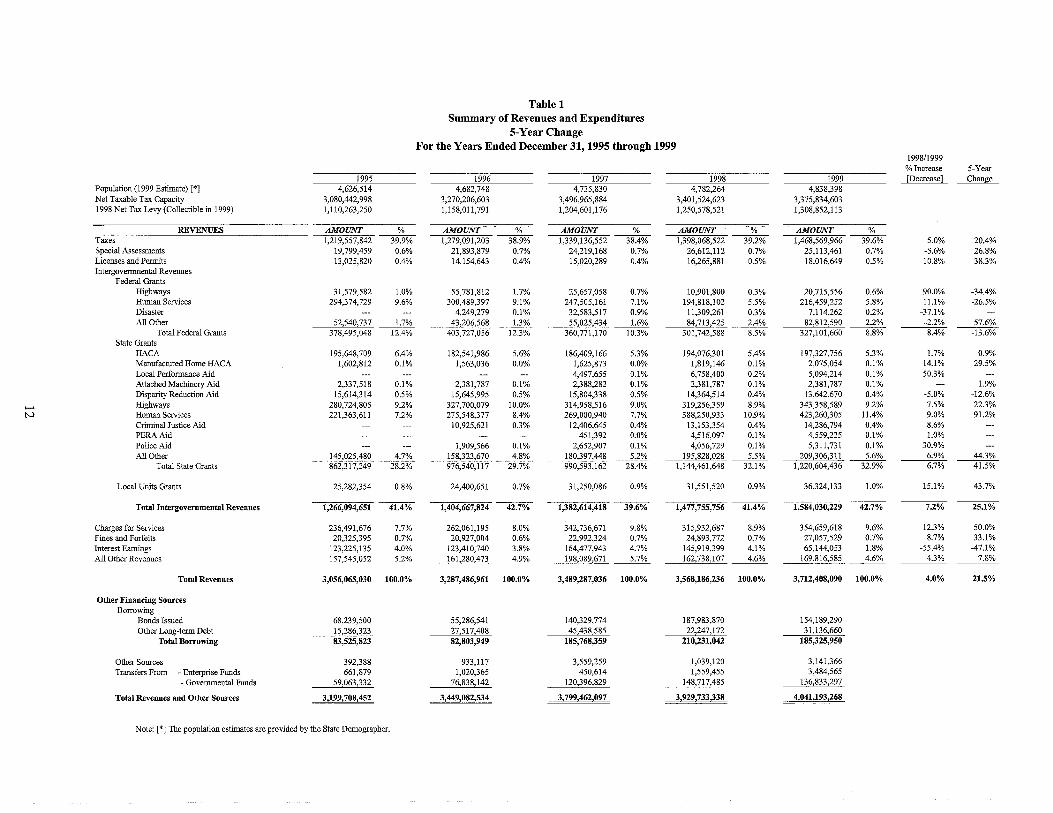
Table 1 Summary of Revenues and Expenditures
5-Year Change For the Years Ended December 31, 1995 through 1999
1998/1999 %Increase 5-Year
1995 1996 1997 1998 1999 [Decrease] Change Population (1999 Estimate)[*] 4,626,514 4,682,748 4,735,830 4,782,264 4,838,398 Net Taxable Tax Capacity 3,080,442,998 3,270,206,603 3,496,965,884 3,401,524,623 3,375,834,603 1998 Net Tax Levy (Collectible in 1999) 1,110,263,250 1,158,011,791 1,204,601,176 1,250,578,521 1,308,852,113
REVENUES AMOUNT % AMOUNT % AMOUNT % AMOUNT % AMOUNT % Taxes 1,219,557,842 39.9% 1,279,091,203 38.9% 1,339,136,552 38.4% 1,398,068,522 39.2% 1,468,569,966 39.6% 5.0% 20.4% Special Assessments 19,799,459 0.6% 21,893,879 0.7% 24,219,168 0.7% 26,612,112 0.7% 25,113,461 0.7% -5.6% 26.8% Licenses and Permits 13,025,820 0.4% 14,154,643 0.4% 15,020,289 0.4% 16,265,881 0.5% 18,016,649 0.5% 10.8% 38.3% Intergovernmental Revenues
Federal Grants Highways 31,579,582 1.0% 55,781,812 1.7% 25,657,058 0.7% 10,901,800 0.3% 20,715,556 0.6% 90.0% -34.4% Human Services 294,374,729 9.6% 300,489,397 9.1% 247,505,161 7.1% 194,818,102 5.5% 216,459,252 5.8% 11.1% -26.5% Disaster 4,249,279 0.1% 32,583,517 0.9% 11,309,261 0.3% 7,114,262 0.2% -37.1% All Other 52,540,737 1.7% 43,206,568 1.3% 55,025,434 1.6% 84,713,425 2.4% 82,812,590 2.2% -2.2% 57.6%
Total Federal Grants 378,495,048 12.4% 403,727,056 12.3% 360,771,170 10.3% 301,742,588 ~ 327,101,660 ~ 8.4% -13.6% State Grants
HACA 195,648,709 6.4% 182,541,986 5.6% 186,409,166 5.3% 194,076,301 5.4% 197,327,756 5.3% 1.7% 0.9% Manufactured Home HACA 1,602,812 0.1% 1,563,036 0.0% 1,625,873 0.0% 1,819,146 0.1% 2,075,054 0.1% 14.1% 29.5% Local Performance Aid -- 4,497,655 0.1% 6,758,400 0.2% 5,094,214 0.1% 50.3% Attached Machinery Aid 2,337,518 0.1% 2,381,787 0.1% 2,388,282 0.1% 2,381,787 0.1% 2,381,787 0.1% 1.9% Disparity Reduction Aid 15,614,314 0.5% 15,645,995 0.5% 15,804,338 0.5% 14,364,514 0.4% 13,642,670 0.4% -5.0% -12.6% - Highways 280,724,805 9.2% 327,700,079 10.0% 314,958,516 9.0% 319,256,359 8.9% 343,358,589 9.2% 7.5% 22.3%
N Human Services 221,363,611 7.2% 275,548,377 8.4% 269,000,940 7.7% 388,250,933 10.9% 423,260,305 11.4% 9.0% 91.2% Criminal Justice Aid 10,925,621 0.3% 12,406,645 0.4% 13,153,354 0.4% 14,286,794 0.4% 8.6% PERAAid 451,392 0.0% 4,516,097 0.1% 4,559,225 0.1% 1.0% Police Aid 1,909,566 0.1% 2,652,907 0.1% 4,056,729 0.1% 5,311,731 0.1% 30.9% All Other 145,025,480 4.7% 158,323,670 4.8% 180,397,448 5.2% 195,828,028 5.5% 209,306,311 5.6% 6.9% 44.3%
Total State Grants 862,317,249 28.2% 976,540,117 29.7% 990,593,162 28.4% 1,144,461,648 32.1% 1,220,604,436 32.9% 6.7% 41.5%
Local Units Grants 25,282,354 0.8% 24,400,651 0.7% 31,250,086 0.9% 31,551,520 0.9% 36,324,133 1.0% 15.1% 43.7%
Total Intergovernmental Revenues 1,266,094,651 41.4% 1,404,667,824 42.7% 1,382,614,418 39.6% 1,477,755,756 41.4% 1,584,030,229 42.7% 7.2% 25.1%
Charges for Services 236,491,676 7.7% 262,061,195 8.0% 342,736,671 9.8% 315,932,687 8.9% 354,659,618 9.6% 12.3% 50.0% Fines and Forfeits 20,325,395 0.7% 20,927,004 0.6% 22,992,324 0.7% 24,893,772 0.7% 27,057,529 0.7% 8.7% 33.1% Interest Earnings 123,225,135 4.0% 123,410,740 3.8% 164,477,943 4.7% 145,919,399 4.1% 65,144,053 1.8% -55.4% -47.1% All Other Revenues 157,545,052 5.2% 161,280,473 4.9% 198,089,671 5.7% 162,738,107 4.6% 169,816,585 4.6% 4.3% ~
Total Revenues 3,056,065,030 100.0% 3,287,486,961 100.0% 3,489,287,036 100.0% 3,568,186,236 100.0% 3,712,408,090 100.0% 4.0% 21.5%
Other Financing Sources Borrowing
Bonds Issued 68,239,500 55,286,541 140,329,774 187,983,870 154,189,290 Other Long-term Debt 15,286,323 27,517,408 45,438,585 22,247,172 31,136,660
Total Borrowing 83,525,823 82,803,949 185,768,359 210,231,042 185,325,950
Other Sources 392,388 933,117 3,559,259 1,039,120 3,141,366 Transfers From - Enterprise Funds 661,879 1,020,365 450,614 1,559,455 3,484,565
- Governmental Funds 59,063,332 76,838,142 120,396,829 148,717,485 136,833,297
Total Revenues and Other Sources 3,199, 708,452 3,449,082,534 3,799,462,097 3,929,733,338 4,041,193,268
Note: [*] The population estimates are provided by the State Demographer.

1998/1999 1995 1996 1997 1998 1999 % Increase 5-Year
EXPENDITURES AMOUNT % AMOUNT % AMOUNT % AMOUNT % AMOUNT % [Decrease] Change
General Government - Current Expenditures 432,323,344 14.1% 456,419,322 13.8% 482,388,917 13.7% 537,488,974 14.5% 540,152,167 13.7% 0.5% 24.9% - Capital Outlay 47,024,301 1.5% 70,135,195 2.1% 105,435,493 3.0% 75,050,953 2.0% 53,035,079 1.3% -29.3% 12.8%
Total General Government 479;347,645 15.7% 526,554,517 15.9% 587,824,410 16.7% 612,539,927 16.6% 593,187,246 15.0% -3.2% 23.7% Public Safety - Sheriff 176,568,088 5.8% 189,596,292 5.7% 247,322;2,67 7.0% 228,807,070 62% 244,968;2,35 62% 7.1% 38.7%
- Corrections 199,477,204 6.5% 215,090,412 6.5% 195,550,308 5.6% 255,228,573 6.9% 274,521,702 6.9% 7.6% 37.6% -All Other 72,127,036 2.4% 78,184,423 2.4% 84,736,349 2.4% 94,824,208 2.6% 96,422,890 2.4% 1.7% 33.7% - Capital Outlay 29,796,271 1.0% 29,651,217 0.9% 52,782,029 1.5% 64,423,361 1.7% 77,553,491 2.0% 20.4% 160.3% Total Public Safety 477,968,599 15.6% 512,522,344 15.4% 580,390,953 16.5% 643,283,212 17.4% 693,466,318 17.5% 7.8% 45.1%
Streets and Highways - Administration 29,094,945 1.0% 27,424,200 0.8% 28,369,209 0.8% 29,087,322 0.8% 33,047,133 0.8% 13.6% 13.6% - Maintenance 189,779,318 62% 210,257,880 6.3% 248,638,312 7.1% 226,340,683 6.1% 229,119,751 5.8% 1.2% 20.7% - Capital Outlay 301,132,228 9.8% 359,177,634 10.8% 302,912,919 8.6% 305,369,052 8.3% 347,122,968 8.8% 13.7% 15.3%
Total Streets and Highways 520,006,491 17.0% 596,859,714 18.0% 579,920,440 16.5% 560,797,057 15.2% 609,289,852 15.4% 8.6% 17.2%
Sanitation - Current Expenditures 48,526,968 1.6% 51,787,608 1.6% 61,761,519 1.8% 61,172,389 1.7% 58,596,300 1.5% -4.2% 20.7% - Capital Outlay 1,819,272 0.1% 658,030 0.0% 538,387 0.0% 365,633 0.0% 16,716,689 0.4% *** 818.9%
Total Sanitation 50,346,240 ~ 52,445,638 ~ 62,299,906 ~ 61,538,022 ~ 75,312,989 ~ 22.4% 49.6% Human Services - Income Maintenance 284,233,963 9.3% 344,441,010 10.4% 323,124,968 9.2% 243,255,550 6.6% 403,645,773 10.2% 65.9% 42.0%
- Social Services 511,393,996 16.7% 526,675,556 15.9% 540,310,887 15.4% 612,098,523 16.6% 819,462,005 20.7% 33.9% 60.2% -All Other 246,499,960 8.1% 261,803,418 7.9% 301,481,151 8.6% 339,680,261 9.2% 51,387,864 1.3% -84.9% -79.2% - Capital Outlay 8,671,392 0.3% 7,010,036 0.2% 6,939,512 0.2% 7,127,161 0.2% 16,228,889 0.4% 127.7% 87.2%
Total Human Services 1,050,799,311 34.3% 1,139,930,020 34.4% 1,171,856,518 33.3% 1,202,161,495 32.5% 1,290,724,531 32.6% 7.4% 22.8% Health - Current Expenditures 120,362,117 3.9% 125,930,244 3.8% 141,061,196 4.0% 156,248,888 4.2% 159,062,477 4.0% 1.8% 32.2%
- Capital Outlay 5,960,306 0.2% 7,149,355 0.2% 14,938,248 0.4% 6,559,082 0.2% 2,785,309 0.1% -57.5% -53.3% Total Health 126,322,423 ~ 133,079,599 4.0% 155,999,444 4.4% 162,807,970 4.4% 161,847,786 ~ -0.6% 28.1%
Culture and Recreation
>--' Libraries - Current Expenditures 51,982,204 1.7% 55,141,172 1.7% 58,840,382 1.7% 61,344,058 1.7% 63,881,689 1.6% 4.1% 22.9% w a Capital Outlay 8,768,543 0.3% 7,686,480 0.2% 7,288,443 0.2% 7,890,497 0.2% 14,114,632 0.4% 78.9% 61.0%
Parks and Recreation - Current Expenditures 31,979,418 1.0% 34,938,680 1.1% 34,363,622 1.0% 37,917,313 1.0% 43,014,762 1.1% 13.4% 34.5% - Capital Outlay 1,973,108 0.1% 7,442,126 0.2% 7,163,498 0.2% 2,660,664 0.1% 6,443,199 0.2% 142.2% 226.6%
Total Culture and Recreation 94,703,273 ~ 105,208,458 3.2% 107,655,945 ~ 109,812,532 ~ 127,454,282 3.2% 16.1% 34.6%
Conservation of Natural Resources - Current Expenditures 51,644,075 1.7% 54,789,030 1.7% 61,592,846 1.8% 65,810,314 1.8% 68,479,093 1.7% 4.1% 32.6% - Capital Outlay 124,555 0.0% 720,138 0.0% 309,772 0.0% 810,761 0.0% 3,353,698 0.1% 313.6% ***
Total Conservation ofNatural Resources 51,768,630 ~ 55,509,168 ~ 61,902,618 ~ 66,621,075 ~ 71,832,791 ~ 7.8% 38.8%
Economic Development - Current Expenditures 37,905,935 1.2% 32,271,541 1.0% 31,375,190 0.9% 36,851,364 1.0% 39,195,052 1.0% 6.4% 3.4% - Capital Outlay 66,557 0.0% 912,508 0.0% 7,419,503 0.2% 15,815,138 0.4% 5,274,370 0.1% -66.6% ***
Total Economic Development 37,972,492 ~ 33,184,049 ------r.Wo 38,794,693 ----------r.T% 52,666,502 ~ 44,469,422 ----------r.T% -15.6% 17.1% All Other - Current Expenditures 22,755,037 0.7% 18,761,662 0.6% 19,943,090 0.6% 20,231,885 0.5% 22,067,356 0.6% 9.1% -3.0%
- Capital Outlay 2,622,041 0.1% 2,543,205 0.1% 6,053,771 0.2% 5,252,085 0.1% 26,330,658 0.7% 401.3% 904.2% Total All Other 25,377,078 ~ 21,304,867 0.6% 25,996,861 0.7% 25,483,970 0.7% 48,398,014 ~ 89.9% 90.7%
Debt Service - Principal Paid on Bonds 73,389,929 2.4% 71,105,799 2.1% 70,956,888 2.0% 109,464,856 3.0% 167,070,050 4.2% 52.6% 127.6% - Other Long-term Debt 19,223,185 0.6% 19,270,201 0.6% 18,604,876 0.5% 19,218,512 0.5% 19,459,776 0.5% 1.3% 1.2% - Interest and Fiscal Charges 53,044,422 1.7% 50,349,405 1.5% 51,949,255 1.5% 70,185,945 1.9% 51,617,724 1.3% -26.5% -2.7%
Total Current Expenditures 2,506,653,608 81.9% 2,683,512,450 80.9% 2,860,860,213 81.4% 3,006,387,375 81.3% 3,147,024,249 79.6% 4.7% 25.5% Total Capital Outlay 407,958,574 13.3% 493,085,924 14.9% 511,781,575 14.6% 491,324,387 13.3% 568,958,982 14.4% 15.8% 39.5% Total Debt Service 145,657,536 4.8% 140,725,405 4.2% 141,511,019 4.0% 198,869,313 5.4% 238,147,550 6.0% 19.8% 63.5%
Total Expenditures 3,060,269,718 100.0% 3,317,323,779 100.0% 3,514,152,807 100.0% 3,696,581,075 100.0% 3,954,130,781 100.0% 7.0% 29.2%
Other Financing Uses Debt Redemption - Refunded Bonds -- 2,380,528 9,325,000 10,685,434 Other Uses 46,435 14,710 26,634 Transfers To - Enterprise Funds 3,154,973 2,249,881 1,910,522 1,772,064 4,569,614
- Governmental Funds 59,063,332 76,838,142 120,396,829 148,717,485 136,833,297
Total Expenditures and Other Uses 3,122,488,023 3,398,838,765 3,645,799,868 3,857,782,692 4,095,533,692
*** Percent change is greater than 1,000%.

This page left blank intentionally

CLASSIFICATION OF
REVENUES AND EXPENDITURES
GOVERNMENTAL FUNDS

Table2 Classification of County Revenues
For the Year Ended December 31, 1999
AITKIN ANOKA BECKER BELTRAMI BENTON BIGSTONE BLUEEARTH
Population ( 1999 Estimate) 14,235 297,776 29,779 38,644 35,110 5,794 55,877 Net Taxable Tax Capacity 10,000,246 184,752,960 15,825,380 13,710,523 15,819,722 3,167,809 34,830,511 1998 Tax Levy (Payable 1999) 5,705,034 48,824,584 9,722,333 10,200,918 9,262,917 1,868,239 14,342,382
REVENUES
Taxes 6,106,427 62,511,991 10,229,497 11,279,077 9,502,697 1,962,787 14,673,961 Special Assessments 518,826 1,299,476 456,368 124,268 884,780 Licenses and Permits 87,928 406,641 246,179 170,817 117,705 18,057 209,064 Intergovernmental Revenues
Federal Grants Highways -- 22,916 -- 9,234 Human Services 661,717 8,584,347 1,810,434 2,727,791 884,951 192,962 2,079,544 Disaster 13,505 97,262 32,579 16,731 5,146 14,433 8,262 All Other 613,049 5,285,555 279,707 683,800 114,486 64,226 83,453
Total Federal Grants 1,288,271 13,967,164 2,145,636 3,428,322 1,004,583 271,621 2,180,493 State Grants
HACA 1,433,359 12,079,638 1,038,467 201,123 1,046,090 650,155 2,084,687 Manufactured Home HACA 12,094 288,142 28,348 58,724 40,039 2,493 41,167 Local Performance Aid 335,114 34,503 44,153 39,977 6,943 64,895 Attached Machinery Aid 90,099 -- -- -- 65,317 Disparity Reduction Aid 12,578 5,283 470 9,178 104,551 86,291 Highways 3,239,076 5,069,632 4,211,319 4,544,876 2,065,576 2,204,723 7,347,088
e-- Human Services 1,820,691 26,975,792 3,160,794 7,227,353 2,583,320 829,395 6,164,714 O"I Criminal Justice Aid 1,773,935 -- 251,616 146,574 -- 350,348 PERA Aid 406,581 -- 54,266 37,904 -- 72,319 Police Aid 497,495 -- 111,387 89,468 -- 95,821 All Other 785,723 10,516,951 1,227,350 1,324,165 720,330 265,041 1,848,305
Total State Grants 7,303,521 58,033,379 9,706,064 13,818,133 6,778,456 4,063,301 18,220,952
Local Units Grants 11,750 8,064,825 -- 94,706 3,180
Total Intergovernmental Revenues 8,603,542 80,065,368 11,851,700 17,246,455 7,877,745 4,338,102 20,401,445
Charges for Services 863,536 25,149,773 2,122,486 1,869,163 1,480,157 252,315 4,978,094 Fines and Forfeits 252,601 1,529,618 357,700 352,216 204,014 491 417,859 Interest Earnings 1,040,787 3,172,808 107,802 759,785 683,883 271,712 748,651 All Other Revenues 1,511,358 8,008,393 1,109,321 3,038,046 694,464 150,713 1,238,098
Total Revenues 18,466,179 180,844,592 26,543,511 36,015,035 21,017,033 7,118,445 43,551,952
Other Financing Sources Borrowing
Bonds Issued 4,539,150 10,810,000 495,000 -- 417,622 Other Long-term Debt 86,000 2,130,000 468,500 39,428 1,015,000 -- 758,884
Total Borrowing 4,625,150 12,940,000 963,500 39,428 1,015,000 - 1,176,506
Other Sources -- -- 1,823,535 Transfers From - Enterprise Funds 2,489,124
- Governmental Funds 208,787 9,309,802 507,554 1,303,988 3,903 3,280,359
Total Revenues and Other Sources 23,300,116 205,583,518 27,507,011 38,385,552 23,336,021 7,122,348 48,008,817

Table 3 Classification of County Expenditures
For the Year Ended December 31, 1999
EXPENDITURES AITKIN ANOKA BECKER BELTRAMI BENTON BIGSTONE BLUEEARTH
General Government - Current Expenditures 3,295,635 28,092,162 3,756,230 4,022,954 3,689,203 848,217 5,239,437 - Capital Outlay -- 1,073,439 - -- -- --
Total General Government 3,295,635 29,165,601 3,756,230 4,022,954 3,689,203 848,217 5,239,437 Public Safety - Sheriff 1,332,332 15,736,811 2,289,839 2,561,939 1,879,694 531,581 1,864,399
- Corrections 1,233,313 15,610,002 1,292,181 1,737,605 2,148,824 32,759 2,170,254 -All Other 51,581 474,903 52,693 37,749 18,812 14,131 26,647 - Capital Outlay -- 5,120,028 -- -- 46,920 --Total Public Safety 2,617,226 36,941,744 3,634,713 4,337,293 4,094,250 578,471 4,061,300
Streets and Highways - Administration 404,869 1,475,537 264,813 206,450 186,229 206,786 286,303 - Maintenance 2,778,346 5,677,640 2,651,004 2,748,206 1,764,075 1,062,671 3,345,033 - Construction . 2,002,797 18,734,254 3,441,145 2,618,054 2,461,667 1,816,663 5,122,321 - Other Capital Outlay -- -- -- --
Total Streets and Highways 5,186,012 25,887,431 6,356,962 5,572,710 4,411,971 3,086,120 8,753,657 Sanitation - Current Expenditures 356,059 5,105,812 1,250,394 2,239,830 184,668 196,402 1,215,472
- Capital Outlay -- -- -- --Total Sanitation 356,059 5,105,812 1,250,394 2,239,830 184,668 196,402 1,215,472
Human Services - Income Maintenance 1,155,265 16,383,487 1,734,571 3,193,831 1,734,764 408,221 2,923,917 - Social Services 2,987,909 38,137,188 6,746,335 10,942,050 4,653,367 964,172 9,240,673 -All Other 49,691 3,140,276 192,072 273,526 -- 82,502 - Capital Outlay 300,948 -- -- --
Total Human Services 4,192,865 57,961,899 8,672,978 14,409,407 6,388,131 1,454,895 12,164,590 Health - Current Expenditures 622,690 5,320,320 195,994 89,727 610,675 67,865 799,989
- Capital Outlay -- -- --Total Health 622,690 5,320,320 195,994 89,727 610,675 67,865 799,989
Culture and Recreation Libraries - Current Expenditures 122,296 5,719,442 114,986 87,298 285,893 41,600 334,322 - - Capital Outlay -- 2,287,605 -- -- -- --
-.....) Parks and Recreation - Current Expenditures 254,172 5,584,999 277,668 357,702 91,668 63,814 423,265 - Capital Outlay -- 3,013 -- -- -- --
Total Culture and Recreation 376,468 13,595,059 392,654 445,000 377,561 105,414 757,587 Conservation of Natural Resources - Current Expenditures 1,345,458 629,638 765,103 1,147,258 210,746 279,544 1,632,645
- Capital Outlay -- -- -- -- --Total Conservation of Natural Resources 1,345,458 629,638 765,103 1,147,258 210,746 279,544 1,632,645
Economic Development - Current Expenditures 48,929 6,379,610 222,673 140,044 107,141 9,414 348,071 - Capital Outlay 3,734,095 --
Total Economic Development 48,929 10,113,705 222,673 140,044 107,141 9,414 348,071 All Other - Current Expenditures 680,835 323,495 986,984 -- 77,400
- Capital Outlay 564,319 - -- -- 3,567,518 Total All Other 564,319 680,835 323,495 986,984 -- l/,400 3,56/,518
Debt Service - Principal Paid on Bonds 28,390,000 1,465,000 1,267,500 440,000 20,000 1,230,000 - Other Long-term Debt 1,479,266 130,154 13,821 430,439 775,991 - Interest and Fiscal Charges 230,922 5,772,094 184,441 473,282 819,457 10,711 248,115
Total Current Expenditures 16,038,545 154,148,662 22,130,051 30,773,153 17,565,759 4,887,079 29,850,427 Total Capital Outlay 2,567,116 31,253,382 3,441,145 2,618,054 2,508,587 1,816,663 8,689,839 Total Debt Service 230,922 35,641,360 1,779,595 1,754,603 1,689,896 30,711 2,254,106
Total Expenditures 18,836,583 221,043,404 27,350,791 35,145,810 21,764,242 6,734,453 40,794,372
Other Financing Uses Debt Redemption - Refim.ded Bonds Other Uses Transfers To - Enterprise Funds -- 800,000 -- -- -- 18,402
- Governmental Funds 208,787 9,309,802 - 507,554 1,303,988 3,903 3,280,359
Total Expenditures and Other Uses 1920452370 23121532206 2723502791 3526532364 2320682230 627382356 4420932133
Unreserved Fund Balance General Fund Unreserved Fund Balance 7,990,422 26,530,550 5,976,140 7,487,909 5,533,844 1,697,126 20,413,019 Special Revenue Fund Unreserved Fund Balance 5,802,829 20,221,004 10,149,984 13,150,697 4,508,235 4,157,888 18,169,522
Total 13,793,251 46,751,554 16,126,124 20,638,606 10,042,079 5,855,014 38,582,541
AS A PERCENT OF TOTAL CURRENT EXPENDITURES 86.0% 30.3% 72.9% 67.1% 57.2% 119.8% 129.3%

Table2 Classification of County Revenues
For the Year Ended December 31, 1999
BROWN CARLTON CARVER CASS CHIPPEWA CHISAGO CLAY
Population ( 1999 Estimate) 28,012 31,591 66,168 25,644 13,152 42,041 53,322 Net Taxable Tax Capacity 13,892,162 14,720,673 48,779,247 25,921,610 8,120,394 22,605,995 21,199,959 1998 Tax Levy (Payable 1999) 6,468,481 10,378,323 20,888,527 9,918,167 3,950,431 12,270,390 13,156,977
REVENUES
Taxes 6,554,043 10,745,501 24,754,034 11,813,620 4,006,422 12,462,095 12,437,648 Special Assessments 539,388 249,322 59,307 -- 391,717 422,249 322,211 Licenses and Permits 16,984 86,512 479,195 59,345 9,565 549,874 13,885 Intergovernmental Revenues
Federal Grants Highways -- -- 722,132 Human Services 801,596 1,422,605 1,197,099 1,422,552 349,051 1,008,997 2,200,346 Disaster 142,135 4,601 350,016 397,723 77,638 5,688 59,065 All Other 190,736 751,619 412,895 1,236,549 219,481 274,223 954,904
Total Federal Grants 1,134,467 2,178,825 1,960,010 3,778,956 646,170 1,288,908 3,214,315 State Grants
HACA 1,320,435 1,589,678 3,986,850 1,064,242 976,804 2,425,115 1,434,673 Manufactured Home HACA -- 77,927 12,499 7,330 119,992 Local Performance Aid 32,874 36,358 72,045 34,082 15,474 -- 62,205 Attached Machinery Aid -- 490,939 -- -- 72,233 Disparity Reduction Aid 34,181 439,197 3,160 8,870 143,094 5,869 1,446,372 Highways 2,723,139 4,314,313 4,136,889 5,171,072 2,275,164 3,310,176 4,321,933 ..... Human Services 1,844,417 4,135,704 4,265,794 3,738,782 1,366,956 3,169,960 5,840,445 00 Criminal Justice Aid 118,071 279,180 179,647 33,798 -- 262,023 PERA Aid 39,317 54,850 90,840 51,978 22,734 30,170 61,294 Police Aid 53,044 247,712 129,656 60,939 All Other 1,862,249 1,613,929 1,992,680 4,200,965 218,711 1,384,447 1,366,894
Total State Grants 8,027,727 12,674,968 15,153,077 14,591,793 5,121,004 10,445,729 14,868,072
Local Units Grants 133,907 11,000 1,615,052 70,533 61,424 74,311
Total Intergovernmental Revenues 9,296,101 14,864,793 18,728,139 18,370,749 5,837,707 11,796,061 18,156,698
Charges for Services 2,627,320 1,640,163 5,941,717 2,561,539 819,772 2,925,637 1,443,796 Fines and Forfeits 197,240 294,832 442,052 263,004 441,719 433,415 Interest Earnings 522,672 436,316 1,369,926 775,152 622,399 649,601 596,905 All Other Revenues 971,128 1,552,064 931,469 2,766,413 896,790 503,275 1,166,759
Total Revenues 20,724,876 29,869,503 52,705,839 36,609,822 12,584,372 29,750,511 34,571,317
Other Financing Sources Borrowing
Bonds Issued -- -- 1,095,577 Other Long-term Debt 329,640 -- 332,505 -- 69,989
Total Borrowing 329,640 -- - 332,505 -- - 1,165,566
Other Sources Transfers From - Enterprise Funds
- Governmental Funds 334,808 307,475 1,159,996 950,395 1,621,042
Total Revenues and Other Sources 21,389,324 30,176,2__78 53,865,835 37,892,722 12,584,372 31,371,553 35,736,883

Table 3 Classification of County Expenditures
For the Year Ended December 31, 1999
EXPENDITURES BRO'WN CARLTON CARVER CASS CHIPPEWA CHISAGO CLAY
General Government - Current Expenditures 2,816,957 4,696,400 11,007,834 4,880,413 1,977,297 4,421,152 4,815,887 - Capital Outlay - -- -- -- 556,107 --
Total General Government 2,816,957 4,696,400 11,007,834 4,880,413 1,977,297 4,977,259 4,815,887 Public Safety - Sheriff 1,063,156 2,432,853 8,050,000 2,343,889 808,949 2,269,232 2,831,094
- Corrections 2,469,929 1,888,283 874,356 1,446,053 366,843 2,097,250 2,264,798 -All Other 83,608 52,616 462,997 73,582 55,355 88,777 73,469 - Capital Outlay -- 974,975 -- 143,386 -- 148,061 27,330 Total Public Safety 3,616,693 5,348,727 9,387,353 4,006,910 1,231,147 4,603,320 5,196,691
Streets and Highways - Administration 176,290 377,905 225,805 466,170 152,399 633,950 374,496 - Maintenance 1,551,467 2,612,242 2,789,964 3,150,356 1,335,626 2,076,408 2,651,447 - Construction 1,938,572 3,815,434 2,389,814 4,516,260 1,964,717 1,695,162 4,087,720 - Other Capital Outlay -- -- - -- 390,817 --
Total Streets and Highways 3,666,329 6,805,581 5,405,583 8,132,786 3,452,742 4,796,337 7,113,663 Sanitation - Current Expenditures 410,036 986,678 -- 1,788,216 387,229 974,717 1,457
- Capital Outlay -- -- -- --Total Sanitation 410,036 986,678 1,788,216 387,229 974,717 1,457
Human Services - Income Maintenance 1,338,928 2,158,884 1,862,124 2,035,489 859,747 1,552,976 2,537,789 - Social Services 4,044,394 6,650,197 11,280,121 5,885,208 2,764,121 6,285,119 12,388,705 -All Other 519,673 -- -- 913,322 - Capital Outlay -- -- --
Total Human Services 5,902,995 8,809,081 13,142,245 8,834,019 3,623,868 7,838,095 14,926,494 Health - Current Expenditures 1,158,235 1,412,367 1,599,276 1,507,146 100,232 · 1,540,183
- Capital Outlay -- -- --Total Health 1,158,235 1,412,367 1,599,276 1,507,146 100,232 1,540,183
Culture and Recreation Libraries - Current Expenditures 61,476 75,877 980,492 221,635 260,371 174,635
...... - Capital Outlay -- -- -- 135,056 --\0 Parks and Recreation - Current Expenditures 439,164 243,820 2,104,979 36,390 91,750 167,988 165,753
- Capital Outlay -- -- -- -- 37,510 --Total Culture and Recreation 500,640 319,697 3,085,471 171,446 313,385 465,869 340,388
Conservation ofNatural Resources - Current Expenditures 711,508 640,803 516,327 2,380,381 804,761 497,971 2,024,135 - Capital Outlay -- -- 2,732,991 -- 1,156
Total Conservation of Natural Resources 711,508 640,803 516,327 5,113,372 804,761 499,127 2,024,135 Economic Development - Current Expenditures 14,508 1,320,284 5,165 353,356 19,850 483,694 549,794
- Capital Outlay -- -- -- -- 97,821 --Total Economic Development 14,508 1,320,284 5,165 353,356 19,850 581,515 549,794
All Other - Current Expenditures 233,578 -- 63,284 1,118,426 75,389 - Capital Outlay -- 1,335,410 -- 28,568
Total All Other 233,578 -- 1,335,410 63,284 1,146,994 75,389
Debt Service - Principal Paid on Bonds 518,000 2,155,000 670,000 265,000 -- 1,120,000 274,310 - Other Long-term Debt 51,076 172,904 21,183 529,327 -- 13,988 - Interest and Fiscal Charges 261,228 281,154 1,659,516 77,578 576,062 183,284
Total Current Expenditures 17,092,907 25,549,209 41,759,440 27,259,971 10,009,078 24,468,214 30,928,848 Total Capital Outlay 1,938,572 4,790,409 3,725,224 7,527,693 1,964,717 2,955,202 4,115,050 Total Debt Service 830,304 2,609,058 2,350,699 871,905 -- 1,696,062 471,582
Total Expenditures 19,861,783 32,948,676 47,835,363 35,659,569 11,973,795 29,119,478 35,515,480
Other Financing Uses Debt Redemption - Refunded Bonds Other Uses Transfers To - Enterprise Funds 34,500 -- 1,400,990
- Governmental Funds 334,808 307,475 1,159,996 950,395 1,621,042 --Total Expenditures and Other Uses 20i231i091 3322562151 4829952359 3626092964 1129732795 30l740l520 3629162470
Unreserved Fund Balance General Fund Unreserved Fund Balance 2,223,234 3,936,611 25,433,420 7,179,830 4,786,396 6,158,502 3,431,716 Special Revenue Fund Unreserved Fund Balance 5,941,401 3,038,013 18,919,260 5,219,286 7,165,530 7,248,569 3,481,320
Total 8,164,635 6,974,624 44,352,680 12,399,116 11,951926 13,407,071 6,913,036
AS A PERCENT OF TOTAL CUR.RENT EXPENDITURES 47.8% 27.3% 106.2% 45.5% 119.4% 54.8% 22.4%

Table 2 Classification of County Revenues
For the Year Ended December 31, 1999
CLEARWATER COOK COTTONWOOD CROWWING DAKOTA DODGE DOUGLAS
Population ( 1999 Estimate) 8,392 4,595 12,773 52,698 347,245 17,504 31,800 Net Taxable Tax Capacity 5,801,008 7,199,114 8,536,547 47,914,722 278,207,458 8,726,495 21,697,593 1998 Tax Levy (Payable 1999) 3,980,592 3,415,180 4,293,208 14,174,699 69,757,892 3,806,780 9,814,660
REVENUES
Taxes 4,177,684 5,192,184 4,408,534 15,140,629 81,896,562 3,886,581 10,078,569 Special Assessments 440,764 434,179 42,310 168,782 73,057 Licenses and Permits 9,050 108,624 5,696 1,046,574 667,243 80,821 311,766 Intergovernmental Revenues
Federal Grants Highways 3,212 -- -- 1,187,992 Human Services 917,920 139,331 373,636 2,099,015 8,503,859 355,942 1,014,872 Disaster 14,941 230,142 5,924 10,662 20,004 4,176 13,654 All Other 155,261 1,063,677 299,957 277,954 3,823,883 150,639 234,991
Total Federal Grants 1,088,122 1,436,362 679,517 2,387,631 12,347,746 510,757 2,451,509 State Grants
HACA 289,088 592,912 1,018,402 1,714,457 11,544,010 1,310,305 1,918,076 Manufactured Home HACA 5,054 3,032 1,241 80,076 216,538 -- 25,250 Local Performance Aid 9,939 5,208 15,177 -- 390,477 20,098 36,710 Attached Machinery Aid -- 52,568 375,772 Disparity Reduction Aid 58,942 3,798 62,701 23,310 2,604 262,266 7,949 Highways 3,050,572 1,420,151 2,013,436 3,290,545 9,523,833 1,668,757 3,377,020
N Human Services 1,333,160 536,315 1,329,742 5,982,132 12,781,342 1,121,444 2,605,228 0 Criminal Justice Aid 40,911 42,588 335,694 1,852,004 75,292 PERA Aid 44,444 17,896 17,411 50,759 333,927 30,670 Police Aid 30,169 25,277 161,130 429,065 All Other 700,494 638,786 333,789 1,367,847 10,289,489 471,554 1,220,684
Total State Grants 5,562,773 3,218,098 4,859,764 13,058,518 47,739,061 4,960,386 9,190,917
Local Units Grants 105,080 25,000 109,076 9,792,348 53,396 5,000
Total Intergovernmental Revenues 6,755,975 4,679,460 5,539,281 15,555,225 69,879,155 5,524,539 11,647,426
Charges for Services 670,197 1,555,671 292,394 2,460,292 35,416,595 1,731,818 3,022,656 Fines and Forfeits 85,552 73,658 79,185 498,681 1,245,085 94,855 238,730 Interest Earnings 362,855 500,042 466,294 1,307,273 7,848,599 196,442 444,797 All Other Revenues 1,042,430 969,965 361,740 2,253,229 4,107,061 648,309 1,052,010
Total Revenues 13,544,507 13,079,604 11,587,303 38,304,213 201,060,300 12,332,147 26,869,011
Other Financing Sources Borrowing
Bonds Issued 440,555 330,000 -- 4,583,444 41,222,390 215,000 Other Long-term Debt 5,852 170,000 -- -- -- 109,144
Total Borrowing 446,407 500,000 - 4,583,444 41,222,390 215,000 109,144
Other Sources 17,000 -- -- 49,336 Transfers From - Enterprise Funds -- -- 157,747
- Governmental Funds 458,944 796,390 38,328 351,880 18,363,503 278,911 489,665
Total Revenues and Other Sources 14,449,858 14J92,294 11,625,631 43,397,284 260,695,529 12,826,058 27,467,820

Table 3 Classification of County Expenditures
For the Year Ended December 31, 1999
EXPENDITURES CLEARWATER COOK COTTONWOOD CROWWING DAKOTA DODGE DOUGLAS
General Government - Current Expenditures 1,372,599 2,087,314 1,434,101 7,966,487 37,964,697 2,060,827 4,110,531 - Capital Outlay -- 111,004 -- -- 1,972,041 37,858
Total General Government 1,372,599 2,198,318 1,434,101 7,966,487 39,936,738 2,060,827 4,148,389 Public Safety - Sheriff 696,833 1,126,471 565,156 4,761,686 11,442,322 1,672,959 2,194,767
- Corrections 559,840 89,138 406,648 581,820 11,562,637 56,896 1,442,017 -All Other 48,181 182,122 4,062 279,988 373,771 52,483 36,902 - Capital Outlay 453,223 -- -- -- 78,368 --Total Public Safety 1,758,077 1,397,731 975,866 5,623,494 23,457,098 1,782,338 3,673,686
Streets and Highways - Administration 212,456 167,644 162,871 423,211 386,181 252,092 292,467 - Maintenance 1,239,123 2,229,332 1,840,795 2,901,638 4,476,632 1,281,985 2,666,184 - Construction 2,292,969 379,365 1,309,078 3,310,485 25,214,245 1,754,453 4,139,830 - Other Capital Outlay -- -- -- --
Total Streets and Highways 3,744,548 2,776,341 3,312,744 6,635,334 30,077,058 3,288,530 7,098,481 Sanitation - Current Expenditures 569,004 1,304,719 195,219 -- 3,817,311 763,758 1,161
- Capital Outlay -- -- -- --Total Sanitation 569,004 1,304,719 195,219 -- 3,817,311 763,758 1,161
Human Services - Income Maintenance 1,025,587 232,924 841,850 3,767,877 24,743,355 543,368 1,455,195 - Social Services 1,983,632 932,313 2,538,165 9,126,789 35,382,090 2,165,942 5,582,347 -All Other 465,746 - Capital Outlay --
Total Human Services 3,474,965 1,165,237 3,380,015 12,894,666 60,125,445 2,709,310 7,037,542 Health - Current Expenditures 18,000 246,863 107,059 1,491,683 7,361,954 632,144 2,070,337
- Capital Outlay -- - - -- --Total Health 18,000 246,863 107,059 1,491,683 7,361,954 632,144 2,070,337
Culture and Recreation Libraries - Current Expenditures 58,874 79,450 46,491 296,162 6,880,119 47,615 523,326
N - Capital Outlay -- - -- 5,729,019 2,672 J---1 Parks and Recreation - Current Expenditures 174,157 1,170,784 207,334 127,602 5,440,689 178,645 468,758
- Capital Outlay -- 300,485 -- -- --Total Culture and Recreation 233,031 1,550,719 253,825 423,764 18,049,827 226,260 994,756
Conservation of Natural Resources - Current Expenditures 1,413,112 100,099 863,104 1,089,361 1,274,980 382,036 548,697 - Capital Outlay -- -- -- -- --
Total Conservation of Natural Resources 1,413,112 100,099 863,104 1,089,361 1,274,980 382,036 548,697 Economic Development - Current Expenditures 61,989 449,892 15,734 2,225,327 5,178,455 87,545 35,000
- Capital Outlay -- 285,028 -- --Total Economic Development 61,989 734,920 15,734 2,225,327 5,178,455 87,545 35,000
All Other - Current Expenditures 235,945 -- 161,718 491,857 -- 232,245 407,424 - Capital Outlay -- 103,074 -- 3,454,427 1,923
Total All Other 235,945 264,792 491,857 3,454,427 232,245 409,347
Debt Service - Principal Paid on Bonds 385,000 1,295,000 160,000 3,505,000 10,000 751,250 - Other Long-term Debt 6,494 199,249 -- 267,191 232,668 226,769 261,688 - Interest and Fiscal Charges 20,655 740,682 342,151 115,747 2,667,041 186,693 492,875
Total Current Expenditures 10,135,078 10,399,065 9,390,307 35,531,488 156,285,193 10,410,540 21,835,113 Total Capital Outlay 2,746,192 1,075,882 1,412,152 3,310,485 36,448,100 1,754,453 4,182,283 Total Debt Service 27,149 1,324,931 1,637,151 542,938 6,404,709 423,462 1,505,813
Total Expenditures 12,908,419 12,799,878 12,439,610 39,384,911 199,138,00!2 12,588,455 27,523,209
Other Financing Uses Debt Redemption - Refunded Bonds Other Uses Transfers To - Enterprise Funds -- 48,261
- Governmental Funds 458,944 796,390 38,328 351,880 18,363,503 278,911 489,665
Total Expenditures and Other Uses 1323672363 1325962268 1225262199 3927362791 217!50125(115 1228672366 2820122874
Unreserved Fund Balance General Fund Umeserved Fund Balance 1,430,260 5,423,175 4,314,330 7,434,417 53,516,708 2,023,230 3,634,916 Special Revenue Fund Umeserved Fund Balance 5,123,982 2,989,907 1,036,256 6,795,970 63,285,440 2,308,983 2,042,158
Total 6,554,242 8,413,082 5,350,586 14,230,387 116,802,148 4,332,213 5,677,074
AS A PERCENT OF TOTAL CURRENT EXPENDITURES 64.7% 80.9% 57.0% 40.1% 74.7% 41.6% 26.0%

Table 2 Classification of County Revenues
For the Year Ended December 31, 1999
FARIBAULT FILLMORE FREEBORN GOODHUE GRANT HENNEPIN HOUSTON
Population ( 1999 Estimate) 16,364 20,914 32,238 43,469 6,165 1,089,024 19,545 Net Taxable Tax Capacity 10,524,144 9,164,736 16,147,446 40,524,609 4,378,970 1,024,048,183 8,157,018 1998 Tax Levy (Payable 1999) 4,483,513 4,227,065 7,261,477 14,957,762 2,367,242 369,693,666 3,862,363
REVENUES
Taxes 4,597,110 4,315,319 7,353,697 15,170,145 2,418,271 405,624,363 3,906,910 Special Assessments 397,937 789,795 1,627 65,346 Licenses and Permits 1,010 45,935 28,454 320,139 207 2,574,361 36,793 Intergovernmental Revenues
Federal Grants Highways 4,042 8,408,396 Human Services -- 416,384 1,253,135 1,000,792 191,089 91,299,936 547,981 Disaster 11,222 27,296 27,788 140,569 -- 18,271 All Other 38,105 123,066 201,357 220,124 47,996 27,985,506 106,022
Total Federal Grants 49,327 566,746 1,482,280 1,365,527 239,085 127,693,838 672,274 State Grants
HACA 911,254 997,178 1,709,765 1,506,601 546,345 34,872,496 1,147,884 Manufactured Home HACA -- 18,030 3,102 52,417 Local Performance Aid 19,424 24,614 38,066 50,459 7,260 1,262,914 22,690 Attached Machinery Aid Disparity Reduction Aid 85,666 250,529 68,076 36,257 7,293 -- 162,881 Highways 3,071,179 6,341,527 4,393,125 3,684,372 2,349,893 12,811,888 4,199,117
N Human Services 3,818 1,167,177 3,269,761 3,245,632 863,477 63,062,251 1,616,160 N Criminal Justice Aid 70,110 76,936 137,377 229,823 28,564 -- 83,556 PERA Aid 14,171 26,020 44,126 61,725 23,804 -- 23,790
Police Aid 44,330 -- 168,606 All Other 257,166 557,073 901,354 1,392,523 297,133 63,930,036 668,208
Total State Grants 4,477,118 9,441,054 10,561,650 10,394,028 4,126,871 175,992,002 7,924,286
Local Units Grants 43,372 6,121 3,470 2,480,045 10,848
Total Intergovernmental Revenues 4,569,817 10,013,921 12,043,930 11,763,025 4,365,956 306,165,885 8,607,408
Charges for Services 592,492 2,105,126 1,886,015 3,293,910 997,666 90,111,045 1,774,005
Fines and Forfeits 130,144 106,306 335,107 262,516 2,083,308 100,590
Interest Earnings 281,272 459,332 826,142 974,106 93,228 222,568 303,195
All Other Revenues 976,515 394,132 786,048 2,528,684 343,319 44,013,746 419,213
Total Revenues 11,546,297 17,440,071 24,049,188 34,314,152 8,283,993 850,795,276 15,148,114
Other Financing Sources Borrowing
Bonds Issued 280,000 -- 232,296 350,000 40,000,000
Other Long-term Debt 14,630 56,487 -- 538,818 8,866
Total Borrowing 294,630 56,487 - 771,114 358,866 40,000,000
Other Sources 103,307 Transfers From - Enterprise Funds -- 460,771
- Governmental Funds 387,202 276,606 8,658 7,438,698 188,222 56,905,265
Total Revenues and Other Sources 12,228,129 17,773,164 24,161,153 42,523,964 8,831,081 948,161,312 15,148,114

Table 3 Classification of County Expenditures
For the Year Ended December 31, 1999
EXPENDITURES FARIBAULT FILLMORE FREEBORN GOODHUE GRANT HENNEPIN HOUSTON
General Government - Current Expenditures 1,773,585 . 1,975,673 3,070,439 5,477,730 1,061,144 84,413,289 2,097,210 - Capital Outlay -- 1,836,229 -- -- -- 33,039,024 --
Total General Government 1,773,585 3,811,902 3,070,439 5,477,730 1,061,144 117,452,313 2,097,210 Public Safety - Sheriff 964,307 895,399 1,185,502 2,731,519 657,819 30,405,639 836,736
- Corrections 306,298 677,250 1,137,778 2,910,187 74,083 99,963,088 676,644 -All Other 160,232 56,526 50,219 231,471 6,580 74,625,545 64,683 - Capital Outlay -- 12,479 -- 9,231,125 -- 33,110,402 --Total Public Safety 1,430,837 1,641,654 2,373,499 15,104,302 738,482 238,104,674 1,578,063
Streets and Highways - Administration 208,950 289,381 189,368 242,622 207,612 372,075 120,612 - Maintenance 1,850,002 1,935,336 2,214,404 2,179,196 1,150,030 19,428,323 2,120,914 - Construction 2,117,192 4,656,705 3,273,211 4,082,294 1,756,397 22,290,521 3,449,243 - Other Capital Outlay -- -- -- -- --
Total Streets and Highways 4,176,144 6,881,422 5,676,983 6,504,112 3,114,039 42,090,919 5,690,769 Sanitation - Current Expenditures 104,895 553,133 366,749 685,343 374,605 647,605
- Capital Outlay -- -- -- -- --Total Sanitation 104,895 553,133 366,749 685,343 374,605 -- 647,605
Human Services - Income Maintenance -- 663,343 1,424,449 2,030,404 416,834 210,595,881 440,428 - Social Services -- 2,165,176 7,569,488 6,485,202 1,504,173 187,220,656 2,924,628 -All Other 1,279,914 252,038 -- --- Capital Outlay -- -- -- -- -- 12,617,560
Total Human Services 1,279,914 2,828,519 9,245,975 8,515,606 1,921,007 410,434,097 3,365,056 Health - Current Expenditures 1,004,479 938,540 2,898,218 612,194 48,228,943 1,182,147
- Capital Outlay -- -- -- 35,516 2,725,247 -Total Health -- 1,004,479 938,540 2,933,734 612,194 50,954,190 1,182,147
Culture and Recreation Libraries - Current Expenditures 162,066 120,000 160,000 251,238 41,229 24,885,163 50,190
N - Capital Outlay -- -- -- 5,897,028 -VJ Parks and Recreation - Current Expenditures 276,994 105,917 97,153 157,476 22,363 140,161
- Capital Outlay -- -- -- --Total Culture and Recreation 439,060 225,917 257,153 408,714 63,592 30,782,191 190,351
Conservation of Natural Resources - Current Expenditures 897,071 535,125 846,122 332,398 257,634 276,794 - Capital Outlay -- 216,274 -- --
Total Conservation of Natural Resources 897,071 535,125 1,062,396 332,398 257,634 -- 276,794
Economic Development - Current Expenditures 214,892 28,076 131,107 157,709 15,000 1,501,361 73,845 - Capital Outlay -- -- -- -- 1,106,826
Total Economic Development 214,892 28,076 131,107 157,709 15,000 2,608,187 73,845
All Other - Current Expenditures 540,312 354,980 391,610 -- 71,452 180,746 - Capital Outlay -- -- -- -- --
Total All Other 540,312 354,980 391,610 -- 71,452 180,746
Debt Service - Principal Paid on Bonds 370,000 110,000 240,000 1,006,146 90,000 23,600,000 - Other Long-term Debt 8,020 -- 383,777 1,263 - Interest and Fiscal Charges 172,035 34,107 355,916 1,381,250 16,111 7,972,839
Total Current Expenditures 8,739,518 11,359,794 20,024,966 26,770,713 6,472,752 781,639,963 11,833,343 Total Capital Outlay 2,117,192 6,505,413 3,489,485 13,348,935 1,756,397 110,786,608 3,449,243 Total Debt Service 542,035 152,127 595,916 2,771,173 107,374 31,572,839 --
Total Expenditures 11,398,745 18,017,334 24,110,367 42,890,821 8,336,523 923,999,410 15,282,586
Other Financing Uses Debt Redemption - Refunded Bonds Other Uses Transfers To - Enterprise Funds
- Governmental Funds 387,202 276,606 8,658 7,438,698 188,222 56,905,265
Total Expenditures and Other Uses 1127852947 1822932940 2421192025 5023292519 825242745 980~042675 1522822586
Unreserved Fund Balance General Fund Unreserved Fund Balance 2,040,315 3,419,888 6,281,013 2,062,389 1,090,727 73,239,841 4,230,217 Special Revenue Fund Unreserved Fund Balance 1,845,197 5,184,208 9,944,805 6,319,726 1,208,370 131,906,618 3,046,626
Total 3,885,512 8,604,096 16,225,818 8,382,115 2,299,097 205,146,459 7,276,843
AS A PERCENT OF TOTAL CURRENT EXPENDITURES 44.5% 75.7% 81.0% 31.3% 35.5% 26.2% 61.5%

Table 2 Classification of County Revenues
For the Year Ended December 31, 1999
HUBBARD ISANTI ITASCA JACKSON KANABEC KANDIYOfil KITTSON
Population ( 1999 Estimate) 17,177 30,826 43,986 11,636 14,432 41,942 5,376 Net Taxable Tax Capacity 12,979,066 13,477,830 33,389,595 9,815,596 5,215,236 24,195,626 5,880,136 1998 Tax Levy (Payable 1999) 4,804,543 7,420,132 17,432,767 4,869,029 4,318,923 12,227,367 1,823,302
REVENUES
Taxes 5,233,086 7,639,791 19,140,000 4,826,726 4,422,274 12,253,072 1,970,435 Special Assessments -- 388,012 144,615 1,448,976 99,545 Licenses and Permits 157,760 394,813 . 48,570 11,608 49,122 151,897 980 Intergovernmental Revenues
Federal Grants Highways Human Services 770,135 867,608 1,810,343 364,015 582,049 1,471,315 168,766 Disaster 135,919 5,203 270,568 4,000 4,000 6,591 306,626 All Other 235,388 332,022 835,403 9,756 109,603 625,791 804,899
Total Federal Grants 1,141,442 1,204,833 2,916,314 377,771 695,652 2,103,697 1,280,291 State Grants
HACA 809,068 2,071,552 2,260,717 940,267 1,155,312 2,269,992 412,323 Manufactured Home HACA 12,588 44,313 35,965 1,707 37,866 35,748 2,432 Local Performance Aid 19,623 50,870 13,792 16,470 48,892 6,468 Attached Machinery Aid -- 409,373 Disparity Reduction Aid 48,604 191,524 64,898 5,147 25,418 5,344 Highways 2,786,525 2,849,977 6,081,870 2,142,042 1,513,412 5,186,486 3,367,297
N Human Services 1,918,575 3,591,828 6,222,947 1,072,754 1,435,740 4,912,642 420,726 .i::,. Criminal Justice Aid 145,644 -- 54,288 73,866 227,439 20,733 PERA Aid 37,531 82,819 18,381 21,596 73,608 13,152 Police Aid 82,309 -- 27,914 42,821 146,621 25,103 All Other 890,460 1,228,400 2,183,351 330,854 434,161 6,010,354 1,235,834
Total State Grants 6,436,839 10,100,158 17,519,436 4,666,897 4,736,391 18,937,200 5,509,412
Local Units Grants 8,500 38,847 2,000 46,000 13,871 91,970
Total Intergovernmental Revenues 7,586,781 11,343,838 20,437,750 5,090,668 5,445,914 21,040,897 6,881,673
Charges for Services 653,828 967,141 4,571,934 467,591 1,262,791 6,286,383 444,797 Fines and Forfeits 148,650 281,174 414,444 129,213 124,871 10,228 67,853 Interest Earnings 543,123 671,187 1,573,255 341,402 459,953 1,668,422 327,181 All Other Revenues 1,285,484 1,621,225 3,458,106 336,974 769,932 1,200,647 434,384
Total Revenues 15,608,712 22,919,169 49,644,059 11,592,194 12,679,472 44,060,522 10,226,848
Other Financing Sources Borrowing
Bonds Issued -- -- 9,750,002 Other Long-term Debt 71,398 -- -- 11,038,453
Total Borrowing 71,398 -- - -- -- 20,788,455
Other Sources -- 995,874 Transfers From - Enterprise Funds
- Governmental Funds -- 126,334 5,362,499 100,100 4,693,852 65,000
Total Revenues and Other Sources 15,680,110 23,045,503 56,002,432 11,592,194 12,779,572 69,542,829 10,291,848

Table3 Classification of County Expenditures
For the Year Ended December 31, 1999
EXPENDITURES HUBBARD ISANTI ITASCA JACKSON KANABEC KANDIYOHI KITTSON
General Government - Current Expenditures 2,612,427 3,828,024 5,887,079 1,551,699 1,614,161 4,049,565 1,180,615 - Capital Outlay 477 1,089,170 5,242,512 129,239 --
Total General Government 2,612,427 3,828,501 6,976,249 1,551,699 6,856,673 4,178,804 1,180,615 Public Safety - Sheriff 1,007,024 3,230,463 2,534,044 453,991 1,226,277 2,981,475 504,723
- Corrections 781,464 359,159 2,638,304 540,270 152,701 2,954,119 168,595 -All Other 42,239 85,252 179,572 34,086 38,519 138,698 2,044,934 - Capital Outlay -- -- 259,960 -- -- 417,810 --Total Public Safety 1,830,727 3,674,874 5,611,880 1,028,347 1,417,497 6,492,102 2,718,252
Streets and Highways - Administration 244,222 253,782 391,244 146,570 177,729 505,248 153,017 - Maintenance 2,437,348 1,155,201 8,615,269 1,884,284 1,641,654 2,552,560 1,355,362 - Construction 2,288,350 2,979,172 4,519,480 888,298 1,540,890 4,091,211 2,926,093 - Other Capital Outlay 122,905 207,804 -- 428,398
Total Streets and Highways 4,969,920 4,511,060 13,733,797 2,919,152 3,360,273 7,577,417 4,434,472 Sanitation - Current Expenditures -- 475,053 1,271,304 75,753 75,617 1,628,113 88,836
- Capital Outlay -- -- -- -- 16,152,628 Total Sanitation -- 475,053 1,271,304 75,753 75,617 17,780,741 88,836
Human Services - Income Maintenance 915,686 1,779,656 3,201,612 718,393 923,834 1,925,771 348,548 - Social Services 3,754,294 6,744,571 10,953,915 2,585,188 2,679,772 10,068,349 722,040 -All Other 225,508 -- -- -- 8,443 - Capital Outlay -- 65,218 -- --
Total Human Services 4,895,488 8,524,227 14,220,745 3,303,581 3,603,606 11,994,120 1,079,031 Health - Current Expenditures 81,070 1,025,125 1,539,254 145,818 1,163,489 1,301,613 33,451
- Capital Outlay -- --Total Health 81,070 1,025,125 1,539,254 145,818 1,163,489 1,301,613 33,451
Culture and Recreation Libraries - Current Expenditures 103,653 189,676 -- 95,490 79,553 182,371 48,359
N - Capital Outlay -- -- -- -- --Vt Parks and Recreation - Current Expenditures 163,570 217,291 679,574 214,828 8,866 1,610,800 81,199
- Capital Outlay -- -- -- -- -- --Total Culture and Recreation 267,223 406,967 679,574 310,318 88,419 1,793,171 129,558
Conservation of Natural Resources - Current Expenditures 998,752 240,515 1,662,025 764,159 170,032 770,039 376,792 - Capital Outlay -- -- -- -- --
Total Conservation of Natural Resources 998,752 240,515 1,662,025 764,159 170,032 770,039 376,792 Economic Development - Current Expenditures 19,100 604,552 897 69,175 52,720 7,275 25,550
- Capital Outlay -- -- -- -- --Total Economic Development 19,100 604,552 897 69,175 52,720 7,275 25,550
All Other - Current Expenditures 110,649 7,181 732,386 473,692 221,093 777,526 161,342 - Capital Outlay -- -- 13,661 -- 8,379,784 --
Total All Other 110,649 7,181 746,047 473,692 221,093 9,157,310 161,342
Debt Service - Principal Paid on Bonds -- 470,000 50,000 105,000 -- 4,095,000 - Other Long-term Debt 42,202 -- 1,183,429 - 125,775 1,117,656 - futerest and Fiscal Charges 3,441 747,597 306,603 60,416 480,122 1,872,733 1,610
Total Current Expenditures 13,497,006 20,195,501 40,286,479 9,753,396 10,226,017 31,453,522 7,301,806 Total Capital Outlay 2,288,350 3,102,554 6,155,293 888,298 6,783,402 29,599,070 2,926,093 Total Debt Service 45,643 1,217,597 1,540,032 165,416 605,897 7,085,389 1,610
Total Expenditures 15,830,999 24,515,652 47,981,804 10,807,110 17,615,316 68,137,981 10,229,509
Other Financing Uses Debt Redemption - Refunded Bonds Other Uses Transfers To - Enterprise Funds 80,000 -- -- -- 37,327
- Governmental Funds -- 126,334 5,362,499 -- 100,100 4,693,852 65,000
Total Expenditures and Other Uses 15!910!999 2426412986 5323442303 1028072110 1727152416 7228312833 10J31!836
Unreserved Fund Balance General Fund Unreserved Fund Balance 3,551,196 3,900,333 6,933,310 4,575,689 1,597,038 445,602 2,347,293 Special Revenue Fund Unreserved Fund Balance 3,341,388 2,156,975 13,490,841 1,917,471 2,018,746 17,406,435 · 2,222,347
Total 6,892,584 6,057,308 20,424,151 6,493,160 3,615,784 17,852,037 4,569,640
AS A PERCENT OF TOTAL CURRENT EXPENDITURES 51.1% 30.0% 50.7% 66.6% 35.4% 56.8% 62.6%

Table 2 Classification of County Revenues
For the Year Ended December 31, 1999
KOOCHICHING LAC QUI PARLE LAKE LAKE OF THE WOODS LESUEUR LINCOLN LYON
Population ( 1999 Estimate) 15,679 8,413 10,745 4,618 25,482 6,585 25,505 Net Taxable Tax Capacity 7,510,562 5,267,253 5,642,516 2,173,985 13,810,262 4,120,041 15,239,744 1998 Tax Levy (Payable 1999) 2,816,326 2,317,495 3,982,996 1,376,888 6,185,480 2,445,100 6,125,494
REVENUES
Taxes 3,545,340 2,479,031 5,872,098 1,815,540 6,404,714 2,488,490 6,293,531 Special Assessments 377,688 248,946 -- 450,958 183,898 190,679 410,277 Licenses and Permits 19,811 5,030 21,872 53,157 98,076 3,330 13,082 Intergovernmental Revenues
Federal Grants Highways -- 501,219 Human Services 696,447 205,352 412,310 58,857 506,657 Disaster 665 43,136 97,907 4,000 122,249 4,000 4,672 All Other 739,951 88,720 1,328,149 199,579 425,764 109,725 64,211
Total Federal Grants 1,437,063 337,208 2,339,585 262,436 1,054,670 113,725 68,883 State Grants
HACA 198,877 578,136 1,164,890 417,525 1,740,159 699,324 1,145,736 Manufactured Home HACA -- 1,371 3,851 23,710 14,945 1,899 8,407 Local Performance Aid -- 10,146 -- 5,276 29,274 -- 29,851 Attached Machinery Aid 487,627 Disparity Reduction Aid 218,994 60,092 194,412 11,891 100,167 45,257 32,308 Highways 3,730,072 2,583,386 1,891,963 2,612,914 2,768,752 2,053,923 2,776,147
N Human Services 1,900,298 791,168 O'\ 1,444,395 250,259 1,839,581 -- 6,692 Criminal Justice Aid 35,313 -- 19,455 96,113 20,839 114,141 PERA Aid 28,034 12,441 24,475 12,302 9,428 26,960 Police Aid 29,402 -- 23,580 63,344 15,566 49,202 All Other 887,606 488,435 823,611 629,922 1,246,986 291,740 775,862
Total State Grants 7,451,508 4,589,890 5,547,597 4,006,834 7,899,321 3,137,976 4,965,306
Local Units Grants 19,650 27,598 4,581 42,665 22,764 14,754
Total Intergovernmental Revenues 8,908,221 4,954,696 7,891,763 4,311,935 8,953,991 3,274,465 5,048,943
Charges for Services 1,037,134 269,148 982,638 202,008 984,329 195,710 518,603 Fines and Forfeits 101,620 2,214 57,447 47,014 198,996 35,864 196,205
Interest Earnings 696,924 326,301 218,729 311,046 408,412 163,718 440,139
All Other Revenues 2,754,492 267,727 877,603 318,791 1,033,649 195,208 583,256
Total Revenues 17,441,230 8,553,093 15,922,150 7,510,449 18,266,065 6,547,464 13,504,036
Other Financing Sources Borrowing
Bonds Issued 511,594 669,464
Other Long-term Debt 38,120 -- 72,500 11,028
Total Borrowing -- 38,120 - -- 72,500 522,622 669,464
Other Sources 10,063 Transfers From - Enterprise Funds
- Governmental Funds 3,139,947 95,007 476,933 -- 98,476 25,950
Total Revenues and Other Sources 20,591,240 8,686,220 16J99,083 7,510,449 18,437,041 7,096,036 14,173,500

Table 3 Classification of County Expenditures
For the Year Ended December 31, 1999
EXPENDITURES KOOCHICHING LAC QUI PARLE LAKE LAKE OF THE WOODS LESUEUR LINCOLN LYON
General Government - Current Expenditures 2,386,771 822,759 3,360,465 1,120,867 2,720,950 949,563 3,513,497 - Capital Outlay -- -- -- -- -- --
Total General Government 2,386,771 822,759 3,360,465 1,120,867 2,720,950 949,563 3,513,497 Public Safety - Sheriff 1,274,361 427,611 1,535,208 609,477 1,069,516 402,913 1,573,223
- Corrections 215,021 35,831 47,235 11,001 753,098 35,483 332,238 -All Other 9,294 13,524 404,604 23,507 526,510 17,601 96,455 - Capital Outlay -- -- -- -- --Total Public Safety 1,498,676 476,966 1,987,047 643,985 2,349,124 455,997 2,001,916
Streets and Highways - Administration 318,349 122,777 253,061 97,600 397,014 213,083 411,307 - Maintenance 1,566,235 1,447,077 2,081,280 1,358,278 1,853,757 1,190,770 1,911,226 - Construction 3,176,558 1,675,795 1,956,580 1,623,463 2,350,460 866,214 2,102,175 - Other Capital Outlay -- -- -- --
Total Streets and Highways 5,061,142 3,245,649 4,290,921 3,079,341 4,601,231 2,270,067 4,424,708 Sanitation - Current Expenditures 1,103,257 148,426 251,137 863,756 147,196 105,507 255,018
- Capital Outlay -- -- -- -- --Total Sanitation 1,103,257 148,426 251,137 863,756 147,196 105,507 255,018
Human Services - Income Maintenance 1,163,246 388,212 625,085 291,927 1,280,656 - Social Services 3,149,071 1,405,126 2,403,728 587,709 3,539,897 -All Other -- -- 35,960 24,532 839,528 2,420,630 - Capital Outlay -- -- -- -- -- --
Total Human Services 4,312,317 1,793,338 3,028,813 915,596 4,845,085 839,528 2,420,630 Health - Current Expenditures 880,933 68,158 370,123 50,792 1,259,341 12,568 102,108
- Capital Outlay -- -- -- -- --Total Health 880,933 68,158 370,123 50,792 1,259,341 12,568 102,108
Culture and Recreation Libraries - Current Expenditures 30,585 56,018 54,971 17,379 254,435 33,218 178,739
N - Capital Outlay -- -- -- ----...J Parks and Recreation - Current Expenditures 113,181 125,362 611,706 135,705 123,425 120,969 196,055
- Capital Outlay -- -- -- -- -- --Total Culture and Recreation 143,766 181,380 666,677 153,084 377,860 154,187 374,794
Conservation ofNatural Resources - Current Expenditures 1,030,325 795,225 598,504 226,012 486,836 451,127 1,419,293 - Capital Outlay -- -- -- --
Total Conservation of Natural Resources 1,030,325 795,225 598,504 226,012 486,836 451,127 1,419,293 Economic Development - Current Expenditures 230,884 11,952 79,626 99,044 206,051 227,881 47,412
- Capital Outlay -- -- -- --Total Economic Development 230,884 11,952 79,626 99,044 206,051 227,881 47,412
All Other - Current Expenditures 64,425 30,898 6,987 93,907 -- 190,160 108,417 - Capital Outlay -- -- 47,525 -- -- -- --
Total All Other 64,425 30,898 54,512 93,907 -- 190,160 108,417
Debt Service - Principal Paid on Bonds 275,000 -- 1,140,000 -- 325,000 777,000 80,000 - Other Long-term Debt 46,277 90,753 26,012 -- 3,801 246,044 - Interest and Fiscal Charges 102,630 6,898 415,267 4,581 128,624 76,893 217,353
Total Current Expenditures 13,535,938 5,898,956 12,683,720 5,622,921 14,643,214 4,790,371 12,565,618 Total Capital Outlay 3,176,558 1,675,795 2,004,105 1,623,463 2,350,460 866,214 2,102,175 Total Debt Service 377,630 53,175 1,646,020 30,593 453,624 857,694 543,397
Total Expenditures 17,090,126 7,627,926 16,333,845 7,276,977 17,447,298 6,514,279 15,211,190
Other Financing Uses Debt Redemption - Refunded Bonds Other Uses Transfers To - Enterprise Funds 62,000
- Governmental Funds 3,139,947 95,007 476,933 -- 98,476 25,950
Total Expenditures and Other Uses 20l230l073 7!722!933 16l872l778 7i276.fl.77 17~45!774 6l540l229 15!211i190
Unreserved Fund Balance General Fund Umeserved Fund Balance 7,296,683 2,148,915 4,414,559 2,413,960 1,454,698 1,251,973 4,843,471 Special Revenue Fund Umeserved Fund Balance 5,258,530 4,004,842 6,412,132 3,518,347 6,250,372 2,773,441 521,779
Total 12,555,213 6,153,757 10,826,691 5,932,307 7,705,070 4,025,414 5,365,250
AS A PERCENT OF TOTAL CURRENT EXPENDITURES 92.8% 104.3% 85.4% 105.5% 52.6% 84.0% 42.7%

Table2 Classification of County Revenues
For the Year Ended December 31, 1999
MAHNOMEN MARSHALL MARTIN MCLEOD MEEKER MILLE LACS MORRISON
Population ( 1999 Estimate) 5,166 10,383 22,694 35,364 21,929 21,355 31,756 Net Taxable Tax Capacity 2,184,639 8,369,723 15,753,180 16,756,566 10,876,339 8,540,982 .12,739,015 1998 Tax Levy (Payable 1999) 2,581,850 2,729,090 5,574,550 8,543,254 5,100,760 6,793,966 7,937,541
REVENUES
Taxes 2,735,428 2,808,701 5,728,019 8,696,894 5,194,919 7,258,350 8,189,239 Special Assessments 249,287 530,744 400,436 213,163 124,597 232,107 146,019 Licenses and Permits 7,471 120 27,533 54,759 27,289 137,299 192,198 Intergovernmental Revenues
Federal Grants Highways -- -- -- 1,313,674 Human Services 419,868 287,625 -- 632,825 461,094 760,704 1,496,959 Disaster 4,000 427,730 4,770 127,344 4,567 3,700 5,269 All Other 137,687 770,636 332,516 199,384 270,375 253,475 247,196
Total Federal Grants 561,555 1,485,991 337,286 959,553 736,036 1,017,879 3,063,098 State Grants
HACA 423,240 663,570 977,362 1,754,799 1,081,807 1,121,598 1,797,625 Manufactured Home HACA 3,022 4,805 -- 34,911 17,252 25,761 24,487 Local Performance Aid 6,130 12,532 26,820 40,488 25,485 24,237 36,663 Attached Machinery Aid Disparity Reduction Aid 76,095 5,349 44,109 71,397 18,460 29,326 35,011 Highways 1,657,670 4,838,583 3,489,335 4,826,455 2,169,895 2,378,678 5,608,342
N Human Services 854,012 509,561 20,299 2,352,897 1,836,074 2,562,932 2,998,911 00 Criminal Justice Aid 41,252 120,115 170,291 105,920 134,615 159,193 PERA Aid 17,785 17,659 54,227 24,144 61,572 48,267 Police Aid -- 50,553 49,915 87,960 46,141 74,763 All Other 663,151 796,278 551,131 675,933 658,794 940,197 744,581
Total State Grants 3,683,320 6,940,268 5,296,745 10,069,358 · 5,983,972 7,353,679 11,453,080
Local Units Grants 35,727 176,688 6,347 30,723 6,412
Total Intergovernmental Revenues 4,280,602 8,602,947 5,634,031 11,028,911 6,726,355 8,402,281 14,522,590
Charges for Services 236,345 1,273,820 927,078 2,890,128 1,660,648 918,154 3,120,343 Fines and Forfeits 52,954 42,645 218,924 272,872 44,217 289,810 214,948 Interest Earnings 227,715 236,059 505,397 980,384 262,148 470,041 974,105 All Other Revenues 338,954 735,199 395,577 1,778,030 1,193,244 699,687 1,192,886
Total Revenues 8,128,756 14,230,235 13,836,995 25,915,141 15,233,417 18,407,729 28,552,328
Other Financing Sources Borrowing
Bonds Issued 1,078,010 Other Long-term Debt 429,653 797,023 285,741 15,500
Total Borrowing 1,507,663 797,023 285,741 -- 15,500
Other Sources -- -- 16,556 2,403 Transfers From - Enterprise Funds
- Governmental Funds 26,052 50,000 812,526 1,026,231 138,442
Total Revenues and Other Sources 9,636,419 15,053J10 14,172,736 26,744,223 16,275,148 18,548,574 28,552,328

Table 3 Classification of County Expenditures
For the Year :Ended December 31, 1999
EXPENDITURES MAHNOMEN MARSHALL MARTIN MCLEOD MEEKER MILLELACS MORRISON
General Government - Current Expenditures 1,282,303 1,363,284 2,868,591 3,745,092 1,887,822 3,122,759 3,718,904 - Capital Outlay -- 1,070,376 -- -- -- --
Total General Government 1,282,303 2,433,660 2,868,591 3,745,092 1,887,822 3,122,759 3,718,904 Public Safety - Sheriff 1,044,262 979,902 1,774,825 2,304,217 1,790,343 1,217,219 1,337,259
- Corrections 95,340 63,602 273,694 1,112,884 340,045 2,285,788 1,406,421 -All Other 3,739 100,552 66,258 260,531 75,489 49,456 46,065 - Capital Outlay -- -- -- -- 725,649 1,126,082 --Total Public Safety 1,143,341 1,144,056 2,114,777 3,677,632 2,931,526 4,678,545 2,789,745
Streets and Highways - Administration 139,055 498,077 205,680 500,959 320,836 216,135 75,280 - Maintenance 966,732 1,965,907 2,468,211 1,669,112 1,783,831 1,434,609 2,301,096 - Construction 856,362 3,372,401 3,032,740 5,694,643 1,956,668 2,086,293 6,380,023 - Other Capital Outlay -- -- --
Total Streets and Highways 1,962,149 5,836,385 5,706,631 7,864,714 4,061,335 3,737,037 8,756,399 Sanitation - Current Expenditures 230,730 131,996 243,272 1,471,580 145,407 398,982 986,029
- Capital Outlay -- -- -- -- --Total Sanitation 230,730 131,996 243,272 1,471,580 145,407 398,982 986,029
Human Services - Income Maintenance 582,271 601,818 -- 1,424,636 1,075,971 1,194,039 2,352,563 - Social Services 1,189,323 1,461,680 -- 5,088,365 3,487,938 5,910,503 4,632,368 -All Other 321,206 203,283 1,779,296 - Capital Outlay -- --
Total Human Services 2,092,800 2,266,781 1,779,296 6,513:t}0l 4,563,9.09 7,104,542 6,984,931 Health - Current Expenditures 63,966 24,000 -- 1,335,293 961,321 715,467 1,124,077
~ Capital Outlay -- -- -- --Total Health 63,966 24,000 -- 1,335,293 961,321 715,467 1,124,077
Culture and Recreation Libraries - Current Expenditures 18,265 83,260 501,186 -- 102,798 125,594 301,929
N - Capital Outlay -- -- -- --l,O Parks and Recreation - Current Expenditures 41,903 171,306 81,061 388,931 155,824 67,739
- Capital Outlay -- -- -- --Total Culture and Recreation 60,168 254,566 582,247 388,931 258,622 125,594 369,668
Conservation of Natural Resources - Current Expenditures 216,098 933,058 593,508 480,278 336,709 172,803 361,613 - Capital Outlay -- -- -- --
Total Conservation of Natural Resources 216,098 933,058 593,508 480,278 336,709 172,803 361,613 Economic Development - Current Expenditures 21,470 1,646,746 32,143 -- 240,844 180,685 52,082
- Capital Outlay -- -- -- -- -- --Total Economic Development 21,470 1,646,746 32,143 -- 240,844 180,685 52,082
All Other - Current Expenditures 82,566 143,426 193,515 991,033 125,526 21,843 199,517 - Capital Outlay -- - -- --
Total All Other 82,566 143,426 193,515 991,033 125,526 21,843 199,517
Debt Service - Principal Paid on Bonds 190,000 345,000 240,000 225,000 100,000 485,000 - Other Long-term Debt 56,678 11,548 29,993 560,000 150,000 15,792 55,000 - Interest and Fiscal Charges 30,082 34,285 88,735 124,241 306,410 324,300 682,561
Total Current Expenditures 6,299,229 10,371,897 11,081,240 20,772,911 12,830,704 17,045,882 18,962,942 Total Capital Outlay 856,362 4,442,777 3,032,740 5,694,643 2,682,317 3,212,375 6,380,023 Total Debt Service 276,760 390,833 358,728 909,241 556,410 340,092 1,222,561
Total Expenditures 7,432,351 15,205,507 14,472,708 27,376,795 16,069,431 20,598,349 26,565,526
Other Financing Uses Debt Redemption - Refunded Bonds Other Uses Transfers To - Enterprise Funds 510,825
- Governmental Funds 26,052 50,000 812,526 1,026,231 138,442
Total Expenditures and Other Uses 729432176 15J312559 14~222708 282189J21 1720952662 2027362791 2625652526
Unreserved Fund Balance General Fund Unreserved Fund Balance 2,506,776 524,381 2,739,916 2,064,649 3,338,314 5,474,396 4,705,637 Special Revenue Fund Unreserved Fund Balance 1,961,861 2,813,391 5,800,561 10,633,987 3,736,655 3,572,419 8,426,371
Total 4,468,637 3,337,772 8,540,477 12,698,636 7,074,969 9,046,815 13,132,008
AS A PERCENT OF TOTAL CURRENT EXPENDITURES 70.9% 32.2% 77.1% 61.1% 55.1% 53.1% 69.3%

Table 2 Classification of County Revenues
For the Year Ended December 31, 1999
MOWER MURRAY NICOLLET NOBLES NORMAN OLMSTED OTTERTAIL
Population ( 1999 Estimate) 37,583 9,544 30,464 19,920 7,637 121,452 55,192 Net Taxable Tax Capacity 17,707,036 6,998,236 16,386,415 12,237,220 4,905,464 71,576,679 31,477,146 1998 Tax Levy (Payable 1999) 8,031,457 3,116,694 7,369,527 4,359,374 2,568,213 34,428,763 12,869,066
REVENUES
Taxes 8,186,028 3,151,696 7,358,988 4,519,734 2,622,582 34,818,562 13,418,029 Special Assessments 341,832 398,766 461,661 89,476 619,573 -- 15,210 Licenses and Permits 41,325 17,135 2,412 11,585 532 1,289,702 136,575 Intergovernmental Revenues
Federal Grants Highways -- -- 68,426 Human Services 1,143,312 851,941 652,439 288,290 5,372,632 2,494,889 Disaster 20,620 6,171 118,442 4,191 55,016 21,906 44,811 All Other 345,679 63,235 113,732 42,565 11,847 1,418,825 449,869
Total Federal Grants 1,509,611 69,406 1,084,115 699,195 355,153 6,813,363 3,057,995 State Grants
HACA 1,999,635 779,022 1,529,576 1,064,947 636,947 6,041,758 2,823,542 Manufactured Home HACA -- 2,052 24,058 4,386 2,372 -- 36,076 Local Performance Aid -- 11,297 35,173 24,145 9,193 -- 63,574 Attached Machinery Aid 49,748 Disparity Reduction Aid 293,684 46,304 16,295 86,548 18,438 19,244 18,250 Highways 2,767,362 3,412,559 2,983,265 3,029,630 2,311,204 3,831,181 9,380,832
vJ Human Services 3,786,785 645 1,993,189 2,632,955 713,939 15,005,865 5,443,242 0 Criminal Justice Aid 199,599 37,588 141,846 98,334 29,618 -- 257,900 PERA Aid 40,232 11,609 -- 28,842 26,366 -- 64,946 Police Aid 20,009 -- 45,536 All Other 1,378,518 478,514 841,523 273,441 213,597 5,054,300 1,617,523
Total State Grants 10,515,563 4,799,599 7,564,925 7,288,764 3,961,674 29,952,348 19,705,885
Local Units Grants 9,584 76,538 -- 720,315 10,036
Total Intergovernmental Revenues 12,034,758 4,945,543 8,649,040 7,987,959 4,316,827 37,486,026 22,773,916
Charges for Services 2,652,585 272,145 1,658,837 571,977 313,024 10,382,850 2,904,220 Fines and Forfeits 198,706 77,712 194,303 143,454 20,177 628,505 336,820 Interest Earnings 186,658 354,763 758,246 515,119 178,566 2,320,726 325,303 All Other Revenues 501,518 366,111 1,096,943 1,379,842 206,858 825,464 845,874
Total Revenues 24,143,410 9,583,871 20,180,430 15,219,146 8,278,139 87,751,835 40,755,947
Other Financing Sources Borrowing
Bonds Issued 297,042 3,937,131 8,152,502 Other Long-term Debt
Total Borrowing -- 297,042 3,937,131 8,152,502
Other Sources Transfers From - Enterprise Funds -- -- 374,220
- Governmental Funds 198,260 216,747 550,000 29,594 264,011 1,063,804
Total Revenues and Other Sources 24,341,670 10,097,660 24,667,561 23,401,242 8,278,139 88J90,066 41,819,751

Table 3 Classification of County Expenditures
For the Year Ended December 31, 1999
EXPENDITURES MOWER MURRAY NICOLLET NOBLES NORMAN OLMSTED OTTERTAIL
General Government - Current Expenditures 3,636,820 1,444,848 3,818,094 2,482,309 1,032,240 10,665,024 7,299,191 - Capital Outlay -- -- -- -- -- --
Total General Government 3,636,820 1,444,848 3,818,094 2,482,309 1,032,240 10,665,024 7,299,191 Public Safety - Sheriff 1,714,520 617,134 916,860 771,801 466,877 5,762,408 2,685,364
- Corrections 977,467 41,630 530,105 526,730 105,703 9,429,763 2,172,239 -All Other 202,677 39,725 2,728,429 127,316 35,242 4,524,042 161,289 - Capital Outlay -- -- 76,954 -- --Total Public Safety 2,894,664 698,489 4,175,394 1,502,801 607,822 19,716,213 5,018,892
Streets and Highways - Administration 393,802 136,434 158,051 221,405 214,058 918,169 254,886 - Maintenance 3,561,174 1,603,692 1,368,442 1,512,683 1,704,896 4,375,799 3,465,280 - Construction 1,847,325 2,725,436 2,642,321 2,645,383 1,439,502 5,977,441 7,334,507 - Other Capital Outlay -- -- -- -- --
Total Streets and Highways 5,802,301 4,465,562 4,168,814 4,379,471 3,358,456 11,271,409 11,054,673 Sanitation - Current Expenditures 441,462 174,375 534,153 460,295 329,774 500,835
- Capital Outlay -- -- -- --Total Sanitation 441,462 174,375 534,153 460,295 329,774 500,835
Human Services - Income Maintenance 1,577,890 -- 1,099,228 1,217,115 490,047 5,839,514 2,392,628 - Social Services 6,709,535 -- 4,450,581 3,731,857 1,315,620 29,413,244 10,949,430 -All Other 429,634 978,656 -- - 23,566 321,392 - Capital Outlay 101,931 -- --
Total Human Services 8,818,990 978,656 5,549,809 4,948,972 1,829,233 35,574,150 13,342,058 Health - Current Expenditures 1,500,311 214,374 601,838 126,449 97,048 5,213,726 2,374,375
- Capital Outlay -- -- -- --Total Health 1,500,311 214,374 601,838 126,449 97,048 5,213,726 2,374,375
Culture and Recreation Libraries - Current Expenditures 229,909 53,077 105,158 362,975 73,027 704,671 219,614
v.) - Capital Outlay -- -- --I--" Parks and Recreation - Current Expenditures 219,076 196,545 98,673 316,269 10,422 1,331,785 146,748
- Capital Outlay -- -- -- -- --Total Culture and Recreation 448,985 249,622 203,831 679,244 83,449 2,036,456 366,362
Conservation of Natural Resources - Current Expenditures 594,228 953,411 578,223 340,906 534,640 737,847 368,808 - Capital Outlay -- -- -- --
Total Conservation of Natural Resources 594,228 953,411 578,223 340,906 534,640 737,847 368,808
Economic Development - Current Expenditures 163,410 32,995 87,841 46,512 1,865 74,215 129,017 - Capital Outlay -- -- -- --
Total Economic Development 163,410 32,995 87,841 46,512 1,865 74,215 129,017 All Other - Current Expenditures 360,680 91,415 1,690,777 63,881 204,462 937,205 478,544
- Capital Outlay -- -- -- -- -- --Total All Other 360,680 91,415 1,690,771 63,881 204,462 93/,205 4/8,544
Debt Service - Principal Paid on Bonds 10,000 105,000 485,000 160,000 395,000 495,000 - Other Long-term Debt 40,000 -- 20,000 13,239 24,762 41,745 - Interest and Fiscal Charges 5,356 55,505 134,894 28,934 255,552 158,835
Total Current Expenditures 22,712,595 6,578,311 18,766,453 12,308,503 6,639,487 80,248,804 33,598,248 Total Capital Outlay 1,949,256 2,725,436 2,642,321 2,722,337 1,439,502 5,977,441 7,334,507 Total Debt Service 55,356 160,505 639,894 -- 202,173 675,314 695,580
Total Expenditures 24,717,207 9,464,252 22,048,668 15,030,840 8,281,162 86,901,559 41,628,335
Other Financing Uses Debt Redemption - Refimded Bonds Other Uses Transfers To - Enterprise Funds -- 10,377 -- -- 557,495
- Governmental Funds 198,260 216,747 550,000 29,594 264,011 1,063,804
Total Expenditures and Other Uses 2429152467 926912376 2225982668 1520602434 822812162 8727232065 4226922139
Unreserved Fund Balance General Fund Umeserved Fund Balance 19,759,773 2,855,495 10,494,413 5,056,324 1,056,449 10,662,759 9,651,350 Special Revenue Fund Umeserved Fund Balance 12,812,564 2,085,892 3,990,017 3,499,382 2,316,946 12,047,126 8,424,050
Total 32,572,337 4,941,387 14,484,430 8,555,706 3 373,395 22,709,885 18,075,400
AS A PERCENT OF TOTAL CURRENT EXPENDrruRES 143.4% 75.1% 77.2% 69.5% 50.8% 28.3% 53.8%

Table 2 Classification of County Revenues
For the Year Ended December 31, 1999
PENNINGTON PINE PIPESTONE POLK POPE RAMSEY REDLAKE
Population ( 1999 Estimate) 13,606 24,496 10,343 32,004 10,980 497,919 4,384 Net Taxable Tax Capacity 4,892,506 11,529,041 4,988,898 17,413,501 5,845,739 343,937,821 2,004,162 1998 Tax Levy (Payable 1999) 3,688,392 6,435,865 3,230,390 10,130,500 2,941,732 128,051,633 1,142,757
REVENUES
Taxes 3,826,726 6,979,769 3,339,973 9,827,928 3,037,834 171,599,658 1,170,981 Special Assessments 392,096 71,580 2,949,849 244,982 107 34,176 Licenses and Permits 2,903 54,994 3,905 26,457 21,401 1,075,547 1,320 Intergovernmental Revenues
Federal Grants Highways -- 138,338 128 3,297,332 Human Services 372,871 1,024,594 298,927 1,754,292 241,186 24,785,533 128,584 Disaster 69,794 4,510 4,000 59,459 4,441 58,132 21,511 All Other 41,724 451,233 22,310 322,671 92,464 5,600,086 6,525
Total Federal Grants 484,389 1,618,675 325,237 2,136,550 338,091 33,741,083 156,620 State Grants
HACA 667,128 1,155,489 690,236 1,494,662 710,380 12,689,398 363,320 Manufactured Home HACA 17,872 3,148 20,381 6,566 -- 2,728 Local Performance Aid 16,019 27,681 12,239 38,510 12,876 583,882 5,231 Attached Machinery Aid -- 65,167 Disparity Reduction Aid 111,221 1,457 100,021 414,762 26,896 384,067 105,135 Highways 2,689,607 4,379,427 2,604,530 4,840,428 3,034,414 9,907,892 3,744,526
VJ Human Services 1,761,080 2,892,009 726,152 5,811,499 1,077,343 77,849,973 329,072 N Criminal Justice Aid 79,185 161,064 45,944 152,582 43,518 -- 17,821 PERA Aid 16,384 36,546 14,804 43,269 17,671 722,907 8,965 Police Aid 33,433 95,769 7,052 22,939 -- 29,750 All Other 658,176 842,351 230,325 690,567 429,357 30,853,047 185,517
Total State Grants 6,050,105 9,591,793 4,434,451 13,571,827 5,381,960 132,991,166 4,792,065
Local Units Grants -- 8,619 578,382 6,147,684
Total Intergovernmental Revenues 6,534,494 11,210,468 4,768,307 15,708,377 6,298,433 172,879,933 4,948,685
Charges for Services 1,059,687 1,760,459 321,709 1,689,063 824,695 35,733,010 655,306 Fines and Forfeits 65,113 239,470 110,666 206,081 34,886 3,739,148 23,173 Interest Earnings 173,661 130,210 369,507 643,951 410,184 2,055,931 144,428 All Other Revenues 681,606 1,216,437 386,600 1,850,607 256,705 19,528,890 243,806
Total Revenues 12,736,286 21,591,807 9,372,247 32,902,313 11,129,120 406,612,224 7,221,875
Other Financing Sources Borrowing
Bonds Issued -- 610,000 5,485,000 Other Long-term Debt 95,741 -- 610,379 9,283
Total Borrowing 95,741 -- - 1,220,379 -- 5,494,283
Other Sources Transfers From - Enterprise Funds
- Governmental Funds 100,221 -- -- 118,117 1,882,503
Total Revenues and Other Sources 12,832,027 21,692,028 9J72,247 34,122,692 11,247,237 413~89,010 7,221,875

Table 3 Classification of County Expenditures
For the Year Ended December 31, 1999
EXPENDITURES PENNINGTON PINE PIPESTONE POLK POPE RAMSEY REDLAKE
General Government - Current Expenditures 2,042,418 3,027,896 1,365,932 3,892,532 1,631,073 74,021,812 672,419 - Capital Outlay -- -- -- -- 418,322 --
Total General Government 2,042,418 3,027,896 1,365,932 3,892,532 1,631,073 74,440,134 672,419 Public Safety - Sheriff 1,403,909 2,504,583 406,628 1,428,136 729,857 26,387,769 535,605
- Corrections 190,480 1,032,004 264,827 1,068,284 219,883 41,079,623 56,264 -All Other 12,916 166,509 56,521 412,000 14,171 1,577,590 13,136 - Capital Outlay -- -- -- -- -- 16,160,566 --Total Public Safety 1,607,305 3,703,096 727,976 2,908,420 963,911 85,205,548 605,005
Streets and Highways - Adnrin.istration 372,091 447,491 123,138 268,415 223,650 2,818,270 142,176 - Maintenance 1,505,366 2,231,377 1,144,792 2,844,375 1,256,993 7,583,940 1,080,431 - Construction 1,873,715 3,288,430 1,810,019 3,676,227 3,362,650 9,866,565 2,375,335 - Other Capital Outlay 1,063,317 - -- -- -- --
Total Streets and Highways 4,814,489 5,967,298 3,077,949 6,789,017 4,843,293 20,268,775 3,597,942 Sanitation - Current Expenditures 60,774 201,584 137,829 1,689,056 267,324 9,564,774 114,186
- Capital Outlay -- -- -- --Total Sanitation 60,774 201,584 137,829 1,689,056 267,324 9,564,774 114,186
Human Services - Income Maintenance 903,766 1,801,806 585,503 2,599,984 665,133 27,228,685 329,709 - Social Services 3,299,255 4,762,221 1,545,572 8,727,037 1,587,275 139,307,617 573,906 -All Other -- 50,307 -- -- 165,430 47,882 - Capital Outlay -- -- -- 2,987,086 --
Total Human Services 4,203,021 6,614,334 2,131,075 11,327,021 2,252,408 169,688,818 951,497 Health - Current Expenditures 39,728 1,082,982 107,713 111,807 638,224 21,045,036 63,000
- Capital Outlay -- -- -- --Total Health 39,728 1,082,982 107,713 111,807 638,224 21,045,036 63,000
Culture and Recreation Libraries - Current Expenditures 49,589 155,797 34,132 - 180,381 48,380 6,764,478 34,937
vJ - Capital Outlay -- -- -- 63,252 --vJ Parks and Recreation - Current Expenditures 43,280 101,550 143,354 183,906 86,890 8,197,873 27,522
- Capital Outlay -- -- -- 4,727,191 --Total Culture and Recreation 92,869 257,347 177,486 364,287 135,270 19,752,794 62,459
Conservation of Natural Resources - Current Expenditures 800,691 773,388 240,153 2,283,383 360,083 626,434 341,887 - Capital Outlay -- -- -- -- -- --
Total Conservation of Natural Resources 800,691 773,388 240,153 2,283,383 360,083 626,434 341,887 Economic Development - Current Expenditures 44,514 12,313 -- 55,078 46,690 5,956,088 16,822
- Capital Outlay -- -- --Total Economic Development 44,514 12,313 -- 55,078 46,690 5,956,088 16,822
All Other - Current Expenditures 123,232 55,824 268,209 11,096 44,777 85,948 - Capital Outlay -- -- -- 537,160 1,500,771 --
Total All Other 123,232 55,824 268,209 548,256 1,545,548 85,948
Debt Service - Principal Paid on Bonds 130,000 -- 295,000 1,386,000 108,750 53,488,094 300,000 - Other Long-term Debt 37,432 224,250 19,701 341,700 52,330 88,103 --- Interest and Fiscal Charges 156,073 79,554 44,586 786,188 45,477 8,189,594 27,518
Total Current Expenditures 10,892,009 18,351,808 6,211,918 26,012,583 7,786,722 372,370,196 4,135,830 Total Capital Outlay 2,937,032 3,288,430 1,810,019 3,676,227 3,899,810 35,723,753 2,375,335 Total Debt Service 323,505 303,804 359,287 2,513,888 206,557 61,765,791 327,518
Total Expenditures 14,152,546 21,944,042 8,381,224 32,202,698 11,893,089 469,859,740 6,838,683
Other Financing Uses Debt Redemption - Refimded Bonds Other Uses Transfers To - Enterprise Funds -- -- 225,751 - 430,794
- Governmental Funds 100,221 -- -- 118,117 1,882,503
Total Expenditures and Other Uses 14l152l546 22l0442263 8!606l975 32!202i698 12l011l206 472l173l037 6l838l683
Unreserved Fund Balance General Fund Unreserved Fund Balance 2,060,585 1,561,591 4,138,488 2,677,084 3,703,409 127,207,768 2,496,559 Special Revenue Fund Unreserved Fund Balance 1,282,685 4,363,647 3,260,220 6,313,813 1,552,988 25,901,004 1,837,314
Total 3,343,270 5,925,238 7,398,708 8,990,897 5,256,397 153,108,772 4,333,873
AS A PERCENT OF TOTAL CURRENT EXPENDITURES 30.7% 32.3% 119.1% 34.6% 67.5% 41.1% 104.8%

Table2 Classification of County Revenues
For the Year Ended December 31, 1999
REDWOOD RENVILLE RICE ROCK ROSEAU SCOTT SHERBURNE
Population ( 1999 Estimate) 17,193 17,412 54,888 9,801 16,314 81,534 63,182 Net Taxable Tax Capacity 11,497,793 13,734,646 27,908,632 6,224,219 6,992,170 59,995,051 56,503,849 1998 Tax Levy (Payable 1999) 5,427,135 5,157,858 9,862,497 2,424,147 2,911,919 21,167,466 17,073,213
REVENUES
Taxes 5,549,075 5,417,780 10,183,171 2,487,329 3,219,317 24,356,667 17,662,803 Special Assessments 613,986 837,526 480,999 203,535 846,440 7,316 43,035 Licenses and Permits 62,780 27,906 321,599 10,473 2,760 1,151,524 676,808 Intergovernmental Revenues
Federal Grants Highways Human Services 469,182 822,970 1,218,988 215,814 291,679 1,390,318 1,043,670 Disaster 37,649 1,280,454 10,061 -- 110,647 112,211 10,831 All Other 181,998 105,252 1,173,731 82,902 302,963 446,229 6,805,588
Total Federal Grants 688,829 2,208,676 2,402,780 298,716 705,289 1,948,758 7,860,089 State Grants
HACA 1,121,571 938,149 1,570,670 608,120 631,183 4,781,048 1,286,246 Manufactured Home HACA 3,989 4,256 27,318 2,511 24,900 45,416 25,224 Local Performance Aid 20,299 50,501 11,697 19,160 88,047 66,534 Attached Machinery Aid -- -- -- 76,204 Disparity Reduction Aid 53,651 46,179 43,143 23,969 2,584 10,775 6,446 Highways 2,955,307 4,067,628 2,881,999 2,724,249 3,478,709 4,378,874 2,073,402
w Human Services 1,395,652 1,669,056 3,414,736 789,235 874,118 4,221,415 3,515,319 .i:::,. Criminal Justice Aid 83,529 315,491 40,346 78,941 383,473 272,351 PERA Aid 27,659 40,045 62,815 15,088 16,974 108,521 63,819
Police Aid 42,902 -- 50,074 42,121 -- 205,655 All Other 479,550 915,596 2,288,689 341,109 401,348 3,001,631 1,646,522
Total State Grants 6,184,109 7,680,909 10,655,362 4,606,398 5,570,038 17,095,404 9,161,518
Local Units Grants 4,563 25,500 58,126 21,023 2,384,552 67,033
Total Intergovernmental Revenues 6,877,501 9,915,085 13,116,268 4,926,137 6,275,327 21,428,714 17,088,640
Charges for Services 1,037,029 1,878,463 4,040,556 534,083 1,000,222 5,109,141 5,331,253 Fines and Forfeits 120,876 20,908 442,536 98,292 76,777 502,564 715,906
Interest Earnings 494,615 828,577 844,304 218,715 379,892 12,630 1,364,995
All Other Revenues 378,482 1,877,922 1,725,439 263,280 525,036 1,002,229 1,174,161
Total Revenues 15,134,344 20,804,167 31,154,872 8,741,844 12,325,771 53,570,785 44,057,601
Other Financing Sources Borrowing
Bonds Issued -- 3,660,000 -- 1,036,001 5,065,000
Other Long-term Debt
Total Borrowing -- 3,660,000 - -- -- 1,036,001 5,065,000
Other Sources Transfers From - Enterprise Funds
- Governmental Funds 100,000 254,252 986,890 122,125 20,000 2,067,210 266,404
Total Revenues and Other Sources 15,234,344 24,718,419 32,141,762 8,863,969 12,345,771 56,673,996 49,389,005

Table 3 Classification of County Expenditures
For the Year Ended December 31, 1999
EXPENDITURES REDWOOD RENVILLE RICE ROCK ROSEAU SCOTT SHERBURNE
General Government - Current Expenditures 2,218,432 3,301,069 4,817,897 1,311,098 1,303,497 13,892,312 7,094,191 - Capital Outlay 34,749 -- -- -- 4,983,075 --
Total General Government 2,218,432 3,335,818 4,817,897 1,311,098 1,303,497 18,875,387 7,094,191 Public Safety - Sheriff 1,271,829 918,941 2,132,337 783,596 765,041 1,454,340 3,091,172
- Corrections 202,771 100,355 2,652,928 25,963 318,104 5,205,527 2,953,770 -All Other 6,771 40,892 76,887 6,822 30,520 1,191,389 852,650 - Capital Outlay -- -- -- -- -- 8,031,931 Total Public Safety 1,481,371 1,060,188 4,862,152 816,381 1,113,665 7,851,256 14,929,523
Streets and Highways - Administration 231,624 184,530 124,292 147,702 273,957 772,733 790,170 - Maintenance 1,979,814 3,116,885 2,028,133 1,092,243 1,780,745 2,510,754 1,323,949 - Construction 2,437,981 2,421,516 2,600,778 2,234,675 2,851,860 8,719,425 3,177,219 - Other Capital Outlay -- -- -- --
Total Streets and Highways 4,649,419 5,722,931 4,753,203 3,474,620 4,906,562 12,002,912 5,291,338 Sanitation - Current Expenditures 236,553 276,207 1,755,876 606,844 663,668 691,266
- Capital Outlay 564,061 -- --Total Sanitation 236,553 840,268 1,755,876 606,844 663,668 691,266
Human Services - Income Maintenance . 1,000,671 1,694,122 1,715,513 518,385 526,989 3,683,158 2,094,280 - Social Services 3,244,733 3,426,101 6,152,866 1,656,576 1,465,853 7,962,138 7,186,654 -All Other -- -- 28,520 326,074 487,662 - Capital Outlay -- -- -- -- --
Total Human Services 4,245,404 5,120,223 7,868,379 2,174,961 2,021,362 11,971,370 9,768,596 Health - Current Expenditures 1,116,657 1,016,184 2,085,343 66,176 -- 1,637,450 1,028,184
- Capital Outlay 6,292 -- --Total Health 1,116,657 1,022,476 2,085,343 66,176 -- 1,637,450 1,028,184
Culture and Recreation Libraries - Current Expenditures 80,916 97,779 297,631 92,352 74,358 1,303,393 757,367
l;.) - Capital Outlay -- -- -- --Vl Parks and Recreation - Current Expenditures 90,312 143,458 210,084 316,756 95,511 489,937 252,373
- Capital Outlay -- -- -- -- -- --Total Culture and Recreation 171,228 241,237 507,715 409,108 169,869 1,793,330 1,009,740
Conservation of Natural Resources - Current Expenditures 756,358 3,278,663 333,138 287,802 694,361 353,587 601,524 - Capital Outlay -- -- -- -- --
Total Conservation of Natural Resources 756,358 3,278,663 333,138 287,802 694,361 353,587 601,524 Economic Development - Current Expenditures 25,886 52,932 965,399 2,900 19,800 672,158 45,967
- Capital Outlay -- 50,600 -- -- --Total Economic Development 25,886 52,932 1,015,999 2,900 19,800 672,158 45,967
All Other - Current Expenditures 1,403 646,458 -- -- 152,155 -- 671,893 - Capital Outlay 238,578 249,355 -- 1,175,109 --
Total All Other 1,403 885,036 249,355 -- 152,155 1,175,109 671,893
Debt Service - Principal Paid on Bonds -- -- 930,000 -- 580,000 170,000 - Other Long-term Debt -- -- 219,000 6,541 62,683 492,506 380,000 - Interest and Fiscal Charges 5,341 15,681 406,516 -- 9,985 1,083,762 482,084
Total Current Expenditures 12,464,730 18,294,576 25,348,324 6,915,215 8,193,079 41,454,950 29,923,072 Total Capital Outlay 2,437,981 3,265,196 2,900,733 2,234,675 2,851,860 14,877,609 11,209,150 Total Debt Service 5,341 15,681 1,555,516 6,541 72,668 2,156,268 1,032,084
Total Expenditures 14,908,052 21,575,453 29,804,573 9,156,431 11,117,607 58,488,827 42,164,306
Other Financing Uses Debt Redemption - Refimded Bonds Other Uses Transfers To - Enterprise Funds
- Governmental Funds 100,000 254,252 986,890 122,125 20,000 2,067,210 266,404
Total Expenditures and Other Uses 15:008:052 21:829:705 30:791:463 9:278:556 11:137:607 60:556:037 42:430:710
Unreserved Fund Balance General Fund Umeserved Fund Balance 3,530,397 2,524,711 7,248,616 2,220,321 3,044,609 15,537,935 7,728,824 Special Revenue Fund Umeserved Fund Balance 4,470,635 8,719,935 8,586,584 3,011,810 3,252,237 19,471,712 9,701,313
Total 8,001,032 11,244,646 15,835,200 5,232,131 6,296,846 35,009,647 17,430,137
AS A PERCENT OF TOTAL CURRENT EXPENDITURES 64.2% 61.5% 62.5% 75.7% 76.9% 84.5% 58.2%

Table2 Classification of County Revenues
For the Year Ended December 31, 1999
SIBLEY STEARNS STEELE STEVENS ST.LOUIS SWIFT TODD
Population ( 1999 Estimate) 14,997 133,977 32,965 10,535 199,080 11,338 24,191 Net Taxable Tax Capacity 8,415,194 65,428,572 20,602,834 5,658,032 87,026,032 5,923,721 7,450,253 1998 Tax Levy (Payable 1999) 4,681,283 27,016,752 7,534,086 2,689,524 58,854,331 3,429,002 5,869,102
REVENUES
Taxes 4,789,919 28,453,843 7,688,793 2,793,165 75,757,841 3,510,195 6,172,933 Special Assessments 475,664 264,121 129,301 230,116 689,707 9,142 Licenses and Permits 22,417 435,780 81,564 2,547 160,899 4,305 103,651 Intergovernmental Revenues
Federal Grants Highways 256,036 701,883 178,124 Human Services 328,648 3,379,469 686,304 220,031 10,418,012 273,590 1,691,552 Disaster 4,000 15,696 4,057 4,000 1,156,972 3,160 4,000 All Other 195,085 988,268 181,705 7,200 6,039,875 16,605 266,721
Total Federal Grants 783,769 5,085,316 1,050,190 231,231 17,614,859 293,355 1,962,273 State Grants
HACA 1,045,757 4,997,292 1,241,107 928,507 9,969,410 812,171 1,704,270 Manufactured Home HACA 6,843 59,067 15,275 2,912 98,348 4,439 29,940 Local Performance Aid 17,505 153,269 37,938 12,553 234,122 Attached Machinery Aid 46,227 Disparity Reduction Aid 66,475 62,657 36,863 65,909 6,480,600 83,163 82,323 Highways 3,211,902 8,485,115 3,004,671 1,984,640 17,450,835 3,026,704 3,994,561
v.) Human Services 1,164,323 9,744,861 2,629,353 1,135,830 31,063,164 1,163,111 2,731,143 O',
Criminal Justice Aid 47,297 744,935 -- 46,270 1,143,157 PERA Aid 25,016 145,954 -- 36,884 385,162 Police Aid 252,139 -- 548,194 All Other 865,881 4,913,422 1,208,576 308,905 2,408,094 328,845 1,040,631
Total State Grants 6,450,999 29,604,938 8,173,783 4,522,410 69,781,086 5,418,433 9,582,868
Local Units Grants 70,000 -- 412,924
Total Intergovernmental Revenues 7,234,768 34,760,254 9,223,973 4,753,641 87,808,869 5,711,788 11,545,141
Charges for Services 1,261,213 3,199,020 2,200,459 258,304 8,191,021 728,411 1,743,411
Fines and Forfeits 91,917 995,886 215,835 1,518,384 300 198,522
Interest Earnings 178,510 1,466,257 891,189 304,075 4,294,946 257,560 371,819
All Other Revenues 166,825 3,026,838 1,027,224 246,980 9,207,218 653,400 1,470,856
Total Revenues 14,221,233 72,601,999 21,458,338 8,588,828 186,939,178 11,555,666 21,615,475
Other Financing Sources Borrowing
Bonds Issued Other Long-term Debt 350,000 2,670,000 3,805,129 4,021,046
Total Borrowing 350,000 2,670,000 3,805,129 -- 4,021,046
Other Sources 105,931 Transfers From - Enterprise Funds 2,703
- Governmental Funds 191,649 1,986,536 2,129,025 342,771 -- 436,511
Total Revenues and Other Sources 14,762,882 77,367,169 27J92,492 8,588,828 191,302~95 11,555,666 22,051,986

Table 3 Classification of County Expenditures
For the Year Ended December 31, 1999
EXPENDITURES SIBLEY STEARNS STEELE STEVENS ST.LOUIS SWIFT TODD
General Government - Current Expenditures 2,037,467 11,910,932 3,532,118 1,087,973 24,329,721 1,191,072 3,073,156 - Capital Outlay -- -- 882,805
Total General Government 2,037,467 11,910,932 3,532,118 1,087,973 25,212,526 1,191,072 3,073,156 Public Safety - Sheriff 1,102,410 4,502,143 2,219,732 712,240 11,334,763 908,728 1,308,151
- Corrections 212,810 6,291,285 425,994 55,426 13,661,862 41,243 631,411 -All Other 39,130 163,552 122,370 23,692 1,287,505 4,022 9,506 - Capital Outlay 148,448 -- 655,788 -- 519,850 --Total Public Safety 1,502,798 10,956,980 3,423,884 791,358 26,803,980 953,993 1,949,068
Streets and Highways - Administration 155,548 506,721 193,178 178,247 4,183,987 163,561 270,804 - Maintenance 1,246,465 4,010,703 1,604,327 1,363,641 19,559,513 2,020,833 1,959,845 - Construction 3,115,459 8,169,547 3,242,217 1,431,392 15,303,814 2,200,568 3,335,172 - Other Capital Outlay 100,000 -- -- 2,803,422
Total Streets and Highways 4,617,472 12,686,971 5,039,722 2,973,280 41,850,736 4,384,962 5,565,821 Sanitation - Current Expenditures 176,951 222,406 486,681 194,687 -- 605,750
- Capital Outlay -- -- -- --Total Sanitation 176,951 222,406 486,681 194,687 -- 605,750
Human Services - Income Maintenance 669,312 1,326,362 429,368 11,400,580 677,687 2,607,686 - Social Services 2,476,689 -- 4,438,475 2,133,526 47,153,816 2,309,638 4,770,678 -All Other -- 27,001,945 -- -- 6,914,603 57,498 - Capital Outlay -- -- -- 156,146
Total Human Services 3,146,001 27,001,945 5,764,837 2,562,894 65,625,145 2,987,325 7,435,862 Health - Current Expenditures 966,350 759,164 135,816 5,778,632 242,687 1,462,737
- Capital Outlay -- -- -- 18,254 --Total Health 966,350 -- 759,164 135,816 5,796,886 242,687 1,462,737
Culture and Recreation Libraries - Current Expenditures 200,601 854,252 -- 44,094 368,837 54,558 220,846
l>J - Capital Outlay -- -- -- -- ---.....l Parks and Recreation - Current Expenditures 26,965 997,277 168,014 59,868 1,125,715 47,137 174,277
- Capital Outlay -- 1,375,000 -- --Total Culture and Recreation 227,566 1,851,529 1,543,014 103,962 1,494,552 101,695 395,123
Conservation of Natural Resources - Current Expenditures 714,930 1,690,119 477,156 325,057 8,244,016 668,733 310,461 - Capital Outlay -- -- 403,277
Total Conservation of Natural Resources 714,930 1,690,119 477,156 325,057 8,647,293 668,733 310,461
Economic Development - Current Expenditures 202,544 1,370,684 -- 92,539 4,169,249 87,935 292,608 - Capital Outlay -- -- -- --
Total Economic Development 202,544 1,370,684 92,539 4,169,249 87,935 292,608
All Other - Current Expenditures 373,544 16,799 1,078,194 140,647 -- 310,938 246,375 - Capital Outlay -- 2,776,632 -- 743,003
Total All Other 373,544 2,793,431 1,0/8,194 140,64-7 310,938 989,378
Debt Service - Principal Paid on Bonds 165,000 1,720,000 235,000 55,000 100,000 285,000 185,000 - Other Long-term Debt 140,000 1,538,000 2,041,398 5,156 1,583,327 13,260 126,998 - Interest and Fiscal Charges 170,382 1,462,353 744,809 40,265 1,048,423 126,913 68,436
Total Current Expenditures 10,601,716 59,538,818 16,831,765 6,976,821 159,512,799 9,334,522 17,396,039 Total Capital Outlay 3,363,907 10,946,179 5,273,005 1,431,392 20,087,568 2,200,568 4,078,175 Total Debt Service 475,382 4,720,353 3,021,207 100,421 2,731,750 425,173 380,434
Total Expenditures 14,441,005 75,205,350 25,125,977 8,508,634 182,332,117 11,960,263 21,854,648
Other Financing Uses Debt Redemption - Refunded Bonds Other Uses Transfers To - Enterprise Funds -- -- 72,942 279,950
- Governmental Funds 191,649 1,986,536 2,129,025 -- 342,771 436,511
Total Expenditures and Other Uses 14!632!654 7721912886 27!255!002 825812576 182!9542838 112960!263 22i2912159
Unreserved Fund Balance General Fund Unreserved Fund Balance 1,852,718 5,878,003 5,709,534 2,613,348 21,206,438 2,561,779 2,247,420 Special Revenue Fund Unreserved Fund Balance 3,464,675 7,359,953 1,827,559 3,098,475 20,224,550 3,151,809 5,539,184
Total 5,317,393 13,237,956 7,537,093 5,711,823 41,430,988 5,713,588 7,786,604
AS A PERCENT OF TOTAL CURRENT EXPENDITURES 50.2% 22.2% 44.8% 81.9% 26.0% 61.2% 44.8%

Table 2 Classification of County Revenues
For the Year Ended December 31, 1999
TRAVERSE WABASHA WADENA WASECA WASHINGTON WATONWAN WILKIN
Population ( 1999 Estimate) 4,212 21,118 13,398 19,403 198,606 11,643 7,319 Net Taxable Tax Capacity 4,276,736 10,028,938 4,264,880 10,575,618 153,451,858 6,741,958 6,115,598 1998 Tax Levy (Payable 1999) 1,838,936 5,591,390 3,530,845 5,394,577 40,437,421 3,975,573 2,739,165
REVENUES
Taxes 1,883,169 5,867,115 3,737,614 5,388,264 47,427,984 4,013,648 2,768,909 Special Assessments 6,532 174,589 222,095 232,240 206,207 Licenses and Permits 18,537 129,078 29,299 18,766 2,059,071 11,897 3,779 Intergovernmental Revenues
Federal Grants Highways -- 1,255,906 2,363,686 282,880 Human Services 183,620 417,739 804,629 500,648 3,408,694 318,622 216,873 Disaster -- 4,129 8,429 5,117 24,623 4,000 76,791 All Other 11,592 219,566 191,956 98,170 1,688,722 158,811 79,419
Total Federal Grants 195,212 641,434 1,005,014 1,859,841 7,485,725 764,313 373,083 State Grants
HACA 496,318 995,346 484,828 1,370,877 7,812,576 942,315 839,782 Manufactured Home HACA 1,267 15,332 -- 57,603 6,087 6,721 Local Performance Aid 5,084 24,323 15,734 21,863 200,061 13,792 8,658 Attached Machinery Aid -- -- -- 100,513 Disparity Reduction Aid 21,747 38,890 63,154 15,644 11,254 6,000 21,340 Highways 2,711,401 3,327,244 2,518,592 2,360,353 7,508,465 1,816,093 3,345,234
v.) Human Services 540,296 1,148,732 2,237,969 1,318,732 10,335,481 1,304,590 646,974 00 Criminal Justice Aid 15,789 95,070 -- 87,699 956,542 56,631 40,643 PERA Aid 32,964 22,637 -- 25,777 209,656 -- 14,876
Police Aid -- -- 462,531 34,801 All Other 191,538 727,349 508,886 593,218 4,339,824 415,757 369,981
Total State Grants 4,016,404 6,379,591 5,844,495 5,794,163 31,994,506 4,596,066 5,294,209
Local Units Grants -- 2,500 1,927,720
Total Intergovernmental Revenues 4,211,616 7,021,025 6,849,509 7,656,504 41,407,951 5,360,379 5,667,292
Charges for Services 226,909 1,179,640 1,139,543 841,465 13,201,395 890,905 777,551
Fines and Forfeits -- 77,430 92,494 82,639 1,261,551 122,903 75
Interest Earnings 92,810 323,560 154,518 705,735 2,795,804 230,699 273,821
All Other Revenues 388,505 544,590 798,959 502,643 6,213,247 489,641 267,387
Total Revenues 6,828,078 15,142,438 12,976,525 15,418,111 114,367,003 11,352,312 9,965,021
Other Financing Sources Borrowing
Bonds Issued -- 5,672,048
Other Long-term Debt 9,053 -- -- 452,759 105,000 115,111
Total Borrowing 9,053 -- - 5,672,048 452,759 105,000 115,111
Other Sources Transfers From - Enterprise Funds
- Governmental Funds 115,000 76,183 651,602 1,364,178 8,611
Total Revenues and Other Sources 6,837,131 15,257,438 13,052,708 21,741,761 116,183~40 11,465,923 10,080,132

Table·3 Classification. of County Expenditures
For the Year Ended December 31, 1999
EXPENDITURES TRAVERSE WABASHA WADENA WASECA WASHINGTON WATONWAN WILKIN
General Government - Current Expenditures 766,490 2,052,111 1,319,145 2,797,986 24,857,036 1,818,521 1,083,897 - Capital Outlay -- -- -- -- 558,652
Total General Government 766,490 2,052,111 1,319,145 2,797,986 25,415,688 1,818,521 1,083,897 Public Safety - Sheriff 367,629 934,771 664,285 1,430,315 16,450,391 1,084,912 648,905
- Corrections 17,016 829,765 135,203 223,665 6,430,102 235,968 39,174 -All Other 10,015 47,608 19,884 75,309 -- 23,435 13,536 - Capital Outlay - -- -- - -- --Total Public Safety 394,660 1,812,144 819,372 1,729,289 22,880,493 1,344,315 701,615
Streets and Highways - Administration 191,546 322,287 257,873 153,954 1,363,046 265,227 219,421 - Maintenance 1,303,701 1,436,772 1,006,489 1,539,886 4,414,244 1,766,866 1,709,690 - Construction 2,032,393 3,055,980 2,150,848 3,368,517 9,780,682 1,166,217 2,862,681 - Other Capital Outlay -- -- -- --
Total Streets and Highways 3,527,640 4,815,039 3,415,210 5,062,357 15,557,972 3,198,310 4,791,792 Sanitation - Current Expenditures 39,126 280,715 1,017,401 486,322 -- 177,910 181,735
- Capital Outlay -- -- -- -Total Sanitation 39,126 280,715 1,017,401 · 486,322 -- 177,910 181,735
Human Services - Income Maintenance 459,139 727,859 1,086,785 853,585 9,419,792 770,274 517,567 - Social Services 883,408 2,521,124 3,265,826 2,699,052 16,499,184 2,353,570 1,410,657 -All Other -- 12,375 -- -- 1,515,174 - Capital Outlay -- -- -- --
Total Human Services 1,342,547 3,261,358 4,352,611 3,552,637 27,434,150 3,123,844 1,928,224 Health - Current Expenditures 140,934 967,091 876,415 351,571 8,186,887 271,393 633,453
- Capital Outlay -- -- -- --Total Health 140,934 967,091 876,415 351,571 8,186,887 271,393 633,453
Culture and Recreation Libraries - Current Expenditures 22';302 106,247 29,177 185,453 3,773,486 396,489 33,411
(.;.) - Capital Outlay -- -- -- --'-0 Parks and Recreation - Current Expenditures 20,072 313,673 36,897 157,686 1,930,163 42,098 11,000
- Capital Outlay -- -- -- --Total Culture and Recreation 42,374 419,920 66,074 343,139 5,703,649 438,587 44,411
Conservation of Natural Resources - Current Expenditures 230,310 353,772 456,222 338,335 666,777 295,313 388,581 - Capital Outlay -- -- --
Total Conservation of Natural Resources 230,310 353,772 456,222 338,335 666,777 295,313 388,581 Economic Development - Current Expenditures 11,204 65,159 -- 148,153 57,741 82,258 2,355
- Capital Outlay -- -- -- --Total Economic Development 11,204 65,159 -- 148,153 57,741 82,258 2,355
All Other - Current Expenditures 89,292 370,664 695,365 116,639 407,887 125,191 - Capital Outlay -- -- 203,991 -- 775,471 124,496 --
Total All Other 89,292 370,664 899,356 116,639 775,471 532,383 125,191
Debt Service - Principal Paid on Bonds 23,000 -- 1,540,000 19,870,000 85,000 - Other Long-term Debt 18,892 131,235 5,408 2,676,229 90,524 - Interest and Fiscal Charges 24,443 51,556 82 109,479 3,306,229 25,549
Total Current Expenditures 4,552,184 11,341,993 10,866,967 11,557,911 95,564,023 9,992,121 7,018,573 Total Capital Outlay 2,032,393 3,055,980 2,354,839 3,368,517 11,114,805 1,290,713 2,862,681 Total Debt Service 66,335 182,791 5,490 1,649,479 25,852,458 201,073
Total Expenditures 6,650,912 14,580,764 13,227,296 16,575,907 132,531,286 11,282,834 10,082,327
Other Financing Uses Debt Redemption - Refimded Bonds Other Uses Transfers To - Enterprise Funds
- Governmental Funds -- 115,000 76,183 651,602 1,364,178 8,611
Total Expenditures and Other Uses 6!650!912 14!695!764 13!303!479 17!227!509 133!895!464 11!291!445 10!082!327
Unreserved Fund Balance General Fund Unreserved Fund Balance 1,137,718 2,798,315 1,481,762 2,884,772 17,180,670 1,580,746 4,220,684 Special Revenue Fund Unreserved Fund Balance 1,633,159 3,202,362 1,550,569 6,374,285 9,661,298 2,822,882 1,393,779
Total 2,770,877 6,000,677 3,032,331 9,259,057 26,841,968 4,403,628 5,614,463
AS A PERCENT OF TOTAL CURRENT EXPENDITURES 60.9% 52.9% 27.9% 80.1% 28.1% 44.1% 80.0%

Table2 Classification of County Revenues
For the Year Ended December 31, 1999
WINONA WRIGHT YELLOW MEDICINE TOTAL ALL COUNTIES
Population ( 1999 Estimate) 49,576 87,779 11,493 4,838,398 Net Taxable Tax Capacity 22,721,570 57,582,765 6,500,694 3,375,834,603 1998 Tax Levy (Payable 1999) 9,278,262 18,570,952 4,571,659 1,308,852,113
REVENUES
Taxes 9,655,204 19,104,860 4,619,844 1,468,569,966 Special Assessments 102,780 197,166 25,113,461 Licenses and Permits 136,031 656,424 18,760 18,016,649 Intergovernmental Revenues
Federal Grants Highways -- 20,715,556 Human Services 1,279,182 1,695,876 342,839 216,459,252 Disaster 237,129 11,637 159,316 7,114,262 All Other 310,025 214,821 49,170 82,812,590
Total Federal Grants 1,826,336 1,922,334 551,325 327,101,660 State Grants
HACA 1,815,281 2,266,080 928,844 197,327,756 Manufactured Home HACA 84,935 4,497 2,075,054 Local Performance Aid 58,086 96,831 13,661 5,094,214 Attached Machinery Aid -- 2,381,787 Disparity Reduction Aid 84,728 6,993 50,692 13,642,670 Highways 4,063,827 6,862,419 2,765,393 343,358,589
.j::::.. Human Services 4,489,034 5,635,435 1,083,951 423,260,305 0 Criminal Justice Aid 249,684 403,699 52,984 14,286,794 PERA Aid -- 81,912 15,548 4,559,225 Police Aid 54,309 373,437 31,787 5,311,731 All Other 1,397,064 1,795,088 230,534 209,306,311
Total State Grants 12,212,013 17,606,829 5,177,891 1,220,604,436
Local Units Grants 53,984 358,009 23,500 36,324,133
Total Intergovernmental Revenues 14,092,333 19,887,172 5,752,716 1,584,030,229
Charges for Services 3,072,539 5,394,590 167,027 354,659,618 Fines and Forfeits 220,066 707,708 3,105 27,057,529 Interest Earnings 939,761 791,363 510,460 65,144,053 All Other Revenues 604,374 1,626,995 341,346 169,816,585
Total Revenues 28,720,308 48,271,892 11,610,424 3,712,408,090
Other Financing Sources Borrowing
Bonds Issued 3,254,462 154,189,290 Other Long-term Debt -- 31,136,660
Total Borrowing -- -- 3,254,462 - 185,325,950
Other Sources 5,371 11,990 3,141,366 Transfers From - Enterprise Funds -- 3,484,565
- Governmental Funds 78,448 4,915 136,833,297
Total Revenues and Other Sources 28,725,679 48,350J40 14,881,791 4,041,193,268

.j:::..
........
EXPENDITURES
General Government - Current Expenditures - Capital Outlay
Total General Government Public Safety - Sheriff
- Corrections -All Other - Capital Outlay Total Public Safety
Streets and Highways - Administration - Maintenance - Construction - Other Capital Outlay
Total Streets and Highways Sanitation - Current Expenditures
- Capital Outlay Total Sanitation
Hmnan Services - Income Maintenance - Social Services -All Other - Capital Outlay
Total Hmnan Services Health - Current Expenditures
- Capital Outlay Total Health
Culture and Recreation Libraries - Current Expenditures
- Capital Outlay Parks and Recreation - Current Expenditures
- Capital Outlay Total Culture and Recreation
Conservation of Natural Resources - Current Expenditures - Capital Outlay
Total Conservation of Natural Resources
Economic Development - Current Expenditures - Capital Outlay
Total Economic Development All Other - Current Expenditures
- Capital Outlay
Debt Service
Total All Other
- Principal Paid on Bonds - Other Long-term Debt - Interest and Fiscal Charges
Total Current Expenditures Total Capital Outlay Total Debt Service
Total Expenditures
Other Financing Uses Debt Redemption - Refunded Bonds Other Uses Transfers To - Enterprise Funds
- Governmental Funds
Total Expenditures and Other Uses
Unreserved Fund Balance General Fund Umeserved Fund Balance Special Revenue Fund Umeserved Fund Balance
Total
AS A PERCENT OF TOTAL CURRENT EXPENDITURES
'WINONA
4,940,618
4,940,618 2,030,213 1,309,633
66,551
3,406,397 201,811
2,116,926 3,776,592
6,095,329 1,072,547
1,072,547 2,220,456 6,893,538
9,113,994 2,229,180
2,229,180
267,478
136,713
404,191 668,759
668,759 79,167
79,167 315,068
Jrr,Do8
160,000 3CJ,793 36,989
24,548,658 3,776,592
236,782
28,562,032
28~032
6,182,903 6,102,537
12_J85_,_440
50.0%
Table 3 Classification of County Expenditures
For the Year Ended December 31, 1999
WRIGHT
7,224,496
7,224,496 6,561,584 3,680,642
174,343
10,416,569 449,000
3,808,836 6,495,345
10,753,181 275,332
275,332 2,902,360
11,046,591
13,948,951 1,750,069
1,750,069
1,020,453
790,044
1,810,497 720,874
720,874 46,500
46,500 425,069 509,883 934,932
5,005,000
1,046,185
40,876,193 7,005,228 6,0_51,185
53,932,606
78,448
54.J!!b.054
8,978,519 3,647,214
12,625,733
30.9%
YELLOW MEDICINE
1,145,723
1,145,723 547,140 467,016
68,368 84,156
1,166,680 147,309
1,831,073 2,216,134
4,194,516 94,461
94,461 757,423
2,224,165
2,981,588 68,266
68,266
44,359
94,379
138,738 603,649
603,649
103,956
TOT,956
365,000 19,336 92,868
8,197,287 2,300,290
477,204
10,974,781
4,915
10~696
2,406,236 6,475,706 8,881,942
108.4%
TOTAL ALL COUNTIES
540,152,167 53,035,079
593,187,246 244,968,235 274,521,702
96,422,890 77,553,491
693,466,318 33,047,133
229,119,751 342,006,305
5,116,663 609,289,852
58,596,300 16,716,689 75,312,989
403,645,773 819,462,005
51,387,864 16,228,889
1,290,724,531 159,062,477
2,785,309 161,847,786
63,881,689 14,114,632 43,014,762
6,443,199 127,454,282 68,479,093 3,353,698
71,832,791 39,195,052
5,274,370 44,469,422 22,067,356 26,330,658 48,398,014
167,070,050 19,459,776 51,617,724
3,147,024,249 568,958,982 238,147,550
3,954,130,781
4,569,614 136,833,297
4,095,533,692
703,587,959 712,882,545
1,416,470,504
45.0%

This page left blank intentionally

ANALYSIS OF
PUBLIC SERVICE ENTERPRISES

Table 4 Public Service Enterprises
Analysis of Hospital Operations For the Year Ended December 31, 1999
Transfers Debt Service
Operating Nonoperating Net Federal State To/(From) Capital Interest Principal
Name of Countx_ Po;eulation Revenue Ex;eense Income Revenue E~ense Income Taxes ~ Grants Other Funds Outlai Borrowinilj Payments ~ents
CHIPPEWA [1] 13,152 7,309,155 6,715,538 593,617 459,947 237,675 815,889 -- -- -- 906,586 CLEARWATER 8,392 8,499,322 8,680,079 (180,757) 269,375 5,075 83,543 -- -- -- -- 188,729 3,475,000 296,406 227,348
COOK [2] 4,595 5,427,162 . 5,871,124 (443,962) 460,065 23,218 (7,115) 300,000 -- -- - 1,510,980 11,500
DOUGLAS 31,800 40,128,855 36,661,368 3,467,487 288,929 -- 3,756,416 - -- -- -- 1,980,913 62,505 674,817
HENNEPIN 1,089,024 319,915,283 342,732,245 (22,816,962) 19,491,350 2,525,014 (5,850,626) 17,176,980 93,490 2,220,880 460,771 16,792,307 -- 2,130,429 5,432,309 KANABEC 14,432 12,163,870 10,942,208 1,221,662 108,604 -- 1,330,266 -- -- -- -- 287,153 207,453 90,000 MAHNOMEN [1] [2] [5] [6] 5,166 2,530,625 2,676,580 (145,955) 634,936 -- 488,981 -- -- (510,825) 1,242,917 3,270 10,461
MEEKER [5] 21,929 9,700,016 8,890,421 809,595 215,665 -- 1,025,260 -- -- - -- 1,849,237
MURRAY 9,544 3,531,165 3,468,287 62,878 93,034 1,698 154,214 -- - -- -- 72,959
PIPESTONE [2] 10,343 8,296,335 8,067,6~7 228,728 58,869 255,737 31,860 -- -- -- (225,751) 326,245 52,138 342,099
RENVILLE 17,412 4,630,633 4,626,663 3,970 48,484 3,268 49,186 -- -- -- -- 522,027 31,244 99,818
SWlFT [5] 111338 Ji935i009 3i998i900 i63i8912 172:700 17758 91 051 150i000 -- -- -- 72:502 _l1755 49,597
TOTAL 1,237,127 426,067,430 443,331,020 (17,263,590) 22,301,958 3,069,443 1,968,925 17,626,980 93,490 2,220,880 (275,805) 25,752,555 3,475,000 2,806,700 ~449
See explanation of footnotes at the end of the public service enterprise section .
..i::,.
..i::,.

Table 5 Public Service Enterprises
Analysis of Nursing Home Operations For the Year Ended December 31, 1999
Transfers Debt Service
Operating N onoperating Net Federal State To/(From) Capital Interest Principal Name of Coun~ Po;2ulation Revenue Ex;2ense Income Revenue Ex;2ense Income Taxes ~ Grants Other Funds Outlai Borrowinll: Payments ~ents
BECKER [3] 29,779 1,994,032 1,940,235 53,797 24,156 1,053 76,900 27,444 1,053 40,000 COOK [2] 4,595
DODGE 17,504 2,680,787 3,004,814 (324,027) 34,496 23,927 (313,458) -- 12,678 23,927 43,398 HUBBARD [3] 17,177 4,922,594 4,652,024 270,570 25,153 17,037 278,686 28,772 17,037 16,587 ITASCA [3] 43,986 4,982,995 4,818,823 164,172 191,895 246,429 109,638 90,753 -- 246,077 164,138 LAKE [3] 10,745 2,439,018 2,347,253 91,765 6,660 98,425 299,981 MAHNOMEN [2] 5,166
PENNINGTON [3] 13,606 2,260,958 2,586,427 (325,469) 14,893 158 (310,734) 22,338 PIPESTONE [2] 10,343
RAMSEY 497,919 9,251,628 9,620,635 (369,007) 33,778 64,294 (399,523) 33,778 (162,928) 121,354 4,081 STEELE 32,965 4,177,278 4,162,414 14,864 24,608 4,581 34,891 -- 129,658 4,581 30,000 ST.LOUIS 199,080 19,275,921 19,975,864 (699,943) 2,369 4,318 (701,892) 2,369 (279,950) 79,374 2,493 40,000
TRAVERSE 4,212 1,974,007 1,988,324 (14,317) 15,066 1,285 (536) 35,102
WADENA [11] ____!_1398
TOTAL 900,475 53,959,218 55,096,813 (1,137,595) 373,074 363,082 (1,127,603) 2369 33 778 (442,878) 847,454 295,168 ~204 ---.i::,.. V\
See explanation of footnotes at the end of the public service enterprise section.

.i::,.. 0-.,
Operating
Name of Coun.!l,_ . .!2£ulation Revenue Ex.E,ense Income
BELTRAMI 38,644 1,231,667 1,851,666 (619,999) CLAY 53,322 1,043,794 2,159,266 (1,115,472) GRANT [8] 6,165
POLK 32,004 790,657 1,480,920 (690,263)
WILKIN [8] 7,319
Table 6 Public Service Enterprises
Analysis of Nursing Services Operations For the Year Ended December 31, 1999
Nonoperating Net Federal
Revenue Ex~ Income Taxes Grants
707,089 87,090 293,243
779,970 (335,502) 231,582
743,391 53,128 235,850 242,555
State
Grants
320,275
548,388
264,986
TOTAL 137,454 3,066,118 5,491,852 (2,425,734) 2,230,450 (195,284) 235,850 767,380 1,133,649
See explanation of footnotes at the end of the public service enterprise section .
Transfers Debt Service
To/(From) Capital Interest Principal
Other Funds Outlai Borrowin~ Payments Payments
4,994
(400,990) 12,213 1,050
12,407
(400,990) 29,614 === === 1 050

Table 7 Public Service Enterprises
Analysis of Sanitation Operations For the Year Ended December 31, 1999
Transfers Debt Service
Operating Nonoperating Net Federal State To/(From) Capital Interest Principal
NameofCoun Po12uiation Revenue Ex12ense Income Revenue E~ense Income Taxes Grants Grants Other Funds Outlai Borrowin~ Payments ~ents
BLUEEARTH 55,877
LANDFILL 1,068,327 788,507 279,820 49,628 83,351 246,097 -- -- (18,402) 64,288 - 83,351 125,684
CASS 25,644
PINE RIVER AREA SANITARY [5] 288,763 558,634 (269,871) 4,048 18,134 (283,957) -- -- -- -- 90,646 -- 18,134 55,000
CLAY 53,322
SOLID WASTE 776,518 1,133,415 (356,897) 1,401,129 19,501 1,024,731 956,851 -- 182,873 - 260,543 -- 19,501 7,527
COTTONWOOD 12,773
LANDFILL [10] 522,529 865,045 (342,516) 99,799 24,862 (267,579) 99,799 -- -- (48,261) 7,206 372,274 24,862 260,000
CROWWING 52,698
SERPENT LAKE SANIT. DIST. [5] 245,225 264,866 (19,641) 2,270 72,410 (69,281) -- -- 157,747 -- 72,410
SOLID WASTE 1,843,765 44,423 1,799,342 137,106 60,321 1,876,127 2,116 -- -- -- 426,528 60,196 580,000
DOUGLAS 31,800
SOLID WASTE [5] 1,704,317 2,467,627 (763,310) 11,435 349,159 -- -- -- 196,343 -- 2,967,258
..i::::. GOODHUE 43,469 -.....) WASTE MANAGEMENT [8]
HENNEPIN 1,089,024
SOLID WASTE 49,727,078 50,088,637 (361,559) 3,764,653 674,686 2,728,408 301,508 -- 3,460,478 -- 51,267 674,686 7,770,000
HUBBARD 17,177
SOLID WASTE 37,182 1,207,160 (1,169,978) 1,446,788 - 276,810 -- -- (80,000) 35,537
LAKE 10,745
SANITARY DISTRICT [5] 62,293 244,963 (182,670) 6,745 -- (175,925)
LYON 25,505
LANDFILL 1,942,141 968,209 973,932 193,172 -- 1,167,104 -- -- -- 149,413
OLMSTED 121,452
WASTE MANAGEMENT 9,273,461 7,851,801 1,421,660 2,066,277 1,596,899 1,891,038 -- 852,526 (16,536) 854,035 1,596,899 2,025,520
OTTERTAIL 55,192
WASTE MANAGEMENT 5,572,890 5,108,693 464,197 345,775 69,107 740,865 -- -- 200,331 - 298,534 -- 69,107
POLK 32,004
LANDFILL 479,927 418,722 61,205 36,933 -- 98,138 -- 413 -- 44,371
RESOURCE RECOVERY 2,441,771 2,140,748 301,023 47,786 115,473 233,336 -- -- 4,752 -- 57,648 115,473 505,000
STEELE 32,965
SOLID WASTE 1,420,686 725,497 695,189 70,349 765,538 -- -- -- -- 17,280 -- 4,981

.,1:::,,. 00
Operating
Name ofCoun Population Revenue E~ense
ST.LOUIS 199,080
SOLID WASTE 4,613,682 4,630,236
TODD 24,191
SOLID WASTE 740,866 956,856
WRIGHT 87,779
SOLID WASTE 40 818,741
TOTAL 1,970,697 82,761,461 81,282,780
See explanation of footnotes at the end of the public service enterprise section .
Table 7 Public Service Enterprises
Analysis of Sanitation Operations For the Year Ended December 31, 1999
N onoperating Net
Income Revenue E~ense Income Taxes
(16,554) 3,524,735 295,299 3,212,882 . I,023,630
(215,990) 291,790 -- 75,800 --
(818,701) 1,414,189 693,809 (98,321) --
1,478,681 14,914,607 4,073,011 13,441,811 2,383,904
Transfers Debt Service
Federal State To/(From) Capital Interest Principal
Grants Grants Other Funds Outla~ Borrowinli Payments ~ents
-- 1,821,800 - 2,530,919 -- 264,022 1,545,000
-- 67,435 -- 32,248
-- -- - -- -- -- 1,304,557
-- 6,786,951 (5,4522 7,887,721 372,274 2,998,641 14,183,269

Table8 Public Service Enterprises
Analysis of Other Enterprise Operations For the Year Ended December 31, 1999
Transfers Debt Service
Operating Nonoperating Net Federal State To/(From) Capital Interest Principal
NameofCoun Po£ulation Revenue Bx£ense Income Revenue E::£ense fucome Taxes Grants Grants Other Funds Outla~ Borrowing ~ ~ents
AITKIN 14,235
CONSERVATION CENTER 549,451 730,477 (181,026) 13,656 24,902 (192,272) 3,210 -- 787,955 -- 18,595 4,142
ANOKA 297,776
GOLF COURSE 799,909 811,833 (11,924) 11,838 51,180 (51,266) -- 10,060 1,778 37,500 514,665 -- 4,256 41,411
WAVEPOOL 482,631 433,029 49,602 49,602 37,500 1,099
BECKER 29,779
EDA [13][5] 144,675 565,819 (421,144) 557,892 176,617 (39,869) -- -- 281,341 -- 6,829 23,503
BROWN 28,012
ECONOMIC DEVELOPMENT PARTNERS [5] 14,230 (14,230) 11,374 -- (2,856) (34,500)
CHISAGO 42,041
HRA [5] 155,019 68,333 86,686 12,900 94,826 4,760 -- -- -- -- 94,826
CLAY 53,322
FAMILY SERVICE CENTER 1,165,863 1,088,047 77,816 249,451 602,575 (275,308) (1,000,000) 876,934 602,575 206,251
JUVENILE CENTER 1,460,558 1,404,108 56,450 191,655 158,340 89,765 137,918 -- 1,880 158,340 105,690
.i:::,. DAKOTA 347,245 l,C) GEOGRAPHIC INFORMATION SYSTEM 59,623 96,873 (37,250) -- (37,250)
FARIBAULT 16,364
HRA [5] 202,500 202,496 4 4
HENNEPIN 1,089,024
GLEN LAKE GOLF COURSE 791,223 631,700 159,521 -- 244,847 (85,326) -- -- 10,555 - 244,847 30,000
METRO HEALTH PLAN 83,104,917 82,847,667 257,250 -- -- 257,250 -- -- 497,261
ITASCA 43,986
ITASCA RESOURCE CENTER 440,494 430,611 9,883 -- 9,883 -- -- 3,540
KITTSON 5,376
RURAL WATER DISTRICT [5] 257,645 267,947 (10,302) 264,949 382,614 (127,967) (37,327) 6,452 -- 1,965,180 1,106,872
LAKE 10,745
HRA [5] 99,911 105,355 (5,444) -- 7,584 (83,028) -- (62,000) -- -- 77,584 12,601
MEEKER 21,929
EDA [5] 149,578 79,312 70,266 - 63,836 6,430 -- -- -- 836,326 1,400,000 63,094 16,877
MOWER 37,583
HRA [5] 598,321 506,422 91,899 -- -- 91,899 -- -- 124,636 59,578 83,065
MURRAY 9,544
CONGREGATE HOUSING 241,140 162,418 78,722 325 91,580 (12,533) (10,377) -- 91,580
OLMSTED 121,452
CAMPUS [14]
Table8 Public Service Enterprises
Analysis of Other Enterprise Operations For the Year Ended December 31, 1999
Transfers Debt Service
Operating Nonoperating Net Federal State To/(From) Capital Interest Principal
NameofCoun Population Revenue Expense Income Revenue E!Pense Income Taxes Grants ~ Other Funds Outla;i;: Borrowing Payments ~ents
RAMSEY 497,919
IN1EGRATED MANAGED CARE 220,357 532,780 (312,423) -- -- (312,423) -- 5,504
LAKE OWASSO RESIDENCE 4,287,345 4,684,311 (396,966) 45,001 -- (351,965) -- 19,968 (240,174) 8,716
ROCK 9,801 RURAL WATERDIS1RICT [5] 349,312 416,206 (66,894) 76,360 -- 9,466 -- -- 1,545,769
STEARNS 133,977
HRA [5] 40,350 57,181 (16,831) 18,380 -- 1,549 -- -- 2,703
STEELE 32,965
CMCCENTER 187,295 193,142 (5,847) 4,153 -- (1,694) -- -- 10,221
STEVENS 10,535
AMBULANCE 434,228 519,512 (85,284) 23,877 -- (61,407) -- -- (72,942) 68,205
TRAVERSE 4,212
CONGREGATE HOUSING 220,283 147,461 72,822 7,022 88,638 (8,794) -- - 2,415 -- 88,638 20,000 ---- ---- ------TOTAL 2,857,822 96,442,628 96,997,270 (554,644} 1,488,833 1,987,539 (1,123,350} -- 10,060 162,874 (1,379,617} 5,583,474 1,400,000 3,475,922 ~412
VI 0
See explanation of footnotes at the end of the public service enterprise section.

Enterprise Fund Footnotes
[1] The hospital is operated jointly by a municipality and the county.
[2] The nursing home operations are included with the hospital operations.
[3] The operations are for the fiscal year ended September 30.
[ 4] The enterprise fund discontinued operations during the current year.
[ 5] The enterprise fund is shown as a component unit in the county financial statements.
[ 6] The enterprise fund beg<;1,n operations during the current year.
[7] The enterprise fund debt was reclassified to the general long-term debt account.
[8] The enterprise fund operations were reclassified and are shown as a special revenue fund.
[9] The enterprise fund operations were reclassified and are included with other enterprise funds.
[ 1 0] The enterprise fund operations were previously classified as a governmental fund type.
[ 11] The enterprise fund operations were reclassified and are shown as a fiduciary fund.
[12] The clinic operations are included with hospital operations.
[13] The operations are for the fiscal year ended June 30.
[ 14] The enterprise fund operations were reclassified and are shown as an internal service fund.
51

This page left blank intentionally

ANALYSIS OF
TOTAL OUTSTANDING INDEBTEDNESS

Table 9 Outstanding Indebtedness of Counties
For the Year Ended December 31, 1999
Type of Bond Other General G.O. Tax Special G.O. All Total Bonded Long-term Compensated
Name of County Po12ulation Oblisation Increment Assessment Revenue Revenue Other [lJ Indebtedness RefundinS [2J Debt Absences
AITKIN 14,235 4,585,000 4,585,000 203,533 822,809
ANOKA 297,776 60,355,000 7,285,000 6,400,000 74,040,000 36,955,000 18,822,719 9,323,617
BECKER 29,779 495,000 15,000 1,500,000 2,010,000 1,500,000 932,617 1,380,877
BELTRAMI 38,644 122,500 2,275,000 5,000,000 7,397,500 2,255,000 46,767 1,211,509
BENTON 35,110 510,000 8,330,000 485,000 9,325,000 6,330,858 985,402
BIG STONE 5,794 200,000 200,000 298,341
BLUE EARTH 55,877 2,165,000 2,100,000 4,265,000 345,000 1,830,871 971,101
BROWN 28,012 935,000 10,000 3,325,000 4,270,000 934,874 726,056
CARLTON 31,591 3,710,000 3,710,000 2,150,000 750,487 1,705,561
CARVER 66,168 14,045,000 12,505,000 1,335,000 27,885,000 12,480,000 568,267 2,280,572
CASS 25,644 225,000 60,000 285,000 40,000 4,423,467 1,965,862
CHIPPEWA 13,152 291,586
CHISAGO 42,041 1,240,000 1,370,000 9,495,000 12,105,000 5,845,000 387,605 1,924,087
CLAY 53,322 3,195,000 4,800,000 10,335,000 18,330,000 4,575,000 1,248,383 1,861,672
CLEARWATER 8,392 445,000 5,830,000 6,275,000 191,621 193,173
Vt COOK 4,595 5,410,000 2,110,000 1,820,000 550,000 9,890,000 1,660,000 4,746,768 252,060 +:>, COTTONWOOD 12,773 1,890,000 1,230,000 2,500,000 5,620,000 1,170,000 303,398
CROW WING 52,698 2,570,000 4,625,000 7,195,000 2,490,000 1,260,835 1,600,860
DAKOTA 347,245 77,360,000 3,465,000 80,825,000 67,940,000 876,037 9,962,628
DODGE 17,504 430,000 430,000 215,000 3,085,869 353,759
DOUGLAS 31,800 6,332,500 1,005,000 1,065,000 8,402,500 3,212,500 870,812 837,544
FARIBAULT 16,364 2,640,000 465,000 3,105,000 2,330,000 14,630 382,833
FILLMORE 20,914 375,000 375,000 49,037 675,490
FREEBORN 32,238 570,000 3,220,000 1,240,000 5,030,000 570,000 751,611
GOODHUE 43,469 2,165,000 21,446,959 23,611,959 2,171,269 2,000,239
GRANT 6,165 415,000 160,000 575,000 12,428 208,586
HENNEPIN 1,089,024 180,120,000 100,795,000 280,915,000 26,295,000 44,243,017 79,787,000
HOUSTON 19,545 584,605
HUBBARD 17,177 300,000 300,000 56,752 908,492
ISANTI 30,826 6,940,000 1,735,000 6,220,000 14,895,000 6,940,000 643,160
ITASCA 43,986 3,380,000 240,000 1,309,020 4,929,020 1,880,000 26,310,234 9,928,669
JACKSON 11,636 350,000 710,000 1,060,000 350,000 50,000 497,989
KANABEC 14,432 6,900,000 3,060,000 9,960,000 360,342
KANDIYOHI 41,942 12,490,000 405,000 3,250,000 16,145,000 3,065,000 28,243,451 1,840,770
KITTSON 5,376 2,037,084 3,551,654 5,588,738 1,641,954 253,923
KOOCHICHING 15,679 1,580,000 1,580,000 638,984
LAC QUI PARLE 8,413 266,834
LAKE 10,745 1,941,233 2,550,000 2,260,000 6,751,233 2,265,000 109,469 781,823

Table 9 Outstanding Indebtedness of Counties
For the Year Ended December 31, 1999
Type of Bond Other General G.O. Tax Special G.O. All Total Bonded Long-term Compensated
Name of County PoEulation Obli~ation Increment Assessment Revenue Revenue Other [lJ Indebtedness Refundin~ [2J Debt Absences
LAKE OF THE WOODS 4,618 149,738
LESUEUR 25,482 2,050,000 500,000 2,550,000 500,000 116,679 264,674
LINCOLN 6,585 1,081,000 1,081,000 470,000 112,178 88,107
LYON 25,505 2,170,000 2,170,000 2,636,575 390,043
MAHNOMEN 5,166 180,000 90,000 1,100,000 1,370,000 1,685,427 267,011
MARSHALL 10,383 1,130,236 450,000 1,580,236 809,008 294,152
MARTIN 22,694 1,030,000 500,000 1,530,000 430,000 380,911 361,351
MCLEOD 35,364 465,000 465,000 465,000 1,070,000 936,684
MEEKER 21,929 3,150,000 3,193,123 6,343,123 2,659,705 527,879
MILLELACS 21,355 4,880,000 1,725,000 6,605,000 34,259 760,701
MORRISON 31,756 4,455,000 2,710,000 3,870,000 11,035,000 7,140,000 788,864 572,392
MOWER 37,583 10,000 10,000 1,230,562 533,910
MURRAY 9,544 990,000 270,000 1,260,000 200,000 1,600,000 156,348
NICOLLET 30,464 4,430,000 15,000 1,000,000 5,445,000 805,000 1,153,837
NOBLES 19,920 8,320,000 8,320,000 351,852
Vt NORMAN 7,637 365,000 365,000 365,000 25,988 276,272 Vt OLMSTED 121,452 2,050,000 43,655,000 17,270,000 62,975,000 36,620,000 2,035,023 2,699,308
OTTER TAIL 55,192 1,450,000 470,000 1,920,000 470,000 335,889 2,713,277
PENNINGTON 13,606 3,100,000 3,100,000 135,326 162,045
PINE 24,496 345,310
PIPESTONE 10,343 715,000 100,000 815,000 330,000 509,629 138,874
POLK 32,004 7,756,000 4,810,000 2,445,000 15,011,000 1,815,000 1,186,908 646,424
POPE 10,980 232,500 232,500 232,500 248,470 455,663
RAMSEY 497,919 121,708,263 121,708,263 67,710,000 836,667 28,495,694
RED LAKE 4,384 315,000 315,000 315,000 111,930
REDWOOD 17,193 558,952
RENVILLE 17,412 3,660,000 3,660,000 572,243 1,168,848
RICE 54,888 885,000 885,000 885,000 5,841,000 906,495
ROCK 9,801 983,832 465,177
ROSEAU 16,314 138,219 487,344
SCOTT 81,534 9,930,000 50,000 9,980,000 7,945,000 13,735,024 2,276,655
SHERBURNE 63,182 5,065,000 8,000,000 13,065,000 982,255
SIBLEY 14,997 1,100,000 1,100,000 325,000 2,320,000 715,753
STEARNS 133,977 7,610,000 515,000 16,675,000 24,800,000 22,075,000 2,525,000 3,781,374
STEELE 32,965 12,590,000 30,000 12,620,000 6,020,000 4,915,770 571,649
STEVENS 10,535 575,000 575,000 20,221 182,276
ST.LOUIS 199,080 2,150,000 4,060,000 6,210,000 2,915,000 21,972,453 31,787,899
SWIFT 11,338 1,660,000 450,000 2,110,000 450,000 193,349 418,549

Table 9 Outstanding Indebtedness of Counties
For the Year Ended December 31, 1999
Type of Bond Other General G.O. Tax Special G.O. All Total Bonded Long-term Compensated
Name of County Po12ulation Oblisation Increment Assessment Revenue Revenue Other [lJ Indebtedness RefundinS [2J Debt Absences
TODD 24,191 380,000 380,000 1,040,188 894,416
TRAVERSE 4,212 1,530,000 1,530,000 291,691 205,496
WABASHA 21,118 866,323 695,539
WADENA 13,398 430,771
WASECA 19,403 5,405,000 1,800,000 7,205,000 1,435,000 632,975
WASHINGTON 198,606 18,950,000 1,035,000 19,985,000 19,985,000 28,932,713 4,850,973
WATONWAN 11,643 105,000 500,838
WILKIN 7,319 100,000 100,000 100,000 311,583 172,692
WINONA 49,576 240,000 240,000 264,173 594,651
WRIGHT 87,779 15,865,000 11,975,000 27,840,000 24,570,000 1,423,301
YELLOW MEDICINE 11,493 3,540,000 15,000 1,120,000 4,675,000 1,135,000 200,206 274,885
TOTAL 4,838,398 648,261,996 12,060,000 33,144,320 270,187,633 ~963,123 18,415,000 1,055,032,072 393,071,954 253,244,733 237,597,063
Footnote: [1] All other includes bonds payable from county state-aid street allocations.
[2] Refunding bonds are also classified by type of bond and included in the total bonded indebtedness. Vl O'I

ANALYSIS OF
THE FUND BALANCES IN THE
GENERAL AND SPECIAL REVENUE FUNDS

Table 10 Percent Change of Unreserved Fund Balances
In the General Fund and Special Revenue Funds 1998 to 1999 1999 Unreserved Fund Balances as a Percent of Total Current Expenditures
1999 Unreserved as
December 31, 1998 December 31, 1999 1998/1999 1999 a Percent of Unreserved Unreserved Total Unreserved Unreserved Total Percent Total Current Total Current
Coun Desi~ated Undesi~ated Unreserved Desi~ted Undesi~ated Unreserved Chanse ExEenditures ExEenditures
AITKIN 427,472 12,931,415 13,358,887 490,580 13,302,671 13,793,251 3.3% 16,038,545 86.0%
ANOKA 45,701,950 477,856 46,179,806 47,599,752 (848,198) 46,751,554 1.2% 154,148,662 30.3%
BECKER 5,359,488 10,417,602 15,777,090 5,262,847 10,863,277 16,126,124 2.2% 22,130,051 72.9%
BELTRAMI 10,739,384 6,734,424 17,473,808 11,062,597 9,576,009 20,638,606 18.1% 30,773,153 67.1%
BENTON 396,650 9,674,778 10,071,428 601,378 9,440,701 10,042,079 -0.3% 17,565,759 57.2%
BIG STONE 1,640,883 3,884,518 5,525,401 1,734,048 4,120,966 5,855,014 6.0% 4,887,079 119.8%
BLUE EARTH 32,506,575 (2,612,248) 29,894,327 38,582,541 38,582,541 29.1% 29,850,427 129.3%
BROWN 2,933,068 4,198,396 7,131,464 3,229,152 4,935,483 8,164,635 14.5% 17,092,907 47.8%
CARLTON 1,080,021 6,350,805 7,430,826 1,436,874 5,537,750 6,974,624 -6.1% 25,549,209 27.3%
CARVER 33,176,686 7,364,021 40,540,707 38,947,810 5,404,870 44,352,680 9.4% 41,759,440 106.2%
CASS 1,772,899 9,481,809 11,254,708 1,899,790 10,499,326 12,399,116 10.2% 27,259,971 45.5%
CHIPPEWA 6,142,213 5,017,270 11,159,483 6,937,333 5,014,593 11,951,926 7.1% 10,009,078 119.4%
VI CHISAGO 9,088,805 3,981,284 13,070,089 10,627,870 2,779,201 13,407,071 2.6% 24,468,214 54.8% 00
CLAY 7,870,300 66,160 7,936,460 6,942,209 (29,173) 6,913,036 -12.9% 30,928,848 22.4%
CLEARWATER 1,358,293 4,677,710 6,036,003 1,770,882 4,783,360 6,554,242 8.6% 10,135,078 64.7%
COOK 347,716 8,140,907 8,488,623 186,967 8,226,115 8,413,082 -0.9% 10,399,065 80.9%
COTTONWOOD 764,893 4,528,934 5,293,827 577,286 4,773,300 5,350,586 1.1% 9,390,307 57.0%
CROW WING 59,065 13,292,007 13,351,072 107,580 14,122,807 14,230,387 6.6% 35,531,488 40.1%
DAKOTA 116,547,436 116,547,436 116,802,148 116,802,148 0.2% 156,285,193 74.7%
DODGE_ 2,910,388 1,696,510 4,606,898 2,863,305 1,468,908 4,332,213 -6.0% 10,410,540 41.6%
DOUGLAS 4,381,577 2,133,257 6,514,834 3,903,625 1,773,449 5,677,074 -12.9% 21,835,113 26.0%
FARIBAULT 1,754,038 1,585,538 3,339,576 1,943,572 1,941,940 3,885,512 16.3% 8,739,518 44.5%
FILLMORE 4,013,110 5,127,805 9,140,915 5,852,597 2,751,499 8,604,096 -5.9% 11,359,794 75.7%
FREEBORN 6,206,607 10,168,926 16,375,533 6,224,029 10,001,789 16,225,818 -0.9% 20,024,966 81.0%
GOODHUE 2,228,828 12,399,746 14,628,574 1,862,872 6,519,243 8,382,115 -42.7% 26,770,713 31.3%
GRANT 1,503,636 513,218 2,016,854 1,472,008 827,089 2,299,097 14.0% 6,472,752 35.5%
HENNEPIN 41,027,388 166,008,114 207,035,502 14,004,548 191,141,911 205,146,459 -0.9% 781,639,963 26.2%
HOUSTON 3,336,613 4,002,985 7,339,598 3,382,994 3,893,849 7,276,843 -0.9% 11,833,343 61.5%
HUBBARD 3,631,207 3,915,343 7,546,550 3,354,474 3,538,110 6,892,584 -8.7% 13,497,006 51.1%
ISANTI 7,929,401 7,929,401 141,082 5,916,226 6,057,308 -23.6% 20,195,501 30.0%
ITASCA 798,205 17,487,479 18,285,684 20,424,151 20,424,151 11.7% 40,286,479 50.7%
JACKSON 2,660,768 2,864,892 5,525,660 576,107 5,917,053 6,493,160 17.5% 9,753,396 66.6%
KANABEC 32,703 3,693,944 3,726,647 297,072 3,318,712 3,615,784 -3.0% 10,226,017 35.4%
KANDIYOHI 5,500 13,706,368 13,711,868 17,852,037 17,852,037 30.2% 31,453,522 56.8%

Tabfo 10 Percent Change of Unreserved Fund Balances
In the General Fund and Special Revenue Funds 1998 to 1999 1999 Unreserved Fund Balances as a Percent of Total Current Expenditures
1999 Unreserved as
December 31, 1998 December 31, 1999 1998/1999 1999 a Percent of Unreserved Unreserved Total Unreserved Unreserved Total Percent Total Current Total Current
Coun~ Desi~ated Undesi~ated Unreserved Desieted Undesi~ated Unreserved Chan~e Ex12enditures ~enditures
KITTSON 1,799,330 2,913,503 4,712,833 1,784,777 2,784,863 4,569,640 -3.0% 7,301,806 62.6%
KOOCHICHING 6,037,724 7,724,297 13,762,021 8,359,940 4,195,273 12,555,213 -8.8% 13,535,938 92.8% LAC QUIP ARLE 1,150,311 4,193,443 5,343,754 1,600,306 4,553,451 6,153,757 15.2% 5,898,956 104.3%
LAKE 2,446,150 8,107,461 10,553,611 2,435,600 8,391,091 10,826,691 2.6% 12,683,720 85.4%
LAKE OF THE WOODS 4,922,270 715,560 5,637,830 5,055,984 876,323 5,932,307 5.2% 5,622,921 105.5% LESUEUR 6,919,788 (12,751) 6,907,037 7,793,957 (88,887) 7,705,070 11.6% 14,643,214 52.6%
LINCOLN 727,357 2,769,105 3,496,462 639,948 3,385,466 4,025,414 15.1% 4,790,371 84.0%
LYON 755,411 5,327,545 6,082,956 870,127 4,495,123 5,365,250 -11.8% 12,565,618 42.7%
MAHNOMEN 1,426,643 2,346,801 3,773,444 1,441,989 3,026,648 4,468,637 18.4% 6,299,229 70.9%
MARSHALL 1,249,292 2,138,157 3,387,449 1,129,347 2,208,425 3,337,772 -1.5% 10,371,897 32.2%
MARTIN 33,623 8,612,886 8,646,509 8,540,477 8,540,477 -1.2% 11,081,240 77.1%
MCLEOD 13,495,358 910,752 14,406,110 12,444,074 254,562 12,698,636 -11.9% 20,772,911 61.1%
Vt MEEKER 2,896,332 5,091,086 7,987,418 2,937,456 4,137,513 7,074,969 -11.4% 12,830,704 55.1%
"° MILLE LACS 3,428,594 6,591,652 10,020,246 3,969,152 5,077,663 9,046,815 -9.7% 17,045,882 53.1%
MORRISON 3,934,267 7,408,235 11,342,502 3,718,178 9,413,830 13,132,008 15.8% 18,962,942 69.3%
MOWER 5,746,650 27,738,837 33,485,487 8,758,097 23,814,240 32,572,337 -2.7% 22,712,595 143.4%
MURRAY 553,650 3,671,911 4,225,561 945,696 3,995,691 4,941,387 16.9% 6,578,311 75.1%
NICOLLET 10,743,010 1,672,203 12,415,213 8,417,081 6,067,349 14,484,430 16.7% 18,766,453 77.2%
NOBLES 3,815,098 4,589,618 8,404,716 4,410,564 4,145,142 8,555,706 1.8% 12,308,503 69.5%
NORMAN 325,709 2,974,428 3,300,137 737,169 2,636,226 3,373,395 2.2% 6,639,487 50.8%
OLMSTED 21,439,913 24,107 21,464,020 22,662,739 47,146 22,709,885 5.8% 80,248,804 28.3%
OTTERTAIL 11,245,583 7,813,385 19,058,968 10,460,268 7,615,132 18,075,400 -5.2% 33,598,248 53.8%
PENNINGTON 1,182,553 2,723,089 3,905,642 1,002,194 2,341,076 3,343,270 -14.4% 10,892,009 30.7%
PINE 278,757 6,294,734 6,573,491 434,642 5,490,596 5,925,238 -9.9% 18,351,808 32.3%
PIPESTONE 720,403 5,900,287 6,620,690 726,429 6,672,279 7,398,708 11.8% 6,211,918 119.1%
POLK 559,617 7,475,966 8,035,583 27,512 8,963,385 8,990,897 11.9% 26,012,583 34.6%
POPE 2,185,800 4,503,850 6,689,650 2,056,470 3,199,927 5,256,397 -21.4% 7,786,722 67.5%
RAMSEY 119,172,333 27,800,646 146,972,979 122,272,755 30,836,017 153,108,772 4.2% 372,370,196 41.1%
RED LAKE 2,333,381 1,791,959 4,125,340 2,342,496 1,991,377 4,333,873 5.1% 4,135,830 104.8%
REDWOOD 6,710,494 860,068 7,570,562 7,215,986 785,046 8,001,032 5.7% 12,464,730 64.2%
RENVILLE 4,353,330 5,626,434 9,979,764 4,426,145 6,818,501 11,244,646 12.7% 18,294,576 61.5%
RICE 11,268,179 2,882,340 14,150,519 11,897,064 3,938,136 15,835,200 11.9% 25,348,324 62.5%
ROCK 2,085,000 3,543,807 5,628,807 2,085,000 3,147,131 5,232,131 -7.0% 6,915,215 75.7%
ROSEAU 3,245,356 2,386,234 5,631,590 3,359,379 2,937,467 6,296,846 11.8% 8,193,079 76.9%

Table 10 Percent Change of Unreserved Fund Balances
In the General Fund and Special Revenue Funds 1998 to 1999 1999 Unreserved Fund Balances as a Percent of Total Current Expenditures
1999 Unreserved as
December 31, 1998 December 31, 1999 1998/1999 1999 a Percent of Unreserved Unreserved Total Unreserved Unreserved Total Percent Total Current Total Current
Coun~ Desi~ated Undesi~ated Unreserved Desi~ted Undesi~ated Unreserved Chan~e E~enditures ~enditures
SCOTT 31,701,693 6,138,350 37,840,043 28,833,176 6,176,471 35,009,647 -7.5% 41,454,950 84.5%
SHERBURNE 11,037,071 5,356,623 16,393,694 12,972,255 4,457,882 17,430,137 6.3% 29,923,072 58.2%
SIBLEY 5,286,203 211,156 5,497,359 5,156,071 161,322 5,317,393 -3.3% 10,601,716 50.2%
STEARNS 11,711,088 834,088 12,545,176 11,681,309 1,556,647 13,237,956 5.5% 59,538,818 22.2%
STEELE 5,231,980 2,233,238 7,465,218 5,886,671 1,650,422 7,537,093 1.0% 16,831,765 44.8%
STEVENS 1,409,853 4,465,195 5,875,048 1,371,538 4,340,285 5,711,823 -2.8% 6,976,821 81.9%
ST. LOUIS 30,714,422 4,084,729 34,799,151 39,901,300 1,529,688 41,430,988 19.1% 159,512,799 26.0%
SWIFT 3,595,209 2,132,328 5,727,537 3,989,466 1,724,122 5,713,588 -0.2% 9,334,522 61.2%
TODD 7,391,288 631,731 8,023,019 7,138,342 648,262 7,786,604 -2.9% 17,396,039 44.8%
TRAVERSE 2,584,898 2,584,898 2,770,877 2,770,877 7.2% 4,552,184 60.9%
WABASHA 4,218,974 1,275,078 5,494,052 4,533,272 1,467,405 6,000,677 9.2% 11,341,993 52.9%
WADENA 1,660,688 1,596,385 3,257,073 1,675,083 1,357,248 3,032,331 -6.9% 10,866,967 27.9%
O"I WASECA 3,751,145 5,007,870 8,759,015 3,648,975 5,610,082 9,259,057 5.7% 11,557,911 80.1% 0
WASHINGTON 6,386,967 17,794,118 24,181,085 8,915,201 17,926,767 26,841,968 11.0% 95,564,023 28.1%
WATONWAN 2,645,473 1,412,372 4,057,845 3,127,677 1,275,951 4,403,628 8.5% 9,992,121 44.1%
WILKIN 1,944,946 3,647,682 5,592,628 1,952,843 3,661,620 5,614,463 0.4% 7,018,573 80.0%
WINONA 5,932,287 6,294,199 12,226,486 6,322,957 5,962,483 12,285,440 0.5% 24,548,658 50.0%
WRIGHT 11,205,630 2,230,660 13,436,290 10,444,113 2,181,620 12,625,733 -6.0% 40,876,193 30.9%
YELLOW MEDICINE 1,379,471 6,932,726 8,312,197 1,783,633 7,098,309 8,881,942 6.9% 8,197,287 108.4%
Total 758,796,019 621,816,235 1,380,612,254 768,430,332 648,040,172 1,416,470,504 2.6% 3,147,024,249 45.0%

APPENDIX A
FACTORS INFLUENCING COUNTY FINANCES

This page left blank intentionally

Appendix A
Factors Influencing County Finances
The finances of counties are affected by many different factors. Some of the variation results from decisions made by county officials. Some is due to factors outside the control of the elected officials such as state mandates, a county's size, the economic status of its residents, or the proximity of similar services provided elsewhere. The amount of revenue available may be influenced by rising or falling property values, the use of fee-based services, intergovernmental grants for projects, and many other interrelated factors. Expenditures may be affected by the demographic, geographic, historical or political landscape of the county. Large swings in expenditures may reflect demands caused by extraordinary weather events such as floods and tomados, high levels of snowfall, public safety events such as forest or brush fires, or large-scale investigations ofhigh-profile crimes. Some factors have an on-going effect on county finances, while others might be one-time events.
A. Demographics
Age of Housing. In the metropolitan area, the average age of housing in a county reflects not only the probable condition of the county's infrastructure, but several other conditions as well. The League of Minnesota Cities (LMC) found the average age of housing to be indicative of a variety of characteristics, including a higher relative rate of poverty, more tax exempt property, more subsidized housing, and a declining population base. Each of these factors tends to contribute to a demand for public services.
Population. Counties with larger populations face certain challenges not encountered by smaller counties. Simply dealing with large amounts of traffic is one challenge that can become very costly, depending upon the burden carried by an area's streets and highways. Large populations may also indicate high population densities that in tum are associated with higher poverty and crime rates. Conversely, counties with sparse populations spread over large land areas may face higher costs per citizen served and fewer taxpayers to pay for the services.
Population Decline. A large loss of population can have a very significant effect upon a county's spending. The costs of a county's infrastructure and many of its services do not go down immediately when a number of county residents move away. Consequently, the county must often curtail services or raise the property taxes on the remaining taxpayers to maintain the existi_!ig level of services. Counties experiencing population loss are commonly home to an aging population that is more likely to live on fixed incomes. This population may require more services while at the same time have fewer resources to afford them.
Income. Income is indirectly related to a county's ability to raise revenues. Where incomes are lower, property values may also be depressed, reducing a county's tax capacity. Poverty rates, in tum, will be higher, creating greater demand for public services.
Crime Rate. Higher crime rates require a correspondingly high level of public safety services. Counties that host entertainment events, such as outdoor concerts, can draw large crowds of nonresidents and create unusual public safety service demands. Higher levels of poverty are also
63

associated with the crime rate of a county and contribute to an overall greater demand for police protection. In addition to these demands, expenditures can be affected by a number of different factors including: the number, type, and use of personnel; the scope of services; and the amount of shared services.
B. Geographic Location
Different areas of the state often operate within quite different economic environments. Just the presence of one large business or industry can impact an entire region. Declines in industries or companies that dominate local economies may result in a higher demand for public assistance and at the same time reduce the tax capacity of the area. Trends in agriculture may result in lower property values and a decline in revenues for counties in regions where economies are primarily based on agriculture. Counties located in these areas may experience difficulty raising revenues at the same time that they face higher demands for public services.
C. Revenue Sources
Tax Capacity. The amount of money any individual or entity spends is directly related to the amount that is available to spend. Likewise, the costs of doing business are directly related to the amounts of revenue that can be generated to meet the costs. The greater the amount and types of revenue available to a county, the more it will spend. Counties with significant amounts of taxexempt property, such as state and federal parks and forests, churches, and academic institutions, may not receive enough revenue from the parcels to cover the costs of the services provided to them.
Enterprise Funds. Services provided through enterprise funds allow counties to pass the costs of services directly onto the users of the services. By using this type of accounting mechanism, counties may be able to keep down the level of general property taxes needed to provide services.
D. Shared Services, Joint Powers Agreements
A significant practice among counties is the sharing of services and the use of joint powers agreements to provide necessary services. "Joint exercise of powers" is defined in Minnesota Statutes § 4 71. 5 9. Such arrangements allow counties to provide services jointly with other counties and thus pool their resources. For example, certain counties operate joint solid waste facilities while others provide human services through jointly-operated boards.
Shared service arrangements are not necessarily formal; some counties provide services to other jurisdictions on an informal basis. By sharing the costs of services, counties can achieve greater economies of scale and avoid duplicating services and capital investments. Counties that provide a service to a number of entities may show higher expenditures for that service, but will have these costs defrayed by revenues provided by the other participating entities.
64

E. Proximity to Regional or State-Run Programs/Facilities
Counties that are located near regional or state-run facilities may decide to have their citizens take advantage of those facilities and services rather than provide them on their own. Counties may also take advantage of services offered by county urban centers or neighboring counties.
The degree of isolation experienced by a community, whether geographic or technological (i.e., lack of advanced telecommunications capability), can also affect service demands and costs. Counties that are remote from other communities may not have the opportunity to participate in joint powers arrangements or have access to urban amenities, and thus may need to provide a wider range of services out of their own budgets.
F. Source of Labor
The extent to which a county depends upon other than full-time, salaried employees will affect the levels of expenditures. The following types of arrangements can reduce the full-time complement of staff: extensive use of part-time employees; significant reliance on volunteers; and use of contracts for specific projects or general services. Besides lower wages to part-time employees, an important reduction in costs created through these types of arrangements is in the area of fringe benefits, which are not generally paid to either part-time employees, volunteers, or individuals hired on a contract basis.
Some employee arrangements may increase, rather than reduce costs. Some counties' expenditures are affected by the extensive unionization of their work force. Because of the role of the unions, salary costs may be more difficult to control for these counties.
G. Other Factors
The effects of weather and natural disasters can significantly affect the expenditures for certain services over a period of time. Counties affected by floods and tornadoes may have higher public safety, streets and highways, and other infrastructure costs. During winters in which there is an unusually high snow fall, counties may have increased expenditures for snow removal. There are many other incidental factors not included in this list. Explanations of differences in county expenditures should be pursued with county officials.
65

This page left blank intentionally

APPENDIXB
COUNTY GENERAL AND SPECIAL REVENUE UNRESERVED FUND BALANCES
This page left blank intentionally

Appendix B
County General and Special Revenue Unreserved Fund Balances
Minnesota counties report their fund balances at the close of their fiscal year which ends December 31. This creates an impression that counties have excessive amounts of revenue held in reserve. In reality, county fund balances should be relatively large at the end of the year because of local government cash-flow cycles. Counties must rely on their fund balances to meet expenses during the first five months of the next fiscal year, until they receive the first property tax payments (May) and aid payments from the state (July).
Unlike state government, which collects income tax withholding and sales tax receipts regularly throughout the year, many counties do not have a constant flow of revenue from which they are able to fund local government operations. Property tax levies, state aid, and property tax credits comprise the majority of county discretionary revenues. Minnesota laws govern the flow of these major revenue sources into county treasuries.
• Counties receive the first half of property taxes from property owners by May 15 of each year.
• Counties receive the first half of their state aid and property tax credits from the state on July 20 of each year.
• Counties receive the second half of property taxes from property owners by October 15 of each year.
• Counties receive the second half of their state aid and property tax credits from the state on December 26 of each year.
Given this state-controlled flow of revenue, county fund balances ( which are measured on December 31) are the primary source of funds available to counties for their operating expenses during the first five months of the next fiscal year. An adequate fund balance will provide counties with the cash flow required to finance expenditures and avoid short-term borrowing.
Unique Circumstances of Each County Determine the Size of Fund Balance
While counties must rely on the fund balances for cash flow purposes during the first five months of a year, the unique circumstances of each county will determine the size of a fund balance that must be maintained to avoid the need for short-term borrowing and to operate effectively.
The unique fiscal characteristics of individual counties make it impossible to apply a single standard for fund balances to all counties. While some counties may require a fund balance equivalent to 40 percent of their total current expenditures, other counties may need a fund balance equal to only 10 percent of their total current expenditures. Numerous factors must be considered when determining the level of reserves necessary to avoid short-term borrowing.
69

• If counties receive relatively large amounts of revenue from sources such as fees, fines, charges for services, other intergovernmental grants and aids, or interest on investments during the first five months of the calendar year, then they will be less dependent on their fund balances for cash flow purposes.
• Counties are often able to delay certain purchases until after the initial property tax and state aid payments are received. While payments for employee salaries, wages, and most benefits cannot be delayed during the first five months of the year, purchases of supplies and capital equipment may be delayed.
The individual cash flow needs of a county will determine the minimum fund balance that is necessary for it to operate effectively. Counties may need less reserves in their General and Special Revenue Funds if they have unreserved fund balances in other governmental or proprietary funds from which they may borrow or transfer resources, or if they receive significant revenues from sources other than property taxes and state aid payments (i.e. charges for services). Conversely, counties that rely heavily on property taxes and state aid for the majority of their revenues will need relatively large fund balances to meet their cash flow needs from January 1 through June 1 of every calendar year.
70

GLOSSARY

This page left blank intentionally

Glossary BORROWING- These revenues reflect the sale of bonds and notes, certificates of indebtedness, and tax anticipation certificates. Counties are restricted by law from borrowing for current expenses.
CAPITAL OUTLAY - These expenditures include the purchase, construction, or permanent improvements of buildings, equipment, machinery, and land. Capital outlay varies from year to year based on the needs and resources of the counties.
CAPITAL PROJECTS FUND - A fund created to account for the financial resources that are used for the acquisition or construction of a fixed asset.
CHARGES FOR SERVICES - These revenues represent user charges paid in exchange for a service, exclusive of revenues from proprietary funds. Examples include sanitation charges, golf fees, court costs, and public safety contracts.
DEBT SERVICE EXPENDITURES - These expenditures reflect the annual costs of servicing the outstanding debt of the local government. These costs include principal, interest, and some fiscal charges.
DEBT SERVICE FUND - A fund to account for the collection of resources designated to pay the interest, fiscal charges, and principal on long-term debt.
ENTERPRISE FUND - A fund established to account for operations financed and operated in a manner similar to private business. Examples include water, sewer, and electric utilities. The expenses of providing services are primarily financed by user charges.
FINES AND FORFEITS - These revenues reflect receipts from the payment of penalties for law violations, non-observance of contracts, and forfeited deposits.
FRANCHISE TAXES - These revenues reflect proceeds from taxes imposed on public utilities, usually involving elements of a monopoly, ( e.g., electric utilities, gas utilities, cable TV) for use of public property.
GENERAL FUND - The fund used to account for all financial resources not required to be accounted for in another fund. This fund is the main operating fund.
GENERAL GOVERNMENT EXPENDITURES - These expenditures reflect the costs associated with local government functions, such as administration, finance, and elections. Expenditures in this category include salaries, wages, and benefits of legislative, judicial, and administrative personnel, in addition to supplies and building maintenance.
GOVERNMENT AL FUNDS - The funds through which most governmental activities are financed. The four governmental fund types are: General, Special Revenue, Debt Service, and Capital Projects.
GRAVEL TAX - These revenues are derived from taxes imposed by the local government for aggregate material removal.
HEAL TH - These expenditures are for the maintenance of vital statistics, restaurant inspection, communicable disease control, and various health services and clinics.
73

Glossary HRA AND ECONOMIC DEVELOPMENT - These expenditures are for development and redevelopment activities in blighted or otherwise economically disadvantaged areas. Activities may include low interest loans to individuals and businesses, cleanup of hazardous sites, rehabilitation of substandard housing and other physical facilities, and other assistance to those wanting to provide housing and economic opportunity within a disadvantaged area.
HUMAN SERVICES - These expenditures are for activities designed to provide public assistance and institutional care for individuals economically unable to provide essential needs for themselves.
INTEREST ON INVESTMENTS - These revenues reflect interest earned on checking and savings accounts, CDs, money market funds, and bonds. This category also includes dividends. In addition, the net increase or decrease in the fair value of investments is recorded here.
LICENSES AND PERMITS - These revenues reflect receipts from liquor licenses, cigarette licenses, other business licenses, street use permits, buildings permits, and other non-business licenses and permits.
MISCELLANEOUS EXPENDITURES - These expenditures reflect the costs of activities that were not allocated to a specific function. Some activities included in this category are pension and insurance costs not allocated to a specific department.
MISCELLANEOUS REVENUES - These revenues refer to refunds, reimbursements, donations, and lease payments.
NET TAX LEVY - The net county property taxes, after state property tax relief aids or grants, required to be paid by the property owners of the county.
OTHER FINANCING SOURCES - Long-term debt proceeds, sale of fixed assets, and transfers from other funds.
OTHER FINANCING USES - Transfers to other funds, refunding bond proceeds deposited with an escrow agent and invested until they are used to pay principal and interest on the old debt at a future time, and remittance to other agencies.
OUTSTANDING LONG-TERM DEBT - This category refers to the long-term debt that a local government has incurred to finance its capital projects. Examples oflong-term debt include various types of bonds and other obligations, such as notes and long-term leases.
PARKS AND RECREATION -These expenditures reflect park maintenance, mowing, planting, and removal of trees. Recreation expenditures include festivals, bands, museums, community centers, baseball fields, organized recreation activities, etc.
PUBLIC SAFETY EXPENDITURES - These expenditures reflect the costs related to the protection of persons and property.
SANITATION - These expenditures reflect the costs of refuse collection and disposal, recycling, as well as weed and pest control. Some local governments provide sanitation services through enterprise funds.
74

Glossary SPECIAL ASSESSMENTS - These revenues refer to levies made against certain properties to defray all or part of the costs of a specific improvement, such as new sewer and water mains, deemed to benefit primarily those properties. The amount includes the penalties and interest paid on the assessments.
SPECIAL REVENUE FUNDS - A fund used to account for the proceeds of specific revenue sources that are restricted to expenditures for a speeific purpose.
STREETS AND HIGHWAYS EXPENDITURES - These expenditures reflect the costs associated with the maintenance and repair of local highways, streets, bridges, and street equipment. Common expenditures include patching, seal coating, and snow removal. Expenditures for road construction are not included in current expenditures but are accounted for as capital outlay.
TAXABLE TAX CAP A CITY -The tax capacity less the tax increment district value, less the fiscal disparities contribution value, plus the fiscal disparities distribution value.
TAX CAP A CITY - The value assigned to the property used to calculate the property taxes.
TAX INCREMENTS - These revenues refer to the amount of resources local governments generate when they establish tax increment fmancing (TIF) districts. In a TIF district, the increase in property tax revenues in the redeveloped area are used to pay the costs of development and redevelopment in the district rather than the general services of the county and school district.
TOT AL CURRENT EXPENDITURES - This category reflects the total of all expenses relating to current operations.
TOTAL EXPENDITURES - This category includes current operating expenses, capital outlays, and debt service principal and interest payments.
TOT AL REVENUES - This category reflects all sources of revenue that increase the amount of available resources without creating a liability or a future payment. Borrowing and transfers between funds are not included in total revenues.
TRANSFERS - ENTERPRISE FUNDS - The transfer of available resources to or from public service enterprises. It is shown separately because proprietary funds are not included in the governmental funds.
TRANSFERS - GOVERNMENT AL FUNDS - The transfer of money between governmental fund types. The revenues and expenditures for these funds are always shown in the same tables.
UNALLOCATED INSURANCE - These expenditures refer to insurance premiums that were not allocated to a specific function of government.
UNALLOCATED PENSION CONTRIBUTIONS - These expenditures refer to contributions to pension plans that were not allocated to a specific function of government.
75

l _
l __
RECENT REPORTS FROM THE OFFICE OF THE STATE AUDITOR GOVERNMENT INFORMATION DIVISION
ANNUAL REPORTS:
• An Analysis of Minnesota's Municipal Liquor Store Operations in 1999 This annual report details the sales and profits of Minnesota's municipally-owned and operated liquor stores. May 2001
• Revenues, Expenditures and Debt of Minnesota Cities Over 2,500 in Population December 31, 1999 This annual report lists the sources and amounts of revenues, expenditures and outstanding debt for Minnesota cities over 2,500 in population during the most recent year. It also examines enterprise operations and the fund balances for the general and special revenue funds. June 2001
• Revenues, Expenditures and Debt of Minnesota Cities Under 2,500 in Population December 31, 1998 This annual report lists· the sources and amounts of revenues, expenditures and outstanding debt for Minnesota cities under 2,500 in population during the most recent year. It also examines enterprise operations. August 2000
• 1999 Local Government Lobbying Expenditures This annual report lists what local governments spend to lobby the Legislature and agencies of the state administration. March 2001
• 2000 Budget Data for Minnesota Cou11ties Together With 1999 Revised Budgets This annual report analyzes the unaudited revenues and expenditures budgeted for 2000 by county. It includes comparisons with 1999 budget data. February 2001
• 2000 Budget Data Together With 1999 Revised Budget Data - Cities Over 2,500 in Population This annual report analyzes the unaudited revenues and expenditures budgeted for 2000 by cities over 2,500 in population. It includes comparisons with 1999 budget data. August 2000
• 2000 Budget Data Together With 1999 Revised Budget Data - Cities Under 2,500 in Population This annual report analyzes the unaudited revenues and expenditures budgeted for 2000 by cities under 2,500 in population. It includes comparisons with 1999 budget data. October 2000
• Revenues, Expenditures and Debt of the Towns in Minnesota December 31, 1998 This annual report lists the sources and amounts ofrevenues, expenditures and outstanding debt for Minnesota towns for the most recent fiscal year. September 2000
• Revenues, Expenditures and Debt of Minnesota Counties December 31, 1999 This annual report lists the sources and audited amounts of revenues, expenditures and debt for Minnesota counties during the most recent fiscal year. It includes analysis of counties' enterprise operations and the fund balances for the general and special revenue funds. August 2001 ·
• Legal Costs Survey - July 1998 through June 1999 This annual report details the expenditure of public funds for legal services incurred to defend all counties, cities of the first, second, and third class, and school districts with enrollment exceeding 100 students, from lawsuits and amounts paid in voluntary settlements or judgements in any lawsuit. September 2000
• 2000 Criminal Forfeitures in the State of Minnesota , This annual report describes the amount of property and cash seized by law enforcement agents in 2000 criminal forfeitures and what happens to the forfeited items. June 2001
• Ranking of 1999 Per Capita Expenditures of Cities Over 2,500 in Population This annual report compares the per capita expenditures and debt of cities over 2,500 in population. June 2001
• Ranking of 1999 Per Capita Expenditures and Long-Term Debt- Counties - for the Year Ending December 31, 1999 This annual report ranks counties on the 10 current expenditure categories, total capital outlay and total debt service expenditures by both dollar amount and per capita dollar amount. It also ranks counties on outstanding long-term debt by both dollar amount and per capita dollar amount. August 2001
If you are interested in one of these recent reports, they are available on our web site at www.osa.state.mn.us. You can also call our office at (651) 297-3688 or email us at [email protected] to request a copy of the report.