Embed Size (px)
Citation preview

Revenue Potential for Himachal Pradesh
An Assessment and Suggestions for Reform
Final Report
R. Kavita Rao
Sacchidananda Mukherjee
D. P. Sengupta
NATIONAL INSTITUTE OF PUBLIC FINANCE AND POLICY (NIPFP)
18/2, SATSANG VIHAR MARG, NEW DELHI - 110 067
May 2013

Acknowledgements
In course of undertaking the study, the team had the opportunity of interacting with a number of
officials of various departments of Government of Himachal Pradesh. These interactions were
immensely useful in helping the team understanding the systems in place and the potential
difficulties in administering the existing system of taxes. While the following list is not a
comprehensive list, the team would like to place on record, our gratitude for the time and insights
these officials shared with us.
Department of Excise & Taxation
Shri J. C. Sharma, IAS - Excise and Taxation Commissioner (ETC)
Shri N.C. Beakta - Additional ETC (TRU)
Shri Hitesh Sharma – Deputy ETC (North Zone) Palampur
Dr. Sunil Kumar – Assistant ETC, Kangra
Shri Shiri Chand - AETC, Kullu
Shri K.D.P.S. Chauhan - AETC (Tax)
Shri Vivek Mahajan – AETC, Bilaspur
Shri Karam Chand – Excise & Taxation Officer (ETO), Dharamshala-I
Shri P. C. Kondal - ETO, Dharamshala-II
Shri Rakesh Kumar – Excise and Taxation Inspector (ETI), Dharamshala-I
Shri Dewan Chand – ETI, Dharamshala-II
Shri S. Thakur – ETI, Shimla
Shri Bhoop Ram - Superintendent (Tax)
Shri Tara Chand - Superintendent, Kangra
Department of Economics and Statistics
Shri Pankaj Sharma - Joint Director
Ms. Anita Rajan - Research Officer
Directorate of Energy
Er. Subhash Gupta - Chief Engineer
Er. R. N. Kaul - Consultant
Department of Transport
Shri Dhruv Vashist - Director
Shri Naresh Sharma

Himachal Pradesh Forest Department
Shri Vinay Tandon - Principal Chief Conservator of Forests
We are grateful to Dr. M. Govinda Rao and Dr. Tapas Sen for giving useful comments and
suggestions on the draft report.
The Team would also like to thank the assistance received from Deborshi Brahmachari, Suranjali
Tandon and Promila Rajvanshi in putting together the final document of the report.
NIPFP Study Team

Preface
The study on ‘Revenue Potential for Himachal Pradesh: An Assessment and Suggestions for
Reform’ was undertaken by the National Institute of Public Finance and Policy (NIPFP) at the
request of the Department of Excise and Taxation, Government of Himachal Pradesh, Shimla.
Changing fiscal environment and the constantly expanding government expenditure have led the
Government of Himachal Pradesh to explore the possibilities of augmenting its revenues. In this
context, the government has commissioned this study to address the issues of - a) trends in the
revenue receipts of Himachal Pradesh for identifying areas of relatively weak performance in
comparison with some similar States, b) detailed study of major taxes: State VAT, State excise,
transport taxes, and c) study of non-tax revenues of the States and identifying area and measures
for improving revenue performance.
This study was carried out by Dr. R. Kavita Rao, Dr. Sacchidananda Mukherjee and Mr.
D. P. Sengupta. The views expressed in the report are that of the authors and the members of the
Governing Body of the institute are no way responsible for them.
Rathin Roy
Director

i
Table of Contents
1 Introduction 1
1.1 Himachal Pradesh: A Snapshot 2
1.2 An Assessment of Fiscal Situation of Himachal Pradesh: 2000-
01 to 2009-10 3
1.3 Projection of Fiscal Situation of Himachal Pradesh: 2010-11 to
2014-15 4
2 Comparison of Revenue Performance with Selected States 11
2.1 An Overview of Revenue Performance of Himachal Pradesh 11
2.2 Revenue Performance of a few Selected Indian States: A
Comparison 17
2.3 A Comparison of Revenue Collection as Percentage of GSDP
(current prices) 19
3 Sales Tax 21
3.1 Introduction 21
3.2 Structure of the Levies and Policy Suggestions 22
3.3 Structural Factors: An Inter-state Comparison 25
3.4 Disaggregate Collections: Any Clues 30
3.5 District-wise Share in Total Sales Tax Collection of Himachal
Pradesh 32
3.6 Conclusions 37
4 State Excise Duty 43
4.1 Introduction 43
4.2 Consumption of Liquor across Selected Indian States 44
4.3 Consumption and State Excise Collection in Himachal Pradesh 46
4.4 Excise Policy: Implications and Suggestions 48
5 Transport Taxes 61
5.1 Introduction 61
5.2 Structure of Taxes 62
5.3 Trends in Revenue 65
5.4 Policy Recommendations 70
6 Other Taxes 73
6.1 Potential for Luxury Tax Collection in Himachal Pradesh 73
6.2 Potential for Profession Tax 77
6.3 Water Levy for Hydropower Projects 78
6.4 Conclusions 90

ii
7 Administrative Structure: An Assessment 91
7.1 Introduction to Administration of Excise and Taxation
Department 91
7.2 Process Review 101
7.3 Arrears in Collections 102
7.4 Adequacy of Number of Officials: Span of Control Analysis 104
7.5 Comparison of Organization with Other States 111
7.6 Recommendations 113
8 Implications of Moving to GST for Himachal Pradesh 124
8.1 Key features of the GST Regime 124
8.2 Implications of GST for Himachal Pradesh 127
9 Conclusions and Policy Recommendations 132
9.1 Commercial Taxes 132
9.2 State Excise 133
9.3 Transport Taxes 135
9.4 Luxury Tax 136
9.5 Profession Tax 137
9.6 Water Levy for Hydropower Projects 137
9.7 Administration 138
9.8 Goods and Services Tax 140
Annexure 142

iii
List of Tables
1.1 Himachal Pradesh: A Snapshot 3
1.2 Fiscal Situation of Himachal Pradesh: 2000-01 to 2009-10 4
1.3 Grants-in-Aid Disbursement to Himachal Pradesh 5
1.4 Fiscal Situation of Himachal Pradesh: 2010-11 to 2014-15 8
1.5 Proposed Grants-in-Aid to Himachal Pradesh under 13th
Finance
Commission 9
2.1 Own Tax and Non-Tax Revenue of Himachal Pradesh 12
2.2 Contribution of Tax and Non-tax Revenue of Himachal Pradesh 15
2.3 A Comparison of Revenue Collection as Percentage of GSDP
(current prices) 18
2.4 Average Collection of Taxes as Percentage of GSDP (at current
prices) 19
3.1 Sales Tax (excluding Central Sales Tax) Collection as Percentage of
GSDP at factor Cost (current prices) 22
3.2 Tax Base for Sales Tax/Value Added Tax – A Comparison 26
3.3 Role of Manufacturing Sector in GSDP: A Comparison 27
3.4 Value Addition per Worker in Un-organized Manufacturing Sector 29
3.5 Present Collection of Revenue from Construction Sector 31
3.6 Estimation of Domestic Product from Construction Sector (at 2004-
05 Prices) 31
3.7 District-wise, Year-wise Share in Total Sales Tax Collection of
Himachal Pradesh 33
3.8 District-wise, Turnover-wise Number of Dealers up to June 30, 2010 34
3.9 Number of Dealers Registered under the HPVAT Act 2005 and CST
Act 1956 36
3.10 Correlation with Revenue per District 37
4.1 A Comparison of State Excise Collection as Percentage of GSDP
at Factor Cost (current prices) 43
4.2 A Comparison of per Capita State Excise Collection 43
4.3 Annual Consumption of Liquor (in million litre) (rural & urban
combined) (population as on October 01, 2007) 45
4.4 Annual Expenditure on Liquor by Residence: A Comparison Across
Selected Indian States: 2007
45
4.5 Category-wise Sales and Revenue Collection from Liquor in
Himachal Pradesh 48
4.6 A Synoptic View on Excise Policy & Procedures in Himachal
Pradesh 50
4.7 Assessed Fee and Excise duty for 2010-11 - a Comparison 50
4.8 Comparison of System of Settlement for Retailers 2011-12 51

iv
4.9 A Comparison of Earnest Money between Himachal Pradesh and Haryana 53
4.10 Excise Duty Shortage due to Low Yield of Sprit from Molasses 56
4.11 Revenue to GSDP ratios before and after Beverages Corporations 58
5.1 Motor Vehicle Taxes on Passenger Transport 63
5.2 Motor Vehicle Taxes for Non-Transport and Transport Goods
Vehicles
63
5.3 Annual Rate of growth of Motor Vehicles Taxes 66
5.4 Annual Rate of Growth of Transport Taxes 66
5.5 Annual Additions to Registered Motor Vehicles 67
5.6 Transport Taxes per Vehicle 68
5.7 Percentage Share of Transport Vehicles in Total Number of
Registered Vehicles 69
5.8 Share of Two-Wheelers in Total Registered Vehicles 69
6.1 Collection of Luxury Tax in Himachal Pradesh 74
6.2 Revenue Potential Based on Tourist Arrivals (2009-10) 74
6.3 Revenue Potential Based on Room Availability (2009-10) 76
6.4 Department-wise Distribution of Regular Employees in Himachal
Pradesh 78
6.5 Water Rates in Chhattisgarh (with effective from 31.05.2010) 79
6.6 Size of Water Charges in Comparison with Revenue Collection
Hydropower Projects in Chhattisgarh 80
6.7 Water Rates for Hydro Power Project in Madhya Pradesh 80
6.8 Madhya Pradesh Power Generating Company Limited 81
6.9 Water Rates for Hydro Power Generation in Andhra Pradesh 82
6.10 Revenue Collection from Water Charges for Hydropower Projects in
Andhra Pradesh 83
6.11 Water Charges on NHPC Hydropower Stations in Jammu & Kashmir 84
6.12 Revenue Collection from Water Charges for NHPC Hydropower
Projects in Jammu and Kashmir 85
6.13 Cost of Water for Hydropower Generation as Percentage of Revenue
from Hydro Power (%) – A Comparison across States 85
6.14 Revenue Collection from Hydropower Projects 87
6.15 Projected Revenue Potential from Hydropower Projects 87
6.16 Daily Generation Information of SJVN Limited 89
7.1 Category-wise Personnel and Work Load of the Department of
Excise and Taxation during 1990-91, 2000-2001 and 2009-10
98
7.2 Spatial Variation of Workload of Excise and Tax Officer in
Himachal Pradesh 100
7.3 Comparative Picture of Cost of Tax Collection as a Percentage of
Corresponding Revenue Collection
102
7.4 Analysis of Arrears of Revenue for Selected States in India 103
7.5 Comparative picture of State Administrations Total Number of
Registered Dealers per Official 104

v
7.6 Number of Days of Work Associated with Assigned Functions:
Case Study of Kangra; Circle: HQ
105
8.1 Revenue Neutral Rate for Himachal Pradesh: An Illustration 129

vi
List of Figures
2.1 The Share of Transport Taxes in GSDP (at current prices) 14
2.2 Electricity Sales to Ultimate Consumer Utilities (GWh) in
Himachal Pradesh: 1998-99 to 2007-08 14
2.3 Change in Shares of Taxes in GSDP during 1990-2001 to 2001-
09: A Comparison across a few States in India 18
2.4 Average Collection of Taxes as Percentage of GSDP (at current
prices) 19
3.1 Share of Various Components of Industry Sector of Himachal
Pradesh in GSDP: 1999-00 to 2009-10
30
3.2 District-wise, Year-wise Share in Total Sales Tax Collection in
Himachal Pradesh 33
3.3 District-wise Share in Dealers and Sales Tax Collection 34
4.1 Sales of Liquor in Himachal Pradesh 47
7.1 Organizational Chart: Excise and Taxation Department 97

1
CHAPTER 1
Introduction
Changing fiscal environment and the ever expanding need for government
expenditure have led the Government of Himachal Pradesh to explore the possibilities
of augmenting its revenues. In this context, the Government has commissioned the
present study with the following terms of reference:
The study will cover
1. Trends in the Revenue receipts of Himachal Pradesh for identifying areas of
relatively weak performance, with comparison with some similar states
2. Detailed study of major taxes: State VAT, State excise, stamp duty and
registration fees, transport taxes
a. Study to cover both design of the tax and administration issues
3. Study of non-tax revenues of the state and identifying areas and measures for
improving revenue performance.
This study report attempts to address these terms of reference and is organised
as follows. The present chapter, after giving a brief snap shot of the state, presents an
assessment of the fiscal context which constitutes the background for this study.
While the fiscal context could justify a quest for higher revenues, it is also important
to examine whether raising additional revenue is feasible given the economic profile
of the state. In order to find some answers for this question, the second chapter
examines the performance of Himachal Pradesh compared to that of some other
similar and/or neighbouring states (Chapter 2). If the performance of the state,
suitably scaled for differences in size of population and/or GSDP, is poor when
compared to that of other comparable states, it would provide a basis to argue that
augmenting the revenues of the state exists within the realm of possibility. In the
following chapters, three important taxes of the state – taxes on goods (Chapter 3),
excise duties (Chapter 4) and transport taxes (Chapter 5) are taken up for a more
detailed analysis. Apart from these taxes, Chapter 6 explores some new sources of
revenue that the state can explore. Apart from policy prescriptions that emerge from
the analysis of these taxes, the analysis also suggests that there is a clear need to re-

2
examine the administrative structure of the revenue raising departments. Chapter 7
builds a case for augmenting the number of personnel as well as for re-organisation of
the department so as to develop the skills required to administer the taxes concerned.
Chapter 8 discusses the impact of a potential changeover to a Goods and Services Tax
for Himachal Pradesh. Finally, Chapter 9 summarises the recommendations of the
study.
We provide the status of Himachal Pradesh with reference to a few selected
socio-economic indicators vis-à-vis all India average in the next section. In section 2,
we document the evolution of the fiscal situation of the state for the period 2000-01 to
2009-10. Taking it forward, in section 3, we project the likely fiscal scenario of the
state for the period 2010-11 to 2014-15 incorporating the recommendations of the
Thirteenth Finance Commission.
1.1 Himachal Pradesh: A Snapshot
Himachal Pradesh is a hilly state in the northern part of India having
boundaries with Jammu and Kashmir, Uttarakhand, Uttar Pradesh, Punjab and
Haryana. The area of Himachal Pradesh is only one percent of India‟s total area and
the population of Himachal Pradesh accounts for only 0.5 percent of the total Indian
population (Table 1.1). Thus the density of population is well below the national
average and is one of the lowest among all States. Although the share of urban
population in the state is lower than the national average, the share of services in
NSDP is similar to the national average. The literacy rate in Himachal Pradesh is
quite high and the percentage of population below poverty line is better than the
national average. Inequality in Himachal Pradesh is somewhat higher than the all
India average. However, its performance in Human Development Indicator is better.
In terms of e-governance indicators, some studies suggest that Himachal Pradesh does
not fare well.1
1 “The Best and Worst E-governed States”, Anand Parthasarathy, The Hindu, March 18, 2007.
www.hindu.com/2007/03/18/stories/2007031800201200.htm

3
Table 1.1 Himachal Pradesh: A Snapshot
Indicators Year
Himachal
Pradesh All India
Area (in „000 sq kms) 2011 55.7 3287
Population (million persons) 2011 6.8 1210.2
Density of population (persons/ sq. km) 2011 123 382
Urban Population 2011 10.04 31.16
Literacy Rate (for age group 7 years and above) 2011 83.78 74.04
Per capita Net State Domestic Product at constant
prices (2004-05 base) 2010-11 43,318 35,917
Percentage share of Manufacturing# 2009-10 5.49 15.90
Percentage share of Services# 2009-10 55.04 57.30
Percentage below poverty line* 2009-10 22.90 37.20
Human Development Index Score - Rural* 2009-10 0.517 0.339
Human Development Index Score – Urban* 2009-10 0.576 0.436
Gini Coefficient of consumption - Rural 2009-10 0.262 0.270
Gini Coefficient of consumption – Urban 2009-10 0.373 0.362 Notes: # The percentage share of sectors is the share in NSDP constant prices, factor cost.
Sources: Census of India, 2011; NSSO, 2011.2
*- Mukherjee and Chakraborty (2011)3
1.2 An Assessment of Fiscal Situation of Himachal Pradesh: 2000-
01 to 2009-10
An assessment of the fiscal situation of Himachal Pradesh (HP) is important to
understand the revenue and expenditure dynamics of the State. As compared to the
period 2000-01 to 2004-05, the fiscal situation for HP as measured by overall deficit
indicators has improved during 2005-06 to 2009-10. As can be seen from Table 1.2, in
the second half of the last decade, except for the year 2009-10, HP was in fact mostly
revenue surplus. Substantial improvement in State‟s own non-tax revenue was the main
reason for the overall improvement in fiscal situation of the state. The improvement in
State‟s own-tax collection, and Grants-in-aid received from the Central Government
allowed the state to augment its capital expenditure. High economic growth in this
decade coupled with introduction of Value Added Tax (VAT) in 2005 possibly
contributed to some increases in the own tax revenue of the State as well. The overall
fiscal deficit, though almost contained at less than 3 percent of GSDP during 2005-08,
2 National Sample Survey Office (NSSO) (2011), “Level and Pattern of Consumer Expenditure: NSS 66
th
Round (July 2009 – June 2010)”, MOS&PI, Government of India, New Delhi. 3 Mukherjee, Sacchidananda and Debashish Chakraborty (2011), “Is there any Interdependence
Between Economic Growth and Human Development? Evidence from Indian States”, Indian Journal
of Human Development, Vol. 5(2), pp. 467-494.

4
shoots up again to 6.2 percent in 2008-09 and to 9.8 percent in 2009-10. This is perhaps
explained by the fact that while due to the economic slowdown, the growth in revenue
receipts slowed down, the government could not compress its expenditure enough to
contain the deficit.
Table 1.2: Fiscal Situation of Himachal Pradesh: 2000-01 to 2009-10
(Rs. Crore)
Description 2000-01 2002-03 2003-04 2005-06 2006-07 2007-08 2008-09 2009-10
Average
Share in
GSDP:
2005-10
Revenue Receipts (A+B) 3,046 3,659 3,981 6,559 7,835 9,142 9,308 10,346 26.20
Tax Revenue (A=a+b) 1,059 1,235 1,434 1,990 2,286 2,752 3,080 3,436 8.15
State's Own Tax Revenue (a) 728 888 984 1,497 1,656 1,958 2,242 2,575 5.97
State's Share in Central Taxes (b) 330 348 450 493 629 794 837 862 2.18
Non-Tax Revenue (B=c+d) 1,987 2,424 2,547 4,568 5,550 6,390 6,228 6,910 18.05
State's Own Non-tax Revenue (c) 177 175 292 690 1,337 1,822 1,756 1,784 4.40
Grants-in-Aid from Centre (d) 1,810 2,248 2,255 3,879 4,213 4,567 4,472 5,127 13.65
Revenue Expenditure (E) 4,329 5,141 5,588 6,466 7,644 8,292 9,438 12,420 26.52
Capital Expenditure (F) 549 860 785 821 1,110 1,413 2,079 2,043 4.39
Loans & Advance - Expenditure (G) 40 28 20 14 26 14 90 70 0.12
Loans & Advance - Receipts (H) 27 29 28 22 23 26 21 34 0.08
Revenue Deficit (RD= E-(A+B)) 1,283 1,482 1,607 -92 -191 -850 130 2,074
Fiscal Deficit (FD=RD+F+(G-H)) 1,845 2,342 2,384 720 921 552 2,278 4,153
RD as % of GSDP 8.2 7.8 7.8 -0.4 -0.7 -2.6 0.4 4.9
FD as % of GSDP 11.8 12.4 11.5 2.8 3.2 1.7 6.2 9.8
GSDP (at Factor Cost) current prices
(1999-2000 Series) 15,661 18,905 20,721 25,685 28,591 32,221 36,924 42,278
Year-to-Year Growth Rate of Nominal GSDP (%) 10.2 9.6 11.4 11.3 12.7 14.6 14.5 13.34*
Grants-in-Aid as % of Total Revenue
Receipts [d/(A+B)*100] 59.4 61.4 56.6 59.1 53.8 50.0 48.0 49.6 52.1
XIIth Finance Commission's Grants-in-Aid Transfers 2,354 2,340 2,346 2,243 2,029
FC Grants-in-Aid as % of Total
Central Grants-in-Aid (%) 60.7 55.6 51.4 50.1 39.6 51.5**
Notes: *-Compounded Annual Growth Rate (CAGR) during 2005-06 to 2009-10.
**- Average Share of Finance Commission Grants-in-Aid in Total Central Grants-in-Aid
Source: Finance Account of Himachal Pradesh (various years).
1.3 Projection of Fiscal Situation of Himachal Pradesh: 2010-11 to
2014-15
The projection of the fiscal situation of HP for 2010-11 to 2014-15 has been
carried out based on Thirteenth Finance Commission‟s projected growth rate of Gross
State Domestic Product (GSDP) (at factor cost, current prices, 1999-2000 series) of
HP and the Commission‟s recommendations regarding transfer of resources (both
State‟s share in central taxes and grants-in-aid).

5
An understanding of the grants-in-aid to be received from the centre is also
necessary before going into the details of the projection of the fiscal situation of the
State. Grants-in-aids from Central Government are classified under three broad heads
– a) non-plan grants (Finance Commission‟s Transfers and miscellaneous transfers to
finance non-plan expenditure of the State), b) plan grants (through the Planning
Commission) and c) grants for Centrally Sponsored Schemes (disbursed by various
Central Government Departments). In Appendix 1.1 head- and subhead-wise details
of Grants-in-Aid and Contributions received from the Central Government for 2009-
10 and 2010-11 is presented.
As indicated in Table 1.3, the share of Finance Commission‟s grants-in-aid to
total grants-in-aid disbursed by Central Government varied from 60.7 percent in
2005-06 to 39.6 percent in 2009-10, with the average being 51.47 percent.
Table 1.3: Grants-in-Aid Disbursement to Himachal Pradesh
(Rs. Crore) Heads and Sub-heads 2005-06 2006-07 2007-08 2008-09 2009-10
1601 Grants-in-Aids & Contributions
from Central Government 3,878.67 4,212.83 4,567.29 4,471.77 5,126.55
01 Non Plan Grants
104
Grants under the Proviso to
Article 275(1) of the
Constitution (A) - of which 2,164.12 2,259.45 2,264.83 2,137.39 1,962.07
01 Grants to cover deficit on Revenue
Account 2,164.12 2,157.14 2,120.96 1,991.64 1,818.52
02 Grants for Local Bodies - - 31.00 31.00 31.00
03 Grants in aid for Maintenance of
Roads and Bridges - 65.41 65.41 65.41 65.41
04 Grants in aid for Maintenance of
Public Buildings - 36.90 36.90 36.90 36.90
05 Maintenance of Forests - - 4.00 4.00 4.00
06 Grant in aid for Heritage
Conservation - - 2.50 - 2.50
07 State Specific Needs - - 4.06 8.44 3.74
109 Grants towards calamity relief
fund (B)* 188.49 77.70 79.99 103.63 63.68
02
Grants for State/ Union
Territory Plan Schemes – of
which
104
Grants under the Proviso to
Article 275(1) of the
Constitution (C) 1.34 3.30 1.65 1.48 3.60
Finance Commission's Grants-
in-Aid (Total) (A+B+C) 2,353.95 2,340.45 2,346.47 2,242.50 2,029.35
(60.7) (55.6) (51.4) (50.1) (39.6)
Note: *-also known as Grants towards Contribution to State Disaster Response Fund
Figure in the parenthesis shows the Finance Commission‟s Transfers of Grants-in-Aid as percentage of
Total Central Government‟s Grants-in-Aid and Contributions transfers (1601) to the State.
Source: Budget Documents (various years), Government of HP.
6
Table 1.2 shows that in HP, GSDP registered a nominal growth of 13.34
percent during 2005-06 to 2009-10. However, for calculating the projected growth
rate of GSDP for HP for 2010-11 to 2014-15 we have considered the Thirteenth
Finance Commission‟s projections for the State (see Table 1.4). Based on such
projected GSDP, we estimated the State's Own Tax and Non-tax Revenue, Revenue
and Capital Expenditure and Loans & Advance - Expenditure and Receipts (Table
1.4).4 The share of HP in shareable Central Taxes is estimated based on the Finance
Commission‟s Report, where the proposed Share in Central Taxes is the difference
between Pre- and Post-Devolution Non-plan Revenue Deficit/Surplus(-) (Table 1.4).
Being a special category State, the grants-in-aid received from the centre constitutes a
significant share of Total Revenue Receipts of HP. The average share of grants-in-aid
in total revenue receipts was 52.1 percent during 2005-06 to 2009-10. Therefore, to
get an idea on future profile of grants-in-aid that will be received as per the
recommendations of the Thirteenth Finance Commission; we have estimated the
proposed grants-in-aid receipt of HP for 2010-11 to 2014-15 in Table 1.5. However,
we could not take the proposed share of HP for the grants under „Performance
Incentive‟ and „Reduction in infant mortality rates‟, as both the grants are
performance led and estimation of share of the HP a priori is difficult. During 2005-
06 to 2009-10, the total Finance Commission‟s grants-in-aid disbursement constitutes
51.5 percent of total grants-in-aid received from Central Government. Assuming that
the same share will continue in the times to come, total grants-in-aid to be received by
HP during 2010-11 to 2014-15 has been derived based on figures for disbursement of
grants given by the Finance Commission. The resultant fiscal situation of HP is
presented in Table 1.4. The table indicates that the State may face severe fiscal stress
in the coming years. From the projected numbers, revenue deficit as a percentage of
GSDP shows an increasing trend with levels in the terminal year turning out to be as
high as 8.2 percent. Similar trends are observable for fiscal deficit as well with
expected levels of 12.7 percent if the present trends continue. This provides the
context for the present study, where an attempt is made to assess the revenue
performance of the State and identify measures by which the revenues stream can be
augmented.
4 The last column in Table 1.2 gives the averages (2005-06 to 2009-10) of Himachal Pradesh‟s Own
Tax and Non-Tax Revenue, Revenue and Capital Expenditure and Loans & Advance, as percentage of
GSDP. These ratios have been used to make the projections for 2010-11 to 2014-15.
7
The availability of the Finance Account of Government of Himachal Pradesh
for 2010-11 has enabled us to compare our projected figures with the actual
realisation of accounts for a year 2010-11 (Table 1.4). For Himachal Pradesh, the 13th
Finance Commission projected a nominal GSDP growth rate of 12.64 percent for
2010-11, whereas as per the quick estimate released by the Department Economics
and Statistics, Government of H.P., the state registered a growth rate (nominal) of
16.45 percent in 2010-11.5
High growth rate in GSDP during 2010-11 helped the state to raise additional
own-tax revenue of Rs. 816 crore over the expected collection of Rs. 2,826 crore (as
we projected based on Finance Commission‟s projection of nominal GSDP growth
rate). Instead of having high nominal growth rate of GSDP, the state's collection of
own non-tax revenue falls short of Rs. 386 crore from our projected figure of Rs.
2,081 crore.6 Instead the fall in collection of non-tax revenue, the overall Revenue
Receipts of the state gone up by Rs. 1,430 crore, due to substantial increase in Grants-
in-aid from the Central Government (an additional Rs. 877 crore over our projection
of Rs. 4,781 crore) and state‟s share in Central Taxes (Rs. 122 crore). The high
revenue receipts coupled with contraction in capital expenditure helped the State to
control the rise in revenue expenditure by Rs. 1,400 crore over and above our
projection. In 2010-11, revenue and fiscal deficit was 2.3 percent and 5.8 percent
respectively which are lower than the projections.
Revenue collection from both tax and non-tax sources and controlling revenue
expenditure should be immediate priority of the Government of Himachal Pradesh. To
comply with the FRBM Act as well as for sustaining long-run fiscal health of the
state, the government needs to look for new avenues for resource mobilisation.
5 From Provisional Estimate of Rs. 46,969.14 crore in 2009-10, GSDP of Himachal Pradesh has gone
up to Rs. 54,695.21 crore in 2010-11 (quick estimate) (source: http://himachal.nic.in/
economics/REPORTS/StateAbstract2013_A1b.pdf, page No. 60) 6 The fall in non-tax revenue collection is mainly attributable to fall in revenue collection from hydel
power generation projects (Rs. 121.59 crore, from Rs. 1214.80 crore in 2009-10 to Rs. 1093.21 crore in
2010-11).

8
Table 1.4: Fiscal Situation of Himachal Pradesh: 2010-11 to 2014-15 (Rs. Crore)
Sl.
No.
Description Projected Actual
2010-11 2011-12 2012-13 2013-14 2014-15 2010-11
1 Revenue Receipts (A+B) 11,281 12,339 13,264 13,490 14,300 12,711
2 Tax revenue (A=a+b) 4,419 5,064 5,831 6,716 7,738 5,358
3 State's Own Tax Revenue (a) 2,826 3,196 3,628 4,117 4,673 3,642
4 State's Share in Central
Taxes (b) 1,593 1,868 2,203 2,599 3,065 1,715
5 Non-Tax Revenue (B=c+d) 6,862 7,275 7,433 6,773 6,561 7,353
6 State's Own Non-tax
Revenue (c) 2,081 2,354 2,672 3,032 3,442 1,695
7 Grants-in-Aid from Centre
(d) 4,781 4,921 4,761 3,741 3,120 5,658
8 Revenue Expenditure (E) 12,546 14,191 16,107 18,281 20,749 13,946
9 Capital Expenditure (F) 2,075 2,347 2,664 3,023 3,432 1,789
10 Loans & Advance -
Expenditure (G) 56 64 72 82 93 227
11 Loans & Advance - Receipts
(H) 36 41 47 53 60 73
12 Revenue Deficit (RD= E-
(A+B)) 1,265 1,852 2,843 4,792 6,449 1,235
13 Fiscal Deficit
(FD=RD+F+(G-H)) 3,360 4,222 5,533 7,844 9,914 3,178
14 RD as % of GSDP 2.7 3.5 4.7 7.0 8.2 2.3
15 FD as % of GSDP 7.1 7.9 9.1 11.4 12.7 5.8
16 GSDP (at Factor Cost)
current prices (1999-2000
series) 47,314 53,517 60,742 68,942 78,249 54,695
17 Year-to-Year Growth Rate of
GSDP (%) 12.64 13.11 13.5 13.5 13.5 16.45
18 Additional Revenue required
to achieve 0% Revenue
Deficit (at per FRBM Act)
(I) 1,265 1,852 2,843 4,792 6,449 1,235
19 Revenue required to achieve
3% Fiscal Deficit at per
FRBM Act) (J) 1,438 1,629 1,847 2,093 2,373 1,641
20 Non-Plan Revenue Deficit
projected by the XIIIth
Finance Commission 2,232 2,055 1,883 1,313 406
Notes: Sl. No. 3, 6, 8-11 are projections, based on the average share as presented in Table 1 (last
column) and the projected GSDP for Himachal Pradesh as given by the Thirteenth Finance
Commission.
Sl. No. 4 and 7 are based on projections based on 13th Finance Commission's proposed
disbursement
Sl No. 16 and 17 are based on 13th Finance Commission's projection
Sl. No. 4, Proposed Share in Central Taxes is the difference between Pre- and Post-Devolution
Non-plan Revenue Deficit/Surplus(-) (Rs. Crore)
The source of the last column is the Finance Account of Himachal Pradesh: 2010-11
Source: Computed by the Authors

9
Table 1.5: Proposed Grants-in-Aid to Himachal Pradesh under XIIIth Finance Commission
(Rs. Crore)
Sl.
No.
Description
Actual Proposed
2010-11 2010-11 2011-12 2012-13 2013-14 2014-15 2010-15
Total
Disbursement
I Local Bodies 59.11 59.77 93.01 136.65 161.45 190.75 641.53 (0.73) 87,519
II
Disaster relief
(including capacity
building)* 271.64 121.68 127.57 133.75 140.24 147.06 670.30 (2.54) 26,373
III
Post-devolution
non-plan revenue deficit 2,232 2,232 2,055 1,883 1,313 406 7,889.00 (15.23) 51,800
IV
Performance
incentive (0) 1,500
V Elementary education 20 20.00 21.00 23.00 24.00 25.00 113.00 (0.47) 24,068
VI Environment 12.58 28.58 41.16 41.16 208.72 332.20 (2.21) 15,000
(a) Protection of
forests 12.58 12.58 12.58 25.16 25.16 25.16 100.64 (2.01) 5,000
(b) Renewable
energy 167.56 167.56 (3.35) 5,000
(c) Water sector
management 0 16.00 16.00 16.00 16.00 64.00 (1.28) 5,000
VII
Improving
outcomes 0.00 0.00 0.00 0.00 100.17 100.17 (0.69) 14,446
(a) Reduction in
infant mortality
rates (0) 5,000
(b) Improvement in supply of
justice 12.96 64.77 64.77 (1.3) 5,000
(c) Incentive for issuing Unique
Identity numbers
(UIDs) 0.64 6.40 6.40 (0.21) 2,989
(d) District innovation fund 0 12.00 12.00 (1.95) 616
(e) Improvement
of statistical systems at the
state and district
levels 0 12.00 12.00 (1.95) 616
(f) Employee
and pension data
base 2.5 5.00 5.00 (2.22) 225
VIII
Maintenance of roads and
bridges 0 89.00 102.00 115.00 130.00 436.00 (2.19) 19,930
IX State-specific needs** 3.7 0.00 87.50 87.50 87.50 87.50 350.00 (1.25) 27,945
X
Interest Relief
on NSSF
Loans*** 13.33 24.08 22.90 21.54 20.19 18.84 107.55 (0.8) 13,517
Total (I to X) 2,628.45 2,482.69 2,553.14 2,469.76 1,943.70 1,622.93 11,072.12 (3.55) 311,544
Total (without
X) 2,615.12 2,458.61 2,530.24 2,448.22 1,923.51 1,604.09 10,964.57
Notes: Figure in the parenthesis shows the percentage share of Himachal Pradesh in Total Disbursement of the
13th
Finance Commission‟s Grants-in-Aid.
*- For 2010-11 (Actual), we have taken grants-in-aid received under sub-sub-head 01 State Disaster Response
Fund Grants under sub-head 109 Grants Towards Contribution to State Disaster Response under broad head 01
Non Plan Grants
**-For 2010-11 (Actual) it includes Rs. 2.5 grants-in-aid received towards Heritage Conservation
***-For 2010-11 (Actual), we have taken grants-in-aid received under sub-sub-head 01 Article 275(1) Plan
Grants of sub-head 104 Grants under Provision to Article 275(1) of the Constitution of broad head 02 Grants
for State/U.T. Plan Schemes
Source: Compiled from the Report of the Thirteenth Finance Commission.

10
Appendix 1.1
C. Grants-in-Aid and Contributions 2009-10 2010-11
1601. Grants-in-Aid from central Government
01 Non-Plan Grant
055 Police 10.80 16.39
070 Other Administrative Services 0.79 1.57
104 Grants under Provisio of Article 275(1) of the Constitution 1,962.07 2,343.49
109 Grants towards Contribution to State Disaster Response Fund 63.68 271.64
110 Grants from National Calamity Contingency Fund 14.58
205 Art and Culture 0.09
235 Social Security and Welfare 0.06
Total - 01 2,052.08 2,633.09
02 Grants for State / Union Territory Plan Schemes
101 Block Grants
(i) Accelerated Irrigation Benefits programme 133.88 117.77
(ii) Additional Central Assistance for Externally Aided project 614.36 346.39
(iii) National Social Assistance Programme i.e., Annapurna 21.79 28.28
(iv) Normal Central Assistance 989.35 1,161.84
(v) Special Central Assistance for Border areas 12.76 12.80
(vi) Central Assistance under Special plan assistance 823.80 832.00
(vii) National E-Governance Plan 4.00 6.77
(viii) Nutrition programme for Adolescent girls 1.19
(ix) Jawahar Lal Nehru National Urban renewal Mission (JNNURM) 39.28 11.74
(x) Rashtriya Krishi Vikas Yojana (RKVY) 94.85
(xi) Tribal Sub Plan 5.50
(xii) Additional Central Assistance for long term reconstruction of assests
damaged due to flood 0.49
(xiii) Additional central Assistance for other project (Sports infrastructure) 2.15 1.00
(xiv) Roads and Bridges 12.06 17.44
Total - 101 2,655.12 2,636.39
104 Grants under Provision to Article 275(1) of the Constitution 3.6 13.33
800 Other Grants 72.23 30.5
Total - 02 2,730.95 2,680.22
03 Grants for Central Plan Schemes
101 Special Central Assistance to S.C. Component Plan 4.54 0.85
102 Special Central Assistance to tribal Sub-Plan 0.28
Total - 03 4.54 1.13
04 Grants for centrally Sponsored Plan Schemes
029 Land Revenue 2.29
059 Public Works 4.68 5.90
070 Other Administrative Services 2.12
202 General Education 62.99 86.93
204 Sports and Youth Services 2.15 5.14
210 Medical and Public Health 0.16
211 Family Welfare 62.51 46.05
215 Water Supply and Sanitation 60.96 0.24
217 Urban Development 0.12
225 Welfare of Scheduled Caste, Scheduled tribes and other Backward
Classes 3.66 33.81
235 Social Security and Welfare 100.28 116.08
236 Nutrition 0.46 0.25
401 Crop Husbandry 24.30 30.10
403 Animal Husbandry 2.30 8.01
404 Dairy Development 0.26 0.69
405 Fisheries 0.15 0.23
406 Forestry and Wild Life 5.48 5.42
452 Tourism 0.30 0.10
454 Census, Survey and Investigation 0.23 0.45
501 Special Programme for Rural Development 0.50
702 Minor Irrigation 0.34
810 Non Conventional Sources of Energy 0.07 0.63
851 Village and Small Industries 3.34 2.44
Total - 04 338.9803 343.1288
Total (1601) 5,126.55 5,657.57
Total - C.Grants-in-Aid and Contributions 5,126.55 5,657.57
Grand Total - Receipt Heads (Revenue Account) 10,346.36 12,710.61
Details of Grants-in-Aid and Contributions received during 2009-10 and 2010-11 (Rs. Crore): Himachal Pradesh

11
CHPAPER 2
Comparison of Revenue Performance with
Selected States
2.1 An Overview of Revenue Performance of Himachal Pradesh
Himachal Pradesh has been recording significant improvement in its revenue
performance since 1990 (Table 2.1). In order to assess the performance of the state,
the decade is divided into two periods 1990-91 to 1999-2000 (period 1) and 2000-01
to 2008-09 (period 2). During period 1, the average receipts from own tax revenue
was 4.51 percent of GSDP and for second period it was 5.40 percent.1 The rise in own
tax revenue in period two is mainly on account of increases in sales tax revenue. The
revenue from sales tax/ VAT has the largest share in total own tax revenue of
Himachal Pradesh. The average share of sales tax in total own tax revenue was 35.90
percent during period one and has gone up to 47.36 percent during period two. There
are two significant changes in the states in the second period which could be
responsible for this change – introduction of VAT and some consequent expansion in
the tax base, and second expansion in economic activity following the introduction of
tax holiday package by the Union Government. The Union government had
introduced a tax holiday package spanning direct as well as indirect taxes in the year
2003. This could have led to an expansion in the production activities in the state and
the resultant increase in economic activities in the state might account for the spurt in
the tax revenues of the state.
1 Unless or otherwise mentioned by GSDP, we mean Gross State Domestic Product at Factor Cost (at current
prices) 1999-2000 Series

12
Table 2.1: Own Tax and Non-Tax Revenue of Himachal Pradesh
(Percent of GSDP)
Description
2000-
01
2001-
02
2003-
04
2005-
06
2006-
07
2007-
08
2008-
09
Average
for
Period 2
Average
for
Period 1
(A) Total own tax revenue
(a+b+c) 4.65 5.34 4.75 5.83 5.79 6.08 6.07 5.4
4.5
(a) Taxes on income -- -- -- -- -- -- -- 0.0 0.0
(b) Taxes on property and capital
transactions 0.21 0.50 0.26 0.33 0.33 0.28 0.32 0.3 0.2
Land Revenue 0.02 0.30 0.00 0.00 0.01 0.01 0.05 0.0 0.0
Stamps and Registration Fees 0.19 0.20 0.25 0.32 0.32 0.27 0.27 0.3 0.2
Urban Immovable Property
Tax -- -- -- -- -- -- -- 0.0 0.0
(c) Taxes on commodities and
services 4.44 4.84 4.49 5.50 5.46 5.80 5.75 5.1 4.3
State Excise 1.34 1.38 1.35 1.28 1.20 1.21 1.17 1.3 1.5
Sales Tax 1.93 2.07 2.11 2.83 3.20 3.39 3.38 2.6 1.6
Taxes on Vehicles 0.39 0.77 0.38 0.40 0.37 0.35 0.37 0.4 0.2
Taxes on Goods & Passengers 0.27 0.20 0.16 0.17 0.18 0.17 0.17 0.2 0.7
Taxes and Duties on
Electricity 0.17 0.05 0.08 0.35 0.11 0.25 0.21 0.2 0.1
Other taxes and Duties 0.34 0.37 0.41 0.48 0.42 0.43 0.46 0.4 0.2
(B) Total own non-tax revenue
(d+e+f+g+h) 1.13 1.16 1.41 2.69 4.68 5.66 4.76 2.8 2.3
(d) Fiscal services 0.00 0.00 0.00 0.00 0.00 0.00 0.00 0.0 0.0
(e) Interest receipts, dividend and
profits 0.10 0.05 0.06 0.30 0.31 0.21 0.45 0.2 0.3
(f) General services 0.21 0.19 0.18 0.18 0.44 0.34 0.19 0.2 0.3
(g) Social services 0.19 0.20 0.30 0.28 0.25 0.27 0.26 0.2 0.2
Education, sports, art &
culture 0.08 0.09 0.20 0.16 0.15 0.16 0.15 0.1 0.0
Medical and public health 0.03 0.02 0.02 0.02 0.02 0.02 0.02 0.0 0.0
Family welfare 0.00 0.00 0.00 0.00 0.00 0.00 0.00 0.0 0.0
Water supply and sanitation 0.03 0.05 0.05 0.05 0.05 0.05 0.05 0.0 0.0
Housing 0.01 0.01 0.01 0.01 0.01 0.01 0.01 0.0 0.1
Social security and welfare 0.02 0.01 0.01 0.01 0.01 0.01 0.01 0.0 0.0
(h) Economic services 0.63 0.72 0.87 1.91 3.68 4.84 3.85 2.1 1.5
Crop Husbandry 0.03 0.05 0.02 0.03 0.01 0.02 0.01 0.0 0.0
Animal Husbandry 0.01 0.01 0.00 0.00 0.00 0.00 0.00 0.0 0.0
Fisheries 0.01 0.01 0.00 0.00 0.00 0.00 0.00 0.0 0.0
Forestry and Wildlife 0.11 0.17 0.37 0.58 0.16 0.17 0.15 0.3 1.0
Cooperation 0.01 0.01 0.01 0.01 0.03 0.02 0.01 0.0 0.1
Other Agricultural
Programme 0.00 0.00 0.00 0.00 0.00 0.00 0.00 0.0 0.0
Other Rural Development
Programme 0.00 0.00 0.02 0.01 0.02 0.01 0.01 0.0 0.0
Power 0.06 0.04 0.17 0.98 3.18 4.39 3.40 1.5 0.0
Village and Small Industries 0.01 0.00 0.00 0.00 0.00 0.00 0.00 0.0 0.0
Industries 0.27 0.15 0.08 0.09 0.09 0.03 0.02 0.1 0.2
Non-ferrous Mining and
Metallurgical Industries 0.08 0.19 0.18 0.17 0.17 0.18 0.21 0.2 0.2
(i) Grants from centre 11.56 13.28 10.88 15.10 14.73 14.18 12.11 12.6 9.9
(C) Total non-tax revenue (B+i) 12.69 14.43 12.29 17.79 19.41 19.83 16.87 15.4 12.2
Note: The above figures are percentage of GSDP at factor cost.
Source: Computed from Finance Accounts of Himachal Pradesh (various years) and EPWRF (2009).

13
State excise collections rank second in terms of share in total own tax revenue
for Himachal Pradesh. However, it is noticed that the average of state excise
collections declined from 1.48 percent of GSDP during period one to 1.30 percent
during period two. While there is fluctuation around 1.48 percent in period 1, the
decline is in evidence from 2002-03 in period 2. The tax to GSDP ratio in 2008-09 for
instance is only 1.17 percent, which is distinctly lower than the average for the second
period as well. An attempt has been made in the chapter relating to excise to analyse
the probable reasons for this downward trend.
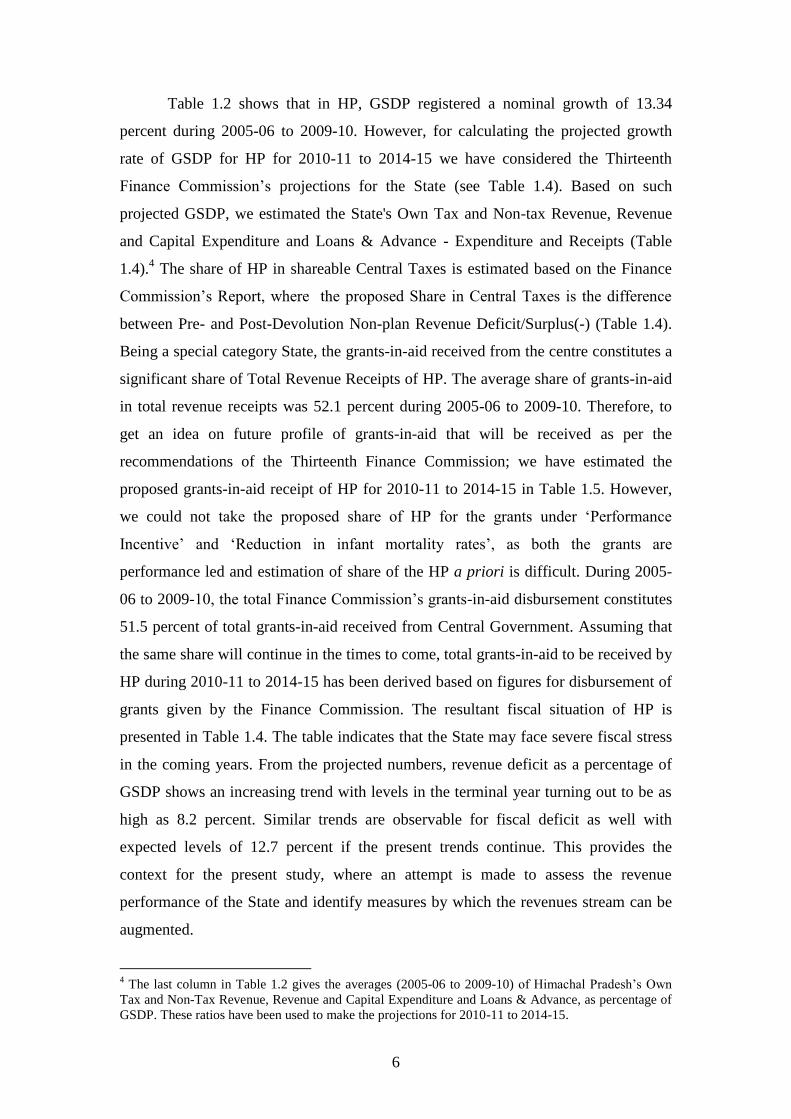
The share of taxes on vehicles, goods and passengers tax and electricity duty
exhibits fluctuations and there are no discernible, stable trends in these taxes. Both
motor vehicles tax and passenger and goods tax record relatively high levels in 2001-
02 but in all subsequent years, they settle down to a lower level with some
fluctuations. Taken together, the transport taxes contribute less than 0.62 percent of
GSDP in period 2, which is somewhat lower than the 0.87 percent recorded in period
1. The continuous fall in share of passenger and goods tax in GSDP since 1997-98 is
the major reason for falling share of transport taxes in GSDP. Since 2001-02, the fall
in share of taxes on vehicles is also pulling down the share of transport taxes in
GSDP. In other words, transport taxes in their present structure and administration do
not appear to be a sustainable source of revenue for the State and suggesting that there
is need for policy interventions to revive this source of revenue for the State. The
chapter on transport taxes attempts to identify the factors generating such a trend in
order to find ways of making the tax more buoyant.
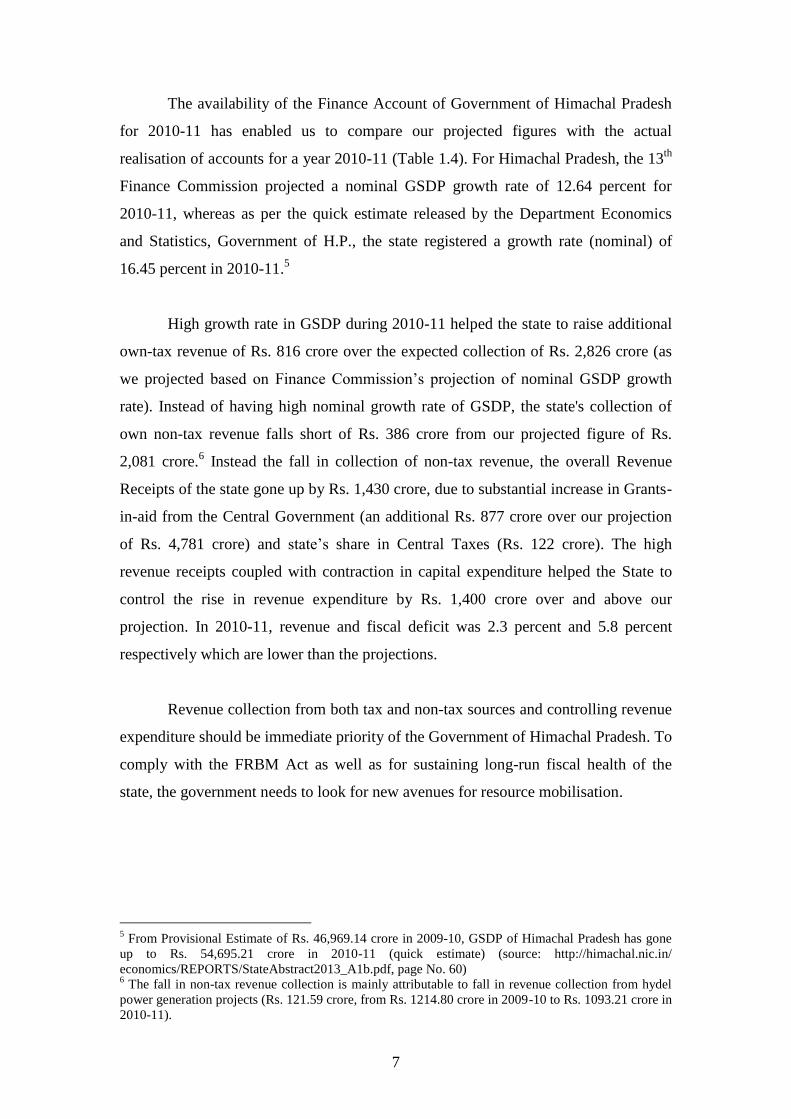
Electricity duty collections show a lot of fluctuation in the state (Table 2.1 and
Figure 2.2). These fluctuations however do not seem to be related to the fluctuations
in power consumption in the State. Consumption of electricity for domestic,
commercial and industrial uses has been consistently going up over the years. While
in one of the years, the Finance Accounts for the state indicate that the decline in
2006-07 is on account of late receipt of the dues from the electricity board (in April
2007), it is not clear such factors alone account for the fluctuations or there are other
factors at work. For instance, in an attempt to encourage new investments in the state,
the industrial policy of the state promises exemption from electricity duty to such
14
units. It is not clear whether such a policy too could have added more volatility to the
collections from this source of revenue.
Figure 2.1: The Share of Transport Taxes in GSDP (at current prices)
Source: Himachal Pradesh State Finance Account Data (various years).
Figure 2.2: Electricity Sales to Ultimate Consumer Utilities (GWh) in Himachal
Pradesh: 1998-99 to 2007-08
Notes: *-includes electricity supplied for public lighting, public water works, sewage
pumping and miscellaneous purposes
**-excludes electricity supply to outside state
Source: TERI Energy Data Directory Yearbook (various years).

15
Another tax which often commands an important place in the resources of a
State is the stamp duty and registration fees. In Himachal Pradesh this tax contributes
only about 0.3 percent of GSDP. The collections from this tax have increased till
2004-05 after which they have declined. The restriction on buying, owning and
reselling of property for people who do not have domicile of Himachal Pradesh,
could contribute to the absence of a vibrant land/property market in Himachal
Pradesh. In addition, the relatively small size of urban population – 10.04 percent in
Himachal Pradesh as compared to an All-India average of 31.16 percent (as per
Population Census of India - 2011) – could account for the comparatively small role
of this source of revenue in the state’s revenue profile.
Table 2.2: Contribution of Tax and Non-tax Revenue of Himachal Pradesh
Description
2000-
01
2001-
02
2002-
03
2003-
04
2004-
05
2005-
06
2006-
07
2007-
08
2008
-09
As percentage of Total Own Tax Revenue
(a) Taxes on income
(b) Taxes on property
and capital transactions 4.54 9.41 4.73 5.41 6.2 5.58 5.7 4.54 5.29
Land Revenue 0.53 5.66 0.52 0.09 0.18 0.07 0.12 0.1 0.9
Stamps and
Registration Fees 4.01 3.74 4.21 5.32 6.02 5.51 5.58 4.44 4.38
(c) Taxes on
commodities & services 95.46 90.59 95.27 94.59 93.80 94.42 94.30 95.46 94.71
State Excise 28.72 25.81 30.81 28.46 23.96 21.98 20.64 19.89 19.26
Sales Tax 41.47 38.78 43.19 44.37 43.32 48.56 55.21 55.77 55.58
Taxes on Vehicles 8.38 14.49 9.24 7.96 8.61 6.78 6.42 5.81 6.04
Taxes on Goods and
Passengers 5.91 3.74 3.54 3.45 3.06 2.85 3.03 2.81 2.78
Taxes and Duties on
Electricity 3.76 0.91 0.03 1.69 7.03 5.96 1.84 4.17 3.52
Other taxes and
Duties 7.22 6.86 8.46 8.66 7.81 8.29 7.17 7.00 7.54
As percentage of Total Non- Own Tax Revenue
(d) Fiscal services
(e) Interest receipts,
dividend and profits 8.82 4.32 6.03 4.06 7.12 11.29 6.66 3.73 9.54
(f) General services 18.72 16.16 21.04 12.71 9.48 6.86 9.32 6.01 4.08
(g) Social services 16.93 16.90 18.82 21.30 9.25 10.56 5.37 4.75 5.54
Education, sports, art
& culture 7.46 7.70 8.33 14.35 5.07 6.04 3.17 2.89 3.24
Medical and public
health 2.85 1.67 1.76 1.15 0.61 0.77 0.40 0.42 0.47
Family welfare 0.03 0.08 0.07 0.02 0.01 0.01 0.01 0.00 0.00
Water supply and
sanitation 2.90 4.27 5.56 3.79 1.93 1.89 1.00 0.81 1.03
Housing 1.03 1.02 0.98 0.56 0.28 0.28 0.15 0.11 0.12
Social security and
welfare 1.88 1.29 0.84 0.52 0.59 0.26 0.12 0.17 0.20
Others 0.77 0.85 1.27 0.91 0.77 1.32 0.52 0.34 0.48
(h) Economic services 55.53 62.63 54.11 61.93 74.15 71.29 78.66 85.51 80.85
Crop Husbandry 2.29 4.06 2.57 1.21 0.73 1.22 0.3 0.32 0.31
Animal Husbandry 0.71 0.65 0.38 0.15 0.07 0.08 0.03 0.02 0.03
Fisheries 0.62 0.58 0.48 0.24 0.13 0.11 0.06 0.06 0.07
Forestry and Wildlife 9.35 14.61 17.96 26.37 16.73 21.7 3.41 2.94 3.15
16
Description
2000-
01
2001-
02
2002-
03
2003-
04
2004-
05
2005-
06
2006-
07
2007-
08
2008
-09
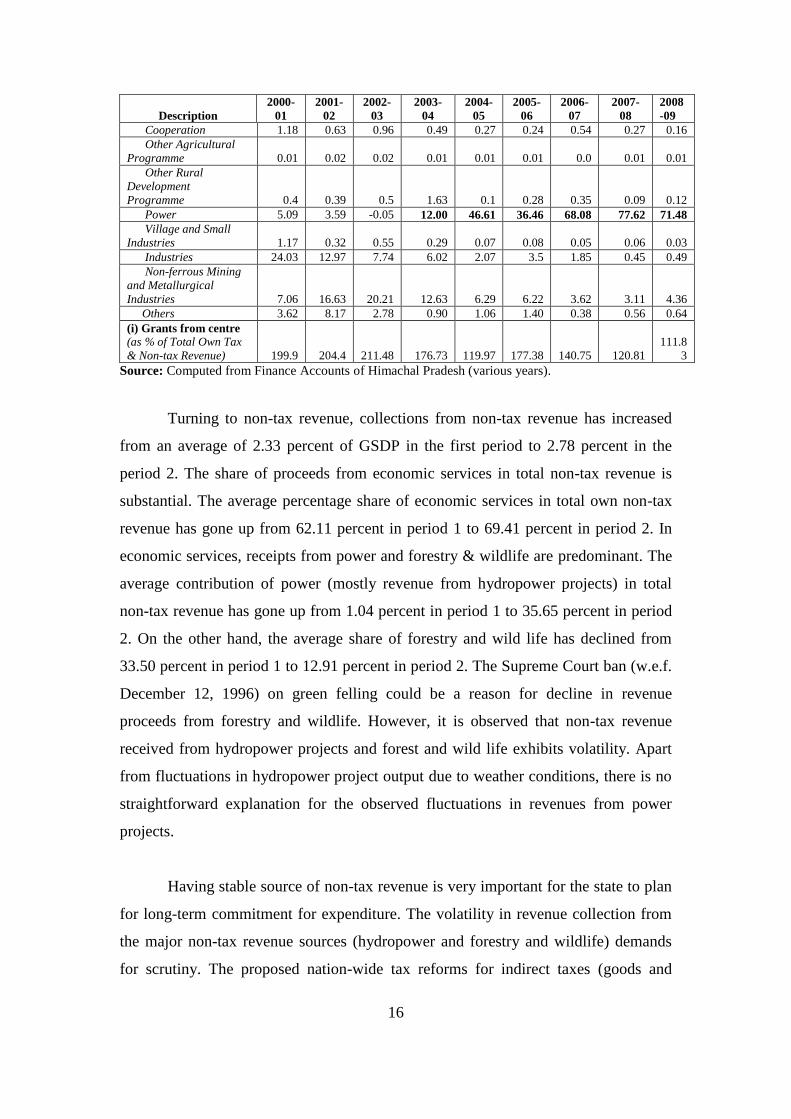
Cooperation 1.18 0.63 0.96 0.49 0.27 0.24 0.54 0.27 0.16
Other Agricultural
Programme 0.01 0.02 0.02 0.01 0.01 0.01 0.0 0.01 0.01
Other Rural
Development
Programme 0.4 0.39 0.5 1.63 0.1 0.28 0.35 0.09 0.12
Power 5.09 3.59 -0.05 12.00 46.61 36.46 68.08 77.62 71.48
Village and Small
Industries 1.17 0.32 0.55 0.29 0.07 0.08 0.05 0.06 0.03
Industries 24.03 12.97 7.74 6.02 2.07 3.5 1.85 0.45 0.49
Non-ferrous Mining
and Metallurgical
Industries 7.06 16.63 20.21 12.63 6.29 6.22 3.62 3.11 4.36
Others 3.62 8.17 2.78 0.90 1.06 1.40 0.38 0.56 0.64
(i) Grants from centre
(as % of Total Own Tax
& Non-tax Revenue) 199.9 204.4 211.48 176.73 119.97 177.38 140.75 120.81
111.8
3
Source: Computed from Finance Accounts of Himachal Pradesh (various years).
Turning to non-tax revenue, collections from non-tax revenue has increased
from an average of 2.33 percent of GSDP in the first period to 2.78 percent in the
period 2. The share of proceeds from economic services in total non-tax revenue is
substantial. The average percentage share of economic services in total own non-tax
revenue has gone up from 62.11 percent in period 1 to 69.41 percent in period 2. In
economic services, receipts from power and forestry & wildlife are predominant. The
average contribution of power (mostly revenue from hydropower projects) in total
non-tax revenue has gone up from 1.04 percent in period 1 to 35.65 percent in period
2. On the other hand, the average share of forestry and wild life has declined from
33.50 percent in period 1 to 12.91 percent in period 2. The Supreme Court ban (w.e.f.
December 12, 1996) on green felling could be a reason for decline in revenue
proceeds from forestry and wildlife. However, it is observed that non-tax revenue
received from hydropower projects and forest and wild life exhibits volatility. Apart
from fluctuations in hydropower project output due to weather conditions, there is no
straightforward explanation for the observed fluctuations in revenues from power
projects.
Having stable source of non-tax revenue is very important for the state to plan
for long-term commitment for expenditure. The volatility in revenue collection from
the major non-tax revenue sources (hydropower and forestry and wildlife) demands
for scrutiny. The proposed nation-wide tax reforms for indirect taxes (goods and

17
services tax) will leave little scope for individual states to set their own rates,
exemptions and thresholds and it is not desirable also for tax harmonisation across
Indian states. Therefore, non-tax revenue could be an area where individual states
could look for more revenue.
2.2 Revenue Performance of a few Selected Indian States: A
Comparison
While historical trends can provide one method of assessing the performance
of a state, comparison with similar other states provides an alternative. Historical
trends can help identify areas where the performance of the state has become worse
over time. On the other hand, inter-state comparisons, suitably normalised, provide a
basis to identify areas where improvements are feasible, even if the performance of
the state has not become worse. For such an inter-state comparison, two different
benchmarks are considered. Considering the fact that Himachal Pradesh is a hilly state
with an incentive regime in place, Uttarakhand provides a good point of comparison.
And since Uttarakhand shares its historical antecedents with Uttar Pradesh, this State
is also added to the comparison. On other hand, Himachal Pradesh shares a lineage
with Punjab and Haryana, in terms of its tax laws. Even today, the Punjab Excise Act
along with the Distillery and Brewery rules continue to be adopted in Himachal
Pradesh. Taken together these States would be referred to as comparable states in the
rest of the study. The following section provides a comparison of the performance of
Himachal Pradesh with these states. Further, an all states average too is taken as a
benchmark for assessment.
As seen earlier, for Himachal Pradesh (HP), own tax revenue (OTR) as a
percentage of GSDP was 4.51 percent in period 1 and has gone up to 5.40 percent in
period 2. The major change in Himachal Pradesh’s tax collection came from 1
percentage point increase in sales tax collection - despite a fall in state excise
collection, and collection from taxes on goods and passengers. For Uttar Pradesh (UP)
and Uttarakhand (UK), the collections from OTR as percentage of GSDP have gone
up by over 1 percentage point; for Himachal Pradesh, Punjab (PB) and Haryana (HR),
the increase is less than one percentage point. For Himachal Pradesh, Uttar Pradesh

18
and Uttarakhand, the major improvement in tax collection was due to improvement in
sales tax (Figure 2.3). For Punjab and Haryana, there is an increase in tax collections
till 2005-06 after which there is a decline. For Haryana, when compared to 2001-02,
the sales tax to GSDP ratio for 2008-09 was lower. For Punjab, this point-to-point
comparison indicates an increase of 0.69 percentage points (Table 2.3).
Figure 2.3: Change in Shares of Taxes in GSDP during 1990-2001 to 2001-09:
A Comparison across a few States in India
Source: Finance Accounts of the States (various years) and EPWRF (2009).
For the selected States, the average revenue from taxes during 2000-01 to
2008-09 as a percentage of GSDP is presented Figure 2.4. The figure shows that total
own-tax revenue of Himachal Pradesh is substantially lower than that of other States.
This is probably due to the fact that the collections from sales tax, stamp duty and
registration fees are lower in Himachal Pradesh. The state’s excise collections are
lower than in Punjab and are marginally higher than in Uttar Pradesh and
Uttarakhand. In so far as taxes on vehicles, goods and passengers are concerned, the
performance of Himachal Pradesh is poorer than that of Haryana and is at par with
Punjab. The above analysis thus indicates that there is scope for improvement for
Himachal Pradesh at least in terms of sales tax and excise collections.

19
Figure 2.4: Average Collection of Taxes as Percentage of GSDP (at current prices)
Note: For all States, the numbers are in Percentage of GSDP at Factor Cost (current prices).
Source: Finance Accounts of the States (various years) and EPWRF (2009.
Table 2.3: A Comparison of Revenue Collection as Percentage of GSDP (current prices)
Himachal Pradesh
2001-
02
2002-
03
2003-
04
2004-
05
2005-
06
2006-
07
2007-
08
2008-
09
2001-
09
Total Own Tax Revenue 5.34 4.69 4.75 5.43 5.83 5.79 6.08 6.07 5.50
Stamps and Registration
Fees 0.20 0.20 0.25 0.33 0.32 0.32 0.27 0.27 0.27
State Excise 1.38 1.45 1.35 1.30 1.28 1.20 1.21 1.17 1.29
Sales Tax 2.07 2.03 2.11 2.35 2.83 3.20 3.39 3.38 2.67
Taxes on Vehicles, Goods
and Passengers 0.97 0.60 0.54 0.63 0.56 0.55 0.52 0.54 0.61
Taxes and Duties on Electricity 0.05 0.00 0.08 0.38 0.35 0.11 0.25 0.21 0.18
Other taxes and Duties 0.37 0.40 0.41 0.42 0.48 0.42 0.43 0.46 0.42
Uttar Pradesh
2001-
02
2002-
03
2003-
04
2004-
05
2005-
06
2006-
07
2007-
08
2008-
09
2001-
09
Total Own Tax Revenue 5.43 6.17 5.99 6.31 6.81 7.42 7.25 7.19 6.57
Stamps and Registration
Fees 0.75 1.00 1.01 1.08 1.08 1.46 1.15 1.04 1.07
State Excise 1.03 1.24 1.09 1.08 1.12 1.15 1.15 1.18 1.13
Sales Tax 3.24 3.44 3.39 3.57 4.07 4.29 4.36 4.38 3.84
Taxes on Vehicles, Goods
and Passengers 0.30 0.34 0.33 0.34 0.39 0.36 0.36 0.35 0.35
Taxes and Duties on Electricity 0.00 0.07 0.08 0.14 0.07 0.06 0.06 0.05 0.07
Other taxes and Duties 0.05 0.05 0.04 0.05 0.04 0.04 0.04 0.04 0.04
Uttarakhand
2001-
02
2002-
03
2003-
04
2004-
05
2005-
06
2006-
07
2007-
08
2008-
09
2001-
09
Total Own Tax Revenue 6.13 5.50 6.00 6.09 6.82 8.01 7.69 8.35 6.83
Stamps and Registration
Fees 0.57 0.67 0.83 0.88 1.27 1.74 1.19 0.89 1.00
State Excise 1.47 1.33 1.34 1.23 1.12 1.19 1.24 1.32 1.28
Sales Tax 3.07 2.97 3.24 3.35 3.87 4.34 4.57 4.76 3.77
Taxes on Vehicles, Goods
and Passengers 0.43 0.39 0.42 0.42 0.44 0.45 0.44 0.42 0.42

20
Taxes and Duties on
Electricity 0.05 0.10 0.08 0.16 0.05 0.21 0.16 0.13 0.12
Other taxes and Duties 0.52 0.03 0.02 0.02 0.02 0.02 0.02 0.01 0.08
Haryana
2001-
02
2002-
03
2003-
04
2004-
05
2005-
06
2006-
07
2007-
08
2008-
09
2001-
09
Total Own Tax Revenue 7.59 7.65 7.66 7.95 8.53 8.39 7.53 6.58 7.74
Stamps and Registration
Fees 0.75 0.75 0.84 0.78 1.26 1.36 1.14 0.73 0.95
State Excise 1.34 1.21 1.11 1.08 1.04 0.93 0.89 0.78 1.05
Sales Tax 4.50 4.60 4.63 5.09 5.27 5.26 5.01 4.47 4.85
Taxes on Vehicles, Goods
and Passengers* 0.90 0.73 0.66 0.61 0.56 0.50 0.37 0.32 0.58
Taxes and Duties on
Electricity 0.05 0.00 0.07 0.07 0.06 0.08 0.07 0.06 0.06
Other taxes and Duties 0.02 0.02 0.02 0.02 0.02 0.01 0.02 0.02 0.02
Punjab
2001-
02
2002-
03
2003-
04
2004-
05
2005-
06
2006-
07
2007-
08
2008-
09
2001-
09
Total Own Tax Revenue 7.53 8.77 8.89 9.57 11.91 11.08 11.38 12.46 10.20
Stamps and Registration
Fees 0.69 0.86 1.05 1.33 2.21 2.22 1.80 1.86 1.50
State Excise 2.11 2.20 2.12 2.05 2.08 1.68 2.14 1.95 2.04
Sales Tax 4.19 4.72 4.78 5.26 6.13 5.94 6.14 6.93 5.51
Taxes on Vehicles, Goods
and Passengers 0.50 0.68 0.56 0.56 0.57 0.58 0.57 0.56 0.57
Taxes and Duties on
Electricity 0.00 0.29 0.34 0.35 0.89 0.65 0.69 0.68 0.49
Other taxes and Duties 0.02 0.02 0.01 0.01 0.01 0.01 0.01 0.00 0.01
All Selected States
2001-
02
2002-
03
2003-
04
2004-
05
2005-
06
2006-
07
2007-
08
2008-
09
2001-
09
Total Own Tax Revenue 6.24 6.79 6.74 7.10 7.87 8.10 7.83 7.70 7.30
Stamps and Registration
Fees 0.70 0.87 0.94 1.01 1.26 1.50 1.20 1.02 1.06
State Excise 1.32 1.41 1.29 1.25 1.25 1.18 1.23 1.19 1.26
Sales Tax 3.58 3.79 3.79 4.07 4.55 4.68 4.71 4.69 4.23
Taxes on Vehicles, Goods and Passengers 0.49 0.48 0.45 0.45 0.46 0.44 0.41 0.38 0.45
Taxes and Duties on
Electricity 0.02 0.09 0.12 0.17 0.20 0.16 0.16 0.14 0.13
Other taxes and Duties 0.08 0.05 0.05 0.05 0.05 0.05 0.05 0.05 0.05
Notes: * - Net of Tax on Entry of Goods into Local Areas.
All numbers use Gross Domestic Product (GSDP) at Factor Cost (current prices) – 1999-2000 series
Source: Computed from Finance Accounts of the States (various years), Indian Public Finance
Statistics (various years) and EPWRF (2009).
21
CHAPER 3
Sales Tax
3.1 Introduction
In Himachal Pradesh, as in most of the states, there are essentially three levies
which put together, are referred to as commodity taxes – VAT on intra-state
transactions, CST on inter-state transactions and entry tax on entry of goods into local
areas. These taxes apply to goods. The collections from all these levies together are
reported under the broad head called sales tax or state VAT. As discussed in Chapter
1, in Himachal Pradesh, the collection of sales taxes has been increasing as a
proportion of the GSDP. At the same time, it is pertinent to remember that the tax to
GSDP ratio for Himachal Pradesh has been consistently lower than that in the other
comparable states (Chapter 2). Therefore, while it could be argued that there is still
scope for augmenting revenue from sales tax, it is equally important to assess whether
there are any specific features of the state economy or any particular consumption
pattern in the state which sets it apart from the other states and result in a lower
overall tax-GSDP ratio.
As discussed in Chapter 2, the ratio of sales tax to GSDP for Himachal
Pradesh is lower than that for other comparable states, the increase in the ratio for
Himachal Pradesh has been higher than that for Haryana and Uttar Pradesh. In other
words, while there have been some gains in moving from sales tax to VAT, the gains
have not been large enough to bring the state on par with the other comparable states
in terms of the VAT-to GSDP ratio (Table 3.1). Further, Punjab and Uttarakhand have
reported sharper increases as well.

22
Table 3.1: Sales Tax (excluding Central Sales Tax) Collection as Percentage of GSDP at
factor Cost (current prices)
States
2001-
02
2002-
03
2003-
04
2004-
05
2005-
06
2006-
07
2007-
08
2008-
09
Gains
from
VAT*
Himachal Pradesh 1.82 1.79 1.88 2.19 2.52 2.87 3.04 3.00 0.94
Uttar Pradesh 2.98 3.44 3.39 3.57 3.76 4.06 3.96 4.02 0.61
Uttarakhand** 0.56 0.01 0.00 0.00 0.00 0.00 4.57 4.34 2.09
Haryana 3.22 3.41 3.56 3.95 4.10 4.08 4.13 3.85 0.63#
Punjab 3.23 4.18 4.24 4.60 5.66 5.54 5.76 6.64 1.84
Notes: *-is the difference between average for 2005-09 and average for 2001-05
**-Figures for Uttarakhand are not comparable with other states since the revenue decomposition into
sales tax and central sales tax are not correctly provided in the finance accounts for the period 2001-02
to 2006-07.
# - Since VAT was introduced in Haryana in 2003, the comparison for this is for pre- and post-2003-04
Source: Finance Accounts (various years) and EPWRF (2009).
This chapter therefore, seeks to establish a case for higher potential revenues
from this important source for the state. The discussion is organised as follows:
Section 3.2 provides a brief summary of the levies and identifies some policy
suggestions. Section 3.3 explores the hypothesis that structural features of the state are
responsible for the relatively weak performance of the state. Section 3.4 takes the
discussion further to examine whether any evidence is found from disaggregated
information of Gross State Domestic Product (GSDP) to support the hypothesis that
the state has the potential to raise more revenue from this source. Section 3.5 uses
information relating to district wise collections of revenue to assess whether the
revenue performance of districts varied beyond what was reflected by the dealer
profile of the districts. Section 3.6 brings together the conclusions that can be derived
from the discussions in all the earlier sections, both on policy front as well as on
administrative issues.
3.2 Structure of the Levies and Policy Suggestions
The introduction of value added tax in Indian states, tied as it was with a
compensation package of the Union government, was based on uniformity on some
broad features of the tax. The key features of the design can be summarised as
follows:
1. The tax covers intra-state sales. In the case of inter-state sales, while input
tax credit is available to the seller, the buyer cannot not claim credit for the

23
CST paid. Similarly, in the case of consignment transfers, there are some
unrebated taxes on inputs, for the seller.
2. Input tax credit is available for taxes paid on capital goods as well, but the
rules vary across states. The definition of capital goods as well as the term
over which the tax credit is spread-out, is different in different states.
3. Export out of the country is zero-rated.
4. As per the agreement among the states, the threshold for VAT registration
could be a maximum of Rs.10 lakh. Dealers with turnover below Rs. 10
lakh are exempt from taxation. Individual states however could choose
lower thresholds. In Himachal Pradesh, this threshold has been fixed at Rs.
6 lakh. In Himachal Pradesh, for manufacturers as well as for dealers who
operate an establishment where food preparations are served, the threshold
is lower at Rs. 2 lakh. All dealers who intend to import any goods from
outside are required to register irrespective of the quantum of turnover.
5. There is a simplified scheme for small dealers – units with turnover
between the exemption threshold and the upper threshold are allowed to
opt for a simplified turnover tax, in place of the VAT with input tax credit.
As per the agreement of the states, this threshold could be fixed at a
maximum of Rs. 50 lakh. Himachal Pradesh fixes this threshold at Rs. 25
lakh. Retailers with thresholds between Rs. 6 lakh and Rs. 25. lakh in
Himachal Pradesh have the option to pay a turnover tax at the rate of 1.5
percent of turnover subject to a minimum of Rs. 1000 per month in place
of the regular Value Added Tax with input tax credit. The Himachal
Pradesh Value Added Tax Act, 2005 also provides for compounding
scheme for some other specific categories of dealers – brick kilns, works
contractors, lottery dealers and halwais. The tax payable has been
specifically defined for each of these categories of dealers.
6. The commodity base for VAT is categorised into three categories – an
exempt category, a standard rate and lower rate of tax. The classification
of the commodities into these categories was accepted more or less
uniformly by all the states. Some petroleum products, tobacco as well as
sugar and textiles were kept out of the base for VAT. Further, there is a
special rate of 1 percent fixed for gold, bullion, so as to reduce the
incentive to underreport transitions in this commodity. The rates of tax too

24
were defined in the initial years of the introduction of VAT, with goods
being classified into three categories, exempt, 4 percent and 12.5 percent.
The Central Sales Tax is a levy by the Union Government, which yields
revenue on inter-state transactions to the exporting state. The levy applies only on
sales and not on consignment transfers. Since the levy is by the Union Government,
the only change the states can make is to reduce the rate of tax, i.e., choose levy the
tax at a low rate.
There are certain implications of the above design of VAT for revenue
collections from the tax for Himachal Pradesh.
1. The present regime suggests that for units that do not expect to have
significant taxable transactions, there exists an opportunity to procure the
goods from outside the state by paying the concessional rate of tax under CST.
This would result in lower tax collections for the state. Since the VAT is
expected to be collected on all consumption in the state, it is important that the
state have the opportunity to tax all goods entering into the state, especially if
they are not related to subsequent taxable sales. Such a levy can take the form
of an entry tax, which is integrated into the VAT regime – entry tax paid to be
set off against subsequent VAT paid in the state. Further, such an entry tax
should also be set-off against any CST payable on inter-state transactions out
of the state. Such a levy can thus protect the revenues of the state.
a. It is understood that Himachal Pradesh has, in fact, introduced such a
levy in 2010, the Himachal Pradesh Tax on Entry of Goods into Local
Area. This tax has been imposed on
i. Diesel, Furnace Oil, Lubricants
ii. Explosives
iii. Iron and Steel
iv. Cement
v. Goods used in works contracts, including for power projects,
telecom projects, whether executed by private or government
agencies
vi. Pan Masala and Gutka containing tobacco

25
vii. All tobacco products
The form of the levy is selective and is aimed at capturing revenue on goods
being brought into the state which are not expected to yield any revenue
through subsequent sales within the state. There are two advantages for the
state from such a levy – first, it protects the state from leakages of revenue on
consumption within the state. Second, in the event of a move to GST, a more
robust revenue profile of the state would enable it to seek better protection
from revenue loss. This levy however is being contested in courts of law and
is under review by the Supreme Court of India. The legal feasibility in the
future would depend on the ruling by the Supreme Court.
2. The levy of a lump-sum tax requires periodic assessment of the levies. For
instance, the levies on brick kilns have been fixed in 2005-06 when the Rules
were put in place. There has been no attempt to reassess whether the levels
fixed are adequate or need revision. Given that there has been an overall
increase in prices by about 37 percent in the last five years1, it is useful to have
a periodic review of the levies to adjust them at least in line with inflation.
3.3 Structural Factors: An Inter-state Comparison
The level of consumption and production activities of a State determines the
sales tax/VAT base of the State. Before assuming that there is scope for raising more
revenue, it is therefore important to verify whether structural factors such as level of
consumption in the state and/or the level of industrial activity in the state can account
for the relatively poor performance of the state in comparison to the other states. The
first check is with respect to the levels of consumption in the state. Since Central
Sales Tax (CST) is levied on goods that are manufactured in the State but not
consumed within the State, collection of revenue under CST does not relate to the
consumption base of the State. Historically, Himachal Pradesh has had lower or no
CST. Therefore, we have excluded CST collection from the Total Sales Tax
collection. Based on National Sample Survey Organization (NSSO)’s 61st Round of
Consumption Expenditure Survey (July 2004 – June 2005), we estimated the
1Based on the All-India wholesale price index of 2004-05, the increase in overall prices has been 37
percent between 2005-06 and 2010-11 and that of bricks and tiles has been 47 percent.
http://eaindustry.nic.in/indx_download_0405/yearlyc.xls

26
consumption base of the States (see Appendix 3.1 for detailed methodology for
estimation). It is seen that adjusted sales tax collection as percentage of consumption
base is lower for Himachal Pradesh as compared to other comparable States (Uttar
Pradesh is the only exception).2 Adjusted sales tax collection in Haryana is almost
double that of Himachal Pradesh. This will suggest that there is scope for improving
the tax collections in this state (Table 3.2).
Table 3.2: Tax Base for Sales Tax/Value Added Tax – A Comparison
Criteria
Himachal
Pradesh Haryana Punjab Uttarakhand
Uttar
Pradesh
GSDP at Factor Cost
(current prices) (Rs.
Crore): 2007-08 32,220.58 1,54,230.53 87,014.54 35,591.95 3,44,346.27
Sales Tax Collection
(excluding CST collection)
(Rs. Crore): 2007-08 978.98 6,364.34 5,014.04 1,627.41 13,638.13
Adjusted Sales Tax
Collection as Percentage of
Adjusted GSDP (%) 3.04 4.13 5.76 4.57 3.96
Annual Private Final
Consumption Expenditure
(Taxable) (Rs. Crore)
(2008 Prices): 2007-08 10,251.86 35,286.51 42,527.39 12,340.10 2,10,431.36
Adjusted Sales Tax
Collection as Percentage of
Final Consumption
Expenditure (%) 9.55 18.04 11.79 13.19 6.48
Market Size (Rs. Crore):
2006** 18,742.00 69,405.00 1,05,346.00 24,579.00 2,96,270.00
Ratio of Consumption
Expenditure to Market Size
(%) 54.70 50.84 40.37 50.21 71.03
Adjusted Sales Tax
Collection as Percentage of
Market Size (%) 5.22 9.17 4.76 6.62 4.60
Share of Urban
Consumption in Total
Consumption Expenditure
(%) 15.02 35.74 42.25 35.02 27.84
Note: *-refers to figures drawn from Market Skyline of India, 2008.
Source: Computed (see Appendix 3.1).
2 Adjusted Sales Tax is the Total Sales Tax collection net of CST collection.
27
Table 3.3: Role of Manufacturing Sector in GSDP: A Comparison
Criteria
Himachal
Pradesh Haryana Punjab Uttarakhand
Uttar
Pradesh
1. GSDP from Manufacturing
Sector (Rs. Crore)*: 2002-
03 2,140.66 14,979.11 11,409.74 2,190.49 25,875.85
2. GSDP from Manufacturing
Sector (Rs. Crore)*: 2007-
08 3,509.05 28,357.72 19,494.48 4,549.75 48,563.69
3. Compounded Annual
Growth Rate of GSDP
from Manufacturing
Sector: 2002-03 to 2007-08
(%) 10.67 13.74 11.61 16.10 13.65
4. Share of Manufacturing in
GSDP (%): 2002-03 10.89 20.65 13.87 11.86 12.51
5. Share of Manufacturing in
GSDP (%): 2007-08 11.41 18.39 13.51 12.62 13.58
6. Annual Survey of
Industries (ASI) Fixed
Capital (Rs. Crore): 2002-
03 3,582.78 14,108.86 11,197.61 2,045.86 28,476.31
7. Annual Survey of
Industries (ASI) Fixed
Capital (Rs. Crore): 2007-
08 20,002.92 28,868.38 21,783.48 12,971.42 58,450.02
8. Compounded Annual
Growth Rate of Fixed
Capital: 2002-03 to 2007-
08 (%) 33.24 14.90 17.50 49.29 15.34
9. ASI Fixed Capital (2002-
03) as Percentage of GSDP
(2002-03) (%) 18.95 19.45 13.61 11.07 13.77
10. ASI Fixed Capital (2007-
08) as Percentage of GSDP
(2007-08) (%) 62.08 18.72 15.09 35.99 16.35
Notes: *- implies GSDP at Factor Cost (1999-2000 Series) at Current Prices.
Source: GSDP Data and ASI data taken from CSO website.
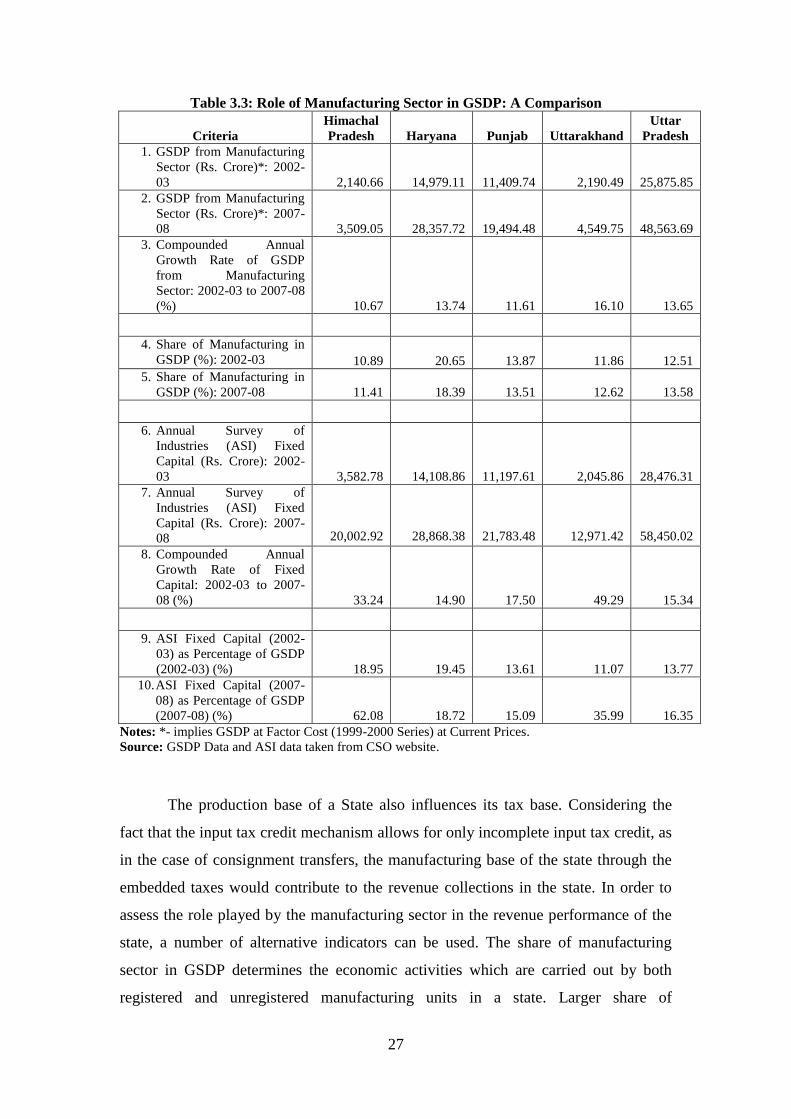
The production base of a State also influences its tax base. Considering the
fact that the input tax credit mechanism allows for only incomplete input tax credit, as
in the case of consignment transfers, the manufacturing base of the state through the
embedded taxes would contribute to the revenue collections in the state. In order to
assess the role played by the manufacturing sector in the revenue performance of the
state, a number of alternative indicators can be used. The share of manufacturing
sector in GSDP determines the economic activities which are carried out by both
registered and unregistered manufacturing units in a state. Larger share of

28
manufacturing sector in GSDP should, going by the above logic, yield higher
revenues to the state. Table 3.3 shows that the share of manufacturing in GSDP is
lower in Himachal Pradesh and it has registered a lower compounded annual growth
rate during 2002-03 to 2007-08 as compared to other States. This suggests that the
revenue potential of the state, at least on this count, should be lower than in the other
comparable states (see rows 4-5 in Table 3.3).
Taking this analysis a step further, if one looks at the stock of capital in
industry as reported in the Annual Survey of Industries, Table 3.3 shows that the
average annual increase in the capital stock for both Uttarakhand and Himachal
Pradesh is higher than that for the other comparable states during the period 2002-03
to 2007-08 (refer rows 6-8 in Table 3.3). Unless there is significant gestation lag in all
these investments, this process of rapid capital accumulation in the state should have
resulted in faster growth of GSDP from manufacturing. This however is not borne out
by the available information on GSDP. In other words, both Himachal Pradesh and
Uttarakhand are showing evidence of very high capital output ratios (see rows 9-10 in
Table 3.3), which is either a sign of very inefficient production systems or of
substantial leakages from these units this feature does suggest the need for more
intensive focus on administration related issues).
Another issue of concern for any tax system relates to the size of the informal
sector in the economy. Units in the informal sector units tend to remain outside tax net
in most regimes. Therefore larger the size of the informal sector in a state, smaller
would be the tax collection corresponding to the given tax base. Further, while
introducing VAT, it was expected that informal economic activities will be reduced
and by becoming part of formal sector the informal sector could reap the benefits of
high economic growth and avail input tax credits and other facilities. Table 3.4 shows
that degree of informalization (as measured by growth in number of establishments in
the unorganized sector between 1998 to 2005) was relatively low in Himachal
Pradesh as compared to other selected states. Value addition per person employed in
the informal sector is also the lowest in Himachal Pradesh among the comparable
states. Hence, informal sector could not be responsible for the low tax collection from
sales tax (Table 3.4).

29
Table 3.4: Value Addition per Worker in Un-organized Manufacturing Sector
State
Number of establishments
% Growth
Persons employed
GSDP from un-registered
manufacturing Sector
(Rs. Lakh)
Value addition per
person employed (Rs.
Thousand)
EC-1998 EC-2005 EC-1998 EC-2005 1999-2000 2005-06 1999-2000 2005-06
Himachal Pradesh 2,25,478 2,67,773 18.76 5,76,898 6,59,479 33,084 57,457 5.7 8.7
Haryana 5,32,817 8,33,898 56.51 15,59,007 22,44,817 2,75,519 4,82,995 17.7 21.5
Punjab 7,17,114 10,71,666 49.44 20,99,655 27,02,069 3,96,082 5,44,343 18.9 20.1
Uttarakhand 2,15,498 3,25,157 50.89 3,06,659 3,44,068 55,109 91,212 18.0 26.5
Uttar Pradesh 28,27,513 40,20,610 42.20 39,41,090 40,62,698 9,84,692 15,94,988 25.0 39.3
Source: Economic Census: 2005 (Compiled from State Report Cards).

30
The discussion so far thus suggests that while there is not much scope of
improved collection from the manufacturing sector, there is in fact some untapped
potential from the consumption side.
3.4 Disaggregate Collections: Any Clues
While the analysis of aggregate data does suggest that there is possibility of
higher revenue collections for the state, this part of the chapter attempts to cross check
this observation with other available data. The present section looks at potential and
actual revenue collections relating to one of the important sectors in the state –
construction. Construction accounts for over 20 percent of GSDP and has been
recording an increase in its share since 2006-07.
Figure 3.1: Share of Various Components of Industry Sector of Himachal Pradesh
in GSDP: 1999-00 to 2009-10
Source: CSO’s data on GSDP.
Two key inputs used by construction sector – inputs that contribute to
revenues in the state – are iron and steel and cement. In addition, the state also derives
revenue from works contracts, a tax on the goods component of a comprehensive
construction contract. The revenue collected by the state from cement and works
contracts is given in Table 3.5 below.

31
Table 3.5: Present Collection of Revenue from Construction Sector (Rs. Crore)
Source: Department of Excise and Taxation, Govt. of Himachal Pradesh.
In order to identify the potential base for tax under cement for instance, an
estimate of the sales corresponding to the GSDP from construction needs to be
derived. This is undertaken using the tables on sectoral domestic product
computations in the National Account Statistics. The detailed calculations are
presented in Appendix 3.2.
Table 3.6: Estimation of Domestic Product from Construction Sector (at 2004-05 Prices)
All India 2006-07 2007-08 2008-09
1 Net value of Input as % of GDP from Construction 177 179 179
Himachal Pradesh
2
GSDP from Construction (Rs. Crore) (at current
prices) 6,163.8 7,065.1 8,583.6
3 Net Value of Input (Rs. Crore) [2*(1/100)] 10,938.6 12,635.8 15,395.9
4
Share of Cement in total input used for
Construction (7%) of net value of inputs (Rs. Crore)
(7% of 3)** 765.7 884.5 1,077.7
5
Potential for Tax Collection from Cement
(@12.5%) (Rs. Crore) (12.5% of 4) 95.7 110.6 134.7
6 Actual Tax Collection from Cement (Rs. Crore) 47.6 60.4 52.8
7 Revenue Gap (13-14) (Rs. Crore) 48.2 50.2 81.9
Notes: **-Estimated based on Input-Output Table for 2006-07 (Commodity x Commodity Matrix).
Source: CSO’s National Account Statistics.
The above Table 3.6 (rows 3, 4 and 5) indicates that the total collections from
cement are substantially lower than that suggested by the level of construction activity
in the state. It could be argued that some of the taxes may accrue in the form of taxes
on works contracts – total tax collected under this head in the financial year 2008-09
was Rs. 19.75 crore (Table 3.5). Since the tax applicable on works contracts is 5.5
percent of the total value of the contract, the value of the contracts should be Rs. 360
crore, and the corresponding value of input for construction would be about 230 crore.
Even excluding this amount from the estimated value of inputs (row 3 in Table 3.6)
does not change the numbers substantially. The revised potential tax from 12.5
percent rate on cement should be Rs. 135 crore as against the collections of Rs. 53
crore. It would have been useful to examine whether a similar story holds for iron and
Cement Works Contract Total
2006-07 47.55 21.21 68.75
2007-08 60.35 21.24 81.59
2008-09 52.78 19.75 72.53
2009-10 65.37 28.60 93.97
32
steel as well. The same however could not be attempted in the absence of data on
revenue from iron and steel.
There are two likely causes for the above:
1. It is possible that since purchase of cement constitutes a large purchase, any
registered entity in the state would seek to purchase the goods from outside the
state through a CST transaction. The total tax liability in that scenario would
be substantially lower, and where such purchases are not for subsequent sales,
no tax is realised by the state. If this is the cause, especially since the state
does not have a provision for providing input tax credit for immovable
property, it is appropriate to tax such transactions at the point of entry into the
state. Such an entry tax has in fact been imposed in the state in 2010. While it
is not yet clear whether it has been a useful tool for limiting the leakage on the
above grounds,3 as discussed above, it is a useful mechanism to prevent such
diversion of trade which results in a reduction of the revenues of the state from
consumption within the state.
2. Inadequate administration could be contributing to poor revenue collections.
Since there exists one tax administration dealing with multiple taxes in the
state, the issues relating to tax administration are dealt with in a separate
chapter.
3.5 District-wise Share in Total Sales Tax Collection of Himachal
Pradesh
As has been discussed earlier, the collection of sales tax in Himachal Pradesh
has gone up from 383.34 crore in 2002-03 to 1491.30 crore in 2009-10. During 2002-
03 to 2009-10, the share of Solan in total sales tax was the highest – at an average
42.10 percent. Solan was divided into two districts, Solan and BBN Baddi, in 2009-10
and sales tax collection from combined Solan and BBN Baddi has since jumped from
Rs. 579.63 crore in 2008-09 to Rs. 703.06 crore in 2009-10. The percentage share in
total sales tax collection of this pair of districts has also improved from 46.49 percent
in 2008-09 to 47.15 percent in 2009-10. However, since 2003-04, the share of Kangra
in total sales tax collection has gone down continuously. The average share of Kangra
3 Total Entry Tax collected during April 8, 2010 to August 31, 2010 was Rs. 59.29 crore.

33
during 2002-03 to 2009-10, was 20.68 percent which is the second among the districts
of Himachal Pradesh. The share of Shimla is not high, though it is the capital of
Himachal Pradesh and is also a famous tourists’ destination. The average share of
Shimla was only 10.39 percent during the period 2002-03 to 2009-10.
Table 3.7: District-wise, Year-wise Share in Total Sales Tax Collection of
Himachal Pradesh
District
2002-
03
2003-
04
2004-
05
2005-
06
2006-
07
2007-
08
2008-
09
2009-
10
Average:
2002-
2010
Shimla 11.66 10.29 8.94 9.40 10.35 10.56 10.58 11.35 10.39
Solan 38.55 40.86 43.28 46.40 47.35 46.58 46.49 27.31 42.10
Sirmour 3.47 3.39 3.58 4.84 5.39 6.26 6.27 6.74 4.99
Bilaspur 4.84 5.40 4.77 4.37 4.49 4.01 3.92 4.31 4.51
Mandi 6.57 6.32 5.24 4.69 4.41 3.89 3.87 4.81 4.98
Kullu 2.05 2.72 3.08 2.63 2.81 2.88 2.72 2.71 2.70
Hamirpur 1.80 1.50 1.34 1.09 0.95 1.18 1.25 1.58 1.34
Kangra 23.86 24.43 23.94 21.66 19.37 19.81 19.06 13.31 20.68
Una 3.75 3.53 3.53 3.57 3.69 3.77 4.18 5.01 3.88
Chamba 2.10 1.14 0.87 0.73 0.82 0.85 1.25 1.33 1.14
Kinnaur 1.25 0.30 1.35 0.52 0.32 0.19 0.36 1.66 0.74
Lahul&Spiti 0.09 0.13 0.09 0.11 0.07 0.02 0.04 0.03 0.07
BBN Baddi N.A. N.A. N.A. N.A. N.A. N.A. 19.84 2.48
Total 100.00 100.00 100.00 100.00 100.00 100.00 100.00 100.00 100.00
Source: Department of Excise and Taxation, Government of Himachal Pradesh.
Figure 3.2: District-wise, Year-wise Share in Total Sales Tax Collection
in Himachal Pradesh

34
Figure 3.3 shows that except in Solan and BBN Baddi, in other districts, the
share in total sales tax collection is lower than its share in total number of dealers
having Gross Turnover (GTO) more than Rs. 25 lakh/year. For instance, in so far as
dealers with turnover of Rs. 25 lakh is concerned, the share of Kangra is higher than
that of Solan and BBN Baddi, but its corresponding share in sales tax collection is
much lower. Similarly, even though Mandi has a higher share in the total number of
dealers than Solan, its share in tax collection is miniscule.
Figure 3.3: District-wise Share in Dealers and Sales Tax Collection
Table 3.8: District-wise, Turnover-wise Number of Dealers up to June 30, 2010
District
Annual Gross Turnover-wise Number of Dealers
Rs. 0 - Rs. 6
Lakh
Rs. 6 lakh - Rs.
25 lakh
Rs. 25 lakh -
Rs. 1Crore
Above Rs. 1
Crore
Total
Solan 1396 (6.1) 1713 (11.4) 887 (10.6) 602 (15.0) 4598 (9.2)
BBN
Baddi
1212 (5.3) 1048 (7.0) 937 (11.2) 792 (19.7) 3989 (8.0)
Hamirpur 1144 (5.0) 1653 (11.0) 685 (8.2) 170 (4.2) 3652 (7.3)
Kullu 2453 (10.8) 497 (3.3) 311 (3.7) 168 (4.2) 3429 (6.8)
Shimla 5306 (23.3) 2366 (15.8) 1085 (13.0) 260 (6.5) 9017 (18.0)
Bilaspur 1300 (5.7) 832 (5.6) 679 (8.1) 149 (3.7) 2960 (5.9)
Una 1793 (7.9) 1097 (7.3) 476 (5.7) 337 (8.4) 3703 (7.4)
Kinnaur 505 (2.2) 91 (0.6) 29 (0.3) 16 (0.4) 641 (1.3)
Kangra 2620 (11.5) 2674 (17.9) 1423 (17.0) 542 (13.5) 7259 (14.5)
Chamba 2073 (9.1) 323 (2.2) 179 (2.1) 98 (2.4) 2673 (5.3)
Mandi 1995 (8.8) 2077 (13.9) 1182 (14.1) 405 (10.1) 5659 (11.3)
Sirmaur 965 (4.2) 606 (4.0) 494 (5.9) 481 (12.0) 2546 (5.1)
Total 22762 (100) 14977 (100) 8367 (100) 4020 (100) 50126 (100)
Source: Department of Excise and Taxation, Government of Himachal Pradesh.

35
The observed trends for number of dealers and revenue collections district
wise raise some questions:
1. Is there any reason for Sirmaur, Mandi and Kangra to have a large share in
number of dealers with GTO above Rs. 1 crore and yet record relatively low
revenue collections?
2. Surprisingly, Sirmaur has 18 percent of its total dealers in the above Rs. 1
crore category. The only other districts to have such high levels are Baddi (19
percent) and Solan (13 percent). The rest of the districts have levels of less
than 10 percent. Given this high concentration of high GTO dealers, it is not
clear why the levels of revenue collection from this district are relatively low.
For any revenue administration, it is well accepted that 80 percent of the
revenue is derived from top 20 percent of the dealers. Accordingly, the
phenomenon as observed is perhaps a pointer for the need to have a more
focussed administration.
The questions posed above also suggest that there is an urgent need not only
to review the structure of administration and the staff strength, but also the
geographical distribution of the tax administration.
Another dimension that the district level information throws up relates to the
profile of dealers. Usually, given the nature of a value added tax, a manufacturer
would claim input tax credit for the inputs locally procured and is therefore expected
to pay lower amounts of tax when compared to an importer-distributor of goods for
the same turnover. Table 3.9 shows that the share of manufacturers in total number of
dealers (either for the district or for the State as a whole) is higher for Solan, BBN
Baddi, Sirmour and Una as compared to other districts. Table 3.10 presents the
correlation coefficients between the share of revenue of a district and the profile of the
dealers in the district.4 The table suggests that the share of manufacturers is more
closely related to the revenue than the share of dealers with turnover above Rs. 25
lakh. The number of manufacturers in the state is 7,353 while that of dealers with
turnover above Rs. 25 lakh is Rs. 12,387. The above could either mean that the
4 Correlation coefficient captures the relation between two variables. The value ranges from -1 to 1. An
inverse relation between the variables would result in a negative value for the coefficient while a
positive relation would yield a positive value. The closer the value of the coefficient is to 1 (or -1 in the
case of inverse relation) the stronger is the correlation between the variables concerned.

36
manufacturers constitute the dominant component of the category of large dealers or
that the transactions of the importers are not being appropriately monitored by the
department. Here it is interesting to note that while the team did ask for information
on the value of total imports into the state, as reflected in the C-forms, no information
could be provided – evidence which corroborates the above explanation.5
Table 3.9: Number of Dealers Registered under the HPVAT Act 2005 and CST Act 1956
District
VAT
dealers CST dealers
VAT & CST
dealers
Manufac-
turers Others Total
(1) (2) (3) (4=2+3) (5) (6) (7=4+5+6)
Sirmour 5,325 3,367 8,692 1,209 4,116 14,017
Kullu & L&S 4,020 2,915 6,935 132 3,888 10,955
Kangra 8,381 7,021 15,402 331 8,050 23,783
Solan 9,722 9,571 19,293 4,107 5,615 29,015
Chamba 2,817 1,428 4,245 46 2,771 7,062
Una 4,066 3,875 7,941 806 3,260 12,007
Bilaspur 4,254 4,119 8,373 88 4,166 12,627
Kunnaur 1,087 933 2,020 6 1,081 3,107
Shimla 10,376 9,055 19,431 46 10,330 29,807
Mandi 6,860 5,314 12,174 290 6,570 19,034
BBN Baddi 619 616 1,235 396 223 1,854
Hamirpur 4,313 4,034 8,347 78 4,226 12,651
Total 61,840 52,248 1,14,088 7,535 54,296 1,75,919
District
VAT
Dealers CST Dealers
VAT & CST
Dealers
Manufac-
turers Others Total
Sirmour 8.61 6.44 7.62 16.05 7.58 7.97
Kullu& L&S 6.50 5.58 6.08 1.75 7.16 6.23
Kangra 13.55 13.44 13.50 4.39 14.83 13.52
Solan 15.72 18.32 16.91 54.51 10.34 16.49
Chamba 4.56 2.73 3.72 0.61 5.10 4.01
Una 6.58 7.42 6.96 10.70 6.00 6.83
Bilaspur 6.88 7.88 7.34 1.17 7.67 7.18
Kunnaur 1.76 1.79 1.77 0.08 1.99 1.77
Shimla 16.78 17.33 17.03 0.61 19.03 16.94
Mandi 11.09 10.17 10.67 3.85 12.10 10.82
BBN Baddi 1.00 1.18 1.08 5.26 0.41 1.05
Hamirpur 6.97 7.72 7.32 1.04 7.78 7.19
Total 100.00 100.00 100.00 100.00 100.00 100.00
Source: Department of Excise and taxation, Government of Himachal Pradesh, Shimla.
5 Annexure 1 provides the details of information requested by the study team and the information
provided by various departments of Government of Himachal Pradesh.

37
Table 3.10: Correlation with Revenue per District
Correlation Coefficient
Number of Manufacturers 0.737323
Number of dealers with turnover above Rs. 25 lakh 0.592414
Number of dealers with turnover above Rs. 1 crore 0.816485
Source: Computed from data given by the Excise and Taxation Department.
3.6 Conclusions
The analysis in this chapter highlights the fact that the revenue collection in
Himachal Pradesh from commodity taxes is somewhat low when compared to other
comparable states. There have been some improvements in the collections in the last
decade; however, the increase has still not brought the state on par with the other
states considered. While smaller share of manufacturing sector could be an
explanatory factor for relatively poor performance, comparisons in consumption
levels and the relatively low levels of the informal sector, suggest that the state does
have untapped revenue potential. If the consumption base of the state is taken as the
appropriate indicator, then as indicated in Table 3.2 above, the tax to consumption
ratio for Himachal Pradesh at 9.55 percent is much lower than that reported for
Haryana, Punjab and Uttarakhand. Even if the state were to achieve the levels
achieved by the Punjab, at 11.79 percent, it should be able to raise additional revenues
to the tune of another Rs. 200 crore, in 2007-08 prices, or Rs. 240 crore in current
prices.
The following are alternative ways for the state to augment its collection from
commodity taxes:
1. By periodic revision of the lump sum levies in line with inflation.
2. The other measure which the state has introduced in 2010 – in the form of
entry tax could be made into a broad based levy with set-off against taxes
collected in subsequent sales. This way the tax would not take the form of a
discretionary and arbitrary levy.
3. By exploring the needs and means of improving tax administration. The latter
is taken up for more detailed discussion in Chapter 7.
38
Appendix 3.1
Methodology for Estimating Private Final Consumption Expenditure
Methodology for Estimation of Monthly Per Capita Consumption Expenditure (MPCE) on
Goods (excluding services)
Item group wise expenditures (sub-total) are added for 33 item groups (30 days recall
period) for rural and urban separately. Data for 15 item groups are found with 365 days recall
period, of which 6 item groups have data for 30 days recall period also. Therefore, we have
taken data for the item groups with 365 days recall period instead of data for same item
groups with 30 days recall period for our estimation.
Since, we are presently interested in total consumption expenditure on goods only,
item wise expenditures on services are identified (46 items) and deducted from the
corresponding item group wise sub-totals. Apart from expenditure on services, we have
exempted 5 items, viz., expenditure on petrol, diesel, lubricant oil, flowers (fresh): all
purposes, pet animals (incl. birds, fish), to estimate the MPCE on goods. The estimated
MPCE is at the 2004-05 prices for rural and urban separately.
Methodology for Estimation of Annual Per Capita Consumption Expenditure on Goods
(APCE)
MPCE is used to estimate the Annual Per Capita Consumption Expenditure on Goods
(APCE) as follows:
APCE (in Rs./head/Year) = [MPCE (in Rs./head/month)/30]*365
APCE is multiplied with the Projected Population (Projected Population on 1st October 2007)
(Registrar General & Census Commissioner, 2006) for all India and States (for rural and
urban separately) to get the Annual Consumption Expenditure (ACE). Therefore, the
estimated ACE (in Rs. Crore/Year) is corresponding to the year 2007-08 and at current prices.
Methodology for Estimation of Annual Private Final Consumption Expenditure
National Accounts Statistics provides Annual Private Final Consumption Expenditure for all
India across Item groups. However, NAS item groups are different from the NSSO item

39
groups. For all India (rural and urban combined).6 NSSO items are reclassified according to
NAS item groups. To get Annual Private Final Consumption Expenditure, the NSSO Annual
Consumption Expenditures are multiplied with a factor, which is the simple ratio of NAS
Private Final Consumption Expenditure and NSSO Annual Consumption Expenditure (ACE),
as we have estimated earlier. It is to be mentioned here that both NAS data and NSSO data
are corresponding to the period 2004-05. For each of the states, the same factor is applied
across NSSO item groups (for rural and urban separately) to get Annual Private Consumption
Expenditure. The estimated figures correspond to the year 2007-08 at current 2008 prices.
Price Deflator
Since, our estimates are corresponding to 2004-05 prices, we have multiplied our estimates
with a price deflator, which is simple ratio of Consumer Price Index (Industrial Workers) –
2008 and Consumer Price Index (Industrial Workers) – 2004. Both CPI(IW) 2004 and
CPI(IW) 2008 are corresponding to the Base Year 1982
(http://labourbureau.nic.in/indexes.htm).
Data Sources
Since item group wise data on MPCE for all the states and all India is available for us only for
NSS 61st Round (July 2004 to June 2005) (NSSO, 2007a, 2007b), we have taken the same for
our analysis on consumption expenditure. The analysis also uses National Accounts Statistics
2007 for data on Private Final Consumption Expenditure for 2004-05 (CSO, 2007).
6 NAS does not give Private Final Consumption Expenditure for rural and urban separately

40
Rural Urban Total Rural Urban Total
States 14,81,35,000 4,06,77,000 18,88,12,000 68,60,000 25,91,000 94,51,000
Rural Urban Total Rural Urban Total
Item
Code Item Description
New
Multiplier (Rs. Crore) (Rs. Crore) (Rs. Crore) (Rs. Crore) (Rs. Crore) (Rs. Crore)
129 cereal: sub-total 0.98 16,533.99 4,725.41 21,259.40 806.65 348.26 1,154.91
139 cereal substitutes 0.98 17.66 3.88 21.54 0.57 0.00 0.57
159 pulses & pulse products: sub-total 0.74 2,722.10 843.06 3,565.16 150.89 74.53 225.42
169 milk & milk products: sub-total 1.27 12,048.94 5,239.40 17,288.35 807.28 403.08 1,210.36
179 edible oil:sub-total 1.02 4,413.89 1,469.98 5,883.87 244.16 112.41 356.57
189 egg, fish & meat: sub-total 2.2 3,413.93 1,586.36 5,000.30 200.51 119.42 319.94
229 vegetables:sub-total 2.19 13,767.34 4,926.05 18,693.38 705.55 351.26 1,056.81
249 fruits (fresh): sub-total 2.19 2,245.88 1,467.52 3,713.39 151.35 120.82 272.16
259 fruits (dry): sub-total 2.19 836.78 544.09 1,380.86 42.22 50.19 92.41
269 sugar: sub-total 1.68 4,696.24 1,474.14 6,170.38 297.82 114.23 412.06
279 salt 1.44 225.79 89.08 314.88 14.66 7.81 22.47
289 spices: sub-total 1.44 2,535.63 808.87 3,344.50 114.18 52.39 166.56
309 beverages etc.:sub-total 0.5 1,556.29 1,087.55 2,643.84 107.88 83.62 191.49
777 total:food 65,014.46 24,265.39 89,279.86 3,643.73 1,838.02 5,481.74
319 pan:sub-total 3.45 1,330.64 513.93 1,844.58 4.32 6.63 10.95
329 tobacco:sub-total 1.21 1,788.25 516.19 2,304.45 115.23 44.09 159.32
339 intoxicants: sub-total 2.04 823.58 205.96 1,029.54 95.52 50.16 145.68
359 fuel and light: sub-total 0.55 5,192.27 2,379.27 7,571.55 349.43 170.09 519.51
379 clothing: sub-total 1.18 5,178.57 2,261.19 7,439.77 212.04 137.52 349.56
389 bedding etc.: sub-total 1.18 635.89 156.51 792.40 44.61 28.57 73.18
399 footwear: sub-total 0.97 923.07 447.89 1,370.96 55.46 27.83 83.28
409 education: sub-total 1.11 1,872.53 1,182.74 3,055.26 89.49 61.03 150.52
419 medical - institutional: sub-total 1.72 2,042.88 751.64 2,794.52 125.61 35.68 161.29
429 medical - non-institutional: sub-total 1.72 10,285.71 2,979.32 13,265.03 290.85 139.51 430.36
439 etertainment: sub-total 0.14 22.20 12.26 34.47 1.95 1.15 3.10
449 minor personal effects: sub-total 5.55 1,360.38 563.08 1,923.46 55.12 39.37 94.49
459 toilet articles: sub-total 0.78 1,734.76 828.80 2,563.55 88.99 53.80 142.79
479 other household consumables: sub-total 0.78 1,481.71 662.42 2,144.13 81.12 50.92 132.04
499 consumer services excl. conveyance: sub-total 2.58 0.00 0.00 0.00 0.00 0.00 0.00
519 conveyance: sub-total 5.03 0.00 0.00 0.00 0.00 0.00 0.00
529 rent: sub-total 3.61 0.00 0.00 0.00 0.00 0.00 0.00
539 house /garage rent (imputed) 0.00 0.00 0.00 0.00 0.00 0.00
549 consumer taxes and cesses: sub-total 3.61 0.00 0.00 0.00 0.00 0.00 0.00
659 durable goods: total 0.38 1,390.30 403.40 1,793.70 111.01 31.39 142.39
Sum of Highlighted Cells (A) 12,043.25 5,203.37 17,246.61 638.23 322.00 960.23
888 total: non-food 36,062.76 13,864.60 49,927.36 1,720.75 877.73 2,598.48
999 total (777+888) 1,01,077.23 38,129.99 1,39,207.22 5,364.48 2,715.74 8,080.22
379 clothing: sub-total 1.18 7,198.96 2,985.92 10,184.88 373.56 193.02 566.58
389 bedding etc.: sub-total 1.18 665.66 270.97 936.63 32.30 24.55 56.85
399 footwear: sub-total 0.97 945.80 482.94 1,428.73 76.26 39.48 115.74
409 education: sub-total 1.11 1,618.46 1,039.91 2,658.36 121.73 95.70 217.44
419 medical - institutional: sub-total 1.72 1,940.58 704.82 2,645.40 89.29 31.18 120.47
559 furniture & fixtures: sub-total 0.23 53.06 19.24 72.30 1.82 2.98 4.80
569 goods for recreation: sub-total 0.14 15.90 14.48 30.38 2.69 3.20 5.88
579 jewellery & ornaments: sub-total 5.55 3,601.01 1,060.23 4,661.25 99.13 93.95 193.08
589 crockery & utensils: sub-total 9.8 2,119.52 824.51 2,944.02 71.98 29.66 101.64
609 cooking and hh appliances: sub-total 5.39 204.00 656.21 860.22 29.24 76.12 105.36
619 personal transport equipment: sub-total 1.02 994.55 406.37 1,400.92 68.87 46.75 115.62
629 therapeutic appliances: sub-total 1.72 3.10 1.70 4.80 0.14 0.05 0.20
639 other personal goods: sub-total 0.78 26.71 61.76 88.47 2.54 9.66 12.20
649 residential buildings and land etc.:sub-total 0.99 74.94 39.69 114.63 1.07 3.21 4.29
659 durable goods: total 0.38 631.46 613.46 1,244.92 65.65 63.00 128.65
Sum of Non-highlighted Cells: C 7,092.79 3,084.19 10,176.98 277.49 265.59 543.08
Sum of Highlighted Cells: B 13,000.92 6,098.02 19,098.94 758.81 446.92 1,205.73
D = B-A 957.67 894.65 1,852.33 120.58 124.92 245.50
888* total : non-food (C+D) 8,050.46 3,978.84 12,029.31 398.07 390.51 788.58
999 total (777+888*) 1,09,127.69 42,108.83 1,51,236.52 5,762.55 3,106.25 8,868.80
Share in Total Consumption Expenditure 72.2 27.8 65.0 35.0
Price Deflator (CPI(IW)-2008/CPI(IW)-2004) 1.39 1.39
A
Annual Pvt. Final Consumption Exp.(in Rs.
Crore) (2008 Prices) 2,10,431.36 12,340.10
B Sales Tax (Rs. Lakh): 2007-08 15,02,309.87 1,62,740.64
B as Percentage of A (%) 7.14 13.19
C GSDP at Factor Cost (Current Prices): 2007-08 (Rs. Lakh) 3,57,55,704.00 36,04,468.00
B as Percentage of C (%) 4.20 4.51
D Market Size (Rs. Crore): 2006 2,96,270.00 24,579.00
A as Percentage of D 71.03 50.21
B as Percentage of D (%) 5.07 6.62
Population as on '01/10/2007
Uttar Pradesh
States
Settlement
Uttar Pradesh Uttarakhand
Population as on '01/10/2007
Uttarakhand

41
Rural Urban Total Rural Urban Total Rural Urban Total
States 58,71,000 6,96,000 65,67,000 1,63,22,000 76,75,000 2,39,97,000 1,67,59,000 98,28,000 1,65,87,000
Rural Urban Total Rural Urban Total Rural Urban Total
Item
Code Item Description
New
Multiplier (Rs. Crore) (Rs. Crore) (Rs. Crore) (Rs. Crore) (Rs. Crore) (Rs. Crore) (Rs. Crore) (Rs. Crore) (Rs. Crore)
129 cereal: sub-total 0.98 712.69 100.21 812.90 1,451.81 720.84 2,172.65 1,488.88 988.08 2,476.97
139 cereal substitutes 0.98 0.07 0.00 0.07 0.19 0.09 0.29 0.00 1.41 1.41
159 pulses & pulse products: sub-total 0.74 165.76 23.06 188.82 237.77 136.47 374.24 345.23 223.87 569.10
169 milk & milk products: sub-total 1.27 1,007.86 148.60 1,156.47 4,342.16 1,955.93 6,298.09 3,577.97 2,411.98 5,989.95
179 edible oil:sub-total 1.02 257.99 40.13 298.12 385.06 277.36 662.42 700.06 470.30 1,170.36
189 egg, fish & meat: sub-total 2.2 147.72 30.83 178.55 219.32 164.55 383.87 168.22 182.83 351.05
229 vegetables:sub-total 2.19 517.64 103.78 621.41 1,689.15 1,106.55 2,795.70 1,833.95 1,256.70 3,090.65
249 fruits (fresh): sub-total 2.19 134.69 37.02 171.70 559.28 489.57 1,048.85 436.27 502.78 939.06
259 fruits (dry): sub-total 2.19 43.96 14.43 58.39 80.02 75.05 155.07 83.06 90.08 173.14
269 sugar: sub-total 1.68 235.33 27.91 263.24 941.81 346.23 1,288.04 1,175.30 528.93 1,704.23
279 salt 1.44 16.87 2.28 19.15 38.60 20.44 59.04 37.58 24.79 62.38
289 spices: sub-total 1.44 114.17 17.62 131.79 270.23 146.57 416.80 298.90 189.06 487.96
309 beverages etc.:sub-total 0.5 119.93 38.79 158.72 394.98 260.81 655.79 458.98 451.81 910.79
777 total:food 3,474.68 584.65 4,059.34 10,610.40 5,700.46 16,310.87 10,604.42 7,322.62 17,927.04
319 pan:sub-total 3.45 0.25 4.35 4.60 3.43 32.54 35.96 0.00 9.49 9.49
329 tobacco:sub-total 1.21 110.20 12.71 122.90 327.03 128.36 455.39 103.87 78.27 182.14
339 intoxicants: sub-total 2.04 114.97 19.88 134.85 310.32 157.92 468.23 427.61 268.57 696.17
359 fuel and light: sub-total 0.55 279.29 46.63 325.92 989.11 650.10 1,639.21 1,221.04 963.99 2,185.04
379 clothing: sub-total 1.18 329.40 63.31 392.71 945.05 436.23 1,381.28 645.30 532.22 1,177.52
389 bedding etc.: sub-total 1.18 24.36 2.51 26.87 50.62 22.70 73.31 45.71 50.23 95.95
399 footwear: sub-total 0.97 98.94 21.91 120.85 176.83 126.90 303.73 155.46 114.83 270.29
409 education: sub-total 1.11 62.64 14.28 76.92 234.76 161.70 396.45 237.42 209.58 447.00
419 medical - institutional: sub-total 1.72 87.72 9.15 96.87 316.97 276.90 593.87 277.06 79.80 356.86
429 medical - non-institutional: sub-total 1.72 477.07 84.39 561.46 1,008.30 565.68 1,573.98 1,315.16 801.69 2,116.85
439 etertainment: sub-total 0.14 1.07 0.56 1.63 8.40 5.40 13.80 5.40 4.45 9.85
449 minor personal effects: sub-total 5.55 69.77 13.96 83.73 78.25 72.04 150.29 165.22 171.22 336.44
459 toilet articles: sub-total 0.78 102.07 22.20 124.27 282.38 190.39 472.77 398.24 346.77 745.01
479 other household consumables: sub-total 0.78 94.88 17.25 112.14 286.56 170.00 456.56 352.92 256.11 609.03
499 consumer services excl. conveyance: sub-total 2.58 0.00 0.00 0.00 0.00 0.00 0.00 0.00 0.00 0.00
519 conveyance: sub-total 5.03 0.00 0.00 0.00 0.00 0.00 0.00 0.00 0.00 0.00
529 rent: sub-total 3.61 0.00 0.00 0.00 0.00 0.00 0.00 0.00 0.00 0.00
539 house /garage rent (imputed) 0.00 0.00 0.00 0.00 0.00 0.00 0.00 0.00 0.00
549 consumer taxes and cesses: sub-total 3.61 0.00 0.00 0.00 121.15 0.00 121.15 0.00 0.00 0.00
659 durable goods: total 0.38 110.15 26.03 136.17 200.35 112.91 313.26 205.79 693.98 899.77
Sum of Highlighted Cells (A) 713.21 137.18 850.38 1,924.58 1,137.33 3,061.91 1,566.75 1,680.63 3,247.37
888 total: non-food 1,962.78 359.11 2,321.89 5,339.49 3,109.74 8,449.24 5,556.20 4,581.20 10,137.40
999 total (777+888) 5,437.46 943.76 6,381.22 15,949.90 8,810.21 24,760.10 16,160.62 11,903.82 28,064.43
379 clothing: sub-total 1.18 429.36 76.14 505.50 1,273.35 759.19 2,032.54 1,296.37 1,027.05 2,323.42
389 bedding etc.: sub-total 1.18 32.03 8.00 40.03 69.83 35.48 105.31 77.23 76.76 153.99
399 footwear: sub-total 0.97 131.65 26.86 158.51 261.20 162.32 423.52 251.78 219.22 470.99
409 education: sub-total 1.11 123.05 60.24 183.30 335.05 232.80 567.85 514.45 459.90 974.35
419 medical - institutional: sub-total 1.72 150.63 13.46 164.08 289.65 93.48 383.12 328.97 202.79 531.75
559 furniture & fixtures: sub-total 0.23 4.24 1.42 5.66 33.34 4.66 38.00 6.99 5.39 12.38
569 goods for recreation: sub-total 0.14 2.77 1.83 4.60 13.07 2.35 15.42 8.34 4.59 12.92
579 jewellery & ornaments: sub-total 5.55 271.16 24.53 295.70 336.15 337.38 673.54 276.12 159.27 435.40
589 crockery & utensils: sub-total 9.8 66.50 8.55 75.05 254.94 110.73 365.67 281.75 217.96 499.71
609 cooking and hh appliances: sub-total 5.39 68.53 41.31 109.84 573.72 165.09 738.80 267.06 186.91 453.97
619 personal transport equipment: sub-total 1.02 113.81 12.91 126.72 218.56 253.74 472.30 256.44 408.83 665.27
629 therapeutic appliances: sub-total 1.72 0.12 0.00 0.12 0.00 0.00 0.00 0.00 0.00 0.00
639 other personal goods: sub-total 0.78 5.52 3.78 9.30 12.24 7.50 19.74 9.22 23.32 32.54
649 residential buildings and land etc.:sub-total 0.99 7.57 -1.10 6.47 27.92 6.47 34.39 29.88 8.52 38.40
659 durable goods: total 0.38 136.10 23.62 159.72 288.72 176.11 464.83 242.91 265.36 508.27
Sum of Non-highlighted Cells: C 540.22 93.24 633.46 1,469.94 887.92 2,357.86 1,135.80 1,014.78 2,150.58
Sum of Highlighted Cells: B 1,002.82 208.33 1,211.14 2,517.80 1,459.37 3,977.17 2,711.71 2,251.07 4,962.77
D = B-A 289.61 71.15 360.76 593.22 322.04 915.26 1,144.96 570.44 1,715.40
888* total : non-food (C+D) 829.83 164.39 994.22 2,063.15 1,209.96 3,273.12 2,280.76 1,585.22 3,865.98
999 total (777+888*) 6,267.29 1,108.15 7,375.44 18,013.05 10,020.17 28,033.22 18,441.38 13,489.04 31,930.42
Share in Total Consumption Expenditure 85.0 15.0 64.3 35.7 57.8 42.2
Price Deflator (CPI(IW)-2008/CPI(IW)-2004) 1.39 1.26 1.33
A
Annual Pvt. Final Consumption Exp.(in Rs.
Crore) (2008 Prices) 10,251.86 35,286.51 42,527.39
B Sales Tax (Rs. Lakh): 2007-08 1,09,216.48 7,72,098.25 5,34,248.69
B as Percentage of A (%) 10.65 21.88 12.56
C GSDP at Factor Cost (Current Prices): 2007-08 (Rs. Lakh) 32,22,057.64 1,54,23,053.00 1,44,30,933.00
B as Percentage of C (%) 3.39 5.01 3.70
D Market Size (Rs. Crore): 2006 18,742.00 69,405.00 1,05,346.00
A as Percentage of D 54.70 50.84 40.37
B as Percentage of D (%) 5.83 11.12 5.07
Population as on '01/10/2007
Haryana
Haryana
Punjab
Population as on '01/10/2007
PunjabStates
Settlement
Himachal Pradesh
Population as on '01/10/2007
Himachal Pradesh

42
Appendix 3.2
(Rs. Crore)
2006-07 2007-08 2008-09
All India
1 Value of output 8,21,755 9,14,593 9,76,246
1.1 New construction 6,66,000 7,39,149 7,89,778
1.2 Repair & maintenance 1,55,755 1,75,444 1,86,468
2 Gross domestic product 2,85,722 3,14,298 3,32,781
2.1 Gross domestic product unadjusted for FISIM* 2,97,309 3,31,242 3,51,437
2.2 less: FISIM 11,587 16,944 18,656
3 less: consumption of fixed capital 12,631 15,428 17,842
4 Net domestic product 2,73,091 2,98,870 3,14,939
5 Value of input (unadjusted for FISIM) (1-2) 5,36,033 6,00,295 6,43,465
6 Value of input (adjusted for FISIM) (5-2.2) 5,24,446 5,83,351 6,24,809
7 less: Consumption of Fixed Capital (6-3) 5,11,815 5,67,923 6,06,967
8 Net Value of Input (7) 5,11,815 5,67,923 6,06,967
9 as % of GDP from Construction [(7/2)*100] 179 181 182
Himachal Pradesh 2006-07 2007-08 2008-09
10 GSDP from Construction (Rs. Crore) 4,907 5,251 6,003
(at constant 1999-00 prices)
11 Net Value of Input (Rs. Crore) [10*(9/100)] 8,790 9,488 10,950
12 Share of Cement in total input used for Construction (7%)** (Rs. Crore) (7% of 11) 615.3 664.2 766.5
13 Potential for Tax Collection from Cement (@12.5%) (Rs. Crore) (12.5% of 12) 76.9 83.0 95.8
14 Actual Tax Collection from Cement (Rs. Crore) 47.55 60.35 52.78
15 Revenue Gap (13-14) (Rs. Crore) 29.4 22.7 43.0
Notes: *-FISIM: Financial intermediation services indirectly measured.
**-Estimated based on Input-Output Table for 2006-07 (Commodity x Commodity Matrix).
Source: CSO’s National Account Statistics.
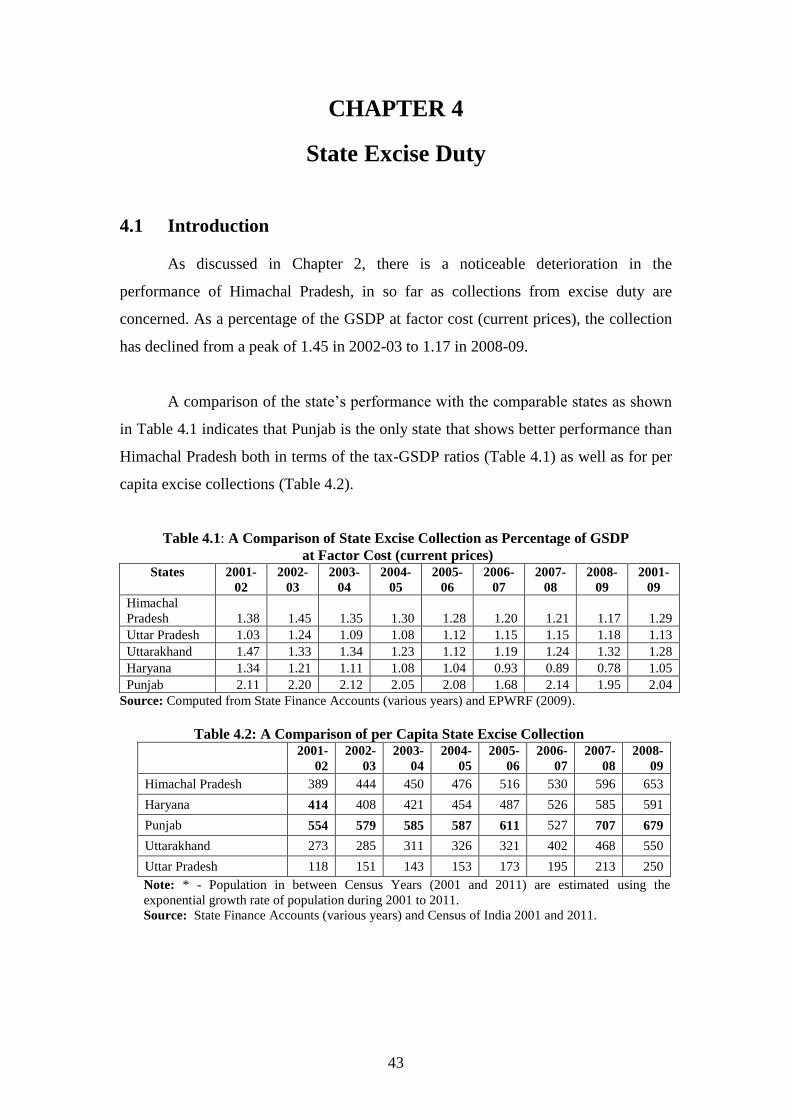
43
CHAPTER 4
State Excise Duty
4.1 Introduction
As discussed in Chapter 2, there is a noticeable deterioration in the
performance of Himachal Pradesh, in so far as collections from excise duty are
concerned. As a percentage of the GSDP at factor cost (current prices), the collection
has declined from a peak of 1.45 in 2002-03 to 1.17 in 2008-09.
A comparison of the state’s performance with the comparable states as shown
in Table 4.1 indicates that Punjab is the only state that shows better performance than
Himachal Pradesh both in terms of the tax-GSDP ratios (Table 4.1) as well as for per
capita excise collections (Table 4.2).
Table 4.1: A Comparison of State Excise Collection as Percentage of GSDP
at Factor Cost (current prices) States 2001-
02
2002-
03
2003-
04
2004-
05
2005-
06
2006-
07
2007-
08
2008-
09
2001-
09
Himachal
Pradesh 1.38 1.45 1.35 1.30 1.28 1.20 1.21 1.17 1.29
Uttar Pradesh 1.03 1.24 1.09 1.08 1.12 1.15 1.15 1.18 1.13
Uttarakhand 1.47 1.33 1.34 1.23 1.12 1.19 1.24 1.32 1.28
Haryana 1.34 1.21 1.11 1.08 1.04 0.93 0.89 0.78 1.05
Punjab 2.11 2.20 2.12 2.05 2.08 1.68 2.14 1.95 2.04
Source: Computed from State Finance Accounts (various years) and EPWRF (2009).
Table 4.2: A Comparison of per Capita State Excise Collection
2001-
02
2002-
03
2003-
04
2004-
05
2005-
06
2006-
07
2007-
08
2008-
09
Himachal Pradesh 389 444 450 476 516 530 596 653
Haryana 414 408 421 454 487 526 585 591
Punjab 554 579 585 587 611 527 707 679
Uttarakhand 273 285 311 326 321 402 468 550
Uttar Pradesh 118 151 143 153 173 195 213 250
Note: * - Population in between Census Years (2001 and 2011) are estimated using the
exponential growth rate of population during 2001 to 2011.
Source: State Finance Accounts (various years) and Census of India 2001 and 2011.

44
The excise revenue for Punjab has however been rather volatile in recent
years. Both in 2006-07 and in 2008-09, the revenue collections from this levy
registered a decline, which is attributable to a decline in collections from the country
liquor segment.1 In all the other years, both in terms of per capita revenue and tax -
GSDP ratio, the performance of Punjab is better than that of Himachal Pradesh. Thus,
it may be concluded that while the comparative performance of Himachal Pradesh on
the excise front may be adequate, there may still be scope of improvement particularly
in view of the fact that there is a much larger inflow of tourists in Himachal Pradesh –
1.14 crore as compared to 4.5 lakh in Punjab.
Since revenue collections in state excise are dependent on the consumption
habits in the state, it would also be useful to explore whether there are any differences
in the patterns of consumption which could explain the differences in revenue
collections. Section 4.2 provides a discussion on the consumption patterns of liquor
and the corresponding revenue collections. Section 4.3 analyses disaggregate
information on receipts from state excise, in terms of the products to identify any
changes in consumption trends that could explain the changes in revenue collections.
The following section provides a brief overview of the excise policy in the state and
identifies some measures that can either augment the revenue collection or reduce the
cost of collection/administration associated with the tax (Section 4.4).
4.2 Consumption of Liquor across Selected Indian States
One source of data for comparison of consumption patterns is the National
Sample Survey. The Survey for the year 2004-05 provides information on the
expenditure on alcoholic beverages as well as on the amount of liquor consumed.
Tables 4.3 and 4.4 summarise this information for the comparable states. What these
tables reveal is that while Himachal Pradesh ranks 3rd
in consumption, it drops to rank
5 in terms of revenue collection. If these figures are considered a fair representation of
the size of consumption in the state, then the revenue collection per litre of
consumption for Himachal Pradesh is substantially lower than that in the other states
1 This is based on data on actual withdrawal of IMFL, Country Liquor and Beer and the data on
revenue collection from IMFL, Country Liquor compiled from Budget Documents

45
in the region. The same holds for revenue collection per rupee of expenditure on
alcoholic beverages.
Table 4.3: Annual Consumption of Liquor (in million litre) (rural & urban combined)
(population as on October 01, 2007)
State Toddy Beer
Country
liquor
Foreign
liquor
Country liquor
& foreign
liquor
Revenue from
excise (Rs. crore):
2007-08
Himachal
Pradesh 0.1 0.1 14.7 12.6 27.3 (3) 390 (5)
Uttar Pradesh 3.6 0.3 170.8 1.1 171.9 (1) 3,948 (1)
Uttarakhand 0.1 0.2 4.3 2.3 6.6 (5) 442 (4)
Haryana 0.0 0.7 22.7 2.5 25.2 (4) 1,379 (3)
Punjab 0.0 0.2 20.6 39.3 59.9 (2) 1,862 (2)
Note: Figure in the parenthesis shows the ranks for the corresponding category.
Source: Estimation based NSSO’s 61st Round Survey (2004-05).
Table 4.4: Annual Expenditure on Liquor by Residence: A Comparison
Across Selected Indian States: 2007 (Rs. Lakh)
State
Rural Urban
Toddy
Country
liquor Beer
Foreign
liquor Total Toddy
Country
liquor Beer
Foreign
liquor Total
Himachal
Pradesh 145 8,728 199 4,554 13,625 - 1,521 - 945 2,466
Uttar
Pradesh 1,826 93,564 456 3,195 99,041 627 21,306 501 2,507 24,940
Uttarakhand 63 5,643 275 5,876 11,857 16 2,499 263 3,457 6,235
Haryana 136 27,979 455 4,595 33,165 - 8,921 556 8,236 17,713
Punjab - 33,363 148 15,371 48,882 - 168 6 58 232
Note: For a detailed procedure on adjustment of monthly average per capita consumption expenditure to
get in annual consumption expenditure for State see Appendix 3.1.
Source: Estimated based on NSSO’s 61st Round Data
It must however, be stated that there are potentially two sorts of problems in
using the NSS data – first, since the data is drawn from a sample survey, people often
tend to underreport their consumption of alcoholic beverages since there is often a
stigma attached to such consumption. It is not clear though whether these biases vary
across states and whether the impact can be different across states. Second, since
these products are also consumed by tourists as well as people in army bases for
instance, since the survey would not cover such individuals, the consumption figures
based on the survey would not cover these components of consumption within the
state. The extent of understatement on these counts can vary across states depending
on the relative importance of these elements in the total consumption in the state.
46
In looking for alternative sources of information, it is useful to mention the
Alcohol Atlas of India. While there are no other firm sources of data on state level
consumption, the Alcohol Atlas of India does suggest that of the total consumption in
India, a significant proportion (about 50 percent) is undocumented consumption.2
Undocumented/unrecorded consumption refers to the consumption that is not reported
in the sales with which the tax authority is concerned. Not all of the undocumented
sales need be illegal – they can be from goods legally brought into the state, as
allowed by law for private consumption, as well. However, it is likely that a sizeable
proportion would be illegally supplied and even maybe illegally brewed. This
suggests that there is potential for augmenting the tax collections from excise, in
Himachal Pradesh as well as in other states.
Anecdotal evidence also suggests that there is possibly some degree of
smuggling of alcohol to Punjab, Haryana and Himachal Pradesh from Chandigarh
owing to the lower levels of taxes in the latter.3
4.3 Consumption and State Excise Collection in Himachal Pradesh
The following graph shows that sales of liquor in Himachal Pradesh have
increased more or less consistently since 2000-01. While there are some fluctuations
in the consumption of IMFL and country liquor, these seem to be compensated for by
the trends in beer sales (Table 4.3). There is one significant spike in sales of IMFL in
2004-05 to 2005-06, which gets neutralised over the next two years. It is not
immediately clear what caused this spike.
2http://www.indianalcoholpolicy.org/alcohol_atlas_download.html (last accessed on 15 May 2011)
3 http://www.thehindu.com/news/states/other-states/article77219.ece (last accessed on 15 May 2011)

47
Figure 4.1: Sales of Liquor in Himachal Pradesh
Source: Department of Excise & Taxation, Govt. of Himachal Pradesh, Shimla.
In order to check whether the excise duty collections are a fair reflection of the
sales figures in the state, Table 4.3 provides estimates of collection per proof litre of
liquor sales for country liquor and IMFL.4 Surprisingly, the revenue per proof litre of
country liquor has been declining almost consistently from 2003-04 to 2008-09, with
some reversal in 2009-10. Given the fact that the sales have not declined, and the
tariffs have not been revised downwards, it is possible to conclude that the revenues
due to the government are not being collected, else the same are getting locked up in
litigation. Coming to IMFL, the data suggests that there is no consistent trend, the
years for which there is an observed spike in consumption (i.e., 2005-06 in Figure
4.1), there is in fact a corresponding decline in the revenue per proof litre (Table 4.3).
For other years, the revenue tends to fluctuate. Once again, since tariffs have not been
revised downwards, the inevitable conclusion would be that the revenue due to
government is somehow not accruing.
4 Since the revenue from beer is clubbed with revenue from IMFL in official statistics, in Table 4.3
IMFL refers to IMFL inclusive of beer.

48
Table 4.5: Category-wise Sales and Revenue Collection from Liquor in Himachal Pradesh
Year
Sales in Himachal Pradesh
Receipt
from
country
liquor &
country
fermented
liquor (Rs.
'000)
Receipt
from
foreign
liquor &
spirit (Rs.
'000)
Receipt / Sales
(Rs./PL)
CL (PL) IMFL (PL) Beer (BL)
Beer (in
PL)**
Country
Liquor*
IMFL
+
Beer
2000-01 88,08,416 47,76,776 26,60,481 2,32,967 - - - -
2001-02 97,83,810 59,17,382 35,09,777 3,07,336 13,00,525 9,33,738 133 150
2002-03 1,04,03,683 52,33,957 35,52,093 3,11,041 - - - -
2003-04 99,81,615 54,09,062 33,83,715 2,96,297 15,37,243 11,55,646 154 203
2004-05 1,10,11,659 54,96,431 32,49,506 2,84,545 16,60,381 12,48,551 151 216
2005-06 1,23,78,874 95,41,388 35,61,071 3,11,828 17,65,305 14,12,966 143 143
2006-07 1,22,87,747 78,86,732 55,42,209 4,85,307 17,88,837 13,51,914 146 161
2007-08 1,19,65,306 63,00,203 93,45,367 8,18,333 16,61,459 17,70,955 139 249
2008-09 1,55,41,553 89,16,116 1,05,70,349 9,25,600 18,02,223 20,41,082 116 207
2009-10 1,62,22,125 1,02,05,528 1,24,53,343 10,90,485 20,41,541 23,17,916 126 205
CAGR
(2003-04
to 2009-
10)
7.83 9.17 29.48 29.48 3.47 12.50
Notes: *-includes Country Fermented Liquor
** - London Proof Litre = Alcohol Strength in % /0.571/100 x bulk litre, we assumed average strength of beer as
5%.
A look at some of the comments of the Comptroller and Auditor General of
India also suggests that there is some evidence of the slippages in the revenue
collection. However, the revenues locked in dispute are relatively small. Barely 1.6
percent of the total revenue is locked in disputes/arrears. In other words, this
discussion does raise the need to explore means for improving administration of
excise duty collections in the state. While the discussion of administrative issues will
be taken up in Chapter 7, there is need to explore whether there are policy related
issues, changes in which could generate better incentive to comply with the tax
regime.
4.4 Excise Policy: Implications and Suggestions
The Excise Act recognises broadly three groups of dealers – distillers and
brewers, wholesale dealers and retail vends, and any combinations of the same. The
various Acts and Rules which are applicable for three groups of operators, namely,
distillers, wholesalers and retailers, are presented in Table 4.6. The key features of the
system for each of these players are summarised below (Appendix 4.1 provides
detailed process of Excise Allotment).

49
1. The distillers and brewers: The levies imposed on a distiller include, apart from a
security deposit, a license fee of Rs. 50,000, and a further license fee at the rate
of Rs. 0.9 per 750 ml of IMFL and Rs. 0.7 per 750 ml of country liquor, subject
to a minimum of Rs. 75000 per annum. These levies are for liquor to be sold in
the state. For bottling of liquor of other distillers as well as for liquor produced
for export out of the State, there are other charges that the distiller faces, albeit at
slightly lower rates of Rs. 0.5 and 0.4 per 750 ml respectively. A minimum
amount is to be paid as an advance against which the actual dues based on
production would be adjusted. The license is renewable annually on payment of
the minimum amount of Rs. 75,000. For a brewery, the license fee is Rs. 10,000
plus Rs. 0.2 per 650 ml subject to a minimum of Rs. 10,000 per annum. The
distillery rules prescribe an outturn of spirit from the base used. In the case of
country liquor, the outturn is prescribed as 12 proof gallons of spirit from 100
gallons of wash. The calculation of the outturn of whisky prepared from malt is
prescribed as 8.2 proof litres of whisky from 19 kilograms of malt. For a
brewery, the norms allow for 10 percent wastage from the total quantity brewed
as per the brewing book of the licensee.
2. Wholesalers: The license fee for wholesalers is in the nature of a fixed fee not
related to the quantum of sales, unless the wholesaler deals in spirits imported
from outside the country. For import of “foreign liquor” the license fee is fixed in
term of the amount of liquor imported, with the rates varying by the kind of
product involved.
3. Retailers: The license fee of retailers has two components – a fixed component
and an assessed component based on the MGQ prescribed. For computing the
assessed fee, the excise policy defines the tariff for different kinds of spirits and
recognises a distinction between country liquor on one side and other spirits,
beer, wine and cider on the other. There is a further distinction between imported
products as against Indian made products. There is no MGQ prescribed for beer,
wine and cider. The license fee as well as excise duty on these products are
payable on lifting for sale.
The laws and levies regulating and relating to this sector are summarised in
Table 4.6 below.

50
Table 4.6: A Synoptic View on Excise Policy & Procedures in Himachal Pradesh Country Spirit Foreign Liquor & beer
Distillers Wholesalers Retailers Distillers Wholesalers Retailers*
Acts & Rules
Punjab Excise Act, 1914 Yes Yes Yes Yes Yes Yes
Punjab Distillery Rules, 1932 Yes Yes Yes Yes
Himachal Pradesh Liquor License
Rules, 1986 Yes Yes Yes Yes
Punjab Brewery Rules, 1932 Yes Yes
Punjab Liquor Permit & Pass
Rules, 1932 Yes Yes
Procedures
Excise Policy & Arrangements
(Annual) Yes Yes Yes Yes
Excise Allotment/ Renewal
Announcement (Annual) Yes Yes
Process for Grant of Licenses
License Fee (Annual) Yes
Fixed Fee (Annual) Yes Yes
Based on Allotment, Renewal,
Auction or Negotiation Yes Yes
Duties & Fees (Annual) Yes Yes Yes Yes
Application Fee or Renewal Fee Yes Yes
Basic License Fee - based on
MGQ Yes Yes
Annual License Fee – based on
MGQ Yes Yes
Excise Duties Yes Yes
Others
Issue of Excise Pass for
withdrawal from warehouses Yes Yes
Note: *- Retail vends in hotels or dak-bungalows, restaurants, restaurants with attached bar, beer bars,
CSD canteens, railways will attract additional Assessed Fee on top off the Fixed Fee.
Source: Compiled from https://hptax.gov.in/HPPortal/
Apart from these license fees which the department fine tunes somewhat for
different kinds of retailers, there is a levy called the Excise Duty. For most of the
products, it would appear that the excise duty component is very small compared to
the levy included in the assessed license fee (see Table 4.7 below).
Table 4.7: Assessed Fee and Excise duty for 2010-11 - a Comparison Description Assessed Fee Excise Duty
Country Liquor Rs. 113 per PL Rs. 7 per PL*
IMFL Rs. 157 per PL Rs. 25 per PL
Beer Rs. 20 per BL Rs. 7.2-11.8 per BL
Importer Foreign Spirit (BII) Rs. 170 per PL Rs. 25 per PL
Importer foreign spirit (BIO) Rs. 200 per PL Rs. 25 per PL
Importer Beer (BIO) Rs. 29 per BL Rs. 7.2-11.8 per BL
Importer Wine and Cider(BIO) Rs. 27 per BL Rs. 1-5 per BL
Indian made wine and Cider Rs. 18 per BL Rs. 1-5 per BL
Note: *-Country liquor with strength of 50o under proof.
Source: Summarised from Excise Policy 2010-11, Government of Himachal Pradesh.

51
The Table 4.7 brings to the fore an interesting feature – the levies collected as
assessed fees for any particular kind of spirit is significantly higher than the levy
collected as excise duty. While the excise duty would be collected at the time the
stocks are procured, the annual assessed fee divided into 12 monthly instalments is
payable irrespective of the quantum of withdrawals during a month. Further, there is a
penalty imposed on shortfall of sale when compared to the MGQ – if the sales are less
than 80 percent of MGQ, there is a penalty of Rs 20 per PL of shortfall payable. On
the other hand, if a retailer finds demand to be in excess of the MGQ, there is a
provision for getting additional quota, with an associated license fee, which is
summarised in Table 4.8 below.
Table 4.8: Comparison of System of Settlement for Retailers 2011-12 System Himachal Pradesh Haryana Punjab
Settlement
System – Retail
Sale
Application-cum-lottery
System at fixed fee
Application-cum- bidding
system (Tender). Minimum
bid price is the reserved
price for a vend. Draw of
lot in case of multiple bids
of the same.
Licensing Units (LUs) are
allotted as Units/ Groups/
Zones Application-cum-
Allotment System is
followed.
Application Fee
(or Participation
Fee/ Processing
Fee) (Rs. Per
Application or
per shop)
Rs. 15,000 (non-
refundable and non-
adjustable)+10% of
Basic License Fee fixed
for the Vend
(adjustable)
Rs. 15,000 (non-refundable
and non-adjustable) +
earnest money as
applicable depending upon
the reserved price of the
vend (refundable /
adjustable)*+20% of the
bid amount (if bid amount
exceeds 25% of the
reserved price)
From Rs. 10,000 to Rs.
50,000 (refundable for
cancelled bids or for
cancelled allotment after
deduction of Rs. 2000 as
processing fee) + allotment
fee for per unit/group/zone
(Rs. 10 lakh for corporation
towns, Rs. 5 lakh for District
Head Quarters and Rs. 2 lakh
for other locations)
Renewal of
Retail License
Renewable Renewable Renewable
Fee for
withdrawal
above MGQ
(a) Up to 15% of the
MGQ: 15% of the
prescribed License Fee
(b) Above 15% to 50%
of MGQ: 25% of the
prescribed License Fee
( c) Above 50% of
MGQ: 50% of the
prescribed License Fee
An additional quota upto
50% of basic quota is
granted on additional
payment of Rs. 7/PL for
Country Liquor and Rs.
17/PL for IMFL.
Allowed to lift additional
25% of the basic quota in
two equal half yearly
instalment subject to
withdrawal of 45% of the
basic quota within six
months.
Charges for additional quota:
a) License fee of Rs. 8/PL of
Country Liquor in addition to
other levies.
b) For IMFL: 50% of Extra
License Fee as applicable to
that category. No license fee
will be charged on additional
quota.
Retail Price
Setting
Sets up Minimum
&Maximum retail Price
Sets up Minimum retail
Price
Sets up Maximum retail
Price
Note: *-Earnest money is forfeited for cancelled bids.
Source: Compiled from respective State Policy on Settlement of Retail Shops.

52
The system followed by Himachal Pradesh in effect transforms the excise duty
structure into a predominance of license fee, with very little revenue accruing
depending upon the actual sales in the state. The state chooses this form of levies so
as to minimise the revenue risk – a larger dependence on excise duty implies that the
revenue would be more closely related to the actual sales. Smuggled goods brought
into the state for instance, would reduce the total collections. On the other hand, with
the present structure, the assessed fees ensure certainty about a large component of the
collections.
4.4.1 Comments on the Process of Excise Allotment/Settlement in
Himachal Pradesh
Revenue generation should be the foremost objective behind annual excise
allotment/settlement besides encouragement for competition. A quick review of
Excise Allotment/Settlement Announcement of Himachal Pradesh for 2013-14, shows
that the state does not meet the objectives in many counts. The observations are as
follows:
Instead of asking for bidding (over and above the reserve price or basic license
fee sets by the department), the present system in Himachal Pradesh
encourages fixed charges based approach (Fixed Application Fee, Fixed
Earnest Money) which is detrimental for revenue generation. The bidding
system should allow bidders to reveal their Reserve Price for their desired
vend/unit and the system will discover the true price. The present system
encourages cartelisation among potential bidders which will needs to be
broken to discover the actual price of a vend/unit.
The application fee is very low in Himachal Pradesh (Rs. 15,000 per
application) and it is based on per application not per vend. For example, in
Haryana the participation fee is Rs. 25,000 and it is applicable for each vend.
Therefore, applicants for an unit (if comprising of 3 vends) have to pay Rs.
75,000 for participation/application.
The application process includes only application fee and earnest money (10%
of basic license fee) in Himachal Pradesh. Whereas in Haryana, it includes
application fee, earnest money (linked to reserve price, see Table 4.9 below),

53
and bid amount (21% of the bid amount, if the bid exceed the reserve price by
25%)
There is no reason for limiting number of applications for settlement of vends/
units.
Multiple process of excise settlement (allotment, auction, private contract,
calling tenders, by negotiations, by draw of lots, by renewal, by any other
arrangements including combination of the foregoing modes) discourages
competition. If there is no demand for a vend/ unit in a year, the same should
be discontinued. The actual consumption will not depend on numbers of
vends. The discretionary power at the hand of tax administrator needs to be
discouraged.
The system should encourage using banking and financial instruments for
transaction with government. The cash transactions should be prohibited. The
people having unaccounted income will find beneficial to venture into liquor
business if cash transactions are allowed. The system also discourages
competition.
The renewal of license should be discontinued as the system does not
encourage competition.
The present system of single license for manufacturing and retail vending of
country fermented liquor (L.20-B) requires separation of manufacturing from
vending. The license for vending of can be clubbed with L.14 & L.14-A
licenses of country liquor whereas manufacturing license can be clubbed with
manufacturing of country liquor.
Table 4.9: A Comparison of Earnest Money between Himachal Pradesh and Haryana
Himachal Pradesh Haryana
Sr.
No.
Minimum
Guaranteed
Quota of the Unit
Basic license
fee
Earnest
Money*
Reserve price of
Group/Vend
Earnest
Money
1. Upto 15000 Pls Rs. 29,000.00 Rs. 2,900.00 Less than Rs. 50 lac Rs. 1.5 lac
2.
Above15001to
25000 Pls Rs. 41,000.00 Rs. 4,100.00
Between Rs. 50 lac
to Rs. 100 lac Rs. 2.5 lac
3.
Above25001to
35000 Pls Rs. 52,000.00 Rs. 5,200.00
Between Rs. 100 lac
to Rs. 150 lac Rs. 5 lac
4.
Above 35001to
45000 Pls Rs 64,000.00 Rs. 6,400.00
Between Rs. 150 lac
to Rs. 200 lac Rs. 6 lac

54
Himachal Pradesh Haryana
Sr.
No.
Minimum
Guaranteed
Quota of the Unit
Basic license
fee
Earnest
Money*
Reserve price of
Group/Vend
Earnest
Money
5.
Above 45001to
65000 Pls Rs. 80,000.00 Rs. 8,000.00
Between Rs. 200 lac
to Rs. 300 lac Rs. 7 lac
6.
Above 65001to
80000 Pls Rs. 92,000.00 Rs. 9,200.00
Between Rs. 300 lac
and Rs. 400 lac Rs. 10 lac
7.
Above 80001to
100000 Pls Rs. 1,15,000.00 Rs. 11,500.00
Rs. 400 lac and
above Rs. 12.5 lac
8.
Above 100001to
200000 Pls Rs. 2,30,000.00 Rs. 23,000.00
9. Above 200001 Pls Rs. 5,75,000.00 Rs. 57,500.00
Note: *-Earnest Money is 10% of Basic License Fee.
Source: Excise Allotment Accouchement of Himachal Pradesh and Haryana for 2013-14.
4.4.2 Implications of the Policy
1. The state policy prescribes both a maximum and a minimum price for the products
to be sold. The minimum price is purportedly to ensure that the suppliers get a
reasonable margin, while the maximum price is introduced to ensure reasonable
prices for the final consumer. In addition, as discussed above, the policy also
prescribes a MGQ. In any given market, controlling both the price and the
quantity is not feasible, unless there is very accurate prediction of demand.
Assuming a more feasible scenario where the predictions of demand are
approximate at best, the implications of prescribing both maximum and minimum
prices would be as follows:
a. If there is inadequate demand for the products, given the existence of a penalty for
selling less than 80 percent of the MGQ, the seller would choose to reduce the
price, so as to attract demand. With a penalty of Rs 20 per PL, there is some scope
for reduction in price to increase sales and thereby avoid the penalty.
b. If the demand is underestimated, the seller has two choices – one, to increase the
price so that demand is discouraged, or two, to ask for additional quota. The
additional quota however cannot be drawn in small packets – for withdrawals upto
15 percent of MGQ, the additional license fee is fixed at 15 percent of the original
license fee.5 Therefore, unless the retailer expects to sell close to 15 percent more
5Excise & Taxation Department (2011), "Excise Allotment/ Renewal Announcements 2011-12",
Government of Himachal Pradesh, Shimla. Chapter 4, Section 4.6, Page No. 14.

55
than the MGQ, he would be unwilling to take the additional quota.6 This
sentiment would be further reinforced by the fact that the MGQ in subsequent
years would stand revised upwards to the extent of additional lifting in any given
year. The alternative therefore is to raise the prices. Ensuring that the retailer does
not opt for this alternative requires extensive monitoring, with the associated risk
of rent seeking.
c. In case there exists some inter-vend differentials in demand not already captured
by the MGQ allocation, the change in demand can provide an opportunity for
trade among the vends. More importantly, if there are any opportunities for
smuggling the goods from other states, the vendor may choose this route over
requesting additional quota from the department itself.
4.4.3 Suggestions
In light of the above, two suggestions are apparent:
a. Once the MGQ is fixed, there is no merit in fixing a maximum or a minimum
retail price. Table 4.8 shows that this is not the policy adopted by other states.
Haryana for instance, chooses to fix a minimum retail price while Punjab fixes
a maximum retail price.
b. In fixing assessed license fee on additional quota, it would be prudent to relate
the collection to the amount of additional lifting, i.e., charge the vendor only
the fee per PL of liquor taken. Haryana adopts such a policy (see Table 4.8
above). This would reduce the incentive to procure from elsewhere. It could
also reduce the incentive to raise the price, provided a one time increase in
MGQ is not used as evidence of sustained demand by the department.
Persistence of additional demand over three years, say, might be used for
augmenting the MGQ. This would reduce the long term commitment of the
dealer in terms of sales and hence would encourage additional withdrawals
from within the system.
In so far as the distillers are concerned, given the government’s interest in
fixing prices, there is an immediate need to control the costs of production as well.
6 By making the process to get approval for additional quota above 15% of MGQ complicated
(application forwarded to Excise & Taxation Commissioner) and not allowing vendors to withdraw
additional quota more than 5 percent in each quarter (for additional quota upto 15 percent of MGQ),
the system encourages vendors to look for alternative sources for their additional requirement of stock.

56
Further, since the produce of the distillers and brewers would be sold either in the
state or outside the state, with a corresponding levy of assessed fee and excise duty,
present excise policy attempts to keep a check on the quantum of inputs used and the
corresponding outputs – alcohol - produced. As discussed above, the rules prescribe
the norms to be adopted for assessment. However, any such normative judgement
needs close monitoring to identify violation. The discussions in the Audit reports on
Revenue of Himachal Pradesh by the Comptroller and Auditor General of India7
indicate that there are slippages in the performance of the distilleries when compared
to the norms prescribed. The slippages however have not been detected by the
department and/or not dealt with through the imposition of suitable penalties as
prescribed in the rules (see Table 4.10). While the departmental clarification to the
CAG suggests that the norms are too restrictive, and actual performance could
justifiably vary from the same, given that neither is the norm revised, nor is the
justification discussed in any assessment of the cases concerned, it would appear that
there is difficulty in administering this provision, either on technical grounds, the
norm being poorly spelt out, or on pure administrative grounds like inadequacy of
manpower required to monitor all the units.
Table 4.10: Excise Duty Shortage due to Low Yield of Sprit from Molasses
(Rs. In lakh) 2005-06 2006-07 2007-08 2008-09
Non realization of duty on excess wastage 3.29 - 2.08
Loss of duty on admissible wastage 197
Irregular/inadmissible allowance of
wastage in maturation process 3.99
Low yield of spirit from molasses 431
Non levy of duty on excess wastage in
manufacture of extra neutral alcohol 6.90
Source: Audit Reports (Revenue) for Himachal Pradesh, CAG of India.
The above suggests that there is merit in technically re-examining the norms
proposed and revising the same. This has been one consistently discussed suggestion
in the reports of the CAG. Alongside, it is useful to examine ways of augmenting the
7Comptroller and Auditor General of India, “Audit Report (Revenue), Himachal Pradesh”, for various
years.

57
administrative capacity of the department so as to better monitor the various
indicators. CAG in its 2009 report has mentioned that there is a need for bringing in a
separate legislation applicable to the state of Himachal Pradesh rather than relying on
the Punjab Excise Act, 1914 which has been adopted by the state. While, the nature of
the problems arising out of the system has not been delineated, there may be
interpretation issues arising out of the same. It may, therefore, be a good idea to
consider having the state’s own excise legislation suited to its own specific
requirements.
In addition to the above, given the difficulties in monitoring the import of
alcohol into the state, and ensuring that the revenues are duly reported, some states
have experimented with the idea of setting up a beverages corporation within the state
which is assigned the sole responsibility of wholesale trade in these beverages in the
state. While such a measure tends to introduce government into areas where there is
no rationale for government intervention, it can reduce the compliance issues relating
to import of spirits into the state, and place the onus of monitoring the distilleries on
this organisation. In order to understand whether there is any clear revenue advantage
from such a move, Table 4.11 below provides a comparison of the state excise
GSDP ratios for some of the states that introduced such corporations. The
experience in the Table suggests that two states gained, i.e., Bihar and Orissa, while
the other two states did not. In the case of Rajasthan, the CAG reports suggest that the
corporation was not sufficiently well planned and executed.8 Better planning with a
well-defined IT framework, could have led to improvements in revenue generation in
this state as well.
8CAG report on Rajasthan State Beverages Corporation Limited
The Company neither formulated a formal Information Technology policy nor any long-
term/medium-term strategic IT plan.
Due to design deficiency, the system was not able to identify the stock of expired beer which
led to sale of expired beer amounting to Rs. 20.21 lakh.
Due to design deficiency, the system could not ascertain the position of active/inactive stock
lying in depots and therefore could not compute the demurrage.
Due to non-mapping of business rules and policy of the Company, the system accepted the
supply of goods without linking to validation period.
Lack of proper validation checks resulted in acceptance of duplicate bank challans from
retailers for delivery of goods and fraudulent transactions.
Lack of validation checks and inadequate input control made the system ineffective in
ensuring the completeness and correctness of the data.
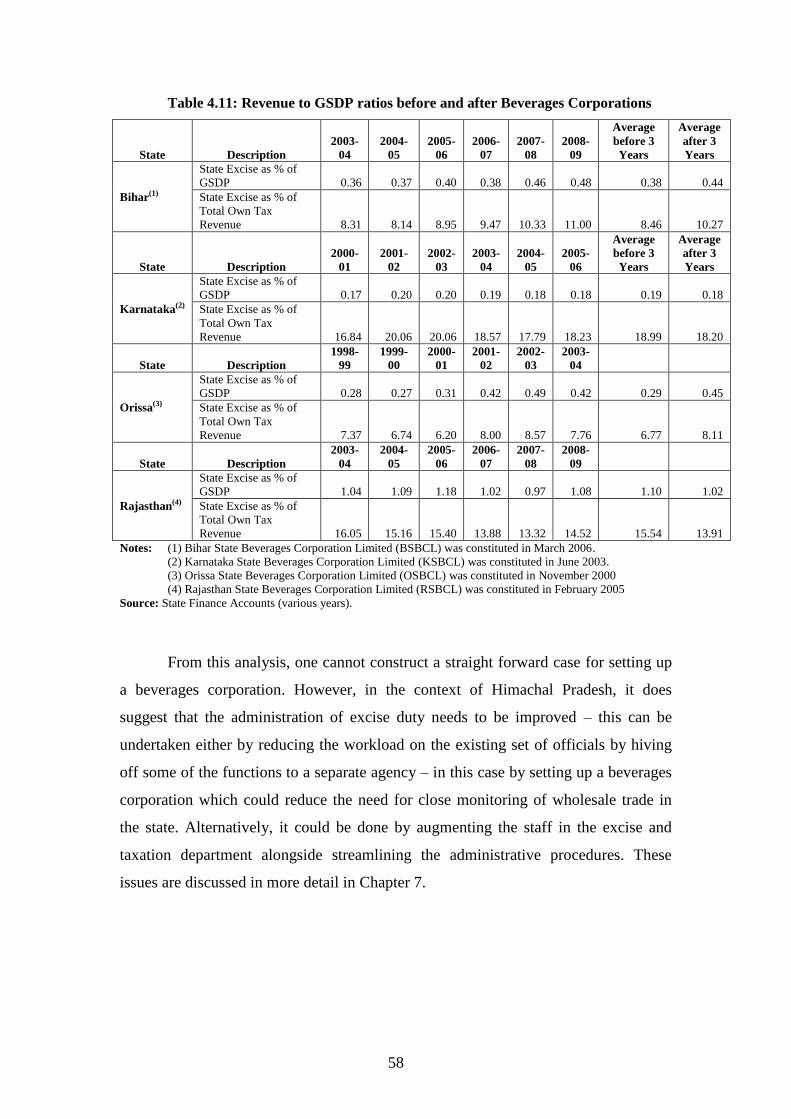
58
Table 4.11: Revenue to GSDP ratios before and after Beverages Corporations
State Description
2003-
04
2004-
05
2005-
06
2006-
07
2007-
08
2008-
09
Average
before 3
Years
Average
after 3
Years
Bihar(1)
State Excise as % of
GSDP 0.36 0.37 0.40 0.38 0.46 0.48 0.38 0.44
State Excise as % of
Total Own Tax
Revenue 8.31 8.14 8.95 9.47 10.33 11.00 8.46 10.27
State Description
2000-
01
2001-
02
2002-
03
2003-
04
2004-
05
2005-
06
Average
before 3
Years
Average
after 3
Years
Karnataka(2)
State Excise as % of
GSDP 0.17 0.20 0.20 0.19 0.18 0.18 0.19 0.18
State Excise as % of
Total Own Tax
Revenue 16.84 20.06 20.06 18.57 17.79 18.23 18.99 18.20
State Description
1998-
99
1999-
00
2000-
01
2001-
02
2002-
03
2003-
04
Orissa(3)
State Excise as % of
GSDP 0.28 0.27 0.31 0.42 0.49 0.42 0.29 0.45
State Excise as % of
Total Own Tax
Revenue 7.37 6.74 6.20 8.00 8.57 7.76 6.77 8.11
State Description
2003-
04
2004-
05
2005-
06
2006-
07
2007-
08
2008-
09
Rajasthan(4)
State Excise as % of
GSDP 1.04 1.09 1.18 1.02 0.97 1.08 1.10 1.02
State Excise as % of
Total Own Tax
Revenue 16.05 15.16 15.40 13.88 13.32 14.52 15.54 13.91
Notes: (1) Bihar State Beverages Corporation Limited (BSBCL) was constituted in March 2006.
(2) Karnataka State Beverages Corporation Limited (KSBCL) was constituted in June 2003.
(3) Orissa State Beverages Corporation Limited (OSBCL) was constituted in November 2000
(4) Rajasthan State Beverages Corporation Limited (RSBCL) was constituted in February 2005
Source: State Finance Accounts (various years).
From this analysis, one cannot construct a straight forward case for setting up
a beverages corporation. However, in the context of Himachal Pradesh, it does
suggest that the administration of excise duty needs to be improved – this can be
undertaken either by reducing the workload on the existing set of officials by hiving
off some of the functions to a separate agency – in this case by setting up a beverages
corporation which could reduce the need for close monitoring of wholesale trade in
the state. Alternatively, it could be done by augmenting the staff in the excise and
taxation department alongside streamlining the administrative procedures. These
issues are discussed in more detail in Chapter 7.

59
Appendix 4.1
Process of Excise Allotment in Himachal Pradesh
Notice for Inviting Applications for the Allotment of Retail Sales of Liquor
Licenses on Fixed Fee basis (under Himachal Pradesh Excise Act, 2011 and
the Rules framed thereunder) for
- L.2: retail vend of foreign liquor to the public only
- Wholesale vend to licenses in the form of hotels/dak-banglow/
restaurant and a bar attached to a restaurant (L.3, L.4, L.5 – foreign
liquor; L.3A, L.4A, L.5A – beer), bar attached to a theatre/cinema/
club/other place of entertainment (L.12A, L.12B and L.12C).
- L.14: retail vend of country spirit for consumption on and off the
premises; also allowed to sell foreign liquor only in rural areas
- L.14-A: retail vend of country spirit for consumption off the premises;
also allowed to sell foreign liquor only in rural areas
- L.20-B: manufacturing and retail vend of country fermented liquor.
Methods (as per the decision of the Excise and Taxation Commissioner-cum-
Financial Commissioner (Excise), Himachal Pradesh)
Process of Excise Settlement
- Allotment
- Auction
- Private contract
- Calling tenders
- By negotiations
- By draw of lots
- By renewal
- By any other arrangement (including combination of the foregoing
modes)
Unit for Settlement
- Individual vends
- predetermined combination of vends (known as unit)
Process for Settlement
- Public Notifications cum Invitation for Application
- Access to Application Form - free of cost (online as well as offline
from offices of AETC/ ETO/ DETC)
- The following details are displayed at the office of respective AETC/
ETO
- location of each retail sale outlet (vend/unit) for Country Liquor, IMFL
& Country Fermented Liquor
- renewal fee
- the basic license fee
- annual license fee
- minimum quranteed quota

60
Basic eligibility of the applicant
- an individual; or
- a body incorporated under the Indian Companies Act; or
- a society registered under the Himachal Pradesh Co-operative Societies
Act; or
- a partnership firm; or
- a Hindu undivided family.
Not allowed to file more than one application for the same vend/unit
An individual should not be a partner in more than four applicant partnership
firms
Application fee (for 2013-14) is Rs. 15,000 per application (non-refundable,
non-adjustable)
Earnest money (along with application) - 10 percent of the basic license fee
fixed for the vend/ unit (adjusted against basic license fee for successful
applicant, for others it is refunded)
If more than one application received against a vend/unit - draw of lots is the
process of selection of successful applicant
Successful allottee shall be required to deposit 50 percent of the basic license
fee in cash or through Demand Draft on the day of allotment (the remaining 50
percent is payable within 7 days from the date of allotment or before 31st
March whichever is earlier)
Successful allottee shall be required to deposit 5 percent of the annual license
fee (determined on the basis of annual MGQ) in cash or through Demand
Draft on the day of allotment. . The amount is adjusted against the licensee fee
for the month of April of the forthcoming FY
Successful allottee has to deposit 10 percent of the annual license fee within
seven days of allotment or 31st March whichever is earlier in cash or FDR or
Bank Guarantee as security deposit. The security deposit is released after
closing of the financial year and after final settlement of all Government dues
A list of successful as well rejected or not confirmed applicants is displayed
against each of the vend/unit at the office of AETC/ETO incharge of the
district
Renewal of License - Allottee of a vend/unit gets the offer for continuation of
license for the next year on the levies fixed by the Government for such year.

61
CHAPER 5
Transport Taxes
5.1 Introduction
The term “transport taxes” includes two broad categories of taxes – motor vehicle
taxes and passenger and goods taxes. These are taxes imposed and collected by the state
government. The former is a tax on the ownership of both personal and transport vehicles
while the latter is a tax on the services provided – transportation of passengers and goods.
The contribution of these taxes taken together in total own tax revenue of the state has
been declining, from about 19.4 percent in period 1 to less than 12 percent in period 2.
Even as a percentage of GSDP, the decline is evident (see discussion in Chapter 2). The
comparison with other states in Chapter 2 suggests that the revenue contribution from
transport taxes in Himachal Pradesh is marginally higher than in most of the other states
considered, Haryana being the only exception. Coincidentally these are also the only two
states where there is evidence of a systematic decline in the revenue performance of
transport taxes as a percentage of GSDP. While inter-state comparison does not suggest
much scope for improvement, considering the state‟s own past performance as a
benchmark, in the absence of any rational explanation for the decline, it can certainly be
concluded that there will be room for improvement over the state‟s recent performance.
This chapter sets out to identify any factors that could be contributing to the deterioration
in the past decade to see if any rational policy prescription could be derived therefrom.
Section 5.1 provides a brief overview of the structure of the taxes and a comparison of
the tax rates in different states and establishes that Himachal Pradesh has one of the
highest tax rates in the neighborhood. Section 5.1 focuses on a discussion of the trends of
revenue collection and attempts to identify the factors that could be contributing to these
trends. Section 5.3 summarizes the policy conclusions from the analysis.
62
5.2 Structure of Taxes
The motor vehicles tax, as mentioned above, is a tax on the ownership of vehicles.
In most states, the tax is a one-time levy on the purchase of a vehicle for personal use. In
order to discourage the use of old vehicles, as a green tax measure, some of the states
have made it mandatory for all vehicles/cars with age above 15 years to be re-registered,
every five years thereafter. The motor vehicle tax for transport vehicles is an annual levy,
payable quarterly, based on the carrying capacity. The passenger and goods tax on the
other hand is a tax on the service provided of transporting goods or services as the name
suggests. While it was historically related to the fees charged by the service provider, for
ease of administration and compliance, it has increasingly been transformed into a levy
on capacities.
In addition to the above, states often impose a tax called the special road tax. In
Punjab, this levy was introduced as a replacement for passenger and goods tax. In the
case of stage carriages, the rate is prescribed per seat, per km per day. For all other forms
of transport, it is defined as a lump sum tax. Himachal Pradesh too has a similar levy on
stage carriages, though it does not replace passenger and goods tax. The structure of taxes
collected by the comparable states is presented in Table 5.1 below.
As would be evident from Tables 5.1 and 5.2, the taxes in Himachal Pradesh are
at least as high as those in all the other states. This is true for almost all categories of
transport considered.

63
Table 5.1: Motor Vehicle Taxes on Passenger Transport
Source: Compiled by the Authors based on State-wise Tax Documents.
Table 5.2: Motor Vehicle Taxes for Non-Transport and Transport Goods Vehicles Haryana Himachal Pradesh Punjab Uttarakhand Uttar Pradesh
Non-transport
Two
wheelers 150-500
Upto 50 cc – 3% of
the value of the
vehicle
Above 50 cc – 4%
of the value of the
vehicle
Upto 15000/- – 3%
of the value of the
vehicle
Above 15000/- - 4%
of the value of the
vehicle
Upto 80 cc –
800/-
Above 80 cc –
1500/-
Less than 50 cc – Rs.
1000/-
50 cc and above – Rs.
1600/-
Cars
Original cost
price upto 4
lakhs – 2000/-
Above 4 lakh
and upto 10
lakhs – 1% of
the value of the
car
Above 10 lakh –
1.5% of the
value of the car
Upto 1000 cc –
2.5% of the value of
the car
Above 1000 cc – 3%
of the value of the
vehicle
2% of the value of
the vehicle
2-5% of the cost
of the vehicle
Petrol driven vehicle
– 2.5% of the cost of
the vehicle
Diesel driven vehicle
– 5% of the cost of
the vehicle
State Stage carriage Contract carriage
Haryana
Rs. 550/- per seat per annum (subject to
maximum)
Rs. 18,000/- per annum (for half body bus)
Rs. 30,000/- per annum (for full body bus)
Rs. 100/- – Rs. 200/- per seat per annum
Rs. 18,000/- per annum (for half body
bus)
Rs. 30,000/- per annum (for full body
bus)
Himachal
Pradesh
Ordinary/express/semi deluxe/deluxe/air-
conditioned/mini buses:
Rs. 500/- – Rs. 550/- per seat per annum
(subject to maximum)
Rs. 200/- – Rs. 1000/- per seat per annum
(subject to maximum)
Punjab
Big Buses:
Rs. 0.50 – Rs. 2.25 per km per vehicle per
day.
Stage carriage buses coming from other
states:
Rs. 3.70 – Rs. 5.00 per km. per vehicle per
day.
Tourist Buses:
Rs. 4,000/- – Rs. 6,000/- per seat per
annum
All India Tourist Permits or another
similar permits registered in other states
entering the state of Punjab (on 24 hours
basis):
Rs. 2,000/- – Rs. 4,000/- per day per
vehicle
Uttarakhand
Buses: Upto 20 seats Rs. 350/- per quarter
plus Rs. 30 per seat per quarter
Upto 35 seats Rs. 590/- per quarter plus
Rs. 35/- per seat per quarter
Rs. 160/- per seat per month
Uttar
Pradesh
Buses: Rs. 40/- per seat per quarter
(average motor vehicle taxes) + Rs. 350/-
per seat per quarter (average passenger
taxes)

64
Haryana Himachal Pradesh Punjab Uttarakhand Uttar Pradesh
Non-transport
Maxi Cab 200 per seat per
annum
Rs. 750/- per seat
per annum
Rs. 750/- per seat
per annum
Rs. 230/- per
quarter upto 6
seats
Rs. 350/- per
quarter upto 12
seats plus
passenger tax of
Rs. 85/- per
month per seat
upto 7 seats
Rs. 125/- per
month per seat
upto 12 seats
passenger tax
Seating capacity of
6+1 - quarterly motor
vehicle tax of Rs.
230/- plus passenger
tax of Rs. 2000/-
Seating capacity of
10+1 - quarterly
motor vehicle tax of
Rs. 350/- plus
passenger tax of Rs.
10,000/-
Motor
Cab
100 per seat per
annum
350 per seat per
annum
750 per seat per
annum
Auto-
rickshaws
200 per seat per
annum
Upto 6 seats
excluding driver –
400/- per seat per
annum
Passenger: Rs.
95/- per quarter
upto 3 seats
Rs. 185/- per
quarter upto 6
seats plus Rs. 30/-
per quarter per
seat passenger tax
Goods: Rs. 70/-
per quarter per
metric tonne for
one region
Rs. 85/- per
quarter per metric
tonne above one
region plus goods
tax of Rs. 210/-
per quarter per
metric tonne and
Rs. 85/- per
quarter per metric
tonne for plane
routes of
Uttarakhand
Seating capacity of
3+1 - quarterly motor
vehicle tax of Rs. 95/-
plus passenger tax of
Rs. 300/-
Seating capacity of
6+1 - quarterly motor
vehicle tax of Rs.
185/- plus passenger
tax of Rs. 600/-
Transport
Trucks 300-4500 per
annum
1500-2500 per
annum
3000-15000 per
annum Rs. 70/- per metric
tonne per quarter
for one region
Rs. 85/- per metric
tonne per quarter
above one region
quarterly plus
goods tax of Rs.
210/- per metric
tonne per quarter
and Rs. 85/- per
metric tonne for
plain routes of
Uttarakhand
Motor vehicle taxes
of Rs. 70/- per quarter
per metric tonne for
GVW of the vehicle
or part thereof – (for
one region) + goods
tax of Rs. 100/- per
quarter
Motor vehicle taxes
of Rs. 85/- per quarter
per metric tonne of
GVW of the vehicle
or part thereof (for
more than one region
in Uttar Pradesh and
Trailers NA NA NA

65
Haryana Himachal Pradesh Punjab Uttarakhand Uttar Pradesh
Non-transport
National permit
vehicles) + goods tax
of Rs. 130/- per
quarter
Tractors NA NA
Permit holders of
tractors with
trolleys used for
commercial purpose
within the radius of
25 km from the
place of permit
holders residence
Rs. 2000 per annum
45 per quarter
Two important conclusions could be drawn from the above:
1. In terms of the structure of taxation, the state has been quite aggressive in adopting
the rates and structure of taxes implemented in neighbouring states.
2. Any attempt to improve the revenue performance of the state cannot come from
increases in the rates of tax.
What then are the factors that contributed to the decline in the performance of the
state over time?
5.3 Trends in Revenue
As discussed in Chapter 2, the contribution of transport taxes in total revenue has
declined over the years. Even when viewed as a percentage of GSDP, it is clear that the
revenue collection under this head tends to fluctuate a lot over the years. Table 5.3 below
presents a comparison of the rates of growth of motor vehicles taxes over the years. What
this table shows is that the rate of growth of motor vehicle taxes in Himachal Pradesh is
considerably more erratic when compared to that of the other states. The coefficient of
variation (CV) for Himachal Pradesh is way too high compared to all the other states.
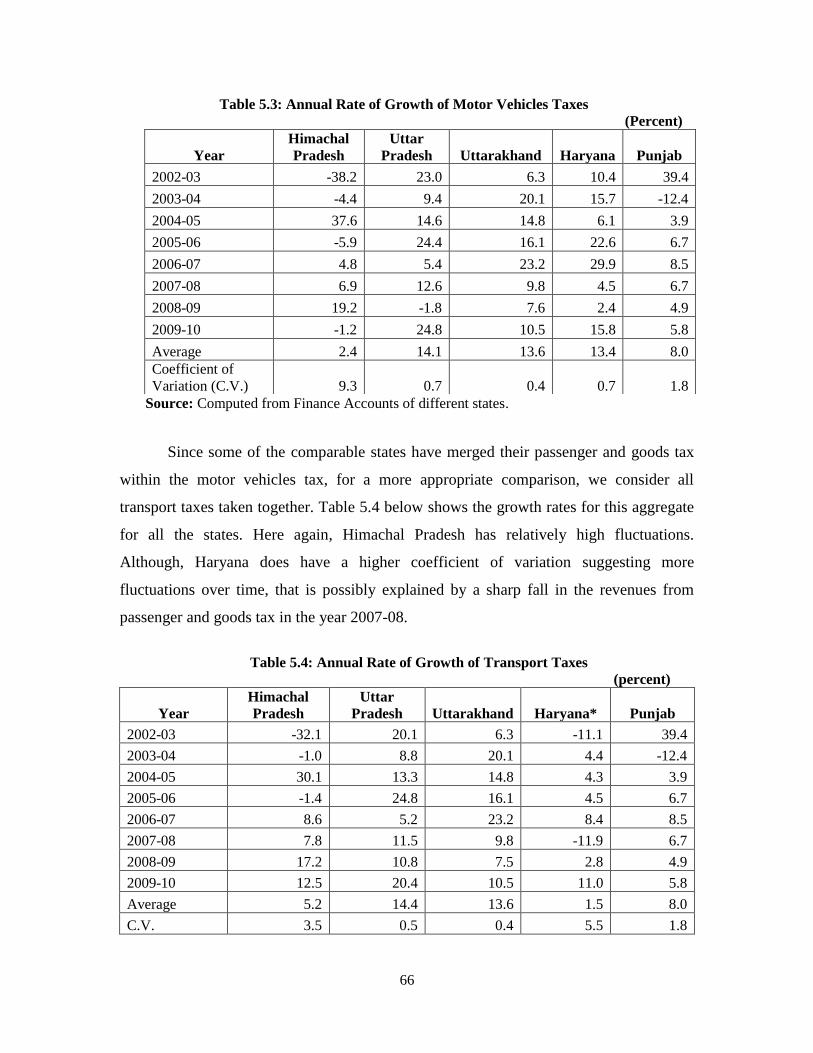
66
Table 5.3: Annual Rate of Growth of Motor Vehicles Taxes
(Percent)
Source: Computed from Finance Accounts of different states.
Since some of the comparable states have merged their passenger and goods tax
within the motor vehicles tax, for a more appropriate comparison, we consider all
transport taxes taken together. Table 5.4 below shows the growth rates for this aggregate
for all the states. Here again, Himachal Pradesh has relatively high fluctuations.
Although, Haryana does have a higher coefficient of variation suggesting more
fluctuations over time, that is possibly explained by a sharp fall in the revenues from
passenger and goods tax in the year 2007-08.
Table 5.4: Annual Rate of Growth of Transport Taxes
(percent)
Year
Himachal
Pradesh
Uttar
Pradesh Uttarakhand Haryana* Punjab
2002-03 -32.1 20.1 6.3 -11.1 39.4
2003-04 -1.0 8.8 20.1 4.4 -12.4
2004-05 30.1 13.3 14.8 4.3 3.9
2005-06 -1.4 24.8 16.1 4.5 6.7
2006-07 8.6 5.2 23.2 8.4 8.5
2007-08 7.8 11.5 9.8 -11.9 6.7
2008-09 17.2 10.8 7.5 2.8 4.9
2009-10 12.5 20.4 10.5 11.0 5.8
Average 5.2 14.4 13.6 1.5 8.0
C.V. 3.5 0.5 0.4 5.5 1.8
Year
Himachal
Pradesh
Uttar
Pradesh Uttarakhand Haryana Punjab
2002-03 -38.2 23.0 6.3 10.4 39.4
2003-04 -4.4 9.4 20.1 15.7 -12.4
2004-05 37.6 14.6 14.8 6.1 3.9
2005-06 -5.9 24.4 16.1 22.6 6.7
2006-07 4.8 5.4 23.2 29.9 8.5
2007-08 6.9 12.6 9.8 4.5 6.7
2008-09 19.2 -1.8 7.6 2.4 4.9
2009-10 -1.2 24.8 10.5 15.8 5.8
Average 2.4 14.1 13.6 13.4 8.0
Coefficient of
Variation (C.V.) 9.3 0.7 0.4 0.7 1.8

67
Note: *- implies that for Haryana Transport Taxes includes „Tax on entry of goods into local
areas‟, however for our analysis we have taken Transport Taxes net of Tax on entry of goods into
local areas.
Source: Computed from Finance Accounts of different states.
In order to understand the factors contributing to the fluctuations in revenue, the
first category to be examined is number of vehicles registered in the state. Table 5.5
shows that the number of vehicles registered in the different states over the years too
fluctuate. The fluctuations in Himachal Pradesh once again are higher than those for the
other states considered. Within a span of 3 years, the figures increase from about eight
thousand to over one lakh twenty thousand. Such dramatic changes are not in evidence
for the other states. It would be interesting to know whether these fluctuations in the
number of vehicles registered accounts for the changes in the revenue performance.
Table 5.5: Annual Additions to Registered Motor Vehicles
Year
Himachal
Pradesh
Uttar
Pradesh Uttarakhand Haryana Punjab
2001-02 27,378 249,861 41,452
172,783 192,771
2002-03 24,403 757,453 51,563
156,853 204,457
2003-04 20,121 531,803 58,528
269,421 221,496
2004-05 11,966 884,288 57,327
305,757 347,006
2005-06 32,749 644,648 70,076
233,359 159,054
2006-07 8,219 1,096,565
441,271 258,696
2007-08 29,148 740,432 87,650
444,987 278,723
2008-09 123,503 952,681 56,501
451,937 258,952
2009-10 43,943 1,209,537 44,019
366,604 442,723
Average 35,714 785,252 58,390
315,886 262,653
Source: Indiastat.com and Road Transport Statistics, MORTH, various issues.
Table 5.6 provides data on the revenue collected per vehicle in different states.
Since the structure of motor vehicle tax in most states is one where transport vehicles are
required to pay an annual charge while there is a one-time levy for non-transport
vehicles, the exercise uses the total number of transport vehicles registered in the state
along with annual registration of non-transport vehicles to derive the tax collected per

68
vehicle. As the table shows, the tax per vehicle does not stay stable over the years – this
is true for all the states. While Haryana and Punjab record a decline in the tax per vehicle,
the other three states show fluctuation. Since the rates of tax in none of the states have
been reduced, the only plausible conclusions could be that the composition of vehicles
has changed over the years causing the fluctuations. An increase in the rate would mean
an increase in the share of vehicles with higher taxes and vice versa. If the above were
not borne out by data, it would raise some serious doubts on the quality of data being
maintained by the departments concerned.
Table 5.6: Transport Taxes per Vehicle
(Rs)
Year
Himachal
Pradesh
Uttar
Pradesh Uttarakhand Haryana Punjab
2001-02 48,470 20,133 16,261 5,997 16,519
2002-03 33,594 8,170 13,901 7,293 21,710
2003-04 38,951 12,730 14,715 4,914 17,553
2004-05 90,108 8,774 17,253 4,592 11,640
2005-06 30,995 14,973 16,389 7,376 27,110
2006-07 129,390 9,280 N.A. 5,069 18,093
2007-08 39,014 15,475 17,714 5,254 17,919
2008-09 10,974 11,805 29,554 5,295 20,239
2009-10 30,487 11,604 41,927 7,558 12,530
Average 50,220 12,549 20,964 5,927 18,146
C.V. 0.73 0.31 0.47 0.20 0.26
Source: Computed.
The average tax collected on transport vehicles in any given year tends to be
higher than that on non-transport vehicles.1 Table 5.7 presents the composition of the
vehicles registered in the states, i.e., the share of transport vehicles in total number of
registered vehicles. It is seen that the share of transport vehicles in Himachal Pradesh is
higher than that for the other states, while the revenue per vehicle is not significantly
higher. Further, this share in Himachal Pradesh is fluctuating more than in other states.
Curiously, the year for which the share of transport vehicles is the lowest also happens to
be the year which records the highest tax collected per vehicle. It appears therefore, that
1 For example, in Himachal Pradesh, passenger and goods tax along with special road tax and composite
fee account for about 65 percent of the total transport taxes collected by the state in 2008-09. Given that
part of token taxes too is paid by the transport vehicles, the share of taxes paid by transport vehicles would
be even higher.

69
trends in registration of transport vehicles do not explain the fluctuations in revenue per
vehicle.
Table 5.7: Percentage Share of Transport Vehicles in
Total Number of Registered Vehicles
Year
Himachal
Pradesh
Uttar
Pradesh Uttarakhand Haryana Punjab
2001 24.10 5.26 8.11 9.20 5.22
2002 22.85 4.84 7.93 9.38 5.15
2003 22.42 4.60 7.86 10.07 5.10
2004 23.06 4.44 7.80 10.53 5.04
2005 24.07 4.06 7.80 10.73 4.85
2006 22.98 4.14 7.83 10.78 5.01
2007 20.22 3.76 7.12 10.70 5.16
2008 20.63 3.74 7.56 10.47 5.21
2009 23.29 3.77 7.83 10.05 5.23
2010 22.84 3.83 8.69 10.12 5.13
Source: Computed from Road Transport Yearbook, various issues.
Moving to a dis-aggregation of the non-transport vehicles, since the taxes on two-
wheelers is significantly smaller than that for other vehicles, Table 5.8 captures the share
of two-wheelers in non-transport vehicles registered in the respective years. The trends
here too suggest that there are a lot of fluctuations in the share of two-wheelers for
Himachal Pradesh. A similar trend is evident in the case of Uttarakhand. However, the
year for which Himachal Pradesh records the lowest share of two-wheelers is not the year
in which the tax per vehicle is highest. In other words, the trends in share of two-wheelers
too do not explain the change observed in the revenue per vehicle.
Table 5.8: Share of Two-Wheelers in Total Registered Vehicles
Source: Computed from Road Transport Yearbook, various issues.
Year
Himachal
Pradesh
Uttar
Pradesh Uttarakhand Haryana Punjab
2001 52.79 72.82 75.01 58.34 72.28
2002 53.16 74.16 75.44 57.99 72.69
2003 55.56 75.71 75.81 59.56 73.01
2004 52.73 76.19 75.83 59.91 73.31
2005 55.82 76.96 75.70 60.60 74.23
2006 56.33 76.15 75.65 60.94 73.73
2007 55.06 78.57 73.80 61.58 73.91
2008 53.97 78.74 72.99 62.01 74.03
2009 50.57 79.06 72.44 62.56 74.13
2010 52.58 79.19 70.24 62.09 75.01

70
The above suggests that the data on revenue and the data on vehicles registered do
not tell a comprehensive and cohesive story. It could be the result of significant cross-
registration – people living in Himachal Pradesh chose to buy their vehicles in other
states and register the vehicle in that jurisdiction. This is a possibility since the
registrations in Uttar Pradesh in that year were disproportionately large. However, even
this explanation has two problems – one, for vehicles to be used in the state, it is
mandatory by law for the vehicles to be registered in the state. Cross-registration should
imply that there are a large number of vehicles from outside the state and consequently
closer vigilance is called for to prevent this from occurring. The second explanation could
be that the data being generated by the state is not reliable. Unless vehicles which had
registered in a state in some earlier year chose to leave the state and get registered
elsewhere, there is no way to explain a decrease in the total number of transport vehicles
registered in Himachal Pradesh in 2006-07.2 Efforts by the study team to get information
on the various aspects of transport taxes did not yield results, possibly since the
departments themselves do not have reliable data (see Annexure for details of data
requested and data received).
5.4 Policy Recommendations
The above suggests the need for reforms on two fronts:
1. There is an urgent need for a drastic improvement in the database with which the
administering departments work.
2. Augmenting the capacities of the departments for administering these taxes.
Augmenting these capacities can involve technological solutions or re-
formulation of some processes so as to address concerns of cross-border
registrations. For instance, some states had imposed an entry tax on motor
vehicles that were registered outside the state and brought into the state for use.
Alternatively, scanning of vehicles through cameras at the check-posts could
allow the department to keep a check on the vehicles entering into the state.
2 The number of transport vehicles registered in Himachal Pradesh has declined from 76652 in 2006 to
69108 in 2007.

71
3. For vehicles requiring re-registration, can the department do a follow-up to
ensure that re-registration is done, or the vehicles do not operate within the
jurisdiction of the state (in case there is no green tax – they should introduce one).
In Himachal Pradesh the transport taxes are administered by two separate
departments – the transport department administers the motor vehicles tax and passenger
transport component of the passenger and goods tax, while the excise and taxation
department administers the goods component of the passenger and goods tax. It would be
worthwhile exploring once again whether there is any merit in having the administration
divided across two departments. By bringing all these levies within one department, it
would be possible to develop a more comprehensive database and track transactions and
tax payments more effectively. While a number of states in the country have these
functions aligned into one department, in Punjab, Haryana and Himachal Pradesh, these
functions are split between two departments. Punjab has opted out of levying and
collecting a passenger and goods tax and has merged this levy within the motor vehicles
tax as a special road tax.
One of the advantages of the present system as emerged from discussion with the
officials of the state was that it provided the excise and taxation department the right to
hold trucks which are used for transporting goods into or out of the state, which it is
argued helps maintain a closer control on the transporters as well as the tax payers.
However, it should be recognized that the present arrangement is a part of the overall
system based on personal controls. As discussed in the other chapters, there is need to
move away to a more systems based tax administration. Here it may be mentioned that a
number of states do require transporters to be registered with the VAT department and to
file information documents with the department as well. This could address the genuine
concerns of the (E&T) department to get information on the goods being transported into
or out of the state. Further, the state continues to have check posts which collect details
regarding goods being brought into the state and the importer responsible for
transactions. Therefore, looking forward, for improving revenue collection from transport

72
taxes, it is important that the administering departments have reliable databases and more
efficient administration.
The overall rationale for motor vehicles taxes and the growing concerns for green
taxes do suggest the possibility of increasing the rates of tax.3 However, this would be a
worthwhile exercise only if the department can check cross-border registrations as
otherwise the additional revenue would only be marginal.
3 For a detailed discussion of the objectives for levying a motor vehicles tax and a model for computing the
same, refer to the Interim and Final Reports of Karnataka Tax Reforms Commission, submitted in 2003.

73
CHAPER 6
Other Taxes
This chapter is focused on identifying some additional sources of revenue for
the state, either in the form of existing taxes, where the actual revenue collected is less
than the potential or in the form of new levies that can supplement the total own tax
revenues of the state. There are three levies considered here: the first, luxury tax
collections on hotel rooms (section 6.1.), the second introduction of profession tax in
the state (section 6.2.) and third, introduction of a tax on using water resources in the
state (section 6.3.).
6.1 Potential for Luxury Tax Collection in Himachal Pradesh
With the eventual introduction of a Goods and Services Tax (GST), it is
expected that the present levy of luxury tax will be merged within the new levy. There
is still some uncertainty on the likely date for introduction of GST in the states.
Therefore, both for the present regime as well as for the proposed regime, it is
important to make efforts to improve the collection of luxury taxes in the state – any
additional revenue would be useful to the state at present and improvements in
administration and collection would make it easier to implement the tax in the new
regime.
Luxury tax is applicable on luxuries provided in hotels and lodging houses,
where “luxury provided in a hotel and lodging houses” implies accommodation for
residence, rate of charges for which (including charges for air-conditioning,
telephone, television, radio, music, sports, extra beds and other amenities provided in
a hotel) is Rs. 50 per person per day or more.
The collection of luxury tax in Himachal Pradesh has gone up from Rs. 12.22
crore in 2004-05 to Rs. 26.05 crore in 2009-10 (Table 6.1). Being a hilly state and
having substantial tourist footfall, the collection of luxury tax per tourist in the state

74
appears rather dismal at about Rs. 20 per capita. In what follows, two alternative
estimates of luxury tax potential are presented.
Table 6.1: Collection of Luxury Tax in Himachal Pradesh
(Rs. Crore)
105 - Luxury Tax (Rs. Crore) 2004-05 2005-06 2006-07 2007-08 2008-09 2009-10
01 - Tax Collection 12.22 13.70 16.21 24.25 21.11 26.05
02 - Receipt from cesses
under other Acts 0.03 0.03 0.00 0.00 0.00 0.00
03 - Penalty & Composition 0.01 0.05 0.02 0.03 0.02 0.05
Total 12.26 13.77 16.23 24.28 21.14 26.10
Indian Tourists Arrival in HP
(Nos.) 3,18,532 22,34,184 59,357 97,66,795 3,77,889 1,01,44,684
Foreign Tourists Arrival in
HP (Nos.) 3,41,226 29,32,973 69,806
1,17,35,36
1 4,11,032 1,21,46,393
Total Tourists Arrival in HP
(Nos.) 6,59,758 51,67,157 1,29,163
2,15,02,15
6 7,88,921 2,22,91,077
Luxury Tax Collection Per
Tourist (Rs.) 18.2 18.9 19.8 26.5 20.8 21.4
Source: Compiled from Budget Documents, Government of Himachal Pradesh, Shimla& Tourist
Arrivals Data assessed from
http://himachaltourism.gov.in/file.axd?file=2011%2f2%2fTourist+Arrival-2004+to+2010.xls (last
accessed on 15 September 2011).
Estimate 1: To estimate the potential for luxury tax collection for Himachal Pradesh,
we assume that average nights spent per tourist is 3 and average tariff for room is Rs.
500 per night. At the prevailing rates of luxury tax of 10 percent on the room tariff,
the estimated revenue under LT could be Rs. 182 crore. The present collection at Rs.
26 crore in 2009-10 is about one seventh the potential suggested above. Clearly, the
tariff in the state would be substantially higher than the Rs. 500 per night assumed in
this exercise, implying thereby that the total revenue could be even higher.
Table 6.2: Revenue Potential Based on Tourist Arrivals (2009-10)
Month
Total Tourists Arrival Nights Spent*
Potential for
LT Collection
(Rs. Crore)** Indian Foreign Total
Apr. 15,29,086 35,961 15,65,047 46,95,141 23.5
May 12,62,620 32,418 12,95,038 38,85,114 19.4
June 14,91,645 42,359 15,34,004 46,02,012 23.0
July 8,22,230 54,987 8,77,217 26,31,651 13.2
Aug. 7,40,982 52,268 7,93,250 23,79,750 11.9
Sept. 8,74,810 54,658 9,29,468 27,88,404 13.9
Oct. 9,85,066 35,143 10,20,209 30,60,627 15.3
Nov. 5,87,468 20,768 6,08,236 18,24,708 9.1
Dec. 5,08,481 12,664 5,21,145 15,63,435 7.8
Jan. 6,95,702 18,157 7,13,859 21,41,577 10.7
Feb. 10,35,789 18,092 10,53,881 31,61,643 15.8
Mar. 12,01,482 33,557 12,35,039 37,05,117 18.5
Total 1,17,35,361 4,11,032 1,21,46,393 3,64,39,179 182.2
Notes: *- we assume that average nights spent by each tourist is 3 and average tariff for room rent
paise per tourist per night is Rs. 500.

75
**- Luxury Tax collection @ 10% of the room rent
Source: Hotels and Bed Capacity
(http://himachaltourism.gov.in/file.axd?file=2011%2f3%2fNo+of+Hotels+etc.xls), Department of
Tourism and Civil Aviation, Govt. of Himachal Pradesh.
Estimate 2: Assuming an average occupancy of 50 percent and average tariff for
rooms varying between Rs. 1,000 for Dormitory (DOR) and Rs. 7,500 for Suit (FS),
Table 6.3 indicates that approximately Rs. 169 crore could be garnered from luxury
tax. Even if the level of occupancy is reduced to 30 percent, the revenue should
exceed Rs. 100 crore. Alternatively, the present revenue corresponds to an occupancy
rate of less than 10 percent for the rooms registered with the Department of Tourism
of Government of Himachal Pradesh (Table 6.3).
In other words, the revenue collection from luxury tax is substantially lower
than the potential as suggested by the available information on the number of tourists
coming into the state as well as number of rooms available in hotels and guesthouses
in the state. Some additional effort therefore has the potential to generate sizeable
revenues from this levy. During the course of the field trip to Kangra, it was reported,
that the Luxury Tax collection of Kangra has gone up from Rs. 1.89 crore in 2006-07
to Rs. 3.77 crore in 2010-11 through the increase in registration of hotels. However,
given the number of rooms available in the district, even with 20 percent occupancy,
this district alone should have revenue of about Rs. 10 crore from this source, whereas
the collection was only Rs. 3.77 crore. This therefore leads to the conclusion that with
some additional emphasis on enforcement, the collection from luxury tax for the
entire state could be substantially enhanced.
It is expected that with improved collection of tourist statistics under the Asian
Development Bank funded Infrastructure Development Investment Program for
Tourism – Himachal Pradesh (IDIPT-HP) Project, collection of luxury tax would be
easier for the Excise and Taxation Department. A better coordination between
Himachal Pradesh Tourism Development Board and Excise and Taxation Department
is required to reap the benefits of tourist statistics.

76
Table 6.3: Revenue Potential Based on Room Availability (2009-10)
District
No. of
hotels/
guest
houses
No of rooms
Total
Average
Occu-
pancy
Average tariff (Rs./Night)
Est. luxury
tax
collection
(Rs. crore/
year)
2000 3500 1000 7500 5000
SBR DBR DOR FS TBR SBR DBR DOR FS TBR
Bilaspur 60 27 436 30 59 11 639 50% 2700 76300 1500 22125 2750 3.8
Chamba 150 57 1170 41 68 0 1336 50% 5700 204750 2050 25500 0 8.6
Hamirpur 30 62 179 1 6 2 250 50% 6200 31325 50 2250 500 1.5
Kangra 357 286 3725 57 131 2 4201 50% 28600 651875 2850 49125 500 26.4
Kinnaur 71 93 287 12 9 0 401 50% 9300 50225 600 3375 0 2.3
Kullu 580 258 7606 18 764 0 8646 50% 25800 1331050 900 286500 0 59.2
Lahaul &
Spiti 84 112 497 14 40 0 663 50% 11200 86975 700 15000 0 4.1
Mandi 142 120 1113 28 45 17 1323 50% 12000 194775 1400 16875 4250 8.3
Shimla 388 303 3615 99 220 211 4448 50% 30300 632625 4950 82500 52750 28.9
Sirmour 59 57 870 17 25 18 987 50% 5700 152250 850 9375 4500 6.2
Solan 185 77 2411 17 112 45 2662 50% 7700 421925 850 42000 11250 17.4
Una 44 19 335 3 21 5 383 50% 1900 58625 150 7875 1250 2.5
TOTAL 2150 1471 22244 337 1500 311 25863
1,47,100
38,92,700
16,850
5,62,500
77,750 169.1
Source: Tourist Statistics (http://himachaltourism.gov.in/file.axd?file=2011%2f2%2fTourist+Arrival-2004+to+2010.xls), Department of Tourism and Civil Aviation, Govt.
of Himachal Pradesh.
77
6.2 Potential for Profession Tax
Unlike most other states in India, Himachal Pradesh currently does not have
any profession tax. The rationale for a tax on Professions, Trade, Callings and
Employment is to incorporate an element of tax on incomes into the options available
to the states. While the limits for the tax are specified in the Constitution of India,
with an expansion in economic activity and hence an increase in the number of people
reporting incomes above the prescribed threshold,1 the collection of tax under this
head increases. It may be pointed out that 24 states in India levy this tax and use it to
augment either state or local body revenues. The present ceiling for profession tax is
Rs. 2,500 per capita per year, with proposals pending to raise it to Rs. 7,500 per capita
per year. The amount paid as profession tax is deductible as expenses in computing
taxable income for income tax purposes. Therefore the entire cost of the levy is not
borne by the tax payers on whom the levy applies.
Considering the ceiling of Rs. 2,500 per capita at the present, since most salary
earners including government employees, teachers in educational institutions, most of
the employees of Public Sector Enterprises as well as those of private businesses
would be earning incomes which would exceed any reasonable threshold that may be
prescribed, all of these individuals would be liable to pay this tax. In Himachal
Pradesh, employment in Central Public Sector Enterprises in 2008-09 alone is 8,258
(Government of India 2010).2 Table 6.4 shows that regular employment in the State
Government‟s rolls is 1.89 lakh as on March 31, 2009 (Government of Himachal
Pradesh 2010).3 Among the regular employees, 10,021 are gazetted (5.3 percent) and
1,79,044 (94.7 percent) are non-gazetted employees. Total employment (regular) in
state PSUs is 42,097. Another 1,10,242 employees are engaged in industries in the
private sector (Government of India 2011).4 Doctors, engineers, chartered
accountants, teachers and professors in private educational institutions together could
be another 1 lakh. In other words, it is reasonable to assume that the total number of
1 The prescribed threshold of professional tax varies across the States and some States have provision
for different professional tax slabs for men, women and senior citizens. 2Government of India (2010), “Public Enterprises Survey: 2008-09 (Vol. I)”, Ministry of Heavy
Industries and Public Enterprises, Department of Public Enterprises, New Delhi. 3Government of Himachal Pradesh (2010), “Himachal Pradesh Government Employees Census 2009”,
Department of Economics and Statistics, Shimla. 4Government of India (2011), “Annual Survey of Industries: 2008-09 (Vol. I: Factory Sector)”,
Ministry of Statistics and Programme Implementation, Central Statistical Office, Kolkata.
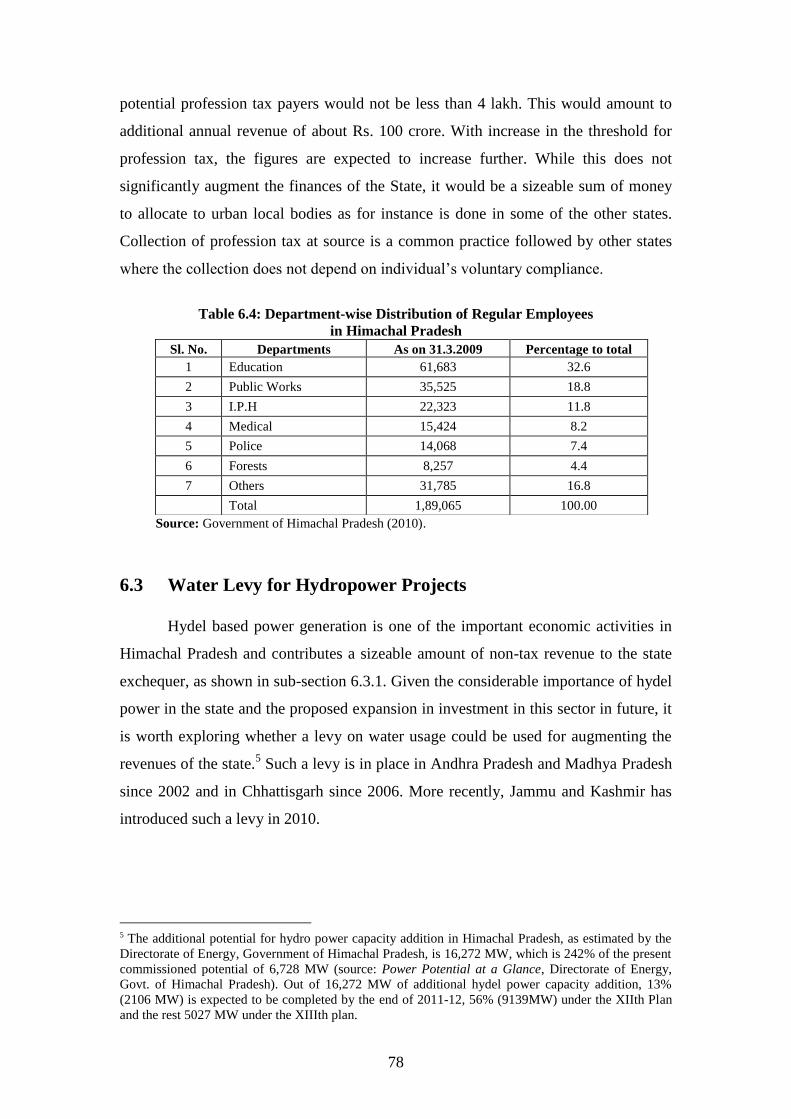
78
potential profession tax payers would not be less than 4 lakh. This would amount to
additional annual revenue of about Rs. 100 crore. With increase in the threshold for
profession tax, the figures are expected to increase further. While this does not
significantly augment the finances of the State, it would be a sizeable sum of money
to allocate to urban local bodies as for instance is done in some of the other states.
Collection of profession tax at source is a common practice followed by other states
where the collection does not depend on individual‟s voluntary compliance.
Table 6.4: Department-wise Distribution of Regular Employees
in Himachal Pradesh
Source: Government of Himachal Pradesh (2010).
6.3 Water Levy for Hydropower Projects
Hydel based power generation is one of the important economic activities in
Himachal Pradesh and contributes a sizeable amount of non-tax revenue to the state
exchequer, as shown in sub-section 6.3.1. Given the considerable importance of hydel
power in the state and the proposed expansion in investment in this sector in future, it
is worth exploring whether a levy on water usage could be used for augmenting the
revenues of the state.5 Such a levy is in place in Andhra Pradesh and Madhya Pradesh
since 2002 and in Chhattisgarh since 2006. More recently, Jammu and Kashmir has
introduced such a levy in 2010.
5 The additional potential for hydro power capacity addition in Himachal Pradesh, as estimated by the
Directorate of Energy, Government of Himachal Pradesh, is 16,272 MW, which is 242% of the present
commissioned potential of 6,728 MW (source: Power Potential at a Glance, Directorate of Energy,
Govt. of Himachal Pradesh). Out of 16,272 MW of additional hydel power capacity addition, 13%
(2106 MW) is expected to be completed by the end of 2011-12, 56% (9139MW) under the XIIth Plan
and the rest 5027 MW under the XIIIth plan.
Sl. No. Departments As on 31.3.2009 Percentage to total
1 Education 61,683 32.6
2 Public Works 35,525 18.8
3 I.P.H 22,323 11.8
4 Medical 15,424 8.2
5 Police 14,068 7.4
6 Forests 8,257 4.4
7 Others 31,785 16.8
Total 1,89,065 100.00

79
6.3.1 Revenue Collection from Imposition of Water Charges for
Hydropower Projects: Experiences of a few Indian States
In some states in the country, the use of water for hydropower generation is
subject to a charge. The charge varies across the states and it has been revised upward
in several occasions. In this section, we provide a brief description of this levy in
some of the states that impose it and the extent to which this levy affects the revenues
of the hydropower generating companies for a few states where such levy is applied.
Chhattisgarh
Water charges in Chhattisgarh are linked to installed hydropower generation
capacity. Apart from an automatic component of revision of water charges in the
water rates for inflation, 15 percent annual hike in water rates is proposed in the
revised water charges (w.e.f. May 31, 2010).
Table 6.5: Water Rates in Chhattisgarh (with effective from 31.05.2010)
Type of use Industrial purpose/
Thermal Power Purpose
Hydal Power Purpose (Regain of
water after use)
A. Government Source:
1. From Dam/Reservoir: Rs. 6.00 per cum. 60 paise per Unit (KWH) generated and
200 paise per 100 Unit per year
escalation charges.
2. From canal System Rs. 7.00 per cum. 70 paise per Unit (KWH) generated and
250 paise per 100 Unit per year
escalation charges.
B. From Natural /Created
own sources
Rs. 2.00 per cum. 20 paise per unit (KWH) generated.
Note: Every year a 15% hike will be made in these rates.
Source: cgwrd.in/cgwrd/organisation/2011-12-23-09-54-25/2011-12-23-10-14-58/water-rates.html
Government of Chhattisgarh collected Rs. 8.18 crore and 9.46 crore in 2009-
10 and 2010-11 respectively from Chhattisgarh State Power Generation Company
Limited (CSPGCL) towards water charges for hydropower projects.

80
Table 6.6: Size of Water Charges in Comparison with Revenue Collection
Hydropower Projects in Chhattisgarh Chhattisgarh State Power Generation Company Limited
Description 2009-10 2010-11
Revenue from Sale of Power (Rs. Lakh)
Hydel 2462.13 3531.62
Thermal 175,679.65 180,269.83
Total 178,141.78 183,801.45
Generation of Power (in million unit)
Hydel 173.23 343.78
Thermal 13,884.47 12,639.11
Total 14,057.70 12,982.89
Water Charges Paid (Rs. Lakh)
Hydel 817.63 946.39
Thermal 1849.11 3952.54
Total 2666.74 4898.93405
Cost of Water for Hydel as Percentage of Revenue from Hydro
Power (%) 33.21 26.80
Cost of Water for Thermal as Percentage of Revenue from
Thermal Power (%) 1.05 2.19
Source: Chhattisgarh State Power Generation Company Limited and Provisional Balance Sheet as on
31st March, 2011 of CSPGCL (available at
http://www.cseb.gov.in/cspgcl/tariffpetition/Final%20APR%20to%20CSERC31.01.12/Finance.pdf)
Madhya Pradesh
As compared to Chhattisgarh, water rates for hydropower projects in Madhya
Pradesh are moderate and linked to installed capacity (except for category 1a, Table
6.7). For hydel power projects using water from Government source, there is an
annual escalation of water charge at the rate of Rs. 0.005 per KWH.
Table 6.7: Water Rates for Hydro Power Project in Madhya Pradesh Sl.
No. Specifications Unit
Water rates
(Rs.)
Date of
enforcement
1a From natural/ created own sources Per CUM 0.15 01.11.2009
1b For Hydel power projects after use
from Government source Per KWH 0.10* -do-
1c For Hydel power projects after use
from natural/ created own source Per KWH 0.02 -do-
Note: *-including 0.05 paisa (Rs. 0.005) per KWH exaltation charges.
Source: CWC (2010, Page No. 199).6
6 Central Water Commission, 2010. “Pricing of Water in Public System in India”, Information Systems
Organisation, Information Technology Directorate, Water Planning and Projects Wing, CWC, October
2010.
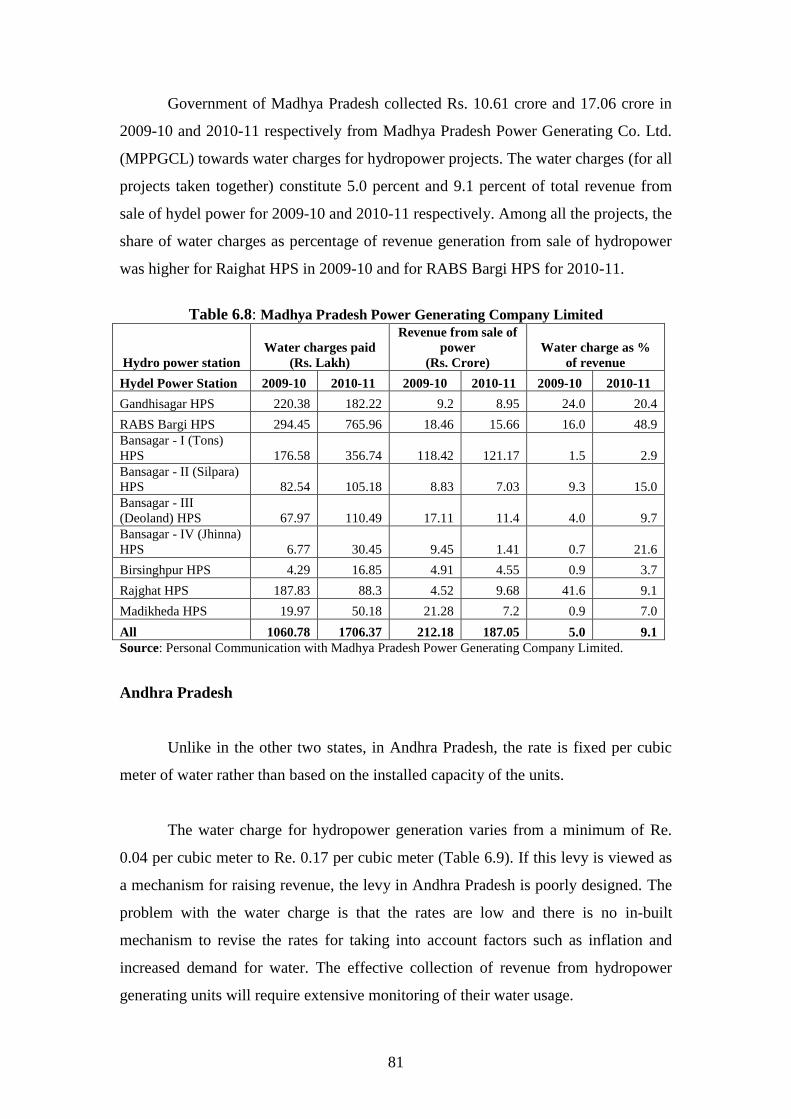
81
Government of Madhya Pradesh collected Rs. 10.61 crore and 17.06 crore in
2009-10 and 2010-11 respectively from Madhya Pradesh Power Generating Co. Ltd.
(MPPGCL) towards water charges for hydropower projects. The water charges (for all
projects taken together) constitute 5.0 percent and 9.1 percent of total revenue from
sale of hydel power for 2009-10 and 2010-11 respectively. Among all the projects, the
share of water charges as percentage of revenue generation from sale of hydropower
was higher for Raighat HPS in 2009-10 and for RABS Bargi HPS for 2010-11.
Table 6.8: Madhya Pradesh Power Generating Company Limited
Hydro power station
Water charges paid
(Rs. Lakh)
Revenue from sale of
power
(Rs. Crore)
Water charge as %
of revenue
Hydel Power Station 2009-10 2010-11 2009-10 2010-11 2009-10 2010-11
Gandhisagar HPS 220.38 182.22 9.2 8.95 24.0 20.4
RABS Bargi HPS 294.45 765.96 18.46 15.66 16.0 48.9
Bansagar - I (Tons)
HPS 176.58 356.74 118.42 121.17 1.5 2.9
Bansagar - II (Silpara)
HPS 82.54 105.18 8.83 7.03 9.3 15.0
Bansagar - III
(Deoland) HPS 67.97 110.49 17.11 11.4 4.0 9.7
Bansagar - IV (Jhinna)
HPS 6.77 30.45 9.45 1.41 0.7 21.6
Birsinghpur HPS 4.29 16.85 4.91 4.55 0.9 3.7
Rajghat HPS 187.83 88.3 4.52 9.68 41.6 9.1
Madikheda HPS 19.97 50.18 21.28 7.2 0.9 7.0
All 1060.78 1706.37 212.18 187.05 5.0 9.1
Source: Personal Communication with Madhya Pradesh Power Generating Company Limited.
Andhra Pradesh
Unlike in the other two states, in Andhra Pradesh, the rate is fixed per cubic
meter of water rather than based on the installed capacity of the units.
The water charge for hydropower generation varies from a minimum of Re.
0.04 per cubic meter to Re. 0.17 per cubic meter (Table 6.9). If this levy is viewed as
a mechanism for raising revenue, the levy in Andhra Pradesh is poorly designed. The
problem with the water charge is that the rates are low and there is no in-built
mechanism to revise the rates for taking into account factors such as inflation and
increased demand for water. The effective collection of revenue from hydropower
generating units will require extensive monitoring of their water usage.

82
Table 6.9: Water Rates for Hydro Power Generation in Andhra Pradesh
Sl.
No. Specifications
Water Rates
(Re. per ‘000
Gallons)*
Water Rates
(Re. per
cubic meter)
Date of
Enforcement
1 Non-consumptive uses for major hydro-
electric schemes 0.015 0.06 02.04.2002
2 Non-consumptive uses for mini hydel
schemes (unit capacity up to 500 KW) Exempted Exempted - do -
2a Non-consumptive use up to 5 years for
unit capacity above 500 KW and rated
head up to 5 m Exempted Exempted - do -
2b Non-consumptive use after 5 years for unit
capacity above 500 KW and rated head up
to 5 m 0.010 0.04 - do -
2c Non-consumptive use after 10 years for
unit capacity above 500 KW and rated
head up to 5 m 0.015 0.06 - do -
2d Non-consumptive use up to 5 years from
the date of commissioning for unit
capacity above 500 KW and rated head up
to 5 m 0.015 0.06 - do -
2e Non-consumptive use after 5 years from
the date of commissioning for unit
capacity above 500 KW and rated head up
to 5 m 0.030 0.11 - do -
3a Non-consumptive use after 10 years from
the date of commissioning for unit
capacity above 500 KW and rated head up
to 5 m 0.045 0.17 - do -
Note: 1 gallon =0.0038 cubic meter or 264.17 gallon = 1 cubic meter.
Source: CWC (2010, Page No. 170) 7
Government of Andhra Pradesh collected Rs. 20.45 crore and Rs. 25.31 crore
in 2009-10 and 2010-11 respectively from Andhra Pradesh Power Generation
Corporation Limited (APGENCO) towards water charges for hydropower projects.
The share of water charges in revenue from sale of hydropower was 1.85 percent and
1.36 percent in 2009-10 and 2010-11 respectively (Table 6.10).
7Central Water Commission (CWC) (2010), “Pricing of Water in Public System in India”, Information
Systems Organization, Information Technology Directorate, Water Planning and Projects Wing, CWC,
October 2010.

83
Table 6.10: Revenue Collection from Water Charges for Hydropower
Projects in Andhra Pradesh Andhra Pradesh Power Generation Corporation Limited
Description 2009-10 2010-11
Revenue from Sale of Power (Rs. Lakh)# 639,086.44 884,178.66
Generation of Power (in million unit)
Hydel 5,543.36 7,872.26
Thermal 26,566.74 29,448.35
Total 32,110.10 37,320.61
Percentage Share of Hydel in Total Power Generation (%) 17.26 21.09
Share of Revenue from Hydel Power (Rs. Lakh)* 110,329.34 186,505.11
Cost of Water - Hydel (Rs. Lakh) 2,044.83 2,530.61
Cost of Water - Thermal (Rs. Lakh) 2,323.52 4,254.11
Cost of Water for Hydel as Percentage of Revenue from
Hydro Power (%) 1.85 1.36
Cost of Water for Thermal as Percentage of Revenue from
Thermal Power (%) 0.44 0.61
Note: # - Revenue from Sale of Power in Andhra Pradesh and other States, net of „Revenue from
O&M and Supervision Contracts‟. .
* - (Percentage Share of Hydel in Total Power generation/100)*Revenue from Sale of Power (Rs.
Lakh)
Data Source: Annual Accounts for the year 2010-11. Andhra Pradesh Power Generation
Corporation Limited.
Jammu and Kashmir
The recent proposal for similar water charges in Jammu and Kashmir is
enacted through the J&K Water Resources (Regulation and Management) Act, 2010
and the J&K Water Resources (Regulation and Management) Rules, 2011. It includes
the proposal for setting up of the State Water Resources Regulatory Authority
(SWRRA), which will manage water resources of the state and raise revenue against
its usage. Though the law would bring every water user under its purview, the
recently proposed levy is only on water uses for hydropower projects. At present
2,456 MW of hydropower is generated in the state and it uses 33,930 million cubic
meter of water. This means that 13.82 million cubic meter of water is required for 1
MW of power generation. The proposed water levy at the rate Rs. 0.25 per cubic
meter of water is expected to generate Rs. 848.25 crore revenue to the Government of
Jammu & Kashmir.8,9
8 Economic Times Bureau (2010), “J&K to tax water used to generate hydel power”, The Economic
Times, 10 October 2010. Available at: http://economictimes.indiatimes.com/features/dateline-india/jk-
to-tax-water-used-to-generate-hydel-power/articleshow/6721461.cms (last accessed on 15 September
2011) 9 Kashmir Observer (2010), "J&K To Tax Water Used To Generate Power", 10 October 2010. Available
at: http://www.kashmirobserver.net/index.php?option=com_content& view=article&id= 5952:jk-to-tax-
water-used-to-generate-power&catid=15:top-news&Itemid=2(last accessed on 15 Sept. 11)
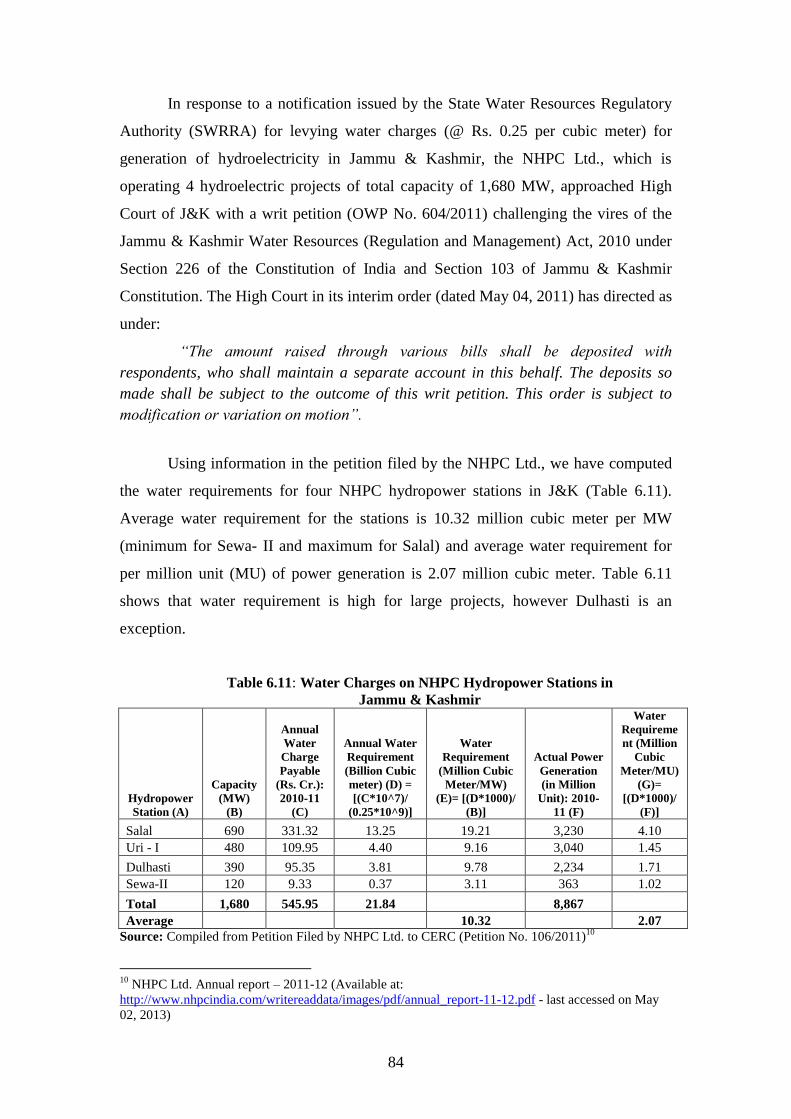
84
In response to a notification issued by the State Water Resources Regulatory
Authority (SWRRA) for levying water charges (@ Rs. 0.25 per cubic meter) for
generation of hydroelectricity in Jammu & Kashmir, the NHPC Ltd., which is
operating 4 hydroelectric projects of total capacity of 1,680 MW, approached High
Court of J&K with a writ petition (OWP No. 604/2011) challenging the vires of the
Jammu & Kashmir Water Resources (Regulation and Management) Act, 2010 under
Section 226 of the Constitution of India and Section 103 of Jammu & Kashmir
Constitution. The High Court in its interim order (dated May 04, 2011) has directed as
under:
“The amount raised through various bills shall be deposited with
respondents, who shall maintain a separate account in this behalf. The deposits so
made shall be subject to the outcome of this writ petition. This order is subject to
modification or variation on motion”.
Using information in the petition filed by the NHPC Ltd., we have computed
the water requirements for four NHPC hydropower stations in J&K (Table 6.11).
Average water requirement for the stations is 10.32 million cubic meter per MW
(minimum for Sewa- II and maximum for Salal) and average water requirement for
per million unit (MU) of power generation is 2.07 million cubic meter. Table 6.11
shows that water requirement is high for large projects, however Dulhasti is an
exception.
Table 6.11: Water Charges on NHPC Hydropower Stations in
Jammu & Kashmir
Hydropower
Station (A)
Capacity
(MW)
(B)
Annual
Water
Charge
Payable
(Rs. Cr.):
2010-11
(C)
Annual Water
Requirement
(Billion Cubic
meter) (D) =
[(C*10^7)/
(0.25*10^9)]
Water
Requirement
(Million Cubic
Meter/MW)
(E)= [(D*1000)/
(B)]
Actual Power
Generation
(in Million
Unit): 2010-
11 (F)
Water
Requireme
nt (Million
Cubic
Meter/MU)
(G)=
[(D*1000)/
(F)]
Salal 690 331.32 13.25 19.21 3,230 4.10
Uri - I 480 109.95 4.40 9.16 3,040 1.45
Dulhasti 390 95.35 3.81 9.78 2,234 1.71
Sewa-II 120 9.33 0.37 3.11 363 1.02
Total 1,680 545.95 21.84
8,867
Average
10.32
2.07
Source: Compiled from Petition Filed by NHPC Ltd. to CERC (Petition No. 106/2011)10
10
NHPC Ltd. Annual report – 2011-12 (Available at:
http://www.nhpcindia.com/writereaddata/images/pdf/annual_report-11-12.pdf - last accessed on May
02, 2013)

85
Table 6.12 shows that water charges payable for 4 hydropower stations
constitute 23.15 percent of revenue from sales of power.
Table 6.12: Revenue Collection from Water Charges for NHPC
Hydropower Projects in Jammu and Kashmir
Description 2010-11
A. Total Generation of Hydropower (in MU) 18,683
B. Revenue from Sales of Power (Rs. Crore) 4,969.76
C. Generation of Hydropower at Stations located in J&K (from Table 6.11) 8,867
D. Share of Hydropower Stations located in J&K in Total Hydropower Generation
(%) (C/A*100) 47.46
E. Revenue Share of Hydropower Stations located in J&K (Rs. Crore) [B*(D/100)] 2,358.66
F. Water Charges Payable to SWWRA (Rs. Crore) (from Table 6.11) 545.95
G. Water Charges as Percentage of Revenue (%) (F/E*100) 23.15
Source: Annual Report of NHPC Ltd. 2011-12 and Petition Filed by NHPC Ltd. to CERC (Petition
No. 106/2011).
A comparison of water charges across the states shows that the charge (as
percentage of revenue) is relatively high in Chhattisgarh and Jammu & Kashmir, and
moderate in Madhya Pradesh (Table 6.13). The water charge is relatively low in
Andhra Pradesh. Since, the water rates are not linked to actual production of
electricity (rather on capacity of electricity generation and physical parameters of the
reservoir/dam), the water charge is low for Andhra Pradesh. The water rates as
implemented in Andhra Pradesh is not a good example from revenue generation point
of view.
Table 6.13: Cost of Water for Hydropower Generation as Percentage of
Revenue from Hydro Power (%) – A Comparison across States States 2009-10 2010-11
Chhattisgarh 33.21 26.80
Jammu & Kashmir* N.A. 23.15
Madhya Pradesh 5.0 9.1
Andhra Pradesh 1.85 1.36
Note: *Implies the estimation is based data available for NHPC hydropower projects only.
Source: Compilation from above detailed tables.
Given the considerable importance of revenue from hydel power to Himachal
Pradesh, it is important that while the state should explore all possible opportunities
for expanding the sources of revenue, it should not be at rates that can endanger the
viability of the activity itself. It is therefore proposed that the state consider

86
introducing a levy of Rs. 0.10 per cubic meter of water used.11
In assessing the merits
of the levy, it is useful to explore two aspects – one, potential revenue from the
proposed levy and second, potential impact the levy could have on the viability of the
underlying economic activity, in this case, hydel power generation.
6.3.2 Present Revenue Collection and Future Revenue Potential from
Hydropower Projects
The collection of own non-tax revenue of the Government of Himachal
Pradesh has gone up from Rs. 35.01 crore in 2003-04 to Rs. 1,255.43 crore in 2008-
09. In 2008-09, the revenue from hydel power projects alone contributes 71.5 percent
of total own non-tax revenue collection and 34.3 percent of own revenue (tax and
non-tax) receipts of the government. The revenue from hydel power mostly comes
from two sources – a) free power as royalty (at present 12% of net power generation)
and b) share of power for the equity holding of the govt. While the figures for actual
receipts under both these heads were not available for past years, the Directorate of
Energy, Government of Himachal Pradesh, did share with the study team, the
projected figures for power to accrue to the state government in future years under the
two heads (see Table 6.6). To estimate the price per unit of power, we need both the
revenue and actual power received data. For 2010-11, we got the Revised Estimate
(RE) of revenue from hydel power, and then estimated the revenue from royalty and
equity component and took this average price received per 1 MU of power received
from hydel power projects as the benchmark. The estimated average revenue from 1
MU of power received as free power royalty is Rs. 0.31 crore and average revenue
from 1 MU of power received as equity component is Rs. 0.30 crore. We used the
same unit price to estimate the potential revenue received from hydel power projects.
However, this is a conservative estimate as we didn‟t take into consideration any
probable inflation and future market price of power in the market.
11
A suitable design of the water charge based on capacity and actual generation of hydropower is
warranted, for an illustrative example we have considered a simple levy of water charge @ Rs. 0.10 per
cubic meter.

87
Table 6.14: Revenue Collection from Hydropower Projects Actuals RE BE
Sources of Revenue (Rs. Crore) 2005-06 2006-07 2007-08 2008-09 2009-10 2010-11 2011-12
Power 251.47 910.08 1,414.52 1,255.43 1,214.80 1,150.00 1,400.00
Hydel Generation 251.47 910.08 1,414.52 1,255.43 1,214.80 1,150.00 1,400.00
Other Receipts 251.47 910.08 1,414.52 1,255.43 1,214.80 1,150.00 1,400.00
(a) Guarantee fee on loans by
HPSEB 1.34 0.69 106.21
(b) Free Power Royalty from HPSEB 96.12 150.71 57.87 11.76 0.00 14.13 140.00
(c) Receipt from State Electricity
Regulatory Commission 0.00 0.00 0.00 0.00 0.00 0.63 0.00
(d) Receipt from equity in NJPC 12.36 275.89 276.08 604.32 360.71 254.32 334.00
(e) Receipt from HPSEB on A/C of deduction from central assistance
on A/C of dues as CPUs 0.00 0.00 0.00 2.70 0.00 286.63 256.00
(f) Free Power Royalty from SJVN 122.62 303.54 407.84 526.63 174.52 400.25 477.32
(g) Receipt from C.P.S.U other than SJVN 16.96 177.42 564.12 109.97 662.19 192.26 192.00
(h) Receipt from Private Sector 0.00 1.84 2.41 0.05 0.68 1.78 0.68
(i) Miscellaneous 2.07 0.00 0.00 0.00 16.71 0.00 0.00
(j) Deduct Refund 0.0000 0.0000 -0.0001 0.0000 -0.0001 0.0000
Total 251.47 910.08 1,414.52 1,255.43 1,214.80 1,150.00 1,400.00
(A) Free Power Royalty (a + f + h) 218.74 456.08 468.11 538.44 175.20 416.16 618.00
(B) Equity Component (d+g) 29.32 453.30 840.21 714.29 1,022.90 446.58 526.00
(C) Total Revenue from Free
Power & Equity Component
(A+B) 248.06 909.38 1,308.31 1,252.73 1,198.10 862.74 1,144.00
C as % of Total Revenue from Hydel Generation 98.64 99.92 92.49 99.78 98.62 75.02 81.71
Source: Data Compiled from Budget Document, Govt. of Himachal Pradesh (various years).
Table 6.15 shows that the revenue from hydel power projects will go up from
Rs. 862.74 crore in 2010-11 to 2,105.24 crore in 2016-17. Adequate attention
therefore needs to be given to this important source of potential revenue.
Table 6.15: Projected Revenue Potential from Hydropower Projects
Source: Based on data shared by the Himachal Pradesh Power Corporation, Shimla and Budget Papers,
Govt. of Himachal Pradesh.
Year
Projected electricity to be accrued to
the government of Himachal Pradesh
(in MU)
Revenue potential
(Rs. Crore)
Free
power
Equity
component Total
Free
power
Equity
component Total
2010-11 1,730 1,437 3,167 416.16 446.58 862.74
2011-12 2,381 1,437 3,818 572.76 446.58 1,019.34
2012-13 3,520 1,576 5,096 846.75 489.78 1,336.53
2013-14 4,304 1,899 6,203 1,035.34 590.16 1,625.51
2014-15 4,681 1,932 6,613 1,126.03 600.42 1,726.45
2015-16 4,883 2,009 6,892 1,174.62 624.35 1,798.97
2016-17 5,642 2,407 8,049 1,357.20 748.04 2,105.24

88
6.3.3 Revenue Potential from Imposition of Water Levy for Hydropower
Projects
If we consider the water levy at the rate of Rs. 0.10 per cubic meter for water
used in hydropower generation (non-consumptive usage of water), and assume that
10.32 million cubic metre of water is required to generate 1 MW of electricity (as in
the case of Jammu & Kashmir, Table 6.11), the estimated revenue for the present
6,461 MW of hydropower generation in Himachal Pradesh could be Rs. 666.45 crore.
Water use (non-consumptive) per unit of hydropower generation varies within a
hydropower plant and it depends on the water flow of the river and height of storage
of water in dam/ reservoir (Table 6.12).12
Assuming that the averages computed for
SJVN ltd in the Table 6.12 are a fair approximation of the numbers for all power
projects in the state, the cost of introducing a levy of Re 0.10 per cubic meter of water
would be Rs. 2.57 lakh per MU of power (Table 6.12, average figure).13
In SJVN
Ltd., the average expenses for 1 MU of power generation is Rs. 10.33 lakh and the
revenue from 1 MU of power generation is Rs. 25.44 lakh.14
Therefore at this rate of
water levy, the cost of generation would increase by 25 percent and the additional
levy of water charges would be 10 percent of revenue. At the present level of installed
hydropower capacity (i.e., 6,461 MW) and at a 50 percent Plant Load Factor (PLF),
the estimated hydropower generation could be 28,299.18 MU (see footnote 10). To
produce 28,299.18 MU of hydropower the water requirement with the above average
rate would be 72,728 million cubic meter (@2.57 million cubic meter for 1 MU) and a
water levy at Rs. 0.10 per cubic meter of water would generate revenue of Rs. 727.28
crore.
12 Theoretical power (P) = Flow rate (Q) x Head (H) x Gravity (g). When Q is in cubic metre per
second, H is the vertical height in metre and g = 9.81 m/s2, then, P = 9.81 x Q x H (kW). Actual Power
= Theoretical Power x Efficiency (approx. 50%) 13
In Table 6.11, we found that for hydropower projects located in J&K, the average water requirement
is 2.07 million cubic meter per MU of power generation. 14
MU= MW x 24(hrs) x 365(days) x PLF/1000, where, PLF is the average plant load factor; MW= the
value of MW for conversion. For example, if we need to convert 150 MW into MU, if PLF=50% or
0.5. Then, MU= 150MW x 24(hrs) x 365(days) x 0.5/1000 = 657 MU.

89
Table 6.16: Daily Generation Information of SJVN Limited
Date
Water
utilized
(m3/s)
Total
running
time of
units
(in hour)
Usage of
water
(million
cubic
meter)
Power
generation
(MU)
(ex-bus)
Water
usage per
MU of
power
generation
(million
cubic
metre)
Water
charges
(Rs.
Lakh/
MU)**
15 April 2010 136 53.8 26.3 12.9 2.04 2.04
16 May 2010 254 97.9 89.5 24.2 3.70 3.70
12 June 2010 326 126.5 148.5 31.1 4.77 4.77
20 July 2010 298 108.4 116.2 28.3 4.10 4.10
18 August 2010 117 44.2 18.6 11.1 1.67 1.67
10 August 2010 82 30.0 8.8 7.8 1.13 1.13
15 September 2010 399 144.0 206.8 37.9 5.45 5.45
15 October 2010 217 90.0 70.3 20.6 3.40 3.40
15 November 2010 138 57.9 28.7 13.2 2.18 2.18
15 December 2010 105 41.2 15.6 10.0 1.56 1.56
15 January 2011 88 37.4 11.8 8.4 1.41 1.41
15 February 2011 77 35.2 9.8 7.4 1.33 1.33
15 March 2011 82 34.8 10.3 7.8 1.31 1.31
15 April 2011 126 50.4 22.9 12.0 1.91 1.91
Average 175 68.0 56.0 16.6 2.57 2.57
Minimum 77 30.0 8.8 7.4 1.13 1.13 Maximum 399 144.0 206.8 37.9 5.45 5.45
Notes: *- since information on water utilized is available, we have taken 'Inflow for Generation' as
proxy.
**-the rate of water charges is Rs. 0.10 per cubic metre of water.
Source: http://sjvn.nic.in/commercial_generation.asp (last accessed on 15 September 2011).
In order to understand the overall impact of such a policy change, it is
important to recognise that the state also receives revenue from the power projects in
the form of equity component. Using the information in Table 6.10, the figures for the
year 2010-11 is Rs. 446 crore. Considering the fact that revenue net of costs for SJVN
ltd is Rs. 15.11 lakh per MU, and the production in the state is 28,299 MU as derived
above, the equity component received by the state is about 10 percent of the total net
receipts. If the return on equity is assumed to remain 10 percent of the net receipts
even after the introduction of the water levy, the returns to the government would
reduce to Rs. 355 crore.15
Correcting for this decline, the state would still have an
incremental additional revenue of Rs. 636 crore from introducing the water levy.
15
This figure is derived as follows: assuming 10% of net receipts is paid as the return on equity the net
receipts per MU are (Rs. 15.11 lakh- Rs. 2.57 lakh) which is equal to Rs. 12.54 lakh per MU. For total
power produced of 28,299 MU, therefore, the receipts to the government would be Rs. 12.54
lakh*29,299*0.1=354.81 Crore.

90
6.4 Conclusions
The three proposals in this chapter can together add about Rs. 835 crore to the
state exchequer. When compared to the total own tax revenue of the state, the above
would amount to an incremental 32 percent. While by itself, these increases would not
be considered large enough to meet the increasing revenue needs of the state, it could
provide the additional resources required to urban and rural local bodies for fulfilling
their obligations and responsibilities.

91
CHAPTER 7
Administrative Structure: An Assessment
7.1 Introduction to Administration of Excise and Taxation
Department
Like the other states which share a lineage with Punjab, Himachal Pradesh too has
an excise and taxation department, which has the responsibility of administering three of
the major taxes in the state – VAT and related taxes, excise and related taxes and
passenger and goods tax in the case of goods transporters. A more exhaustive listing of
the Acts administered by the Excise and Taxation department of Government of
Himachal Pradesh include:
i) HP Value Added Tax Act, 2005
ii) Central Sales Tax Act, 1956
iii) HP Taxation on Certain Goods Carried by Road Act, 1999 (CGCR)
iv) HP Entry of Goods into Local Area Act, 2010
v) HP General Sales Tax Act, 1968
vi) Punjab Excise Act, 1914
vii) Medicinal & Toilet Preparation (Excise Duties) Act, 1955
viii) East Punjab Molasses Act, 1948
ix) Indian Power Alcohol Act, 1948
x) Narcotic Drugs and Psychotropic Substances (NDPS) Act, 1985
xi) HP Passenger and Goods Tax, 1955
xii) HP Tax on Luxuries in Hotels and Lodging House Act, 1979
xiii) HP Entertainments Tax (Cinematograph Shows) Act, 1968
xiv) HP Entertainments Duty Act, 1968
xv) HP Toll Act, 1975

92
These Acts correspond to five areas of taxation – taxation of goods, excise on and
control of alcoholic products, passenger and goods tax, luxury tax and entertainment tax.
Some of the acts mentioned in the list above have been repealed or replaced, and
administration of the same refers to the pending cases under these acts. As per the
perception of the Officers that we had interacted with, the maximum time is spent on
administration of VAT and related taxes on goods, followed by the administration of
Excise related Acts. In order of priority, Passenger and Goods Tax comes next followed
by luxury tax. This is also a reflection of the revenues associated with these taxes. Most
of the Acts mentioned above require the tax payer to be registered with the department
and report periodically about the activities concerned through returns or through
submission of other statutory forms. The main functions under two of the main taxes,
VAT and excise are summarized below.
7.1.1 Main Administrative Functions under VAT:
a) Registration of Dealers: All dealers who have a gross turnover above Rs. 6 lakh,
all manufacturers with turnover above Rs. 2 lakh, and all importers need to be
registered for VAT purposes. The registration threshold in case of establishments
which sell food preparations is Rs. 2 lakh. There is no fixed time period within
which the registration process needs to be completed by the authorities.
a. The rules do specify that the authorities need to be satisfied that the
application is in order, and can undertake any verification that is required.
b. There is requirement of security deposit of a specified amount as well –
this can be in the form of a surety or cash deposit in a bank etc. duly
pledged to the department.
i. The validity of all these documents and needs to be monitored
periodically.
b) Payment of tax: Apart from depositing in the treasury through a challan, the rules
allow for the payment to be made through bank draft or crossed cheque from a
local branch. However, these payments need to be made well in advance, thereby
93
increasing the opportunity cost of this option, and perforce encouraging the
dealers to opt for payment through the treasury.
a. A copy of the challan submitted to the office is to be cross-checked with
the copy/list received from the treasury. Since extent of computerization is
limited, this activity needs to be completed manually, and regularly.
c) Receiving of Returns and scrutiny of returns: Most dealers are expected to submit
a quarterly return. Large dealers with turnover above Rs. 5 crore need to submit a
monthly return. Each return is to be accompanied by list of purchases and sales.
Further, each dealer is expected to file an annual return which needs to be
accompanied by a copy of final accounts including balance sheet, profit and loss
cum manufacturing/trading account and a statement reconciling the difference, if
any, between the accounts and the turnover reported in the annual return.
a. Given that most of these are paper documents, the purpose of these
documents would be only to serve as a psychological deterrent.
b. Every return has to be scrutinized, so that the information in the return can
be correlated with the information in the challans.
d) Issuance of Notice to Return Defaulters: In the event of incorrect
payments/returns or for non-payment/non-filers, the department is expected to
issue a notice. This requires up-to-date information on the returns filed, and
timely scrutiny of the returns received.
e) Assessment: The Act and rules mention a provision for “deemed assessment”. The
rules specify cases which can be taken up for scrutiny. Apart from specific
characteristics of the dealers, like dealers with turnover above Rs. 1 crore, these
include cases selected at random by The Commissioner, and cases where the
returns are not complete even after due procedure. Given the wide sweep of these
conditions, it would appear that the conditions for deemed assessment for the rest
of the dealers should be simple. However, there is a clause [Rule 21(1)(i)] which
states that for a return to be deemed to be “correct, if its version conforms to that
of the accounts maintained by the dealer and the account version cannot be

94
impeached by any adverse information available on record till 31st October of the
following year”.
a. This could be interpreted as requiring an inspection of the books of
accounts of the dealer thereby bringing back bulk of the cases into regular
assessment. Discussions with the officials also suggest that only about 10
percent of the cases qualify for deemed assessment and the rest need to be
regularly assessed.
b. It is not clear how many dealers in any particular district will fall in the
categories requiring mandatory assessment.
i. It may be worthwhile to regularly redefine the criterion for cases
requiring mandatory assessment, at least in line with inflation.
In regular assessment, the assessing authority is expected to send a notice to the
dealer concerned specifying the time period for which assessment is to be
undertaken and require that books of accounts be produced for examination by the
authority. The notice is supposed to be provide at least 10 days time to the dealer.
f) Issuance of Notice for Demand Recovery, and recovery of demands: An
assessment procedure can potentially generate additional demands, and issue of
demand recovery notice and recovery of demands is a function arising out of the
assessment procedure.
g) Inspection of Registered/Un-registered Business Premises: Since the assessment
is done in the office of the assessing officer, inspection is a tool used by tax
departments to undertake spontaneous checks on the veracity of account-keeping
of the registered dealers and to check whether hitherto unregistered businesses
need to brought within the tax net.
h) VAT Survey: Apart from spontaneous checks in the form of inspection, the
department is expected to carry out periodic surveys to identify potential
businesses, which need to be brought within the ambit of registration.
i) Refund procedure: In the event of some of the taxpayers becoming entitled to
refund, the rules prescribe that the case would be subject to scrutiny. Once the
scrutiny is complete, the officer concerned issues the order sanctioning the refund.

95
Depending on the amount of refund due, the responsibility of issuing the order is
assigned to different officials, with all orders for refunds over fifty thousand
rupees requiring the Commissioner to take action.
a. This refund amount can be paid in cash or adjusted against subsequent
payments to be made by the dealer.
j) Unlike most other tax departments, HP does not have a separate appellate system
within the department. The dealer can appeal against an assessment order passed
by an official, to a superior officer.
7.1.2 Main Functions under State Excise
As discussed in chapter 4, the main activities under the state excise relate to
issuing of licenses to distillers, brewers, wholesalers and the vends, determining the
MGQs, and fixing maximum prices for the products. The main functions can be
summarized as follows
a. Fixation of Maximum Retail Price (MRP) and minimum retail price for all
variants of country liquor and Indian Made Foreign Liquor (IMFL)
b. Allotment/Renewal of Liquor Vends
c. Issuing Excise Passes
d. Inspection (Physical verification) of the location of the liquor vends
e. Inspection of stock of the liquor vends and other excise licensees
f. Receiving application for quota conversion/additional quota etc.
g. Recovery of License Fee/Interest penalty
h. Audit & Inspection
7.1.3 Organisational Structure of the Excise Department
The Excise and Taxation Department is organized into districts and circles and is
manned by a hierarchy of officials, including Assistant Commissioner of Excise and

96
Taxation, Excise and Taxation Officer and Excise and Taxation Inspector. The
organizational structure is summarized as follows:
Each of the AETCs is supported by Excise and Taxation Officers and Excise and
Taxation Inspectors. Some of the key features of the present form of organization of the
department can be summarized as follows:
I. In each of the districts and circles therein, each of the officials deals with all
of the applicable Acts in the region. There is a marked focus on geographical
organization of the department with a taxpayer reporting to a single official
for all the activities regarding any given tax, or in fact for all taxes applicable.
II. There are segregated functions for research (TRU) and legal, but
organizational chart shows very few positions for these functions.
III. Certain functions like training and IT are conspicuous by their absence from
the organizational chart, indicating that there is no allocation of manpower for
these functions, at least at the senior levels.
Given the wide variety of functions performed by the officials, it is illuminating to
examine the number of officials available for all these functions. Table 7.1 below
presents a summary picture of the number of registered tax payers for the three important
taxes and the total number of officials for administering these taxes.

97
Figure 7.1: Organizational Chart: Excise and Taxation Department
Source: hptax.gov.in

98
Table 7.1: Category-wise Personnel and Work Load of the Department of Excise and
Taxation during 1990-91, 2000-2001 and 2009-10 Category Sub-category 1990 2000 2010
Category-wise break up of Personnel
(with nomenclature)
ETC 1 1 1
Addl. ETC - 2 2
Jt. ETC 1 1 1
DETC 5 6 6
AETC/AETC (L) 13 14 14
ETO 45 59 55
Excise and
Taxation Inspector
(ETI)
199 269 218
Sub-Total 264 352 297
Others 497 646 557
Total 761 998 854
1990-91 2000-01 2008-09
Revenue Collection (Rs. Crore) 160.90 728.41 2242.49
No. of Files Dealt with (Per Year) - - -
No. of letters dealt with (Per Year) 70000 151747 394565
IAA dealt with - - -
No. of Tax payers (Registered Dealers) VAT/HPGST
Dealers+CST
dealers
16019 27514 61,840
Dealers regd. only
under CST
15963 27417 52,248
Manufacturers 1100 3007 7,544
Other Dealers - - 54,296
Total 34982 54931 1,75,928
1990 2001 2010
No. of Registered Motor Vehicles (nos.) 1,08,312 2,16,911 5,38,341
No. of barriers 36 36 36
No. of circles 35 58 62
1990-91 2000-01 2010-11
No. of liquor vends 826 1,078 1,812
Different Acts/Rules/ Legislations dealt with 12 12 14
Some Indicative Ratios
No. of Registered Dealers & Liquor Vends per Excise Tax
Officer (ETO) 796 949 3232
No. of Registered Dealers & Liquor Vends per Excise Tax
Inspector (ETI) 180 208 815
No. of Registered Dealers & Liquor Vends per Excise Tax
Personnel (Officer Grade) 136 159 598
No. of Registered Dealers & Liquor Vends per Excise Tax
Personnel (Non-officer Grade) 72 87 319
Source: Based on information provided by the Department of Excise and Taxation, Government of
Himachal Pradesh, Shimla
The table brings to light the sharp increase in the number of taxpayers associated
with each of the officers in the administration. While the total number of taxpayers for
each ETO was 796 in 1990, the same has jumped to 3232 by 2010. Similarly, the number

99
of taxpayers for each ETI has jumped from 180 in 1990 to 815 in 2010. Apart from the
startling fact that the number of officials has declined while the number of registered
entities for the various taxes have increased significantly, the table also highlights the fact
that the number of “others” is almost twice the number of “officers”. This ratio provides
the first indication that the existing strength and structure of manpower in the department
may not be adequate to meet the needs of administering all the various taxes that the
department has been entrusted with administering.
In order to assess the adequacy of the number of officials, especially of ETOs and
ETIs, an attempt was made to assess the time required to complete the assigned tasks for
each of these officials, through a case study of Kangra district. The detailed listing of
activities is reported in the Appendix Table. Using this information, section 2 below
provides an assessment of the number of officials required to complete the activities
assigned. With changing technology, it is often argued that the need for personnel per
unit of work can be reduced. While the level of computerization and use of IT in tax
administration in the state is at a rather limited level, and hence the corresponding need
for manpower larger in the state when compared to other similar states, it is also useful to
recognize that redesigning of procedures could allow for better utilization of the available
manpower in the state.
Another aspect that needs some attention is the spatial distribution of officials in
the state. While the structure of the tax department suggests that there is an emphasis on
district based organization, the following table highlights the need to explore whether
some re-organization could yield more efficient utilization of the existing manpower.

100
Table 7.2: Spatial Variation of Workload of Excise and Tax Officer in Himachal Pradesh
District
Number
of
Excise
Tax
Officer
(ETO):
2011
Population
served by
each ETO
(in 10,000
population):
2011
Area
covered
by each
ETO (in
Sq. Km.):
2011
Gross
district
domestic
product
per
ETO
(Rs.
crore):
2005-06
No. of
registered
dealers
under HP
VAT Act
under
each ETO
No. of
dealers
having
annual
turnover
of Rs. 1
crore
for each
ETO
Revenue
collection
by each
ETO
(Rs.
crore):
2009-10
(1) (2) (3) (4) (5) (6) (7) (8)
Bilaspur 4 10 292 360 1,064 37 41
Chamba 3 17 2,162 435 939 33 17
Hamirpur 1 45 1,119 1,631 4,313 170 52
Kangra 11 14 521 439 762 49 27
Kinnaur 1 8 6,484 508 1,087 16 31
Kullu&Lahul&Spiti 2 23 10,651 1,021 2,010 84 39
Mandi 5 20 790 559 1,372 81 23
Shimla 7 12 731 520 1,482 37 36
Sirmaur 6 9 470 300 888 80 25
Solan (including
BBN Baddi)
10 6 194 368 1,034 139 95
Una 5 10 308 359 813 67 27
Source: Census of India 2011, Department of Excise & Taxation, Govt. of Himachal Pradesh, Department of
Economics and Statistics, Govt. of Himachal Pradesh.
Population served by each ETO, Area covered by each ETO, Gross District
Domestic Product per ETO and Number of registered dealers per ETO (columns 3-6), in
the table can be considered indicators of the potential tax/potential workload for the
department, while the last three columns are indicators of the actual work load of the
officer. As can be seen, there is significant divergence across districts in each of these
indicators. In terms of number of dealers per ETO, Hamirpur and Kullu and Lahaul Spiti
stand out from the others, while in terms of area, it is Kinnaur and Kullu Lahaul Spiti. In
terms of number of large dealers, it is once again Hamirpur along with Solan. These
suggest that some re-organization in the spatial location of officials can provide for more
even distribution of the workload. It may be mentioned here, that just the number of tax
payers and/or the revenue generation per se may not be the only two variables to take into
account. Further, segregation of some functions and better management of information
systems can augment the performance of the officers concerned. Some of these issues are
discussed in section 2 below.

101
Since some of the other states in the country have experimented with different
levels of computerization, as well as different kinds of processes, it is useful to ask how
the state compares with some of other departments of commercial taxes in the country.
Section 3 below provides a comparison with other states both in terms of the number of
personnel and in terms of some of the key procedures adopted.
7.2 Process Review
7.2.1. Cost of Collection
The first summary measure of the size of the department is the cost of collection.
The following Table 7.3 provides some comparisons across states in India, of the cost of
collection of some of the important state level taxes. The excise and taxation department
in Himachal Pradesh administers a number of taxes. A similar structure is followed by
the states of Punjab and Haryana. In most of other states however, there are separate
departments to deal with these taxes - commercial tax/sales tax to deal with VAT and
excise department to deal with excise duty. The Finance Accounts for each state however
do provide a number for the cost of collection for each of the taxes separately. These
numbers are used as a basis for comparison. The Table 7.3 reveals that the cost of
collection in Himachal Pradesh is somewhat lower than that in all the other comparable
states. These figures can be interpreted in either of two ways – the department is more
efficient when compared to the other states or that the department is failing to undertake
the minimum functions required and consequently there is a loss of potential revenue.

102
Table 7.3: Comparative Picture of Cost of Tax Collection as a Percentage of
Corresponding Revenue Collection (percent)
Himachal Pradesh 2004-05 2005-06 2006-07 2007-08 2008-09
Sales Tax/ VAT 0.15 0.27 0.10 0.09 0.12
State Excise 0.51 0.50 0.53 0.50 0.51
Taxes on Vehicles 0.69 0.72 1.25 1.90 0.81
Stamps and Registration Fees 2.68 1.48 2.43 1.16 1.25
Haryana 2004-05 2005-06 2006-07 2007-08 2008-09
Sales Tax/ VAT 0.72 0.66 0.66 0.66 0.81
State excise 0.88 0.97 0.99 0.94 1.30
Taxes on vehicles 4.47 3.90 3.10 2.34 3.34
Stamp duty and registration fees 0.72 0.42 0.60 0.68 1.23
Punjab 2004-05 2005-06 2006-07 2007-08 2008-09
Sales Tax/ VAT 0.96 1.06 0.87 0.86 0.75
State excise 0.74 0.76 0.90 0.71 0.80
Taxes on vehicles 1.50 1.51 1.57 1.53 1.76
Stamp duty and registration fees 1.48 1.21 1.67 1.16 1.37
Uttar Pradesh 2004-05 2005-06 2006-07 2007-08 2008-09
Commercial Tax 2.01 1.71 1.51 1.52 1.56
State excise 1.10 1.08 1.05 1.11 0.96
Taxes on vehicles, goods and
passengers 1.51 2.92 2.69 2.88 3.63
Stamp duty and registration fees 2.19 1.75 1.36 1.83 1.84
Source: Finance Accounts (various years).
7.3 Arrears in Collections
A similar alternative indicator is the arrears in collections (Table 7.4). Low arrears
could be an indicator of the ineffectiveness of the department in generating claims or of a
very efficient department, which effectively collects all the claims raised by it. A
comparison of the performance of Himachal Pradesh with some of the other states
indicates that the state has very little arrears in trade taxes and excise duty. In other taxes,
such as electricity duty, the arrears are substantially larger than in the comparable states.
This observation too does not help generate a coherent interpretation. As argued earlier,
lower arrears could be both the result of good administration and ineffective
administration. In order to explore this issue further, it would be useful to understand the
differences in workload of officials in the different states.

103
Table 7.4: Analysis of Arrears of Revenue for Selected States in India
States
Amount
outstanding as on
31 March 2009
(Rs. Crore)
Amount
outstanding for
more than 5 years
as on 31 March
2009 (Rs. Crore)
Revenue
Collection
(Rs.
Crore):
2008-09
Himachal Pradesh
Taxes on sales, trade/VAT etc. 120.38 (9.66) 53.77 (4.31) 1,246.31
State Excise 7.87 (1.82) 4.22 (0.98) 431.83
Taxes & duties of electricity 167.83 (212.9) Nil 78.83
Taxes on Vehicles 109.10 (80.5) 56.53 (41.71) 135.53
Taxes on goods & passengers 13.21 (21.17) 11.14 (17.86) 62.39
Other taxes & duties on commodities and
services 5.40 (3.2) 1.56 (0.92) 168.99
Land Revenue 1.03 (5.08) 0.43 20.28
Total 568.60 (25.36) 159.39 (7.11) 2,242.49
Haryana
Taxes on sales, trade, etc. 1,955.87 (23.98) 417.20 (5.12) 8,154.73
State Excise 46.61 (3.29) 21.29 (1.5) 1,418.53
Taxes & duties on electricity 101.23 (95.22) 61.91 (58.24) 106.31
Taxes on goods & passengers 50.08 (13.52) 26.71 (7.21) 370.29
Other taxes & duties on commodities and
services 13.77 (44.21) 9.46 (30.37) 31.15
Total 2,366.78 (20.31) 606.22 (5.2) 11,655.28
Punjab
Taxes on sales, trade, etc./VAT 860.10 (13.95) 401.48 (6.51) 6,166.46
State Excise 11.60 (0.64) 11.60 (0.64) 1,809.95
Taxes & duties of electricity 148.43 (23.51) 35.21 (5.58) 631.33
Taxes on vehicles 109.20 (20.84) 46.17 (8.81) 524.09
Total 1,357.06 (12.17) 618.97 (5.55) 11,150.19
Uttar Pradesh
Commercial tax 15,389.85 (88.03) 9,210.00 (52.68) 17,482.05
Stamp & Registration 249.67 (154.51) NA 161.59
Land Revenue 9.90 (6.32) NA 156.75
Taxes on vehicles, goods & passengers 72.06 (5.18) NA 1,391.15
Total 15,731.74 (54.89) 9,214.86 (32.15) 28,658.97
Note: Figure in the parenthesis shows the percentage of Revenue Collection (as on 2008-09).
Source: State-wise CAG's Audit Report (Revenue): 2008-09.

104
7.4 Adequacy of Number of Officials: Span of Control Analysis
The degree of control and the efficiency of a tax administration can depend on the
number of officials when compared to the number of taxpayers. Lower the number of
taxpayers per official, greater the time that can be devoted to individual cases. There can
be two ways of undertaking such a comparison – one across states, and the other over
time for a given State (Table 7.1). As highlighted above, there is a sharp increase in the
number of tax payers per official in Himachal Pradesh the period since 1991. A similar
picture emerges in inter-state comparisons as well. (Table 7.5) When compared to
Himachal Pradesh, all the other states in the table have lower number of tax payers per
official. Bihar seems to be the only exception to this. This holds true for both officers as
well as for other grades of employees. Higher number of tax payers per official does
suggest that the tax administration in the state is in considerably more stress when
compared to that in the other states presented in the table.
Table 7.5: Comparative picture of State Administrations
Total Number of Registered Dealers per Official
Ratios Maharashtra HP Bihar Gujarat AP
STO 1115 5790 7892 1451 338
STI 385 1461 540 175
AC 2476 22748 14770 9670
Officers 234 1072 4293 379 113
Non-officers 272 572 310 213
All grades 126 279 4293 171 74
Assessing officers 257 1110 5143 394 114
Ratio of Officers to
others 0.49 0.34 0.83 0.43 0.65
Source: Computed from Websites of State Departments and CAG reports.
Another interesting feature reported in the table relates to the share of officers in
the total number of employees in department. The table indicates that the number for
Himachal Pradesh is much lower than that in the other states. This result holds good for
Bihar as well. Given the technical nature of tax administration, especially in the case of

105
value added tax, this feature does place relatively high load on the available number of
officials and assessing officers. Considering the fact that these states exhibit better tax to
GSDP ratios when compared to Himachal Pradesh, it is useful to recognize that the
higher workload in Himachal Pradesh could be contributing to poorer tax administration,
translating into lower tax collections.
In order to further explore the issues of adequacy of the number of officials in the
tax administration, the team undertook a detailed study of Kangra district, wherein the
various functions of the officials, ETO, ETI and Superintendent were documented along
with number of cases they were supposed to handle and the time taken for each of the
cases for each of the functions. The information on time taken was in the minimum and
maximum. This information was collated for the level of ETO and ETI and is presented
in Table 7.6 below.
Table 7.6: Number of Days of Work Associated with Assigned Functions:
Case Study of Kangra; Circle: HQ
Minimum Time
Requirement
Average Time
Requirement
Maximum
Time
Requirement
(in Days/Year) (in Days/Year) (in Days/Year)
Excise Tax
Inspector
(ETI)
State Excise 301 (32.3) 396 (26) 492 (23.2)
HP VAT 480 (51.5) 846 (55.4) 1212 (57.1)
Others 152 (16.3) 284 (18.6) 417 (19.7)
Total 932 1,526 2,121
Priority Functions 447 879 1,311
Excise Tax
Officer (ETO)
State Excise 228 (19.8) 263 (18.3) 297 (18.9)
HP VAT 560 (48.5) 793 (55.3) 879 (56.1)
Others 368 (31.8) 379 (26.4) 391 (25)
Total 1,156 1,435 1,567
Priority Functions 740 979 1,071
Note: (a) Figure in the parenthesis shows the percentage of total time devoted to functions related to
particular Act
(b) Derived from information presented in Appendix Table, on the assumption of 8 hour working day.
The table shows some stunning numbers – if the workflow as reported by the
officials is taken as factually correct, even if one assumes that the minimum time reported
for each of the activities is assumed to apply for all the cases, the total time required to
complete the tasks assigned to an ETI would require 932 days, and for ETO, the

106
corresponding number would be 1156 days, where each working day is assumed to be
consist of 8 hours. Even with longer working days of say 10 or even 11 hours, the work
cannot be squeezed into 230 working days of the year. With a 10-hour working day for
instance, the number of workdays required for ETOs would be 925. In other words, the
workload would require 4 ETOs in place of one. Clearly, given the time available, i.e.,
230 working days, there has to be some compromise on work. This would either take the
form of poorly completed work, or work not done. One evidence of work not done is
found in the fact that assessments currently in progress are for the financial year 2005-06
and 2006-07 – a backlog of over three years. Another piece of evidence of work not done
is infrequent surveys. The observation on arrears read along with the above, suggests that
probably the arrears are low because good quality assessments are not being performed.
In discussions with the officials during the visits to the state, some of the
personnel issues that emerged from the discussion are
a. Number of personnel to sort and forward the statutory forms collected from
the barriers is inadequate – the forms are not forwarded on a timely manner.
One official at the head quarter is assigned the task of sorting through and
forwarding over 10,000 forms a year.
b. While computers have been placed in all the offices and there exists some
software to capture data in returns, each district is assigned only one data
entry operator. Given the differences in the number of tax payers in the
districts, the number of data entry operators might not be adequate in all the
districts and the result would be incomplete data entry in the information
system, bringing in the need to maintain some paper documents in order to
comply with all the periodic and occasional reports required by the
headquarters.
From the above, there is a clear case for augmenting the staff strength in the
department. While the above exercise is only illustrative, a similar exercise can be
replicated for the entire department, to get comprehensive numbers for the required staff

107
strength. However, in undertaking such an exercise, it is important to re-evaluate the
processes as well, so that inefficient processes can be redefined.
From the case study of Kangra and discussions with some of the officials of the
tax department, the study team has been able to identify some key areas within processes
that could reasonably be revisited and redefined. These are discussed below:
I. Procedures related to VAT/CST
a. Extensive computerization and more effective use of information systems:
the official website of the Excise and Taxation Department provides links
for e-filing of returns and e-payments. These along with e-registration can
reduce considerably the time spent by the officials in the field on routine
administrative activities. This would require mandatory e-filing for all
dealers, or at least a majority of the dealers in the state. At the present
juncture, Kerala and Andhra Pradesh have made it mandatory for dealers
to e-file their returns. Rajasthan has introduced the scheme on a mandatory
basis for dealers with turnover above Re 80 lakh and has now reduced this
threshold to Rs. 50 lakh. A similar threshold exists in Gujarat as well. In
the case of Himachal Pradesh, if the threshold of 25 lakh is adopted it
would cover about 25 percent of the dealers to begin. The threshold can
gradually be adjusted, over time.
i. States like Karnataka and West Bengal have introduced some of
the other statutory forms as well on the online system, where the
dealer can provide the necessary information and self-issue the
forms. This facilitates operations by the dealers and can reduce the
work effort of the employees as well. This would be especially true
for Form 26, that is collected at the barriers. Collecting the forms
from the barriers and sending the same to the relevant officers,
after sorting is a huge task, which does not get completed in the
present regime, for want of manpower.

108
ii. Discussions with officials in the tax department suggest that while
there are computers in all the offices, the staff available to capture
data is not adequate.
iii. A look at the time analysis of work done suggests that about 10
percent of the time of ETOs can be saved through the use of these
tools.
b. Deemed assessment: For ETOs once again, the importance of Assessment
in the total volume of work is substantial – between 35 to 50 percent of the
total time required is spent on assessments. It is often found in most tax
departments, both in indirect taxes and direct taxes that the number of tax
payers has grown much more rapidly than the number of employees.
While computerization is one way to deal with the resultant increase in
workload, departments have also attempted to rationalize their processes.
One of the important initiatives in this regard related to deemed
assessment. Since routine assessment of all taxpayers takes too much time,
there is little scope for undertaking comprehensive assessment in each
case. And perfunctory assessments yield very little revenue – discussions
with officials in Himachal Pradesh for instance, suggest that the average
increase in revenue on account of assessment is about Rs. 2000. Most tax
departments therefore have opted for schemes of deemed assessments with
selective audit. The number of cases taken up for audit can be determined
on the basis of available manpower and the choice of cases can be driven
by “risk assessment” – identification of potential cases where there is
larger revenue at risk. Given that a smaller number of cases are selected
for comprehensive assessment, these assessments can be more extensive
and potentially can yield more results.
II. Some Legal issues raised by officials:
i. It was mentioned that under the law, one ETO is posted at the barriers
and he can only check vehicles at the barrier. However, near all the
barriers, escape routes are available particularly in the plains. The Excise

109
and Taxation Officer has no legal authority to go out of the barrier and
check vehicles taking the escape routes. One suggestion was that ETO in
charge should have jurisdiction over a certain distance. For example, in
Punjab the jurisdiction extends to about 5 kms.
ii. The officers also do not have any power to ask for the sources of income.
They do not have power to call for information about the tax payer from
others. Section 37 is the only section which gives the power to call for
information and states as follows:-
“The Commissioner or any other person appointed to assist under sub-
Section (i) of Section 3 may for carrying out the purposes of this Act
require any person including a banking, company, post office or any
office thereof to furnish any information or statement useful for relevant
to any proceeding under this Act.”
iii. The special mode of recovery as given in the 27 of the VAT Act is not
available to the officers under other Acts. It was also mentioned that
there is no preemptive power under the VAT Act.
III. Payment of tax: Opening up of alternative modes for payment of tax, which does
not involve early blocking of resources would ease payment of taxes by the tax
payers. Alongside, if the procedures can be refined so that the effort of the
officials in cross-verification of the payments with the returns can be reduced, the
system would optimize on the time of the officials. With computerization, a
number of states have worked out arrangements with banks such that the time lag
between the instruments like cheques being submitted to the bank and money
being credited to the government account can be reduced. In the process, the
banks provide a scroll of the names and TIN numbers of the tax payers along with
the amount of tax paid. A number of states are also providing for online payment
of taxes.
IV. Need for research and training: The department lacks strength in two critical
segments – research and training. For effective policy inputs, it is desirable that
the department institute a robust research unit, which works on more
comprehensive data. Such a unit can generate and maintain most of the reports

110
that are required at the headquarter without calling for all the information from
the field on a regular basis. The other vital wing which is missing in this
department is the training wing.
i. Training of new inductees as well as mid-career training are useful
tools for augmenting the skills of the officials. Some more details
are provided in the next section in conclusions.
ii. As a part of the training institute, there should be systematic
documentation of good assessments undertaken by officials in the
state. Documentation and dissemination of the same among the
officials provides recognition to officials who have performed well
and at the same time allows all other officials to verify whether
similar forms of evasion are being replicated in their respective
jurisdictions.
V. Procedures relating to Excise:
a. A relatively high license fee associated with lifting beyond MGQ would
tempt the dealers to sell the existing stock at higher than market prices.
The design of the system attempts to preclude this option by incorporating
a maximum price into the equation. It should be mentioned that such
design features are often very difficult to implement – they create
opportunities for rent seeking. It would be more effective to allow for
lifting beyond MGQ at proportionate license fees.
b. Reducing the number of permits/passes to be issued is required. The
officials of the Excise and Taxation Department suggest that considerable
amount of time is spent on issuing these passes. Over 50 percent of the
time of an ETI is used up in Excise administration and over 25 percent of
the total time of an ETI is spent on issuing these passes. Effective
computerisation and a redefinition of rules can help reduce this routine
engagement of the officials, without compromising on the quality of
administration.

111
VI. Procedures relating to Transport taxes:
a. There is considerable merit in merging the administration of all transport
taxes – motor vehicles taxes and passenger and goods taxes into the
transport department
b. Enhanced computerization would allow for better monitoring of the
vehicles on road. Some of the states are using hand held devices to check
the veracity of the license documents that the vehicles are carrying, and
can even check whether all due taxes have been paid.
VII. Stability of tenure, political interference through DO based transfers:
Discussions with officials of the department highlighted an unusual dimension in
the transfers and posting of officials in the department. It was indicated that there
was interference of the political class in the transfer and posting of officials. In
the State, there is an open system by which D.O. transfers are open during the
months of April and May and there is a ban on D.O. transfers for the rest of the
period. This process potentially would generate and sustain a transfer and posting
industry in the State, with suitable monetized incentives tied to such transfers.
Officials can seek transfer and request MLAs to issue a D.O. letter requesting the
administration for either retention of the official in a particular place or transfer to
a particular place. It was suggested that there are also very frequent transfers in
the State leading to a very high turnover of officers, which cannot be very healthy
for the proper functioning of the Department.
7.5 Comparison of Organization with Other States
A comparison of the organization of this department with that of some of the
other states in the country indicates the need for two major reforms:
a. Segregation of administration for major acts: As argued above, there is
need to segregate the administration – this can be in the form of two
112
separate wings in the same department as in the case of Punjab and
Haryana or in the form of two separate departments as in most of the other
states. It is noteworthy that while Delhi too comes from the same taxation
history as Punjab, Haryana and Himachal Pradesh, it has separate
departments taking care of these two major taxes.1
i. In addition to the above, most states have attempted to stem the
leakage in revenues from the excise duties by setting by a State
Owned Beverages Corporation, setup as a monopoly in wholesale
trade in the state. Leakages through incomplete reporting of sales
are avoided through this route. While there is no social cause
served by the presence of government in this sector, it can be one
feasible mechanism to improve the revenue performance of the
state.
b. Functional specialization: Apart from the segregation of administration of
excise and VAT, it is noteworthy that a number of departments feel the
need to maintain some minimum functions set apart from the general
administration of the tax. As indicated in the Appendix 7.1 (for ETO),
these functions include some crucial functions like audit/assessment,
investigation, Legal, Training, and Research. Some such functional
specialization may provide a degree of distance to the officials concerned
from the taxpayer, thereby allowing for more effective administration of
the tax.
1 For example, Department of Trade and Taxes, Government of NCT of Delhi administers Delhi VAT Act,
2004 and the Central Sales Tax Act, 1956, whereas, Department of Excise Entertainment & Luxury Tax,
Government of NCT of Delhi administers Delhi Excise Act, 2009; Delhi Entertainment and Betting
Tax(Amendment) Act, 2009, and Delhi Tax on Luxury Act and Rules, 1996.

113
7.6 Recommendations
a. Augmenting the number of employees: from the above discussion, there
is a clear case for augmenting the number of employees in the excise and
taxation department. With the existing structure and organization of
functions in the department, it would appear that at least a three-fold
increase in workforce is required.
i. Skill set for new employees: At present, recruitment within the
department has not focused on any specific set of skills. Since
there are specific functions within the tax department, it may be
useful to recruit people with a minimum background in
accounts/law so as to reduce the training costs of the department.
ii. Stability of tenure: In the absence of an extensive system of
computerization and data capture and data mining, a lot of
intelligence in the department gets embodied in the people working
in the department. Frequent transfers tend to reduce this
accumulation of knowledge about the tax payers thereby
undermining the effectiveness of the tax department. Further, if
politically motivated transfers become the norm rather than the
exception, the officials would have no incentive to safeguard the
interests of revenue. Stability of tenure should therefore be very
high on the list of priorities of the tax department.
However, alongside this increase in the size of workforce, there is need to
consider a few important changes in the structure of the department, in the
process of recruitment and training. These are summarized below:
b. Segregating the administration of the major taxes: The structure of
taxes for each of individual taxes to be administered by the department
is different. Each of the major taxes places considerable demand on the
time of the officials and the kinds of work involved are different. In
Excise for instance, a larger chunk of the time is spent on monitoring.

114
While in the case of VAT and CST, there is a significant amount of
effort required to be placed on technical activities like scrutiny of books
of accounts. Further, the set of dealers are quite different for these two
taxes. Depending on the exigencies involved, therefore, if the
administration of all the taxes is squeezed into one department, with the
same set of officials doing all the functions, then tax administration in
some of the taxes and in some of the functions can be severely
compromised. This is reflected in part for instance, in the poor
monitoring of revenues from luxury tax. While most of the states in the
country have separate departments for excise and commercial tax,
Punjab and Haryana which have similar organization of departments – a
single Excise and Taxation Department – have segregated wings dealing
with these functions. Officials dealing with one tax do not, at the same
time, deal with the other tax.
i. For Himachal Pradesh, it would be desirable to have separate sets
of officials dealing with excise and VAT. This could be in the form
of separate departments or within the same department, as separate
wings. Further, all transport related taxes should be maintained in
one department, as against the present arrangement of some taxes
being administered by the Excise and Taxation department and
others being administered by the Transport department.
c. Functional specialization: At the present juncture, there is a
predominance of area based organization of the department, with no
focus on functions. An analysis of the organizational structure of some
of the other tax departments in the country suggests that segregating
some functions would be desirable.
i. Separating routine functions like issuing of forms, accepting
returns, accepting registration forms, helping in filling challans,
i.e., functions that do not require a high level of skill can be
separated. Some of these functions can even be outsourced to

115
retired employees of the department or to people authorized by the
department for these functions.
ii. Deemed assessment should be made more comprehensive in
coverage with only limited number of cases being taken up for
detailed assessment. These assessments should be of a high quality
in order to generate the deterrent effect. For this purpose, the
department might want to select and train a small set of officials. It
is important that the function of assessment be assigned to people
who do not have the simultaneous responsibility of recovery and
collection. If these two functions are assigned to the same
individual official, the official would have an incentive to only
assess as much to tax as the dealer is willing to pay. In other
words, assessment should be separated from recovery and
collection. The recovery function may be given to a dedicated
wing within the department rather than leaving it to the certificate
officer. The experiment has worked in the income tax department.
Some tax recovery officials may be designated and special training
given to them.
iii. A separate appellate authority within the department will allow for
speedy and objective disposal of cases of appeal.
iv. TRU to be revived: In the era of changing taxes, with the
impending move to GST, it is important for the state to have a set
of people who dedicate their efforts in maintaining up-to-date
information for the purposes of policy debate as also for
identifying ways of improving collections through new levies or
through improved administration.
v. Training Institute: As emphasized earlier, there is need for training
both new recruits and for refresher programmes for existing
officials. This institution can also encourage a debate among
officials about proposed reform measures and help the department
116
identify administrative measures that can improve tax collection
and compliance. It is important to emphasize that such a training
institute should possibly be located not in Shimla but at a more
central location so as to be accessible from all parts of the state.
d. Geographical organization: Within the geographical organization, it
would be useful to focus not just on revenue generation but on indicators
of potential revenue in order to determine the number of positions in
different districts. Given that geographically large districts would require
more travelling for undertaking the same set of functions, this aspect too
may be kept in mind when defining geographical units.
e. Procedure improvements
i. Aligning payment systems with return filing will minimize the cost
of compliance.
ii. Computerization of the Barriers will ensure that data is promptly
captured and utilized.
f. Training for existing and new recruits: For a robust organization, the
officers of the department need to know the law they are administering
and allied commercial laws; they need to know accounts, need to know
how to deal with people, as also have skills to find out tax evasion. The
mode of doing business is changing everywhere. Therefore, such
officers and officials need also to be aware of the developments in the
area of information technology.
However, it is gathered that there is hardly any training that is
systematically imparted to the officers and officials. It has to be
remembered that a certain percentage of the ETOs is filled up through
promotions and there may be situations where there is a possibility of
even non-matriculates occupying important positions. While this may
not be the case actually, the possibility is there. The problem is
compounded by the fact that there is hardly any institutionalized training

117
mechanism for the officials, particularly at the local level. For a vibrant
department, this is simply unacceptable. It is also gathered that even at
the level of the AETCs, there is no systematic training except for an
induction training of about six months that is organized by HIPA and
which is not geared to the particular training needs of the department.
It is high time therefore that the department has its own training institute,
preferably away from the State capital, which is manned by willing and
competent people. The government should think of giving some special
allowance to those posted in the training establishment. Recruits at every
level should be given induction training. There should also be constant
orientation course where the participants can interact and learn about the
modalities of the various evasion techniques that are being adopted. Senior
departmental officers should actively take part in such efforts and guest
lecturers from outside can complement the in house faculty. The training
institute can also be utilized as a think tank and their inputs taken at the
time of policy formulations as also for dissemination of any particular
governmental schemes and taxpayers education programme. It has to be
ensured at the beginning that training institute does not become a sinecure,
nor a dumping ground and that only highly motivated people are posted
there. Such persons should have a minimum tenure of at least three years
and on completion of the same should be given posting of their choice.
i. The prevailing tendency among the supervisory officers is to issue
instructions and then forget. There is no attempt to find out
whether the instructions have been properly understood and
implemented. The training institute can be utilized to achieve this
goal as well.
ii. In our interaction with the officers to find out the modus operandi
generally adopted by tax evaders, we found that not much
information was forthcoming. It will be worthwhile to build up a

118
database of quality assessments, which can be tapped into for the
purpose of training.
iii. The information about a taxpayer is presented in the form of
accounting format and the officers need to discover the underlying
information. One may get away by giving a transaction a particular
name. Moreover, a single transaction may be split into seemingly
independent transactions. Bigger taxpayers are able to engage
better brains to help them dress up accounts. Intensive inputs about
accountancy and accounting practices including the accounting
standards are a must for any officer dealing with commercial taxes.
iv. Enormous changes are taking place in every field, particularly in
the technological filed which can affect other areas including law
and regulatory framework. Because of the vast social, technical
and economic changes that are taking place as an offshoot of
increasing globalization and increasing integration of the global
economy, a complete reeducation process and constant updating is
necessary. For an organization to survive, its rate of learning must
be equal to or greater than the change in the external environment.
v. Needless to say that proper administration of the laws, rules,
circulars and instructions will translate into better revenue
collection even in the short term. Therefore, setting up an exclusive
training institute to cater to the needs of the commercial taxes
department, the choice of the faculty and other members, as also
the course contents need to be monitored at the highest level of the
administration.

119
Appendix 7.1: Workload Analysis
ETO Priority
Average Cases
(No./Year)
Average Time
Requirement
(min/case)
Total Time
Requirement
(in
hour/Year)
Total Time
Requirement
(Days / Year)
Min
Time
per
Case
Max
Time
per
Case
Average
Time
per
Case
Value Added Tax
Registration 1 166 77.5 214 26.8 65 90 77.5
Receiving of Returns
Monthly 1 5 7.5 7.5 0.9 5 10 7.5
Quarterly 1 753 7.5 376.5 47.1 5 10 7.5
Annual 1 753 7.5 94.125 11.8 5 10 7.5
Issuance of Notice to Return Defaulters 1 18 7.5 9 1.1 5 10 7.5
Scrutiny
Monthly 1 5 7.5 7.5 0.9 5 10 7.5
Quarterly 1 753 7.5 376.5 47.1 5 10 7.5
Annual 1 753
37.5
Assessment
Deemed Assessment 1 80 30 40 5.0 15 45 30
Regular Assessment 1 673 240 2692 336.5 145 335 240
Issuance of Notice and Demand Recovery 1 75 7.5 9.375 1.2 5 10 7.5
Recovery of Demand
Voluntary Recovery 1 35 7.5 4.375 0.5 5 10 7.5
Recovery of Old Arrears under VAT Act 1 22.5 37.5 14.0625 1.8 30 45 37.5
Recovery of Old Arrears under Land
Revenue Act 1 3.5
77.0
Recovery under Installments 1
30.0
Inspection of Registered/Un-registered Business
Premises 2 48
48.0
Inspection of Transport Companies 2 48
48
Road Checking (under VAT, PGT, Excise, CGCR,
Entry Tax Act etc.) 2 104 210 364 45.5 180 240 210
VAT Survey 2 210 60 210 26.25 60 60 60

120
ETO Priority
Average Cases
(No./Year)
Average Time
Requirement
(min/case)
Total Time
Requirement
(in hour/Year)
Total Time
Requirement
(Days / Year)
Min
Time
per
Case
Max
Time
per
Case
Average
Time
per
Case
State Excise
Allotment/ Renewal of Excise Licenses 1
12.5
Inspection of Premises of the Excise Licensees in the
Circle 2 540 150 1350 168.75 120 180 150
Destroy of Property Cases (with Police Department) 2 27.5 480 220 27.5 480 480 480
Observation of Dry Days 2 24 960 384 48 960 960 960
Presence during Raids by Police Department 2 4.5 480 36 4.5 480 480 480
Issuance of Transport License for L-1, L-13, L-9, L-
1B, L-1BB, S-1A, L-42 1 90 7.5 11.25 1.40625 5 10 7.5
Passenger and Goods Tax
Registration of Vehicles 1 470 17.5 137.08 17.13541667 15 20 17.5
Issuance of NOC 1 352 30 176.00 22 30
30
Deciding on Challans 1 150 17.5 43.75 5.46875 15 20 17.5
Recovery of Old and New Arrears 1 150 17.5 43.75 5.46875 15 20 17.5
Other Taxes & Duties
Luxury Tax
Registration 1 20 17.5 5.83 0.729166667 15 20 17.5
Receiving & Scrutiny of Return 1 1200 17.5 350.00 43.75 15 20 17.5
Assessment 1 1200 60 1200.00 150 60
60
Serving of Demand Notice 1 300 7.5 37.50 4.6875 5 10 7.5
Recovery of Old & Current Arrears 1 9
1
LT Survey 2 35 180 105.00 13.125 180 180 180
Inspection of Hotels 2 17.5 120 35 4.375 120 120 120
Others
Auction of Toll Collection 1
3
Audit CAG Audit
VAT 1
7.5
PGT 1
7.5
OTD 1
3.5
Replying Audit Queries
VAT 1
7.5
PGT 1
3
OTD 1
5.5

121
ETO Priority
Average Cases
(No./Year)
Average Time
Requirement
(min/case)
Total Time
Requirement
(in hour/Year)
Total Time
Requirement
(Days / Year)
Min
Time
per
Case
Max
Time
per
Case
Average
Time
per
Case
Miscellaneous
Court Cases 1 7.5
7.5
Meetings 1 11
16.5
Protocol Duty 2 22.5
22.5
Public Dealings 1 222 60 222 27.75 60 60 60
ETI
Priority Average No. of
Cases per Year
Time
Requirement
(min/case)
Total Time
Requirement
(in hour/Year)
Total Time
Requirement
(in Days /
Year)
Min
Time
per
Case
Min
Time
per
Case
Average
Time
per
Case
Value Added
Tax
Registration 1 300 145 725 91 105 185 66
Recovery of Old & Current Arrears 1 1050 147 2573 322 32 262 70
Checking under HP VAT Act (On Road Checking) 2 52
52
52
Casual Dealer Checking & Tax Recovery 2 24
24
24
Visit to Circles within District (as Flying Squad) with
AETC/ ETO 2 30
30
30
Verification of Return Defaulters 1 30 15 8 1 10 20 1
VAT Survey 2 2850 45 2138 267 30 60 178
Visit to Dealers' Premises (once in a year) 2 800
53
53
Appearance before Appellate Authority 1 6
6
6
State Excise
Duty
Inspection of Premises of the Excise Licensees in the
Circle 2 62 133 137 17 66 200 9
Renewal/ Auction of Liquor Vends 1
15
Issuing Excise Pass for Own Circle 1 5400 14.5 1305 163 9 20 101
Report for Issue of Excise Pass from Other Circles 1 3600 7.5 450 56 5 10 38
Lifting Samples from Liquor Vends 2 257 37.5 161 20 25 50 13
Physical verification of the location of excise vends 1 753
36
36
Overcharging by the Excise Licensee & related penalty
enforcement 2 12
6
6
Inspection of illegal bar within a hotel/ guest house 1 6
12
12
Observation of Dry Days 2 6
12
12
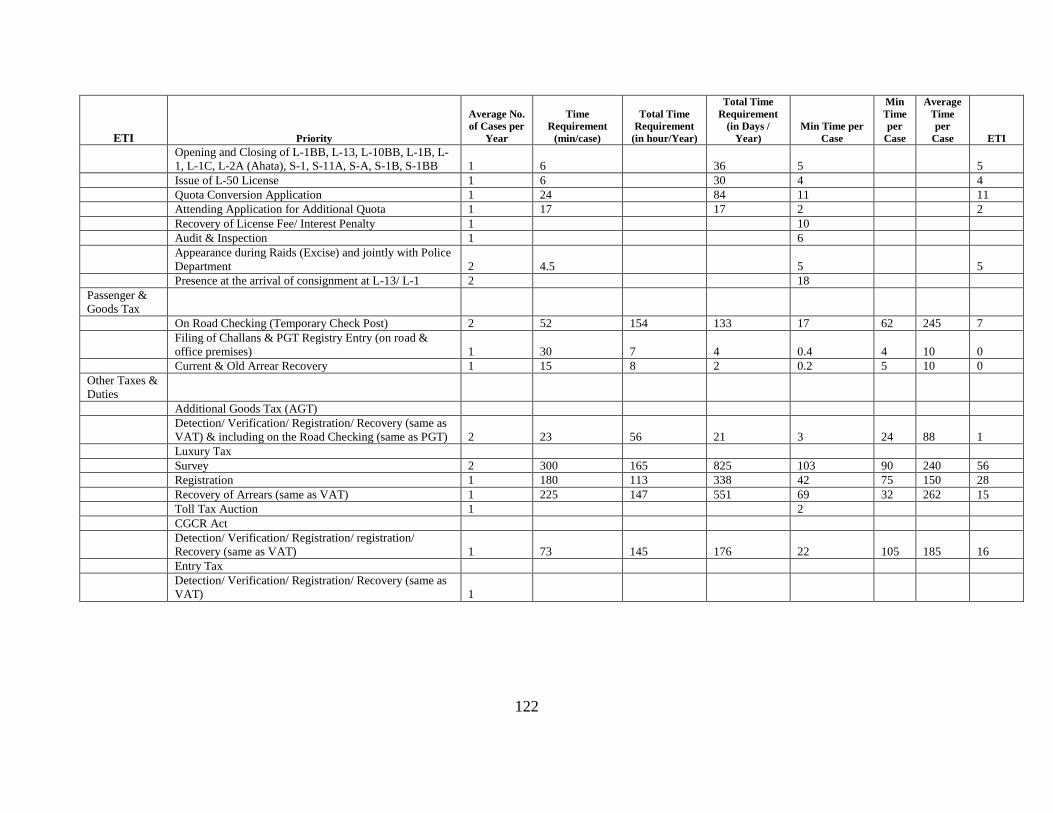
122
ETI Priority
Average No.
of Cases per
Year
Time
Requirement
(min/case)
Total Time
Requirement
(in hour/Year)
Total Time
Requirement
(in Days /
Year)
Min Time per
Case
Min
Time
per
Case
Average
Time
per
Case ETI
Opening and Closing of L-1BB, L-13, L-10BB, L-1B, L-
1, L-1C, L-2A (Ahata), S-1, S-11A, S-A, S-1B, S-1BB 1 6
36 5
5
Issue of L-50 License 1 6
30 4
4
Quota Conversion Application 1 24
84 11
11
Attending Application for Additional Quota 1 17
17 2
2
Recovery of License Fee/ Interest Penalty 1
10
Audit & Inspection 1
6
Appearance during Raids (Excise) and jointly with Police
Department 2 4.5
5
5
Presence at the arrival of consignment at L-13/ L-1 2
18
Passenger &
Goods Tax
On Road Checking (Temporary Check Post) 2 52 154 133 17 62 245 7
Filing of Challans & PGT Registry Entry (on road &
office premises) 1 30 7 4 0.4 4 10 0
Current & Old Arrear Recovery 1 15 8 2 0.2 5 10 0
Other Taxes &
Duties
Additional Goods Tax (AGT)
Detection/ Verification/ Registration/ Recovery (same as
VAT) & including on the Road Checking (same as PGT) 2 23 56 21 3 24 88 1
Luxury Tax
Survey 2 300 165 825 103 90 240 56
Registration 1 180 113 338 42 75 150 28
Recovery of Arrears (same as VAT) 1 225 147 551 69 32 262 15
Toll Tax Auction 1
2
CGCR Act
Detection/ Verification/ Registration/ registration/
Recovery (same as VAT) 1 73 145 176 22 105 185 16
Entry Tax
Detection/ Verification/ Registration/ Recovery (same as
VAT) 1

123
ETI Priority
Average No.
of Cases per
Year
Time
Requirement
(min/case)
Total Time
Requirement
(in hour/Year)
Total Time
Requirement
(in Days /
Year)
Min Time per
Case
Min
Time
per
Case
Average
Time
per
Case
ETI
Miscellaneous
Grahak Protsahan Yojana
Issue/ Collection of GPY receipts to/ from the Dealers 2
2
Draw 2
1
Tracing out of Winner 2 90
3
3
Court Cases 1 5
5
5
Protocol Duty 2
15

124
CHAPTER 8
Implications of Moving to GST for
Himachal Pradesh
While the study so far works on the premise that the present system of taxation
will continue to exist at least for the next few years, there is some change already on the
cards. The Union Government has proposed that some of the major indirect taxes
currently imposed in the country would be replaced by a comprehensive Goods and
Services Tax (GST). This change in system of taxation can alter both the profile of tax
payers in the state and the size of the tax base and thereby change the demands placed on
the administration. It would, therefore, be necessary to consider these possibilities and
prepare for the change. In order to understand the likely implications of introduction of
GST, the following discussion first summarises the key features of the proposed regime
as known till now. This is followed by an attempt to identify the impact of the same on
Himachal Pradesh and the implications for reforms in tax administration in the state.
8.1 Key features of the GST Regime
The key features of the proposed regime can be summarized as follows:
1. GST would involve a dual levy – central GST and a state GST. These will be in
the form of a Value Added Tax operating on the input tax credit principle. The tax
would apply on the supply of both goods and services, where the supply is for a
consideration. The coverage of goods and services would be the same across both
levies.
2. This tax would replace Central Excise, Service Tax and Additional Customs Duty
for the Union government and State VAT, Entertainment tax, Luxury tax, Entry
tax not in lieu of octroi and some surcharges and cesses for the states. It is not yet
clear whether purchase tax too would be subsumed therein.

125
3. Alcoholic beverages, petrol, diesel, ATF, Crude oil and possibly natural gas
would be kept out of the base for GST. Since petroleum products, especially
diesel and petrol contribute a significant amount to the exchequers of both levels
of government this is considered a revenue protecting measure. It is rationalized
sometimes on the grounds that these goods have negative externalities and
therefore the consumption of the same is sought to be discouraged through such
forms of taxation. While states will continue to impose an excise duty on
alcoholic beverages, the Union government would impose excises on tobacco
products, and both would be free to choose the rates of tax to be applicable to the
other products kept outside the purview of GST.
a. There is some discussion to bring petrol and diesel into the GST regime
with powers to the state and the central government to levy some
additional non-rebatable taxes in these products. This measure is expected
to ensure that the tax credit chain remains uninterrupted and refineries in
the business of producing these products are not saddled with additional
non-recoverable taxes.
4. On the rates of tax to be imposed within GST, the initial proposals by the
Empowered Committee of State Finance Ministers were to the effect that the rates
of tax would be uniform across all states, with three main categories – a lower rate
for goods (essential commodities), a standard rate for goods and a separate rate
for services. The Union government too has agreed to such a structure. In addition
to these categories, there would be some exemptions both in goods and in
services. Further, gold and bullion would be taxed at a lower rate of one percent
in order to encourage compliance in these high value transactions that often
escape taxation.
a. While the initial discussions in the Empowered Committee as reflected in
the Discussion Paper on GST suggests that the rates of tax would remain
the same across all states, there is some disagreement on the subject in
more recent times. Some of the states are advocating the need to have
flexibility of rates in order to address their different revenue needs.

126
b. There is some discussion on reducing the number of rates to two by
bifurcating both goods and services into essential and non-essential, the
former being taxed at a lower rate and the latter being taxed at the standard
rate.
5. Central Sales tax would be phased out and inter-state transactions would be dealt
with through some alternative arrangement. This tax would be structured on
destination principle of taxation, i.e., the tax would accrue to the state which is
receiving the goods or services. Since the seller is located in the exporting state,
the proposed regime transfers revenues collected in the exporting state to the
importing state through some mechanism.
a. Initial discussion on the issue proposed a centralised clearing house
mechanism facilitated by the Central Government. However, no firm
decision on this aspect has as yet been taken.
6. Since the objective of GST is to reform the system of indirect taxes in the country
so as to integrate the entire country into one common market, there is a drive
towards hammering out a consensus design of GST, to be adopted both by the
Union and the State Governments. In order to arrive at such a consensus, two
institutional arrangements are being proposed – a GST Council and a GST
Dispute Settlement Commission. The former would arrive at and announce a
consensus decision on the design of GST and on any further changes in the same.
The latter would be a body that the states or the Union government can approach
if one of the constituent members violates the agreement, thereby harming the
revenues of the contesting entity.
7. It has been proposed that while there will be a model GST Act and rules, each of
the governments concerned would enact their own Acts and Rules which have to
be in conformity with the agreed structure spelt out by the GST Council.
8. The administration of GST would remain independent for all the governments
concerned. However, it has been agreed that there would be a common GST
portal setup for the purpose of registration, returns filing and payments. All these
transactions, it is expected, would be only through the electronic medium.

127
a. In terms of the proposals, once the returns are received, they would be
forwarded to the respective departments for further processing.
8.2 Implications of GST for Himachal Pradesh
The introduction of such a levy has certain implications for the state, both in
terms of tax policy and in terms of the proposed reform agenda identified in this study.
The policy issues are taken up first, followed by a discussion of the implications for
reform of the tax administration in the state.
8.2.1 Tax Policy and Revenue Implications for Himachal Pradesh
1. While there is a drive to ensure uniformity across all states, it is important for the
states to know what parameters are left for the states or the Union government, in
terms of decision making. In subsequent discussions at the Empowered
Committee, it would be very important for the state to ask for clarity on this issue
so that its approach to GST Act and Rules can be evolved.
a. In determining the terms of reference of the GST Council, it would be
very useful if the council is asked to explicitly identify the parameters on
which the respective governments have autonomy. If the state can muster
support for the idea, it should push this issue in the Empowered
Committee discussions as well as with the standing committee which is
looking into the Constitutional Amendment Bill.
2. The Rates of Tax: It has been pointed out in other studies, through empirical
computations, that the revenue impact of GST could be differential across states.1
The main change comes in the following manner – for every state, introduction of
GST and IGST would mean that the revenues accruing presently from CST would
be foregone. These, it is expected, would be replaced by taxes on services. In
states where the CST revenue is larger than the corresponding base for services,
there is the potential for a revenue deficit through the adoption of GST. Further, it
is important to note that this deficit is not a transitional issue, but a structural
1 EPW “Goods and Services Tax: An Assessment of the Base”, R. Kavita Rao and Pinaki Chakraborty,
Economic and Political Weekly, January 2, 2010.
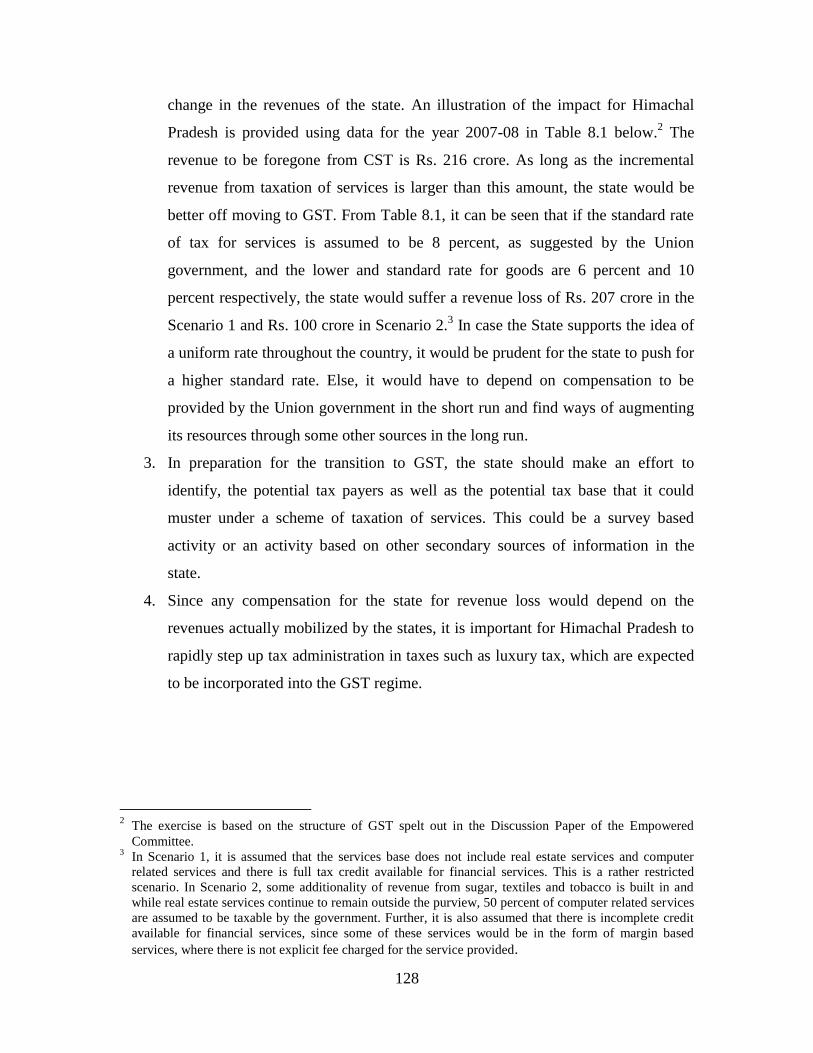
128
change in the revenues of the state. An illustration of the impact for Himachal
Pradesh is provided using data for the year 2007-08 in Table 8.1 below.2 The
revenue to be foregone from CST is Rs. 216 crore. As long as the incremental
revenue from taxation of services is larger than this amount, the state would be
better off moving to GST. From Table 8.1, it can be seen that if the standard rate
of tax for services is assumed to be 8 percent, as suggested by the Union
government, and the lower and standard rate for goods are 6 percent and 10
percent respectively, the state would suffer a revenue loss of Rs. 207 crore in the
Scenario 1 and Rs. 100 crore in Scenario 2.3 In case the State supports the idea of
a uniform rate throughout the country, it would be prudent for the state to push for
a higher standard rate. Else, it would have to depend on compensation to be
provided by the Union government in the short run and find ways of augmenting
its resources through some other sources in the long run.
3. In preparation for the transition to GST, the state should make an effort to
identify, the potential tax payers as well as the potential tax base that it could
muster under a scheme of taxation of services. This could be a survey based
activity or an activity based on other secondary sources of information in the
state.
4. Since any compensation for the state for revenue loss would depend on the
revenues actually mobilized by the states, it is important for Himachal Pradesh to
rapidly step up tax administration in taxes such as luxury tax, which are expected
to be incorporated into the GST regime.
2 The exercise is based on the structure of GST spelt out in the Discussion Paper of the Empowered
Committee. 3 In Scenario 1, it is assumed that the services base does not include real estate services and computer
related services and there is full tax credit available for financial services. This is a rather restricted
scenario. In Scenario 2, some additionality of revenue from sugar, textiles and tobacco is built in and
while real estate services continue to remain outside the purview, 50 percent of computer related services
are assumed to be taxable by the government. Further, it is also assumed that there is incomplete credit
available for financial services, since some of these services would be in the form of margin based
services, where there is not explicit fee charged for the service provided.

129
Table 8.1: Revenue Neutral Rate for Himachal Pradesh: An Illustration
(Rs. crore)
2007-08
Revenues for RNR 941.31
VAT 700.44
CST 162
CST to be compensated 216
Entry Tax 0.00
Entertainment Tax 0.10
Betting Tax 0.00
Luxury Tax 24.28
Cesses & Surcharges 0.00
VAT BASE 8312
Base of Services-Scenario-I: Assuming no revenue from Real estate services and
Computer related services 1299
GST Base: Scenario 1 9611
Base of services Scenario-II: Real estate service remain outside the purview, 50
% of Computer and Related Activities are Taxable and incomplete credit for
financial services 2645
(with sugar, textiles and tobacco)
GST Base: Scenario 2 10956
Scenario-I:
RNR-GST-Single Rate 9.8
RNR -GST-Two Rates 16.0
Scenario-II:
RNR-GST-Single Rate 8.6
RNR -GST-Two Rates 12.9
If Services are to be taxed at 8 percent and the standard rate for goods is 10 percent
Impact on Himachal Pradesh: Scenario 1 (-) 207
Impact on Himachal Pradesh: Scenario 2 (-) 100
Source: Computed.
8.2.2 Implications for Tax Administration
1. The public pronouncements of the Union government as well as the Empowered
Committee of State Finance Ministers so far, indicate that the administration of
the Central component and the state components of the tax would be done
separately, by the respective tax departments. As discussed above, the only
functions that would be jointly undertaken are registration, returns filing and
payments through the GST portal. Under this assumption of a status quo in the

130
structure of tax administration, the changeover to GST should expand the scope
for taxation and hence should place more demands on the state tax administration.
Even if the size of services sector in the state is not very large, it would add some
dealers to the existing set and hence, the total number of dealers would increase
and would need to be dealt with, requiring recruitment of some additional people
to service these tax payers.
a. Since the nature of business in the case of services would be quite
different from that of goods, the record keeping as well as the
interpretation of such records would need training.
However, such a status quo would impose considerably higher compliance costs
on the tax payers, since a significant number of the tax payers would have to
move from dealing with one administration in the present regime to dealing with
two administrations in GST. In case this realization provokes adverse reactions
from the tax payers, there is a possibility of some restructuring of the
administrations. In other words, there is a degree of uncertainty with respect to the
likely structure of tax administration in the proposed regime. It would therefore be
prudent for the state to maintain some flexibility in its administration, while
undertaking the reforms suggested in Chapter 7.
a. Hiving off some of the activities to reduce the effort of tax administration
can be another option – that allows for some more room for manoeuvre.
For instance, in the discussion on state excise, there is a mention of the
option of setting up a beverages corporation. This is one of the ways of
hiving off activities. Even within luxury tax, for instance, it would be
useful to explore alternative ways of augmenting registration and returns
filing, so as to improve revenues. Here, a tie-up with the tourism
department might be useful.
2. Since the form of computerization for the new regime so far suggests that the
returns would be filed in a single GST portal and would be forwarded to the
states, it is important for the states to have compatible and reasonably well
functioning systems to be able to utilize the data that is being provided by the

131
GST portal. This would require not only two way communication between the
systems but also database management and data mining capabilities so as to
optimize on revenue collection.

132
CHAPTER 9
Conclusions and Policy Recommendations
The fiscal situation of Himachal Pradesh, which had improved during the
middle of the last decade is exhibiting signs of some stress once again. This may be
partly due to lower levels of shared taxes, following the economic slowdown. It is
also expected that the recommendations of the thirteenth Finance Commission may
result in a slowdown if not an actual fall in the grants from the central government. In
the context of the above scenario, the Government of Himachal Pradesh has
commissioned this study in an attempt to identify some additional sources of revenue
and streamline the policy and administrations of existing sources so as to be better
equipped to meet its fiscal responsibilities, especially given the limitations imposed
by the Fiscal Responsibility and Budget Management Act. This study analyses the
major taxes of the state government – sales tax, state excise, and transport taxes. In
addition to the above, the study attempts to identify a few new sources of revenue for
the state. While stamp duty and registration fees too are not a negligible part of the
revenue, this study did not attempt to analyse the revenues from this source, even
though the collections in the state are considerably lower than those in the comparable
states. This is because of the fact that there are a number of restrictions on the
functioning of a land market in the state in terms of the Himachal Pradesh Tenancy
and Land Reforms Act, 1972. Such restrictions are placed with an overall objective
beyond revenue generation and hence cannot be assessed on revenue considerations
alone. In what follows, we provide a summary of the recommendations as discussed
in the different chapters of the study.
9.1 Commercial Taxes (Chapter 3)
In so far as the performance of Himachal Pradesh in the area of commercial
taxes is concerned, an inter-state comparison suggests that there is still scope for
further improvement. Even though there have been some improvements in revenue
over time, the commercial tax to GSDP ratio for the state is less than in comparable

133
states. In terms of tax collection to estimates of consumption too, the state has a lower
ratio. In terms of tax to production ratios, however, the state is outperforming most of
the comparable states. Therefore, the opportunity to improve collections rests with a
closer monitoring of consumption and wholesale and retail trade connected therewith.
The evidence on the potential and actual collections for cement in the state
further strengthens this point. Our analysis shows that the total revenue collections
from cement are substantially lower than that suggested by the level of construction
activity in the state.
An analysis of the policies and the performance of the state suggest the
following alternative policy options for the state to augment its collection from
commodity taxes:
1. By periodic revision of the lump sum levies in line with inflation. Since the
lump-sum levies within the state VAT regime have been introduced in sectors
which are otherwise known to be prone to evasion, and not as a means of
providing relief to the sectors, it is important to revise these levies periodically
at least in line with inflation.
2. Entry Tax, which the state has introduced in 2010, could be made into a broad
based levy with set-off against taxes collected in subsequent sales. This way
the tax would not take the form of a discretionary and arbitrary levy, and
should then not be read as a hurdle to inter-state trade.
9.2 State Excise (Chapter 4)
Unlike in sales tax/VAT, the state here seems to perform on par with most of
the other comparable states in Excise. However, there is noticeable deterioration in its
performance over time. As a percentage of GSDP, the collection has declined from a
peak of 1.54 in 2003-04 to 1.28 in 2008-09. Comparing the revenue collections with
the consumption data from National Sample Survey for 2004-05 suggests that the
performance both in terms of revenue collection per litre of consumption and revenue
per rupee of consumption in Himachal Pradesh is lower than in the comparable states.

134
This suggests that there is potential for raising revenues from this source as well. The
Alcohol Atlas of India too suggests that out of the total consumption in India, a
significant proportion (about 50%) is undocumented consumption, i.e., consumption
that is not reported in the sales of the tax authority concerned.1
Another tell-tale piece of evidence is found in the trends of revenue per proof
litre in Himachal Pradesh. For country liquor, this ratio has been declining almost
consistently from 2003-04 to 2008-09, with some reversal in 2009-10. Similarly, if
one looks at the ratio for IMFL & Beer, the revenue tends to fluctuate, and records a
decline from 2007-08. Given the fact that sales have not declined, and the tariffs have
not been revised downwards, the above can only suggest that the revenues due to the
government are not being collected, or that they are getting locked up in litigation.
The revenues locked in dispute are relatively small. Barely 1.6 percent of the total
revenue is locked in disputes/arrears. In other words, the decline points towards
incomplete collection of revenues due to the government. There is thus a clear
possibility of raising additional revenues from this source. Towards this end, both
policy changes and changes in administration could contribute. An assessment of the
excise policy of the state suggests
The current practice of prescribing prices as well as a Minimum Guaranteed
Quantity (MGQ) could be counter-productive, since such a policy needs to be
closely monitored thereby creating opportunities for rent seeking and related
loss to the exchequer.
o It may be more useful to fix the MGQ and let the price float.
Since the license fee is related to the MGQ fixed, for additional withdrawal,
the state would clearly like to claim additional license fee. However, in the
present regime, the license fee for additional quota increases by slabs. This
reduces the incentive to take additional quota.
o In fixing assessed license fee on additional quota, it would be prudent
to relate the collection to the amount of additional lifting, i.e., charge
the vendor only the fee per PL of liquor taken. Haryana adopts such a
policy. This would reduce the incentive to procure from elsewhere. It
could also reduce the incentive to raise the price, provided a one-time
1 http://www.indianalcoholpolicy.org/alcohol_atlas_download.html (last accessed on 15 May 2011).

135
demand for additional quota is not used as evidence to increase the
MGQ for the vend. Persistence of additional demand over three years,
say, might be used for augmenting the MGQ. This would reduce the
long term commitment of the dealer in terms of sales and hence would
encourage additional withdrawals from within the system.
For distillers and brewers, the excise policy through the rules, prescribes
norms of output to be produced from given quantum of inputs and/or the
amount of wastage permitted. There have been repeated mentions in the audit
reports of the Comptroller and Auditor General about the lack of adherence to
the norms of prescribed. While the departmental defence has been that these
norms cannot be adhered to, due to technical conditions, it is important that
the state revise the rules and prescribe such norms as can be adhered to.
Otherwise, this is another possible source of leakage of revenue for the state.
9.3 Transport Taxes (Chapter 5)
The performance of Himachal Pradesh in the collection of transport taxes, i.e.,
motor vehicles tax and passenger and goods tax, as measured by the tax to GSDP ratio
has declined over the years, though the state performs as well as the comparable
states. The former suggests that there is scope for improvement. Interestingly, a
comparison of the structure of taxes in the comparable states suggests that Himachal
Pradesh has been quite aggressive in terms of determining its taxation policy. In most
of the categories of vehicles, the rates in Himachal Pradesh are at par if not higher
than in comparable states. It is possible that the higher rates adopted by the state are
opening the possibility of higher cross-border registrations. While the law mandates
that the vehicles plying in a state are required to register in the state, the administering
departments need strong databases and monitoring systems to administer such a law.
Therefore, the reforms required to improve collections of transport taxes are:
need for a drastic improvement in the database with which the administering
departments work to allow for tracking/monitoring of entry of vehicles into
the state (contract carriages – with/without All India permit, goods vehicles –
other than having National Permit, stage carriages – with/ without reciprocal
agreement, temporary registered vehicles, private passenger vehicles)

136
need for augmenting the capacities of the departments for administering these
taxes as well. Augmenting the capacities can involve technological solutions
or re-formulation of some processes so as to address concerns of cross-border
registrations. For instance, some states have imposed an entry tax on motor
vehicles that are registered outside the state and brought into the state for use.
Scanning of vehicles through cameras at the check-posts could allow the
department to keep a check on the vehicles entering into the state.
Further, in Himachal Pradesh, these taxes are administered by two separate
departments. Given the considerable workload in the Excise and Taxation department,
and the potential problems for goods transporters in dealing with two departments, it
would be very useful to explore the possibility of bringing all transport taxes within
the domain of the transport department. In Punjab, this has been achieved by doing
away with the passenger and goods tax and by introducing a special road tax within
the motor vehicles tax itself.
The overall rationale for motor vehicles taxes and the growing concerns for
green taxes do suggest the possibility of increasing the rates of tax. However, this
would be a worthwhile exercise only if the department can check cross-border
registrations as otherwise the additional revenue would only be marginal.
9.4 Luxury Tax (Chapter 6)
An assessment of the potential for luxury tax collections in the state suggests
that even assuming a 50 percent occupancy, the state should be able to collect about
Rs. 160 crore from the rooms available in the state. Even with more conservative
assumptions, the state should be able to collect at least Rs. 100 crore from this tax.
However, the actual collection in 2009-10 was only Rs. 26.05 crore. Since the data
used for deriving the estimates are from the state’s tourism department, it should be
possible, through closer coordination with this department, to generate some
additional revenue.

137
9.5 Profession Tax (Chapter 6)
The rationale for a tax on Professions, Trade, Callings and Employment is to
incorporate an element of tax on incomes into the options available to the states.
While the limits for the tax are specified in the Constitution of India, with an
expansion in economic activity and hence an increase in the number of people
reporting incomes above the prescribed threshold, the collection of tax under this head
is expected to increase. It may be pointed out that 24 states in India levy this tax and
use it to augment either state or local body revenues. The present ceiling for
profession tax is Rs. 2,500 per capita per year, with proposals to raise it to Rs. 7,500
per capita per year. The amount paid as profession tax is deductible as expenses in
computing taxable income for income tax purposes. Therefore the entire cost of the
levy is not borne by the taxpayers on whom the levy applies.
The estimates in this study suggest that Himachal Pradesh could generate
about Rs. 100 crore from this source. While this amount, by itself, may not
significantly augment the finances of the State, it would be a sizeable sum of money
to allocate to urban local bodies as is done in some of the other states. Collection of
profession tax at source is a common practice followed by some states where the
collection does not depend on individual’s voluntary compliance, thereby reducing
the cost of administration.
9.6 Water Levy for Hydropower Projects
Some states in India have introduced a levy on the use of water for hydel
power generation. Given the considerable importance of hydel power to the state, it is
useful to explore any mechanism for augmenting the revenues from this source.
However, such measures have to balance between the need for generating revenues
and the possibility of undermining the financial viability of the sector. Here it is
proposed that the state consider introducing a levy of Rs. 0.10 per cubic meter of
water used. This rate would be considerably lower than the rates in some of the other
states, and can potentially generate some revenue for the state.

138
Estimates in this study suggest that the state can expect to get revenue of about
Rs. 727 crore from this source. Since this could imply a reduction in the equity
component of receipts from the power generation companies, in chapter 6 the net gain
to the exchequer too is worked – it is expected that the net gain would be to the tune
of about Rs. 630 crore to the exchequer.
Luxury tax along with the two new taxes proposed could bring in an additional
Rs. 836 crore, i.e., about 32 percent of the own tax revenue of the states. Some
improvements in the performance of the major taxes through administration measures
would add to this base, thereby substantially addressing the revenue needs of the state.
9.7 Administration (Chapter 7)
Apart from the policy recommendations, the study has also undertaken an
assessment of the administrative structure of the Excise and Taxation Department in
the state. It is found that given the demands arising from the various taxes to be
administered by this department, the current staff strength is woefully inadequate.
Moreover, in the existing work process, procedural matters like issuing excises passes
take predominance over the more substantive work of assessment and audit which can
potentially raise additional revenues for the government. Chapter 7 provides a
methodology for assessing the workload for each level of official in the department
and therefrom, it is possible to identify the additionality in workforce required to meet
the needs of the department. The analysis in the chapter reveals that at least a three-
fold increase in manpower is required. That apart, the chapter also suggests some
improvements in the administrations which are summarised below.
1. Recruitment: Apart from the number of employees, it was felt that there is merit in
focusing on the following issues:
a. Skill set for new employees: At present, recruitment within the department has
not focused on any specific set of skills. By focusing on the skills required in
the tax department in the criteria for recruitment, the department can reduce its
training costs.

139
b. Stability of tenure: In the absence of an extensive system of computerization,
data capture and data mining, a lot of intelligence in the departments gets
embodied in the people working in the department. Frequent transfers tend to
reduce this accumulation of knowledge about the tax payers thereby
undermining the effectiveness of the tax department. Further, if politically
motivated transfers become the norm rather than the exception, the officials
would have no incentive to safeguard the interests of revenue.
2. Segregating the administration of the major taxes: Each of the major taxes places
considerable demand on the time of the officials and the kinds of work involved
are distinctly different. Further, the set of dealers are also different under the
different Acts.
a. For Himachal Pradesh, it would be desirable to have separate sets of officials
dealing with excise and VAT. This could be in the form of separate
departments or within the same department, as separate wings. Further, all
transport related taxes should be maintained in one department, as against the
present arrangement of some taxes being administered by the Excise and
Taxation department and others being administered by the Transport
department.
3. Functional specialization –At the present juncture, there is a predominance of area
based organisation of the department, with no focus on functions. Some functional
specialisation can once again reduce the training costs of the department
a. Routine functions like issuing of forms, accepting returns, accepting
registration forms, helping in filling challans, i.e., functions that do not
require a high level of skill can be separated. Some of these functions can
even be outsourced to retired employees of the department or to people
authorized by the department for these functions.
b. Deemed assessment should be made more comprehensive in coverage with
only limited number of cases being taken up for detailed assessment.
These assessments should be of a high quality in order to generate the
deterrent effect. For this purpose, the department might want to select and
train a small set of officials.
c. It is important that the function of assessment be assigned to people who
do not have the simultaneous responsibility of recovery and collection. If

140
these two functions are assigned to the same individual official, the official
would have an incentive to only assess as much to tax as the dealer is
willing to pay.
d. A separate appellate authority within the department will allow for speedy
and objective disposal of cases of appeal.
e. TRU to be revived: In the era of changing taxes, with the impending move
to GST, it is important for the state to have a set of people who dedicate
their efforts to maintaining up-to-date information for the purposes of
policy debate as also for identifying ways of improving collections through
new levies or through improved administration.
f. Training Institute: As emphasized earlier, there is need for training both
new recruits and for refresher programmes for existing officials. This
institution can also encourage a debate among officials about proposed
reform measures and help the department identify administrative measures
that can improve tax collection and compliance. It is important to
emphasize that such a training institute should possibly be located not in
Shimla but at a more central location so as to be accessible from all parts
of the state.
1. The government should think of giving some special allowance to those
posted in the training establishment. The training institute should be manned
by willing and competent people.
2. Chapter 7 suggests the various ways in which the training institute can
be used to improve the overall tax administration in the state.
4. Geographical organization: Within the geographical organization, it would be
useful to focus not just on revenue generation but on indicators of potential
revenue in order to determine the number of positions in different districts.
9.8 Goods and Services Tax (Chapter 8)
Apart from the discussion on existing taxes, chapter 8 provides a review of the
implications of a change to a Goods and Services Tax as proposed by the Union
government. While the timeline for such a change has not been firmed up, the change
can have significant implications for the state. The chapter highlights a few policy and

141
administrative issues that the policy makers in the state should focus on. In terms of
policy:
1. In order to reduce the uncertainty in policy, Himachal Pradesh should seek
clarity from the Empowered Committee on parameters that will be left free for
the states or the Union government, in terms of decision making. Ideally,
determination of these parameters should constitute a crucial part of the terms
of reference of the GST Council, proposed in the Constitutional Amendment
Bill.
2. The Rates of Tax: It appears that the proposed rates of tax on goods and
services may not provide adequate revenue to the state. The state could be
looking at some revenue loss, the extent depending on the adopted coverage of
services. In case the State supports the idea of a uniform rate throughout the
country, it would be prudent for the state to push for a higher standard rate.
Else, it would have to depend on compensation to be provided by the Union
government.
3. In preparation for the transition to GST, the state should make an effort to
identify, the potential tax payers as well as the potential tax base that it could
muster under a scheme of taxation of services. This could be a survey based
activity or an activity based on other secondary sources of information in the
state.
4. Since any compensation to the state for revenue loss would depend on the
revenues actually mobilized by the states in the period prior to the introduction
of GST, it is important for Himachal Pradesh to rapidly step up reforms in tax
administration so as to augment collections of taxes such as Luxury tax, which
are expected to be incorporated into the GST regime.
In terms of administration, there is uncertainty in the forms of administration
of GST. Viewed in the context of the state government’s urgent need to augment the
capacities in tax administration, there is need to maintain a degree of flexibility in the
proposed design so that new changes can easily be incorporated.
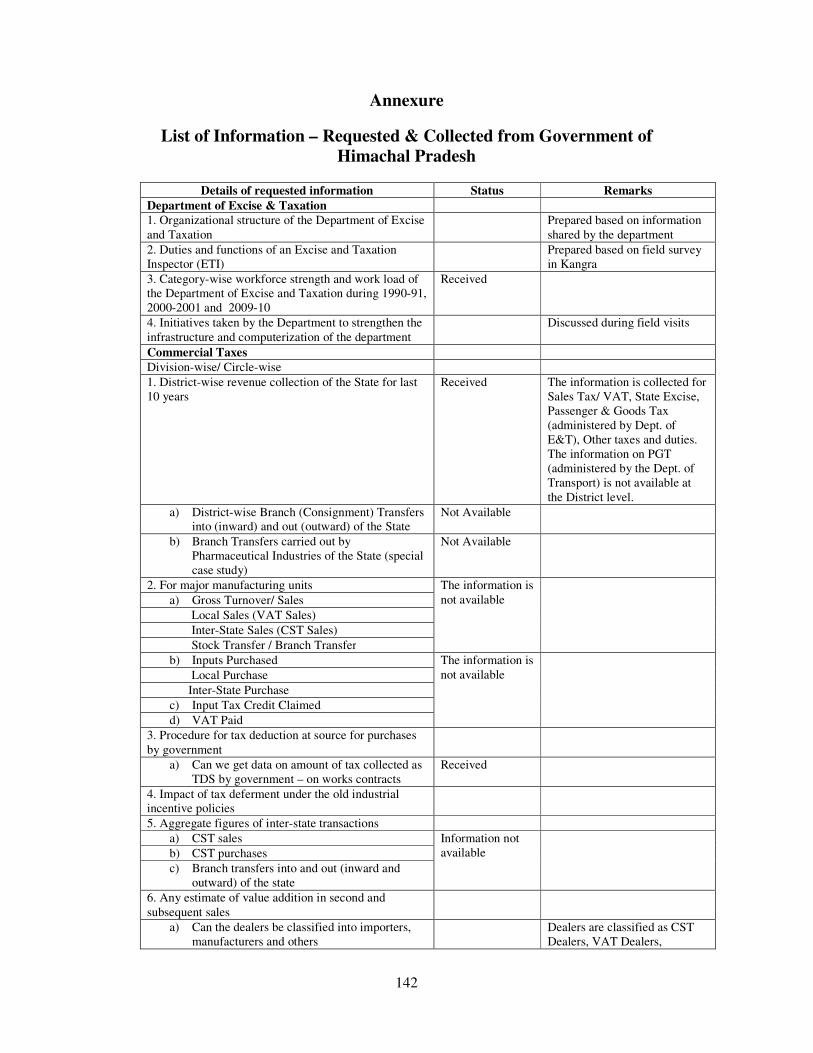
142
Annexure
List of Information – Requested & Collected from Government of
Himachal Pradesh
Details of requested information Status Remarks
Department of Excise & Taxation
1. Organizational structure of the Department of Excise
and Taxation
Prepared based on information
shared by the department
2. Duties and functions of an Excise and Taxation
Inspector (ETI)
Prepared based on field survey
in Kangra
3. Category-wise workforce strength and work load of
the Department of Excise and Taxation during 1990-91,
2000-2001 and 2009-10
Received
4. Initiatives taken by the Department to strengthen the
infrastructure and computerization of the department
Discussed during field visits
Commercial Taxes
Division-wise/ Circle-wise
1. District-wise revenue collection of the State for last
10 years
Received The information is collected for
Sales Tax/ VAT, State Excise,
Passenger & Goods Tax
(administered by Dept. of
E&T), Other taxes and duties.
The information on PGT
(administered by the Dept. of
Transport) is not available at
the District level.
a) District-wise Branch (Consignment) Transfers
into (inward) and out (outward) of the State
Not Available
b) Branch Transfers carried out by
Pharmaceutical Industries of the State (special
case study)
Not Available
2. For major manufacturing units The information is
not available
a) Gross Turnover/ Sales
Local Sales (VAT Sales)
Inter-State Sales (CST Sales)
Stock Transfer / Branch Transfer
b) Inputs Purchased The information is
not available
Local Purchase
Inter-State Purchase
c) Input Tax Credit Claimed
d) VAT Paid
3. Procedure for tax deduction at source for purchases
by government
a) Can we get data on amount of tax collected as
TDS by government – on works contracts
Received
4. Impact of tax deferment under the old industrial
incentive policies
5. Aggregate figures of inter-state transactions
a) CST sales Information not
available
b) CST purchases
c) Branch transfers into and out (inward and
outward) of the state
6. Any estimate of value addition in second and
subsequent sales
a) Can the dealers be classified into importers,
manufacturers and others
Dealers are classified as CST
Dealers, VAT Dealers,

143
Details of requested information Status Remarks
Manufacturers & Traders
(i) sales and purchases by these
categories
Information is not
available
7. Major item-wise tax collection for last 10 years Received
8. Rate-wise revenue collection for last 10 years Information not
available
21% of revenue comes from
5% tax rate and the rest comes
from 13.5% tax rate
9. Taxation of Petroleum Products
a) Rate of tax on petroleum products Available for
current year
Data for last 10 years not
available
b) Collection of revenue from petroleum
products
Received
10. Proposals to levy cess (if any) on Electricity Duty,
Inter-State Sales (CST)
No such proposal
11. Details of demands locked up in arrears Received
State Excise
1. Detailed discussion on the process of issuing fresh
contracts/licenses (settlement system)
a) Description of the steps involved in issuing
licenses
Discussed
b) How frequently is the license renewed and
how long is the process involved
Yearly
c) How many months in a year normally would
there be no licensed sellers in the state
No such incidence
(i) Check for last five years Not required
d) Are the rates of duty and license fees in
Himachal Pradesh comparable with those in
the neighbouring states – is there any study?
No such study
available
2. Consumption of liquor – any statistics on
consumption
District-wise data
on withdrawal is
available
a) Any reason to assume that the per capita
consumption in the state is less than in other
states?
No
3. District/ Division-wise status of settlement and MGQ
withdrawal for last 5 years
Settlement is cent
per cent
4. Details of demands locked up in arrears
Passenger and Good Tax
1. A copy of the Act & Rules Received
2. Tax rates and structure Received
3. District-wise Collection of Taxes Received
4. District-wise list of defaulters / tax dues Not available
5. Details of demands locked up in arrears Received
Transport Taxes
Department of Transport
1. Category-wise, Year-wise Number of Vehicles
Registered in Himachal Pradesh (as on 31 March 2002
to as on 31 March 2009)
Data Received
only for 2010 (as
on 31 march
2010)
For the purpose of
understanding the revenue
potential from various
categories of vehicles
2. Revenue Collection across Categories of Vehicles
for last Five Years (under Indian Motor Vehicle Act.,
State Motor Vehicle Taxation Act and Other Receipts)
Not Received -do-
3. Organizational structure of the Department Received
4. Post-wise, Category-wise Sanctioned, Filled Up and
Vacant posts of the Department of Transport
- Category wise workforce strength along with work
load
Not received The requested information was
expected to capture the increase
in workload without
corresponding increase in

144
Details of requested information Status Remarks
manpower
5. Year-wise number of MV Tax defaulters and amount
of tax involve therein
Note received
6. Tax category-wise details of demands locked up in
arrears (e.g., defaulters under Token Tax, Special Road
Tax, Permit Fee etc.) and amount recovered therefore.
Not Received
Data separately for the following two categories
7. Motor vehicles tax
a) What are the components of motor vehicles
tax – what are the levies imposed in addition
to road tax when a new vehicle is registered?
Received
b) Rate of tax – category wise Received
c) Division/ Circle-wise collection of revenue Not Received
d) District-wise, year-wise number of registered
motor vehicles (category-wise and not
cumulative) from March 31, 2001 to March
31, 2008
Not Received Information on category-wise
registered motor vehicles for
HP is received for 3 years
e) District-wise, year-wise number of motor
vehicle tax defaulters and amount of tax
receipt / withheld thereof
Not Received
f) Are there cross registrations: vehicles to be
registered in this state getting registered
elsewhere and vice versa?
Not Received
8. Passenger and goods tax: tax levied on vehicles that
transport goods and passengers – commercial vehicles
a) Any changes in the number of vehicles paying
tax over the years
No information
b) Rates of tax – category wise Received
3. A copy of the Recent Motor Vehicle Tax Act Received
4. Details of demands locked up in arrears Received
Department of Economics & Statistics
1. Gross State Domestic Product of Himachal Pradesh
(1999-2000 to 2006-07)
Received
2. Gross District Domestic Product of Himachal
Pradesh (1999-2000 to 2005-06)
Received
3. Economic Survey 2009-10 Received
4. The methodology adopted (in details) to estimate the
GSDP from the Construction sector
Not Received We requested the department
for a detail methodology to
understand the procedure of
computing contribution of the
Construction Sector in GSDP
2. GSDP data for Construction Sector at the
disaggregated level (e.g., Public Sector, Private Sector,
etc.) for 1999-2000 to 2009-10.
Not Received
3. The methodology adopted to estimate the GSDP
from the Hotels and Restaurants sector
Not Received We requested the department
for a detail methodology to
understand the procedure of
computing contribution of the
Construction Sector in GSDP
4. GSDP data for Hotels and restaurant Sector at the
disaggregated level (e.g., Public Sector, Private Sector
– Organized, Private Sector – unorganized etc.) for
1999-2000 to 2009-10.
Not Received
Directorate of Energy

145
Details of requested information Status Remarks
1. Free power, equity component and total hydropower
(electricity) received by the Govt. of Himachal Pradesh
from 2001-02 to 2007-08.
Not received Data shared for future
projections of hydropower
receivable under free power
and royalty components
Department of Finance (Budget Division)
1. Number of State and Central Government
Employees in Himachal Pradesh
A copy of the HP
Government
Public Sector
Undertakings is
shared with us
which contains
the required
information
2. Number of college and university teachers
3. Number of employees in the state PSUs
4. Number of professionals (doctors, chartered
accountants, lawyers, other professionals)
Information for
private
professionals are
not available