Embed Size (px)
Citation preview
Press releaseParis, 26 April 2016
1st quarter 2016 financial information
Revenue increase buoyed by solid commercial performance
Objective of restated EBITDA growth in 2016 confirmed
The Group’s commercial activity in the 1st quarter of 2016 was very positive across all regions,
both in very high-speed fixed and mobile broadband in Europe and in the development of
mobile services in Africa and the Middle East.
The Group had 20 million 4G customers at 31 March 2016 (up 2.0x year on year) and
2.226 million fibre customers (up 2.1x in one year on a comparable basis).
In France, fixed broadband recorded 96,000 net additional sales in the 1st quarter, led by fibre
(+115,000), which had 1.075 million customers at 31 March 2016. In mobile, net sales of
consumer convergent offers continued to be very strong (+209,000), with Sosh withstanding the
strong competitive pressure in Q1 at the low end of the market, adding +84,000 net sales. There
were 8.7 million 4G customers at 31 March 2016, an increase of 92% year on year.
In Spain, fibre rose strongly with +211,000 net additions in the 1st quarter and 1.020 million
customers at 31 March 2016 (up 3.2x in one year). 4G also increased sharply, with 5.8 million
customers at 31 March 2016.
In Poland, net sales of mobile contracts remained high in the 1st quarter (+214,000). Similarly,
Belgium recorded an increase in mobile contracts1 for the fourth consecutive quarter.
In Africa and the Middle East, net mobile sales rebounded significantly in the 1st quarter
(+1.6 million customers) after slowing in the 4th quarter of 2015. Africa and the Middle East had
111.9 million mobile customers at 31 March 2016 up 2.8% on a comparable basis, and Orange
Money had 17.8 million customers (+34%).
First quarter 2016 revenues (10.009 billion euros) grew for the third consecutive quarter, up
0.6%, after rising 0.1% in the 4th quarter of 2015 and 0.5% in the 3rd quarter (comparable
basis). Growth resumed in Spain (+1.8%) after nine consecutive quarters of decline, while the
Belgium and Luxembourg segment rose 2.3% as in the 4th quarter of 2015, and the decline in
mobile services in Poland was limited to 2.1%. The Enterprise segment increased 2.1%, led by
IT and integration services, while growth continued to be strong in Africa and the Middle East,
rising 4.4% in the 1st quarter. Meanwhile, revenues in France declined 0.7%, mostly due to the
increased drop in national roaming.
Underlying operating performance increasing: excluding the impact of the employee
shareholding operation2, 1st quarter restated EBITDA rose 0.3% and the restated EBITDA
margin fell 0.1 percentage points. Restated EBITDA for the 1st quarter of 2016 was
2.569 billion euros, a decrease of 1.6% on a comparable basis, while the restated EBITDA
margin (25.7%) declined 0.6 percentage points. The Group confirms the objective for the full
year of higher restated EBITDA in 2016 than in 2015 on a comparable basis.
1 Excluding machine-to-machine. 2 Ambition 2016 programme.
2
CAPEX (1.457 billion euros in the 1st quarter of 2016) rose 10.4% on a comparable basis, in line
with the Essentiels2020 strategic plan, representing 14.6% of revenues. CAPEX on fibre rose
sharply, mainly in France. CAPEX related to mobile networks continued to be strong, in
particular with the continued deployment of 4G and 4G+. At the same time, the programme to
improve the customer experience expanded with the opening of new Smart Stores.
Commenting on the publication of the results for the 1st quarter of 2016, Stéphane Richard,
Chairman and CEO of the Orange Group, stated:
"For the third consecutive quarter, Orange revenues have grown, again validating our strategy of
differentiation through quality and investment. This is due to the strong commercial performance
in all Group countries, particularly France, Spain, Belgium, Romania and the Africa and Middle
East region as well as in the Enterprise market.
These good results are the fruit of our sustained investment efforts in very high-speed fixed and
mobile broadband, in line with our Essentials2020 plan.
In Europe, we doubled the number of our 4G customers in just one year, reaching 20 million. We
also reaffirmed our status as the leading fibre operator in Europe where we more than doubled the
number of fibre customers to in excess of 2.2 million, principally driven by France and Spain with
the successful integration of Jazztel.
During the quarter, we also continued the development of our operations in Africa by becoming
an operator in Liberia, consolidating our presence in the Democratic Republic of the Congo and
investing in Africa Internet Group, the e-commerce leader on the continent.
Very recently, we laid the foundations for our future mobile banking services by signing an
agreement that will allow us to take a stake of 65% in Groupama Banque, which will become
Orange Bank."
3
Key figures
1st quarter 2016
1st quarter 2015
comparable
basis
1st quarter 2015
historical
basis
change change
comparable
basis
historical
basis
In millions of euros
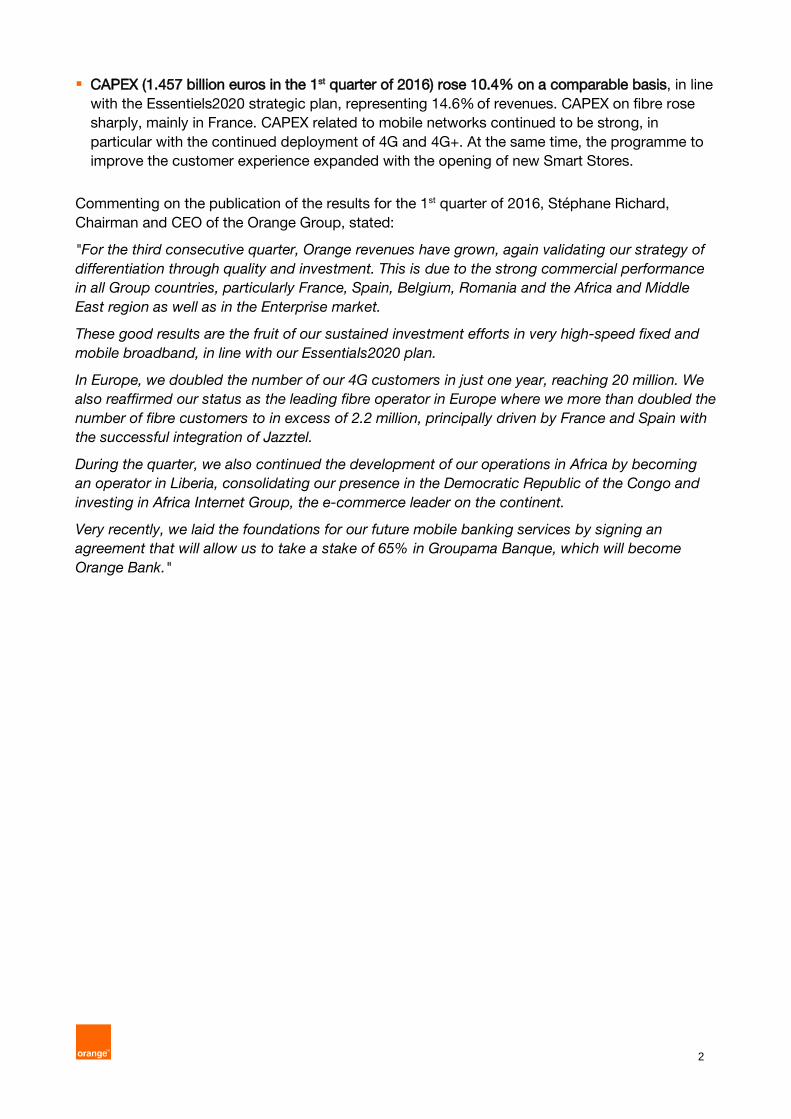
Revenues 10 009 9 950 9 672 0.6 % 3.5 %
Of which:
France 4 691 4 725 4 722 (0.7)% (0.7)%
Europe 2 534 2 524 2 324 0.4 % 9.1 %
Spain 1 189 1 168 928 1.8 % 28.2 %
Poland 642 670 699 (4.2)% (8.1)%
Belgium & Luxembourg 309 302 302 2.3 % 2.3 %
Central European countries 395 384 396 2.8 % (0.1)%
Intra-Europe eliminations (1) (1) (1) - -
Africa & Middle East 1 271 1 218 1 124 4.4 % 13.1 %
Enterprise 1 583 1 550 1 546 2.1 % 2.4 %
International Carriers & Shared Services 454 441 462 3.1 % (1.8)%
Intra-Group eliminations (525) (508) (506) - -
Restated EBITDA* 2 569 2 611 2 521 (1.6)% 1.9 %
As % of revenues 25.7 % 26.2 % 26.1 % (0.6)pt (0.4)pt
CAPEX (excluding licenses) 1 457 1 320 1 190 10.4 % 22.4 %
As % of revenues 14.6 % 13.3 % 12.3 % 1.3 pt 2.3 pt
* EBITDA restatements are described in appendix 2.
Henceforth, restated EBITDA excludes all income from the disposal of shares. The impact on restated EBITDA on both a comparable
and an historical basis was +5 million euros for the 1st quarter of 2015, -16 million euros for the 1st half of 2015, and -8 million euros for
the full year of 2015.
*
* *
The Board of Directors of Orange SA met on 25 April 2016 and examined the Group's results at
31 March 2016.
The financial data and comparable basis data in this press release are unaudited.
More detailed information is available on the Orange website:
www.orange.com

4
Comments on key Group figures
Revenues
The Orange Group revenues were 10.009 billion euros in the 1st quarter of 2016, an increase of
0.6% on a comparable basis (+59 million euros), confirming the resumption of growth observed in
the two previous quarters (+0.1% in the 4th quarter of 2015 and +0.5% in the 3rd quarter). The
Group’s mobile services rose 0.9% in the 1st quarter of 2016 while fixed broadband services rose
4.7%, on a comparable basis.
In France, revenues declined 0.7% in the 1st quarter of 2016, mostly related to the more
pronounced decline of national roaming. Excluding that impact, the mobile services trend
improved in relation to the 4th quarter of 2015. At the same time, fixed broadband growth
accelerated, led by fibre and TV content.
In the Europe zone, revenues rose 0.4% in the 1st quarter after falling 1.0% in the 4th quarter of
2015:
- in Spain, revenue growth resumed (+1.8% in the 1st quarter of 2016) after nine consecutive
quarters of decline, led by mobile services (+4.4%) and fixed broadband (+8.8%);
- in Poland, the decline was limited to 4.2% in the 1st quarter of 2016. The mobile services trend
(-2.1%) was comparable to that of the 4th quarter of 2015, and mobile equipment sales
continued to have strong growth;
- Belgium & Luxembourg: revenues rose 2.3% in the 1st quarter, led by mobile services which
climbed 2.9%;
- the Central European countries grew 2.8% in the 1st quarter. Growth in Romania remained
strong (+6.5%) and the trend improved in Slovakia with a modest decrease of 1.6%, while
Moldova was down 6.5%.
In Africa and the Middle East, mobile services rose 5.1% in the 1st quarter of 2016 after rising
4.3% in the 4th quarter of 2015, principally led by Côte d’Ivoire, Mali, Egypt and Guinea.
Enterprise segment: revenues rose 2.1% in the 1st quarter of 2016, confirming the improvement
observed over the previous three quarters. IT and integration services increased strongly (+8.6%),
led by cloud computing and application services.
Customer base growth
The Group had 191.0 million mobile customers at 31 March 2016, a year-on-year increase of
2.9% on a comparable basis (+5.3 million net additions). Africa and the Middle East had
111.9 million mobile customers at 31 March 2016, an increase of 2.8% on a comparable basis
(+3.0 million net additions).
In France, mobile contract customers rose 9.7% to 24.6 million, representing 86% of the mobile
customer base at 31 March 2016 (+3.8 percentage points in one year). In the Europe zone, mobile
contracts were up 6.4% year on year on a comparable basis to 31.7 million customers at 31
March 2016, representing 63% of the mobile customer base at that date (+2.6 percentage points
in one year). The increase in contract customers in the Europe zone mainly related to Spain and
Poland.
There were 17.8 million fixed broadband customers at 31 March 2016, a year-on-year increase of
2.9% on a comparable basis with 408,000 net additions in France and 202,000 in Spain. Fixed
broadband subscribers included 2.226 million fibre subscribers at 31 March 2016 (up 2.1x in one
year on a comparable basis), with 1.075 million in France and 1.020 million in Spain.
5
Digital TV services, over the Internet or by satellite, had 8.2 million customers at 31 March 2016, a
year-on-year increase of +10.4% on a comparable basis.
Restated EBITDA
Restated EBITDA was 2.569 billion euros in the 1st quarter of 2016, a decrease of 1.6% on a
comparable basis, while the restated EBITDA margin was 25.7%, down 0.6 percentage points in
relation to the 1st quarter of 2015.
Restated EBITDA in the 1st quarter of 2016 was impacted in particular by the employee
shareholding operation. Excluding that component (50 million euros), restated EBITDA rose 0.3%
in the 1st quarter of 2016 with the restated EBITDA margin down 0.1 percentage points.
Operating costs in the 1st quarter of 2016 also included the impact in Belgium of the adoption of
the IFRIC21 accounting standard3 and the pylon tax increase, for a total of 19 million euros. The
combination of other costs showed a modest increase of 32 million euros: 16 million euros related
to UEFA Euro 2016, where Orange is an official partner, and increased content costs, particularly
in Spain.
Other expenses were generally stable principally as a result of actions taken in connection with
the Explore2020 plan to improve operational efficiency.
CAPEX
CAPEX was 1.457 billion euros in the 1st quarter of 2016, an increase of 10.4% in relation to the
1st quarter of 2015 on a comparable basis. The ratio of CAPEX to revenues was 14.6%, an
increase of 1.3 percentage points compared with the 1st quarter of 2015.
Investments in fibre continued to rise strongly (+30% in relation to the 1st quarter of 2015 on a
comparable basis). At 31 March 2016, 5.5 million households had fibre connectivity in France, a
year-on-year increase of 39%. Spain had a total of 7.4 million households with fibre connectivity
and confirmed its goal of 14 million households with connectivity by the end of 2020. In Poland,
the fibre deployment programme accelerated; 818,000 households had fibre connectivity at 31
March 2016.
In 4G, the Group strengthened its leadership in France with 8,716 sites in service at 31 March
2016 providing coverage to 81% of the population; 4G+ deployment continued with 3,446 sites in
service representing 40% of the 4G sites. At 31 March 2016, 4G coverage reached 87% of the
population in Spain, 89% in Poland, 99% in Belgium, 72% in Romania, 65% in Slovakia and 85%
in Moldova. In addition, 4G is deployed in Botswana, Jordan, Morocco, Mauritius, Cameroon,
Guinea-Bissau and, more recently, Côte d’Ivoire.
Programmes to improve the customer experience continued, particularly in France where since
the month of February the Paris-Lyon line of the high-speed TGV has 3G and 4G coverage. On
the motorways, network quality was improved with eight motorways now covered by 3G+ or 4G.
Modernisation of the stores continued with the deployment of the new Smart Store concept in
several countries: France, Spain (first opening), Poland, Romania (five stores now open), Slovakia
(first opening) and Egypt (first opening).
With respect to investments in submarine cables, the SEA-ME-WE 5 cable (Southeast Asia /
Middle East / Western Europe) reached land in France at Seyne-sur-Mer on 1 March for
connection to Orange’s submarine cable station in Toulon. It will link France to Singapore and
serve 17 countries. The cable is set to be commissioned in the 2nd half of 2016.
3 The IFRIC21 accounting standard recognises tax expenses as from January 1st of the year; this change in accounting method is
neutral for the full year.

6
Changes in asset portfolio
In accordance with the agreement signed in February 2015, Orange and Deutsche Telekom
finalised the sale in January 2016 of 100% of EE, their joint venture in the United Kingdom, to BT
Group.
On 6 April 2016, the Group announced that it had acquired 100% of Cellcom, Liberia’s leading
mobile operator in number of subscribers4, through its subsidiary Orange Côte d’Ivoire.
Less than three months after signing an agreement with the Millicom group, Orange announced
on 21 April 2016 that it had acquired 100% of the mobile operator Tigo in the Democratic
Republic of the Congo (DRC), which represents strong growth potential for the Group.
The process of Orange’s acquisition of Airtel’s subsidiaries in Burkina Faso and Sierra Leone
continues. Orange will acquire 100% of the shares of both companies and will carry out these
transactions in partnership with its subsidiaries in Côte d’Ivoire and Senegal.
The Group strengthened its presence in Africa and the Middle East with the announcement on 5
April 2016 of the acquisition of an interest in Africa Internet Group, the e-commerce leader on the
continent, which will enable Orange to benefit from the rapid development of the e-commerce
market in Africa, particularly in the 12 countries where the two groups are present.
Orange also announced, on 15 April 2016, the acquisition through Orange Business Services of
100% of Lexsi, a European leader in cyber security specialising in Threat Intelligence Services.
On 22 April 2016, Orange and Groupama announced they had signed an agreement to develop
an innovative, 100% mobile banking service. The agreement follows exclusive negotiations
between the two groups since January and will take the form of Orange’s acquisition of 65% of
the share capital of Groupama Banque, which will then become Orange Bank.
2016 outlook
Orange confirms that restated EBITDA will be higher for the full year 2016 than in 2015 on a
comparable basis. This objective will be supported by continued efforts to reduce the cost
structure.
The Group also confirms the objective of a ratio of net debt to EBITDA of around 2x in the
medium term to preserve Orange’s financial strength and investment capacity.
Within this framework, the Group is pursuing a policy of selective acquisitions by concentrating on
markets in which it is already present.
The Group further confirms the payment of a dividend of 0.60 euros per share for 20155. An
interim dividend for 2015 of 0.20 euros per share was paid on 9 December 2015 and the balance
of 0.40 euros per share will be paid on 23 June6.
The Group plans to pay a dividend of 0.60 euros per share for 20165. An interim dividend for 2016
of 0.20 euros per share should be paid in December.
4 At the end of December 2015. 5 Subject to the approval of the Annual General Meeting of shareholders. 6 The ex-dividend date is set at 21 June 2016 and the record date at 22 June 2016.
7
Review by operating segment
France
In France, revenues declined 0.7% in the 1st quarter of 2016, mostly related to a more
pronounced downturn in national roaming.
Mobile services declined 2.4% in the 1st quarter of 2016, a pace comparable to that of the full
year of 2015 (-2.2%). Excluding national roaming, mobile services improved, reflected by the
evolution in ARPU, which saw a limited decline of -0.7% in the 1st quarter of 2016 after falling
1.3% in the 4th quarter of 2015. The impact of the rapid growth of SIM-only offers (55% of
consumer contracts at 31 March 2016, versus 39% one year earlier) was offset by the favourable
impact of continuing growth of the contract customer base despite strong competitive pressures
in the consumer market in the 1st quarter of 2016.
Net sales of Open offers continued to be high, rising 182,000 after increasing 233,000 in the 4th
quarter of 2015. Similarly, Sosh had an additional 84,000 net sales in the 1st quarter after rising
121,000 in the 4th quarter of 2015. In all, the contract customer base7 (20.305 million customers)
increased 2.7% year on year. In parallel, there were 8.7 million 4G customers at that same date
(x1.9 in one year).
Fixed services were slightly improved in the 1st quarter of 2016 (+0.1%) after a decrease of 0.9%
in the 4th quarter of 2015. The growth of fixed broadband services accelerated (+4.2% in the 1st
quarter of 2016 after rising 3.2% in the 4th quarter of 2015), led by customer base growth and the
increasing share of fibre and premium offers (Play and Jet offers). The fixed broadband customer
base held 10.830 million subscribers at 31 March 2016 (+3.9% in one year). It included 1.075 fibre
subscribers at that date, versus 638,000 one year earlier (+69%). Meanwhile, convergent offers
represented 49.6% of the fixed broadband customer base at 31 March 2016, versus 45.9% one
year earlier.
Traditional telephony continued its downward trend (-9.4%) in the 1st quarter of 2016, while fixed
services to carriers rose 1.5%.
Europe
The Europe zone’s revenues climbed 0.4% in the 1st quarter of 2016 after falling 1.0% in the 4th
quarter of 2015 on a comparable basis.
The improvement was mainly in Spain, with growth of 1.8% in the 1st quarter of 2016 after a
decline of 0.7% in the 4th quarter of 2015. The Belgium & Luxembourg segment rose 2.3%,
continuing the positive trend of the previous quarters. Similarly, the Central European countries
increased 2.8% in the 1st quarter of 2016, led by Romania, while the revenue decline in Poland
slowed (-4.2% after falling 5.1% in the 4th quarter of 2015).
Across the Europe zone, mobile services revenues rose 2.3% in the 1st quarter of 2016 after
remaining stable in the 4th quarter of 2015. They benefitted notably from the strong growth of the
contract customer base (+6.4% at 31 March 2016 year on year on a comparable basis). At the
same time, fixed broadband revenue growth accelerated (+5.7% in the 1st quarter of 2016 after
rising 3.6% in the 4th quarter of 2015), led by the rapid growth of fibre in Spain.
7 Excluding machine-to-machine.
8
Spain
Revenue growth resumed in Spain after nine consecutive quarters of decline. The 1st quarter of
2016 saw an increase of 1.8% after declines of 0.7% in the 4th quarter of 2015, 1.7% in the 3rd
quarter and 3.8% in the 1st half (comparable basis).
This change reflects the gradual recovery of mobile services, which rose 4.4% in the 1st quarter
of 2016 after rising 0.7% in the 4th quarter of 2015, following decreases of 2.7% in the 3rd
quarter and 8.1% in the 1st half. It benefitted in particular from the new richer contract offers
launched at the end of 2015 in connection with 4G deployment, which helped improve ARPU.
There were 5.8 million 4G customers at 31 March 2016, a doubling of the 4G customer base in
one year.
Contracts customer numbers continued to grow (12.2 million customers at 31 March 2016, a
year-on-year increase of 5.6% on a comparable basis), while prepaid offers (3.2 million
customers) remained stable year on year (-0.6%).
In addition, revenues with the MVNOs and from network sharing rose sharply in the 1st quarter of
2016 (+35.7% and +28.0% respectively).
Fixed services rose 5.0% in the 1st quarter of 2016 on a comparable basis. Revenue growth in
fixed broadband accelerated, reaching 8.8% in the 1st quarter of 2016 after rising 6.6% in the 4th
quarter of 2015.
Fixed broadband had a total of 3.797 million customers at 31 March 2016, a year-on-year
increase of 5.6% on a comparable basis. In particular, fibre grew very rapidly (up 3.2x in one year)
with 1.020 million customers at that date representing 27% of the fixed broadband customer
base.
Internet TV services (IPTV) also grew quickly, with 365,000 customers at 31 March 2016 (up 2.8x
in one year), led by content offers, in particular football championship broadcasts. Meanwhile,
convergent offers represented 81.7% of the fixed broadband customer base at 31 March 2016
(+3.7 percentage points in one year).
Poland
Revenues in Poland posted a decline limited to 4.2% in the 1st quarter of 2016 on a comparable
basis, after falling 5.1% in the 4th quarter of 2015. They benefitted in particular from stronger
growth in mobile equipment sales (+39.6% in the 1st quarter of 2016), led by sales under the
instalment payment plan.
Mobile services declined 2.1% in the 1st quarter of 2016, a pace comparable to that of the 4th
quarter of 2015 (-1.9%). Commercial momentum continued to be very strong, with 214,000 net
contract sales over the quarter. The total contract customer base grew 11.0% year on year
(+849,000 net sales). Mobile broadband services (contract and prepay Internet dongles) increased
sharply (+40% year on year), and 4G had 2.4 million customers at 31 March 2016 (up 2.6x in one
year). Meanwhile, the number of convergent offers rose 30% year on year, with 766,000
customers at 31 March 2016.
Fixed services fell 8.7% in the 1st quarter of 2016 after declining 8.5% in the 4th quarter of 2015.
The erosion of the broadband customer base (2.079 million customers at 31 March 2016) was
limited to 5.4% year on year (after declining 6.1% at the end of December 2015), thanks to the
rapid development of offers for very high-speed broadband8, which had a total of 366,000
customers at 31 March 2016 (+77% year on year), including 27,000 fibre customers.
8 Fibre and VDSL subscribers.
9
Fixed broadband revenues in the 1st quarter of 2016 were nevertheless impacted by ADSL price
reductions, falling 6.9% in the 1st quarter of 2016 after declining 5.0% in the 4th quarter of 2015.
Traditional telephony declined 12.6% after falling 11.4% the 4th quarter of 2015.
Belgium & Luxembourg
Revenues in Belgium and Luxembourg confirmed the resumption of growth begun in the 2nd half
of 2015 with an increase of 2.3% in the 1st quarter of 2016, the same as that of the 4th quarter of
2015. The increase in the 1st quarter of 2016 was generated by mobile services, which rose
2.9%.
The mobile contract customer base9 (2.3 million customers at 31 March 2016) increased 2.9%
year on year, representing 65,000 net contract additions, of which 11,000 were added in the 1st
quarter of 2016 (8,400 in Belgium), and rapid growth continued in 4G with 1.1 million customers at
31 March 2016 (x1.8 in one year).
Contract ARPU in Belgium rose 3.3% at 31 March 2016, led by the success of richer offers and
the development of data services.
The MVNO customer base (1.8 million customers at 31 March 2016) increased 6.2% year on year.
Ahead of the launch of the Orange brand in Belgium, planned for 9 May, Mobistar announced on
15 February of this year the gradual geographic deployment of convergent offers using regulated
access to cable networks. Mobistar already had more than 5,000 pilot users of these new offers
at the end of March 2016.
Central European countries
Revenues in the Central European countries rose 2.8% in the 1st quarter of 2016 on a
comparable basis, a pace similar to that of the 4th quarter of 2015 (+2.9%).
Revenues in Romania grew 6.5% in the 1st quarter of 2016, led by an upturn in mobile services
and, to a lesser extent, by increased fixed satellite television services and mobile equipment
sales. Following the signature of a network sharing agreement with Romania Telekom, Orange will
soon be able to launch very high-speed convergent offers in urban areas.
In Slovakia, the revenue downturn was limited to 1.6%, thanks to the favourable trend in mobile
services and the growth of fixed services (fixed broadband and carrier services). The decline in
Moldova continued (-6.5% in the 1st quarter of 2016), reflecting decreased incoming international
traffic and the slowing of mobile equipment sales.
The Central European countries had a mobile customer base of 15.0 million customers at 31
March 2016. Contract customer numbers (7.9 million customers) increased 4.5% year on year on
a comparable basis, representing more than half (52.7%) of the mobile customer base at 31
March 2016 (+3.5 percentage points year on year). At that date, Slovakia had 156,000 fixed
broadband customers (+14.1% year on year). The number of satellite television services
customers in Romania (294,000 at 31 March 2016) rose 54.5% in one year.
Africa & Middle East
Revenues in the Africa & Middle East segment rose 4.4% in the 1st quarter of 2016 on a
comparable basis. Mobile services increased 5.1%, led by Côte d’Ivoire, Mali, Egypt and Guinea.
In particular, data services rose sharply (+42% in relation to the 1st quarter of 2015) with the
deployment of 3G and 4G. Seven countries in the Africa & Middle East segment are already
9 Excluding machine-to-machine contracts.
10
marketing 4G. At the same time, Orange Money revenues rose 53%. Orange Money had 17.8
million customers at 31 March 2016, an increase of 34% year on year.
The mobile customer base comprised 111.9 million customers at 31 March 2016, a year-on-year
increase of 2.8% on a comparable basis (+3.0 million customers). The principal contributors to
customer base growth were Côte d'Ivoire, Guinea and Cameroon.
Enterprise
Revenue growth resumed in the Enterprise segment in the 1st quarter of 2016 (+2.1%) after falling
0.4% in the 4th quarter of 2015 (comparable basis). Revenues benefitted from the slowing decline
of legacy voice and data services, the recovery in IT and integration services, and a favourable
2015 base effect, the 1st quarter of last year having been impacted by a downturn in revenues
(-3.4%).
Voice services fell slightly in the 1st quarter of 2016 (-2.3%), reflecting the slowdown in the
decline of traditional telephony, while other voice services (voice over IP, customer relations and
audioconferencing services) grew in relation to the 1st quarter of 2015.
Data services also rose in the 1st quarter of 2016 (+0.4%), with a good international performance.
Revenues from IPVPN subscribers rose 2.3%, while the decline of legacy data services slowed.
IT and integration services rose sharply (+8.6% in the 1st quarter of 2016 after rising 3.6% in the
4th quarter of 2015), particularly internationally (Americas and Asia-Pacific). The recovery was also
tied to cloud computing, which had growth of 20.9% in the 1st quarter of 2016 after rising 7.0% in
the 4th quarter of 2015.
International Carriers & Shared Services
Revenues in the International Carriers and Shared Services segment rose 3.1% in the 1st quarter
of 2016 on a comparable basis, led by the growth of the Viaccess subsidiary with the TV decoder
access card replacement programme, revenues from the laying and servicing of submarine cables
and, to a lesser extent, increased content services, in particular OCS and Orange Studio.
11
Schedule of upcoming events
26 July 2016: 1st half 2016 results
Contacts
press: +33 1 44 44 93 93
Jean-Bernard Orsoni
Tom Wright
Olivier Emberger
Caroline Simeoni
financial communications: +33 1 44 44 04 32
(analysts and investors)
Patrice Lambert-de Diesbach
Constance Gest
Luca Gaballo
Caroline Maury
Samuel Castelo
Didier Kohn
All press releases are available on the following websites:
www.orange.com; www.orange.es; www.orange-ir.pl; www.mobistar.be; www.orange-business.com
Disclaimer
This press release contains forward-looking statements about Orange. Although we believe these statements are based on reasonable
assumptions, they are subject to numerous risks and uncertainties, including matters not yet known to us or not currently considered
material by us, and there can be no assurance that anticipated events will occur or that the objectives set out will actually be achieved.
Important factors that could cause actual results to differ from the results anticipated in the forward-looking statements include,
among others: the success of Orange’s strategy, particularly its ability to maintain control over customer relations when facing
competition with OTT players, Orange’s ability to withstand intense competition in mature markets and business activities, its ability to
capture growth opportunities in emerging markets and the risks specific to those markets, fiscal and regulatory constraints and
changes, and the results of litigation regarding regulations, competition and other matters, the success of Orange's French and
international investments, joint ventures and strategic partnerships in situations in which it may not have control of the enterprise, and
in countries presenting additional risk, risks related to information and communications technology systems generally, including
networks or software failures due to cyberattacks, damage to networks caused by natural disasters, voluntary acts or other reasons,
loss or disclosure to third parties of customers data, health concerns surrounding telecommunications equipment and devices,
Orange's credit ratings, its ability to access capital markets and the state of capital markets in general, exchange rate or interest rate
fluctuations, and changes in assumptions underlying the carrying amount value of certain assets and resulting in their impairment.
More detailed information on the potential risks that could affect our financial results will be found in the Registration Document and in
the annual report on Form 20-F filed on April 4, 2016 with, respectively, the French Autorité des Marchés Financiers (AMF) and the U.S.
Securities and Exchange Commission. Forward-looking statements speak only as of the date they are made. Other than as required by
law (in particular pursuant to sections 223-1 and seq. of the General Regulations of the AMF), Orange does not undertake any
obligation to update them in light of new information or future developments.
12
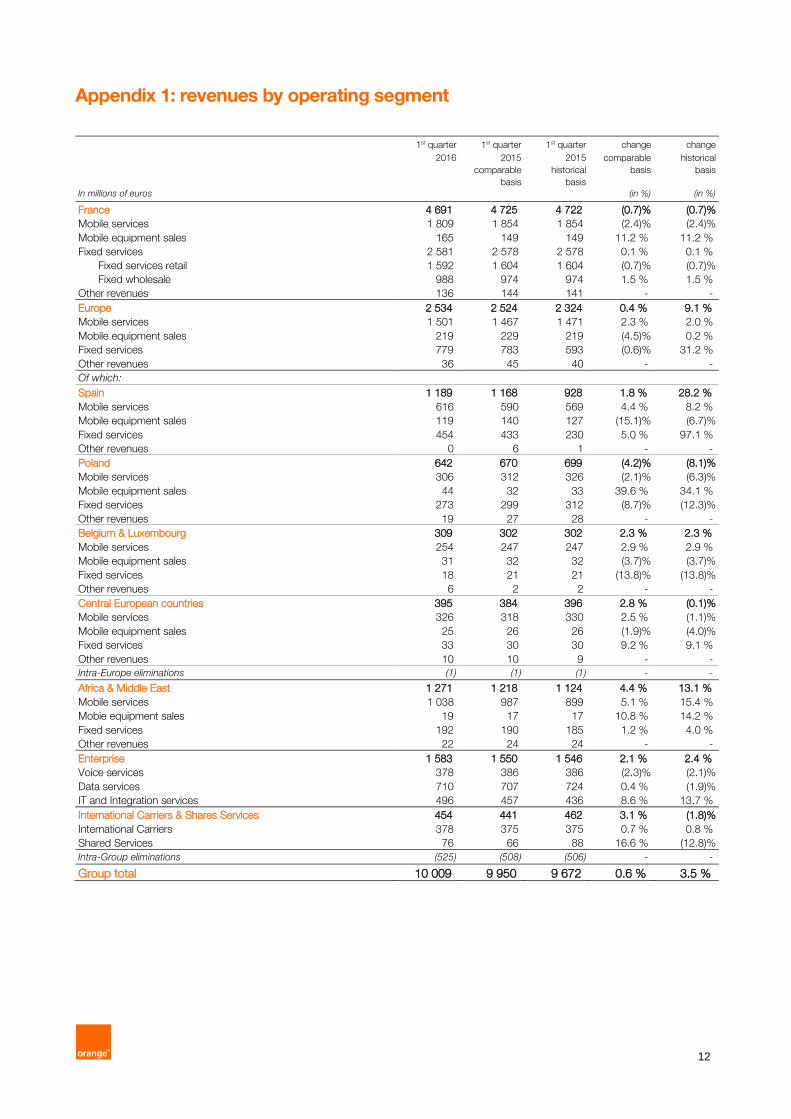
Appendix 1: revenues by operating segment
1st quarter 1st quarter 1st quarter change change
2016 2015 2015 comparable historical comparable
basis
historical
basis
basis basis
In millions of euros (in %) (in %)
France 4 691 4 725 4 722 (0.7)% (0.7)%
Mobile services 1 809 1 854 1 854 (2.4)% (2.4)%
Mobile equipment sales 165 149 149 11.2 % 11.2 %
Fixed services 2 581 2 578 2 578 0.1 % 0.1 %
Fixed services retail 1 592 1 604 1 604 (0.7)% (0.7)%
Fixed wholesale 988 974 974 1.5 % 1.5 %
Other revenues 136 144 141 - -
Europe 2 534 2 524 2 324 0.4 % 9.1 %
Mobile services 1 501 1 467 1 471 2.3 % 2.0 %
Mobile equipment sales 219 229 219 (4.5)% 0.2 %
Fixed services 779 783 593 (0.6)% 31.2 %
Other revenues 36 45 40 - -
Of which:
Spain 1 189 1 168 928 1.8 % 28.2 %
Mobile services 616 590 569 4.4 % 8.2 %
Mobile equipment sales 119 140 127 (15.1)% (6.7)%
Fixed services 454 433 230 5.0 % 97.1 %
Other revenues 0 6 1 - -
Poland 642 670 699 (4.2)% (8.1)%
Mobile services 306 312 326 (2.1)% (6.3)%
Mobile equipment sales 44 32 33 39.6 % 34.1 %
Fixed services 273 299 312 (8.7)% (12.3)%
Other revenues 19 27 28 - -
Belgium & Luxembourg 309 302 302 2.3 % 2.3 %
Mobile services 254 247 247 2.9 % 2.9 %
Mobile equipment sales 31 32 32 (3.7)% (3.7)%
Fixed services 18 21 21 (13.8)% (13.8)%
Other revenues 6 2 2 - -
Central European countries 395 384 396 2.8 % (0.1)%
Mobile services 326 318 330 2.5 % (1.1)%
Mobile equipment sales 25 26 26 (1.9)% (4.0)%
Fixed services 33 30 30 9.2 % 9.1 %
Other revenues 10 10 9 - -
Intra-Europe eliminations (1) (1) (1) - -
Africa & Middle East 1 271 1 218 1 124 4.4 % 13.1 %
Mobile services 1 038 987 899 5.1 % 15.4 %
Mobie equipment sales 19 17 17 10.8 % 14.2 %
Fixed services 192 190 185 1.2 % 4.0 %
Other revenues 22 24 24 - -
Enterprise 1 583 1 550 1 546 2.1 % 2.4 %
Voice services 378 386 386 (2.3)% (2.1)%
Data services 710 707 724 0.4 % (1.9)%
IT and Integration services 496 457 436 8.6 % 13.7 %
International Carriers & Shares Services 454 441 462 3.1 % (1.8)%
International Carriers 378 375 375 0.7 % 0.8 %
Shared Services 76 66 88 16.6 % (12.8)%
Intra-Group eliminations (525) (508) (506) - -
Group total 10 009 9 950 9 672 0.6 % 3.5 %
13
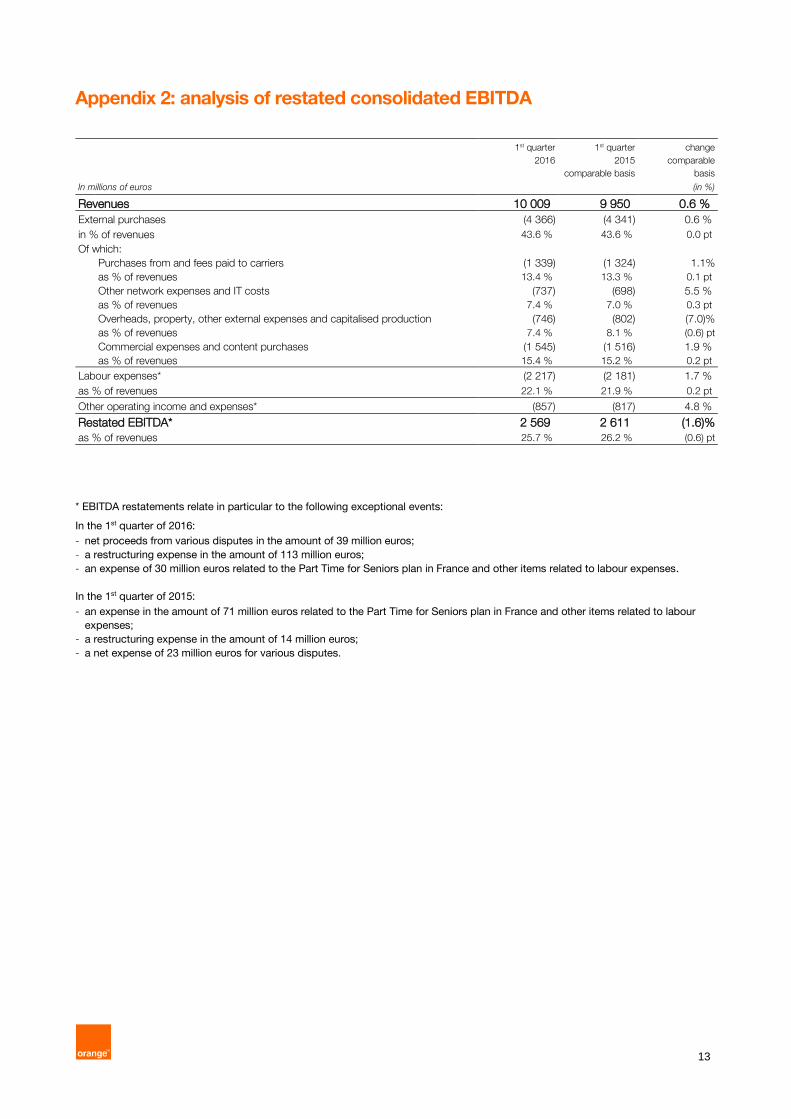
Appendix 2: analysis of restated consolidated EBITDA
1st quarter 1st quarter change 2016 2015 comparable comparable basis basis
In millions of euros (in %) Revenues 10 009 9 950 0.6 %
External purchases (4 366) (4 341) 0.6 %
in % of revenues 43.6 % 43.6 % 0.0 pt
Of which:
Purchases from and fees paid to carriers (1 339) (1 324) 1.1%
as % of revenues 13.4 % 13.3 % 0.1 pt
Other network expenses and IT costs (737) (698) 5.5 %
as % of revenues 7.4 % 7.0 % 0.3 pt
Overheads, property, other external expenses and capitalised production (746) (802) (7.0)%
as % of revenues 7.4 % 8.1 % (0.6) pt
Commercial expenses and content purchases (1 545) (1 516) 1.9 %
as % of revenues 15.4 % 15.2 % 0.2 pt
Labour expenses* (2 217) (2 181) 1.7 %
as % of revenues 22.1 % 21.9 % 0.2 pt
Other operating income and expenses* (857) (817) 4.8 %
Restated EBITDA* 2 569 2 611 (1.6)% as % of revenues 25.7 % 26.2 % (0.6) pt
* EBITDA restatements relate in particular to the following exceptional events:
In the 1st quarter of 2016:
- net proceeds from various disputes in the amount of 39 million euros;
- a restructuring expense in the amount of 113 million euros;
- an expense of 30 million euros related to the Part Time for Seniors plan in France and other items related to labour expenses.
In the 1st quarter of 2015:
- an expense in the amount of 71 million euros related to the Part Time for Seniors plan in France and other items related to labour
expenses;
- a restructuring expense in the amount of 14 million euros;
- a net expense of 23 million euros for various disputes.
14
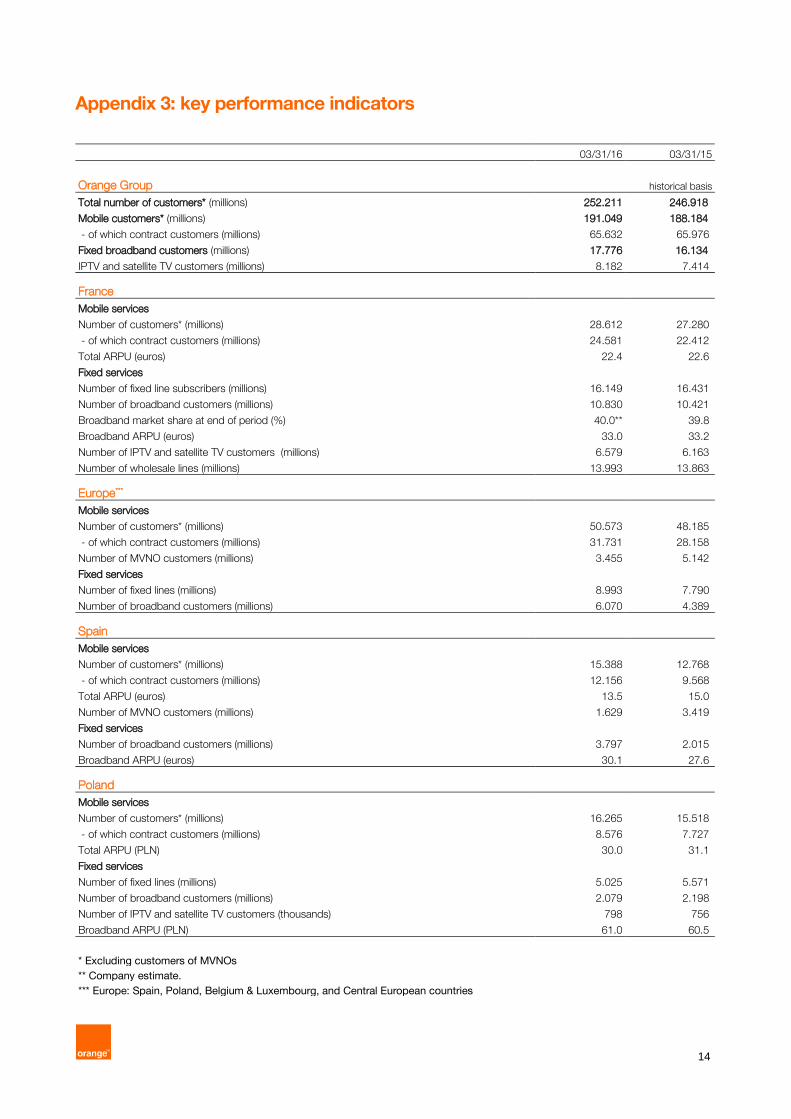
Appendix 3: key performance indicators
03/31/16 03/31/15
Orange Group historical basis
Total number of customers* (millions) 252.211 246.918
Mobile customers* (millions) 191.049 188.184
- of which contract customers (millions) 65.632 65.976
Fixed broadband customers (millions) 17.776 16.134
IPTV and satellite TV customers (millions) 8.182 7.414
France
Mobile services
Number of customers* (millions) 28.612 27.280
- of which contract customers (millions) 24.581 22.412
Total ARPU (euros) 22.4 22.6
Fixed services
Number of fixed line subscribers (millions) 16.149 16.431
Number of broadband customers (millions) 10.830 10.421
Broadband market share at end of period (%) 40.0** 39.8
Broadband ARPU (euros) 33.0 33.2
Number of IPTV and satellite TV customers (millions) 6.579 6.163
Number of wholesale lines (millions) 13.993 13.863
Europe***
Mobile services
Number of customers* (millions) 50.573 48.185
- of which contract customers (millions) 31.731 28.158
Number of MVNO customers (millions) 3.455 5.142
Fixed services
Number of fixed lines (millions) 8.993 7.790
Number of broadband customers (millions) 6.070 4.389
Spain
Mobile services
Number of customers* (millions) 15.388 12.768
- of which contract customers (millions) 12.156 9.568
Total ARPU (euros) 13.5 15.0
Number of MVNO customers (millions) 1.629 3.419
Fixed services
Number of broadband customers (millions) 3.797 2.015
Broadband ARPU (euros) 30.1 27.6
Poland
Mobile services
Number of customers* (millions) 16.265 15.518
- of which contract customers (millions) 8.576 7.727
Total ARPU (PLN) 30.0 31.1
Fixed services
Number of fixed lines (millions) 5.025 5.571
Number of broadband customers (millions) 2.079 2.198
Number of IPTV and satellite TV customers (thousands) 798 756
Broadband ARPU (PLN) 61.0 60.5
* Excluding customers of MVNOs
** Company estimate.
*** Europe: Spain, Poland, Belgium & Luxembourg, and Central European countries
15
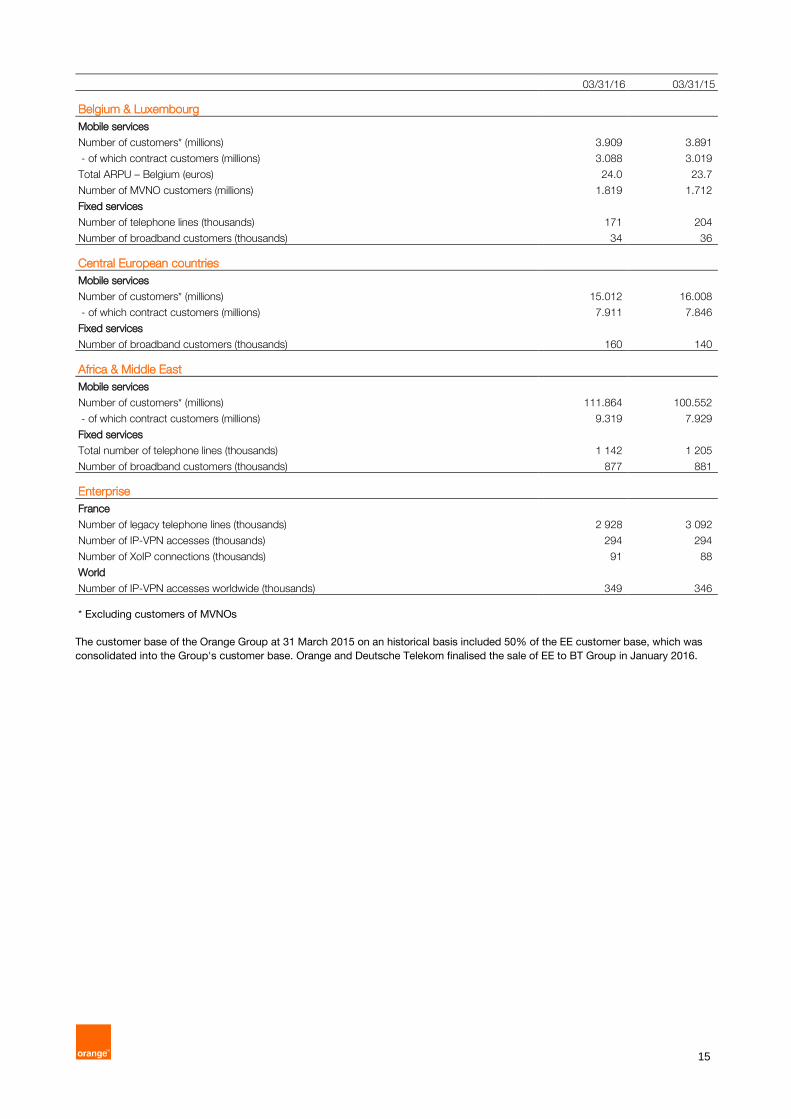
03/31/16 03/31/15
Belgium & Luxembourg
Mobile services
Number of customers* (millions) 3.909 3.891
- of which contract customers (millions) 3.088 3.019
Total ARPU – Belgium (euros) 24.0 23.7
Number of MVNO customers (millions) 1.819 1.712
Fixed services
Number of telephone lines (thousands) 171 204
Number of broadband customers (thousands) 34 36
Central European countries
Mobile services
Number of customers* (millions) 15.012 16.008
- of which contract customers (millions) 7.911 7.846
Fixed services
Number of broadband customers (thousands) 160 140
Africa & Middle East
Mobile services
Number of customers* (millions) 111.864 100.552
- of which contract customers (millions) 9.319 7.929
Fixed services
Total number of telephone lines (thousands) 1 142 1 205
Number of broadband customers (thousands) 877 881
Enterprise
France
Number of legacy telephone lines (thousands) 2 928 3 092
Number of IP-VPN accesses (thousands) 294 294
Number of XoIP connections (thousands) 91 88
World
Number of IP-VPN accesses worldwide (thousands) 349 346
* Excluding customers of MVNOs
The customer base of the Orange Group at 31 March 2015 on an historical basis included 50% of the EE customer base, which was
consolidated into the Group's customer base. Orange and Deutsche Telekom finalised the sale of EE to BT Group in January 2016.

16
Appendix 4: glossary
Key figures
Comparable basis: data based on comparable accounting principles, scope of consolidation and exchange rates are
presented for previous periods. The transition from data on an historical basis to data on a comparable basis consists
of keeping the results for the period ended and then restating the results for the corresponding period of the preceding
year for the purpose of presenting, over comparable periods, financial data with comparable accounting principles,
scope of consolidation and exchange rate. The method used is to apply to the data of the corresponding period of the
preceding year, the accounting principles and scope of consolidation for the period just ended as well as the average
exchange rate used for the income statement for the period ended.
EBITDA: Earnings Before Interest, Taxes, Depreciation and Amortisation. This indicator corresponds to operating
income before depreciation and amortisation, before revaluation related to acquisitions of controlling interests, before
impairment of goodwill and asset impairment, and before income from associates. EBITDA is one of the operational
profitability indicators used by the Group to steer and evaluate the results of its operating segments and to implement
its investment and resource allocation strategy. EBITDA is not a financial performance indicator as defined by IFRS
standards and may not be directly comparable to indicators referenced by the same name in other companies.
CAPEX: capital expenditure on tangible and intangible assets excluding telecommunication licences and investments through
finance leases. CAPEX is not a financial performance indicator as defined by IFRS standards and may not be directly
comparable to indicators referenced by the same name in other companies.
Mobile services
Revenues from mobile services: include revenues generated by incoming and outgoing calls (voice, SMS and data
services), network access fees, added-value services, machine to machine, roaming revenues from customers of other
networks (national and international roaming), revenues with mobile virtual network operators (MVNO) and revenues
from network sharing.
Mobile ARPU: the annual average revenues per user (ARPU) are calculated by dividing the revenues from incoming and
outgoing calls (voice, SMS and data services), network access fees, added-value services and visitor roaming over the
past twelve months, by the weighted average number of customers over the same period, excluding "machine to
machine" customers. The weighted average number of customers is the average of the monthly averages during the
period in question. The monthly average is the arithmetic mean of the number of customers at the start and end of the
month. Mobile ARPU is expressed as monthly revenues per customer.
Roaming: use of a mobile service on the network of an operator other than that of the subscriber.
MVNO: Mobile Virtual Network Operator. These are operators that do not have their own radio network and thus use the
infrastructure of third-party networks.
Fixed services
Includes include traditional fixed telephony, fixed broadband services, enterprise solutions and networks10 and carrier
services (notably national and international interconnections, unbundling and wholesale telephone line rentals).
Fixed broadband ARPU (ADSL, FTTH, satellite and WiMAX): the average revenues per user (ARPU) of broadband
services per year are calculated by dividing the revenues generated by retail broadband services over the past twelve
months by the weighted average number of accesses over the same period. The weighted average number of accesses
is the average of the monthly averages during the period in question. The monthly average is the arithmetic mean of the
number of accesses at the start and end of the month. Fixed broadband ARPU is expressed as monthly revenues per
access.
10 With the exception of France, where enterprise solutions and networks are listed under the Enterprise business segment.