Embed Size (px)
Citation preview
DOCUMENTO DE TRABAJO 42Banco Central de ChileDiciembre de 1998
Revenue, Efficiency, and Equity Aspects of MajorTaxes in Chile: A Preliminary Assessment
Howell Zee

BANCO CENTRAL DE CHILE
Documento de Trabajo es una publicación del Banco Central de Chile, que da a conocer lostrabajos de investigación en el ámbito económico, teórico o empírico, realizados porprofesionales de esta institución. Su objetivo es entregar un aporte al debate de ciertostópicos relevantes, o bien, presentar nuevos enfoques en el análisis de los mismos.
La publicación de los Documentos de Trabajo no está sujeta a la aprobación previa de losmiembros del Consejo del Banco Central de Chile, por lo que no representa en ningunaforma la opinión de esta institución ni de sus Consejeros. La difusión de los mismos, enconsecuencia, sólo intenta facilitar el intercambio de ideas y dar a conocer investigacionescon carácter preliminar, para su discusión y comentarios. Por esta misma razón, tanto elcontenido de los Documentos de Trabajo, como también los análisis y conclusiones que deellos se deriven, son de exclusiva resposabilidad de su(s) autor(es).
DOCUMENTOS DE TRABAJO DEL BANCO CENTRAL DE CHILE.Gerencia de Investigación Económica - Departamento Publicaciones
Huérfanos 1175, Santiago de ChileTeléfono: 670 2000 - Fax: 670 2231

REVENUE, EFFICIENCY, AND EQUITY ASPECTS OFMAJOR TAXES IN CHILE: A PRELIMINARY
ASSESSMENT
Howell Zee
DOCUMENTOS DE TRABAJO DEL BANCO CENTRALNº 42
Diciembre 1998

REVENUE, EFFICIENCY, AND EQUITY ASPECTS OF MAJOR TAXES INCHILE: A PRELIMINARY ASSESSMENT
H. ZeeFiscal Affairs Department
International Monetary Fund
ResumenEste artículo analiza aspectos de la recaudación, eficiencia y equidad de los impuestos más importantes enChile, es decir, el impuesto a la renta, el IVA, y los impuestos a las ventas. La carga tributaria chilena en laactualidad representa aproximadamente un 20% del PIB, lo que se encuentra en línea con las cargas de lospaíses vecinos. La conveniencia de un cambio en la carga tributaria dependerá de las necesidades de gastopublico del país que no pongan en riesgo la estabilidad macroeconómica. En comparaciones internacionales,Chile tiene una tasa máxima de impuesto a la renta personal (45%) que se encuentra entre las mas altas delmundo, y una tasa de impuesto a las utilidades (15%) que se encuentra muy por debajo de los estandaresinternacionales. La brecha entre ambas tasas (brecha de tasas al ingreso) es de 30 puntos porcentuales, y sureducción podría generar importantes mejoras en recaudación, eficiencia, y equidad que deben sercuidadosamente comparadas con los beneficios del actual sistema. Puede valer la pena analizar los efectossobre la recaudación, costos en eficiencia y beneficios esperados de algunos aspectos del sistema deimpuestos a la renta. Concretamente, son elementos que merecen consideración, los incentivos al ahorro, laefectividad de costo del impuesto global complementario en lograr sus objetivos de equidad y recaudación, yla introducción de cobros por la explotación de recursos naturales. Existen, además, un conjunto de elementosque podrían ser usados para mejorar la recaudación y la eficiencia del IVA y de los impuestos a la renta. Ellasincluyen: (1) el crédito especial en el IVA a la construcción; (2) la exclusión de los retornos de impuestos a laventa de diversos productos --especialmente derivados del petróleo-- de la base del IVA; (3) el rol delimpuesto de timbres y estampillas y el tratamiento del sector financiero frente al IVA; y (4) la carga tributariaapropiada para vehículos motorizados y del petróleo desde el punto de vista de la recaudación y el medioambiente.
AbstractThis paper assesses selected revenue, efficiency, and equity aspects of Chile’s major taxes, i.e., the incometax, the value-added tax (VAT), and excises. Chile’s present overall tax burden, at about 20 percent of GDP,is in line with that in its neighboring countries. Whether any change from this level is desirable depends in afundamental way on the public expenditure needs of the country without jeopardizing macroeconomicstability. Chile has a top personal income tax (PIT) rate (45 percent) that is at the high end of theinternational spectrum, and a corporate income tax (CIT) rate (15 percent) that is an outlier at the low end.The gap between these two rates (the income rate gap) of 30 percentage points could entail important revenue,efficiency, and equity costs that must be weighed carefully against any perceived or actual benefits. It may beworthwhile to undertake an assessment of the revenue and efficiency costs relative to the expected benefits ofsome aspects of the income tax system. Namely, saving incentives presently available, the cost effectivenessof the global complementary tax in achieving its revenue and equity objectives of taxing income on a globalincome basis, simpler ways of taxing capital and labor incomes, the introduction of royalties for theexploitation of natural resources. There are also a number of areas where existing policies could bereevaluated to enhance the efficiency and revenue potential of the VAT and excises. They include: (1) thespecial VAT credit to the construction sector; (2) the present exclusion of the excise revenue on manyexcisable goods--especially petroleum products--from the VAT base; (3) the role of the stamp duties and theVAT treatment of the financial sector; and (4) the appropriate excise burdens on motor vehicles andpetroleum products for revenue and environmental reasons.

1
1. Introduction
This paper provides an assessment of the revenue, efficiency, and equity aspects of the presenttax system in Chile from two perspectives: the macroeconomic perspective in terms of theoverall level and composition of tax revenue in relation to GDP; and the microeconomicperspective in terms of the allocative and equity implications of certain structural features ofthe tax system. Throughout the report, an attempt has been made, whenever possible, to placethe assessment in the context of both theoretical considerations and regional/internationalpractices. The focus of the assessment is restricted to the three major taxes in Chile: theincome taxes (comprising both the corporate income tax (CIT) and the personal income tax(PIT)), the value-added tax (VAT), and excises. Together, these taxes accounted for over 80percent of the total tax revenue in Chile in recent years. A breakdown of the tax revenue isprovided in Table 1.
There are two aspects of the assessment contained in this paper that are worth emphasizing atthe outset. First, comparing a country’s tax system and its revenue performance to those inother countries does not imply that international tax norms are necessarily appropriatebenchmarks against which to undertake an evaluation, as different countries face differentcircumstances and have different national policy objectives. Instead, the value of such acomparison lies primarily in providing a basis, when the national practice deviatessignificantly from that abroad, for raising questions about whether the deviation is based oncompelling and well thought-out reasons, as well as whether it can be sustained.
Second, on such fundamental issues as the efficiency and equity of tax policy, an assessmentof the tax system alone is clearly incomplete, as it ignores the nature and composition ofgovernment expenditures that are financed by the tax revenue. Frequently, the efficiencyand/or equity implications of a particular tax measure could be quite different onceexpenditures are taken into account. This limitation, which will become more apparent insome of the discussions below, should be borne in mind as an assessment of governmentexpenditure policy is beyond the scope of this aide-mémoire.
2. Macroeconomic Perspective: Level and Composition of Tax Revenue
From a macroeconomic perspective, aspects on a tax system that interest policy makers mostare whether the existing overall tax burden on the economy (usually expressed as a ratio toGDP) is appropriate, and, given a particular burden, whether the existing composition of taxrevenue (usually in terms of income relative to consumption taxation) is desirable.1 Much ofthis interest undoubtedly stems from the widely-held belief that the welfare costs of resourcemisallocation (both intra- and intertemporally) would increase with increased taxation, andthat, between taxing income and taxing consumption, the latter is the lesser of the two evils in
1From time to time, policy makers may also be interested in tax revenue for addressing short-run budgetary imbalances. This has not been an immediate concern in Chile, however, as anoverall budgetary surplus has been maintained in recent years.

2
affecting long-run growth.2
As it turns out, the vast literature on optimal tax theory provides little guidance on choosingthe overall level of tax burden. The literature has a bit more to offer on the choice betweenincome and consumption taxation, but even here the verdict is not clear cut. Following briefreviews of theoretical considerations about the tax burden and revenue composition, theChilean situation is assessed against recent regional and international developments.
Level of the tax burden
Theoretical considerations
The primary reason why optimal tax theory has so little to say about choosing the overall taxburden for an economy is that much of this theory has been developed to solve for the optimalstructure of taxes in a static, second-best context to raise a given amount of revenue, i.e., agiven tax burden. To relax this assumption in a meaningful way for purposes of normativepolicy prescription would necessitate the explicit modeling of the benefits (through eitherconsumption or production effects) of particular expenditures to be financed by the taxrevenue. In other words, determining the optimal tax burden is conceptually equivalent todetermining the optimal level of government expenditure. While many recent theoreticalattempts have been made to address this issue in an integrated framework of expenditure andtaxation,3 the results so far have been rather abstract and highly model dependent; they cannot,therefore, provide much practical policy guidance.
International comparisons
Lacking a clear prescription from theory, an alternative approach to assessing the present taxburden in Chile might be to compare it to that in selected groups of countries to see whetherthe former is broadly in line with international developments. Table 2 provides somecomparative information on the tax burden in Chile and that in a number of other LatinAmerican countries, in OECD countries (for both the group as a whole and a few of itssubgroups), and in Hong Kong and Singapore--the two countries most commonly cited forhaving good tax systems and achieving high growth.
Table 2 shows that, for the period 1993-95, Chile’s total tax burden (inclusive of socialsecurity taxes and tax payments by CODELCO--the state-owned copper company) averagedabout 20.6 percent of GDP, which was about the same as that in Mexico (19.3 percent ofGDP) and the average of the four Mercosur countries (20.6 percent of GDP) on a comparablebasis. In contrast, the average tax burden of OECD countries was almost twice as high,although the variance in the averages among the three OECD geographical subgroups was
2Much of the theoretical and empirical literature in this area is surveyed recently in Tanzi andZee (1997) (henceforth TZ), a copy of which is attached to this paper.
3Such attempts have become increasingly fashionable since the advent of the endogenousgrowth literature. A particularly well known example is Barro (1990) (cited in TZ).

3
large. The average tax burden in both Hong Kong and Singapore was notably lower than thatin either the Latin American or OECD countries.
An important contributing factor to the high tax burden in the OECD countries (principally theEurope subgroup) is their high social security taxes, which averaged about 10 percent of GDPin the 1993-95 period. In non-European OECD countries, as well as in most developingcountries, revenue from social security taxes as a percent of GDP is typically much lower. InChile, such revenue, which amounted to about 1.4 percent of GDP in the same period, wascomparatively low even by regional standards.4 Hence, if social security taxes are excludedfrom tax burden comparisons, the total tax burden in Chile would be somewhat higher (byroughly 3.5 percentage points of GDP) than that in both Mexico and the Mercosur countries asa whole, although it would still be below the level of most OECD countries (albeit by asmaller margin).
Numerous studies have attempted to identify the determinants of the level of taxation. One ofthe most commonly cited determinant has been per capita income, usually on grounds thateconomic development would bring about both an increased demand for public expenditureand a larger taxing capacity. Available international statistical evidence has tended to supportthe positive correlation between levels of income and levels of taxation . Indeed, compared toindustrial countries, the tax burdens in developing countries are typically lower by 50 percentor more.5 Asian developing countries generally have some of the lowest tax burdens, and it iscertainly tempting to view this as a causal factor in their high growth rates. Unfortunately, theempirical evidence on this relationship is far from compelling.6
The implication for Chile of the above is twofold: (1) its present tax burden is in line with thatin its neighboring countries; and (2) further economic development is likely to generateincreasing needs for additional tax revenue. It is thus important to focus more on the ways therevenue is utilized, than on the level of taxation per se.
Composition of revenue
Theoretical considerations
4This is largely explained by the fact that, since 1981, the social security system in Chile hasbeen converted from a state-run pay-as-you-go system to a (mandatory) fully-funded systemadministered by private organizations (the so-called Pension Fund Administrators) under stateregulations. Hence, budgetary revenue from social security taxes after the conversioncorresponds only to that collected from workers who remain in the old system. Inevitably,such revenue has declined, and will continue to decline, over time.
5For a discussion of this literature as well as statistical evidence, see Zee (1996) (cited in TZ).
6Much of the available econometric evidence on the relationship between taxation and growthhas not been very robust, due largely to the difficulties in disentangling the growth effects ofother relevant variables from taxation. See, for example, Easterly and Rebelo (1993) andLevine and Renelt (1992) (both cited in TZ).

4
The most prominent issue in any discussion of revenue composition involves the taxation ofincome relative to that of consumption.7 In evaluating the relative merits of these two taxbases, both efficiency and equity considerations are central to the analyses, although thetheoretical literature has focused on the former.
The conventional belief that taxing income entails a higher welfare (efficiency) cost thantaxing consumption is primarily based on the observation that the income tax consists of twobroad components: a labor tax and a capital tax. Since the labor tax is equivalent to a tax onconsumption in an intertemporal framework without labor-leisure choice and after adjustingfor inheritances and bequests, the income tax gives rise to an additional distortion--on savings--that is absent from the consumption tax. This line of reasoning disregards, however, the factthat the labor tax--and thus the consumption tax--does distort the labor-leisure choice. In thepresence of such a distortion, adding a second distortion is not necessarily welfare-reducing, aresult that follows directly from the theory of the second best. It turns out that, in thetraditional neoclassical growth model, the length of the consumer’s planning horizon plays acrucial role in the theoretical ambiguity of the relative superiority of the consumption tax. Ifsaving decisions are based on life-cycle considerations, the optimal mix of income andconsumption taxes would depend entirely on the relevant elasticities, i.e, of labor supply andsavings.8 If, however, the planning horizon is infinite, then the optimal tax on capital would infact be zero in the long run.9
The analytical picture would get even more complex and the results more ambiguous if humancapital--the crucial ingredient in the new endogenous growth literature--is brought into theanalysis. In general, the nature and process of human capital accumulation, i.e., whether itsacquisition is thought to require time (foregone wages), physical capital, even human capitalitself, or some combination of all three, will ultimately have a bearing on the relative welfarecosts of income and consumption taxation.10 The upshot of the above theoretical 7Other issues that have also attracted attention include the revenue and protection implicationsof tariffs (still important for many developing countries) and the efficacy of environmentaltaxes (receiving increasing interest in developed countries).
8It is not uncommon to encounter arguments for relatively heavy consumption taxation on thebasis that the elasticity of labor supply--at least for the group of prime male workers--is low. Itmust be noted, however, that the cited inelasticity usually refers to the uncompensated laborsupply curve. The compensated elasticity--the concept relevant for measuring welfare costs--istypically much higher. Moreover, there is a great deal of uncertainty about the magnitude ofthe interest elasticity of savings.
9The life-cycle results are established in Atkinson and Sandmo (1980), and results from theinfinite-horizon model are derived in Chamley (1986) (both cited in TZ). It could be optimalto tax capital in the life-cycle model because the intergenerational excess burden of a capitaltax is not fully captured in such a framework.
10An important implication of the income tax in Chile for the acquisition of human capital isdiscussed in the Section 3.

5
considerations is that, while taxing (physical) capital may well depress (physical) capitalaccumulation, it, like taxing consumption, could have an impact on human capitalaccumulation and other variables through a web of complex interactions, rendering therelative welfare costs of the two taxes a priori uncertain.
With the rapid globalization of financial markets in recent years, there has been muchrethinking about the appropriate tax treatment of capital income. In this regard, the concern isnot so much about the traditional efficiency issues such as the tax-induced distortions onsavings, as on the increasing ability of capital, especially financial capital for portfolioinvestment, to easily escape the domestic income tax net altogether. Such concerns haveprompted a reexamination of the relevance of imposing an income tax based on the concept ofglobal income.11
As regards (vertical) equity, it has long been thought that taxing consumption is inherentlymore regressive than taxing income, since it is administratively infeasible to effectivelyimplement, on a broad scale, graduated tax rates on consumption.12 Two recent lines ofresearch have, however, cast doubt on this conclusion. First, the traditional form of theconsumption tax, i.e., taxing consumption as it takes place (such as a VAT or sales tax), hasbeen found to be far less regressive than commonly thought when viewed from a life-cyclerather than a static perspective.13 Second, consumption can be taxed on the same graduatedbasis as the income tax, in theory, by allowing unlimited deductions from income of savingsunder the income tax itself.14 But such a tax is likely to be administratively more costly thanthe traditional consumption tax, as net savings during a tax period eligible for deduction mustbe tracked and reported to the tax authorities.
International comparisons
Broadly speaking, income tax revenue (inclusive of taxes paid by CODELCO) andconsumption tax revenue (the sum of the VAT, excises, and stamp duties) accounted for about30 percent and 50 percent, respectively, of the total tax revenue in Chile in recent years, or anincome/consumption revenue ratio of 0.6 (Table 1). How does such a ratio compare with thatin other countries?
11See Tanzi (1996) for an extended discussion on this issue.
12A limited application of differential consumption taxation is certainly feasible and in fact iswidely practiced. There is, however, compelling evidence suggesting that such a practice ishighly ineffective in achieving equity objectives, since both the rich and the poor consume(albeit in different proportions) the same goods that are being taxed differentially.
13See a series of studies by Metcalf, e.g., Metcalf (1994).
14This is the idea lying behind the so-called USA (unlimited savings allowance) tax that hasbeen proposed in the United States recently (see Seidman (1997)). To a limited degree,Chile’s income tax already contains some of the features of the USA tax, as discussed inSection 3 below.

6
As table 2 indicates, the comparable average ratio for the Mercosur countries over the 1993-95period was about 0.3 and about 1.25 for Mexico. Hence, the mix of income and consumptiontax revenues in Chile was certainly well within the regional boundaries. In the broadercontext, the OECD countries displayed an average ratio above unity, either for the group as awhole (about 1.3) or for any one of its three subgroups; and the same held true for Hong Kongand (marginally so) for Singapore. The study by Zee (1996) (cited in TZ) which looks at amuch larger sample of non-OECD countries and over a longer horizon finds that their averageratio declined from about unity in the second half of the 1970s to about 0.75 in the second halfof the 1980s, while over the same period the average ratio for the OECD countries remainedstable at about 1.4. The developing countries as a whole experienced, therefore, a marked shifttowards consumption taxation. It is noteworthy to point out, however, that this shift was muchless pronounced for the group of Latin American countries (the average ratio declining fromabout 0.75 to 0.6--coincidentally the present ratio for Chile); and that for the small group ofhigh growth Asian countries, the average ratio actually rose (from about 0.9 to unity) over theperiod.15
There are few clear-cut normative policy prescriptions that could be drawn from the aboveinternational comparisons; nor are there much compelling positive policy implications to behad from existing econometric evidence on the relationship between the income andconsumption revenue mix on the one hand, and either the growth or savings rate on the other.While employing tax instruments to alter rates of return to savings may have an impact on thecomposition of savings, there has been little conclusive international evidence that suchmeasures (unless of a drastic nature) could significantly affect either private or nationalsavings in the long run.16
For Chile, the merits of any shift in the income-consumption taxation from its present mix ineither direction would ultimately depend on spelling out clearly what objective(s) such a shiftis supposed to achieve, how it would be achieved, and at what costs--in terms of both possiblenew distortions arising from the shift and its consequent equity impact.
3. Microeconomic Perspective: Selected Structural Aspects of Major Taxes
This section assesses the efficiency and equity of selected structural aspects of the income tax,
15As reported in Zee (1996), an interesting aspect of the comparison between OECD anddeveloping countries with respect to the income tax is that the former tends to rely more onthe PIT than the latter. The ratio of PIT/CIT revenue in OECD countries is about 3, while it isbelow unity for developing countries (ranging from about 0.25 in the Middle East to about0.75 in Asia, based on broad samples of countries). Chile’s ratio has averaged about 0.3 inrecent years. Per capita income and sophistication of the tax administration are among themany possible factors in determining the relative importance of the PIT as a source of taxrevenue.
16For a recent review of tax effects on household savings in OECD countries, see Normannand Owens (1997).

7
the VAT, and excises in Chile. Throughout the discussion below, it is taken as a given that, allother things equal, a simple tax system is better than a complex one. From this point of view,there seems to be much scope for simplifying Chile’s tax system, especially regarding theincome tax. From reading the income tax law, one gets a distinct impression that, to a largedegree, the complexity in the present law is due to the accumulation of a great number ofprovisions enacted over many years designed for the fine tuning of different policy objectives.As time passes and economic circumstances change, tax provisions deserve to be reexaminedfrom time to time for their intentions and effectiveness. Of course, tax simplificationfrequently involves accepting some degree of compromise over objectives of efficiency andequity, but this price must be weighed against the possibly unintentional distortions hidden in,and the enormous amount of rent-seeking activities generated by, a complex tax system.
Before launching into the assessment, however, it would be useful to take a brief look at someregional and international comparative information on both the nominal rates of broad-basedincome and consumption taxes and the tax treatments of major financial incomes (interest,dividends, and capital gains). While nominal rates alone seldom convey sufficient informationabout the structural content of a tax system, they are nevertheless convenient reference pointswith which to frame the discussion. As for financial incomes, the way they are treated in a taxsystem frequently have important implications for efficiency, equity, and tax competitiveness.
Comparative nominal tax rates
The nominal rates of the CIT, PIT, and VAT in the Mercosur countries, Mexico, Hong Kong,and Singapore are provided in Table 3, together with information on the rates of socialsecurity taxes and the corporate asset tax (if any) in these countries. The most striking featureabout this table is that Chile has the lowest CIT rate (15 percent) and the highest top PIT rate(45 percent) among the sample countries . While the latter cannot be said to be the highest inthe world,17 the former is probably unparalleled (perhaps excluding one or two island taxhavens) for its low level.18 Another notable feature is that, in all of the sample countriesexcept Chile, the CIT rate is closely aligned with the top PIT rate. The gap between the tworates in Chile (henceforth the income rate gap)--a full 30 percentage points--is also among thelargest by international standards.19 Unlike a number of other Latin American countries,
17A number of European countries, such as Belgium (60.6 percent), Denmark (61), Finland(57.5), France (60.2), Germany (57), Italy (51), Luxemburg (51.3), Netherlands (60), Spain(56), and Sweden (56), have a top marginal PIT rate in excess of 50 percent (indicated ratesrepresent the sum of PITs at the central and subcentral levels of government in 1996).
18As of 1996, the bulk of the countries around the world have a CIT rate in the range of 30percent to 40 percent. Countries with a CIT rate substantially above 40 percent are now fewand far in between (e.g., Germany (56 percent) and Italy (53.2)). Most Nordic countries,which previously had CIT rates above 50 percent, have now moved to a dual-income taxsystem with an uniform tax rate (around 30 percent) on capital income (see below).
19A few countries with an income rate gap on the same order as Chile’s are Finland (29.5percentage points), Denmark (27), and Sweden (28). These gaps result not from anexcessively low CIT rate, but from a high top PIT rate. All three countries have adopted the

8
including Mexico and Uruguay, Chile does not impose a tax on corporate assets.
As regards the VAT, the 18 percent rate in Chile is certainly comparable to that observed inother countries, either regionally or internationally.20
Comparative tax treatments of major financial incomes
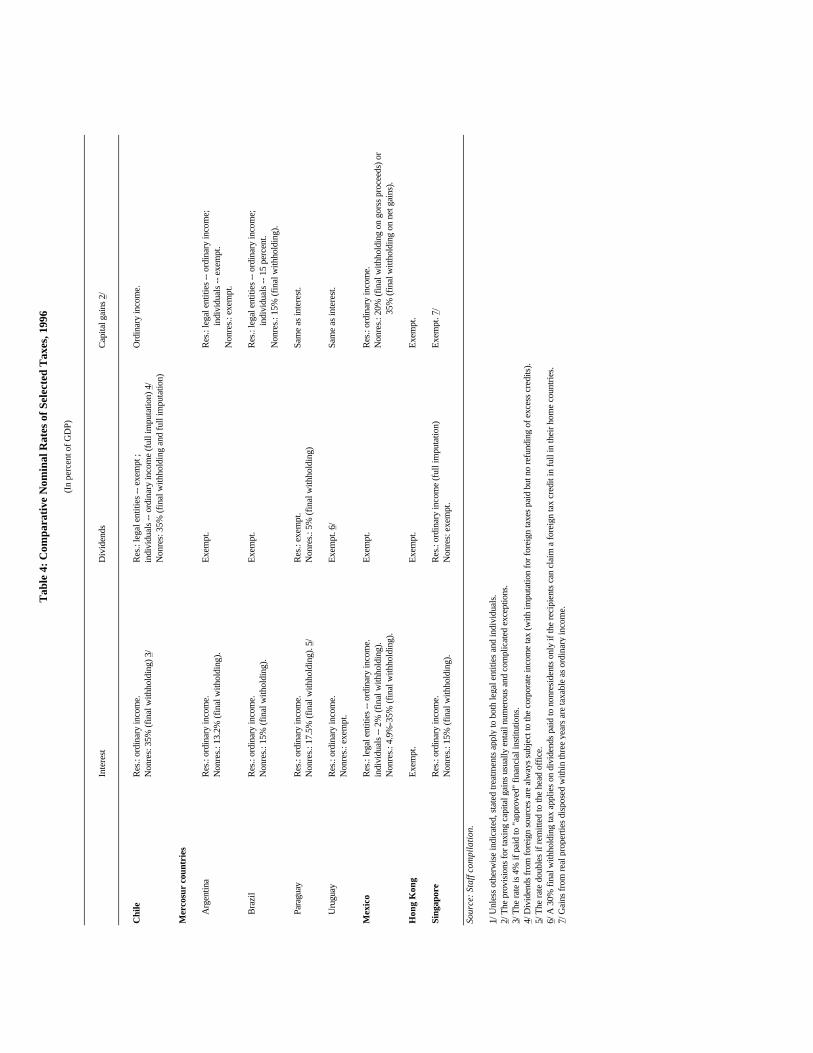
Table 4 summarizes the tax treatments of major financial incomes in the same sample ofcountries as in Table 3. Generally, the tax treatment of interest income is based on the sameprinciple across the countries: it is treated as ordinary income when paid to a resident legal ornatural entity (although in Chile many specific types of interest income are tax exempt), and issubject to a final withholding tax when paid to nonresidents (Hong Kong is an exception,where interest is totally tax-exempt). Since interest expenditure is a deductible cost forcompanies, a withholding tax on interest remitted abroad is essential to prevent the strippingof profits by nonresidents.21 While the withholding rate in Chile, at 35 percent, seems muchhigher than that in the other sample countries, almost all foreign investors in Chile takeadvantage of the special withholding rate of 4 percent that applies when the recipient is aforeign financial institution approved by the Central Bank of Chile. Given that thewithholding tax on remitted dividends abroad is 35 percent (see below), the spread of 31percentage points in the tax treatment of the two types of remittances could give rise tosubstantial incentives for back-to-back loan arrangements with an approved foreign financialinstitution.22
The tax treatment of dividends in Chile is substantially different from that in the othercountries in the sample. These latter countries have generally opted for a simple exemption ofdividend income, irrespective of the recipient’s status of residence. This method is feasiblebecause their CIT rates are at a reasonably high level (i.e., around 30 percent, except HongKong) and the CIT and the top PIT rates are closely aligned, as noted earlier. The exemptionmethod is not feasible in Chile, given its large income rate gap, unless the authorities are
dual-income tax system.
20As of 1996, the bulk of the OECD countries have a standard VAT rate ranging from 15percent to 25 percent.
21Another common device to safeguard against profit stripping is to impose a thincapitalization rule. Chile’s rule is set at 65:35 at present for foreign investments entering thecountry under Decree 600 (the foreign investment law). The rule can be bypassed, however, ifforeign investors choose instead to enter through Chapter 14 of the Compendium of ForeignExchange Regulations of the Central Bank of Chile (and in so doing they forego some of thebenefits provided by Decree 600, including the exemption from reserve requirement onforeign loans (see below)). The international norm for the rule is in the range of 2:1 to 3:1.
22Foreign loans are, however, subject to a 30 percent reserve requirement with the CentralBank of Chile for one year without interest. This requirement lessens somewhat the benefits ofthe tax arbitrage.

9
willing to sacrifice a substantial portion of the tax base (especially with respect to Chile-sourced income remitted abroad). The full imputation method adopted by Chile with respectto dividend income circumvents the problems posed by the income rate gap, but at the cost ofadded opaqueness and complexity (relative to the exemption method).23
Among the different types of financial income, the tax treatment of capital gains is usually themost complex and diverse across countries--and the sample countries in Table 4 are noexception, as special provisions for capital gains on different assets abound in income taxlaws. The broad tendency in most countries is to tax short-term capital gains (when notspecifically exempted) as ordinary income and provide some relief for long-term gains; and totax gains from financial assets at higher rates than those from real estate (if taxed at all). In apervasively indexed tax system like Chile’s, however, the distinction between short- and long-term gains is not relevant. Instead, the distinction is drawn on the basis of habituality of theactivity from which the gains arise. Habitual gains are taxed as ordinary income, while the taxtreatment of nonhabitual gains is varied. On the whole, however, capital gains taxation inChile is not out of line with international practice, although there is certainly scope forstreamlining special cases, especially those relating to the taxation of nonhabitual gains. Thesimplest approach is, of course, not to tax such gains at all, as in Hong Kong and Singapore,but this could raise serious issues of equity, and countries that exempt capital gains entirelyfrom tax are still a minority.
Assessing the CIT and PIT
The income tax law in Chile first taxes capital income (referred to as first category income),which is the CIT component, separately from labor income (second category income), whichis the PIT component. The two types of income are then combined and taxed under a globalcomplementary tax (GCT), with full imputation against the CIT or PIT, or both, as the casemay be. Capital income remitted abroad is assessed an additional tax (AT) through finalwithholding, again with full imputation against any CIT paid. Hence, in theory, Chile adheresto the global or comprehensive income tax concept. In practice, however, capital incomereceives a substantially more favorable tax treatment than labor income as a result of variousprovisions in the law. Several notable aspects of Chile’s income tax system are assessed anddiscussed below, and are compared with recent international practices.
Income rate gap
The income rate gap of 30 percentage points in Chile raises several interrelated problems ofefficiency and equity in the income tax system. For discussion purposes, it would beconvenient to separate those that are related to the magnitude of the gap itself, from those thatstem from the underlying cause(s) of the gap (i.e., the CIT rate being too low, or the top PIT
23It must be noted, however, that some form of imputation (partial or full) is in use in anumber of OECD countries (e.g., Australia, Finland, France, Germany, Ireland, Italy, NewZealand, Turkey, and United Kingdom), as well as in Singapore, for dividends paid todomestic shareholders. Chile’s system of imputation is, however, much wider in scope thanthat found in most other countries. See further discussions below.

10
rate being too high, or both).
Magnitude of the income rate gap. The primary objective of the income rate gap is, of course,to encourage corporate savings. Whether such a gap would, in and of itself, lead to higherprivate savings is debatable at best. Even if it did, its beneficial effects must be weighedagainst a number of revenue, efficiency, and equity problems the gap would entail.
First and foremost, a large income rate gap provides strong incentives for taxpayers to choosethe corporate form of doing business purely for tax reasons. This distortion exists even if theCIT and the PIT are fully integrated (as they are in Chile), because the taxpayers who are bestsituated to abuse the delay in the taxation of accrued income by incorporating themselves areprecisely those whose sole purpose is to side-step the PIT in the first place. Professionals (e.g.,lawyers and accountants) and small entrepreneurs, for example, can easily siphon off profitsthrough dubious expense deductions over time and escape the higher PIT rate permanently.For them, taxes delayed are taxes evaded. With respect to these taxpayers, therefore, a largeincome rate gap creates a possibly severe revenue leakage but confers no investment benefitson the economy.24
For companies which are formed for legitimate reasons, a large income rate gap creates adifferent type of distortion: decisions about whether to retain or distribute profits would thenbe heavily influenced by tax considerations. One could, of course, argue that this is in fact apolicy objective, i.e., to encourage reinvestment, but it must be noted that it is a distortion allthe same. Whether such a distortion is desirable depends clearly on one’s assessment of therelative benefits and costs of taxing distributed profits more heavily than retained earnings.Viewed in this light, the issue is basically the same as that involved in the well-known debateon the classical versus the integrated approach to dividend taxation.
On one side of the debate is the old view, which holds that, because a company’s dividendshave informational value for investors, discouraging dividend distribution through high taxesentails an efficiency loss. On the other side is the new view, which holds that, becauseretained earnings will eventually be distributed and subject to the higher PIT, the twoapproaches amount to a purely timing difference in tax payments, which, in present valueterms, will be viewed by investors only as a lump-sum tax. Hence, the higher taxes ondistributed profits entail no distortion (save for an income effect).25 Naturally, it is anempirical matter as to which view is correct. It is important to note, however, that neither viewprovides any theoretical support for the differential taxation against distributed profits: it iseither costly (the old view) or has little or no efficiency effects (the new view).
Even if retained earnings increase as a result of tax considerations, it still does not mean thatthis is brought about without a price. Excessive retainment of earnings by existing companiesresult in a economy-wide misallocation of capital, and new companies are penalized as they
24Forming companies to evade the PIT is seemingly a widespread phenomenon in Chile.
25For a recent review of this voluminous literature, see Sinn (1991).

11
typically require more equity capital than mature ones.26 The trapping of earnings incompanies to escape (or at least delay) the higher taxes on distributed profits is analogous tothe lock-in effect of capital gains taxation, which is widely regarded as an impediment to theefficient functioning of capital markets.
The differential taxation of retained and distributed profits also gives rise to a horizonal equityproblem, since the ease with which the high PIT can be evaded is not the same for alltaxpayers. It could be vertically inequitable as well: with tax evasion, the progressive PIT ratestructure, ostensibly designed to address vertical equity concerns, becomes binding mostly onwage earners. It has much less of an effective impact on those whose income is primarilyderived from nonwage sources but who are, at least arguably, likely to be better off than thosewith only wage income.
Should the income rate gap be deemed excessive after conducting a careful analysis, thelogical next question would be how to reduce it: should the CIT be raised or the top PIT belowered, or that the burden of adjustment be shared by both?
Absolute level of the CIT rate. As noted earlier, by regional and international standards, thetop PIT rate in Chile is relatively high and the CIT rate is exceedingly low. Amazingly, themarginal effective tax rate on capital at the company level is likely to be substantially beloweven that indicated by the low nominal CIT rate, largely due to the availability of a generalinvestment allowance, in the form of a tax credit, of 4 percent of the value of new tangiblefixed assets. At a CIT rate of 15 percent, this allowance is equivalent to an initial write-offagainst taxable income of about 27 percent of the value of the assets.27 This is in addition tothe applicable depreciation allowances, which separately provide favorable tax treatment tonew fixed assets.28 In OECD countries, the provision of general investment allowances or taxcredits on fixed assets is very much a minority practice.29
26This penalty on new companies is countered somewhat in Chile’s income tax systembecause the purchase of new equity shares by individual taxpayers is partially deductible fromincome for tax purposes.
27There is a ceiling on the tax credit of 500 UTMs per year (the UTM is an accounting unit fortax purposes that is adjusted monthly according to the change in the CPI in the previousmonth). At present, 1 UTM is roughly equal to about US$57 (excess credits are notrefundable). Hence, the equivalent maximum write-off against taxable income is aboutUS$190,000 annually. To get a sense of the relative degree of generosity of this maximumwrite-off, note that in the tax year 1996, the average CIT taxpayer in Chile had aboutUS$21,000 of taxable income.
28Chile employs the straight-line method of depreciation. The life of a depreciable asset, ifnew or imported, is reduced to one-third of its normal length.
29There is, of course, the well known externality argument in favor of providing tax incentivesto equipment investment (see Delong and Summers (1991), cited in TZ). For this argument tobe compelling, however, tax incentives should be given on a targeted, rather than general,basis--and only after a careful assessment of the costs and benefits of such incentives.

12
It is sometimes argued that generous tax incentives are necessary for competing with othercountries in attracting foreign investment. Putting aside the fact that the empirical evidence onthis argument is fairly inconclusive,30 Table 3 shows that the CIT rate of 15 percent in Chile islower than that in the other countries in the region by a wide margin, which raises questionsabout the necessity of maintaining it at its present level for this reason. Note also that, to aforeign investor, Chile’s low CIT rate is attractive only to the extent that profits are notrepatriated, since, as noted earlier, there is an AT that brings the total tax rate on profitsremitted abroad to 35 percent--a rate that certainly cannot be regarded as particularlycompetitive. Hence, for foreign investment purposes, the offering of an initially low CIT rateis likely to be regarded as only a short-run benefit.
The above discussion suggests that, in narrowing the income rate gap, raising the CIT rateshould not be excluded from serious consideration.
Absolute level of the top PIT rate. As regards the top PIT rate, lowering it is likely to improveboth efficiency and equity, since, as discussed earlier, its burden falls disproportionately onlabor income, notwithstanding the full integration of the CIT with the PIT. While in the longerterm a lower top PIT rate may well raise revenue from efficiency gains and reduced incentivesto evade taxes, such effects are difficult to quantify. In the short run, the rate reduction willnecessarily have an adverse revenue impact, and this concern must be carefully addressed.
Table 5a provides the distribution profiles, by tax bracket, of both sole 2nd category taxpayersand taxpayers who filed for the GCT in 1996. As can be clearly seen, in both profilestaxpayers in the 45 percent bracket were small in number (which is typical in any tax with asteeply progressive rate structure) but contributed disproportionately to the revenue collected(which is somewhat surprising). Among the sole 2nd category taxpayers, about 28 percent ofthe revenue was collected from those located in the top bracket, which comprised only 0.1percent of the entire taxpaying population of this tax. For the GCT, about 50 percent of therevenue was collected from the top bracket, which comprised about 1 percent of all GCTtaxpayers.31 These distribution profiles imply that the revenue impact of lowering the top PITrate cannot be completely ignored.
Table 5b provides an illustrative new PIT rate structure that is broadly revenue neutral ascompared to the existing rate structure for sole 2nd category taxpayers.32 The block on the left
30See OECD (1994) for an assessment of Asian country experiences, and Shah (1995) ondeveloping countries (both cited in TZ).
31It must be noted that most GCT taxpayers also paid the 2nd category tax (and/or the 1stcategory tax), which can be claimed as a credit against the GCT. Such credits have beennetted out from the GCT figures in Table 5a.
32The same exercise cannot be performed so easily for the GCT, because of the complexinteractions among it and the 1st and 2nd categories of taxes. For the GCT, reliable simulationresults must be based on detailed data from a reasonably large sample of actual tax returns.

13
side of Table 5b shows the tax revenue calculated under the existing structure based on theaverage actual taxable income in each bracket. The purpose of this calculation is to ascertainwhether such an approach can broadly reproduce the actual tax revenue collected shown inTable 5a. It does, since the simulated revenue collection of 3.9 million UTMs is close to theactual figure of 4.1 million UTMs. The block on the right side of Table 5b illustrates the newrate structure, which is shown to be capable of raising about 4.1 million UTMs in revenue--about the same as the actual revenue figure, and marginally higher than the simulated figureunder the existing rate structure.
The new rate structure differs from the existing one in two crucial respects: the former has atop rate of only 35 percent, but the rate of its fourth bracket is set at 25 percent, thuseliminating the 15 percent rate in the latter altogether. Obviously, this is not the only ratestructure with a lowered top rate that could achieve revenue neutrality. But the illustrated ratestructure has a number of desirable features: (1) the number of rates would be reduced fromthe present six to four, which is consistent with the direction of recent PIT reforms in bothdeveloped and developing countries around the world; (2) the top rate would be at a level thatis compatible with the regional as well as international practices. This would contributesubstantially to the narrowing of the income rate gap and facilitate further alignment with theCIT rate in the future; (3) taxpayers in the lowest three brackets, comprising about 99 percentof all sole 2nd category taxpayers, would be left unaffected, thus mitigating any adverseimpact on the less well off; and (4) adverse vertical equity effects on taxpayers in the otherbrackets would be severely limited: taxpayers in the 4th-6th brackets would see their averagetax burdens increase only marginally--in all cases by no more than 2.5 percentage points,while that on the taxpayers in the top bracket would be reduced by only 2 percentage points.
Naturally, in deciding on a new structure, the revenue impact on the GCT must also be takeninto account. The approach adopted in the illustrative restructuring would, however, remainbroadly valid, i.e., the adverse revenue impact of lowering the top rate by even a significantmargin could be compensated by raising a middle rate, without producing serious negativeeffects on vertical equity.
Saving incentives
For taxpayers who have to file GCT returns, i.e., individuals with nonwage income, the PITcontains several notable incentives for savings that have important efficiency and equityimplications. These incentives can be broadly grouped into four types: (1) income from anyform of personal capital is tax-exempt if the total amount does not exceed 20 UTMs in a year;(2) 50 percent of the portion of the sum not exceeding 50 UTAs (1 UTA is equal to 12UTMs) of dividend income and capital gains associated with shares of open corporation isdeductible from taxable income; the deductible percentage is reduced to 20 percent on theportion of the said sum in excess of the stated amount; (3) 20 percent of the value of shares ofopen corporations is deductible (up to 50 UTAs) from taxable income if such shares arebought at initial public offerings and held for more than a year; and (4) net savings invested ininstruments and securities issued by financial institutions and pension funds, up to 30 percentof taxable income or 65 UTAs, generate a tax credit against the GCT equal to the saidapplicable investment amount multiplied by the average tax rate prior to applying the credit(net dissavings give rise to a tax debit). Generally speaking, the first two types of incentives

14
relate to exempting income from savings from tax, while the last two relate to deductingsavings from taxable income.
Efficiency implications. The above incentives raise two efficiency issues. First, all taxincentives entail, by definition, a revenue cost. For given levels of expenditure and budgetarybalance, the revenue loss must be compensated by other (distortive) taxes. The crucialquestion is then whether this cost is justified by the benefits expected from the incentives. Itshould be noted that, in Chile, a significant portion of capital income is either not taxed ortaxed only lightly: a large part of the interest income is out of the income tax net because ofincentive (1) above and the income-exempt status of social security institutions;33 anddividends from open corporations are taxed lightly due to incentive (2) above and the low PITrate. As discussed earlier, removing capital income from the income tax base is alreadyequivalent to converting, to a substantial degree, the income tax to a consumption-based tax inan intertemporal context. Hence, if the bias against savings under a traditional income tax isthe chief concern, then the present tax treatment of capital income should already have largelymitigated it. If, in addition, a significant portion of savings is also allowed as a deductionagainst taxable income, then it is tantamount to allowing a part of income to permanentlyescape the income tax net. Whether such a double-barreled tax measure to stimulate savings isnecessarily welfare-enhancing must, therefore, be carefully analyzed on a rigorous cost-benefit basis.34
The second efficiency issue is that the allowed savings deductions reward savings in physicalassets but not investments in human capital by wage earners who incur expenses for eitherupgrading their existing skills or acquiring new ones through vocational training, since nodeductions for such expenses are given.35 This is not to imply, of course, that deductions forvocational training are necessarily desirable and should be given. The point is rather that theimpact of the savings deductions currently available in the tax system is not neutral withrespect to different forms of capital, even though they may all be important for future growth.
Equity implications. By definition, taxing different types of income differently violateshorizontal equity. More importantly, the manner by which the incentives are given--throughexemptions and deductions--also violates vertical equity. The reason is that, with aprogressive PIT rate structure, a given amount of exemption or deduction always confers morebenefit on the taxpayers in the higher rate brackets than those in the lower brackets, since the
33Although personal capital income (inclusive of interest income), if it exceeds 20 UTMs, istaxable under the GCT (unless specifically exempted), there is no withholding to ensure itseffective taxation.
34As noted earlier, incentive (3) has the function of (partially) compensating for the penaltyimposed on new companies as a result of the heavier tax burden on distributed profits. It is notclear, however, that this incentive is necessarily preferable to reducing the underlyingdistortion it is intended to compensate.
35At the company level, however, a tax credit against the CIT of up to 1 percent of payroll forcontributions to approved training courses is available.

15
tax value of each unit of allowed deduction increases with the marginal tax rate. By contrast,tax incentives given in the form of tax credits benefit all taxpayers (who are in a position toexploit the incentives) equally, irrespective of the applicable marginal tax rate.
Table 6 provides a numerical illustration of this principle. It is assumed that, for the stated ratestructure and average gross income in each bracket, a deduction of 5 UTMs is available to alltaxpayers. With this deduction, the total tax collected is 100.5 UTMs. In an alternativescenario, instead of the deduction, a tax credit of 0.5 UTM is given to all taxpayers. Thebenefit of this credit is equivalent to that enjoyed by the taxpayers in the 10 percent bracketunder the first scenario. It follows from this that taxpayers in the 10 percent bracket or lowerunder the credit method are no worse off (but could be better off) than those in the samebrackets under the deduction method, as can be seen from comparing their average taxburdens under the two scenarios. For taxpayers in brackets above the 10 percent bracket,however, the average tax burdens rise, because, unlike the deduction, the benefit of the taxcredit to taxpayers in the higher brackets is exactly the same as that to those in the lower ones.For this reason, not only does the credit method improve the vertical equity of the ratestructure without any change to the nominal rates and brackets themselves, it also raises morerevenue (by 3.8 UTMs in the numerical example).36
The implication of the above discussion is that, if tax incentives are to be given, for verticalequity reasons it is preferable for them to take the form of tax credits rather than exemptionsor deductions.
Tax simplification
As noted earlier, Chile’s income tax system is fairly complex, and it is worth examiningwhether some of its features that have led to this complexity are effective in achieving theirintended objectives. This includes the treatment of capital gains and the system ofdepreciation (with more than 15 rates). One particularly notable aspect of the complexity thatis discussed below is the pervasive use of imputation, ostensibly to define the tax base on thebasis of the global income concept. In practice, however, the taxable income is far fromglobal.
Although the literature on optimal tax theory has long established that it may be optimal onefficiency grounds to tax different types of income differently (schedular taxation), many taxspecialists have championed, for reasons of horizontal equity, the concept of global income asa basis for taxation, i.e., a single tax rate (or tax schedule) is applied on the sum of all incomesas they accrue. It is, of course, seldom administratively feasible to implement a pure system ofglobal income taxation, as some types of income, such as capital gains, are difficult if notimpossible to tax on an accrual basis. In reality, most tax systems are neither purely schedularnor purely global, because for tax purposes it is often the case that only some types of incomeare aggregated.
36The revenue effect depends on the imputed equivalent tax credit of the amount of deduction.There would be a revenue loss if the credit is imputed at a sufficiently high rate bracket, e.g.,at the top bracket.

16
In Chile, it seems that the compromise between schedular and global taxation has beenbrought to the extreme. On the one hand, different types of income (e.g., capital and laborincomes) are treated in a conspicuously different manner. On the other hand, all types ofincome (inclusive of exempt-income) must be combined under the GCT through acomprehensive imputation system, if only to capture the progressive effects of the ratestructure. Since there are extensive exemptions under the GCT itself, as discussed earlier, it isunclear whether any significant effective enhancement in either horizontal or vertical equity isachieved by the GCT, and whether the administrative costs of the imputation system is fullyjustified by its relatively small net revenue yield (about 0.5 percent of GDP in recent years).
The advantage to be had from the GCT’s imputation system would be even less clear shouldthere be any reduction in the income rate gap through a combination of a higher CIT rate anda lower top PIT rate, in which case the progressivity impact (whatever degree remains afterthe exemptions) on nonwage income would be further diluted and the revenue yield of theGCT diminished. It would then be worthwhile to examine the possibility of foregoing theconcept of global income taxation altogether, and instead tax financial incomes (when deemedtaxable) separately from wage income explicitly. A version of this approach, known as thedual-income system, has in fact been recently adopted in a number of Nordic countries(Denmark, Finland, Norway, and Sweden) with minor variations.37 Other versions of thisapproach are also possible, including a more widespread use of final withholding taxes oncertain types of financial incomes, especially interest and dividends. Indeed, increased capitalmobility across national boundaries has prompted a number of proposals just in thisdirection.38
Taxation of the mining sector
The mining sector, in which copper is the dominant output, contributed about 8 percent of thecountry’s GDP in 1995. Copper production by the private sector now surpasses that ofCODELCO, although income tax revenue collected from the former reportedly only amountedto about 10 percent of that from the latter. An unusual aspect of the tax treatment of themining sector in Chile is that income from the exploitation of natural resources is only subjectto the regular income tax, while in most countries such income is also subject to additional
37The impetus for the move away from the global income concept in these countries was theadministrative difficulty in capturing financial incomes properly in the tax net when they haveto be aggregated with labor income and subject to high PIT rates. The fundamental feature ofthe dual-income tax system is that all financial incomes are taxed once and at the uniform CITrate. Thus, all capital income in the economy is taxed at this rate. In contrast, labor incomecontinues to be taxed under a separate, progressive schedule. For a description andassessment, see Sorensen (1994).
38Two well known proposals (not yet adopted) in the European Union are: (1) the proposedEC directive in 1989 of a 15 percent minimum withholding tax on interest; and (2) the RudingCommittee’s recommendation to the EC in 1992 of a uniform 30 percent withholding tax ondividends. Of course, many countries already have withholding taxes on interest income.

17
fiscal levies, such as royalties. Royalties are necessary because they represent payments to thegovernment as the ultimate owner of the resources being exploited, which are conceptuallydistinct from the income tax that is imposed on all producers. They are also important forensuring the tax treatments of private and state-owned companies are on an equitable basis, asthe latter are subject to profit transfer requirements in addition to income tax payments.
While the design of an appropriate structure of royalties is beyond the scope of this aide-mémoire, its introduction should be given serious consideration, as it is likely to have asignificant revenue potential.
Assessing the VAT and excises
Generally speaking, the VAT and excises in Chile have few major structural issues that wouldrequire special attention. The base of the VAT is extremely broad by international standards--excluded sectors comprise only education, health, public transportation, and the financialinstitutions, which is unexceptional in any VAT system. Save for one special case, discussedbelow, the VAT has a uniform rate of 18 percent, and yielded 7.9 percent of GDP in revenue(exclusive of special excises administered under the VAT law) in 1996 (Table 1). This impliesa revenue productivity (defined as the average revenue yield for each percentage point of thestandard VAT rate) of about 0.44 percent of GDP, which is notably higher than that in mostother Latin American countries (typically in the 0.3-0.35 range) and is comparable to thatfound in Western European and high-growth Asian countries.39 The same point about theVAT’s relatively high revenue efficiency can be made from a different perspective: for aconsumption-type VAT implemented on the destination principle (such as the VAT in Chile),its maximum theoretical base is simply the sum of private and government consumption. InChile, this sum is about 70 percent of GDP. Hence, the VAT’s actual revenue yield impliesthat the tax has captured, impressively, more than 60 percent of its maximum base.
As regards Chile’s excise system, it includes all the goods that are traditionally considered tobe excisable, such as motor vehicles, and alcoholic, tobacco, and petroleum products. Whileits total revenue yield, at about 3.1 percent of GDP in 1996, compared favorably with that inother countries in the region, a significant portion of it (about 22 percent) was derived fromstamp duties on credit instruments. Excluding these duties, the excise revenue yield was muchmore modest. Discussed below are a number of issues related to the VAT and excises,primarily with a view to further enhancing their revenue potential.
Special VAT credits for the construction sector
The standard VAT rate of 18 percent is applied on all taxable goods, except residentialhousing, where the applicable rate is reduced to11.7 percent (65 percent of the standard rate).Officially, this reduced rate is administered as a special tax credit provided to constructioncompanies of such housing, and the revenue foregone associated with this credit has averagedabout 0.4 percent of GDP in recent years (Table 1). The credit has its origin many years ago as
39Brazil’s VAT revenue productivity figure of about 0.47 percent of GDP is somewhatmisleading, since its VAT system includes numerous exceptionally high rates.

18
a compensating measure for the cascading effects of the incomplete application of the creditmechanism in the construction sector. It has remained to this day, notwithstanding the fact thatthe original rationale for its existence no longer applies. Hence, the desirability of continuingwith the credit should be examined in the context of both budgetary revenue needs and thedistortion against other sectors taxed at the regular rate.
Interactions between the VAT and excises on excisable goods
The general principle observed in many countries around the world of imposing the VAT onexcisable goods is to include the excise revenue in the VAT base. This is to ensure that theapplicable VAT rate is applied on a basis that will in fact produce the same effective rate. Ascan be seen from Table 7, in Chile this principle is largely not observed, in part because someof the excises (e.g., on beverages and luxury goods) are administered under the VAT lawitself, and are, therefore, officially classified as part of the VAT system (hence their exclusionfrom the base of the regular VAT). However, excises on petroleum products are imposedunder a separate legislation, and there is no reason why they should not be treated on par withexcises on tobacco products as part of the VAT base. Including petroleum excises in the VATbase would yield about 0.25 percent of GDP in revenue.
VAT treatment of the financial sector
As noted earlier, the VAT in Chile does not cover the financial sector. This is the standardinternational practice, primarily due to the conceptual difficulty in defining the appropriatebasis for the financial sector on which to apply the VAT in a manner comparable to othergoods and services. Credit instruments, however, are subject to stamp duties (0.1 percent permonth up to a maximum of 1.2 percent on the amount of the credit) that are really in thenature of a financial transactions tax. As such, the tax cascades just like any other form of aturnover tax. While duties of this nature are not uncommon internationally,40 their potentialeconomic effects, in terms of both benefits and costs, on the efficient functioning of financialmarkets cannot be ignored.41
Since the revenue yield of the stamp duties (about 0.7 percent of GDP in 1996) is not trivial,any contemplated policy change regarding such duties must take into account its revenueconsequences. If the duties were to be reduced, a possible compensating measure could be alimited extension of the VAT into the financial sector, such as imposing it on interest ratespreads (such as that recently implemented in Argentina). Note, however, that such anextension would introduce distortions of its own, because the tax is not comprehensivelyapplied on the entire value-added of the financial sector, nor is it likely to be politicallyfeasible to encompass all interest spreads under the VAT. Yet another alternative would be toapply the VAT on the financial institutions on the income side, where the tax base is formedby summing their wages and profits (the so-called addition method of a VAT). This approach
40For a survey of country practices, see Spahn (1995).
41Some have argued that a financial transactions tax is beneficial because it tends to reduce thevolatility of financial markets. See, for example, Summers and Summers (1990).

19
has been adopted in Israel, and its scope would be more comprehensive than applying theVAT on interest rate spreads. The addition method has, however, the shortcoming that theresultant tax resembles an income tax, and, as a consequence, it may have effects that could bequite different from those of a conventional VAT.
Due to their potentially important efficiency implications for capital markets, the costs andbenefits of tax policy changes as they relate to the financial sector must be carefully weighed.
Excises on motor vehicles and petroleum products
Motor vehicles and petroleum products are traditionally two important excisable goods, notonly for their typically high revenue potential, but also for beneficial effects from excises onsuch goods in reducing pollution and urban congestion. It is not uncommon to find, forexample, excise (or tariff, as the case may be) rates of 50 percent and up on motor vehicles inmany countries. By international standards, the excise burden on motor vehicles in Chileseems excessively light (see Table 7).42 The luxury tax, though imposed at a high rate, isineffective, since it can be avoided by consumers in favor of small and/or used cars (theimportation of used cars is allowed in Chile). Given the present low uniform tariff rate of 11percent and its expected further decline in the near future, as well as the planned phasing-outof the cylinder tax by 1999, there seems to be an urgent need for a thorough evaluation of theadequacy of present and prospective excises on motor vehicles, for both revenue andenvironmental reasons.
For similar reasons, the present excise burden on petroleum products should also be examined.Table 8 provides comparative information on such burdens between Chile and OECDcountries. Generally speaking, the excise rates on fuels in Chile, though higher than those inthe United States and Canada, are far below the levels found in the European countries. Insetting the appropriate excise rates, however, some care must be taken to ensure that ratediscrepancies, if any, between Chile and its neighboring countries do not become excessive soas to generate incentives for smuggling activities.
42The revenue figure in Table 7 does not include the recurring (annual) registration taximposed on a progressive scale (on the undepreciated value of the vehicle) and collected bymunicipal governments. No data on this tax are available.

20
References
Metcalf, G., 1994, “Life-cycle versus Annual Perspective on the Incidence of a Value-addedTax,” Tax Policy and the Economy (Cambridge: The MIT Press).
Normann, G., and J. Owens, 1997, “Tax Effects on Household Savings: Evidence from OECDMember Countries,” in Promoting Savings in Latin America, edited by RechartHausmann and Helmut Reisen (Paris: OECD).
Seidman, L., 1997, The USA Tax: A Progressive Consumption Tax (Cambridge: The MITPress).
Sinn, H., 1991, “Taxation and the Cost of Capital: The Old View, the New View and AnotherView,” Tax Policy and the Economy (Cambridge: The MIT Press).
Sorensen, P., 1994, “From Global Income Tax to the Dual Income Tax: Recent Tax Reformsin the Nordic Countries,” International Tax and Public Finance.
Spahn, P., 1995, “International Financial Flows and Transactions Taxes: Survey and Options,”WP/95/60 (Washington, DC: International Monetary Fund).
Summers, L. and V. Summers, 1990, “The Case for a Securities Transactions Excise Tax,”Tax Notes.
Tanzi, V., 1996, “Globalization, Tax Competition and the Future of Tax Systems,”WP/96/141 (Washington, DC: International Monetary Fund).
Tanzi, V., and H. Zee, 1997, “Fiscal Policy and Long-Run Growth,” Staff Papers(forthcoming).
Note: references cited in the text that are also cited in Tanzi and Zee (1997) above are notseparately listed.
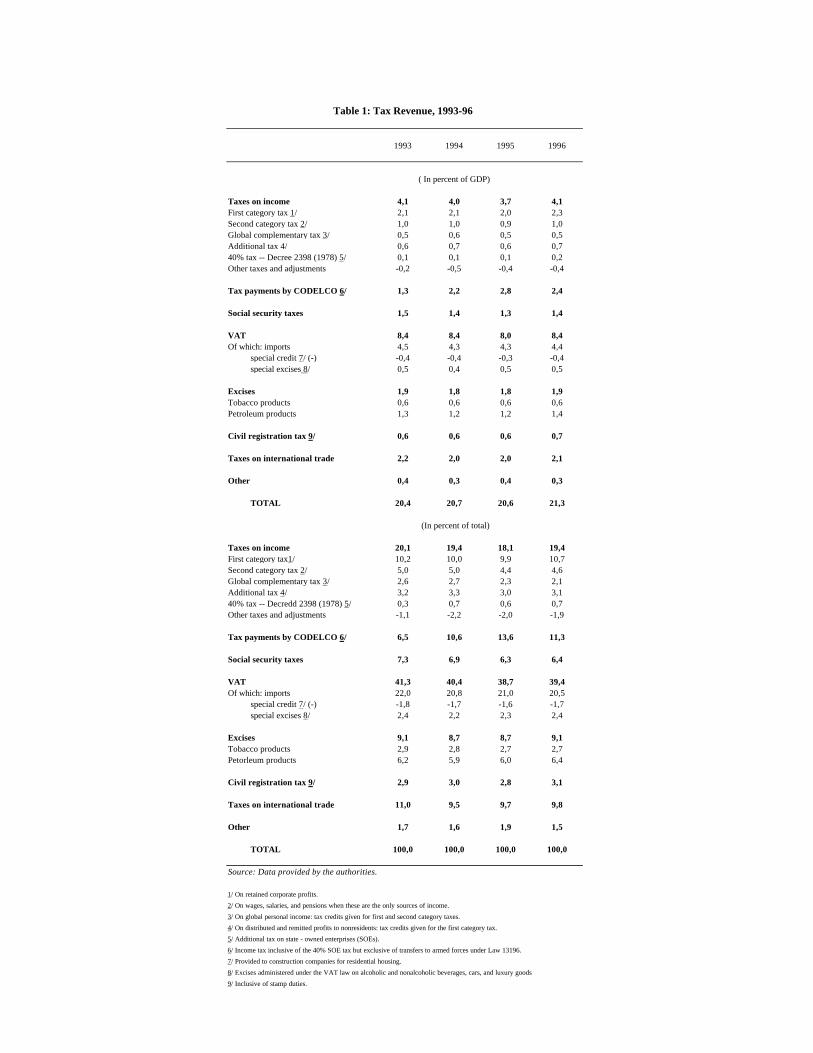
Table 1: Tax Revenue, 1993-96
1993 1994 1995 1996
( In percent of GDP)
Taxes on income 4,1 4,0 3,7 4,1First category tax 1/ 2,1 2,1 2,0 2,3Second category tax 2/ 1,0 1,0 0,9 1,0Global complementary tax 3/ 0,5 0,6 0,5 0,5Additional tax 4/ 0,6 0,7 0,6 0,740% tax -- Decree 2398 (1978) 5/ 0,1 0,1 0,1 0,2Other taxes and adjustments -0,2 -0,5 -0,4 -0,4
Tax payments by CODELCO 6/ 1,3 2,2 2,8 2,4
Social security taxes 1,5 1,4 1,3 1,4
VAT 8,4 8,4 8,0 8,4Of which: imports 4,5 4,3 4,3 4,4
special credit 7/ (-) -0,4 -0,4 -0,3 -0,4special excises 8/ 0,5 0,4 0,5 0,5
Excises 1,9 1,8 1,8 1,9Tobacco products 0,6 0,6 0,6 0,6Petroleum products 1,3 1,2 1,2 1,4
Civil registration tax 9/ 0,6 0,6 0,6 0,7
Taxes on international trade 2,2 2,0 2,0 2,1
Other 0,4 0,3 0,4 0,3
TOTAL 20,4 20,7 20,6 21,3
(In percent of total)
Taxes on income 20,1 19,4 18,1 19,4First category tax1/ 10,2 10,0 9,9 10,7Second category tax 2/ 5,0 5,0 4,4 4,6Global complementary tax 3/ 2,6 2,7 2,3 2,1Additional tax 4/ 3,2 3,3 3,0 3,140% tax -- Decredd 2398 (1978) 5/ 0,3 0,7 0,6 0,7Other taxes and adjustments -1,1 -2,2 -2,0 -1,9
Tax payments by CODELCO 6/ 6,5 10,6 13,6 11,3
Social security taxes 7,3 6,9 6,3 6,4
VAT 41,3 40,4 38,7 39,4Of which: imports 22,0 20,8 21,0 20,5
special credit 7/ (-) -1,8 -1,7 -1,6 -1,7special excises 8/ 2,4 2,2 2,3 2,4
Excises 9,1 8,7 8,7 9,1Tobacco products 2,9 2,8 2,7 2,7Petorleum products 6,2 5,9 6,0 6,4
Civil registration tax 9/ 2,9 3,0 2,8 3,1
Taxes on international trade 11,0 9,5 9,7 9,8
Other 1,7 1,6 1,9 1,5
TOTAL 100,0 100,0 100,0 100,0
Source: Data provided by the authorities.
1/ On retained corporate profits.
2/ On wages, salaries, and pensions when these are the only sources of income.
3/ On global personal income: tax credits given for first and second category taxes.
4/ On distributed and remitted profits to nonresidents: tax credits given for the first category tax.
5/ Additional tax on state - owned enterprises (SOEs).
6/ Income tax inclusive of the 40% SOE tax but exclusive of transfers to armed forces under Law 13196.
7/ Provided to construction companies for residential housing.
8/ Excises administered under the VAT law on alcoholic and nonalcoholic beverages, cars, and luxury goods
9/ Inclusive of stamp duties.

Tab
le 2
: C
ompa
rati
ve L
evel
s an
d St
ruct
ures
of
Tax
Rev
enue
s, 1
993-
95 A
vera
ge
(In
perc
ent o
f G
DP)
Tot
al ta
xes
of w
hich
:In
clud
ing
Exc
ludi
ng
Gen
eral
Spec
ific
Soci
also
cial
soci
alIn
com
e co
nsum
ptio
ndo
mes
ticse
curi
tyIm
port
secu
rity
secu
rity
taxe
sta
xes
taxe
sta
xes
dutie
s
Chi
le20
,619
,26,
07,
82,
91,
42,
1
Mer
cosu
r co
untr
ies
Arg
enti
na19
,114
,62,
25,
91,
94,
50,
9B
razi
l26
,120
,94,
09,
8--
5,2
0,5
Para
guay
12,5
10,8
1,9
3,9
1,7
1,7
2,1
Uru
guay
24,5
16,9
2,4
8,1
3,5
7,6
1,2
A
vera
ge 1
/20
,615
,82,
66,
92,
44,
81,
2
Mex
ico
19,3
15,9
6,0
3,0
1,8
3,4
1,1
OE
CD
1/2
/3/
38,0
28,0
13,5
6,6
4,0
10,0
0,7
Am
eric
a 1/
2/3/
27,5
22,1
11,4
3,5
3,3
5,4
0,6
Paci
fic
1/2/
31,4
28,2
16,2
4,1
2,7
3,2
0,6
Eur
ope
1/2/
40,4
28,8
13,4
7,4
4,3
11,6
0,7
Hon
g K
ong
2/12
,412
,47,
3--
4,9
----
Sing
apor
e 2/
17,5
17,5
7,6
1,4
6,1
--4/
0,9
Sour
ces:
Rev
enue
Sta
tist
ics,
196
5-19
95 (
OE
CD
); a
nd n
atio
nal a
utho
riti
es.
1/ U
nwei
ghte
d av
erag
e.2/
Dat
a re
fer
to 1
992-
94 p
erio
d av
erag
e.3/
Inc
lude
s M
exic
o.4/
Con
trib
utio
ns to
the
Cen
tral
Pro
vide
nt F
und
appl
y.

Tab
le 3
: C
ompa
rati
ve N
omin
al R
ates
of
Sele
cted
Tax
es, 1
996
(In
perc
ent o
f G
DP)
Val
ue-
Cor
pora
teC
orpo
rate
Pers
onal
So
cial
sec
urity
taxe
sad
ded
tax
1 /In
com
e ta
x 2/
asse
t tax
inco
me
tax
Em
ploy
erE
mpl
oyee
Chi
le18
15 3
/--
5,10
,15,
25,3
5,45
0.9
- 3.
4 4/
20,3
Mer
cosu
r co
untr
ies
Arg
entin
a21
33--
6,10
,15,
20,2
5,33
3317
Bra
zil
20.4
8/21
.95
5/15
6/
--15
,25
27,8
8,9,
11
Para
guay
1030
----
16,5
9,5
Uru
guay
2330
1.5
7/--
18,5
519
.05,
21.0
5,24
.05
Mex
ico
1534
1.8
8 /3,
10,1
7,25
,32,
33,3
4,35
22.7
4/
5,25
Hon
g K
ong
--16
,5--
2,9,
17,2
0 9/
----
Sing
apor
e3
26--
2,5,
8,12
,16,
20,2
2,23
,26,
28--
10/
--10
/
Sour
ce:
Staf
f com
pila
tion
1/ S
tand
ard
tax
- ex
clus
ive
rate
.2/
Gen
eral
rat
e3/
35
perc
ent a
pplie
s on
pro
fits
rem
itted
abr
oad
or d
istr
ibut
ed to
non
resi
dent
sha
reho
lder
s.4/
A r
equi
red
prof
it -
shar
ing
arra
ngm
ent w
ith e
mpl
oyee
s ge
nera
lly a
pplie
s: 3
0 pe
rcen
t of
prof
its
(les
s 10
per
cent
of
net e
quity
) or
25
perc
ent o
f an
nual
wag
es in
Chi
le, a
nd 1
0 pe
rcen
t of
prof
its in
Mex
ico.
5/ S
tate
tax
(IC
MS)
; the
re is
als
o a
Fede
ral t
ax (
IPI)
with
var
ied
rate
s up
to o
ver
300
perc
ent.
6/ S
urch
arge
of
10 p
erce
nt a
pplie
s to
inco
me
abov
e a
cert
ain
thre
shol
d; c
orpo
rate
inco
me
is a
lso
subj
ect t
o a
8 pe
rcen
t
soci
al c
ontr
ibut
ion
tax.
7/ A
pplie
s on
net
ass
ets;
cre
dita
ble
agai
nst c
orpo
rate
inco
me
tax
with
cei
ling.
8 / A
pplie
s on
gro
ss a
sset
s (n
et o
f in
terc
ompa
ny li
abili
ties
subj
ect t
o th
is ta
x) a
s a
min
imum
tax
on c
orpo
rate
inco
me.
9/ A
pplie
s on
ly o
n sa
lari
es, o
n w
hich
the
max
imum
rat
e is
15
perc
ent b
efor
e pe
rson
al a
llow
ance
s.10
/ A 2
0 pe
rcen
t con
trib
utio
n (f
or b
oth
the
empl
oyer
and
em
ploy
ee)
to th
e C
entr
al P
rovi
dent
Fun
d on
wag
es g
ener
ally
app
lies.
Tab
le 4
: C
ompa
rati
ve N
omin
al R
ates
of
Sele
cted
Tax
es, 1
996
(In
perc
ent o
f G
DP)
Inte
rest
Div
iden
dsC
apita
l gai
ns 2
/
Chi
leR
es.:
ordi
nary
inco
me.
Res
.: le
gal e
ntiti
es -
- ex
empt
; O
rdin
ary
inco
me.
Non
res:
35%
(fi
nal w
ithho
ldin
g) 3
/in
divi
dual
s --
ord
inar
y in
com
e (f
ull i
mpu
tatio
n) 4
/N
onre
s: 3
5% (
fina
l with
hold
ing
and
full
impu
tatio
n)
Mer
cosu
r co
untr
ies
A
rgen
tina
Res
.: or
dina
ry in
com
e.E
xem
pt.
Res
.: le
gal e
ntiti
es -
- or
dina
ry in
com
e;N
onre
s.: 1
3.2%
(fi
nal w
ithol
ding
).
indi
vidu
als
-- e
xem
pt.
Non
res.
: exe
mpt
.
B
razi
lR
es.:
ordi
nary
inco
me.
Exe
mpt
.R
es.:
lega
l ent
ities
--
ordi
nary
inco
me;
Non
res.
: 15%
(fi
nal w
ithol
ding
).
indi
vidu
als
-- 1
5 pe
rcen
t.N
onre
s.: 1
5% (
fina
l with
hold
ing)
.
P
arag
uay
Res
.: or
dina
ry in
com
e.R
es.:
exem
pt.
Sam
e as
inte
rest
.N
onre
s.: 1
7.5%
(fi
nal w
ithho
ldin
g). 5
/N
onre
s.: 5
% (
fina
l with
hold
ing)
U
rugu
ayR
es.:
ordi
nary
inco
me.
Exe
mpt
. 6/
Sam
e as
inte
rest
.N
onre
s.: e
xem
pt.
Mex
ico
Res
.: le
gal e
ntiti
es -
- or
dina
ry in
com
e.E
xem
pt.
Res
.: or
dina
ry in
com
e.in
divi
dual
s --
2%
(fi
nal w
ithho
ldin
g).
Non
res.
: 20%
(fi
nal w
ithho
ldin
g on
gor
ss p
roce
eds)
or
Non
res.
: 4.9
%-3
5% (
fina
l with
hold
ing)
.
35%
(fi
nal w
ittho
ldin
g on
net
gai
ns).
Hon
g K
ong
Exe
mpt
.E
xem
pt.
Exe
mpt
.
Sing
apor
eR
es.:
ordi
nary
inco
me.
Res
.: or
dina
ry in
com
e (f
ull i
mpu
tatio
n)E
xem
pt. 7
/N
onre
s.: 1
5% (
fina
l with
hold
ing)
.N
onre
s: e
xem
pt.
Sour
ce:
Staf
f com
pila
tion
.
1/ U
nles
s ot
herw
ise
indi
cate
d, s
tate
d tr
eatm
ents
app
ly to
bot
h le
gal e
ntiti
es a
nd in
divi
dual
s.2/
The
pro
visi
ons
for
taxi
ng c
apita
l gai
ns u
sual
ly e
ntai
l num
erou
s an
d co
mpl
icat
ed e
xcep
tions
.3/
The
rat
e is
4%
if p
aid
to "
appr
oved
" fi
nanc
ial i
nstit
utio
ns.
4/ D
ivid
ends
fro
m f
orei
gn s
ourc
es a
re a
lway
s su
bjec
t to
the
corp
orat
e in
com
e ta
x (w
ith im
puta
tion
for
fore
ign
taxe
s pa
id b
ut n
o re
fund
ing
of e
xces
s cr
edits
).5/
The
rat
e do
uble
s if
rem
itted
to th
e he
ad o
ffic
e.6/
A 3
0% f
inal
with
hold
ing
tax
appl
ies
on d
ivid
ends
pai
d to
non
resi
dent
s on
ly if
the
reci
pien
ts c
an c
laim
a f
orei
gn ta
x cr
edit
in f
ull i
n th
eir
hom
e co
untr
ies.
7/ G
ains
fro
m r
eal p
rope
rtie
s di
spos
ed w
ithin
thre
e ye
ars
are
taxa
ble
as o
rdin
ary
inco
me.

Tab
le 5
a. D
istr
ibu
tio
n P
rofi
les
of
So
le 2
nd
. Cat
ego
ry a
nd
Glo
bal
Co
mp
lem
enta
ry T
axp
ayer
s, 1
996
Tax
able
M
argi
nal
S
ole
2nd.
cat
egor
y ta
xpay
ers
G
loba
l com
plem
enta
ry ta
xpay
ers
inco
me
tax
T
axpa
yers
Tax
able
inco
me
Net
tax
Ave
rage
T
axpa
yers
Tax
able
inco
me
N
et ta
xA
vera
gebr
acke
tra
teN
umbe
rP
erce
ntT
otal
Per
cent
Tot
alP
erce
ntta
x ra
teN
umbe
rP
erce
ntT
otal
Per
cent
Tot
alP
erce
ntta
x ra
te
(UT
M)
(Per
cent
)(U
TM
mil.
)(U
TM
mil.
)(P
erce
nt)
(UT
M m
il.)
(UT
M m
il.)
(Per
cent
)
0-10
012
7016
878
,548
,234
,90,
01,
10,
166
8956
63,2
22,0
11,6
0,0
0,1
0,0
10-3
05
2953
2818
,356
,140
,70,
819
,61,
424
8083
22,7
51,3
27,0
0,3
5,7
0,6
30-5
010
3247
42,
014
,710
,70,
716
,34,
574
179
7,0
34,2
18,0
0,5
9,1
1,4
50-7
015
1064
00,
77,
55,
40,
513
,27,
234
418
3,3
24,3
12,8
0,5
9,5
2,1
70-9
025
4327
0,3
4,1
3,0
0,4
10,4
10,4
1787
71,
717
,08,
90,
610
,53,
490
-120
3524
590,
23,
02,
20,
511
,115
,112
415
1,2
15,3
8,0
0,8
15,0
5,4
>120
4520
440,
14,
33,
11,
228
,326
,810
276
1,0
26,2
13,7
2,7
50,3
10,5
Tot
al16
1744
010
0,0
137,
910
0,0
4,1
1059
004
190,
310
0,0
5,4
100,
0
Sou
rce:
Dat
a P
rovi
ded
by th
e au
thor
ities
.
Tab
le 5
b. I
llust
rati
ve R
even
ue
- N
eutr
al C
han
ge
in R
ate
Str
uct
ure
fo
r S
ole
2n
d. C
ateg
ory
Tax
pay
ers,
199
6
E
xist
ing
stru
ctur
e Ill
ustr
ativ
e re
venu
e -
neut
ral n
ew s
truc
ture
Tax
able
M
argi
nal
Tax
able
Mar
gina
lin
com
eta
x
Tax
able
inco
me
Net
tax
Ave
rage
inco
me
tax
Tax
able
inco
me
N
et ta
xA
vera
gebr
acke
tra
teA
vera
geT
otal
Ave
rage
Tot
alta
x ra
tebr
acke
tra
teA
vera
geT
otal
Ave
rage
Tot
al
tax
rate
(UT
M)
(Per
cent
)(U
TM
)(U
TM
mil.
)(U
TM
)(U
TM
mil.
)(P
erce
nt)
(UT
M)
(Per
cent
)(U
TM
)(U
TM
mil.
)(U
TM
)(U
TM
mil.
)(P
erce
nt)
0-10
03,
248
,20,
00,
00,
00-
100
3,2
48,2
0,0
0,0
0,0
10-3
05
15,8
56,1
0,2
0,7
1,2
10-3
05
15,8
56,1
0,2
0,7
1,2
30-5
010
37,8
14,7
1,7
0,7
4,4
30-5
010
37,8
14,7
1,7
0,7
4,4
50-7
015
58,5
7,5
4,2
0,5
7,1
50-7
015
58,5
7,5
5,0
0,6
8,6
70-9
025
78,7
4,1
8,1
0,4
10,3
70-9
015
78,7
4,1
10,1
0,5
12,8
90-1
2035
102,
33,
015
,20,
410
,390
-120
3510
2,3
3,0
17,2
0,5
16,8
>120
4517
6,3
4,3
46,7
1,1
26,5
>120
3517
6,3
4,3
43,1
1,1
24,5
Tot
al13
7,9
3,9
137,
94,
1
Sou
rce:
Dat
a pr
ovid
ed b
y th
e au
thor
ities
; and
sta
ff ca
lcul
atio
ns.

Tab
le 6
. Illu
stra
tive
Tax
Cal
cula
tion
s u
nd
er D
edu
ctio
n a
nd
Tax
Cre
dit
Met
ho
ds
Ded
uctio
n m
etho
d 2 /
Tax
cre
dit m
etho
d 3/
Tax
able
Mar
gina
lA
vg.
Avg
.A
vg.
Avg
.A
vg.
Inco
me
tax
gros
sD
educ
tion
taxa
ble
Net
tax
taxa
ble
Gro
ssT
axN
etta
xbr
acke
tra
tein
com
e 1/
inco
me
tax
rate
inco
me
tax
cred
itta
xra
te
(UT
M)
(Per
cent
)(U
TM
)(U
TM
)(U
TM
)(U
TM
)(P
erce
nt)
(UT
M)
(UT
M)
(UT
M)
(UT
M)
(Per
cent
)
0-10
05
5,0
0,0
0,0
0,0
50,
00,
50,
00,
010
-30
520
5,0
15,0
0,3
1,3
200,
50,
50,
00,
030
-50
1040
5,0
35,0
1,5
3,8
402,
00,
51,
53,
850
-70
1560
5,0
55,0
3,8
6,3
604,
50,
54,
06,
770
-90
2580
5,0
75,0
7,3
9,1
808,
50,
58,
010
,090
-120
3510
55,
010
0,0
14,5
13,8
105
16,3
0,5
15,8
15,0
>120
4524
05,
023
5,0
73,3
30,5
240
75,5
0,5
75,0
31,3
Tot
al10
0,5
104,
3S
ourc
e: S
taff
calc
ulat
ions
1 / A
ssum
ptio
n: a
vera
ge g
ross
inco
me
in e
ach
brac
ket i
s at
the
mid
-poi
nt o
f the
bra
cket
; tha
t in
the
high
est b
rack
et is
twic
e th
e m
inim
um o
f the
bra
cket
.2/
By
assu
mpt
ion,
5 U
TM
s of
inco
me
can
be d
educ
ted
from
inco
me
befo
re ta
x co
mpu
tatio
n.3/
By
assu
mpt
ion,
tax
cred
it is
impu
ted
from
the
tax
dedu
ctio
n at
the
10 p
erce
nt b
rack
et.

Tab
le 7
.Str
uct
ure
an
d R
even
ue
of
Exc
ises
, 199
6
R
even
ueC
redi
t for
VA
TE
xcis
e in
Bas
is o
f tax
Rat
e1/
Per
cent
of G
DP
Per
cent
of t
otal
earli
er e
xcis
e?im
pose
d?V
AT
bas
e?
Mo
tor
veh
icle
s0,
092,
9Lu
xury
tax
2/C
IF le
ss U
S$
10.1
1885
,00,
082,
6N
oY
esY
esC
ylin
der
tax
2/C
IFF
orm
ula
3/...
0,0
No
Yes
Yes
Use
d ve
hicl
e ta
xm
arke
t pr
ice
0,5
0,01
0,3
Yes
No
No
Lu
xury
go
od
s0,
010,
2P
reci
ous
ston
es, j
ewer
ly, i
vory
, fur
CIF
+ ta
riff o
r sa
le p
rice
50,0
0,01
0,2
Yes
4/
Yes
No
Tap
estr
y, c
avia
r, fi
rew
orks
, airg
uns,
trai
lers
CIF
+ ta
riff o
r 1s
t sal
e50
,00,
000,
0Y
es 4
/Y
esN
oY
acht
s"
30,0
0,00
0,0
Yes
4/
Yes
N
o
Bev
erag
es0,
299,
2S
oft d
rinks
CIF
+ ta
riff o
r n
onre
tail
sale
pric
e13
,00,
134,
2Y
es 4
/Y
esN
oW
ine
"15
,00,
041,
4Y
es 4
/Y
esN
oB
eer
"15
,00,
051,
7Y
es 4
/Y
esN
oP
isco
s"
25,0
0,04
1,2
Yes
4/
Yes
No
Liqu
ors
"30
,00,
010,
4Y
es 4
/Y
esN
oW
hisk
ey"
70,0
0,01
0,2
Yes
4/
Yes
No
To
bac
co p
rod
uct
sR
etai
l pri
ce12
4,2
0,57
18,3
No
Yes
Yes
Pet
role
um
pro
du
cts
1,36
43,7
Gas
olin
eIm
port
atio
n or
1st
. sal
e4.
4084
UT
M/c
u.m
.0,
9631
,0N
oY
esN
oD
iese
l"
1.5
UT
M/c
u. m
.0,
3912
,5N
oY
esN
oO
ther
s...
...0,
010,
2N
oY
esN
o
Sta
mp
Du
ties
0,67
21,5
Che
cks
Per
che
ckC
$ 10
3/ch
eck
0,11
3,5
No
No
No
Unp
aid
chec
ks o
r dr
afts
Am
ount
1,0
0,01
0,4
No
No
No
Cre
dit i
nstr
umen
tsA
mou
nt0.
1 5/
0,54
17,5
No
No
No
Oth
ers
6/...
0,13
4,2
To
tal
3,11
100,
0
Sou
rce:
Dat
a pr
ovid
ed b
y th
e au
thor
ities
.
1/ In
per
cent
of t
ax -
- ex
clus
ive
pric
e or
val
ue, u
nles
s ot
herw
ise
spec
ified
. 2/
Veh
icle
s w
eigh
ing
mor
e th
an 2
tons
or
with
mor
e th
an 1
5 pa
ssen
ger
seat
s ar
e ex
empt
.3/
For
mul
a ba
sed
on c
c; ta
x w
ill b
e ph
ased
out
by
1999
.4/
Cre
dit g
iven
onl
y if
the
selle
r is
exc
isab
le a
nd e
xcis
e w
as p
aid
on h
is p
urch
ases
.5/
Per
mon
th, m
axim
um 1
.2 p
erce
nt6/
Incl
udes
exc
ises
on
impo
rted
luxu
ry g
oods
; bev
erag
es; a
nd m
otor
veh
icle
bas
ed o
n cy
linde
rs.

Table 8. Comparative Excise Burdens on Fuels, 1996
Leaded Unleaded Dieselpetrol petrol
(Multiples of U.S. burden)
Chile 4,6 4,6 1,2
OECD countriesAustralia 5,7 5,4 4,0Austria 12,2 10,4 5,4Belgium 12,2 10,5 5,7Canada 1,6 1,5 0,4Denmark 13,6 11,4 8,9Finland 13,8 11,9 5,8France 14,8 13,7 6,2Germany 14,3 13,0 6,2Greece 10,9 10,4 5,4Iceland 12,0 11,2 0,0Ireland 9,5 8,7 5,6Italy 14,8 13,6 7,5Japan 11,5 11,5 5,3Luxembourg 7,7 6,4 5,8Mexico 1/ ... ... ...Netherlands 15,2 13,5 5,9New Zealand 2/ ... 4,3 0,0Norway 15,7 13,7 7,8Portugal 12,1 11,2 6,0Spain 10,1 9,3 5,1Sweden 13,1 11,6 6,2Switzerland 12,6 11,3 9,0Turkey 3/ ... ... ...United Kingdom 11,6 10,1 7,6 Average 11,7 10,2 5,5
Memorandum item:
U.S. excise rate (US$/1000 litres) 48,61 48,61 64,61
Sources: Consumption Tax Trends, Second Edition (EOCD, 1997); and staff calculations.
1/ In Mexico, the excise is ad valorem: 60.2% (leaded), 46.4% (unleaded), 29.5% (diesel).2/ New Zealand does not use leaded petrol.3/ In Turkey, the excise is ad valorem: 233.5% (leaded), 222% (unleaded), 164.5% (diesel).

Números Anteriores
DTBC-41 Diciembre, 1998Empírical Regularities of Chilean Business CyclesAgnès Belaisch y Claudio Soto
DTBC-40 Diciembre, 1998Evaluación del Sistema Tributario Chilenoy Propuesta de ReformaPablo Serra
DTBC-39 Diciembre, 1998El Sistema Impositivo y su Efecto en el Funcionamientode la Economía: Una Revisión de la LiteraturaPablo Serra
DTBC-38 Diciembre, 1998Productividad y Tipo de Cambio Real en ChileRodrigo Valdés y Valentín Délano
DTBC-37 Diciembre, 1998Stabilization, Inertia, and Inflationary Convergence:A Comparative AnalysisSebastian Edwards y Fernando Lefort
DTBC-36 Diciembre, 1998La Política Monetaria, el Tipo de Cambio Real y el Encajeal Influjo de Capitales: Un Modelo Analítico SimpleGuillermo Le Fort
DTBC-35 Marzo, 1998The Macroeconomic Consequences of Wage Indexation RevisitedEsteban Jadresic
DTBC-34 Marzo, 1998Chile’s Takeoff: Facts, Challenges, LessonsKlaus Schmidt-Hebbel
DTBC-33 Marzo, 1998Does Pension Reform Really Spur Productivity,Saving, and Growth?Klaus Schmidt-Hebbel
DTBC-32 Marzo, 1998Monetary Policy, Interest Rate Rules, and Inflation

Targeting: Some Basic EquivalencesCarlos Végh
DTBC-31 Marzo, 1998Indización, Inercia Inflacionaria y el Coeficiente de SacrificioLuis Oscar Herrera
DTBC-30 Marzo, 1998Causas y Consecuencias de la Indización:Una Revisión de la LiteraturaOscar Landerretche, Fernando Lefort y Rodrigo Valdés
DTBC-29 Marzo, 1998The Chilean Experience Regarding Completing Marketswith Financial IndexationEduardo Walker
DTBC-28 Marzo, 1998Indexed Units of Account: Theory and Assessmentof Historical ExperienceRobert Shiller
DTBC-27 Marzo, 1998Public Debt Indexation and Denomination:The Case of BrazilIlan Goldfajn
DTBC-26 Marzo, 1998Optimal Management of Indexed and Nominal DebtRobert Barro
DTBC-25 Marzo, 1998Liquidez y Decisiones de Inversión en Chile:Evidencia de Sociedades AnónimasJuan Pablo Medina y Rodrigo Valdés
DTBC-24 Octubre, 1997Determinantes del Crecimiento y Estimación del Producto Potencialen Chile: El Rol del ComercioPatricio Rojas, Eduardo López y Susana Jiménez


![Equity aspects in a financial consolidation [in Dutch], by ARSIMA Projects](https://img.pdfslide.us/doc/110x75/5557af63d8b42a4a5d8b500b/equity-aspects-in-a-financial-consolidation-in-dutch-by-arsima-projects.jpg)