Embed Size (px)
Citation preview
City of Chesapeake, VirginiaFY2015-16 Operating Budget
REVENUE BUDGET ECONOMIC CONDITIONS
The resources necessary for local government to provide public services and infrastructure to its citizens are derived, directly or indirectly, from economic activity at the local, regional, state, national, and even international level. Trends in the economy and the demographics affecting the economy are fundamental in understanding the outlook for future revenues and thus for the budgetary capacity to provide public services and infrastructure in future years. The size and demographics of the local population, its employment and income, the level of economic activity within the City, and the growth of invested value in the form of residential and commercial construction, business and household investment in capital equipment, and demand for local real property constitute the environment in which the local revenue base is embedded. International, national, state, and regional economic conditions directly affect the local revenue base by creating demand for goods and services produced in the City, either directly or as components in the supply chain for final products, driving investment returns and interest rates, and creating employment opportunities. Lastly, defense spending on military personnel, supplies and contract services continues to play a significant role in the regional economy. Some of these factors are described below. It should be noted that the City's revenue forecast has a relatively distant horizon, prepared in October of 2014 for the fiscal year ending in June 2016.
Local revenues comprise 84% of General Fund and therefore are the core of the resource base that constitutes the City's ability to provide services. This component includes ad valorum (value-based) taxes on ownership of an asset such as real estate and tangible personal property, transactional taxes such as sales and recordation taxes which are incurred only at the time of transaction, fees for regulatory permits, charges for services, and fines and forfeitures levied by the courts on violations of local ordinances and certain state laws. Intergovernmental revenues from state and federal agencies comprise the other 16% of General Fund resources. While the policies, political dynamics of the respective government units are important factors, revenue-producing economic activity is a key determinant of budgetary capacity and can influence the political will to provide local governments with fiscal assistance.
ECONOMIC, DEMOGRAPHIC AND OTHER FACTORS AFFECTING REVENUES
NATIONAL ECONOMIC OUTLOOK
The vigor of the national economy as a whole reflects the strength of market demand for much of the private goods and services exported by the Hampton Roads region exclusive of Federal civilian and military purchases, including port, warehouse and transportation activity associated with imports. Growth in the amount of goods and services produced by the nation as a whole as measured by the Gross Domestic Product (GDP), growth in employment, the trend in price levels as measured by the Consumer (CPI) and Producer (PPI) Price Indices, and the interest rates that govern the City's cost of long term capital and the return it earns on its short term investment portfolio of cash reserves ("working capital"). This report uses two public sources of national economic forecasts as background for the City's revenue projections, the Congressional Budget Office's annual Budget and Economic Outlook and the Federal Reserve Bank of Philadelphia's quarterly Survey of Professional Forecasters. The National Bureau of Economic Research is used as the generally accepted reference for determination of benchmarks for the national business cycles.
Business Cycle: Recession & Expansion
The Business Cycle Dating Committee of the National Bureau of Economic Research determined that the severe recession which began in December of 2007 reached its trough in June 2009. The nation is now in the 21st quarter (63rd month) of recovery from a contraction that lasted 18 months, and that followed a 73 month period of expansion from the trough of the 2001 recession. Recent studies indicate that long, slow recoveries are typical for recessions caused by financial crises, as is the case now, in contrast to other causes (From Recession to Recovery: How Soon and How Strong? , Chapter 3 In: International Monetary Fund, World Economic Outlook April 2009, Washington, DC: 228pp. ). Not only is the U.S. still laboring to recover from the "Great Recession" as it is now called, but its trading partners in Europe and Asia are also struggling with recovery from the the same event, as well as internal issues, so a supplementary boost to aggregate demand from overseas is hampered. There is some evidence that the long range outlook for the economy is one of repeating cycles of secular stagnation where underlying changes in the economy, such as slowing growth in the working-age population, will make business cycles like the past six years in Europe and the US, and the last 20 years in Japan, likely to happen with some frequency in the future, resulting in persistent shortfalls of aggregate demand which can’t be overcome even with near-zero interest rates. In addition, some economists show evidence that the growth of economic potential (potential GDP) is slowing in developed nations, contributing to secular stagnation by reducing investment demand (Secular Stagnation: Facts, Causes, and Cures, Coen Teulings and Richard Baldwin (eds), CEPR Press 2014). Not all economic reviews have such reservations. Among other publicly available analyses, Wells Fargo's August and September monthly economic newsletters are quite optimistic about the track of the recovery. But then again, the same group of economists trading as Wachovia predicted in their December 21, 2007 newsletter-"slower growth, but no recession".
FY2015-16 Operating Budget C-1 As Amended June 9, 2015
City of Chesapeake, VirginiaFY2015-16 Operating Budget
REVENUE BUDGET ECONOMIC CONDITIONS
Actual2013 2014 2015 2016 2017
3.23% 4.19% 5.07% 5.30% 4.92%1.72% 2.68% 3.34% 3.41% 2.97%1.47% 1.68% 1.97% 2.11% 2.20%1.01% 1.21% 1.36% 1.30% 1.14%2.95% 4.33% 5.12% 5.36% 5.64%4.19% 0.62% 4.37% 5.56% -0.42%0.06% 0.15% 0.38% 1.81% 3.31%2.35% 3.14% 3.74% 4.30% 4.82%
Actual2013 2014 2015 2016 20173.2% 3.7% 4.9% N.A. N.A.1.7% 2.1% 3.1% 2.9% 2.8%1.4% 2.3% 2.2% 2.3% N.A1.6% 1.8% 1.9% N.A N.A0.1% 0.0% 0.4% 1.8% 2.9%2.3% 2.7% 3.3% 3.9% 4.4%
Congressional Budget Office Forecast
Survey of Professional Forecasters Median Forecast
CBO Forecast
Philadelphia Federal Reserve
Economic Forecast for Calendar Years 2014 through 2016
Survey of Professional Forecasters
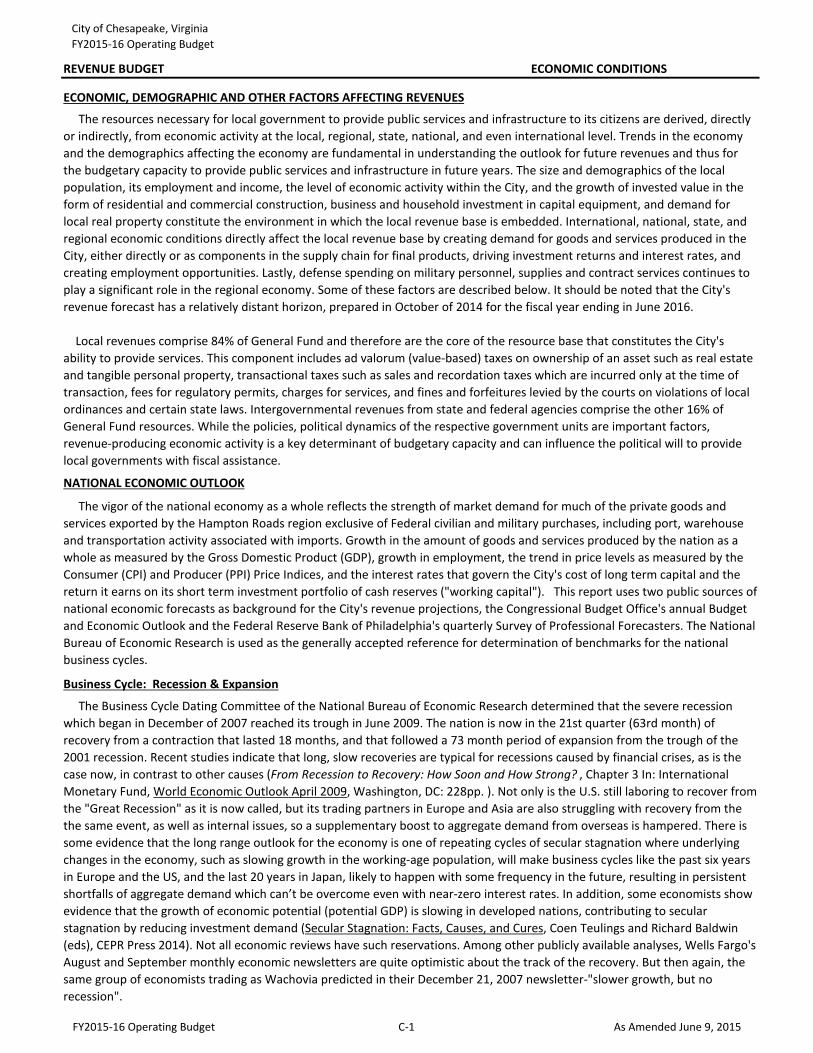
The outlook in the third quarter of 2014 for growth in the U.S. economy over the next four years is mostly unchanged from that of three months ago, according to 43 professional economic forecasters surveyed by the Federal Reserve Bank of Philadelphia. The panel expects real GDP to grow at an annual rate of 3.0 percent this quarter and 3.1 percent next quarter. On an annual-average over annual-average basis, the forecasters see real GDP growing 2.1 percent in 2014, down from the previous estimate of 2.4 percent. The forecasters predict real GDP will grow 3.1 percent in 2015, 2.9 percent in 2016, and 2.8 percent in 2017. Expectations of healthier conditions in the labor market accompany the nearly stable outlook for output growth. The forecasters predict the unemployment rate will be an annual average of 6.3 percent in 2014, before falling to 5.7 percent in 2015, 5.4 percent in 2016, and 5.3 percent in 2017. These projections are below those of the last survey. The forecasters are also more optimistic about the employment outlook. They have revised upward their estimates of the growth in jobs in the next four quarters. The forecasters see nonfarm payroll employment growing at a rate of 228,600 jobs per month this quarter and 211,200 jobs per month next quarter. The forecasters' projections for the annual-average level of nonfarm payroll employment suggest job gains at a monthly rate of 204,800 in 2014 and 214,000 in 2015.
In February 2014, CBO projected that the economy will grow at a solid pace in 2014 and for the next few years. Real GDP (output adjusted to remove the effects of inflation) is expected to increase by roughly 3 percent between the fourth quarter of 2013 and the fourth quarter of 2014. Similar annual growth rates are projected through 2017. However, CBO also estimated that the economy will continue to have considerable unused labor and capital resources (“slack”) for the next few years. The unemployment rate is expected to decline, but will remain above 6.0 percent until late 2016. The rate of participation in the labor force is projected to move only slowly back toward what it would be without the cyclical weakness in the economy. Of concern for the more distant forecast horizon are that the deep recession and slow recovery have resulted in a decline in the potential Gross Domestic Product by as much as 7.6% by 2017, attributable to the lapse in the rate of public and private investment and to the erosion of the nation's stock of human capital. In practical terms, this means that the level of GDP and rate of economic growth which can be achieved by the recovery in the long run has declined.
Congressional Budget Office
Three-Month Treasury Bill Rate Ten-Year Treasury Note Rate
February 2014 Forecast
Consumer Price Index Change
Nominal GDP GrowthReal GDP Growth
Personal Income (Nominal)Corporate Profits, VA & CCAdj
Employment Growth (Household)
Forecasts 3rd Qtr 2014
Employment Growth (Household)
Nominal GDP GrowthReal GDP Growth
Three-Month Treasury Bill Rate Ten-Year Treasury Note Rate
Consumer Price Index Change
FY2015-16 Operating Budget C-2 As Amended June 9, 2015
City of Chesapeake, VirginiaFY2015-16 Operating Budget
REVENUE BUDGET ECONOMIC CONDITIONS
Actual2012 2013 2014 2015 2016
1.20% 1.3% 1.0% 1.5% 1.7%0.4% 0.7% 1.4%
4.70% 3.0% 2.9% 4.3% 4.4%1.6% 3.7% 3.8%
2.70% 3.0% 2.6% 4.0% 4.2%1.1% 3.2% 3.6%
1.50% 1.7% 1.6% 2.5% 2.5%0.8% 2.5% 2.1%
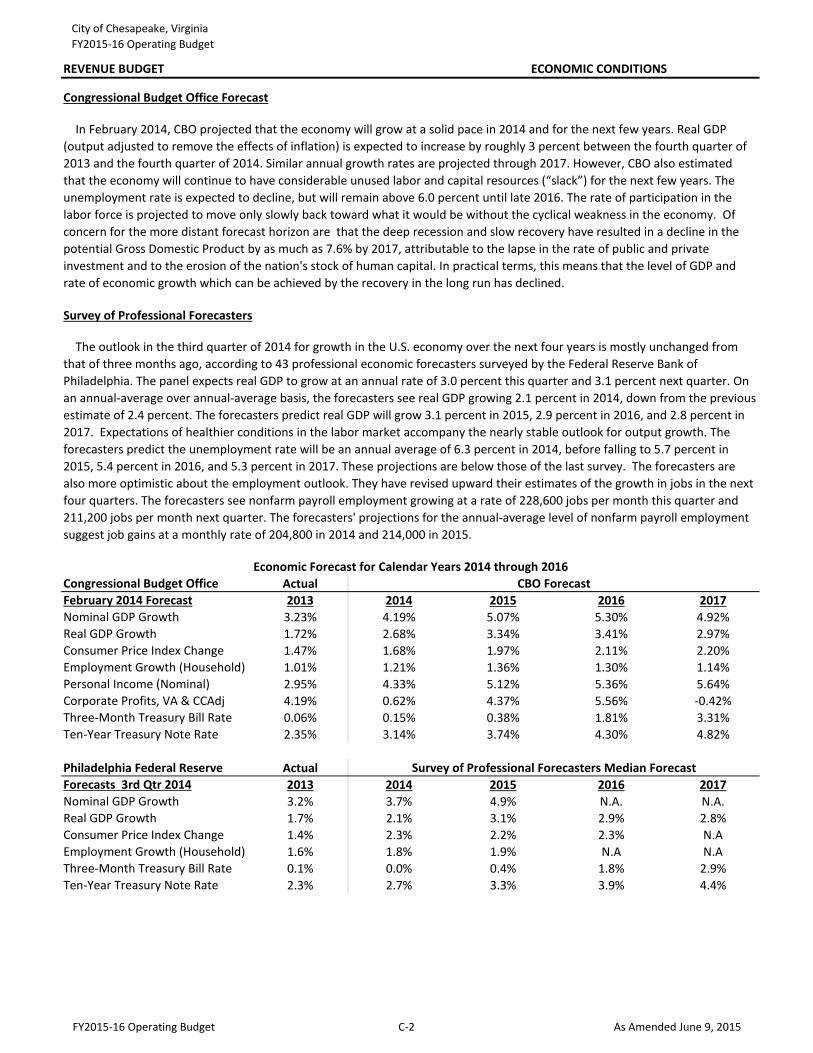
The state forecasts of economic conditions and revenues used here are taken from the Governor's fiscal and economic reports to the Virginia legislature's Joint Money Committee in December and the following August. The economic forecast is developed with the assistance of the Joint Advisory Board of Economists (JABE), and forms the basis of the budgetary deliberations of the Governor's Advisory Council on Revenue Estimates (GACRE) under Code of Virginia § 2.2-1503. The revised projections in the August 2014 report relate to a slowdown in Virginia's economic recovery, brought on in large part by federal austerity measures, particularly in the area of defense spending.
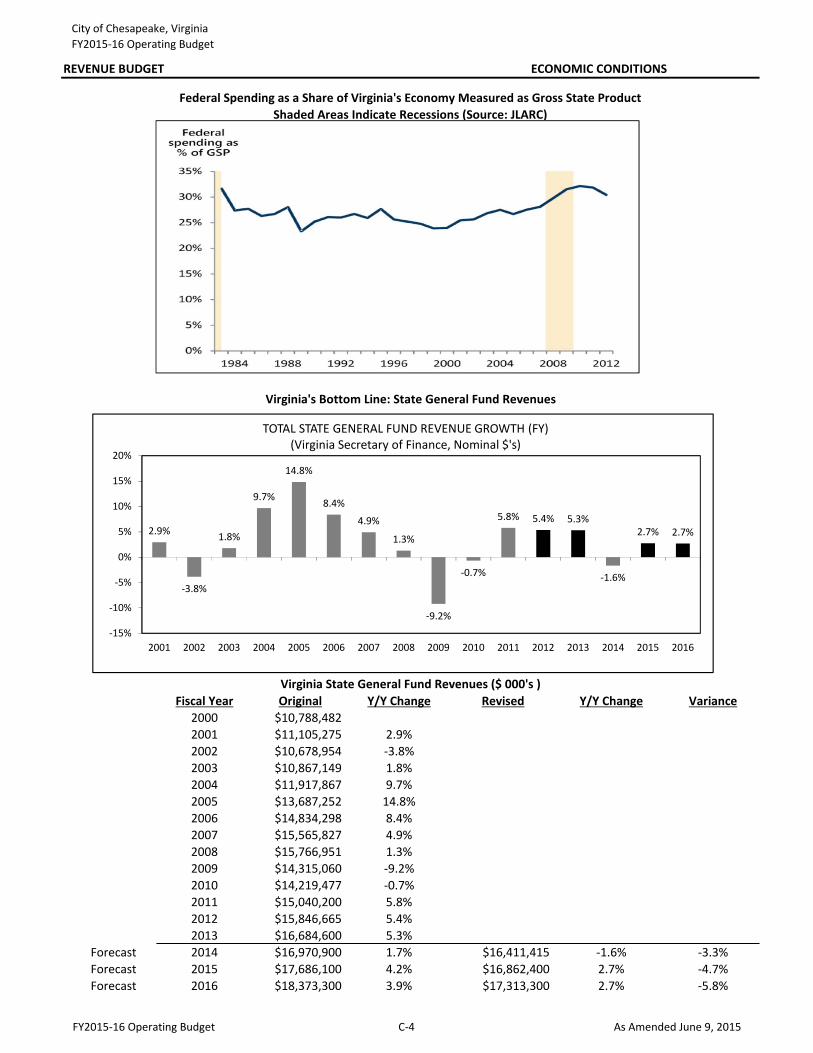
A report by Virginia's Joint Legislative Audit and Review Committee (JLARC) issued in June 2014 finds that Federal spending per person in Virginia has doubled over the past 30 years when adjusted for inflation. Federal spending per person has been higher in Virginia than in any state except Alaska during this period. Military spending has been the largest source of growth in Federal spending, becoming about four times the national average, followed by non-military contracts for goods and services. Federal spending accounted for about 24 percent of the state’s economy in 2000, increasing to 30 percent in 2012. Less than 10 percent of federal spending was for income assistance, education, and transportation.
Federal Spending in Virginia
Forecast
STATE ECONOMIC OUTLOOK
Virginia-Governor's ForecastOriginal & Revised Economic Forecast for Fiscal Years 2014 through 2016
Economic conditions at the state level have important implications for local revenues in terms of both an export base market for goods and services produced by local and regional businesses and the budgetary capacity of the State to provide intergovernmental funding support of local government services and state-imposed mandates. State revenue growth provides opportunity to address key hard infrastructure issues such as roads and bridges, as well as social infrastructure such as education and public safety. Also important is the state's ability to sustain its commitment to funding programs such as road maintenance and the Personal Property Tax Relief Act.
Virginia-Governor's Forecast
Employment Growth (Household)
Personal Income Growth
Wages & Salaries Growth
Economic Indicator
Average Wage GrowthRevised
Revised
Revised
Revised
FY2015-16 Operating Budget C-3 As Amended June 9, 2015
City of Chesapeake, VirginiaFY2015-16 Operating Budget
REVENUE BUDGET ECONOMIC CONDITIONS
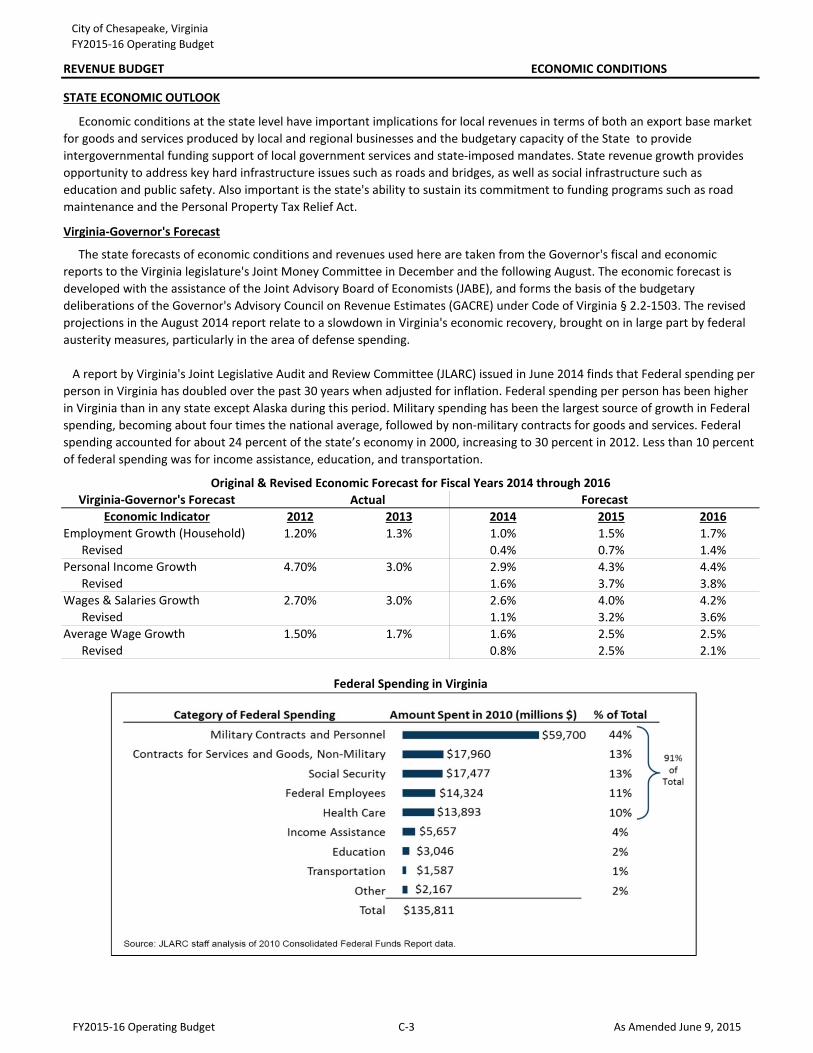
Fiscal Year Original Y/Y Change Revised Y/Y Change Variance2000 $10,788,4822001 $11,105,275 2.9%2002 $10,678,954 -3.8%2003 $10,867,149 1.8%2004 $11,917,867 9.7%2005 $13,687,252 14.8%2006 $14,834,298 8.4%2007 $15,565,827 4.9%2008 $15,766,951 1.3%2009 $14,315,060 -9.2%2010 $14,219,477 -0.7%2011 $15,040,200 5.8%2012 $15,846,665 5.4%2013 $16,684,600 5.3%
Forecast 2014 $16,970,900 1.7% $16,411,415 -1.6% -3.3%Forecast 2015 $17,686,100 4.2% $16,862,400 2.7% -4.7%Forecast 2016 $18,373,300 3.9% $17,313,300 2.7% -5.8%
Federal Spending as a Share of Virginia's Economy Measured as Gross State ProductShaded Areas Indicate Recessions (Source: JLARC)
Virginia's Bottom Line: State General Fund Revenues
Virginia State General Fund Revenues ($ 000's )
2.9%
-3.8%
1.8%
9.7%
14.8%
8.4%
4.9%
1.3%
-9.2%
-0.7%
5.8% 5.4% 5.3%
-1.6%
2.7% 2.7%
-15%
-10%
-5%
0%
5%
10%
15%
20%
2001 2002 2003 2004 2005 2006 2007 2008 2009 2010 2011 2012 2013 2014 2015 2016
TOTAL STATE GENERAL FUND REVENUE GROWTH (FY)(Virginia Secretary of Finance, Nominal $'s)
FY2015-16 Operating Budget C-4 As Amended June 9, 2015
City of Chesapeake, VirginiaFY2015-16 Operating Budget
REVENUE BUDGET ECONOMIC CONDITIONS
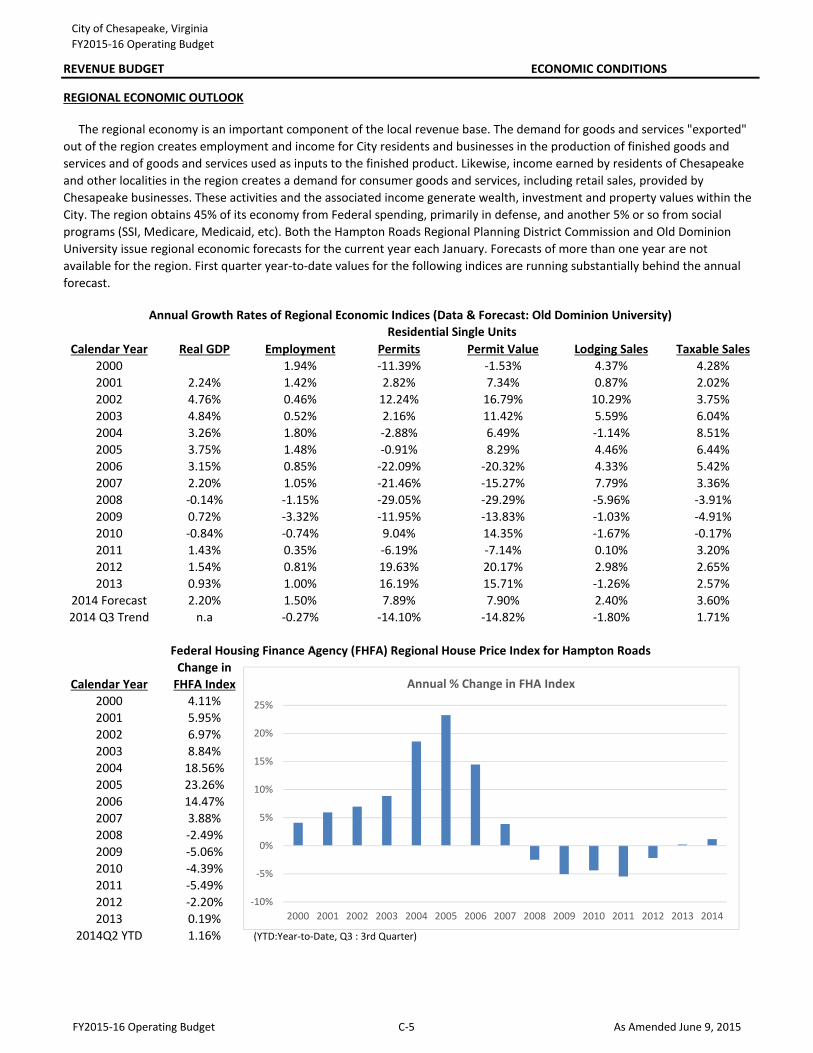
Calendar Year Real GDP Employment Permits Permit Value Lodging Sales Taxable Sales2000 1.94% -11.39% -1.53% 4.37% 4.28%2001 2.24% 1.42% 2.82% 7.34% 0.87% 2.02%2002 4.76% 0.46% 12.24% 16.79% 10.29% 3.75%2003 4.84% 0.52% 2.16% 11.42% 5.59% 6.04%2004 3.26% 1.80% -2.88% 6.49% -1.14% 8.51%2005 3.75% 1.48% -0.91% 8.29% 4.46% 6.44%2006 3.15% 0.85% -22.09% -20.32% 4.33% 5.42%2007 2.20% 1.05% -21.46% -15.27% 7.79% 3.36%2008 -0.14% -1.15% -29.05% -29.29% -5.96% -3.91%2009 0.72% -3.32% -11.95% -13.83% -1.03% -4.91%2010 -0.84% -0.74% 9.04% 14.35% -1.67% -0.17%2011 1.43% 0.35% -6.19% -7.14% 0.10% 3.20%2012 1.54% 0.81% 19.63% 20.17% 2.98% 2.65%2013 0.93% 1.00% 16.19% 15.71% -1.26% 2.57%
2014 Forecast 2.20% 1.50% 7.89% 7.90% 2.40% 3.60%2014 Q3 Trend n.a -0.27% -14.10% -14.82% -1.80% 1.71%
Change inCalendar Year FHFA Index
2000 4.11%2001 5.95%2002 6.97%2003 8.84%2004 18.56%2005 23.26%2006 14.47%2007 3.88%2008 -2.49%2009 -5.06%2010 -4.39%2011 -5.49%2012 -2.20%2013 0.19%
2014Q2 YTD 1.16% (YTD:Year-to-Date, Q3 : 3rd Quarter)
Residential Single Units
Federal Housing Finance Agency (FHFA) Regional House Price Index for Hampton Roads
Annual Growth Rates of Regional Economic Indices (Data & Forecast: Old Dominion University)
The regional economy is an important component of the local revenue base. The demand for goods and services "exported" out of the region creates employment and income for City residents and businesses in the production of finished goods and services and of goods and services used as inputs to the finished product. Likewise, income earned by residents of Chesapeake and other localities in the region creates a demand for consumer goods and services, including retail sales, provided by Chesapeake businesses. These activities and the associated income generate wealth, investment and property values within the City. The region obtains 45% of its economy from Federal spending, primarily in defense, and another 5% or so from social programs (SSI, Medicare, Medicaid, etc). Both the Hampton Roads Regional Planning District Commission and Old Dominion University issue regional economic forecasts for the current year each January. Forecasts of more than one year are not available for the region. First quarter year-to-date values for the following indices are running substantially behind the annual forecast.
REGIONAL ECONOMIC OUTLOOK
-10%
-5%
0%
5%
10%
15%
20%
25%
2000 2001 2002 2003 2004 2005 2006 2007 2008 2009 2010 2011 2012 2013 2014
Annual % Change in FHA Index
FY2015-16 Operating Budget C-5 As Amended June 9, 2015
City of Chesapeake, VirginiaFY2015-16 Operating Budget
REVENUE BUDGET ECONOMIC CONDITIONS
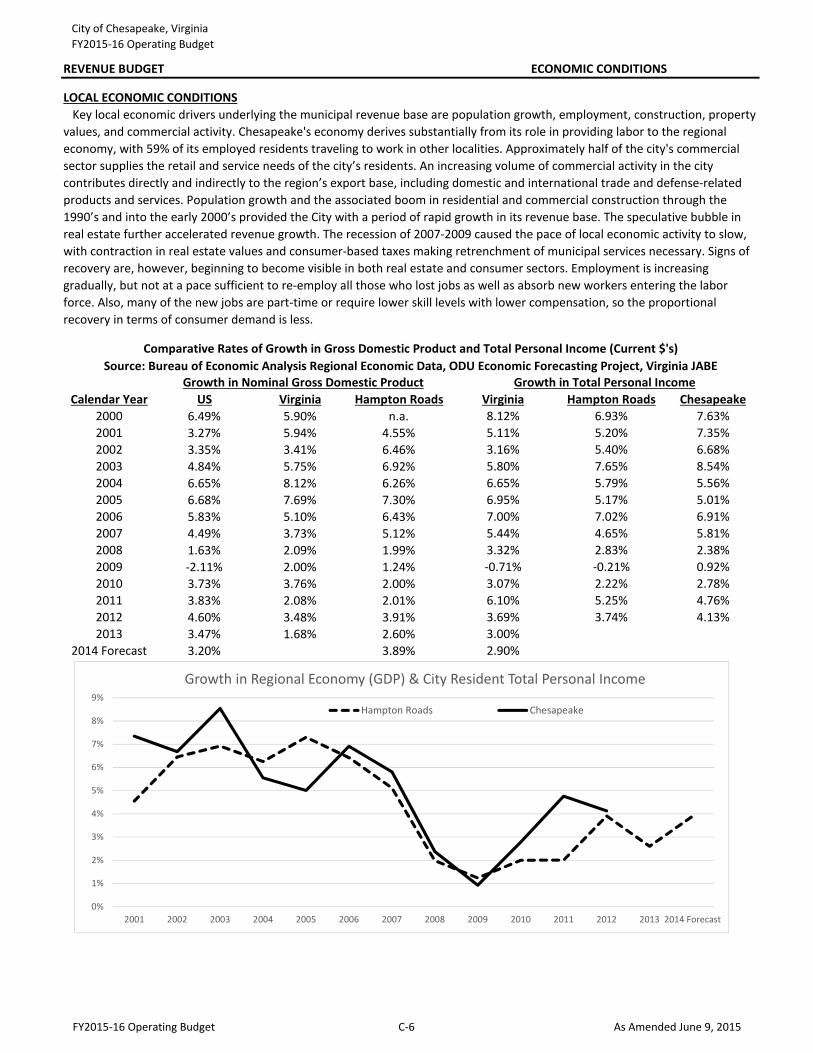
Calendar Year US Virginia Hampton Roads Virginia Hampton Roads Chesapeake2000 6.49% 5.90% n.a. 8.12% 6.93% 7.63%2001 3.27% 5.94% 4.55% 5.11% 5.20% 7.35%2002 3.35% 3.41% 6.46% 3.16% 5.40% 6.68%2003 4.84% 5.75% 6.92% 5.80% 7.65% 8.54%2004 6.65% 8.12% 6.26% 6.65% 5.79% 5.56%2005 6.68% 7.69% 7.30% 6.95% 5.17% 5.01%2006 5.83% 5.10% 6.43% 7.00% 7.02% 6.91%2007 4.49% 3.73% 5.12% 5.44% 4.65% 5.81%2008 1.63% 2.09% 1.99% 3.32% 2.83% 2.38%2009 -2.11% 2.00% 1.24% -0.71% -0.21% 0.92%2010 3.73% 3.76% 2.00% 3.07% 2.22% 2.78%2011 3.83% 2.08% 2.01% 6.10% 5.25% 4.76%2012 4.60% 3.48% 3.91% 3.69% 3.74% 4.13%2013 3.47% 1.68% 2.60% 3.00%
2014 Forecast 3.20% 3.89% 2.90%
Source: Bureau of Economic Analysis Regional Economic Data, ODU Economic Forecasting Project, Virginia JABE
Key local economic drivers underlying the municipal revenue base are population growth, employment, construction, property values, and commercial activity. Chesapeake's economy derives substantially from its role in providing labor to the regional economy, with 59% of its employed residents traveling to work in other localities. Approximately half of the city's commercial sector supplies the retail and service needs of the city’s residents. An increasing volume of commercial activity in the city contributes directly and indirectly to the region’s export base, including domestic and international trade and defense-related products and services. Population growth and the associated boom in residential and commercial construction through the 1990’s and into the early 2000’s provided the City with a period of rapid growth in its revenue base. The speculative bubble in real estate further accelerated revenue growth. The recession of 2007-2009 caused the pace of local economic activity to slow, with contraction in real estate values and consumer-based taxes making retrenchment of municipal services necessary. Signs of recovery are, however, beginning to become visible in both real estate and consumer sectors. Employment is increasing gradually, but not at a pace sufficient to re-employ all those who lost jobs as well as absorb new workers entering the labor force. Also, many of the new jobs are part-time or require lower skill levels with lower compensation, so the proportional recovery in terms of consumer demand is less.
Growth in Total Personal Income
LOCAL ECONOMIC CONDITIONS
Comparative Rates of Growth in Gross Domestic Product and Total Personal Income (Current $'s)
Growth in Nominal Gross Domestic Product
0%
1%
2%
3%
4%
5%
6%
7%
8%
9%
2001 2002 2003 2004 2005 2006 2007 2008 2009 2010 2011 2012 2013 2014 Forecast
Growth in Regional Economy (GDP) & City Resident Total Personal Income
Hampton Roads Chesapeake
FY2015-16 Operating Budget C-6 As Amended June 9, 2015
City of Chesapeake, VirginiaFY2015-16 Operating Budget
REVENUE BUDGET ECONOMIC CONDITIONS
Population
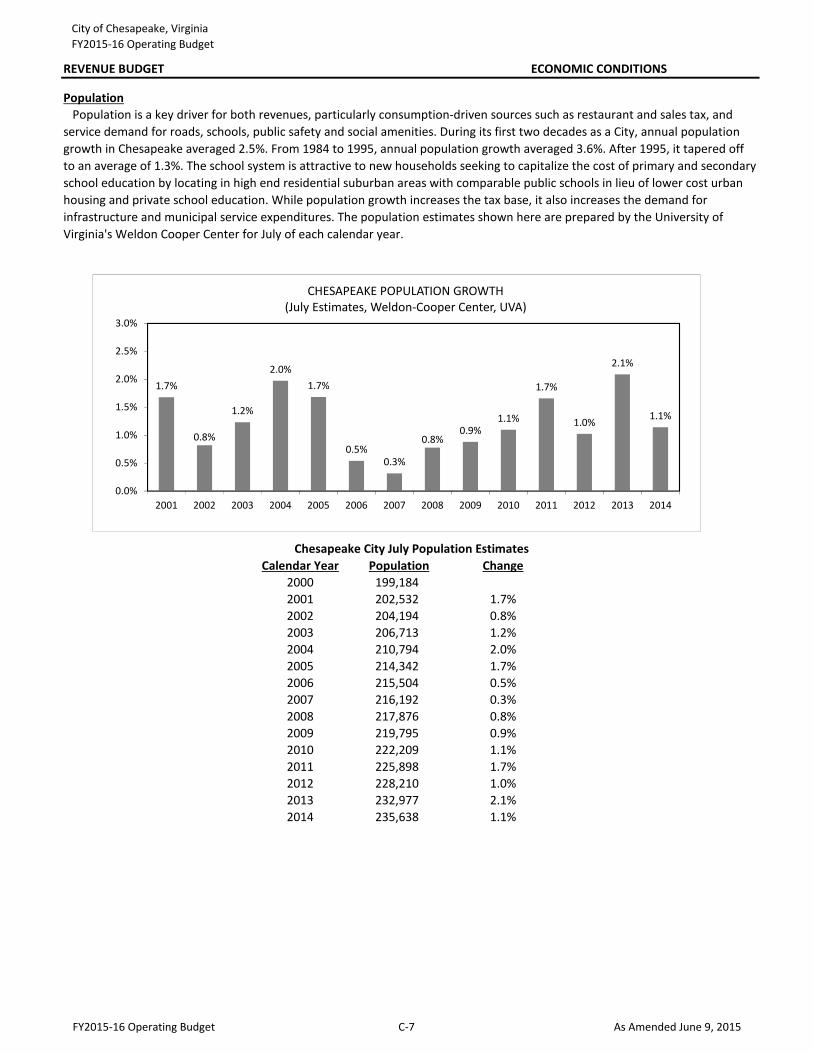
Calendar Year Population Change2000 199,1842001 202,532 1.7%2002 204,194 0.8%2003 206,713 1.2%2004 210,794 2.0%2005 214,342 1.7%2006 215,504 0.5%2007 216,192 0.3%2008 217,876 0.8%2009 219,795 0.9%2010 222,209 1.1%2011 225,898 1.7%2012 228,210 1.0%2013 232,977 2.1%2014 235,638 1.1%
Population is a key driver for both revenues, particularly consumption-driven sources such as restaurant and sales tax, and service demand for roads, schools, public safety and social amenities. During its first two decades as a City, annual population growth in Chesapeake averaged 2.5%. From 1984 to 1995, annual population growth averaged 3.6%. After 1995, it tapered off to an average of 1.3%. The school system is attractive to new households seeking to capitalize the cost of primary and secondary school education by locating in high end residential suburban areas with comparable public schools in lieu of lower cost urban housing and private school education. While population growth increases the tax base, it also increases the demand for infrastructure and municipal service expenditures. The population estimates shown here are prepared by the University of Virginia's Weldon Cooper Center for July of each calendar year.
Chesapeake City July Population Estimates
1.7%
0.8%
1.2%
2.0%1.7%
0.5%0.3%
0.8%0.9%
1.1%
1.7%
1.0%
2.1%
1.1%
0.0%
0.5%
1.0%
1.5%
2.0%
2.5%
3.0%
2001 2002 2003 2004 2005 2006 2007 2008 2009 2010 2011 2012 2013 2014
CHESAPEAKE POPULATION GROWTH(July Estimates, Weldon-Cooper Center, UVA)
FY2015-16 Operating Budget C-7 As Amended June 9, 2015
City of Chesapeake, VirginiaFY2015-16 Operating Budget
REVENUE BUDGET ECONOMIC CONDITIONS
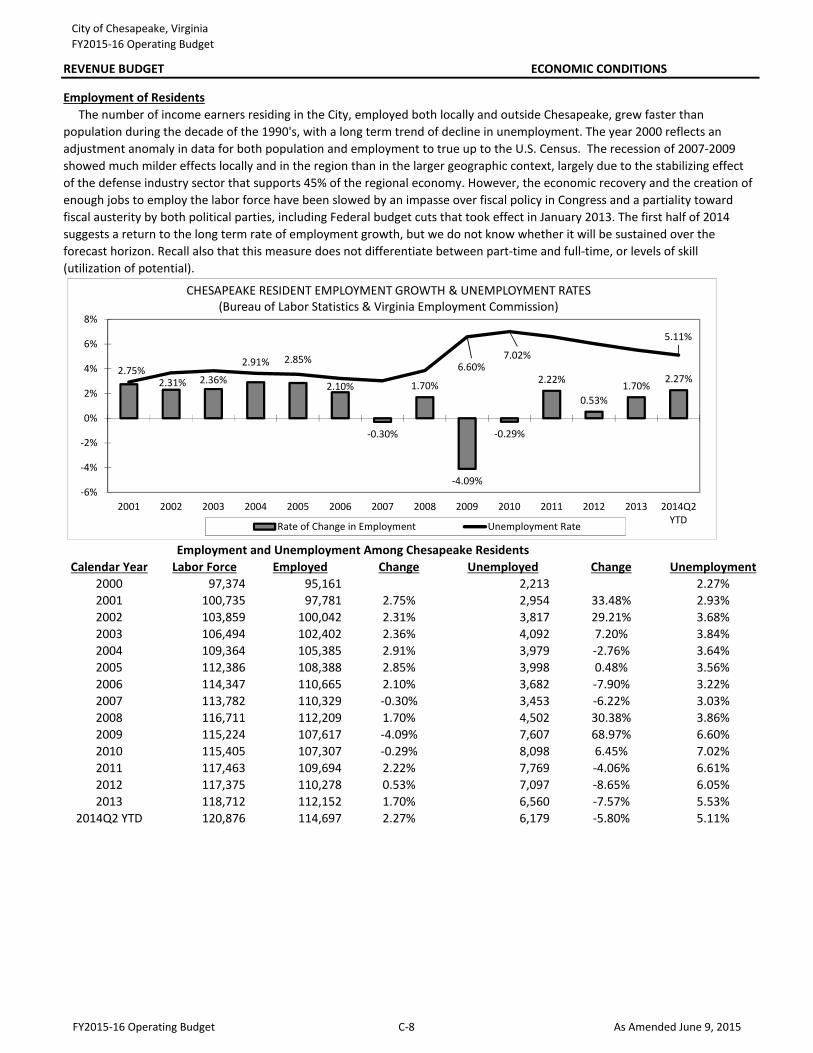
Calendar Year Labor Force Employed Change Unemployed Change Unemployment2000 97,374 95,161 2,213 2.27%2001 100,735 97,781 2.75% 2,954 33.48% 2.93%2002 103,859 100,042 2.31% 3,817 29.21% 3.68%2003 106,494 102,402 2.36% 4,092 7.20% 3.84%2004 109,364 105,385 2.91% 3,979 -2.76% 3.64%2005 112,386 108,388 2.85% 3,998 0.48% 3.56%2006 114,347 110,665 2.10% 3,682 -7.90% 3.22%2007 113,782 110,329 -0.30% 3,453 -6.22% 3.03%2008 116,711 112,209 1.70% 4,502 30.38% 3.86%2009 115,224 107,617 -4.09% 7,607 68.97% 6.60%2010 115,405 107,307 -0.29% 8,098 6.45% 7.02%2011 117,463 109,694 2.22% 7,769 -4.06% 6.61%2012 117,375 110,278 0.53% 7,097 -8.65% 6.05%2013 118,712 112,152 1.70% 6,560 -7.57% 5.53%
2014Q2 YTD 120,876 114,697 2.27% 6,179 -5.80% 5.11%
The number of income earners residing in the City, employed both locally and outside Chesapeake, grew faster than population during the decade of the 1990's, with a long term trend of decline in unemployment. The year 2000 reflects an adjustment anomaly in data for both population and employment to true up to the U.S. Census. The recession of 2007-2009 showed much milder effects locally and in the region than in the larger geographic context, largely due to the stabilizing effect of the defense industry sector that supports 45% of the regional economy. However, the economic recovery and the creation of enough jobs to employ the labor force have been slowed by an impasse over fiscal policy in Congress and a partiality toward fiscal austerity by both political parties, including Federal budget cuts that took effect in January 2013. The first half of 2014 suggests a return to the long term rate of employment growth, but we do not know whether it will be sustained over the forecast horizon. Recall also that this measure does not differentiate between part-time and full-time, or levels of skill (utilization of potential).
Employment of Residents
Employment and Unemployment Among Chesapeake Residents
2.75%2.31% 2.36%
2.91% 2.85%
2.10%
-0.30%
1.70%
-4.09%
-0.29%
2.22%
0.53%1.70%
2.27%6.60%
7.02%
5.11%
-6%
-4%
-2%
0%
2%
4%
6%
8%
2001 2002 2003 2004 2005 2006 2007 2008 2009 2010 2011 2012 2013 2014Q2YTD
CHESAPEAKE RESIDENT EMPLOYMENT GROWTH & UNEMPLOYMENT RATES(Bureau of Labor Statistics & Virginia Employment Commission)
Rate of Change in Employment Unemployment Rate
FY2015-16 Operating Budget C-8 As Amended June 9, 2015
City of Chesapeake, VirginiaFY2015-16 Operating Budget
REVENUE BUDGET ECONOMIC CONDITIONS
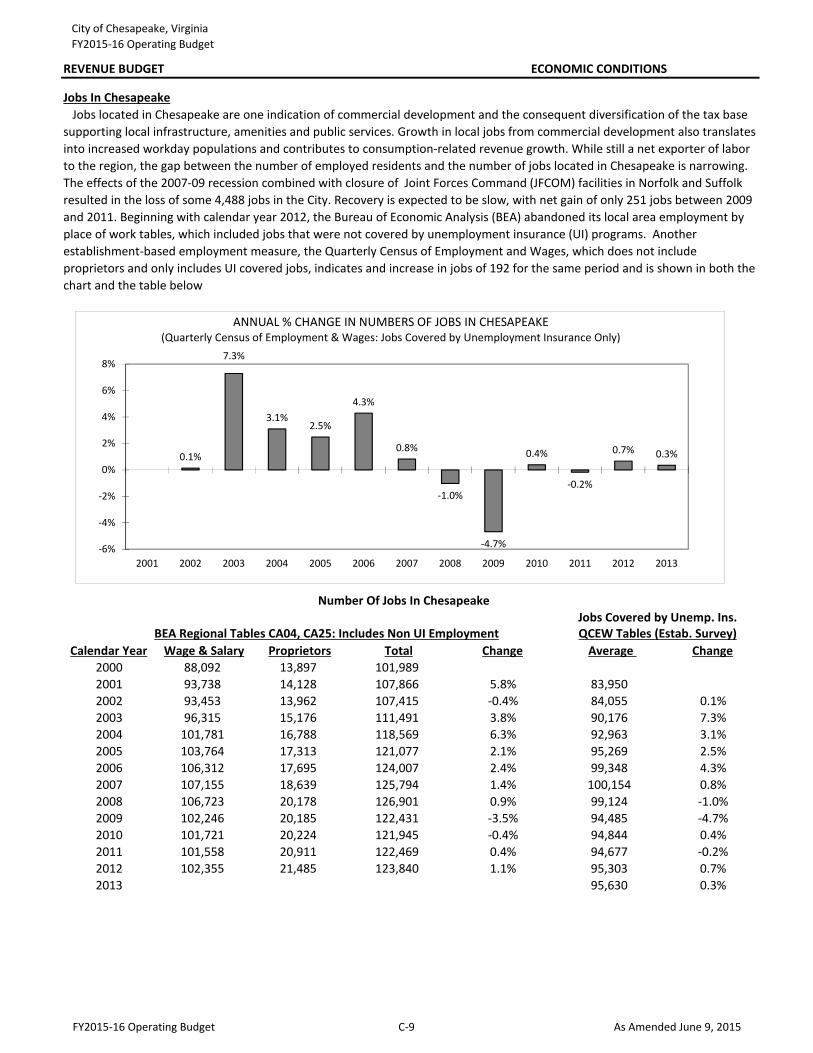
Calendar Year Wage & Salary Proprietors Total Change Average Change2000 88,092 13,897 101,9892001 93,738 14,128 107,866 5.8% 83,9502002 93,453 13,962 107,415 -0.4% 84,055 0.1%2003 96,315 15,176 111,491 3.8% 90,176 7.3%2004 101,781 16,788 118,569 6.3% 92,963 3.1%2005 103,764 17,313 121,077 2.1% 95,269 2.5%2006 106,312 17,695 124,007 2.4% 99,348 4.3%2007 107,155 18,639 125,794 1.4% 100,154 0.8%2008 106,723 20,178 126,901 0.9% 99,124 -1.0%2009 102,246 20,185 122,431 -3.5% 94,485 -4.7%2010 101,721 20,224 121,945 -0.4% 94,844 0.4%2011 101,558 20,911 122,469 0.4% 94,677 -0.2%2012 102,355 21,485 123,840 1.1% 95,303 0.7%2013 95,630 0.3%
QCEW Tables (Estab. Survey)Jobs Covered by Unemp. Ins.
Jobs In Chesapeake Jobs located in Chesapeake are one indication of commercial development and the consequent diversification of the tax base supporting local infrastructure, amenities and public services. Growth in local jobs from commercial development also translates into increased workday populations and contributes to consumption-related revenue growth. While still a net exporter of labor to the region, the gap between the number of employed residents and the number of jobs located in Chesapeake is narrowing. The effects of the 2007-09 recession combined with closure of Joint Forces Command (JFCOM) facilities in Norfolk and Suffolk resulted in the loss of some 4,488 jobs in the City. Recovery is expected to be slow, with net gain of only 251 jobs between 2009 and 2011. Beginning with calendar year 2012, the Bureau of Economic Analysis (BEA) abandoned its local area employment by place of work tables, which included jobs that were not covered by unemployment insurance (UI) programs. Another establishment-based employment measure, the Quarterly Census of Employment and Wages, which does not include proprietors and only includes UI covered jobs, indicates and increase in jobs of 192 for the same period and is shown in both the chart and the table below
Number Of Jobs In Chesapeake
BEA Regional Tables CA04, CA25: Includes Non UI Employment
0.1%
7.3%
3.1%2.5%
4.3%
0.8%
-1.0%
-4.7%
0.4%
-0.2%
0.7% 0.3%
-6%
-4%
-2%
0%
2%
4%
6%
8%
2001 2002 2003 2004 2005 2006 2007 2008 2009 2010 2011 2012 2013
ANNUAL % CHANGE IN NUMBERS OF JOBS IN CHESAPEAKE(Quarterly Census of Employment & Wages: Jobs Covered by Unemployment Insurance Only)
FY2015-16 Operating Budget C-9 As Amended June 9, 2015
City of Chesapeake, VirginiaFY2015-16 Operating Budget
REVENUE BUDGET ECONOMIC CONDITIONS
HamptonCalendar Year Virginia Change Roads MSA Change Chesapeake Change
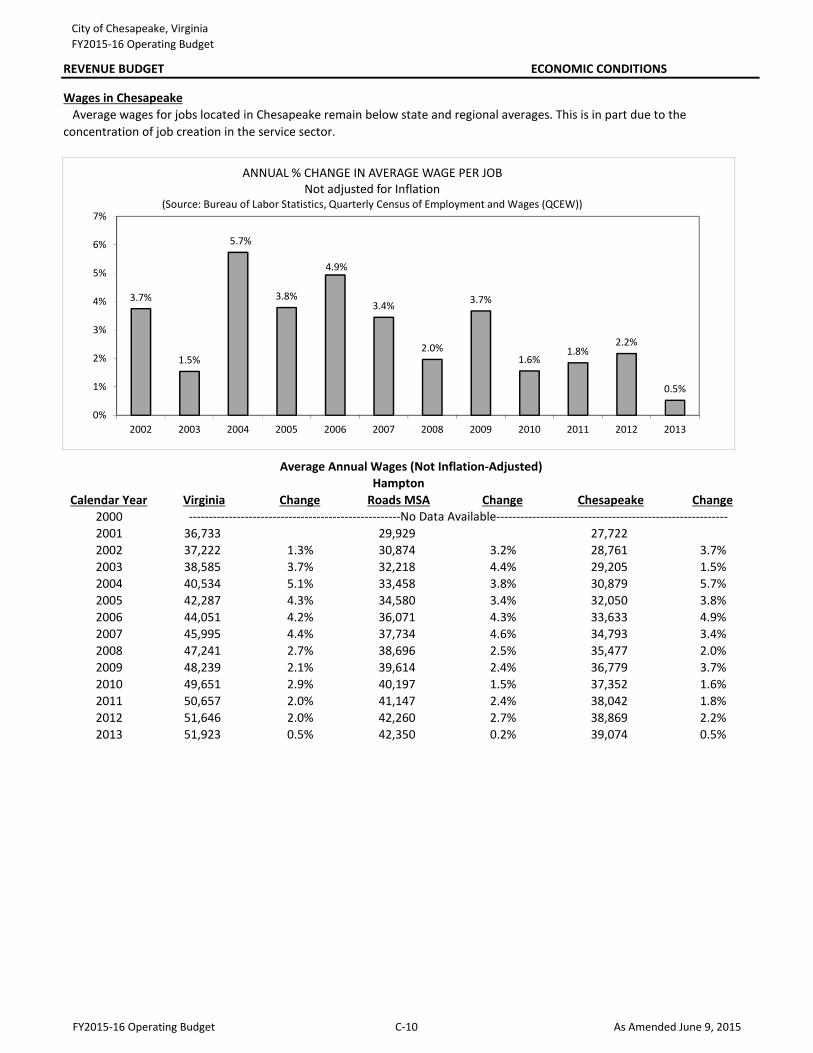
20002001 36,733 29,929 27,7222002 37,222 1.3% 30,874 3.2% 28,761 3.7%2003 38,585 3.7% 32,218 4.4% 29,205 1.5%2004 40,534 5.1% 33,458 3.8% 30,879 5.7%2005 42,287 4.3% 34,580 3.4% 32,050 3.8%2006 44,051 4.2% 36,071 4.3% 33,633 4.9%2007 45,995 4.4% 37,734 4.6% 34,793 3.4%2008 47,241 2.7% 38,696 2.5% 35,477 2.0%2009 48,239 2.1% 39,614 2.4% 36,779 3.7%2010 49,651 2.9% 40,197 1.5% 37,352 1.6%2011 50,657 2.0% 41,147 2.4% 38,042 1.8%2012 51,646 2.0% 42,260 2.7% 38,869 2.2%2013 51,923 0.5% 42,350 0.2% 39,074 0.5%
Average Annual Wages (Not Inflation-Adjusted)
Average wages for jobs located in Chesapeake remain below state and regional averages. This is in part due to the concentration of job creation in the service sector.
Wages in Chesapeake
-----------------------------------------------------No Data Available----------------------------------------------------------
3.7%
1.5%
5.7%
3.8%
4.9%
3.4%
2.0%
3.7%
1.6%1.8%
2.2%
0.5%
0%
1%
2%
3%
4%
5%
6%
7%
2002 2003 2004 2005 2006 2007 2008 2009 2010 2011 2012 2013
ANNUAL % CHANGE IN AVERAGE WAGE PER JOBNot adjusted for Inflation
(Source: Bureau of Labor Statistics, Quarterly Census of Employment and Wages (QCEW))
FY2015-16 Operating Budget C-10 As Amended June 9, 2015
City of Chesapeake, VirginiaFY2015-16 Operating Budget
REVENUE BUDGET ECONOMIC CONDITIONS
HamptonCalendar Year Virginia Change Roads MSA Change Chesapeake Change
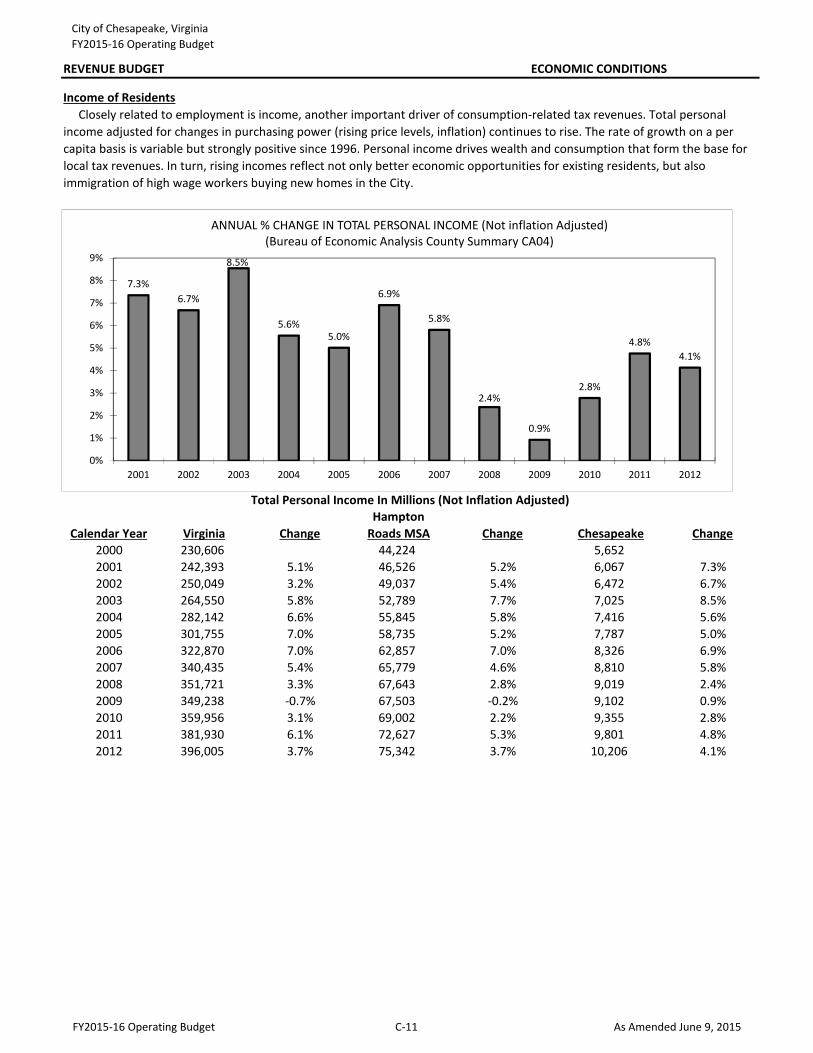
2000 230,606 44,224 5,6522001 242,393 5.1% 46,526 5.2% 6,067 7.3%2002 250,049 3.2% 49,037 5.4% 6,472 6.7%2003 264,550 5.8% 52,789 7.7% 7,025 8.5%2004 282,142 6.6% 55,845 5.8% 7,416 5.6%2005 301,755 7.0% 58,735 5.2% 7,787 5.0%2006 322,870 7.0% 62,857 7.0% 8,326 6.9%2007 340,435 5.4% 65,779 4.6% 8,810 5.8%2008 351,721 3.3% 67,643 2.8% 9,019 2.4%2009 349,238 -0.7% 67,503 -0.2% 9,102 0.9%2010 359,956 3.1% 69,002 2.2% 9,355 2.8%2011 381,930 6.1% 72,627 5.3% 9,801 4.8%2012 396,005 3.7% 75,342 3.7% 10,206 4.1%
Total Personal Income In Millions (Not Inflation Adjusted)
Income of Residents Closely related to employment is income, another important driver of consumption-related tax revenues. Total personal income adjusted for changes in purchasing power (rising price levels, inflation) continues to rise. The rate of growth on a per capita basis is variable but strongly positive since 1996. Personal income drives wealth and consumption that form the base for local tax revenues. In turn, rising incomes reflect not only better economic opportunities for existing residents, but also immigration of high wage workers buying new homes in the City.
7.3%6.7%
8.5%
5.6%5.0%
6.9%
5.8%
2.4%
0.9%
2.8%
4.8%4.1%
0%
1%
2%
3%
4%
5%
6%
7%
8%
9%
2001 2002 2003 2004 2005 2006 2007 2008 2009 2010 2011 2012
ANNUAL % CHANGE IN TOTAL PERSONAL INCOME (Not inflation Adjusted) (Bureau of Economic Analysis County Summary CA04)
FY2015-16 Operating Budget C-11 As Amended June 9, 2015
City of Chesapeake, VirginiaFY2015-16 Operating Budget
REVENUE BUDGET ECONOMIC CONDITIONS
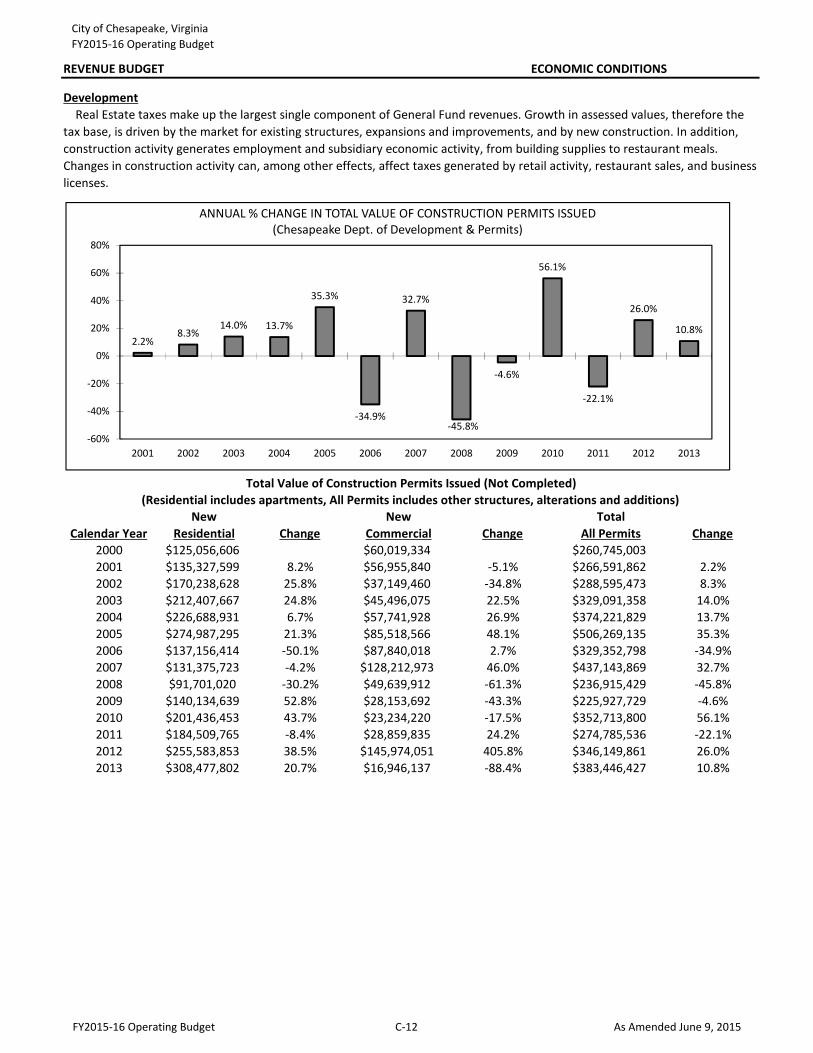
Development
New New TotalCalendar Year Residential Change Commercial Change All Permits Change
2000 $125,056,606 $60,019,334 $260,745,0032001 $135,327,599 8.2% $56,955,840 -5.1% $266,591,862 2.2%2002 $170,238,628 25.8% $37,149,460 -34.8% $288,595,473 8.3%2003 $212,407,667 24.8% $45,496,075 22.5% $329,091,358 14.0%2004 $226,688,931 6.7% $57,741,928 26.9% $374,221,829 13.7%2005 $274,987,295 21.3% $85,518,566 48.1% $506,269,135 35.3%2006 $137,156,414 -50.1% $87,840,018 2.7% $329,352,798 -34.9%2007 $131,375,723 -4.2% $128,212,973 46.0% $437,143,869 32.7%2008 $91,701,020 -30.2% $49,639,912 -61.3% $236,915,429 -45.8%2009 $140,134,639 52.8% $28,153,692 -43.3% $225,927,729 -4.6%2010 $201,436,453 43.7% $23,234,220 -17.5% $352,713,800 56.1%2011 $184,509,765 -8.4% $28,859,835 24.2% $274,785,536 -22.1%2012 $255,583,853 38.5% $145,974,051 405.8% $346,149,861 26.0%2013 $308,477,802 20.7% $16,946,137 -88.4% $383,446,427 10.8%
(Residential includes apartments, All Permits includes other structures, alterations and additions)Total Value of Construction Permits Issued (Not Completed)
Real Estate taxes make up the largest single component of General Fund revenues. Growth in assessed values, therefore the tax base, is driven by the market for existing structures, expansions and improvements, and by new construction. In addition, construction activity generates employment and subsidiary economic activity, from building supplies to restaurant meals. Changes in construction activity can, among other effects, affect taxes generated by retail activity, restaurant sales, and business licenses.
2.2%8.3%
14.0% 13.7%
35.3%
-34.9%
32.7%
-45.8%
-4.6%
56.1%
-22.1%
26.0%
10.8%
-60%
-40%
-20%
0%
20%
40%
60%
80%
2001 2002 2003 2004 2005 2006 2007 2008 2009 2010 2011 2012 2013
ANNUAL % CHANGE IN TOTAL VALUE OF CONSTRUCTION PERMITS ISSUED(Chesapeake Dept. of Development & Permits)
FY2015-16 Operating Budget C-12 As Amended June 9, 2015
City of Chesapeake, VirginiaFY2015-16 Operating Budget
REVENUE BUDGET ECONOMIC CONDITIONS
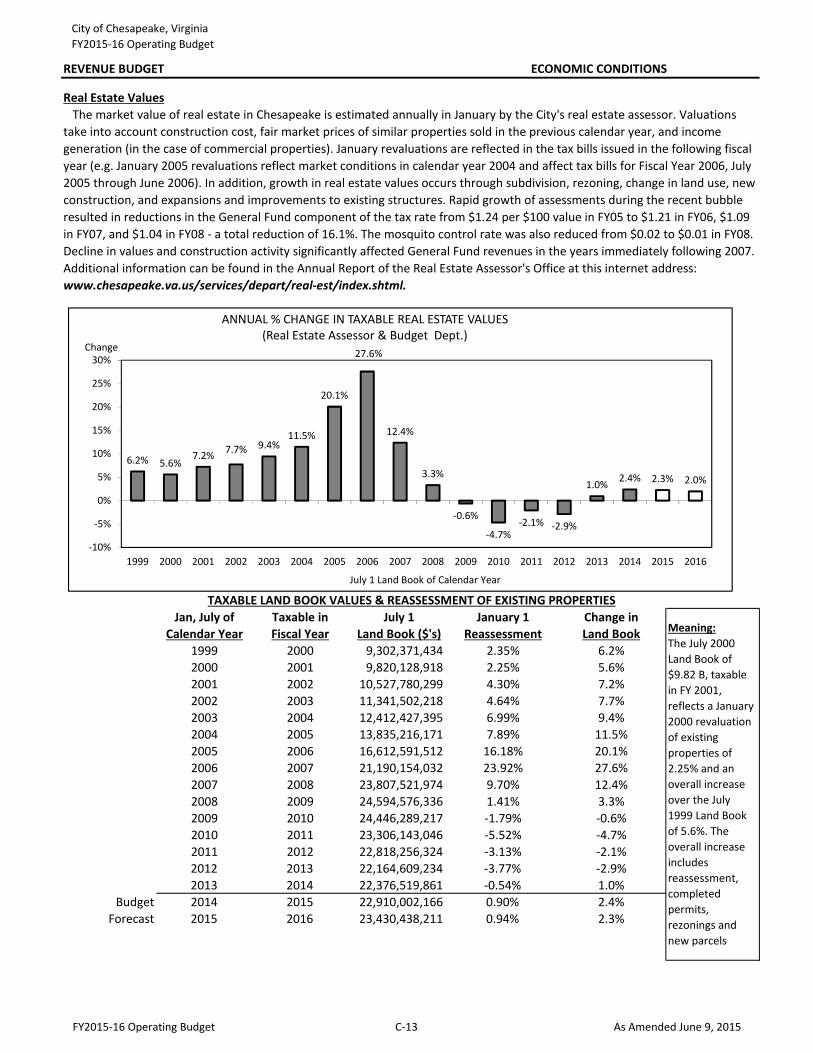
Real Estate Values
Jan, July of Taxable in July 1 January 1 Change inCalendar Year Fiscal Year Land Book ($'s) Reassessment Land Book
1999 2000 9,302,371,434 2.35% 6.2%2000 2001 9,820,128,918 2.25% 5.6%2001 2002 10,527,780,299 4.30% 7.2%2002 2003 11,341,502,218 4.64% 7.7%2003 2004 12,412,427,395 6.99% 9.4%2004 2005 13,835,216,171 7.89% 11.5%2005 2006 16,612,591,512 16.18% 20.1%2006 2007 21,190,154,032 23.92% 27.6%2007 2008 23,807,521,974 9.70% 12.4%2008 2009 24,594,576,336 1.41% 3.3%2009 2010 24,446,289,217 -1.79% -0.6%2010 2011 23,306,143,046 -5.52% -4.7%2011 2012 22,818,256,324 -3.13% -2.1%2012 2013 22,164,609,234 -3.77% -2.9%2013 2014 22,376,519,861 -0.54% 1.0%
Budget 2014 2015 22,910,002,166 0.90% 2.4%Forecast 2015 2016 23,430,438,211 0.94% 2.3%Forecast 2016 2017 23,894,985,799 1.00% 2.0%Forecast 2017 2018 24,384,178,863 1.00% 2.0%Forecast 2018 2019 24,898,263,858 1.00% 2.1%Forecast 2019 2020 25,437,489,702 1.00% 2.2%
Meaning:The July 2000 Land Book of $9.82 B, taxable in FY 2001, reflects a January 2000 revaluation of existing properties of 2.25% and an overall increase over the July 1999 Land Book of 5.6%. The overall increase includes reassessment, completed permits, rezonings and new parcels
TAXABLE LAND BOOK VALUES & REASSESSMENT OF EXISTING PROPERTIES
The market value of real estate in Chesapeake is estimated annually in January by the City's real estate assessor. Valuations take into account construction cost, fair market prices of similar properties sold in the previous calendar year, and income generation (in the case of commercial properties). January revaluations are reflected in the tax bills issued in the following fiscal year (e.g. January 2005 revaluations reflect market conditions in calendar year 2004 and affect tax bills for Fiscal Year 2006, July 2005 through June 2006). In addition, growth in real estate values occurs through subdivision, rezoning, change in land use, new construction, and expansions and improvements to existing structures. Rapid growth of assessments during the recent bubble resulted in reductions in the General Fund component of the tax rate from $1.24 per $100 value in FY05 to $1.21 in FY06, $1.09 in FY07, and $1.04 in FY08 - a total reduction of 16.1%. The mosquito control rate was also reduced from $0.02 to $0.01 in FY08. Decline in values and construction activity significantly affected General Fund revenues in the years immediately following 2007. Additional information can be found in the Annual Report of the Real Estate Assessor's Office at this internet address: www.chesapeake.va.us/services/depart/real-est/index.shtml.
6.2% 5.6%7.2% 7.7% 9.4%
11.5%
20.1%
27.6%
12.4%
3.3%
-0.6%
-4.7%-2.1% -2.9%
1.0% 2.4% 2.3% 2.0%
-10%
-5%
0%
5%
10%
15%
20%
25%
30%
1999 2000 2001 2002 2003 2004 2005 2006 2007 2008 2009 2010 2011 2012 2013 2014 2015 2016
Change
July 1 Land Book of Calendar Year
ANNUAL % CHANGE IN TAXABLE REAL ESTATE VALUES(Real Estate Assessor & Budget Dept.)
FY2015-16 Operating Budget C-13 As Amended June 9, 2015
City of Chesapeake, VirginiaFY2015-16 Operating Budget
REVENUE BUDGET ECONOMIC CONDITIONS
23,332,926,311$ (221,930,900)$
23,110,995,411$ 240,354,352$
22,895,247,880$ (1,739,400)$
22,893,508,480$ 238,092,488$
217,486,931$ 0.95%
2,261,864$ 0.95%
$1.0400$1.0400$1.0302
$0.00980.94%
23,332,926,311$ 97,512,000$
23,430,438,311$
2,343,044$
to January 1, 2015 Adjusted Taxable Assessed Value:
Change from Tax on July 1, 2014 Adjusted Taxable Land Book @ Current Tax Rate
Percentage Change
Allowable Deductions (Construction, Land Development and Rezoning):
FY2014-15 Tax Rate per $100 Assessed Value:
Change from July 1, 2014 Adjusted Taxable Land Book
Percentage Change
July 1, 2014 Taxable Land Book:
In terms commonly used in taxation, one cent ($0.01/$100) of tax rate equates to a tax rate of 0.01% or 10 mills of the assessed value. The mill rate is the amount of tax payable per dollar of the assessed value of a property; as each mill is one-thousandth of a currency unit, one mill is equivalent to one-tenth of a cent or $0.001. Each cent, or ten mills, is $10 per $100,000 of assessed property value in tax revenue. In terms of the aggregated taxable property values in the City, each cent or ten mills represents total tax evenues as follows:
Revenue Equivalent of one cent ($0.01/$100) in the tax rate:
July 1, 2015 Supplements to Taxable Assessed Value (Building permits, etc):
Tax on January 1, 2015 Adjusted Taxable Assessed Value @ Current Tax Rate:
FY2015-16 Tax Rate per $100 Assessed Value:
July 1, 2015 Estimated Land Book:
Understanding the Real Estate Tax Rate
January 1, 2015 Adjusted Taxable Assessed Value:
January 1, 2015 Total Taxable Assessed Value After Reassessment:
January 1, 2015 Total Taxable Assessed Value:
to Tax on January 1, 2015 Adjusted Taxable Assessed Value @ Current Tax Rate:
Tax Rate per $100 Assessed Value Necessary to Offset Change in Assessed Value:
Each year, the Real Estate Assessor provides a calculation of what the real property tax rate would be if it were adjusted to maintain revenues after revaluation of existing properties. This information is provided to the City Council as an indicator of the increase in property valuations. Information on this calculation is provided below.
Adjustments for Corrections (Supplementals, Exonerations):July 1, 2014 Adjusted Taxable Land Book:Tax on July 1, 2014 Adjusted Taxable Land Book @ Current Tax Rate:
Real Estate Recapitulation
Effective Tax Rate Increase Relative to FY2014-15 Tax Rate:Effective %Tax Rate Increase Relative to FY2014-15 Tax Rate:
FY2015-16 Operating Budget C-14 As Amended June 9, 2015
City of Chesapeake, VirginiaFY2015-16 Operating Budget
REVENUE BUDGET ECONOMIC CONDITIONS
Business/M&T Boats, Aircraft, Change inFiscal Year Motor Vehicles Motor Carriers RV, Motor Home Total Assessments
2000 $922,379,092 $268,206,537 $46,893,373 $1,237,479,002 12.3%2001 $966,774,843 $286,477,097 $47,592,639 $1,300,844,579 5.1%2002 $1,004,244,584 $272,361,359 $50,282,799 $1,326,888,742 2.0%2003 $1,041,693,964 $278,987,134 $53,262,637 $1,373,943,735 3.5%2004 $1,076,329,833 $291,503,581 $56,278,081 $1,424,111,495 3.7%2005 $1,205,887,805 $311,839,443 $64,840,239 $1,582,567,487 11.1%2006 $1,313,495,222 $326,189,382 $56,343,105 $1,696,027,709 7.2%2007 $1,338,242,510 $349,545,822 $62,561,972 $1,750,350,304 3.2%2008 $1,394,117,569 $349,592,227 $70,099,974 $1,813,809,770 3.6%2009 $1,227,011,359 $365,769,770 $68,928,445 $1,661,709,574 -8.4%2010 $1,290,394,651 $368,978,765 $70,120,045 $1,729,493,461 4.1%2011 $1,338,687,114 $379,670,283 $68,285,275 $1,786,642,672 3.3%2012 $1,400,334,977 $370,988,989 $49,228,832 $1,820,552,798 1.9%2013 $1,426,464,456 $385,962,758 $66,871,726 $1,879,298,940 3.2%2014 $1,481,885,029 $402,947,467 $79,567,826 $1,964,400,322 4.5%
Budget 2015 $1,446,504,855 $391,385,149 $67,811,207 $1,905,701,211 -3.0%Forecast 2015 $1,517,491,059 $412,629,297 $81,479,644 $2,011,600,000 2.4%Forecast 2016 $1,562,149,773 $424,772,693 $83,877,534 $2,070,800,000 2.9%
Component Share 75.4% 20.5% 4.1% 100.0%
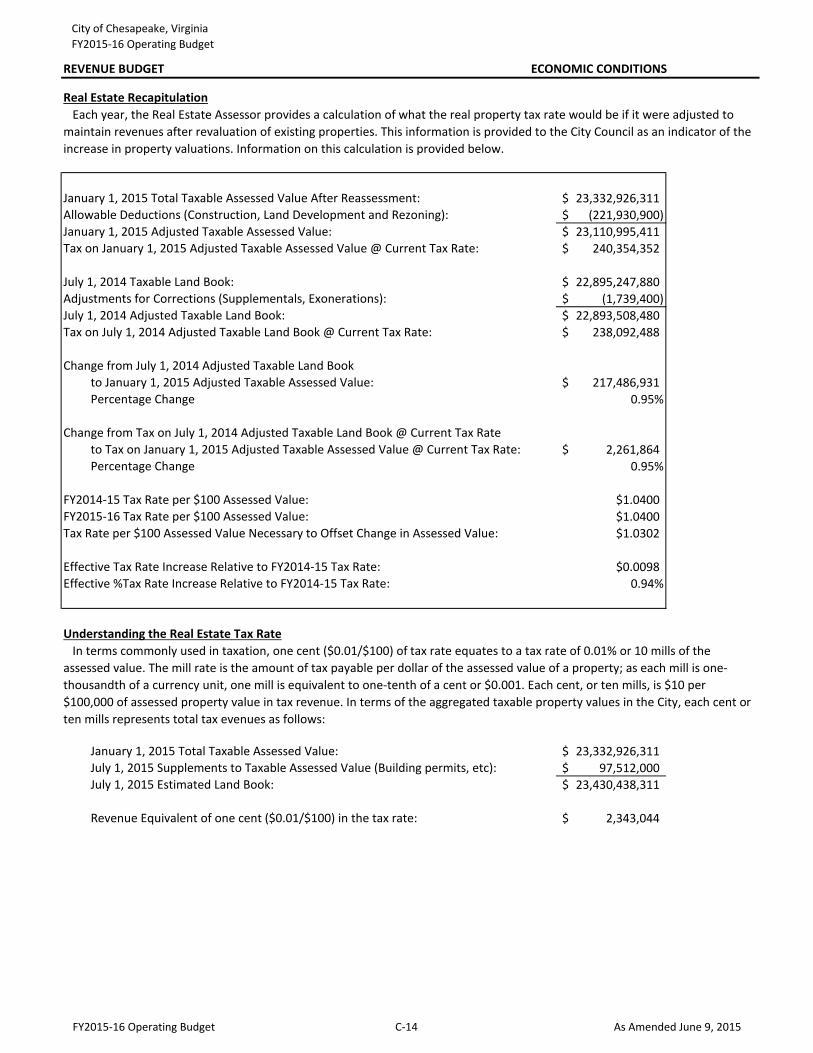
TAXABLE PERSONAL PROPERTY VALUES
Personal Property Taxable personal property is the second largest source of local revenues. Motor vehicles make up the largest component of Personal Property Tax revenues, about 76%. Change in assessed values (tax base) of motor vehicles is affected by the size and age of the vehicle stock and by market prices of new and used vehicles. These factors are in turn influenced by personal income, business activity and development, new and used vehicle prices, fuel prices, interest rates, and population growth. The most important driver of vehicle assessed values is the December auction market, which determines the values in the January NADA pricing guide used to assign assessed values to most vehicles. The used vehicle auction market introduces considerable year-to-year volatility to this component. Vehicles per capita, rising since 1996, is about 0.94. Average vehicle value is relatively low at about $6,753 in 2012. The second major component of the personal property tax base includes business equipment and fixtures, motor carriers, farm equipment, and machinery and tools. These comprise about 20% of this tax base. Commercial personal property is governed by equipment life and replacement cycles, changes in technology, firms' anticipation of changes in economic activity, and the availability and cost of capital.
12.3%
5.1%
2.0%3.5% 3.7%
11.1%
7.2%
3.2% 3.6%
-8.4%
4.1% 3.3%1.9%
3.2%4.5%
-3.0%
2.4% 2.9%
-10%
-5%
0%
5%
10%
15%
2000 2001 2002 2003 2004 2005 2006 2007 2008 2009 2010 2011 2012 2013 2014 2015 2015 2016
ANNUAL % CHANGE IN PERSONAL PROPERTY ASSESSMENTS(Commissioner of the Revenue, Budget Dept.)
FY2015-16 Operating Budget C-15 As Amended June 9, 2015
City of Chesapeake, VirginiaFY2015-16 Operating Budget
REVENUE BUDGET ECONOMIC CONDITIONS
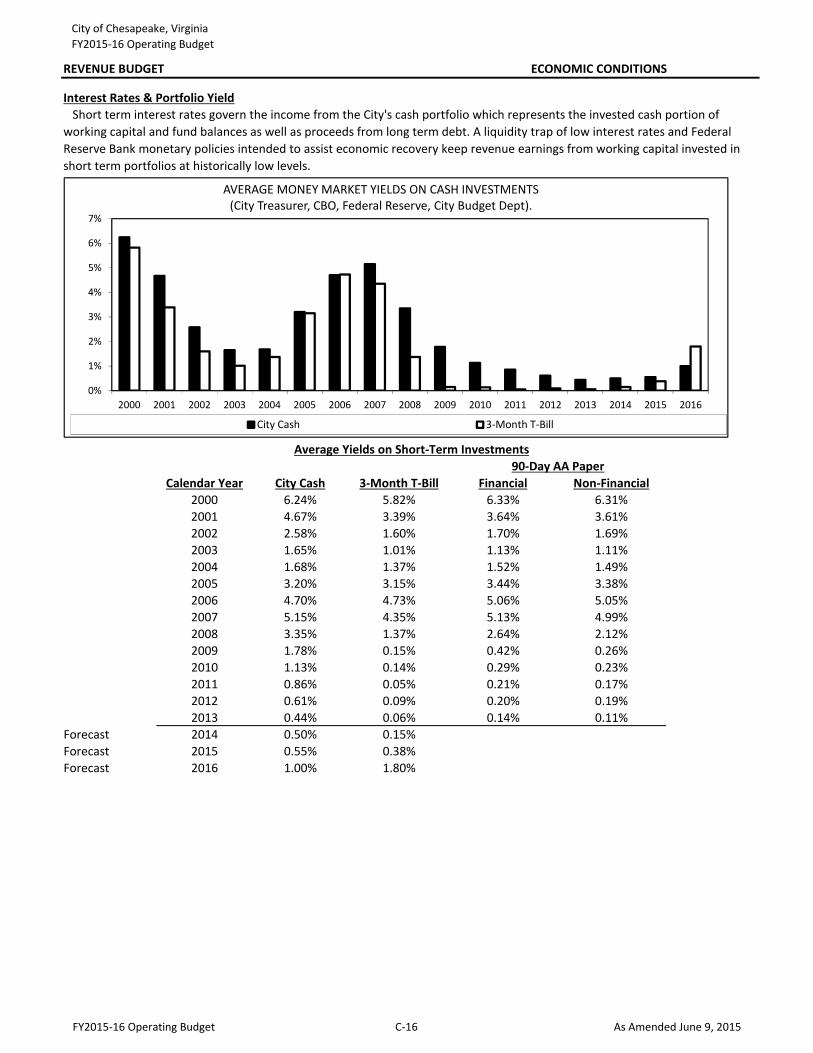
Calendar Year City Cash 3-Month T-Bill Financial Non-Financial2000 6.24% 5.82% 6.33% 6.31%2001 4.67% 3.39% 3.64% 3.61%2002 2.58% 1.60% 1.70% 1.69%2003 1.65% 1.01% 1.13% 1.11%2004 1.68% 1.37% 1.52% 1.49%2005 3.20% 3.15% 3.44% 3.38%2006 4.70% 4.73% 5.06% 5.05%2007 5.15% 4.35% 5.13% 4.99%2008 3.35% 1.37% 2.64% 2.12%2009 1.78% 0.15% 0.42% 0.26%2010 1.13% 0.14% 0.29% 0.23%2011 0.86% 0.05% 0.21% 0.17%2012 0.61% 0.09% 0.20% 0.19%2013 0.44% 0.06% 0.14% 0.11%
Forecast 2014 0.50% 0.15%Forecast 2015 0.55% 0.38%Forecast 2016 1.00% 1.80%
Average Yields on Short-Term Investments
Short term interest rates govern the income from the City's cash portfolio which represents the invested cash portion of working capital and fund balances as well as proceeds from long term debt. A liquidity trap of low interest rates and Federal Reserve Bank monetary policies intended to assist economic recovery keep revenue earnings from working capital invested in short term portfolios at historically low levels.
Interest Rates & Portfolio Yield
90-Day AA Paper
0%
1%
2%
3%
4%
5%
6%
7%
2000 2001 2002 2003 2004 2005 2006 2007 2008 2009 2010 2011 2012 2013 2014 2015 2016
AVERAGE MONEY MARKET YIELDS ON CASH INVESTMENTS(City Treasurer, CBO, Federal Reserve, City Budget Dept).
City Cash 3-Month T-Bill
FY2015-16 Operating Budget C-16 As Amended June 9, 2015
City of Chesapeake, VirginiaFY2015-16 Operating Budget
FUND STRUCTURE
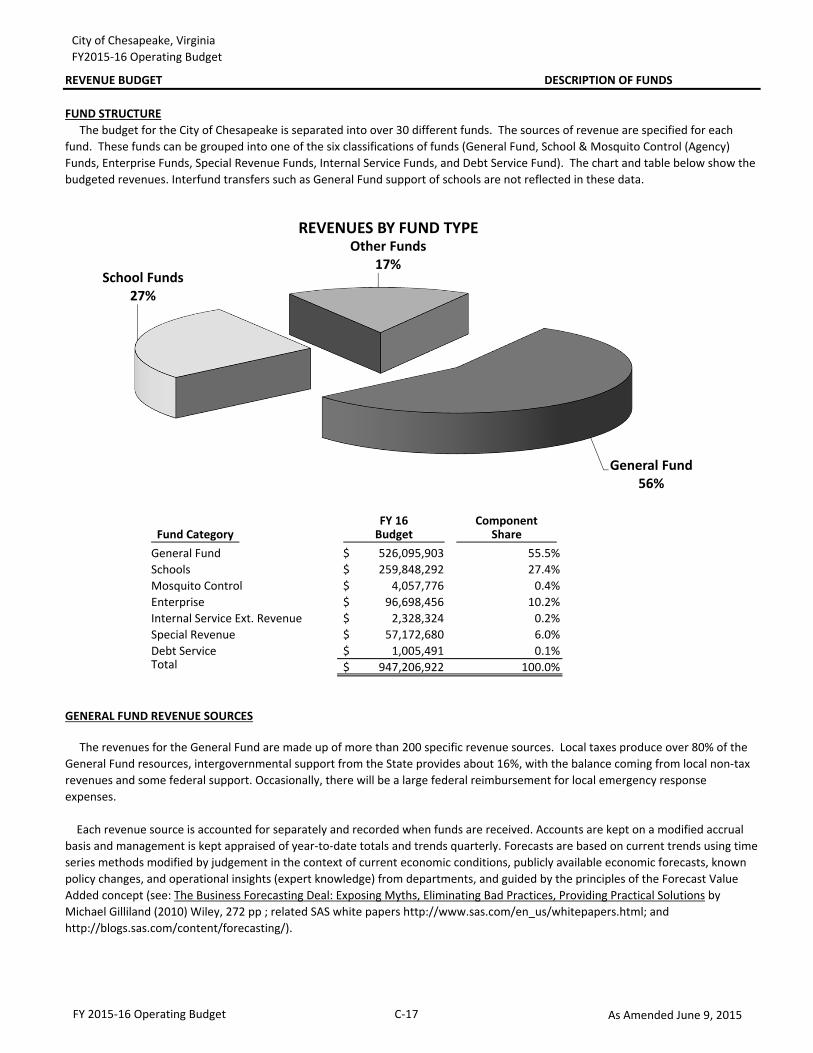
FY 16 ComponentFund Category Budget Share
526,095,903$ 55.5%259,848,292$ 27.4%
4,057,776$ 0.4%96,698,456$ 10.2%
2,328,324$ 0.2%57,172,680$ 6.0%
1,005,491$ 0.1%947,206,922$ 100.0%
GENERAL FUND REVENUE SOURCES
Total
REVENUE BUDGET DESCRIPTION OF FUNDS
The budget for the City of Chesapeake is separated into over 30 different funds. The sources of revenue are specified for each fund. These funds can be grouped into one of the six classifications of funds (General Fund, School & Mosquito Control (Agency) Funds, Enterprise Funds, Special Revenue Funds, Internal Service Funds, and Debt Service Fund). The chart and table below show the budgeted revenues. Interfund transfers such as General Fund support of schools are not reflected in these data.
General FundSchoolsMosquito ControlEnterpriseInternal Service Ext. RevenueSpecial RevenueDebt Service
The revenues for the General Fund are made up of more than 200 specific revenue sources. Local taxes produce over 80% of the General Fund resources, intergovernmental support from the State provides about 16%, with the balance coming from local non-tax revenues and some federal support. Occasionally, there will be a large federal reimbursement for local emergency response expenses.
Each revenue source is accounted for separately and recorded when funds are received. Accounts are kept on a modified accrual basis and management is kept appraised of year-to-date totals and trends quarterly. Forecasts are based on current trends using time series methods modified by judgement in the context of current economic conditions, publicly available economic forecasts, known policy changes, and operational insights (expert knowledge) from departments, and guided by the principles of the Forecast Value Added concept (see: The Business Forecasting Deal: Exposing Myths, Eliminating Bad Practices, Providing Practical Solutions by Michael Gilliland (2010) Wiley, 272 pp ; related SAS white papers http://www.sas.com/en_us/whitepapers.html; and http://blogs.sas.com/content/forecasting/).
General Fund56%
School Funds27%
Other Funds17%
REVENUES BY FUND TYPE
FY 2015-16 Operating Budget C-17 As Amended June 9, 2015
City of Chesapeake, VirginiaFY2015-16 Operating Budget
REVENUE BUDGET DESCRIPTION OF FUNDS
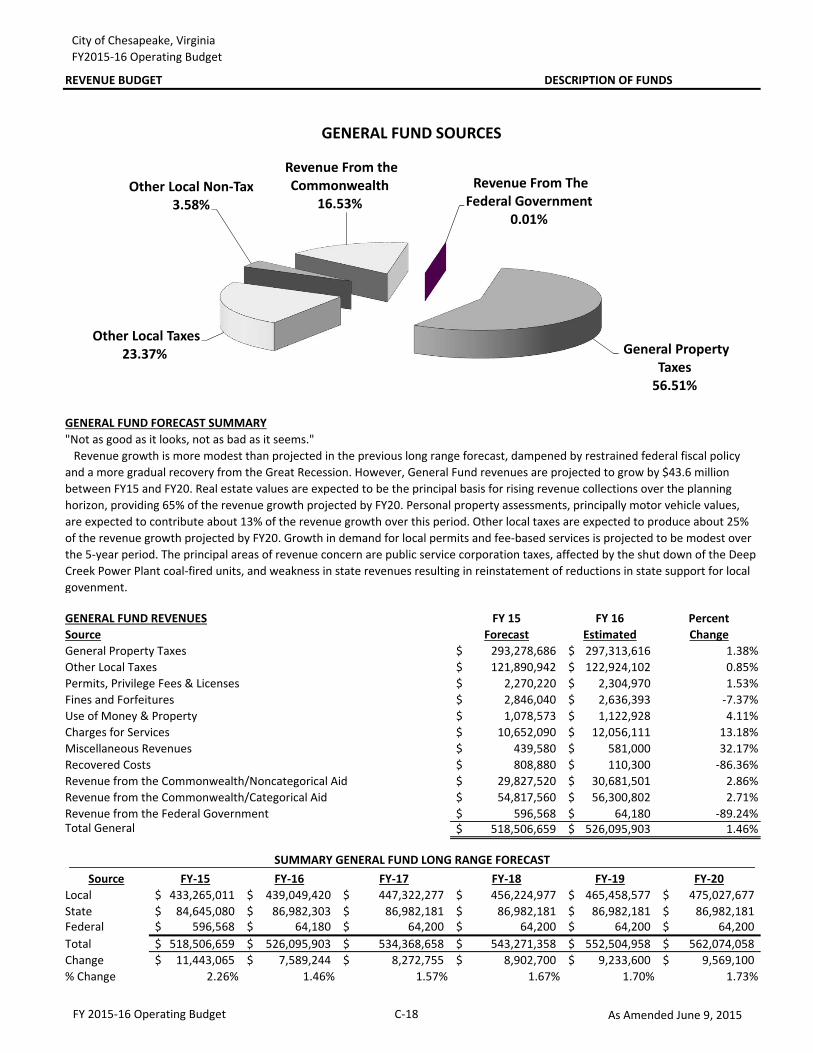
FY 15 FY 16 PercentSource Forecast Estimated ChangeGeneral Property Taxes 293,278,686$ 297,313,616$ 1.38%Other Local Taxes 121,890,942$ 122,924,102$ 0.85%Permits, Privilege Fees & Licenses 2,270,220$ 2,304,970$ 1.53%Fines and Forfeitures 2,846,040$ 2,636,393$ -7.37%Use of Money & Property 1,078,573$ 1,122,928$ 4.11%Charges for Services 10,652,090$ 12,056,111$ 13.18%Miscellaneous Revenues 439,580$ 581,000$ 32.17%Recovered Costs 808,880$ 110,300$ -86.36%Revenue from the Commonwealth/Noncategorical Aid 29,827,520$ 30,681,501$ 2.86%Revenue from the Commonwealth/Categorical Aid 54,817,560$ 56,300,802$ 2.71%Revenue from the Federal Government 596,568$ 64,180$ -89.24%Total General 518,506,659$ 526,095,903$ 1.46%
Source FY-15 FY-16 FY-17 FY-18 FY-19 FY-20Local 433,265,011$ 439,049,420$ 447,322,277$ 456,224,977$ 465,458,577$ 475,027,677$ State 84,645,080$ 86,982,303$ 86,982,181$ 86,982,181$ 86,982,181$ 86,982,181$ Federal 596,568$ 64,180$ 64,200$ 64,200$ 64,200$ 64,200$ Total 518,506,659$ 526,095,903$ 534,368,658$ 543,271,358$ 552,504,958$ 562,074,058$ Change 11,443,065$ 7,589,244$ 8,272,755$ 8,902,700$ 9,233,600$ 9,569,100$ % Change 2.26% 1.46% 1.57% 1.67% 1.70% 1.73%
GENERAL FUND FORECAST SUMMARY"Not as good as it looks, not as bad as it seems." Revenue growth is more modest than projected in the previous long range forecast, dampened by restrained federal fiscal policy and a more gradual recovery from the Great Recession. However, General Fund revenues are projected to grow by $43.6 million between FY15 and FY20. Real estate values are expected to be the principal basis for rising revenue collections over the planning horizon, providing 65% of the revenue growth projected by FY20. Personal property assessments, principally motor vehicle values, are expected to contribute about 13% of the revenue growth over this period. Other local taxes are expected to produce about 25% of the revenue growth projected by FY20. Growth in demand for local permits and fee-based services is projected to be modest over the 5-year period. The principal areas of revenue concern are public service corporation taxes, affected by the shut down of the Deep Creek Power Plant coal-fired units, and weakness in state revenues resulting in reinstatement of reductions in state support for local govenment.
GENERAL FUND REVENUES
SUMMARY GENERAL FUND LONG RANGE FORECAST
General Property Taxes
56.51%
Other Local Taxes23.37%
Other Local Non-Tax3.58%
Revenue From the Commonwealth
16.53%Revenue From The
Federal Government0.01%
GENERAL FUND SOURCES
FY 2015-16 Operating Budget C-18 As Amended June 9, 2015
City of Chesapeake, VirginiaFY2015-16 Operating Budget
REVENUE BUDGET DESCRIPTION OF FUNDS
ComparableFiscal Year Gross Revenue Additions Deductions Net Revenue Change % Change
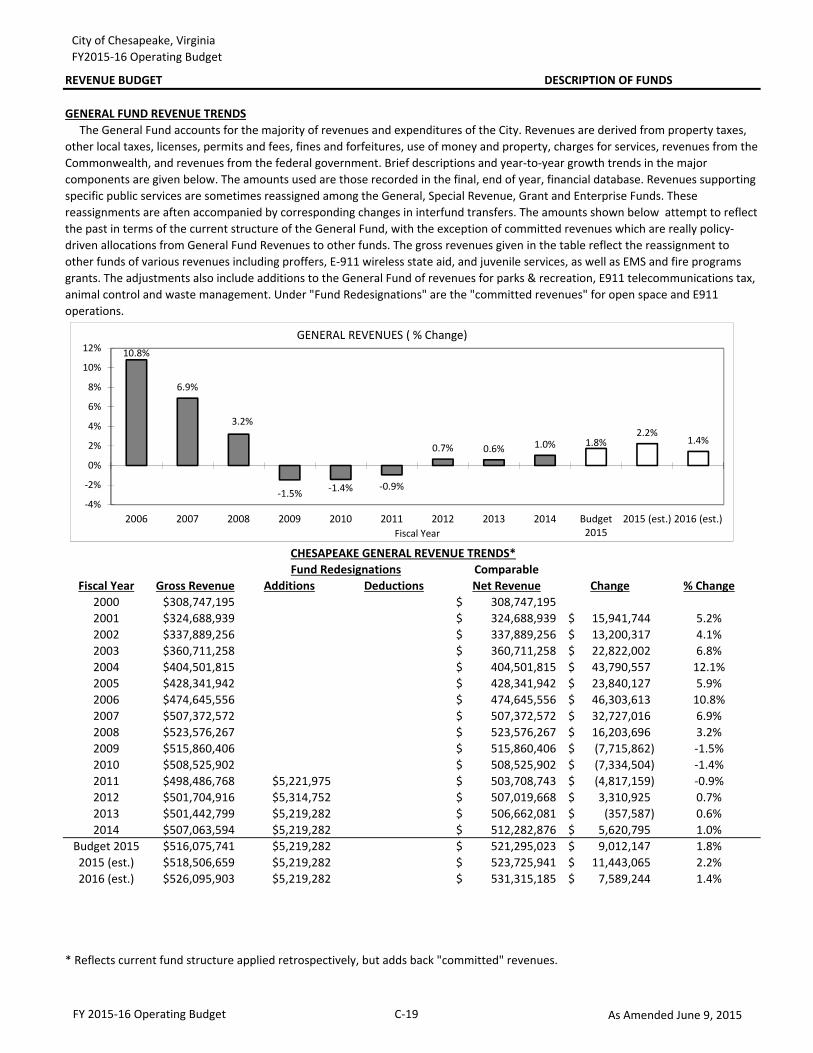
2000 $308,747,195 308,747,195$ 2001 $324,688,939 324,688,939$ 15,941,744$ 5.2%2002 $337,889,256 337,889,256$ 13,200,317$ 4.1%2003 $360,711,258 360,711,258$ 22,822,002$ 6.8%2004 $404,501,815 404,501,815$ 43,790,557$ 12.1%2005 $428,341,942 428,341,942$ 23,840,127$ 5.9%2006 $474,645,556 474,645,556$ 46,303,613$ 10.8%2007 $507,372,572 507,372,572$ 32,727,016$ 6.9%2008 $523,576,267 523,576,267$ 16,203,696$ 3.2%2009 $515,860,406 515,860,406$ (7,715,862)$ -1.5%2010 $508,525,902 508,525,902$ (7,334,504)$ -1.4%2011 $498,486,768 $5,221,975 503,708,743$ (4,817,159)$ -0.9%2012 $501,704,916 $5,314,752 507,019,668$ 3,310,925$ 0.7%2013 $501,442,799 $5,219,282 506,662,081$ (357,587)$ 0.6%2014 $507,063,594 $5,219,282 512,282,876$ 5,620,795$ 1.0%
Budget 2015 $516,075,741 $5,219,282 521,295,023$ 9,012,147$ 1.8%2015 (est.) $518,506,659 $5,219,282 523,725,941$ 11,443,065$ 2.2%2016 (est.) $526,095,903 $5,219,282 531,315,185$ 7,589,244$ 1.4%
GENERAL FUND REVENUE TRENDS The General Fund accounts for the majority of revenues and expenditures of the City. Revenues are derived from property taxes, other local taxes, licenses, permits and fees, fines and forfeitures, use of money and property, charges for services, revenues from the Commonwealth, and revenues from the federal government. Brief descriptions and year-to-year growth trends in the major components are given below. The amounts used are those recorded in the final, end of year, financial database. Revenues supporting specific public services are sometimes reassigned among the General, Special Revenue, Grant and Enterprise Funds. These reassignments are aften accompanied by corresponding changes in interfund transfers. The amounts shown below attempt to reflect the past in terms of the current structure of the General Fund, with the exception of committed revenues which are really policy-driven allocations from General Fund Revenues to other funds. The gross revenues given in the table reflect the reassignment to other funds of various revenues including proffers, E-911 wireless state aid, and juvenile services, as well as EMS and fire programs grants. The adjustments also include additions to the General Fund of revenues for parks & recreation, E911 telecommunications tax, animal control and waste management. Under "Fund Redesignations" are the "committed revenues" for open space and E911 operations.
CHESAPEAKE GENERAL REVENUE TRENDS*Fund Redesignations
* Reflects current fund structure applied retrospectively, but adds back "committed" revenues.
10.8%
6.9%
3.2%
-1.5% -1.4% -0.9%
0.7% 0.6% 1.0% 1.8%2.2%
1.4%
-4%
-2%
0%
2%
4%
6%
8%
10%
12%
2006 2007 2008 2009 2010 2011 2012 2013 2014 Budget2015
2015 (est.) 2016 (est.)Fiscal Year
GENERAL REVENUES ( % Change)
FY 2015-16 Operating Budget C-19 As Amended June 9, 2015
City of Chesapeake, VirginiaFY2015-16 Operating Budget
REVENUE BUDGET DESCRIPTION OF FUNDS
PROPERTY TAXES
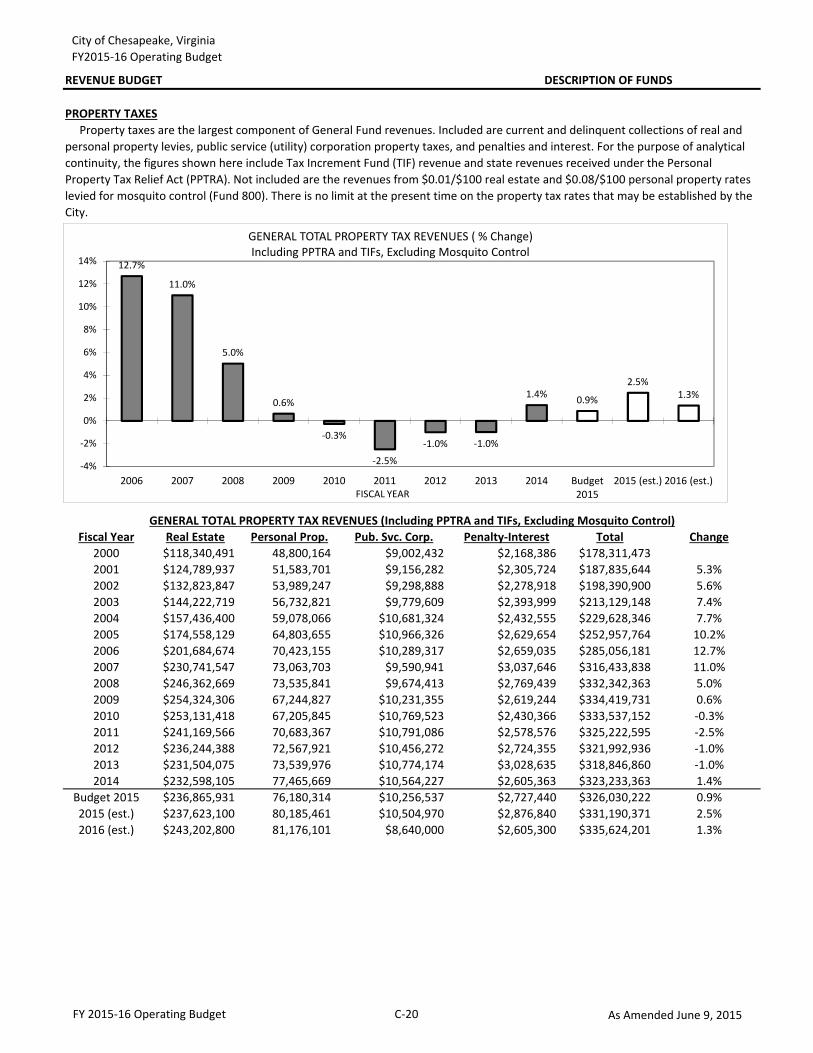
Fiscal Year Real Estate Personal Prop. Pub. Svc. Corp. Penalty-Interest Total Change2000 $118,340,491 48,800,164 $9,002,432 $2,168,386 $178,311,4732001 $124,789,937 51,583,701 $9,156,282 $2,305,724 $187,835,644 5.3%2002 $132,823,847 53,989,247 $9,298,888 $2,278,918 $198,390,900 5.6%2003 $144,222,719 56,732,821 $9,779,609 $2,393,999 $213,129,148 7.4%2004 $157,436,400 59,078,066 $10,681,324 $2,432,555 $229,628,346 7.7%2005 $174,558,129 64,803,655 $10,966,326 $2,629,654 $252,957,764 10.2%2006 $201,684,674 70,423,155 $10,289,317 $2,659,035 $285,056,181 12.7%2007 $230,741,547 73,063,703 $9,590,941 $3,037,646 $316,433,838 11.0%2008 $246,362,669 73,535,841 $9,674,413 $2,769,439 $332,342,363 5.0%2009 $254,324,306 67,244,827 $10,231,355 $2,619,244 $334,419,731 0.6%2010 $253,131,418 67,205,845 $10,769,523 $2,430,366 $333,537,152 -0.3%2011 $241,169,566 70,683,367 $10,791,086 $2,578,576 $325,222,595 -2.5%2012 $236,244,388 72,567,921 $10,456,272 $2,724,355 $321,992,936 -1.0%2013 $231,504,075 73,539,976 $10,774,174 $3,028,635 $318,846,860 -1.0%2014 $232,598,105 77,465,669 $10,564,227 $2,605,363 $323,233,363 1.4%
Budget 2015 $236,865,931 76,180,314 $10,256,537 $2,727,440 $326,030,222 0.9%2015 (est.) $237,623,100 80,185,461 $10,504,970 $2,876,840 $331,190,371 2.5%2016 (est.) $243,202,800 81,176,101 $8,640,000 $2,605,300 $335,624,201 1.3%2017 (est.) $248,059,200 82,509,401 $8,300,000 $2,605,300 $341,473,901 1.7%2018 (est.) $253,172,800 83,644,401 $8,400,000 $2,605,300 $347,822,501 1.9%2019 (est.) $258,544,400 84,779,401 $8,500,000 $2,605,300 $354,429,101 1.9%2020 (est.) $264,176,300 85,914,401 $8,600,000 $2,605,300 $361,296,001 1.9%
Property taxes are the largest component of General Fund revenues. Included are current and delinquent collections of real and personal property levies, public service (utility) corporation property taxes, and penalties and interest. For the purpose of analytical continuity, the figures shown here include Tax Increment Fund (TIF) revenue and state revenues received under the Personal Property Tax Relief Act (PPTRA). Not included are the revenues from $0.01/$100 real estate and $0.08/$100 personal property rates levied for mosquito control (Fund 800). There is no limit at the present time on the property tax rates that may be established by the City.
GENERAL TOTAL PROPERTY TAX REVENUES (Including PPTRA and TIFs, Excluding Mosquito Control)
12.7%
11.0%
5.0%
0.6%
-0.3%
-2.5%
-1.0% -1.0%
1.4% 0.9%
2.5%1.3%
-4%
-2%
0%
2%
4%
6%
8%
10%
12%
14%
2006 2007 2008 2009 2010 2011 2012 2013 2014 Budget2015
2015 (est.) 2016 (est.)FISCAL YEAR
GENERAL TOTAL PROPERTY TAX REVENUES ( % Change)Including PPTRA and TIFs, Excluding Mosquito Control
FY 2015-16 Operating Budget C-20 As Amended June 9, 2015
City of Chesapeake, VirginiaFY2015-16 Operating Budget
REVENUE BUDGET DESCRIPTION OF FUNDS
Real Property Taxes
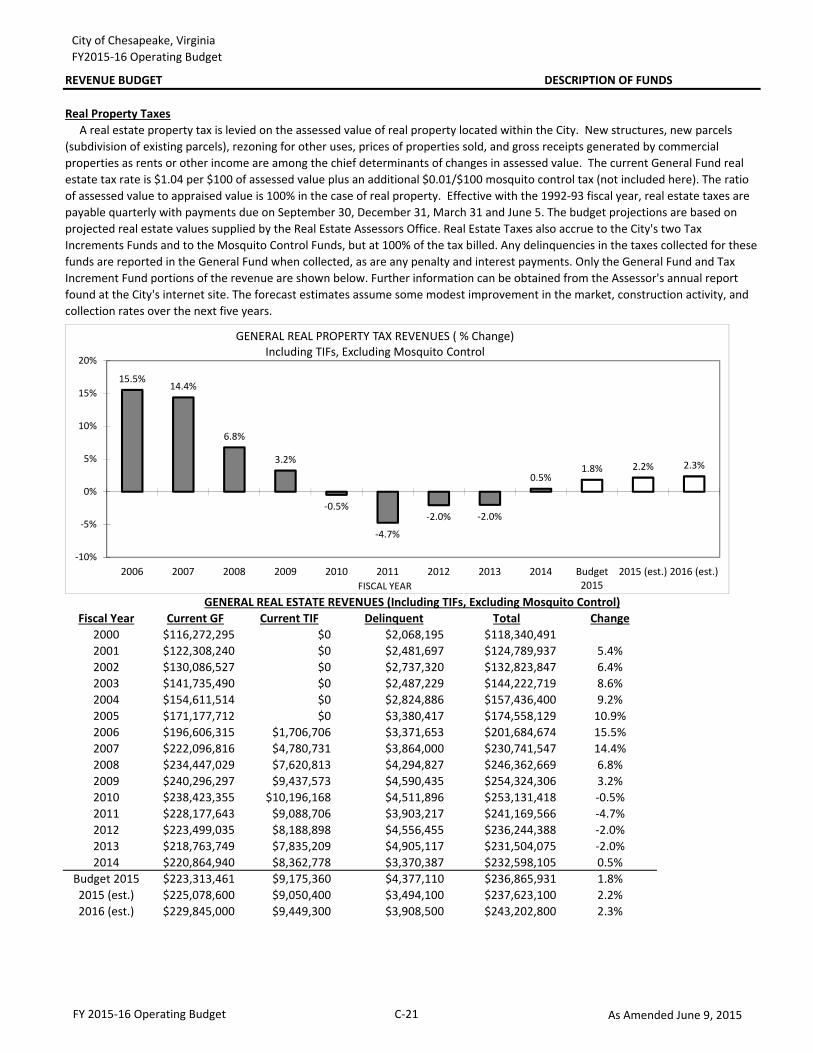
Fiscal Year Current GF Current TIF Delinquent Total Change2000 $116,272,295 $0 $2,068,195 $118,340,4912001 $122,308,240 $0 $2,481,697 $124,789,937 5.4%2002 $130,086,527 $0 $2,737,320 $132,823,847 6.4%2003 $141,735,490 $0 $2,487,229 $144,222,719 8.6%2004 $154,611,514 $0 $2,824,886 $157,436,400 9.2%2005 $171,177,712 $0 $3,380,417 $174,558,129 10.9%2006 $196,606,315 $1,706,706 $3,371,653 $201,684,674 15.5%2007 $222,096,816 $4,780,731 $3,864,000 $230,741,547 14.4%2008 $234,447,029 $7,620,813 $4,294,827 $246,362,669 6.8%2009 $240,296,297 $9,437,573 $4,590,435 $254,324,306 3.2%2010 $238,423,355 $10,196,168 $4,511,896 $253,131,418 -0.5%2011 $228,177,643 $9,088,706 $3,903,217 $241,169,566 -4.7%2012 $223,499,035 $8,188,898 $4,556,455 $236,244,388 -2.0%2013 $218,763,749 $7,835,209 $4,905,117 $231,504,075 -2.0%2014 $220,864,940 $8,362,778 $3,370,387 $232,598,105 0.5%
Budget 2015 $223,313,461 $9,175,360 $4,377,110 $236,865,931 1.8%2015 (est.) $225,078,600 $9,050,400 $3,494,100 $237,623,100 2.2%2016 (est.) $229,845,000 $9,449,300 $3,908,500 $243,202,800 2.3%2017 (est.) $234,109,800 $9,969,500 $3,979,900 $248,059,200 2.0%2018 (est.) $238,678,800 $10,436,500 $4,057,500 $253,172,800 2.1%2019 (est.) $243,494,200 $10,910,800 $4,139,400 $258,544,400 2.1%2020 (est.) $248,558,400 $11,392,400 $4,225,500 $264,176,300 2.2%
A real estate property tax is levied on the assessed value of real property located within the City. New structures, new parcels (subdivision of existing parcels), rezoning for other uses, prices of properties sold, and gross receipts generated by commercial properties as rents or other income are among the chief determinants of changes in assessed value. The current General Fund real estate tax rate is $1.04 per $100 of assessed value plus an additional $0.01/$100 mosquito control tax (not included here). The ratio of assessed value to appraised value is 100% in the case of real property. Effective with the 1992-93 fiscal year, real estate taxes are payable quarterly with payments due on September 30, December 31, March 31 and June 5. The budget projections are based on projected real estate values supplied by the Real Estate Assessors Office. Real Estate Taxes also accrue to the City's two Tax Increments Funds and to the Mosquito Control Funds, but at 100% of the tax billed. Any delinquencies in the taxes collected for these funds are reported in the General Fund when collected, as are any penalty and interest payments. Only the General Fund and Tax Increment Fund portions of the revenue are shown below. Further information can be obtained from the Assessor's annual report found at the City's internet site. The forecast estimates assume some modest improvement in the market, construction activity, and collection rates over the next five years.
GENERAL REAL ESTATE REVENUES (Including TIFs, Excluding Mosquito Control)
15.5%14.4%
6.8%
3.2%
-0.5%
-4.7%
-2.0% -2.0%
0.5%1.8% 2.2% 2.3%
-10%
-5%
0%
5%
10%
15%
20%
2006 2007 2008 2009 2010 2011 2012 2013 2014 Budget2015
2015 (est.) 2016 (est.)FISCAL YEAR
GENERAL REAL PROPERTY TAX REVENUES ( % Change)Including TIFs, Excluding Mosquito Control
FY 2015-16 Operating Budget C-21 As Amended June 9, 2015
City of Chesapeake, VirginiaFY2015-16 Operating Budget
REVENUE BUDGET DESCRIPTION OF FUNDS
Personal Property Taxes
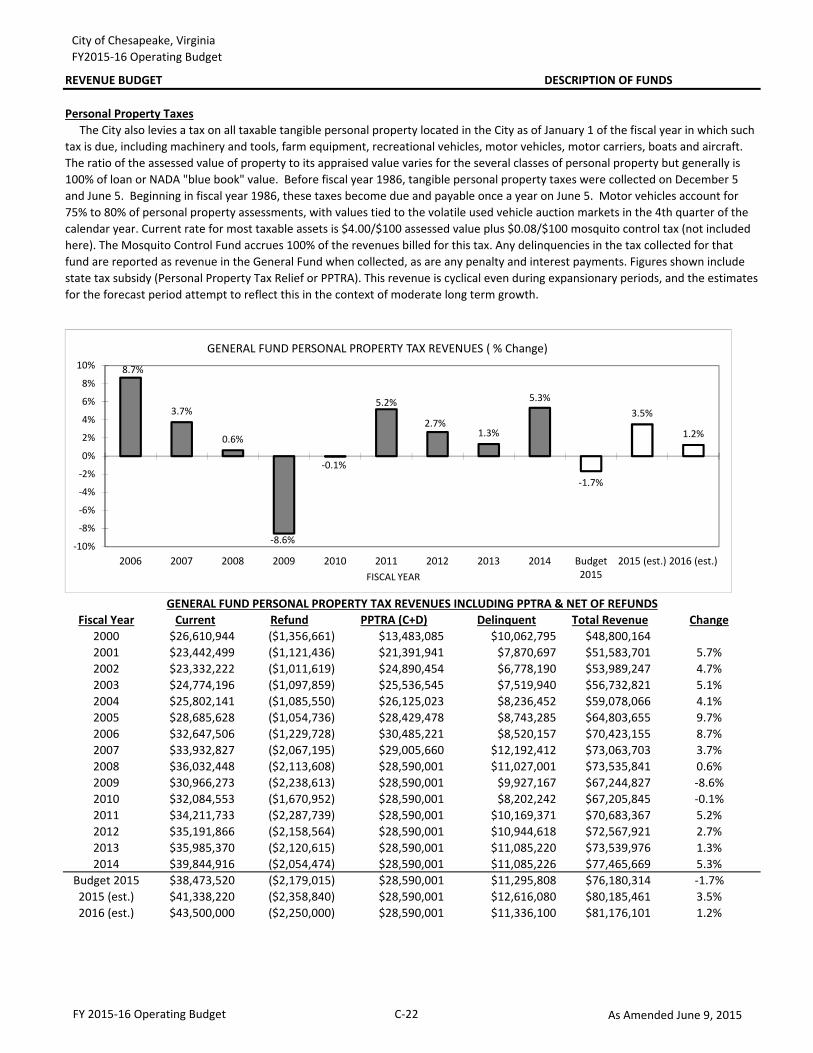
Fiscal Year Current Refund PPTRA (C+D) Delinquent Total Revenue Change2000 $26,610,944 ($1,356,661) $13,483,085 $10,062,795 $48,800,1642001 $23,442,499 ($1,121,436) $21,391,941 $7,870,697 $51,583,701 5.7%2002 $23,332,222 ($1,011,619) $24,890,454 $6,778,190 $53,989,247 4.7%2003 $24,774,196 ($1,097,859) $25,536,545 $7,519,940 $56,732,821 5.1%2004 $25,802,141 ($1,085,550) $26,125,023 $8,236,452 $59,078,066 4.1%2005 $28,685,628 ($1,054,736) $28,429,478 $8,743,285 $64,803,655 9.7%2006 $32,647,506 ($1,229,728) $30,485,221 $8,520,157 $70,423,155 8.7%2007 $33,932,827 ($2,067,195) $29,005,660 $12,192,412 $73,063,703 3.7%2008 $36,032,448 ($2,113,608) $28,590,001 $11,027,001 $73,535,841 0.6%2009 $30,966,273 ($2,238,613) $28,590,001 $9,927,167 $67,244,827 -8.6%2010 $32,084,553 ($1,670,952) $28,590,001 $8,202,242 $67,205,845 -0.1%2011 $34,211,733 ($2,287,739) $28,590,001 $10,169,371 $70,683,367 5.2%2012 $35,191,866 ($2,158,564) $28,590,001 $10,944,618 $72,567,921 2.7%2013 $35,985,370 ($2,120,615) $28,590,001 $11,085,220 $73,539,976 1.3%2014 $39,844,916 ($2,054,474) $28,590,001 $11,085,226 $77,465,669 5.3%
Budget 2015 $38,473,520 ($2,179,015) $28,590,001 $11,295,808 $76,180,314 -1.7%2015 (est.) $41,338,220 ($2,358,840) $28,590,001 $12,616,080 $80,185,461 3.5%2016 (est.) $43,500,000 ($2,250,000) $28,590,001 $11,336,100 $81,176,101 1.2%2017 (est.) $44,500,000 ($2,275,000) $28,590,001 $11,694,400 $82,509,401 1.6%2018 (est.) $45,500,000 ($2,300,000) $28,590,001 $11,854,400 $83,644,401 1.4%2019 (est.) $46,500,000 ($2,325,000) $28,590,001 $12,014,400 $84,779,401 1.4%2020 (est.) $47,500,000 ($2,350,000) $28,590,001 $12,174,400 $85,914,401 1.3%
The City also levies a tax on all taxable tangible personal property located in the City as of January 1 of the fiscal year in which such tax is due, including machinery and tools, farm equipment, recreational vehicles, motor vehicles, motor carriers, boats and aircraft. The ratio of the assessed value of property to its appraised value varies for the several classes of personal property but generally is 100% of loan or NADA "blue book" value. Before fiscal year 1986, tangible personal property taxes were collected on December 5 and June 5. Beginning in fiscal year 1986, these taxes become due and payable once a year on June 5. Motor vehicles account for 75% to 80% of personal property assessments, with values tied to the volatile used vehicle auction markets in the 4th quarter of the calendar year. Current rate for most taxable assets is $4.00/$100 assessed value plus $0.08/$100 mosquito control tax (not included here). The Mosquito Control Fund accrues 100% of the revenues billed for this tax. Any delinquencies in the tax collected for that fund are reported as revenue in the General Fund when collected, as are any penalty and interest payments. Figures shown include state tax subsidy (Personal Property Tax Relief or PPTRA). This revenue is cyclical even during expansionary periods, and the estimates for the forecast period attempt to reflect this in the context of moderate long term growth.
GENERAL FUND PERSONAL PROPERTY TAX REVENUES INCLUDING PPTRA & NET OF REFUNDS
8.7%
3.7%
0.6%
-8.6%
-0.1%
5.2%
2.7%1.3%
5.3%
-1.7%
3.5%
1.2%
-10%
-8%
-6%
-4%
-2%
0%
2%
4%
6%
8%
10%
2006 2007 2008 2009 2010 2011 2012 2013 2014 Budget2015
2015 (est.) 2016 (est.)FISCAL YEAR
GENERAL FUND PERSONAL PROPERTY TAX REVENUES ( % Change)
FY 2015-16 Operating Budget C-22 As Amended June 9, 2015
City of Chesapeake, VirginiaFY2015-16 Operating Budget
REVENUE BUDGET DESCRIPTION OF FUNDS
Personal Property Tax Relief
% Subsidy onFiscal Year PPTRA-C PPTRA-D Total Eligible Values
2000 $10,370,702 $3,112,383 $13,483,0852001 $16,239,588 $5,152,353 $21,391,9412002 $17,511,333 $7,379,121 $24,890,4542003 $18,805,774 $6,730,771 $25,536,5452004 $18,854,600 $7,270,424 $26,125,0232005 $21,299,117 $7,130,361 $28,429,4782006 $25,380,868 $5,104,353 $30,485,221 62%2007 $28,609,802 $395,857 $29,005,660 63%2008 $28,590,001 $0 $28,590,001 58%2009 $28,590,001 $0 $28,590,001 66%2010 $28,590,001 $0 $28,590,001 65%2011 $28,590,001 $0 $28,590,001 60%2012 $28,590,001 $0 $28,590,001 60%2013 $28,590,001 $0 $28,590,001 60%2014 $28,590,001 $0 $28,590,001 54%
Budget 2015 $28,590,001 $0 $28,590,001 54%2015 (est.) $28,590,001 $0 $28,590,001 51%2016 (est.) $28,590,001 $0 $28,590,001 50%2017 (est.) $28,590,001 $0 $28,590,0012018 (est.) $28,590,001 $0 $28,590,0012019 (est.) $28,590,001 $0 $28,590,0012020 (est.) $28,590,001 $0 $28,590,001
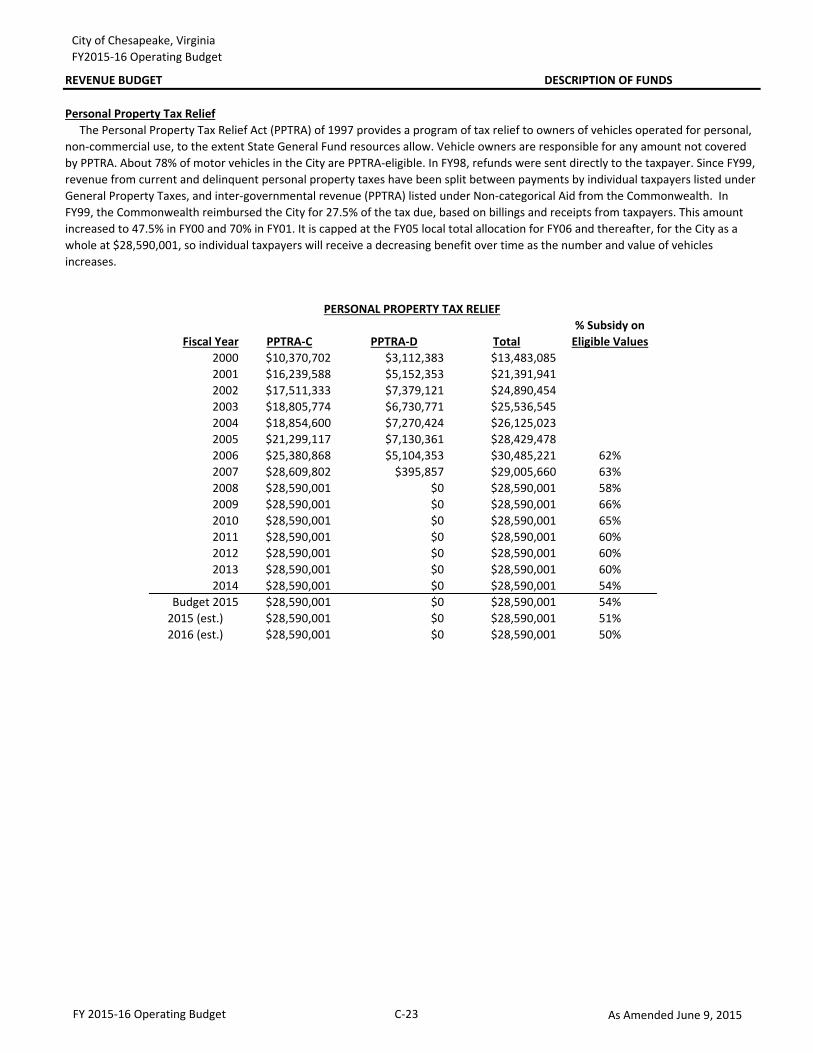
PERSONAL PROPERTY TAX RELIEF
The Personal Property Tax Relief Act (PPTRA) of 1997 provides a program of tax relief to owners of vehicles operated for personal, non-commercial use, to the extent State General Fund resources allow. Vehicle owners are responsible for any amount not covered by PPTRA. About 78% of motor vehicles in the City are PPTRA-eligible. In FY98, refunds were sent directly to the taxpayer. Since FY99, revenue from current and delinquent personal property taxes have been split between payments by individual taxpayers listed under General Property Taxes, and inter-governmental revenue (PPTRA) listed under Non-categorical Aid from the Commonwealth. In FY99, the Commonwealth reimbursed the City for 27.5% of the tax due, based on billings and receipts from taxpayers. This amount increased to 47.5% in FY00 and 70% in FY01. It is capped at the FY05 local total allocation for FY06 and thereafter, for the City as a whole at $28,590,001, so individual taxpayers will receive a decreasing benefit over time as the number and value of vehicles increases.
FY 2015-16 Operating Budget C-23 As Amended June 9, 2015
City of Chesapeake, VirginiaFY2015-16 Operating Budget
REVENUE BUDGET DESCRIPTION OF FUNDS
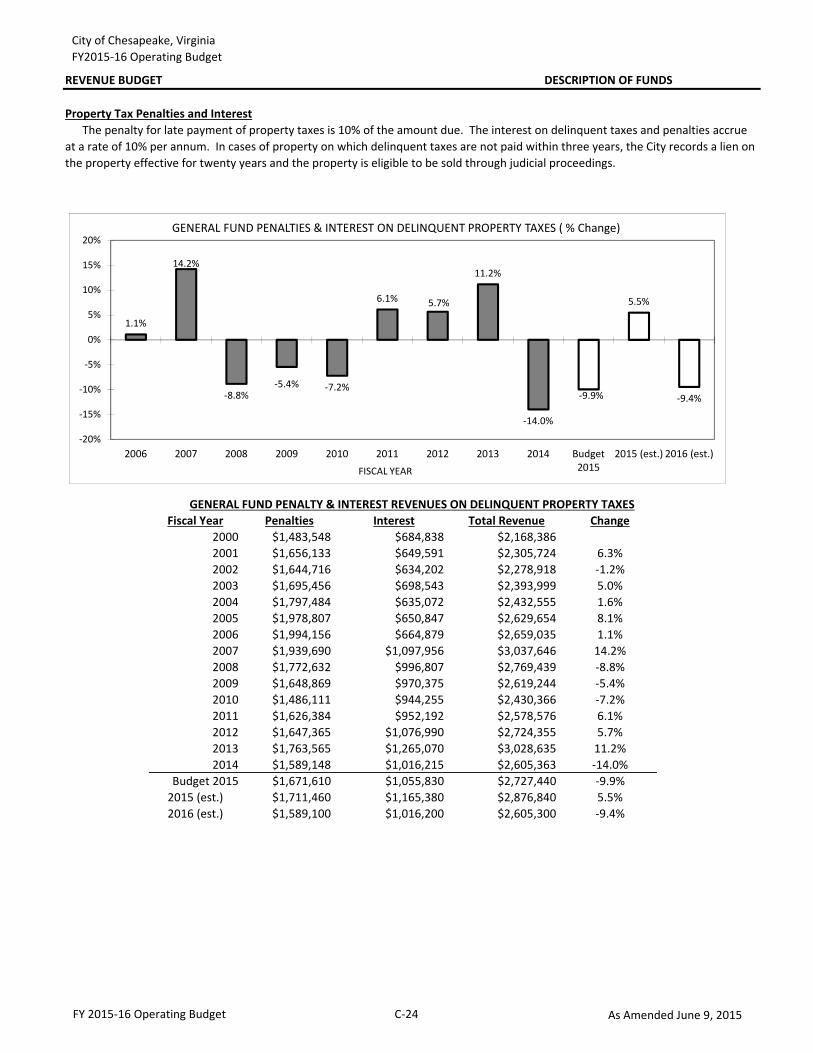
Property Tax Penalties and Interest
Fiscal Year Penalties Interest Total Revenue Change2000 $1,483,548 $684,838 $2,168,3862001 $1,656,133 $649,591 $2,305,724 6.3%2002 $1,644,716 $634,202 $2,278,918 -1.2%2003 $1,695,456 $698,543 $2,393,999 5.0%2004 $1,797,484 $635,072 $2,432,555 1.6%2005 $1,978,807 $650,847 $2,629,654 8.1%2006 $1,994,156 $664,879 $2,659,035 1.1%2007 $1,939,690 $1,097,956 $3,037,646 14.2%2008 $1,772,632 $996,807 $2,769,439 -8.8%2009 $1,648,869 $970,375 $2,619,244 -5.4%2010 $1,486,111 $944,255 $2,430,366 -7.2%2011 $1,626,384 $952,192 $2,578,576 6.1%2012 $1,647,365 $1,076,990 $2,724,355 5.7%2013 $1,763,565 $1,265,070 $3,028,635 11.2%2014 $1,589,148 $1,016,215 $2,605,363 -14.0%
Budget 2015 $1,671,610 $1,055,830 $2,727,440 -9.9%2015 (est.) $1,711,460 $1,165,380 $2,876,840 5.5%2016 (est.) $1,589,100 $1,016,200 $2,605,300 -9.4%2017 (est.) $1,589,100 $1,016,200 $2,605,300 0.0%2018 (est.) $1,589,100 $1,016,200 $2,605,300 0.0%2019 (est.) $1,589,100 $1,016,200 $2,605,300 0.0%2020 (est.) $1,589,100 $1,016,200 $2,605,300 0.0%
The penalty for late payment of property taxes is 10% of the amount due. The interest on delinquent taxes and penalties accrue at a rate of 10% per annum. In cases of property on which delinquent taxes are not paid within three years, the City records a lien on the property effective for twenty years and the property is eligible to be sold through judicial proceedings.
GENERAL FUND PENALTY & INTEREST REVENUES ON DELINQUENT PROPERTY TAXES
1.1%
14.2%
-8.8%-5.4% -7.2%
6.1% 5.7%
11.2%
-14.0%
-9.9%
5.5%
-9.4%
-20%
-15%
-10%
-5%
0%
5%
10%
15%
20%
2006 2007 2008 2009 2010 2011 2012 2013 2014 Budget2015
2015 (est.) 2016 (est.)FISCAL YEAR
GENERAL FUND PENALTIES & INTEREST ON DELINQUENT PROPERTY TAXES ( % Change)
FY 2015-16 Operating Budget C-24 As Amended June 9, 2015
City of Chesapeake, VirginiaFY2015-16 Operating Budget
REVENUE BUDGET DESCRIPTION OF FUNDS
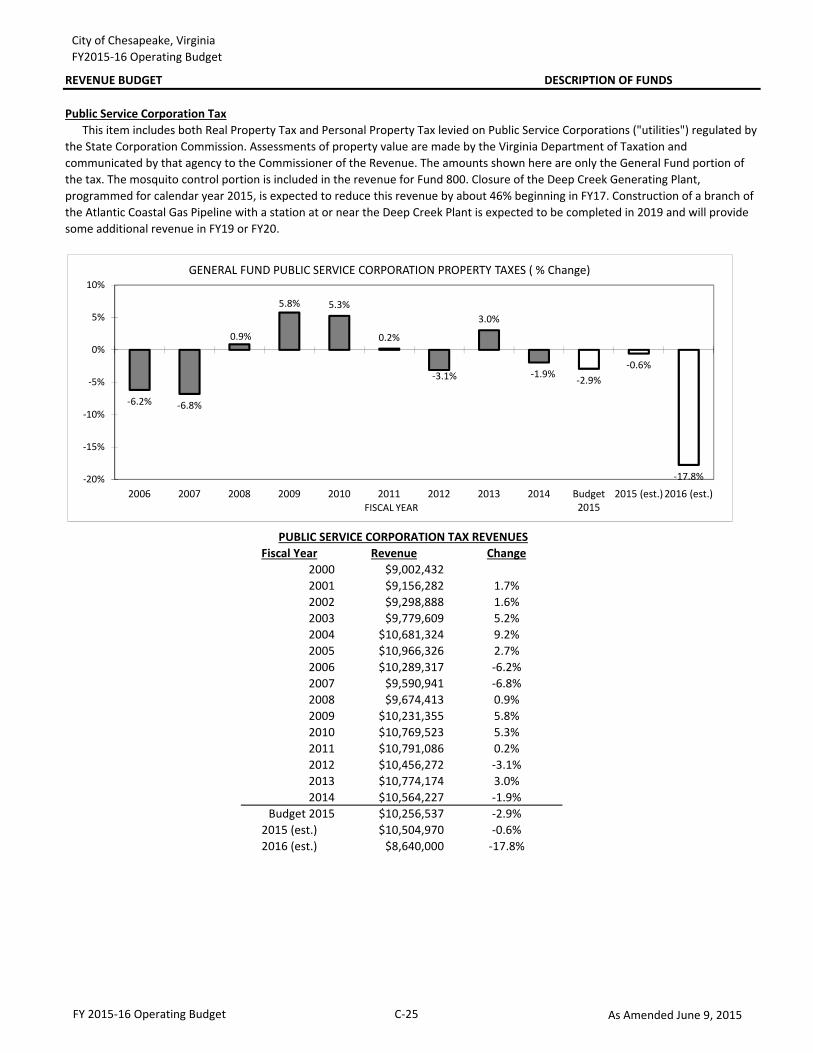
Public Service Corporation Tax
Fiscal Year Revenue Change2000 $9,002,4322001 $9,156,282 1.7%2002 $9,298,888 1.6%2003 $9,779,609 5.2%2004 $10,681,324 9.2%2005 $10,966,326 2.7%2006 $10,289,317 -6.2%2007 $9,590,941 -6.8%2008 $9,674,413 0.9%2009 $10,231,355 5.8%2010 $10,769,523 5.3%2011 $10,791,086 0.2%2012 $10,456,272 -3.1%2013 $10,774,174 3.0%2014 $10,564,227 -1.9%
Budget 2015 $10,256,537 -2.9%2015 (est.) $10,504,970 -0.6%2016 (est.) $8,640,000 -17.8%2017 (est.) $8,300,000 -3.9%2018 (est.) $8,400,000 1.2%2019 (est.) $8,500,000 1.2%2020 (est.) $8,600,000 1.2%
This item includes both Real Property Tax and Personal Property Tax levied on Public Service Corporations ("utilities") regulated by the State Corporation Commission. Assessments of property value are made by the Virginia Department of Taxation and communicated by that agency to the Commissioner of the Revenue. The amounts shown here are only the General Fund portion of the tax. The mosquito control portion is included in the revenue for Fund 800. Closure of the Deep Creek Generating Plant, programmed for calendar year 2015, is expected to reduce this revenue by about 46% beginning in FY17. Construction of a branch of the Atlantic Coastal Gas Pipeline with a station at or near the Deep Creek Plant is expected to be completed in 2019 and will provide some additional revenue in FY19 or FY20.
PUBLIC SERVICE CORPORATION TAX REVENUES
-6.2% -6.8%
0.9%
5.8% 5.3%
0.2%
-3.1%
3.0%
-1.9% -2.9%-0.6%
-17.8%-20%
-15%
-10%
-5%
0%
5%
10%
2006 2007 2008 2009 2010 2011 2012 2013 2014 Budget2015
2015 (est.) 2016 (est.)FISCAL YEAR
GENERAL FUND PUBLIC SERVICE CORPORATION PROPERTY TAXES ( % Change)
FY 2015-16 Operating Budget C-25 As Amended June 9, 2015
City of Chesapeake, VirginiaFY2015-16 Operating Budget
REVENUE BUDGET DESCRIPTION OF FUNDS
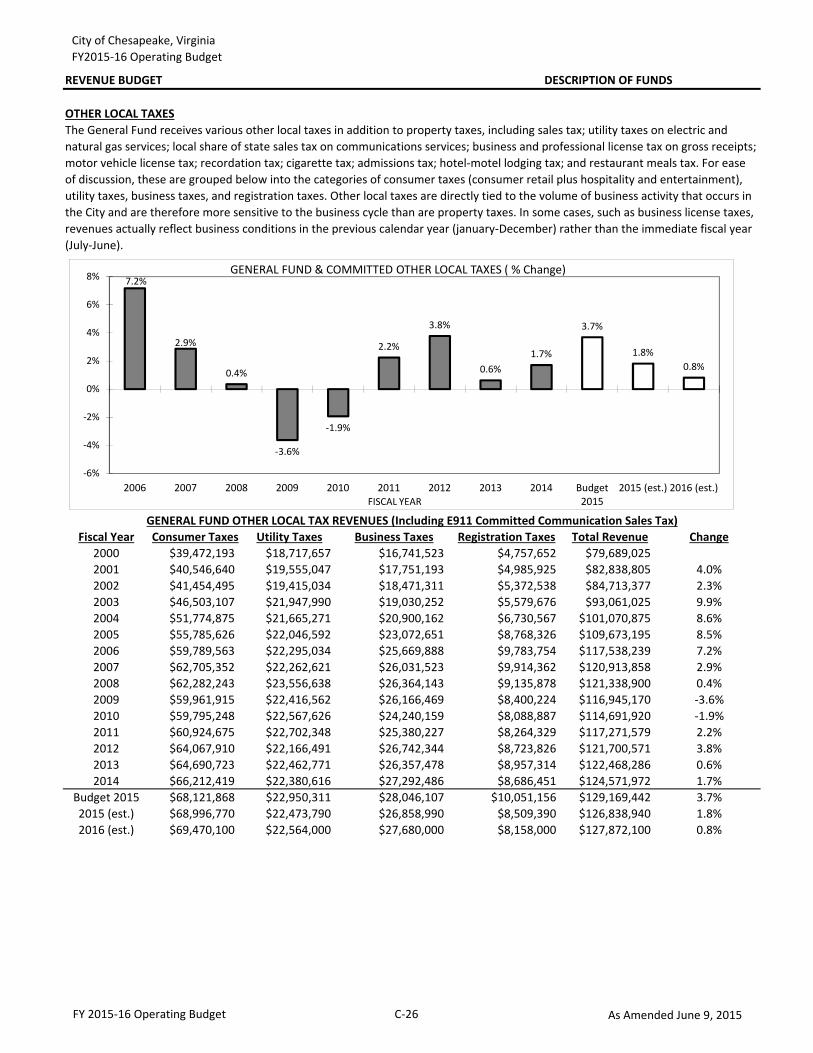
OTHER LOCAL TAXES
Fiscal Year Consumer Taxes Utility Taxes Business Taxes Registration Taxes Total Revenue Change2000 $39,472,193 $18,717,657 $16,741,523 $4,757,652 $79,689,0252001 $40,546,640 $19,555,047 $17,751,193 $4,985,925 $82,838,805 4.0%2002 $41,454,495 $19,415,034 $18,471,311 $5,372,538 $84,713,377 2.3%2003 $46,503,107 $21,947,990 $19,030,252 $5,579,676 $93,061,025 9.9%2004 $51,774,875 $21,665,271 $20,900,162 $6,730,567 $101,070,875 8.6%2005 $55,785,626 $22,046,592 $23,072,651 $8,768,326 $109,673,195 8.5%2006 $59,789,563 $22,295,034 $25,669,888 $9,783,754 $117,538,239 7.2%2007 $62,705,352 $22,262,621 $26,031,523 $9,914,362 $120,913,858 2.9%2008 $62,282,243 $23,556,638 $26,364,143 $9,135,878 $121,338,900 0.4%2009 $59,961,915 $22,416,562 $26,166,469 $8,400,224 $116,945,170 -3.6%2010 $59,795,248 $22,567,626 $24,240,159 $8,088,887 $114,691,920 -1.9%2011 $60,924,675 $22,702,348 $25,380,227 $8,264,329 $117,271,579 2.2%2012 $64,067,910 $22,166,491 $26,742,344 $8,723,826 $121,700,571 3.8%2013 $64,690,723 $22,462,771 $26,357,478 $8,957,314 $122,468,286 0.6%2014 $66,212,419 $22,380,616 $27,292,486 $8,686,451 $124,571,972 1.7%
Budget 2015 $68,121,868 $22,950,311 $28,046,107 $10,051,156 $129,169,442 3.7%2015 (est.) $68,996,770 $22,473,790 $26,858,990 $8,509,390 $126,838,940 1.8%2016 (est.) $69,470,100 $22,564,000 $27,680,000 $8,158,000 $127,872,100 0.8%2017 (est.) $71,186,500 $22,686,800 $28,495,000 $8,236,800 $130,605,100 2.1%2018 (est.) $72,951,100 $22,810,300 $29,334,400 $8,316,400 $133,412,200 2.1%2019 (est.) $74,765,400 $22,934,500 $30,198,900 $8,396,900 $136,295,700 2.2%2020 (est.) $76,630,900 $23,059,400 $31,089,000 $8,478,200 $139,257,500 2.2%
GENERAL FUND OTHER LOCAL TAX REVENUES (Including E911 Committed Communication Sales Tax)
The General Fund receives various other local taxes in addition to property taxes, including sales tax; utility taxes on electric and natural gas services; local share of state sales tax on communications services; business and professional license tax on gross receipts; motor vehicle license tax; recordation tax; cigarette tax; admissions tax; hotel-motel lodging tax; and restaurant meals tax. For ease of discussion, these are grouped below into the categories of consumer taxes (consumer retail plus hospitality and entertainment), utility taxes, business taxes, and registration taxes. Other local taxes are directly tied to the volume of business activity that occurs in the City and are therefore more sensitive to the business cycle than are property taxes. In some cases, such as business license taxes, revenues actually reflect business conditions in the previous calendar year (january-December) rather than the immediate fiscal year (July-June).
7.2%
2.9%
0.4%
-3.6%
-1.9%
2.2%
3.8%
0.6%1.7%
3.7%
1.8%0.8%
-6%
-4%
-2%
0%
2%
4%
6%
8%
2006 2007 2008 2009 2010 2011 2012 2013 2014 Budget2015
2015 (est.) 2016 (est.)FISCAL YEAR
GENERAL FUND & COMMITTED OTHER LOCAL TAXES ( % Change)
FY 2015-16 Operating Budget C-26 As Amended June 9, 2015
City of Chesapeake, VirginiaFY2015-16 Operating Budget
REVENUE BUDGET DESCRIPTION OF FUNDS
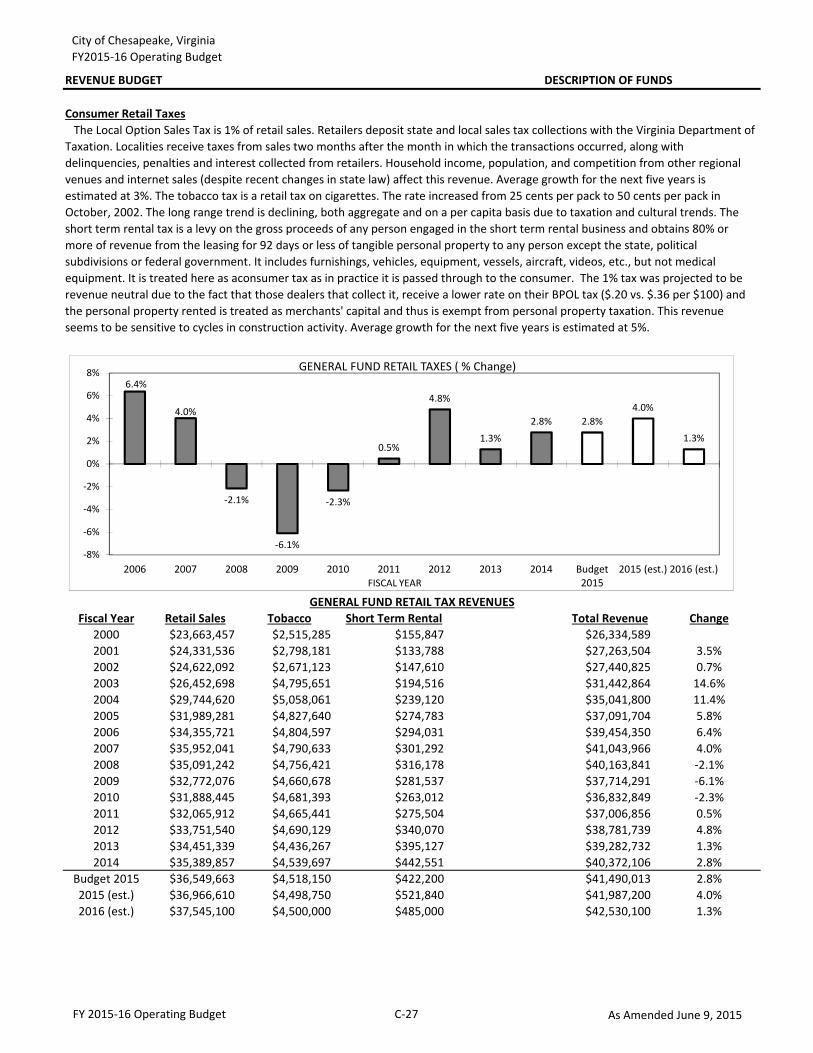
Consumer Retail Taxes
Fiscal Year Retail Sales Tobacco Short Term Rental Total Revenue Change2000 $23,663,457 $2,515,285 $155,847 $26,334,5892001 $24,331,536 $2,798,181 $133,788 $27,263,504 3.5%2002 $24,622,092 $2,671,123 $147,610 $27,440,825 0.7%2003 $26,452,698 $4,795,651 $194,516 $31,442,864 14.6%2004 $29,744,620 $5,058,061 $239,120 $35,041,800 11.4%2005 $31,989,281 $4,827,640 $274,783 $37,091,704 5.8%2006 $34,355,721 $4,804,597 $294,031 $39,454,350 6.4%2007 $35,952,041 $4,790,633 $301,292 $41,043,966 4.0%2008 $35,091,242 $4,756,421 $316,178 $40,163,841 -2.1%2009 $32,772,076 $4,660,678 $281,537 $37,714,291 -6.1%2010 $31,888,445 $4,681,393 $263,012 $36,832,849 -2.3%2011 $32,065,912 $4,665,441 $275,504 $37,006,856 0.5%2012 $33,751,540 $4,690,129 $340,070 $38,781,739 4.8%2013 $34,451,339 $4,436,267 $395,127 $39,282,732 1.3%2014 $35,389,857 $4,539,697 $442,551 $40,372,106 2.8%
Budget 2015 $36,549,663 $4,518,150 $422,200 $41,490,013 2.8%2015 (est.) $36,966,610 $4,498,750 $521,840 $41,987,200 4.0%2016 (est.) $37,545,100 $4,500,000 $485,000 $42,530,100 1.3%2017 (est.) $38,671,500 $4,477,500 $509,300 $43,658,300 2.7%2018 (est.) $39,831,600 $4,455,100 $534,800 $44,821,500 2.7%2019 (est.) $41,026,500 $4,432,800 $561,500 $46,020,800 2.7%2020 (est.) $42,257,300 $4,410,600 $589,600 $47,257,500 2.7%
GENERAL FUND RETAIL TAX REVENUES
The Local Option Sales Tax is 1% of retail sales. Retailers deposit state and local sales tax collections with the Virginia Department of Taxation. Localities receive taxes from sales two months after the month in which the transactions occurred, along with delinquencies, penalties and interest collected from retailers. Household income, population, and competition from other regional venues and internet sales (despite recent changes in state law) affect this revenue. Average growth for the next five years is estimated at 3%. The tobacco tax is a retail tax on cigarettes. The rate increased from 25 cents per pack to 50 cents per pack in October, 2002. The long range trend is declining, both aggregate and on a per capita basis due to taxation and cultural trends. The short term rental tax is a levy on the gross proceeds of any person engaged in the short term rental business and obtains 80% or more of revenue from the leasing for 92 days or less of tangible personal property to any person except the state, political subdivisions or federal government. It includes furnishings, vehicles, equipment, vessels, aircraft, videos, etc., but not medical equipment. It is treated here as aconsumer tax as in practice it is passed through to the consumer. The 1% tax was projected to be revenue neutral due to the fact that those dealers that collect it, receive a lower rate on their BPOL tax ($.20 vs. $.36 per $100) and the personal property rented is treated as merchants' capital and thus is exempt from personal property taxation. This revenue seems to be sensitive to cycles in construction activity. Average growth for the next five years is estimated at 5%.
6.4%
4.0%
-2.1%
-6.1%
-2.3%
0.5%
4.8%
1.3%2.8% 2.8%
4.0%
1.3%
-8%
-6%
-4%
-2%
0%
2%
4%
6%
8%
2006 2007 2008 2009 2010 2011 2012 2013 2014 Budget2015
2015 (est.) 2016 (est.)FISCAL YEAR
GENERAL FUND RETAIL TAXES ( % Change)
FY 2015-16 Operating Budget C-27 As Amended June 9, 2015
City of Chesapeake, VirginiaFY2015-16 Operating Budget
REVENUE BUDGET DESCRIPTION OF FUNDS
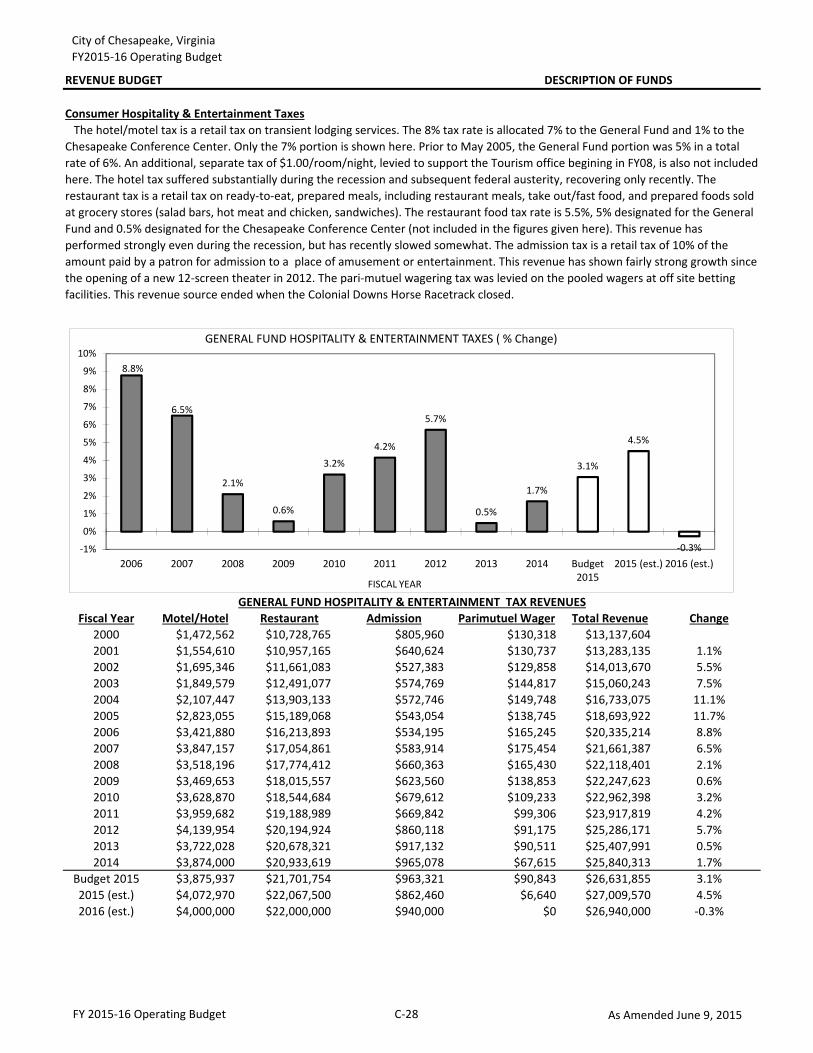
Fiscal Year Motel/Hotel Restaurant Admission Parimutuel Wager Total Revenue Change2000 $1,472,562 $10,728,765 $805,960 $130,318 $13,137,6042001 $1,554,610 $10,957,165 $640,624 $130,737 $13,283,135 1.1%2002 $1,695,346 $11,661,083 $527,383 $129,858 $14,013,670 5.5%2003 $1,849,579 $12,491,077 $574,769 $144,817 $15,060,243 7.5%2004 $2,107,447 $13,903,133 $572,746 $149,748 $16,733,075 11.1%2005 $2,823,055 $15,189,068 $543,054 $138,745 $18,693,922 11.7%2006 $3,421,880 $16,213,893 $534,195 $165,245 $20,335,214 8.8%2007 $3,847,157 $17,054,861 $583,914 $175,454 $21,661,387 6.5%2008 $3,518,196 $17,774,412 $660,363 $165,430 $22,118,401 2.1%2009 $3,469,653 $18,015,557 $623,560 $138,853 $22,247,623 0.6%2010 $3,628,870 $18,544,684 $679,612 $109,233 $22,962,398 3.2%2011 $3,959,682 $19,188,989 $669,842 $99,306 $23,917,819 4.2%2012 $4,139,954 $20,194,924 $860,118 $91,175 $25,286,171 5.7%2013 $3,722,028 $20,678,321 $917,132 $90,511 $25,407,991 0.5%2014 $3,874,000 $20,933,619 $965,078 $67,615 $25,840,313 1.7%
Budget 2015 $3,875,937 $21,701,754 $963,321 $90,843 $26,631,855 3.1%2015 (est.) $4,072,970 $22,067,500 $862,460 $6,640 $27,009,570 4.5%2016 (est.) $4,000,000 $22,000,000 $940,000 $0 $26,940,000 -0.3%2017 (est.) $4,120,000 $22,440,000 $968,200 $0 $27,528,200 2.2%2018 (est.) $4,243,600 $22,888,800 $997,200 $0 $28,129,600 2.2%2019 (est.) $4,370,900 $23,346,600 $1,027,100 $0 $28,744,600 2.2%2020 (est.) $4,502,000 $23,813,500 $1,057,900 $0 $29,373,400 2.2%
Consumer Hospitality & Entertainment Taxes The hotel/motel tax is a retail tax on transient lodging services. The 8% tax rate is allocated 7% to the General Fund and 1% to the Chesapeake Conference Center. Only the 7% portion is shown here. Prior to May 2005, the General Fund portion was 5% in a total rate of 6%. An additional, separate tax of $1.00/room/night, levied to support the Tourism office begining in FY08, is also not included here. The hotel tax suffered substantially during the recession and subsequent federal austerity, recovering only recently. The restaurant tax is a retail tax on ready-to-eat, prepared meals, including restaurant meals, take out/fast food, and prepared foods sold at grocery stores (salad bars, hot meat and chicken, sandwiches). The restaurant food tax rate is 5.5%, 5% designated for the General Fund and 0.5% designated for the Chesapeake Conference Center (not included in the figures given here). This revenue has performed strongly even during the recession, but has recently slowed somewhat. The admission tax is a retail tax of 10% of the amount paid by a patron for admission to a place of amusement or entertainment. This revenue has shown fairly strong growth since the opening of a new 12-screen theater in 2012. The pari-mutuel wagering tax was levied on the pooled wagers at off site betting facilities. This revenue source ended when the Colonial Downs Horse Racetrack closed.
GENERAL FUND HOSPITALITY & ENTERTAINMENT TAX REVENUES
8.8%
6.5%
2.1%
0.6%
3.2%4.2%
5.7%
0.5%
1.7%
3.1%
4.5%
-0.3%-1%
0%
1%
2%
3%
4%
5%
6%
7%
8%
9%
10%
2006 2007 2008 2009 2010 2011 2012 2013 2014 Budget2015
2015 (est.) 2016 (est.)
FISCAL YEAR
GENERAL FUND HOSPITALITY & ENTERTAINMENT TAXES ( % Change)
FY 2015-16 Operating Budget C-28 As Amended June 9, 2015
City of Chesapeake, VirginiaFY2015-16 Operating Budget
REVENUE BUDGET DESCRIPTION OF FUNDS
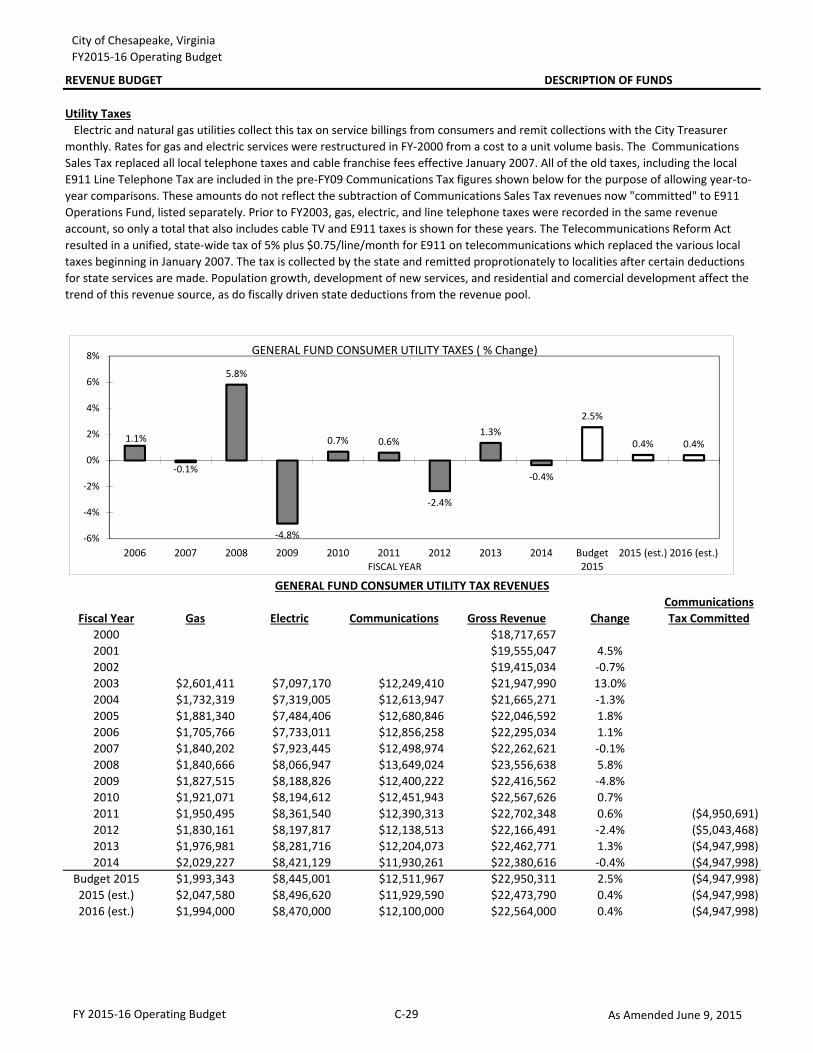
CommunicationsFiscal Year Gas Electric Communications Gross Revenue Change Tax Committed
2000 $18,717,6572001 $19,555,047 4.5%2002 $19,415,034 -0.7%2003 $2,601,411 $7,097,170 $12,249,410 $21,947,990 13.0%2004 $1,732,319 $7,319,005 $12,613,947 $21,665,271 -1.3%2005 $1,881,340 $7,484,406 $12,680,846 $22,046,592 1.8%2006 $1,705,766 $7,733,011 $12,856,258 $22,295,034 1.1%2007 $1,840,202 $7,923,445 $12,498,974 $22,262,621 -0.1%2008 $1,840,666 $8,066,947 $13,649,024 $23,556,638 5.8%2009 $1,827,515 $8,188,826 $12,400,222 $22,416,562 -4.8%2010 $1,921,071 $8,194,612 $12,451,943 $22,567,626 0.7%2011 $1,950,495 $8,361,540 $12,390,313 $22,702,348 0.6% ($4,950,691)2012 $1,830,161 $8,197,817 $12,138,513 $22,166,491 -2.4% ($5,043,468)2013 $1,976,981 $8,281,716 $12,204,073 $22,462,771 1.3% ($4,947,998)2014 $2,029,227 $8,421,129 $11,930,261 $22,380,616 -0.4% ($4,947,998)
Budget 2015 $1,993,343 $8,445,001 $12,511,967 $22,950,311 2.5% ($4,947,998)2015 (est.) $2,047,580 $8,496,620 $11,929,590 $22,473,790 0.4% ($4,947,998)2016 (est.) $1,994,000 $8,470,000 $12,100,000 $22,564,000 0.4% ($4,947,998)2017 (est.) $2,013,900 $8,512,400 $12,160,500 $22,686,800 0.5% ($4,948,000)2018 (est.) $2,034,000 $8,555,000 $12,221,300 $22,810,300 0.5% ($4,948,000)2019 (est.) $2,054,300 $8,597,800 $12,282,400 $22,934,500 0.5% ($4,948,000)2020 (est.) $2,074,800 $8,640,800 $12,343,800 $23,059,400 0.5% ($4,948,000)
GENERAL FUND CONSUMER UTILITY TAX REVENUES
Utility Taxes Electric and natural gas utilities collect this tax on service billings from consumers and remit collections with the City Treasurer monthly. Rates for gas and electric services were restructured in FY-2000 from a cost to a unit volume basis. The Communications Sales Tax replaced all local telephone taxes and cable franchise fees effective January 2007. All of the old taxes, including the local E911 Line Telephone Tax are included in the pre-FY09 Communications Tax figures shown below for the purpose of allowing year-to-year comparisons. These amounts do not reflect the subtraction of Communications Sales Tax revenues now "committed" to E911 Operations Fund, listed separately. Prior to FY2003, gas, electric, and line telephone taxes were recorded in the same revenue account, so only a total that also includes cable TV and E911 taxes is shown for these years. The Telecommunications Reform Act resulted in a unified, state-wide tax of 5% plus $0.75/line/month for E911 on telecommunications which replaced the various local taxes beginning in January 2007. The tax is collected by the state and remitted proprotionately to localities after certain deductions for state services are made. Population growth, development of new services, and residential and comercial development affect the trend of this revenue source, as do fiscally driven state deductions from the revenue pool.
1.1%
-0.1%
5.8%
-4.8%
0.7% 0.6%
-2.4%
1.3%
-0.4%
2.5%
0.4% 0.4%
-6%
-4%
-2%
0%
2%
4%
6%
8%
2006 2007 2008 2009 2010 2011 2012 2013 2014 Budget2015
2015 (est.) 2016 (est.)FISCAL YEAR
GENERAL FUND CONSUMER UTILITY TAXES ( % Change)
FY 2015-16 Operating Budget C-29 As Amended June 9, 2015
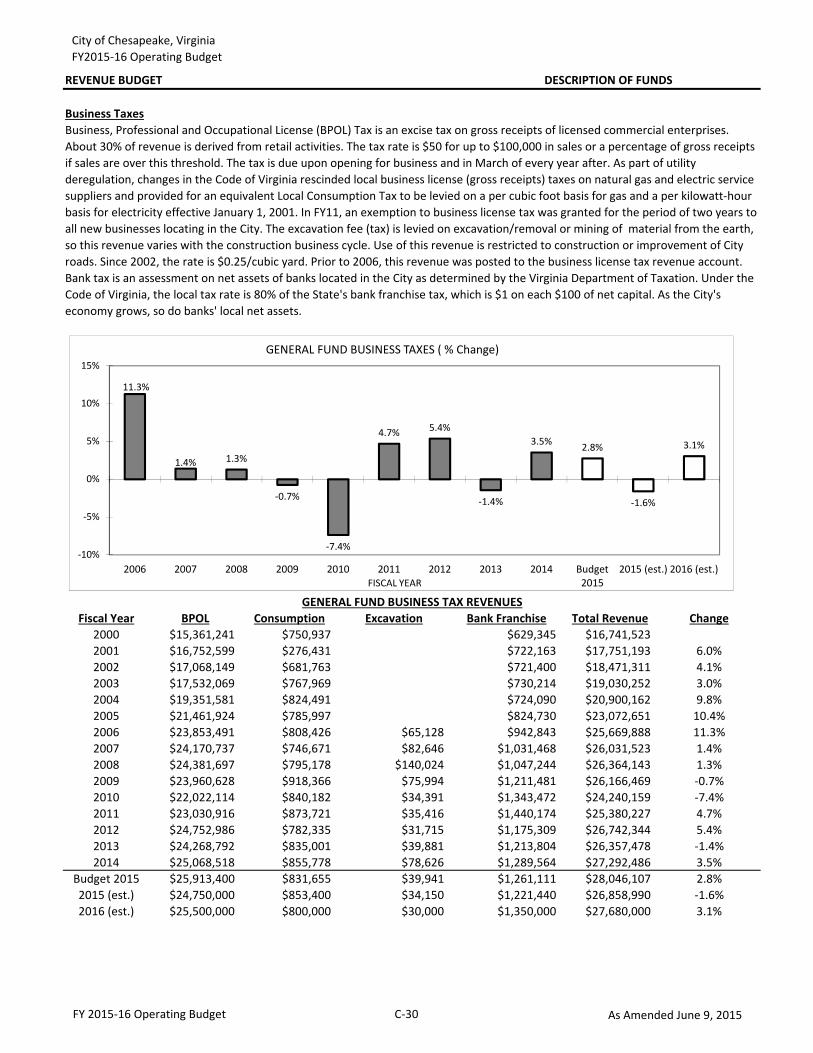
City of Chesapeake, VirginiaFY2015-16 Operating Budget
REVENUE BUDGET DESCRIPTION OF FUNDS
Fiscal Year BPOL Consumption Excavation Bank Franchise Total Revenue Change2000 $15,361,241 $750,937 $629,345 $16,741,5232001 $16,752,599 $276,431 $722,163 $17,751,193 6.0%2002 $17,068,149 $681,763 $721,400 $18,471,311 4.1%2003 $17,532,069 $767,969 $730,214 $19,030,252 3.0%2004 $19,351,581 $824,491 $724,090 $20,900,162 9.8%2005 $21,461,924 $785,997 $824,730 $23,072,651 10.4%2006 $23,853,491 $808,426 $65,128 $942,843 $25,669,888 11.3%2007 $24,170,737 $746,671 $82,646 $1,031,468 $26,031,523 1.4%2008 $24,381,697 $795,178 $140,024 $1,047,244 $26,364,143 1.3%2009 $23,960,628 $918,366 $75,994 $1,211,481 $26,166,469 -0.7%2010 $22,022,114 $840,182 $34,391 $1,343,472 $24,240,159 -7.4%2011 $23,030,916 $873,721 $35,416 $1,440,174 $25,380,227 4.7%2012 $24,752,986 $782,335 $31,715 $1,175,309 $26,742,344 5.4%2013 $24,268,792 $835,001 $39,881 $1,213,804 $26,357,478 -1.4%2014 $25,068,518 $855,778 $78,626 $1,289,564 $27,292,486 3.5%
Budget 2015 $25,913,400 $831,655 $39,941 $1,261,111 $28,046,107 2.8%2015 (est.) $24,750,000 $853,400 $34,150 $1,221,440 $26,858,990 -1.6%2016 (est.) $25,500,000 $800,000 $30,000 $1,350,000 $27,680,000 3.1%2017 (est.) $26,265,000 $808,000 $31,500 $1,390,500 $28,495,000 2.9%2018 (est.) $27,053,000 $816,100 $33,100 $1,432,200 $29,334,400 2.9%2019 (est.) $27,864,600 $824,300 $34,800 $1,475,200 $30,198,900 2.9%2020 (est.) $28,700,500 $832,500 $36,500 $1,519,500 $31,089,000 2.9%
GENERAL FUND BUSINESS TAX REVENUES
Business TaxesBusiness, Professional and Occupational License (BPOL) Tax is an excise tax on gross receipts of licensed commercial enterprises. About 30% of revenue is derived from retail activities. The tax rate is $50 for up to $100,000 in sales or a percentage of gross receipts if sales are over this threshold. The tax is due upon opening for business and in March of every year after. As part of utility deregulation, changes in the Code of Virginia rescinded local business license (gross receipts) taxes on natural gas and electric service suppliers and provided for an equivalent Local Consumption Tax to be levied on a per cubic foot basis for gas and a per kilowatt-hour basis for electricity effective January 1, 2001. In FY11, an exemption to business license tax was granted for the period of two years to all new businesses locating in the City. The excavation fee (tax) is levied on excavation/removal or mining of material from the earth, so this revenue varies with the construction business cycle. Use of this revenue is restricted to construction or improvement of City roads. Since 2002, the rate is $0.25/cubic yard. Prior to 2006, this revenue was posted to the business license tax revenue account. Bank tax is an assessment on net assets of banks located in the City as determined by the Virginia Department of Taxation. Under the Code of Virginia, the local tax rate is 80% of the State's bank franchise tax, which is $1 on each $100 of net capital. As the City's economy grows, so do banks' local net assets.
11.3%
1.4% 1.3%
-0.7%
-7.4%
4.7% 5.4%
-1.4%
3.5% 2.8%
-1.6%
3.1%
-10%
-5%
0%
5%
10%
15%
2006 2007 2008 2009 2010 2011 2012 2013 2014 Budget2015
2015 (est.) 2016 (est.)FISCAL YEAR
GENERAL FUND BUSINESS TAXES ( % Change)
FY 2015-16 Operating Budget C-30 As Amended June 9, 2015
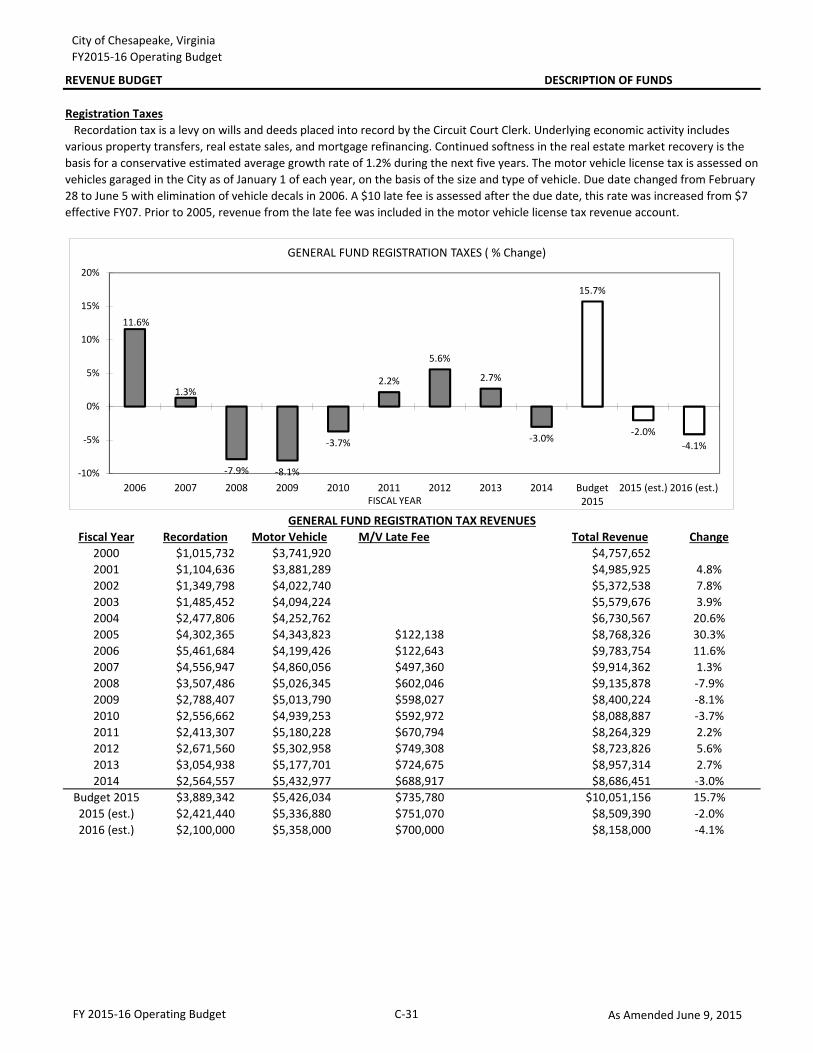
City of Chesapeake, VirginiaFY2015-16 Operating Budget
REVENUE BUDGET DESCRIPTION OF FUNDS
Fiscal Year Recordation Motor Vehicle M/V Late Fee Total Revenue Change2000 $1,015,732 $3,741,920 $4,757,6522001 $1,104,636 $3,881,289 $4,985,925 4.8%2002 $1,349,798 $4,022,740 $5,372,538 7.8%2003 $1,485,452 $4,094,224 $5,579,676 3.9%2004 $2,477,806 $4,252,762 $6,730,567 20.6%2005 $4,302,365 $4,343,823 $122,138 $8,768,326 30.3%2006 $5,461,684 $4,199,426 $122,643 $9,783,754 11.6%2007 $4,556,947 $4,860,056 $497,360 $9,914,362 1.3%2008 $3,507,486 $5,026,345 $602,046 $9,135,878 -7.9%2009 $2,788,407 $5,013,790 $598,027 $8,400,224 -8.1%2010 $2,556,662 $4,939,253 $592,972 $8,088,887 -3.7%2011 $2,413,307 $5,180,228 $670,794 $8,264,329 2.2%2012 $2,671,560 $5,302,958 $749,308 $8,723,826 5.6%2013 $3,054,938 $5,177,701 $724,675 $8,957,314 2.7%2014 $2,564,557 $5,432,977 $688,917 $8,686,451 -3.0%
Budget 2015 $3,889,342 $5,426,034 $735,780 $10,051,156 15.7%2015 (est.) $2,421,440 $5,336,880 $751,070 $8,509,390 -2.0%2016 (est.) $2,100,000 $5,358,000 $700,000 $8,158,000 -4.1%2017 (est.) $2,125,200 $5,411,600 $700,000 $8,236,800 1.0%2018 (est.) $2,150,700 $5,465,700 $700,000 $8,316,400 1.0%2019 (est.) $2,176,500 $5,520,400 $700,000 $8,396,900 1.0%2020 (est.) $2,202,600 $5,575,600 $700,000 $8,478,200 1.0%
Registration Taxes Recordation tax is a levy on wills and deeds placed into record by the Circuit Court Clerk. Underlying economic activity includes various property transfers, real estate sales, and mortgage refinancing. Continued softness in the real estate market recovery is the basis for a conservative estimated average growth rate of 1.2% during the next five years. The motor vehicle license tax is assessed on vehicles garaged in the City as of January 1 of each year, on the basis of the size and type of vehicle. Due date changed from February 28 to June 5 with elimination of vehicle decals in 2006. A $10 late fee is assessed after the due date, this rate was increased from $7 effective FY07. Prior to 2005, revenue from the late fee was included in the motor vehicle license tax revenue account.
GENERAL FUND REGISTRATION TAX REVENUES
11.6%
1.3%
-7.9% -8.1%
-3.7%
2.2%
5.6%
2.7%
-3.0%
15.7%
-2.0%-4.1%
-10%
-5%
0%
5%
10%
15%
20%
2006 2007 2008 2009 2010 2011 2012 2013 2014 Budget2015
2015 (est.) 2016 (est.)FISCAL YEAR
GENERAL FUND REGISTRATION TAXES ( % Change)
FY 2015-16 Operating Budget C-31 As Amended June 9, 2015
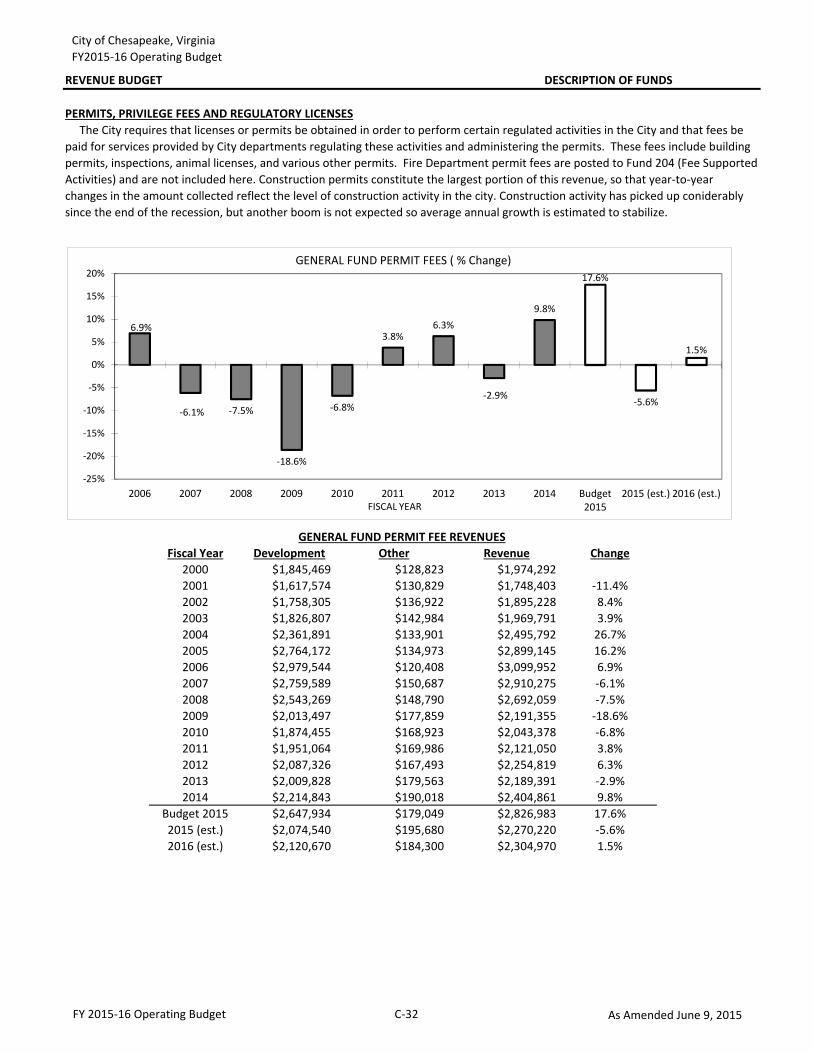
City of Chesapeake, VirginiaFY2015-16 Operating Budget
REVENUE BUDGET DESCRIPTION OF FUNDS
Fiscal Year Development Other Revenue Change2000 $1,845,469 $128,823 $1,974,2922001 $1,617,574 $130,829 $1,748,403 -11.4%2002 $1,758,305 $136,922 $1,895,228 8.4%2003 $1,826,807 $142,984 $1,969,791 3.9%2004 $2,361,891 $133,901 $2,495,792 26.7%2005 $2,764,172 $134,973 $2,899,145 16.2%2006 $2,979,544 $120,408 $3,099,952 6.9%2007 $2,759,589 $150,687 $2,910,275 -6.1%2008 $2,543,269 $148,790 $2,692,059 -7.5%2009 $2,013,497 $177,859 $2,191,355 -18.6%2010 $1,874,455 $168,923 $2,043,378 -6.8%2011 $1,951,064 $169,986 $2,121,050 3.8%2012 $2,087,326 $167,493 $2,254,819 6.3%2013 $2,009,828 $179,563 $2,189,391 -2.9%2014 $2,214,843 $190,018 $2,404,861 9.8%
Budget 2015 $2,647,934 $179,049 $2,826,983 17.6%2015 (est.) $2,074,540 $195,680 $2,270,220 -5.6%2016 (est.) $2,120,670 $184,300 $2,304,970 1.5%2017 (est.) $2,154,400 $184,300 $2,338,700 1.5%2018 (est.) $2,188,600 $184,300 $2,372,900 1.5%2019 (est.) $2,223,500 $184,300 $2,407,800 1.5%2020 (est.) $2,259,100 $184,300 $2,443,400 1.5%
PERMITS, PRIVILEGE FEES AND REGULATORY LICENSES The City requires that licenses or permits be obtained in order to perform certain regulated activities in the City and that fees be paid for services provided by City departments regulating these activities and administering the permits. These fees include building permits, inspections, animal licenses, and various other permits. Fire Department permit fees are posted to Fund 204 (Fee Supported Activities) and are not included here. Construction permits constitute the largest portion of this revenue, so that year-to-year changes in the amount collected reflect the level of construction activity in the city. Construction activity has picked up coniderably since the end of the recession, but another boom is not expected so average annual growth is estimated to stabilize.
GENERAL FUND PERMIT FEE REVENUES
6.9%
-6.1% -7.5%
-18.6%
-6.8%
3.8%6.3%
-2.9%
9.8%
17.6%
-5.6%
1.5%
-25%
-20%
-15%
-10%
-5%
0%
5%
10%
15%
20%
2006 2007 2008 2009 2010 2011 2012 2013 2014 Budget2015
2015 (est.) 2016 (est.)FISCAL YEAR
GENERAL FUND PERMIT FEES ( % Change)
FY 2015-16 Operating Budget C-32 As Amended June 9, 2015
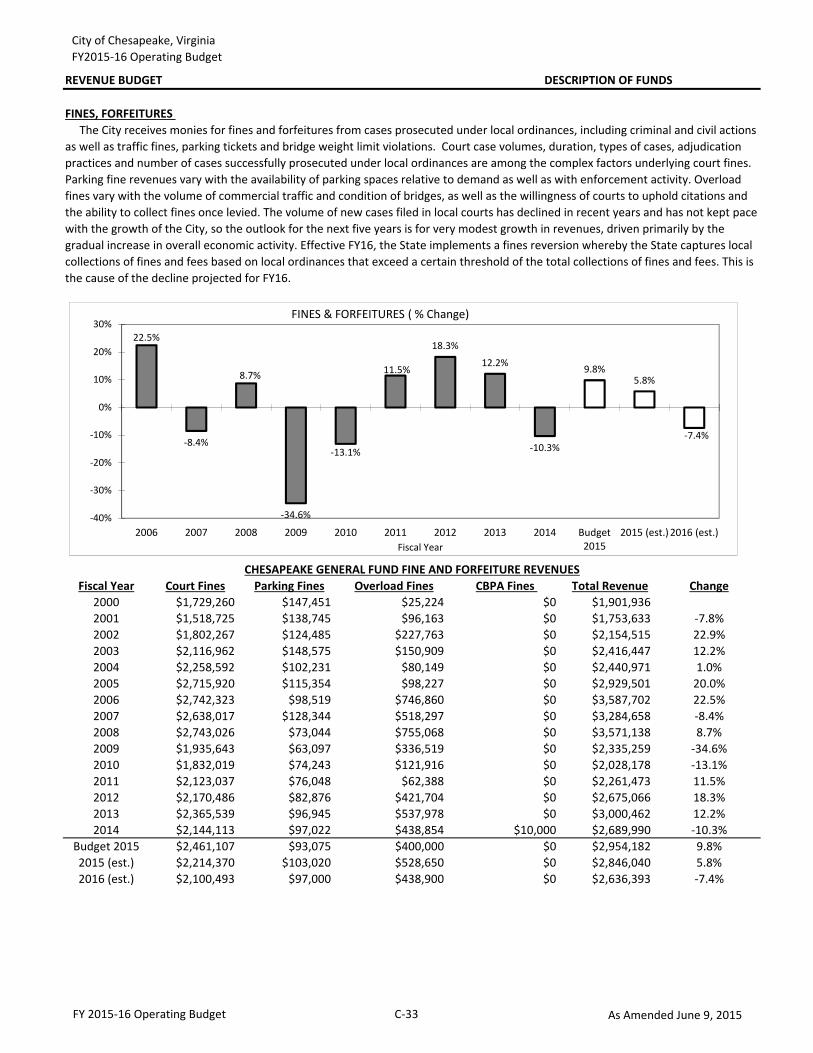
City of Chesapeake, VirginiaFY2015-16 Operating Budget
REVENUE BUDGET DESCRIPTION OF FUNDS
FINES, FORFEITURES
Fiscal Year Court Fines Parking Fines Overload Fines CBPA Fines Total Revenue Change2000 $1,729,260 $147,451 $25,224 $0 $1,901,9362001 $1,518,725 $138,745 $96,163 $0 $1,753,633 -7.8%2002 $1,802,267 $124,485 $227,763 $0 $2,154,515 22.9%2003 $2,116,962 $148,575 $150,909 $0 $2,416,447 12.2%2004 $2,258,592 $102,231 $80,149 $0 $2,440,971 1.0%2005 $2,715,920 $115,354 $98,227 $0 $2,929,501 20.0%2006 $2,742,323 $98,519 $746,860 $0 $3,587,702 22.5%2007 $2,638,017 $128,344 $518,297 $0 $3,284,658 -8.4%2008 $2,743,026 $73,044 $755,068 $0 $3,571,138 8.7%2009 $1,935,643 $63,097 $336,519 $0 $2,335,259 -34.6%2010 $1,832,019 $74,243 $121,916 $0 $2,028,178 -13.1%2011 $2,123,037 $76,048 $62,388 $0 $2,261,473 11.5%2012 $2,170,486 $82,876 $421,704 $0 $2,675,066 18.3%2013 $2,365,539 $96,945 $537,978 $0 $3,000,462 12.2%2014 $2,144,113 $97,022 $438,854 $10,000 $2,689,990 -10.3%
Budget 2015 $2,461,107 $93,075 $400,000 $0 $2,954,182 9.8%2015 (est.) $2,214,370 $103,020 $528,650 $0 $2,846,040 5.8%2016 (est.) $2,100,493 $97,000 $438,900 $0 $2,636,393 -7.4%2017 (est.) $2,121,500 $97,000 $438,900 $0 $2,657,400 0.8%2018 (est.) $2,142,700 $97,000 $438,900 $0 $2,678,600 0.8%2019 (est.) $2,164,100 $97,000 $438,900 $0 $2,700,000 0.8%2020 (est.) $2,185,700 $97,000 $438,900 $0 $2,721,600 0.8%
The City receives monies for fines and forfeitures from cases prosecuted under local ordinances, including criminal and civil actions as well as traffic fines, parking tickets and bridge weight limit violations. Court case volumes, duration, types of cases, adjudication practices and number of cases successfully prosecuted under local ordinances are among the complex factors underlying court fines. Parking fine revenues vary with the availability of parking spaces relative to demand as well as with enforcement activity. Overload fines vary with the volume of commercial traffic and condition of bridges, as well as the willingness of courts to uphold citations and the ability to collect fines once levied. The volume of new cases filed in local courts has declined in recent years and has not kept pace with the growth of the City, so the outlook for the next five years is for very modest growth in revenues, driven primarily by the gradual increase in overall economic activity. Effective FY16, the State implements a fines reversion whereby the State captures local collections of fines and fees based on local ordinances that exceed a certain threshold of the total collections of fines and fees. This is the cause of the decline projected for FY16.
CHESAPEAKE GENERAL FUND FINE AND FORFEITURE REVENUES
22.5%
-8.4%
8.7%
-34.6%
-13.1%
11.5%
18.3%
12.2%
-10.3%
9.8%5.8%
-7.4%
-40%
-30%
-20%
-10%
0%
10%
20%
30%
2006 2007 2008 2009 2010 2011 2012 2013 2014 Budget2015
2015 (est.) 2016 (est.)Fiscal Year
FINES & FORFEITURES ( % Change)
FY 2015-16 Operating Budget C-33 As Amended June 9, 2015
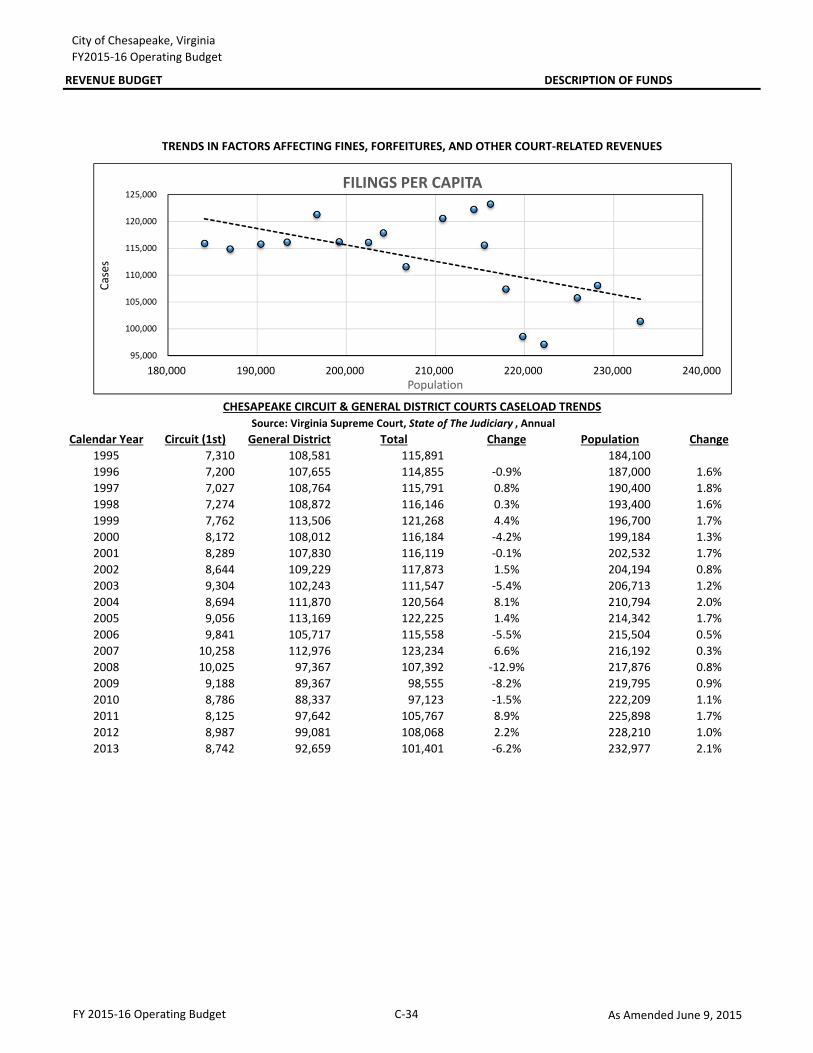
City of Chesapeake, VirginiaFY2015-16 Operating Budget
REVENUE BUDGET DESCRIPTION OF FUNDS
Calendar Year Circuit (1st) General District Total Change Population Change1995 7,310 108,581 115,891 184,1001996 7,200 107,655 114,855 -0.9% 187,000 1.6%1997 7,027 108,764 115,791 0.8% 190,400 1.8%1998 7,274 108,872 116,146 0.3% 193,400 1.6%1999 7,762 113,506 121,268 4.4% 196,700 1.7%2000 8,172 108,012 116,184 -4.2% 199,184 1.3%2001 8,289 107,830 116,119 -0.1% 202,532 1.7%2002 8,644 109,229 117,873 1.5% 204,194 0.8%2003 9,304 102,243 111,547 -5.4% 206,713 1.2%2004 8,694 111,870 120,564 8.1% 210,794 2.0%2005 9,056 113,169 122,225 1.4% 214,342 1.7%2006 9,841 105,717 115,558 -5.5% 215,504 0.5%2007 10,258 112,976 123,234 6.6% 216,192 0.3%2008 10,025 97,367 107,392 -12.9% 217,876 0.8%2009 9,188 89,367 98,555 -8.2% 219,795 0.9%2010 8,786 88,337 97,123 -1.5% 222,209 1.1%2011 8,125 97,642 105,767 8.9% 225,898 1.7%2012 8,987 99,081 108,068 2.2% 228,210 1.0%2013 8,742 92,659 101,401 -6.2% 232,977 2.1%
TRENDS IN FACTORS AFFECTING FINES, FORFEITURES, AND OTHER COURT-RELATED REVENUES
Source: Virginia Supreme Court, State of The Judiciary , AnnualCHESAPEAKE CIRCUIT & GENERAL DISTRICT COURTS CASELOAD TRENDS
95,000
100,000
105,000
110,000
115,000
120,000
125,000
180,000 190,000 200,000 210,000 220,000 230,000 240,000
Case
s
Population
FILINGS PER CAPITA
FY 2015-16 Operating Budget C-34 As Amended June 9, 2015
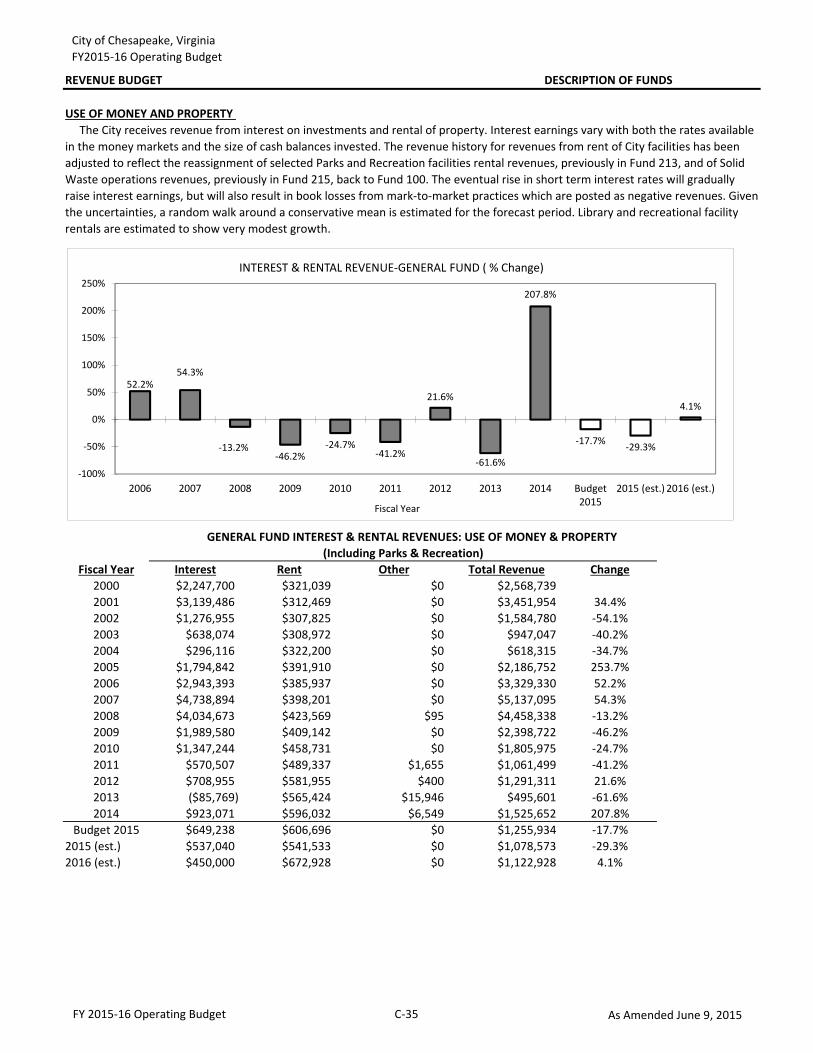
City of Chesapeake, VirginiaFY2015-16 Operating Budget
REVENUE BUDGET DESCRIPTION OF FUNDS
Fiscal Year Interest Rent Other Total Revenue Change2000 $2,247,700 $321,039 $0 $2,568,7392001 $3,139,486 $312,469 $0 $3,451,954 34.4%2002 $1,276,955 $307,825 $0 $1,584,780 -54.1%2003 $638,074 $308,972 $0 $947,047 -40.2%2004 $296,116 $322,200 $0 $618,315 -34.7%2005 $1,794,842 $391,910 $0 $2,186,752 253.7%2006 $2,943,393 $385,937 $0 $3,329,330 52.2%2007 $4,738,894 $398,201 $0 $5,137,095 54.3%2008 $4,034,673 $423,569 $95 $4,458,338 -13.2%2009 $1,989,580 $409,142 $0 $2,398,722 -46.2%2010 $1,347,244 $458,731 $0 $1,805,975 -24.7%2011 $570,507 $489,337 $1,655 $1,061,499 -41.2%2012 $708,955 $581,955 $400 $1,291,311 21.6%2013 ($85,769) $565,424 $15,946 $495,601 -61.6%2014 $923,071 $596,032 $6,549 $1,525,652 207.8%
Budget 2015 $649,238 $606,696 $0 $1,255,934 -17.7%2015 (est.) $537,040 $541,533 $0 $1,078,573 -29.3%2016 (est.) $450,000 $672,928 $0 $1,122,928 4.1%2017 (est.) $450,000 $674,700 $0 $1,124,700 0.2%2018 (est.) $450,000 $676,500 $0 $1,126,500 0.2%2019 (est.) $450,000 $678,300 $0 $1,128,300 0.2%2020 (est.) $450,000 $680,200 $0 $1,130,200 0.2%
USE OF MONEY AND PROPERTY The City receives revenue from interest on investments and rental of property. Interest earnings vary with both the rates available in the money markets and the size of cash balances invested. The revenue history for revenues from rent of City facilities has been adjusted to reflect the reassignment of selected Parks and Recreation facilities rental revenues, previously in Fund 213, and of Solid Waste operations revenues, previously in Fund 215, back to Fund 100. The eventual rise in short term interest rates will gradually raise interest earnings, but will also result in book losses from mark-to-market practices which are posted as negative revenues. Given the uncertainties, a random walk around a conservative mean is estimated for the forecast period. Library and recreational facility rentals are estimated to show very modest growth.
GENERAL FUND INTEREST & RENTAL REVENUES: USE OF MONEY & PROPERTY(Including Parks & Recreation)
52.2%54.3%
-13.2%-46.2%
-24.7%-41.2%
21.6%
-61.6%
207.8%
-17.7% -29.3%
4.1%
-100%
-50%
0%
50%
100%
150%
200%
250%
2006 2007 2008 2009 2010 2011 2012 2013 2014 Budget2015
2015 (est.) 2016 (est.)
Fiscal Year
INTEREST & RENTAL REVENUE-GENERAL FUND ( % Change)
FY 2015-16 Operating Budget C-35 As Amended June 9, 2015
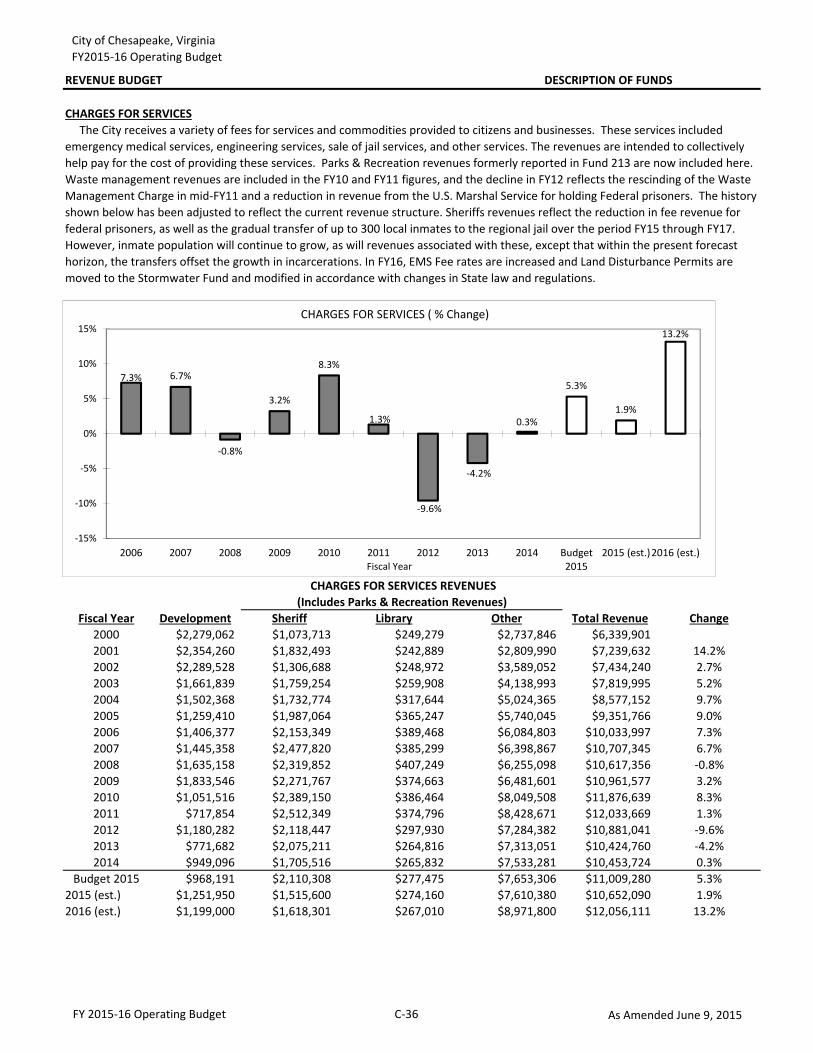
City of Chesapeake, VirginiaFY2015-16 Operating Budget
REVENUE BUDGET DESCRIPTION OF FUNDS
Fiscal Year Development Sheriff Library Other Total Revenue Change2000 $2,279,062 $1,073,713 $249,279 $2,737,846 $6,339,9012001 $2,354,260 $1,832,493 $242,889 $2,809,990 $7,239,632 14.2%2002 $2,289,528 $1,306,688 $248,972 $3,589,052 $7,434,240 2.7%2003 $1,661,839 $1,759,254 $259,908 $4,138,993 $7,819,995 5.2%2004 $1,502,368 $1,732,774 $317,644 $5,024,365 $8,577,152 9.7%2005 $1,259,410 $1,987,064 $365,247 $5,740,045 $9,351,766 9.0%2006 $1,406,377 $2,153,349 $389,468 $6,084,803 $10,033,997 7.3%2007 $1,445,358 $2,477,820 $385,299 $6,398,867 $10,707,345 6.7%2008 $1,635,158 $2,319,852 $407,249 $6,255,098 $10,617,356 -0.8%2009 $1,833,546 $2,271,767 $374,663 $6,481,601 $10,961,577 3.2%2010 $1,051,516 $2,389,150 $386,464 $8,049,508 $11,876,639 8.3%2011 $717,854 $2,512,349 $374,796 $8,428,671 $12,033,669 1.3%2012 $1,180,282 $2,118,447 $297,930 $7,284,382 $10,881,041 -9.6%2013 $771,682 $2,075,211 $264,816 $7,313,051 $10,424,760 -4.2%2014 $949,096 $1,705,516 $265,832 $7,533,281 $10,453,724 0.3%
Budget 2015 $968,191 $2,110,308 $277,475 $7,653,306 $11,009,280 5.3%2015 (est.) $1,251,950 $1,515,600 $274,160 $7,610,380 $10,652,090 1.9%2016 (est.) $1,199,000 $1,618,301 $267,010 $8,971,800 $12,056,111 13.2%2017 (est.) $1,219,900 $1,618,261 $267,100 $9,104,700 $12,209,961 1.3%2018 (est.) $1,241,300 $1,618,261 $267,100 $9,240,100 $12,366,761 1.3%2019 (est.) $1,263,000 $1,618,261 $267,100 $9,378,100 $12,526,461 1.3%2020 (est.) $1,285,300 $1,618,261 $267,100 $9,518,700 $12,689,361 1.3%
CHARGES FOR SERVICES The City receives a variety of fees for services and commodities provided to citizens and businesses. These services included emergency medical services, engineering services, sale of jail services, and other services. The revenues are intended to collectively help pay for the cost of providing these services. Parks & Recreation revenues formerly reported in Fund 213 are now included here. Waste management revenues are included in the FY10 and FY11 figures, and the decline in FY12 reflects the rescinding of the Waste Management Charge in mid-FY11 and a reduction in revenue from the U.S. Marshal Service for holding Federal prisoners. The history shown below has been adjusted to reflect the current revenue structure. Sheriffs revenues reflect the reduction in fee revenue for federal prisoners, as well as the gradual transfer of up to 300 local inmates to the regional jail over the period FY15 through FY17. However, inmate population will continue to grow, as will revenues associated with these, except that within the present forecast horizon, the transfers offset the growth in incarcerations. In FY16, EMS Fee rates are increased and Land Disturbance Permits are moved to the Stormwater Fund and modified in accordance with changes in State law and regulations.
CHARGES FOR SERVICES REVENUES(Includes Parks & Recreation Revenues)
7.3% 6.7%
-0.8%
3.2%
8.3%
1.3%
-9.6%
-4.2%
0.3%
5.3%
1.9%
13.2%
-15%
-10%
-5%
0%
5%
10%
15%
2006 2007 2008 2009 2010 2011 2012 2013 2014 Budget2015
2015 (est.)2016 (est.)Fiscal Year
CHARGES FOR SERVICES ( % Change)
FY 2015-16 Operating Budget C-36 As Amended June 9, 2015
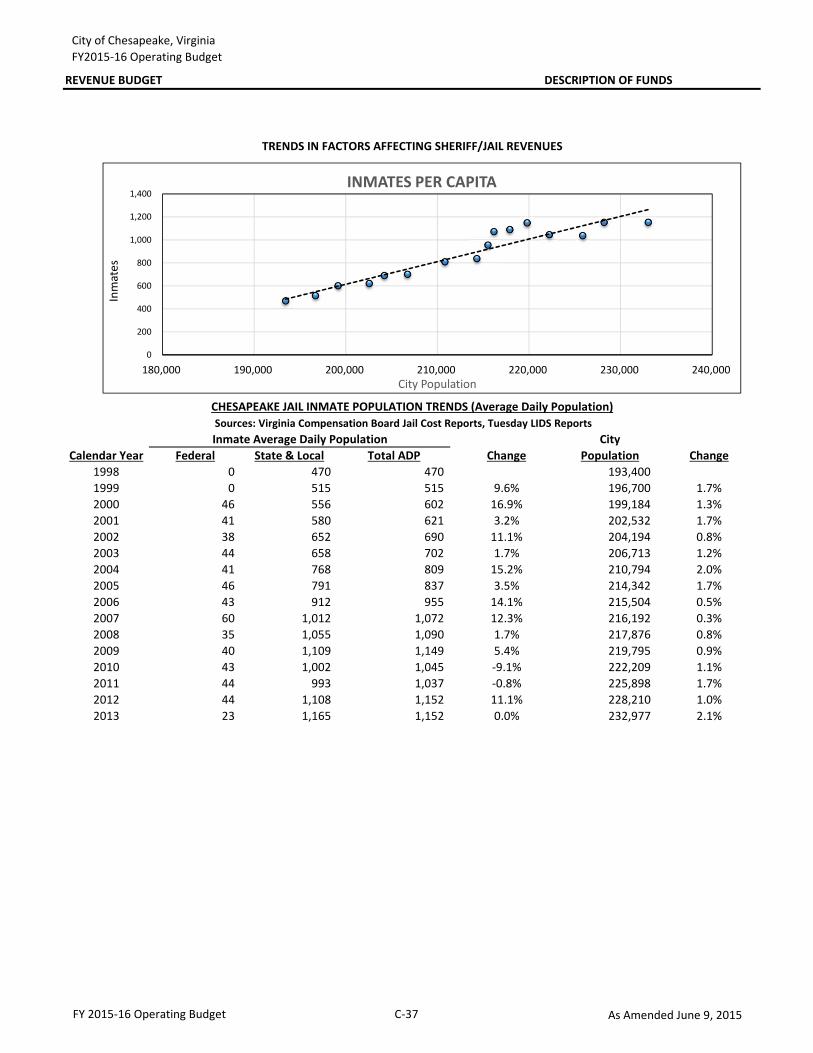
City of Chesapeake, VirginiaFY2015-16 Operating Budget
REVENUE BUDGET DESCRIPTION OF FUNDS
CityCalendar Year Federal State & Local Total ADP Change Population Change
1998 0 470 470 193,4001999 0 515 515 9.6% 196,700 1.7%2000 46 556 602 16.9% 199,184 1.3%2001 41 580 621 3.2% 202,532 1.7%2002 38 652 690 11.1% 204,194 0.8%2003 44 658 702 1.7% 206,713 1.2%2004 41 768 809 15.2% 210,794 2.0%2005 46 791 837 3.5% 214,342 1.7%2006 43 912 955 14.1% 215,504 0.5%2007 60 1,012 1,072 12.3% 216,192 0.3%2008 35 1,055 1,090 1.7% 217,876 0.8%2009 40 1,109 1,149 5.4% 219,795 0.9%2010 43 1,002 1,045 -9.1% 222,209 1.1%2011 44 993 1,037 -0.8% 225,898 1.7%2012 44 1,108 1,152 11.1% 228,210 1.0%2013 23 1,165 1,152 0.0% 232,977 2.1%
TRENDS IN FACTORS AFFECTING SHERIFF/JAIL REVENUES
CHESAPEAKE JAIL INMATE POPULATION TRENDS (Average Daily Population)Sources: Virginia Compensation Board Jail Cost Reports, Tuesday LIDS ReportsInmate Average Daily Population
0
200
400
600
800
1,000
1,200
1,400
180,000 190,000 200,000 210,000 220,000 230,000 240,000
Inm
ates
City Population
INMATES PER CAPITA
FY 2015-16 Operating Budget C-37 As Amended June 9, 2015
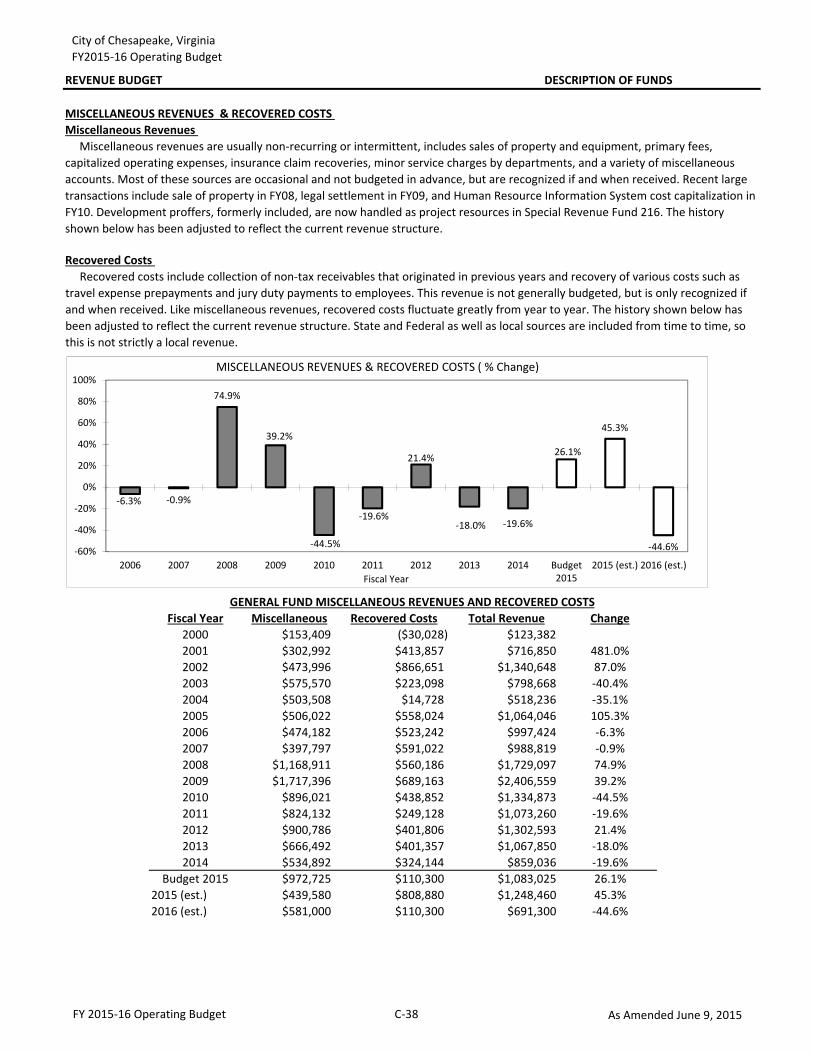
City of Chesapeake, VirginiaFY2015-16 Operating Budget
REVENUE BUDGET DESCRIPTION OF FUNDS
Miscellaneous Revenues
Recovered Costs
Fiscal Year Miscellaneous Recovered Costs Total Revenue Change2000 $153,409 ($30,028) $123,3822001 $302,992 $413,857 $716,850 481.0%2002 $473,996 $866,651 $1,340,648 87.0%2003 $575,570 $223,098 $798,668 -40.4%2004 $503,508 $14,728 $518,236 -35.1%2005 $506,022 $558,024 $1,064,046 105.3%2006 $474,182 $523,242 $997,424 -6.3%2007 $397,797 $591,022 $988,819 -0.9%2008 $1,168,911 $560,186 $1,729,097 74.9%2009 $1,717,396 $689,163 $2,406,559 39.2%2010 $896,021 $438,852 $1,334,873 -44.5%2011 $824,132 $249,128 $1,073,260 -19.6%2012 $900,786 $401,806 $1,302,593 21.4%2013 $666,492 $401,357 $1,067,850 -18.0%2014 $534,892 $324,144 $859,036 -19.6%
Budget 2015 $972,725 $110,300 $1,083,025 26.1%2015 (est.) $439,580 $808,880 $1,248,460 45.3%2016 (est.) $581,000 $110,300 $691,300 -44.6%2017 (est.) $581,000 $110,300 $691,300 0.0%2018 (est.) $581,000 $110,300 $691,300 0.0%2019 (est.) $581,000 $110,300 $691,300 0.0%2020 (est.) $581,000 $110,300 $691,300 0.0%
Recovered costs include collection of non-tax receivables that originated in previous years and recovery of various costs such as travel expense prepayments and jury duty payments to employees. This revenue is not generally budgeted, but is only recognized if and when received. Like miscellaneous revenues, recovered costs fluctuate greatly from year to year. The history shown below has been adjusted to reflect the current revenue structure. State and Federal as well as local sources are included from time to time, so this is not strictly a local revenue.
GENERAL FUND MISCELLANEOUS REVENUES AND RECOVERED COSTS
Miscellaneous revenues are usually non-recurring or intermittent, includes sales of property and equipment, primary fees, capitalized operating expenses, insurance claim recoveries, minor service charges by departments, and a variety of miscellaneous accounts. Most of these sources are occasional and not budgeted in advance, but are recognized if and when received. Recent large transactions include sale of property in FY08, legal settlement in FY09, and Human Resource Information System cost capitalization in FY10. Development proffers, formerly included, are now handled as project resources in Special Revenue Fund 216. The history shown below has been adjusted to reflect the current revenue structure.
MISCELLANEOUS REVENUES & RECOVERED COSTS
-6.3% -0.9%
74.9%
39.2%
-44.5%
-19.6%
21.4%
-18.0% -19.6%
26.1%
45.3%
-44.6%-60%
-40%
-20%
0%
20%
40%
60%
80%
100%
2006 2007 2008 2009 2010 2011 2012 2013 2014 Budget2015
2015 (est.) 2016 (est.)Fiscal Year
MISCELLANEOUS REVENUES & RECOVERED COSTS ( % Change)
FY 2015-16 Operating Budget C-38 As Amended June 9, 2015
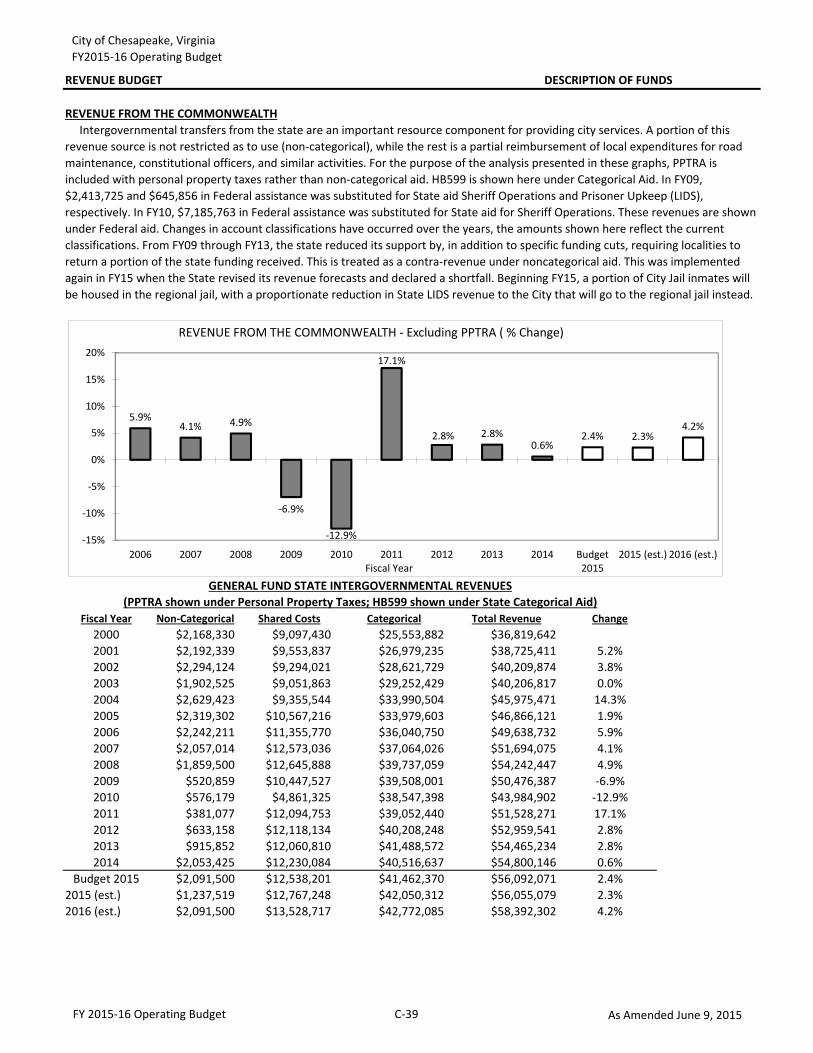
City of Chesapeake, VirginiaFY2015-16 Operating Budget
REVENUE BUDGET DESCRIPTION OF FUNDS
Fiscal Year Non-Categorical Shared Costs Categorical Total Revenue Change2000 $2,168,330 $9,097,430 $25,553,882 $36,819,6422001 $2,192,339 $9,553,837 $26,979,235 $38,725,411 5.2%2002 $2,294,124 $9,294,021 $28,621,729 $40,209,874 3.8%2003 $1,902,525 $9,051,863 $29,252,429 $40,206,817 0.0%2004 $2,629,423 $9,355,544 $33,990,504 $45,975,471 14.3%2005 $2,319,302 $10,567,216 $33,979,603 $46,866,121 1.9%2006 $2,242,211 $11,355,770 $36,040,750 $49,638,732 5.9%2007 $2,057,014 $12,573,036 $37,064,026 $51,694,075 4.1%2008 $1,859,500 $12,645,888 $39,737,059 $54,242,447 4.9%2009 $520,859 $10,447,527 $39,508,001 $50,476,387 -6.9%2010 $576,179 $4,861,325 $38,547,398 $43,984,902 -12.9%2011 $381,077 $12,094,753 $39,052,440 $51,528,271 17.1%2012 $633,158 $12,118,134 $40,208,248 $52,959,541 2.8%2013 $915,852 $12,060,810 $41,488,572 $54,465,234 2.8%2014 $2,053,425 $12,230,084 $40,516,637 $54,800,146 0.6%
Budget 2015 $2,091,500 $12,538,201 $41,462,370 $56,092,071 2.4%2015 (est.) $1,237,519 $12,767,248 $42,050,312 $56,055,079 2.3%2016 (est.) $2,091,500 $13,528,717 $42,772,085 $58,392,302 4.2%2017 (est.) $2,091,500 $13,528,600 $42,772,080 $15,620,100 -73.2%2018 (est.) $2,091,500 $13,528,600 $42,772,080 $15,620,100 0.0%2019 (est.) $2,091,500 $13,528,600 $42,772,080 $15,620,100 0.0%2020 (est.) $2,091,500 $13,528,600 $42,772,080 $15,620,100 0.0%
REVENUE FROM THE COMMONWEALTH Intergovernmental transfers from the state are an important resource component for providing city services. A portion of this revenue source is not restricted as to use (non-categorical), while the rest is a partial reimbursement of local expenditures for road maintenance, constitutional officers, and similar activities. For the purpose of the analysis presented in these graphs, PPTRA is included with personal property taxes rather than non-categorical aid. HB599 is shown here under Categorical Aid. In FY09, $2,413,725 and $645,856 in Federal assistance was substituted for State aid Sheriff Operations and Prisoner Upkeep (LIDS), respectively. In FY10, $7,185,763 in Federal assistance was substituted for State aid for Sheriff Operations. These revenues are shown under Federal aid. Changes in account classifications have occurred over the years, the amounts shown here reflect the current classifications. From FY09 through FY13, the state reduced its support by, in addition to specific funding cuts, requiring localities to return a portion of the state funding received. This is treated as a contra-revenue under noncategorical aid. This was implemented again in FY15 when the State revised its revenue forecasts and declared a shortfall. Beginning FY15, a portion of City Jail inmates will be housed in the regional jail, with a proportionate reduction in State LIDS revenue to the City that will go to the regional jail instead.
GENERAL FUND STATE INTERGOVERNMENTAL REVENUES(PPTRA shown under Personal Property Taxes; HB599 shown under State Categorical Aid)
5.9%4.1% 4.9%
-6.9%
-12.9%
17.1%
2.8% 2.8%0.6%
2.4% 2.3%4.2%
-15%
-10%
-5%
0%
5%
10%
15%
20%
2006 2007 2008 2009 2010 2011 2012 2013 2014 Budget2015
2015 (est.) 2016 (est.)Fiscal Year
REVENUE FROM THE COMMONWEALTH - Excluding PPTRA ( % Change)
FY 2015-16 Operating Budget C-39 As Amended June 9, 2015
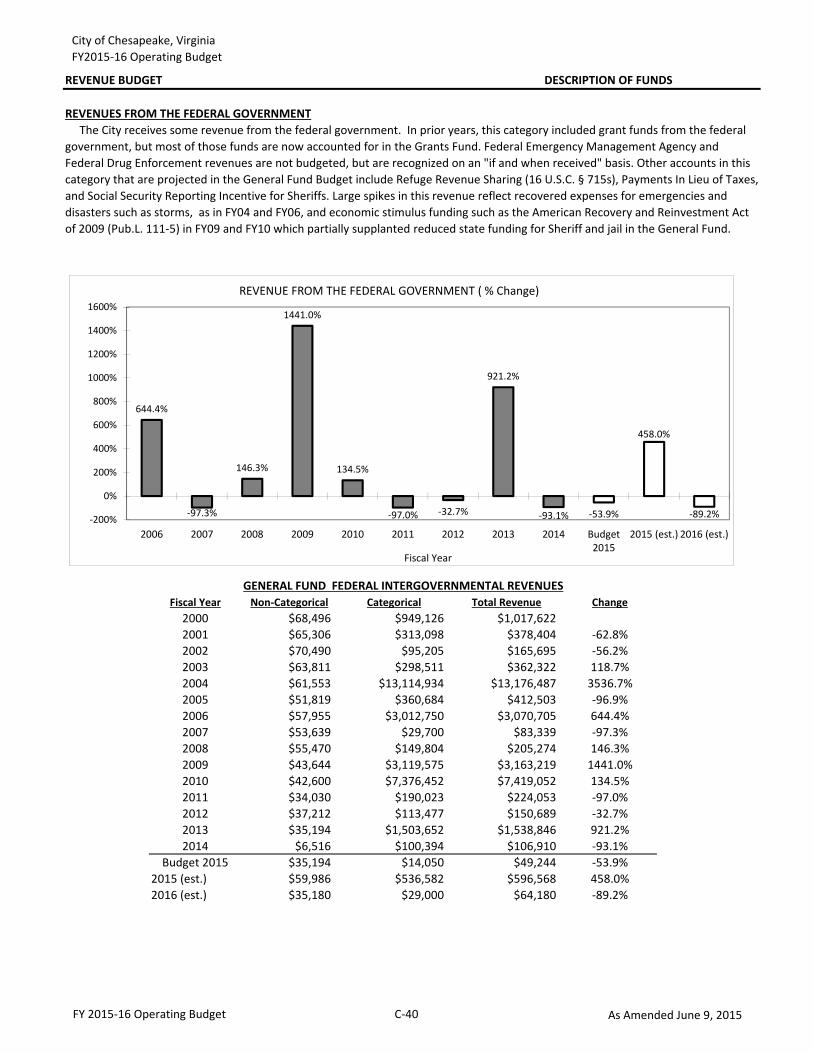
City of Chesapeake, VirginiaFY2015-16 Operating Budget
REVENUE BUDGET DESCRIPTION OF FUNDS
Fiscal Year Non-Categorical Categorical Total Revenue Change2000 $68,496 $949,126 $1,017,6222001 $65,306 $313,098 $378,404 -62.8%2002 $70,490 $95,205 $165,695 -56.2%2003 $63,811 $298,511 $362,322 118.7%2004 $61,553 $13,114,934 $13,176,487 3536.7%2005 $51,819 $360,684 $412,503 -96.9%2006 $57,955 $3,012,750 $3,070,705 644.4%2007 $53,639 $29,700 $83,339 -97.3%2008 $55,470 $149,804 $205,274 146.3%2009 $43,644 $3,119,575 $3,163,219 1441.0%2010 $42,600 $7,376,452 $7,419,052 134.5%2011 $34,030 $190,023 $224,053 -97.0%2012 $37,212 $113,477 $150,689 -32.7%2013 $35,194 $1,503,652 $1,538,846 921.2%2014 $6,516 $100,394 $106,910 -93.1%
Budget 2015 $35,194 $14,050 $49,244 -53.9%2015 (est.) $59,986 $536,582 $596,568 458.0%2016 (est.) $35,180 $29,000 $64,180 -89.2%2017 (est.) $35,200 $29,000 $64,200 0.0%2018 (est.) $35,200 $29,000 $64,200 0.0%2019 (est.) $35,200 $29,000 $64,200 0.0%2020 (est.) $35,200 $29,000 $64,200 0.0%
GENERAL FUND FEDERAL INTERGOVERNMENTAL REVENUES
REVENUES FROM THE FEDERAL GOVERNMENT The City receives some revenue from the federal government. In prior years, this category included grant funds from the federal government, but most of those funds are now accounted for in the Grants Fund. Federal Emergency Management Agency and Federal Drug Enforcement revenues are not budgeted, but are recognized on an "if and when received" basis. Other accounts in this category that are projected in the General Fund Budget include Refuge Revenue Sharing (16 U.S.C. § 715s), Payments In Lieu of Taxes, and Social Security Reporting Incentive for Sheriffs. Large spikes in this revenue reflect recovered expenses for emergencies and disasters such as storms, as in FY04 and FY06, and economic stimulus funding such as the American Recovery and Reinvestment Act of 2009 (Pub.L. 111-5) in FY09 and FY10 which partially supplanted reduced state funding for Sheriff and jail in the General Fund.
644.4%
-97.3%
146.3%
1441.0%
134.5%
-97.0% -32.7%
921.2%
-93.1% -53.9%
458.0%
-89.2%-200%
0%
200%
400%
600%
800%
1000%
1200%
1400%
1600%
2006 2007 2008 2009 2010 2011 2012 2013 2014 Budget2015
2015 (est.) 2016 (est.)
Fiscal Year
REVENUE FROM THE FEDERAL GOVERNMENT ( % Change)
FY 2015-16 Operating Budget C-40 As Amended June 9, 2015
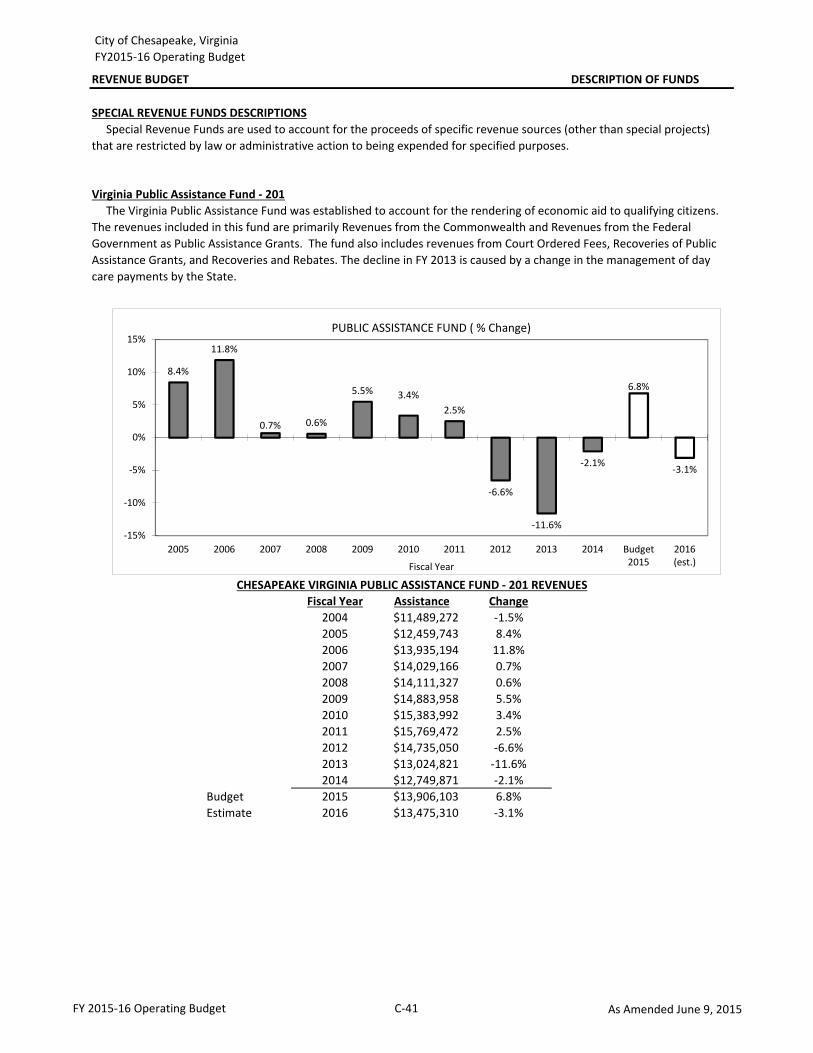
City of Chesapeake, Virginia FY2015-16 Operating Budget
SPECIAL REVENUE FUNDS DESCRIPTIONS
201
Fiscal Year Assistance Change2004 $11,489,272 -1.5%2005 $12,459,743 8.4%2006 $13,935,194 11.8%2007 $14,029,166 0.7%2008 $14,111,327 0.6%2009 $14,883,958 5.5%2010 $15,383,992 3.4%2011 $15,769,472 2.5%2012 $14,735,050 -6.6%2013 $13,024,821 -11.6%2014 $12,749,871 -2.1%
Budget 2015 $13,906,103 6.8%Estimate 2016 $13,475,310 -3.1%
CHESAPEAKE VIRGINIA PUBLIC ASSISTANCE FUND - 201 REVENUES
REVENUE BUDGET DESCRIPTION OF FUNDS
Special Revenue Funds are used to account for the proceeds of specific revenue sources (other than special projects) that are restricted by law or administrative action to being expended for specified purposes.
Virginia Public Assistance Fund - 201 The Virginia Public Assistance Fund was established to account for the rendering of economic aid to qualifying citizens. The revenues included in this fund are primarily Revenues from the Commonwealth and Revenues from the Federal Government as Public Assistance Grants. The fund also includes revenues from Court Ordered Fees, Recoveries of Public Assistance Grants, and Recoveries and Rebates. The decline in FY 2013 is caused by a change in the management of day care payments by the State.
8.4%
11.8%
0.7% 0.6%
5.5% 3.4%2.5%
-6.6%
-11.6%
-2.1%
6.8%
-3.1%
-15%
-10%
-5%
0%
5%
10%
15%
2005 2006 2007 2008 2009 2010 2011 2012 2013 2014 Budget2015
2016(est.)Fiscal Year
PUBLIC ASSISTANCE FUND ( % Change)
FY 2015-16 Operating Budget C-41 As Amended June 9, 2015
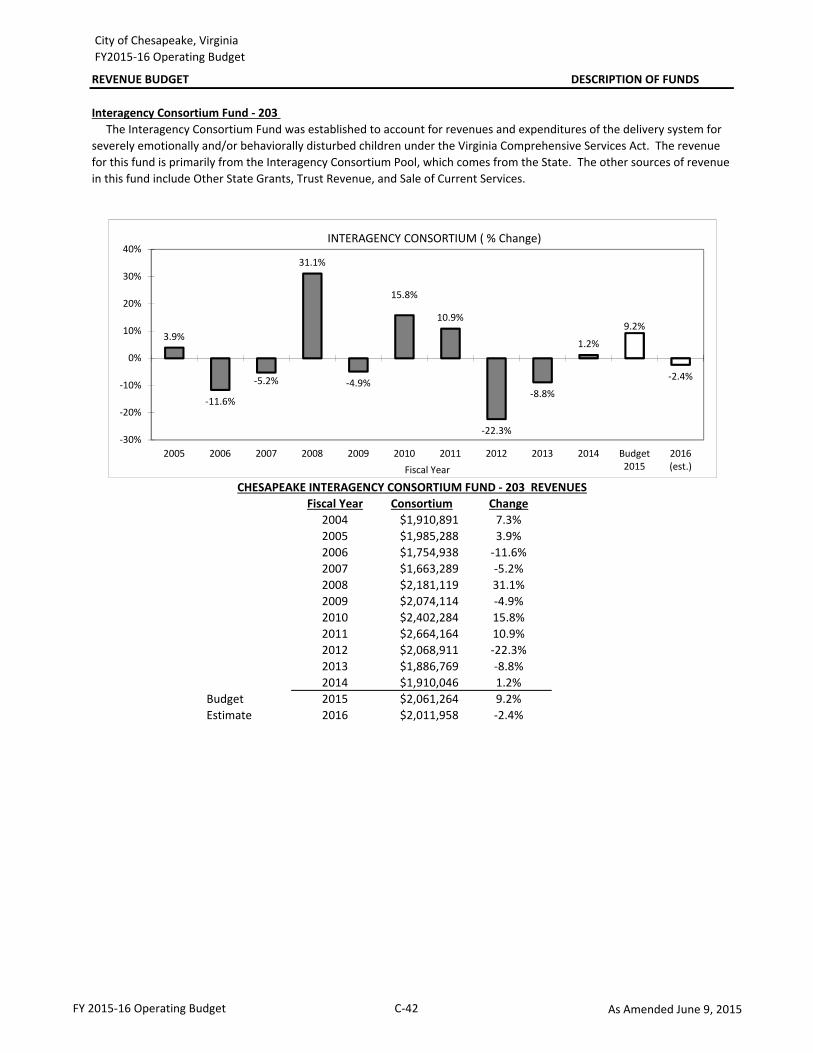
City of Chesapeake, Virginia FY2015-16 Operating Budget
REVENUE BUDGET DESCRIPTION OF FUNDS
203
Fiscal Year Consortium Change2004 $1,910,891 7.3%2005 $1,985,288 3.9%2006 $1,754,938 -11.6%2007 $1,663,289 -5.2%2008 $2,181,119 31.1%2009 $2,074,114 -4.9%2010 $2,402,284 15.8%2011 $2,664,164 10.9%2012 $2,068,911 -22.3%2013 $1,886,769 -8.8%2014 $1,910,046 1.2%
Budget 2015 $2,061,264 9.2%Estimate 2016 $2,011,958 -2.4%
Interagency Consortium Fund - 203 The Interagency Consortium Fund was established to account for revenues and expenditures of the delivery system for severely emotionally and/or behaviorally disturbed children under the Virginia Comprehensive Services Act. The revenue for this fund is primarily from the Interagency Consortium Pool, which comes from the State. The other sources of revenue in this fund include Other State Grants, Trust Revenue, and Sale of Current Services.
CHESAPEAKE INTERAGENCY CONSORTIUM FUND - 203 REVENUES
3.9%
-11.6%
-5.2%
31.1%
-4.9%
15.8%
10.9%
-22.3%
-8.8%
1.2%
9.2%
-2.4%
-30%
-20%
-10%
0%
10%
20%
30%
40%
2005 2006 2007 2008 2009 2010 2011 2012 2013 2014 Budget2015
2016(est.)Fiscal Year
INTERAGENCY CONSORTIUM ( % Change)
FY 2015-16 Operating Budget C-42 As Amended June 9, 2015
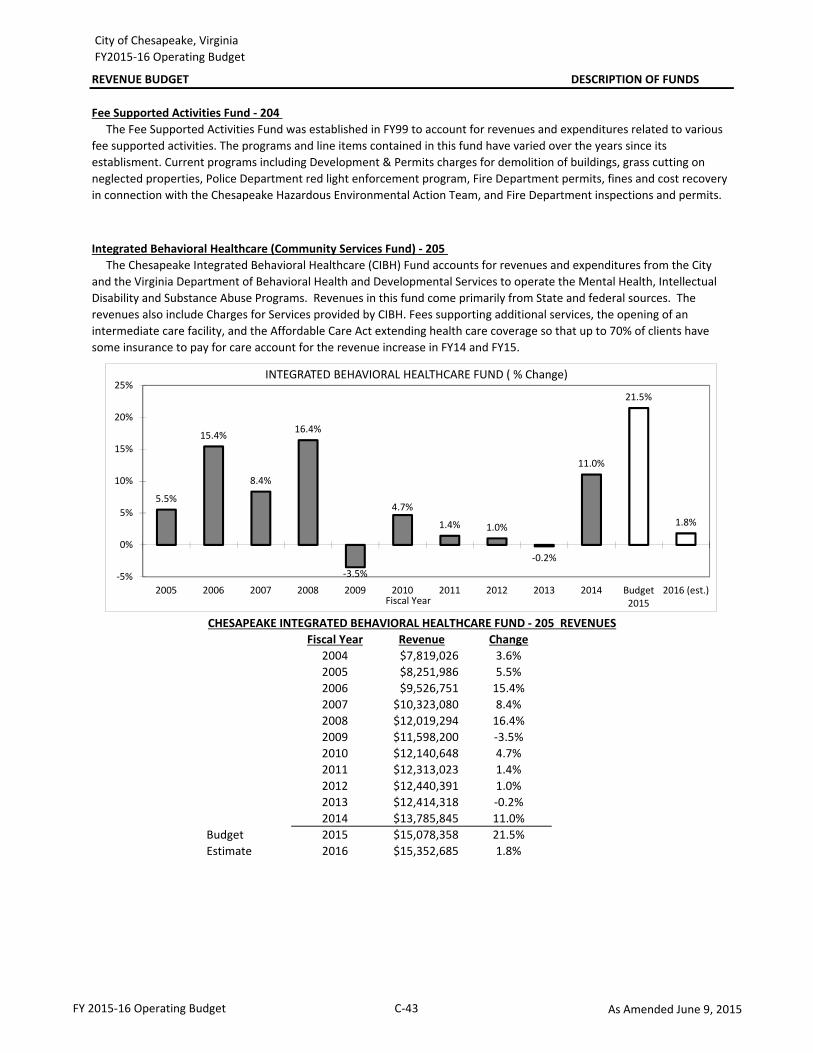
City of Chesapeake, Virginia FY2015-16 Operating Budget
REVENUE BUDGET DESCRIPTION OF FUNDS
205
Fiscal Year Revenue Change2004 $7,819,026 3.6%2005 $8,251,986 5.5%2006 $9,526,751 15.4%2007 $10,323,080 8.4%2008 $12,019,294 16.4%2009 $11,598,200 -3.5%2010 $12,140,648 4.7%2011 $12,313,023 1.4%2012 $12,440,391 1.0%2013 $12,414,318 -0.2%2014 $13,785,845 11.0%
Budget 2015 $15,078,358 21.5%Estimate 2016 $15,352,685 1.8%
Fee Supported Activities Fund - 204 The Fee Supported Activities Fund was established in FY99 to account for revenues and expenditures related to various fee supported activities. The programs and line items contained in this fund have varied over the years since its establisment. Current programs including Development & Permits charges for demolition of buildings, grass cutting on neglected properties, Police Department red light enforcement program, Fire Department permits, fines and cost recovery in connection with the Chesapeake Hazardous Environmental Action Team, and Fire Department inspections and permits.
Integrated Behavioral Healthcare (Community Services Fund) - 205 The Chesapeake Integrated Behavioral Healthcare (CIBH) Fund accounts for revenues and expenditures from the City and the Virginia Department of Behavioral Health and Developmental Services to operate the Mental Health, Intellectual Disability and Substance Abuse Programs. Revenues in this fund come primarily from State and federal sources. The revenues also include Charges for Services provided by CIBH. Fees supporting additional services, the opening of an intermediate care facility, and the Affordable Care Act extending health care coverage so that up to 70% of clients have some insurance to pay for care account for the revenue increase in FY14 and FY15.
CHESAPEAKE INTEGRATED BEHAVIORAL HEALTHCARE FUND - 205 REVENUES
5.5%
15.4%
8.4%
16.4%
-3.5%
4.7%
1.4% 1.0%
-0.2%
11.0%
21.5%
1.8%
-5%
0%
5%
10%
15%
20%
25%
2005 2006 2007 2008 2009 2010 2011 2012 2013 2014 Budget2015
2016 (est.)Fiscal Year
INTEGRATED BEHAVIORAL HEALTHCARE FUND ( % Change)
FY 2015-16 Operating Budget C-43 As Amended June 9, 2015
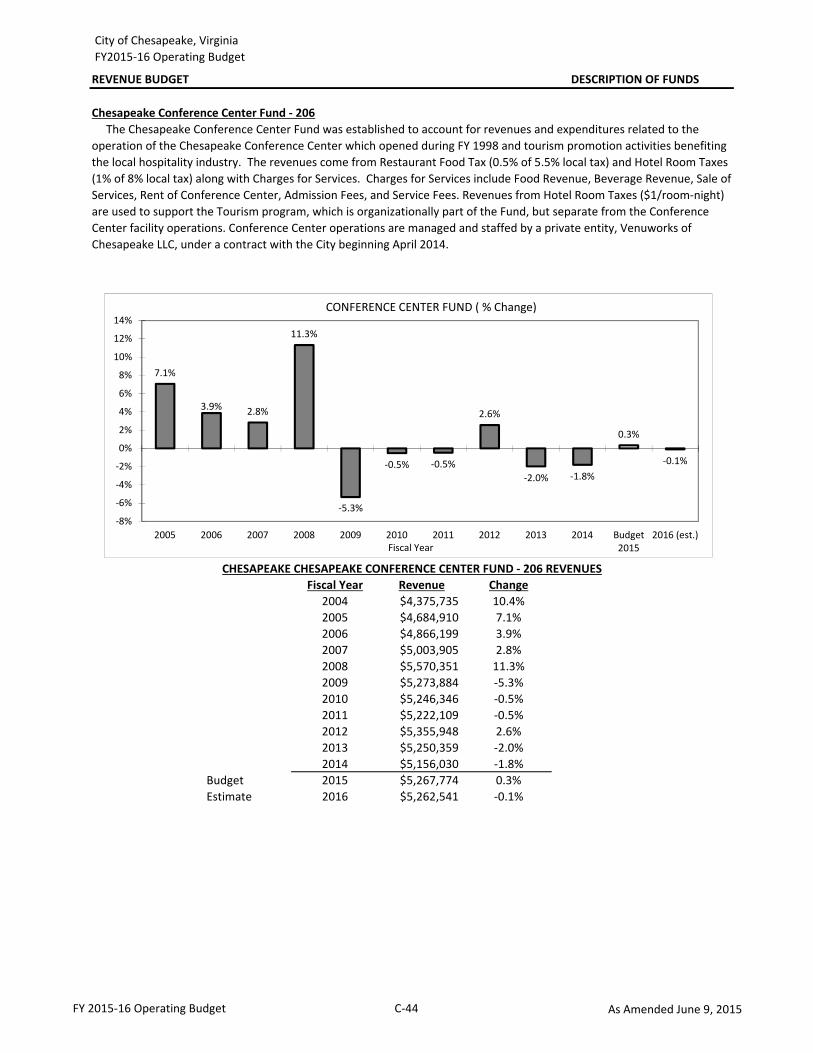
City of Chesapeake, Virginia FY2015-16 Operating Budget
REVENUE BUDGET DESCRIPTION OF FUNDS
206
Fiscal Year Revenue Change2004 $4,375,735 10.4%2005 $4,684,910 7.1%2006 $4,866,199 3.9%2007 $5,003,905 2.8%2008 $5,570,351 11.3%2009 $5,273,884 -5.3%2010 $5,246,346 -0.5%2011 $5,222,109 -0.5%2012 $5,355,948 2.6%2013 $5,250,359 -2.0%2014 $5,156,030 -1.8%
Budget 2015 $5,267,774 0.3%Estimate 2016 $5,262,541 -0.1%
Chesapeake Conference Center Fund - 206 The Chesapeake Conference Center Fund was established to account for revenues and expenditures related to the operation of the Chesapeake Conference Center which opened during FY 1998 and tourism promotion activities benefiting the local hospitality industry. The revenues come from Restaurant Food Tax (0.5% of 5.5% local tax) and Hotel Room Taxes (1% of 8% local tax) along with Charges for Services. Charges for Services include Food Revenue, Beverage Revenue, Sale of Services, Rent of Conference Center, Admission Fees, and Service Fees. Revenues from Hotel Room Taxes ($1/room-night) are used to support the Tourism program, which is organizationally part of the Fund, but separate from the Conference Center facility operations. Conference Center operations are managed and staffed by a private entity, Venuworks of Chesapeake LLC, under a contract with the City beginning April 2014.
CHESAPEAKE CHESAPEAKE CONFERENCE CENTER FUND - 206 REVENUES
7.1%
3.9% 2.8%
11.3%
-5.3%
-0.5% -0.5%
2.6%
-2.0% -1.8%
0.3%
-0.1%
-8%
-6%
-4%
-2%
0%
2%
4%
6%
8%
10%
12%
14%
2005 2006 2007 2008 2009 2010 2011 2012 2013 2014 Budget2015
2016 (est.)Fiscal Year
CONFERENCE CENTER FUND ( % Change)
FY 2015-16 Operating Budget C-44 As Amended June 9, 2015
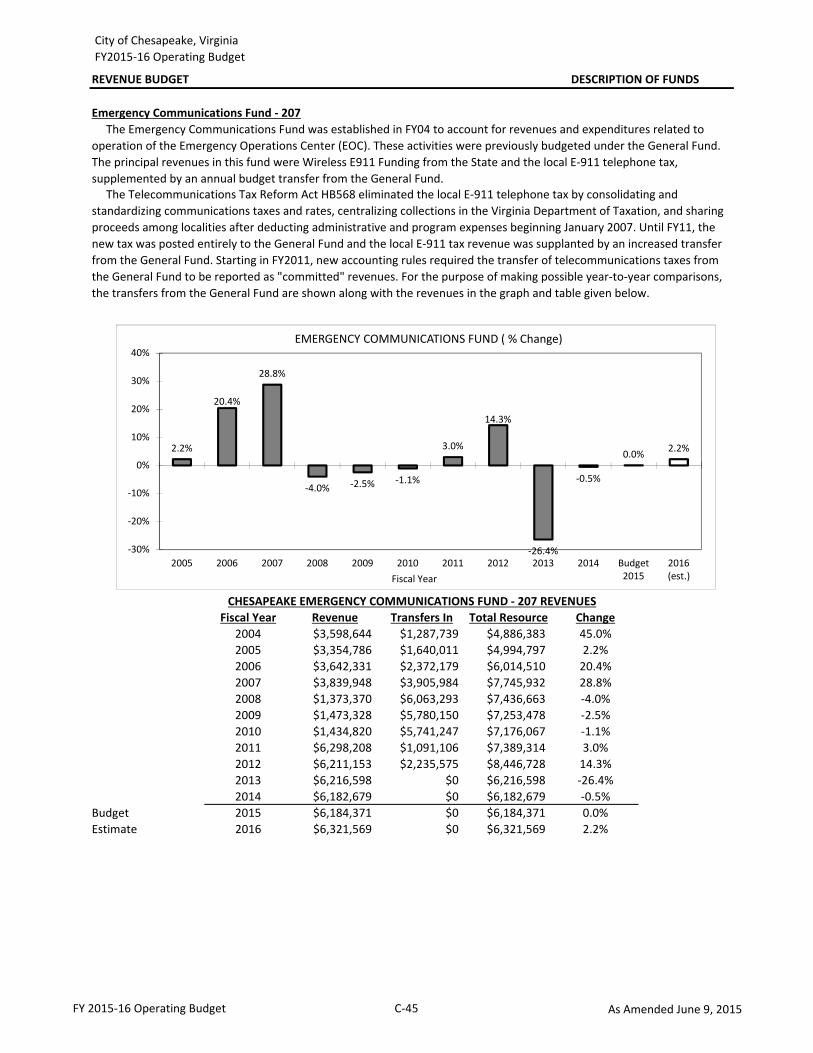
City of Chesapeake, Virginia FY2015-16 Operating Budget
REVENUE BUDGET DESCRIPTION OF FUNDS
207
Fiscal Year Revenue Transfers In Total Resource Change2004 $3,598,644 $1,287,739 $4,886,383 45.0%2005 $3,354,786 $1,640,011 $4,994,797 2.2%2006 $3,642,331 $2,372,179 $6,014,510 20.4%2007 $3,839,948 $3,905,984 $7,745,932 28.8%2008 $1,373,370 $6,063,293 $7,436,663 -4.0%2009 $1,473,328 $5,780,150 $7,253,478 -2.5%2010 $1,434,820 $5,741,247 $7,176,067 -1.1%2011 $6,298,208 $1,091,106 $7,389,314 3.0%2012 $6,211,153 $2,235,575 $8,446,728 14.3%2013 $6,216,598 $0 $6,216,598 -26.4%2014 $6,182,679 $0 $6,182,679 -0.5%
Budget 2015 $6,184,371 $0 $6,184,371 0.0%Estimate 2016 $6,321,569 $0 $6,321,569 2.2%
Emergency Communications Fund - 207 The Emergency Communications Fund was established in FY04 to account for revenues and expenditures related to operation of the Emergency Operations Center (EOC). These activities were previously budgeted under the General Fund. The principal revenues in this fund were Wireless E911 Funding from the State and the local E-911 telephone tax, supplemented by an annual budget transfer from the General Fund. The Telecommunications Tax Reform Act HB568 eliminated the local E-911 telephone tax by consolidating and standardizing communications taxes and rates, centralizing collections in the Virginia Department of Taxation, and sharing proceeds among localities after deducting administrative and program expenses beginning January 2007. Until FY11, the new tax was posted entirely to the General Fund and the local E-911 tax revenue was supplanted by an increased transfer from the General Fund. Starting in FY2011, new accounting rules required the transfer of telecommunications taxes from the General Fund to be reported as "committed" revenues. For the purpose of making possible year-to-year comparisons, the transfers from the General Fund are shown along with the revenues in the graph and table given below.
CHESAPEAKE EMERGENCY COMMUNICATIONS FUND - 207 REVENUES
2.2%
20.4%
28.8%
-4.0% -2.5% -1.1%
3.0%
14.3%
-26.4%
-0.5%
0.0% 2.2%
-30%
-20%
-10%
0%
10%
20%
30%
40%
2005 2006 2007 2008 2009 2010 2011 2012 2013 2014 Budget2015
2016(est.)Fiscal Year
EMERGENCY COMMUNICATIONS FUND ( % Change)
FY 2015-16 Operating Budget C-45 As Amended June 9, 2015
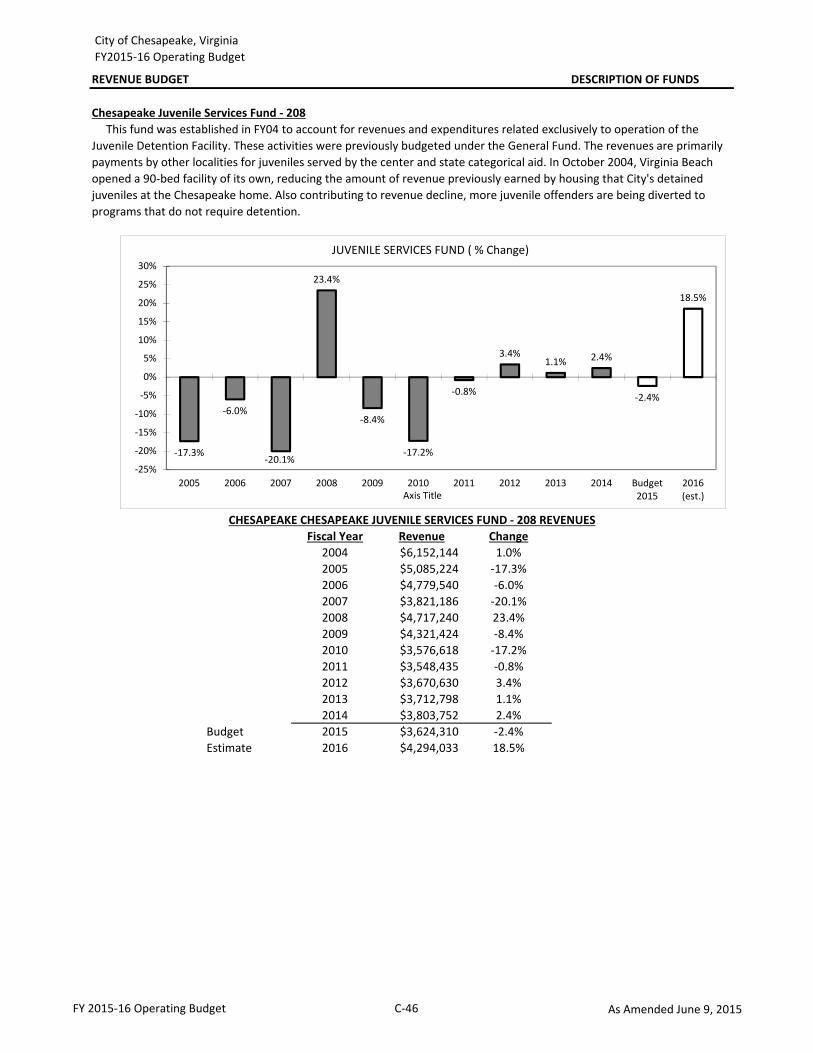
City of Chesapeake, Virginia FY2015-16 Operating Budget
REVENUE BUDGET DESCRIPTION OF FUNDS
208
Fiscal Year Revenue Change2004 $6,152,144 1.0%2005 $5,085,224 -17.3%2006 $4,779,540 -6.0%2007 $3,821,186 -20.1%2008 $4,717,240 23.4%2009 $4,321,424 -8.4%2010 $3,576,618 -17.2%2011 $3,548,435 -0.8%2012 $3,670,630 3.4%2013 $3,712,798 1.1%2014 $3,803,752 2.4%
Budget 2015 $3,624,310 -2.4%Estimate 2016 $4,294,033 18.5%
Chesapeake Juvenile Services Fund - 208 This fund was established in FY04 to account for revenues and expenditures related exclusively to operation of the Juvenile Detention Facility. These activities were previously budgeted under the General Fund. The revenues are primarily payments by other localities for juveniles served by the center and state categorical aid. In October 2004, Virginia Beach opened a 90-bed facility of its own, reducing the amount of revenue previously earned by housing that City's detained juveniles at the Chesapeake home. Also contributing to revenue decline, more juvenile offenders are being diverted to programs that do not require detention.
CHESAPEAKE CHESAPEAKE JUVENILE SERVICES FUND - 208 REVENUES
-17.3%
-6.0%
-20.1%
23.4%
-8.4%
-17.2%
-0.8%
3.4%1.1% 2.4%
-2.4%
18.5%
-25%
-20%
-15%
-10%
-5%
0%
5%
10%
15%
20%
25%
30%
2005 2006 2007 2008 2009 2010 2011 2012 2013 2014 Budget2015
2016(est.)Axis Title
JUVENILE SERVICES FUND ( % Change)
FY 2015-16 Operating Budget C-46 As Amended June 9, 2015
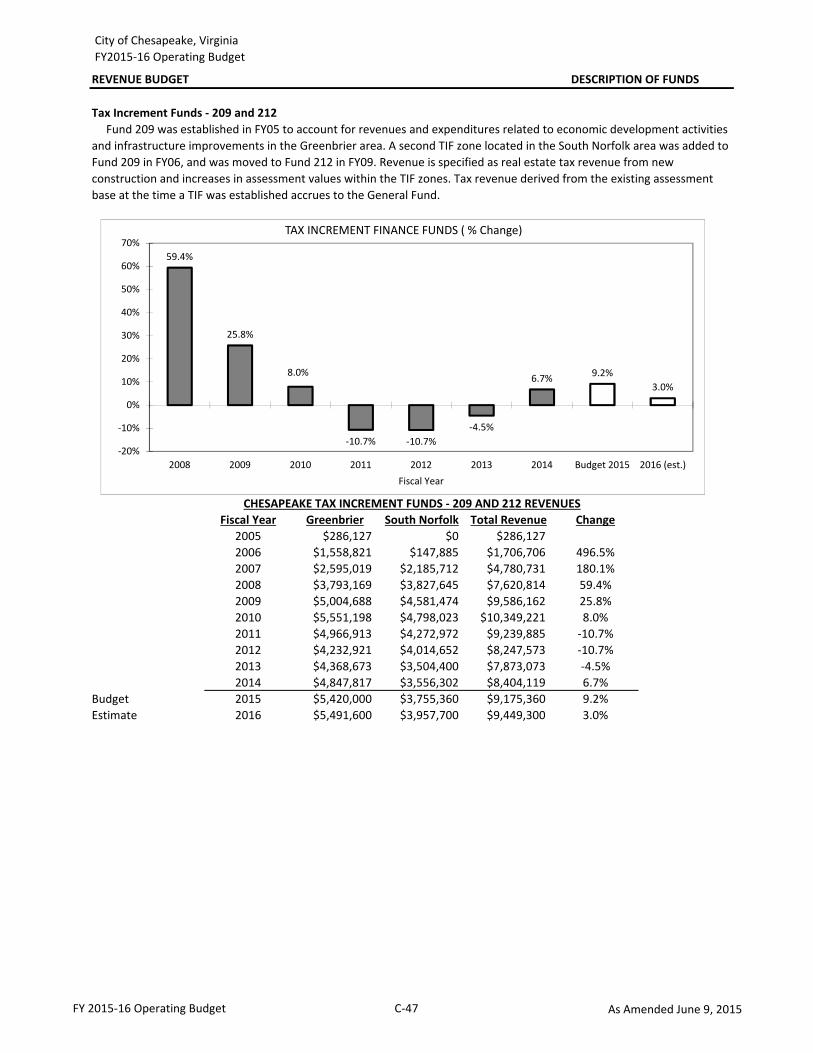
City of Chesapeake, Virginia FY2015-16 Operating Budget
REVENUE BUDGET DESCRIPTION OF FUNDS
209 212
Fiscal Year Greenbrier South Norfolk Total Revenue Change2005 $286,127 $0 $286,1272006 $1,558,821 $147,885 $1,706,706 496.5%2007 $2,595,019 $2,185,712 $4,780,731 180.1%2008 $3,793,169 $3,827,645 $7,620,814 59.4%2009 $5,004,688 $4,581,474 $9,586,162 25.8%2010 $5,551,198 $4,798,023 $10,349,221 8.0%2011 $4,966,913 $4,272,972 $9,239,885 -10.7%2012 $4,232,921 $4,014,652 $8,247,573 -10.7%2013 $4,368,673 $3,504,400 $7,873,073 -4.5%2014 $4,847,817 $3,556,302 $8,404,119 6.7%
Budget 2015 $5,420,000 $3,755,360 $9,175,360 9.2%Estimate 2016 $5,491,600 $3,957,700 $9,449,300 3.0%
CHESAPEAKE TAX INCREMENT FUNDS - 209 AND 212 REVENUES
Tax Increment Funds - 209 and 212 Fund 209 was established in FY05 to account for revenues and expenditures related to economic development activities and infrastructure improvements in the Greenbrier area. A second TIF zone located in the South Norfolk area was added to Fund 209 in FY06, and was moved to Fund 212 in FY09. Revenue is specified as real estate tax revenue from new construction and increases in assessment values within the TIF zones. Tax revenue derived from the existing assessment base at the time a TIF was established accrues to the General Fund.
59.4%
25.8%
8.0%
-10.7% -10.7%-4.5%
6.7% 9.2%3.0%
-20%
-10%
0%
10%
20%
30%
40%
50%
60%
70%
2008 2009 2010 2011 2012 2013 2014 Budget 2015 2016 (est.)Fiscal Year
TAX INCREMENT FINANCE FUNDS ( % Change)
FY 2015-16 Operating Budget C-47 As Amended June 9, 2015
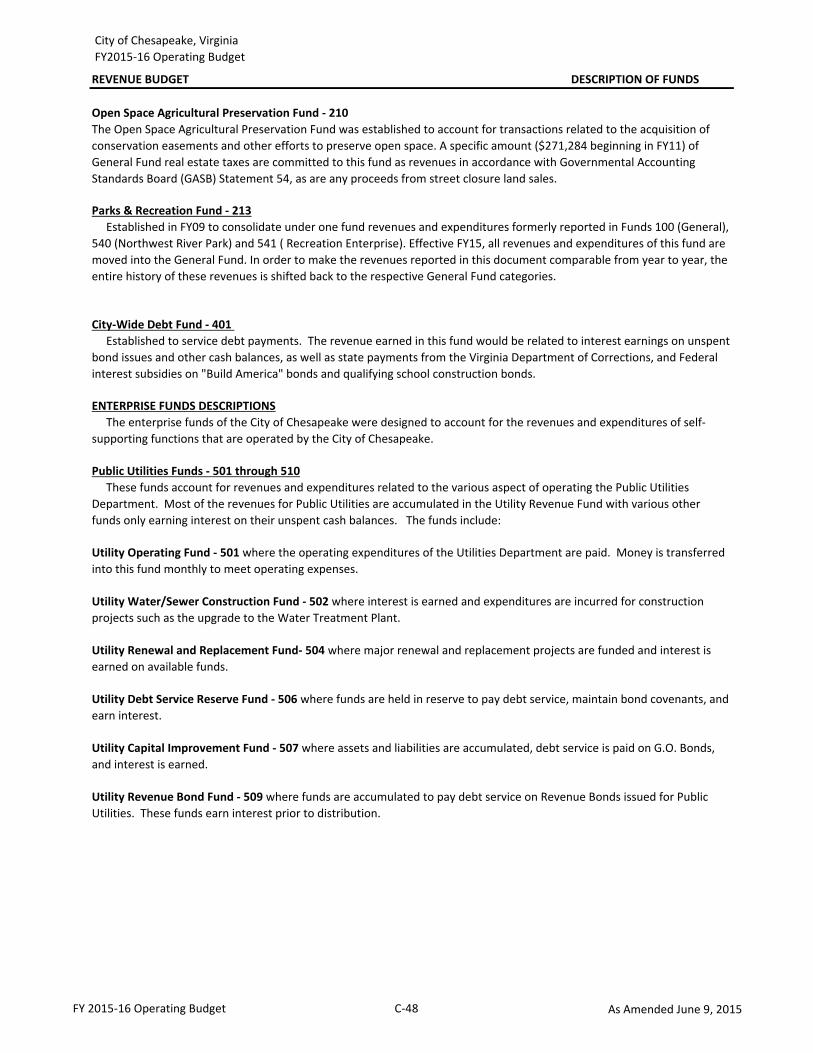
City of Chesapeake, Virginia FY2015-16 Operating Budget
REVENUE BUDGET DESCRIPTION OF FUNDS
Open Space Agricultural Preservation Fund - 210The Open Space Agricultural Preservation Fund was established to account for transactions related to the acquisition of conservation easements and other efforts to preserve open space. A specific amount ($271,284 beginning in FY11) of General Fund real estate taxes are committed to this fund as revenues in accordance with Governmental Accounting Standards Board (GASB) Statement 54, as are any proceeds from street closure land sales.
Parks & Recreation Fund - 213 Established in FY09 to consolidate under one fund revenues and expenditures formerly reported in Funds 100 (General), 540 (Northwest River Park) and 541 ( Recreation Enterprise). Effective FY15, all revenues and expenditures of this fund are moved into the General Fund. In order to make the revenues reported in this document comparable from year to year, the entire history of these revenues is shifted back to the respective General Fund categories.
City-Wide Debt Fund - 401 Established to service debt payments. The revenue earned in this fund would be related to interest earnings on unspent bond issues and other cash balances, as well as state payments from the Virginia Department of Corrections, and Federal interest subsidies on "Build America" bonds and qualifying school construction bonds.
ENTERPRISE FUNDS DESCRIPTIONS The enterprise funds of the City of Chesapeake were designed to account for the revenues and expenditures of self-supporting functions that are operated by the City of Chesapeake.
Public Utilities Funds - 501 through 510 These funds account for revenues and expenditures related to the various aspect of operating the Public Utilities Department. Most of the revenues for Public Utilities are accumulated in the Utility Revenue Fund with various other funds only earning interest on their unspent cash balances. The funds include:
Utility Operating Fund - 501 where the operating expenditures of the Utilities Department are paid. Money is transferred into this fund monthly to meet operating expenses.
Utility Debt Service Reserve Fund - 506 where funds are held in reserve to pay debt service, maintain bond covenants, and earn interest.
Utility Renewal and Replacement Fund- 504 where major renewal and replacement projects are funded and interest is earned on available funds.
Utility Water/Sewer Construction Fund - 502 where interest is earned and expenditures are incurred for construction projects such as the upgrade to the Water Treatment Plant.
Utility Capital Improvement Fund - 507 where assets and liabilities are accumulated, debt service is paid on G.O. Bonds, and interest is earned.
Utility Revenue Bond Fund - 509 where funds are accumulated to pay debt service on Revenue Bonds issued for Public Utilities. These funds earn interest prior to distribution.
FY 2015-16 Operating Budget C-48 As Amended June 9, 2015
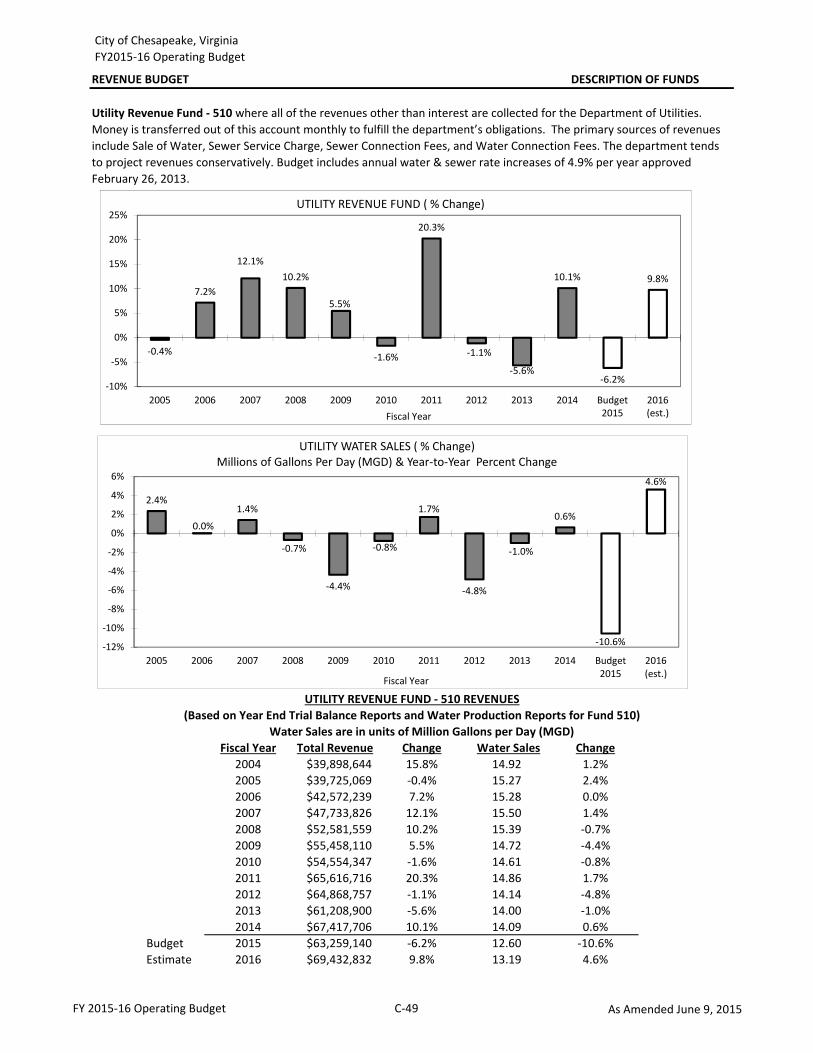
City of Chesapeake, Virginia FY2015-16 Operating Budget
REVENUE BUDGET DESCRIPTION OF FUNDS
510
Fiscal Year Total Revenue Change Water Sales Change2004 $39,898,644 15.8% 14.92 1.2%2005 $39,725,069 -0.4% 15.27 2.4%2006 $42,572,239 7.2% 15.28 0.0%2007 $47,733,826 12.1% 15.50 1.4%2008 $52,581,559 10.2% 15.39 -0.7%2009 $55,458,110 5.5% 14.72 -4.4%2010 $54,554,347 -1.6% 14.61 -0.8%2011 $65,616,716 20.3% 14.86 1.7%2012 $64,868,757 -1.1% 14.14 -4.8%2013 $61,208,900 -5.6% 14.00 -1.0%2014 $67,417,706 10.1% 14.09 0.6%
Budget 2015 $63,259,140 -6.2% 12.60 -10.6%Estimate 2016 $69,432,832 9.8% 13.19 4.6%
Water Sales are in units of Million Gallons per Day (MGD)
Utility Revenue Fund - 510 where all of the revenues other than interest are collected for the Department of Utilities. Money is transferred out of this account monthly to fulfill the department’s obligations. The primary sources of revenues include Sale of Water, Sewer Service Charge, Sewer Connection Fees, and Water Connection Fees. The department tends to project revenues conservatively. Budget includes annual water & sewer rate increases of 4.9% per year approved February 26, 2013.
UTILITY REVENUE FUND - 510 REVENUES(Based on Year End Trial Balance Reports and Water Production Reports for Fund 510)
-0.4%
7.2%
12.1%10.2%
5.5%
-1.6%
20.3%
-1.1%
-5.6%
10.1%
-6.2%
9.8%
-10%
-5%
0%
5%
10%
15%
20%
25%
2005 2006 2007 2008 2009 2010 2011 2012 2013 2014 Budget2015
2016(est.)Fiscal Year
UTILITY REVENUE FUND ( % Change)
2.4%
0.0%
1.4%
-0.7%
-4.4%
-0.8%
1.7%
-4.8%
-1.0%
0.6%
-10.6%
4.6%
-12%
-10%
-8%
-6%
-4%
-2%
0%
2%
4%
6%
2005 2006 2007 2008 2009 2010 2011 2012 2013 2014 Budget2015
2016(est.)
Fiscal Year
UTILITY WATER SALES ( % Change)Millions of Gallons Per Day (MGD) & Year-to-Year Percent Change
FY 2015-16 Operating Budget C-49 As Amended June 9, 2015
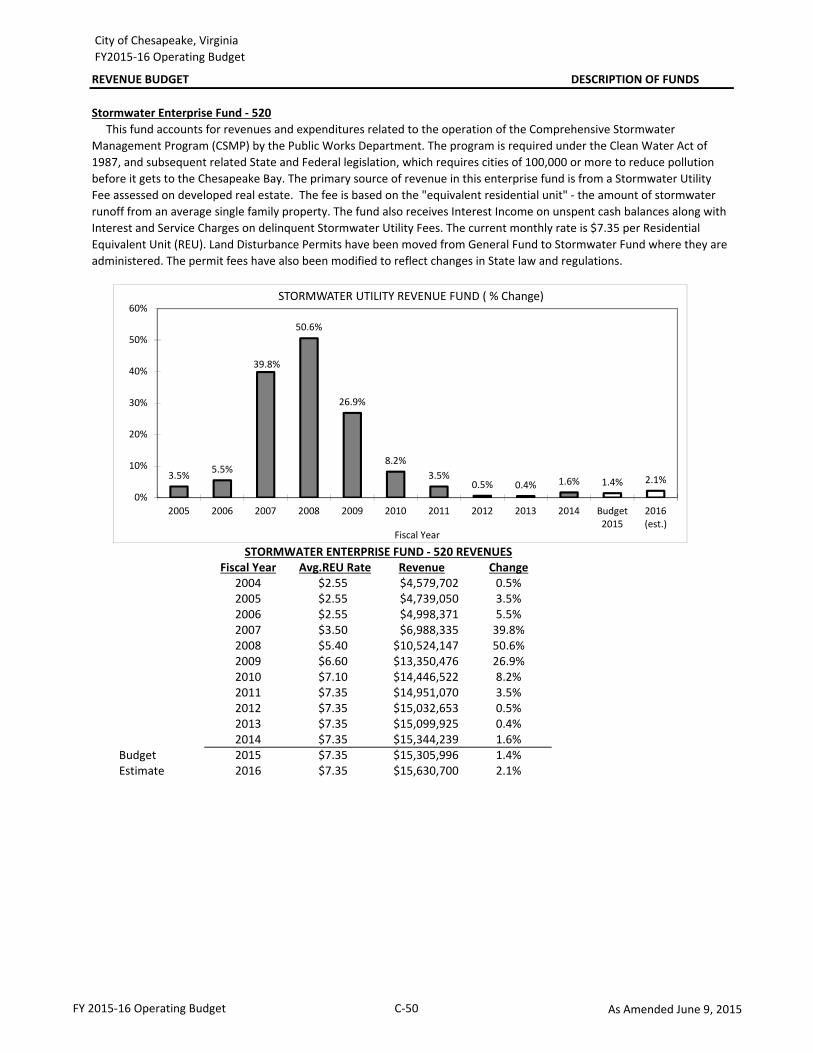
City of Chesapeake, Virginia FY2015-16 Operating Budget
REVENUE BUDGET DESCRIPTION OF FUNDS
520
Fiscal Year Avg.REU Rate Revenue Change2004 $2.55 $4,579,702 0.5%2005 $2.55 $4,739,050 3.5%2006 $2.55 $4,998,371 5.5%2007 $3.50 $6,988,335 39.8%2008 $5.40 $10,524,147 50.6%2009 $6.60 $13,350,476 26.9%2010 $7.10 $14,446,522 8.2%2011 $7.35 $14,951,070 3.5%2012 $7.35 $15,032,653 0.5%2013 $7.35 $15,099,925 0.4%2014 $7.35 $15,344,239 1.6%
Budget 2015 $7.35 $15,305,996 1.4%Estimate 2016 $7.35 $15,630,700 2.1%
Stormwater Enterprise Fund - 520 This fund accounts for revenues and expenditures related to the operation of the Comprehensive Stormwater Management Program (CSMP) by the Public Works Department. The program is required under the Clean Water Act of 1987, and subsequent related State and Federal legislation, which requires cities of 100,000 or more to reduce pollution before it gets to the Chesapeake Bay. The primary source of revenue in this enterprise fund is from a Stormwater Utility Fee assessed on developed real estate. The fee is based on the "equivalent residential unit" - the amount of stormwater runoff from an average single family property. The fund also receives Interest Income on unspent cash balances along with Interest and Service Charges on delinquent Stormwater Utility Fees. The current monthly rate is $7.35 per Residential Equivalent Unit (REU). Land Disturbance Permits have been moved from General Fund to Stormwater Fund where they are administered. The permit fees have also been modified to reflect changes in State law and regulations.
STORMWATER ENTERPRISE FUND - 520 REVENUES
3.5% 5.5%
39.8%
50.6%
26.9%
8.2%3.5%
0.5% 0.4% 1.6% 1.4% 2.1%
0%
10%
20%
30%
40%
50%
60%
2005 2006 2007 2008 2009 2010 2011 2012 2013 2014 Budget2015
2016(est.)
Fiscal Year
STORMWATER UTILITY REVENUE FUND ( % Change)
FY 2015-16 Operating Budget C-50 As Amended June 9, 2015
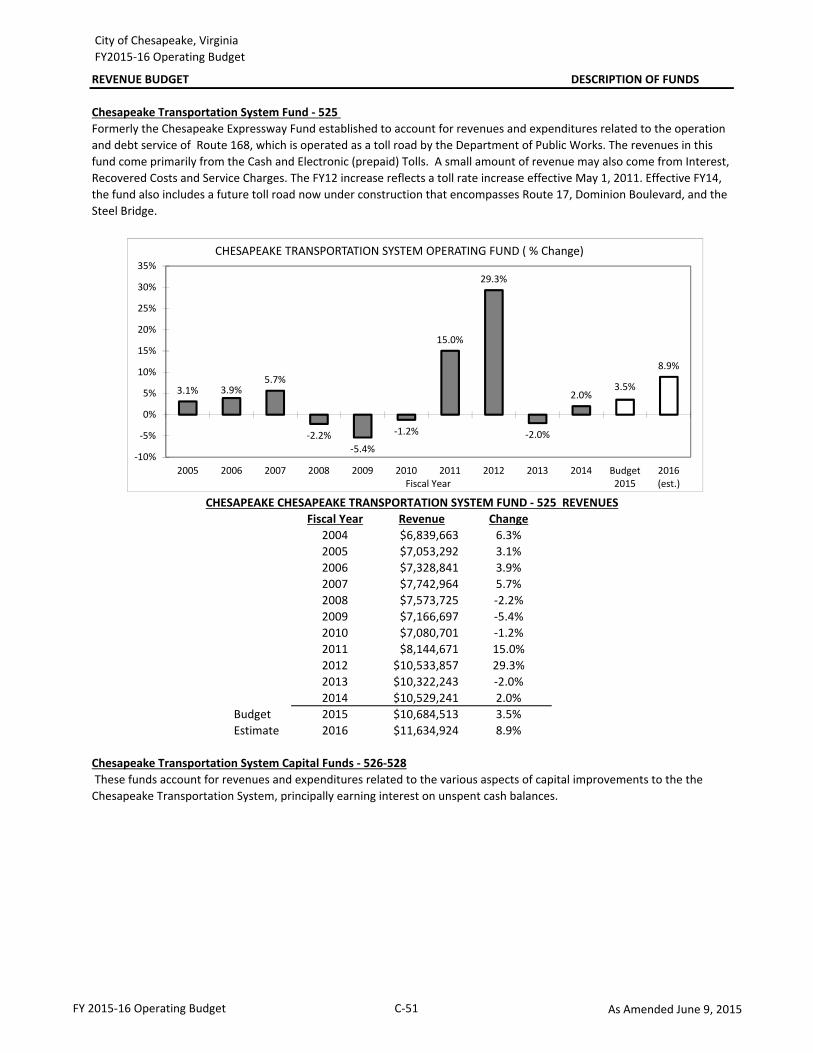
City of Chesapeake, Virginia FY2015-16 Operating Budget
REVENUE BUDGET DESCRIPTION OF FUNDS
525
Fiscal Year Revenue Change2004 $6,839,663 6.3%2005 $7,053,292 3.1%2006 $7,328,841 3.9%2007 $7,742,964 5.7%2008 $7,573,725 -2.2%2009 $7,166,697 -5.4%2010 $7,080,701 -1.2%2011 $8,144,671 15.0%2012 $10,533,857 29.3%2013 $10,322,243 -2.0%2014 $10,529,241 2.0%
Budget 2015 $10,684,513 3.5%Estimate 2016 $11,634,924 8.9%
Chesapeake Transportation System Fund - 525 Formerly the Chesapeake Expressway Fund established to account for revenues and expenditures related to the operation and debt service of Route 168, which is operated as a toll road by the Department of Public Works. The revenues in this fund come primarily from the Cash and Electronic (prepaid) Tolls. A small amount of revenue may also come from Interest, Recovered Costs and Service Charges. The FY12 increase reflects a toll rate increase effective May 1, 2011. Effective FY14, the fund also includes a future toll road now under construction that encompasses Route 17, Dominion Boulevard, and the Steel Bridge.
CHESAPEAKE CHESAPEAKE TRANSPORTATION SYSTEM FUND - 525 REVENUES
Chesapeake Transportation System Capital Funds - 526-528 These funds account for revenues and expenditures related to the various aspects of capital improvements to the the Chesapeake Transportation System, principally earning interest on unspent cash balances.
3.1% 3.9%5.7%
-2.2%-5.4%
-1.2%
15.0%
29.3%
-2.0%
2.0%3.5%
8.9%
-10%
-5%
0%
5%
10%
15%
20%
25%
30%
35%
2005 2006 2007 2008 2009 2010 2011 2012 2013 2014 Budget2015
2016(est.)Fiscal Year
CHESAPEAKE TRANSPORTATION SYSTEM OPERATING FUND ( % Change)
FY 2015-16 Operating Budget C-51 As Amended June 9, 2015
City of Chesapeake, Virginia FY2015-16 Operating Budget
REVENUE BUDGET DESCRIPTION OF FUNDS
Self-Insurance Fund - 606
INTERNAL SERVICE FUNDS DESCRIPTIONS The City of Chesapeake maintains three internal service funds to supply the needs of the various departments within the city. The revenues earned in each fund are related to the services that they provide to other departments and are primarily internal charges rather than true revenues. These internal service funds include:
Central Fleet Management Fund - 601 Established to account for revenues and expenditures related to the operation of the City Garage and the activities of the Sheriff's inmate work crews. The fund is used to maintain the vehicles and equipment owned by the City. Sources of revenue include vehicle lease charges to City departments and sales of fuel to Chesapeake Public Schools.
Information Technology Fund - 603 Established to account for revenues and expenditures related to the operation of the City's Information Technology Department. The department services and maintains the City's computer and communication systems. Sources of revenue include rent of space on the City's communications tower and computer services charges to City departments and Chesapeake Public Schools.
Established to account for revenues and expenditures related to the operation of the City's Risk Management operations. Risk Management is responsible for supplying the various insurance needs of the City. The primary source of revenue is the Sale of Service to Departments.
FY 2015-16 Operating Budget C-52 As Amended June 9, 2015
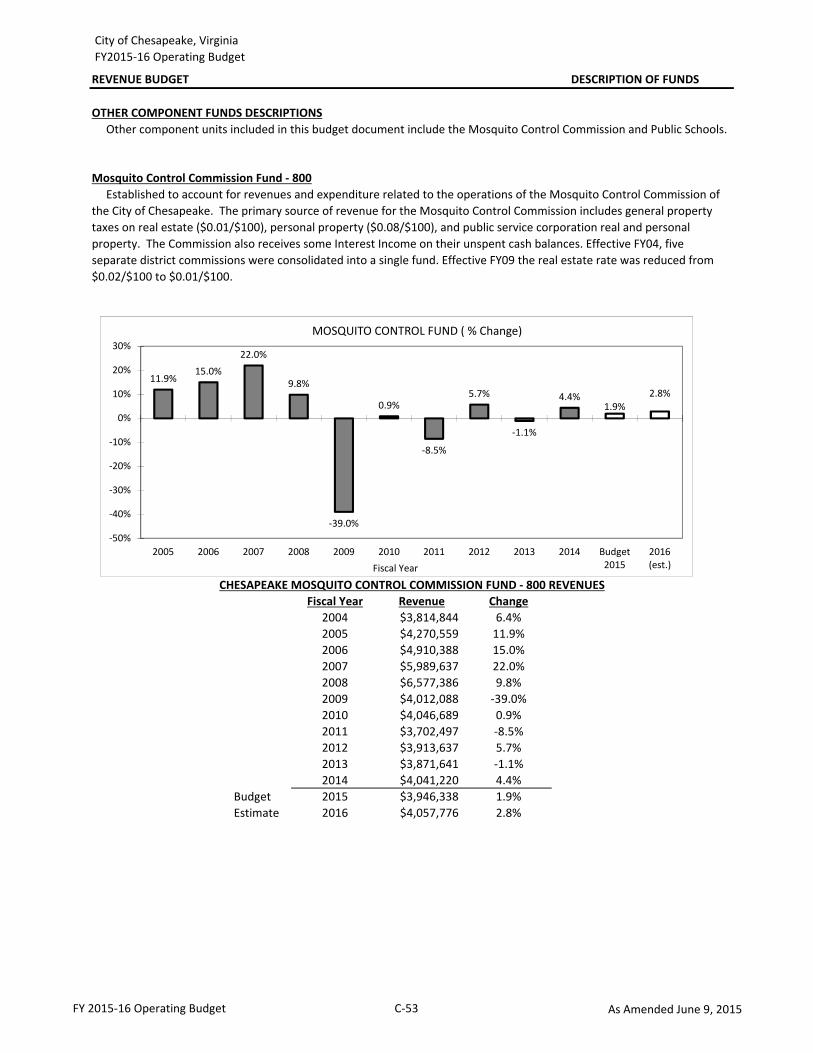
City of Chesapeake, Virginia FY2015-16 Operating Budget
REVENUE BUDGET DESCRIPTION OF FUNDS
800
Fiscal Year Revenue Change2004 $3,814,844 6.4%2005 $4,270,559 11.9%2006 $4,910,388 15.0%2007 $5,989,637 22.0%2008 $6,577,386 9.8%2009 $4,012,088 -39.0%2010 $4,046,689 0.9%2011 $3,702,497 -8.5%2012 $3,913,637 5.7%2013 $3,871,641 -1.1%2014 $4,041,220 4.4%
Budget 2015 $3,946,338 1.9%Estimate 2016 $4,057,776 2.8%
OTHER COMPONENT FUNDS DESCRIPTIONS Other component units included in this budget document include the Mosquito Control Commission and Public Schools.
Mosquito Control Commission Fund - 800 Established to account for revenues and expenditure related to the operations of the Mosquito Control Commission of the City of Chesapeake. The primary source of revenue for the Mosquito Control Commission includes general property taxes on real estate ($0.01/$100), personal property ($0.08/$100), and public service corporation real and personal property. The Commission also receives some Interest Income on their unspent cash balances. Effective FY04, five separate district commissions were consolidated into a single fund. Effective FY09 the real estate rate was reduced from $0.02/$100 to $0.01/$100.
CHESAPEAKE MOSQUITO CONTROL COMMISSION FUND - 800 REVENUES
11.9%15.0%
22.0%
9.8%
-39.0%
0.9%
-8.5%
5.7%
-1.1%
4.4%1.9%
2.8%
-50%
-40%
-30%
-20%
-10%
0%
10%
20%
30%
2005 2006 2007 2008 2009 2010 2011 2012 2013 2014 Budget2015
2016(est.)Fiscal Year
MOSQUITO CONTROL FUND ( % Change)
FY 2015-16 Operating Budget C-53 As Amended June 9, 2015
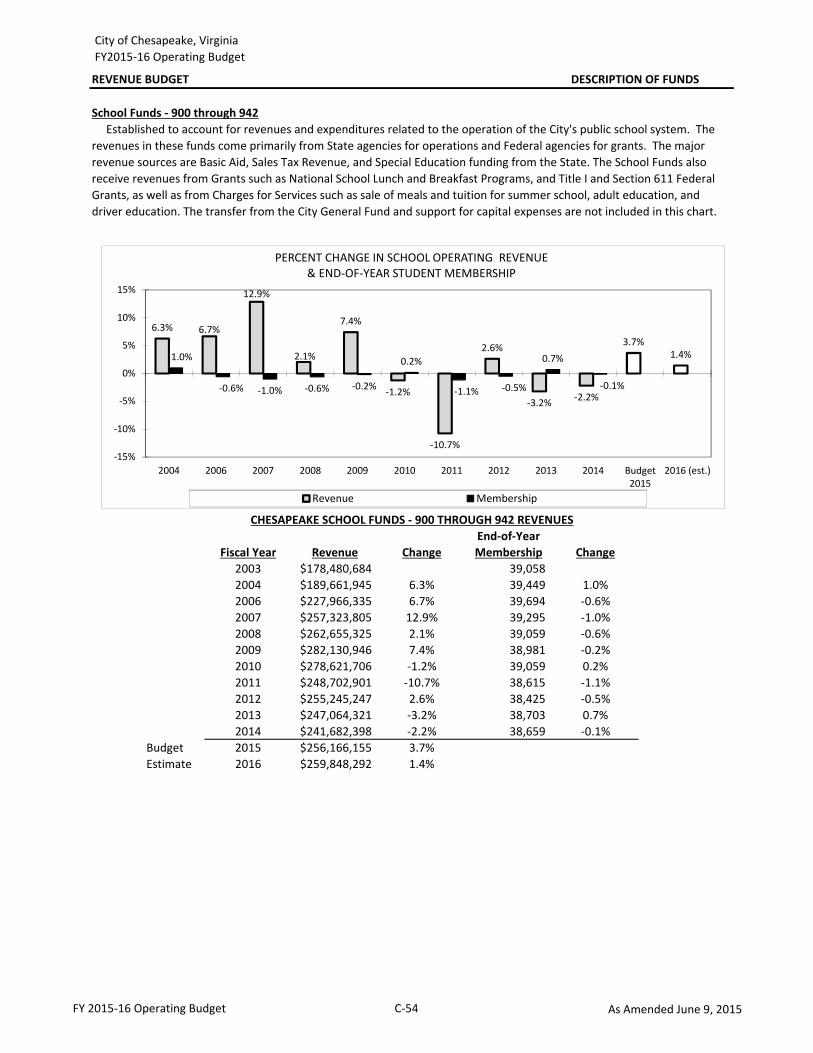
City of Chesapeake, Virginia FY2015-16 Operating Budget
REVENUE BUDGET DESCRIPTION OF FUNDS
>899
End-of-YearFiscal Year Revenue Change Membership Change
2003 $178,480,684 39,0582004 $189,661,945 6.3% 39,449 1.0%2006 $227,966,335 6.7% 39,694 -0.6%2007 $257,323,805 12.9% 39,295 -1.0%2008 $262,655,325 2.1% 39,059 -0.6%2009 $282,130,946 7.4% 38,981 -0.2%2010 $278,621,706 -1.2% 39,059 0.2%2011 $248,702,901 -10.7% 38,615 -1.1%2012 $255,245,247 2.6% 38,425 -0.5%2013 $247,064,321 -3.2% 38,703 0.7%2014 $241,682,398 -2.2% 38,659 -0.1%
Budget 2015 $256,166,155 3.7%Estimate 2016 $259,848,292 1.4%
School Funds - 900 through 942 Established to account for revenues and expenditures related to the operation of the City's public school system. The revenues in these funds come primarily from State agencies for operations and Federal agencies for grants. The major revenue sources are Basic Aid, Sales Tax Revenue, and Special Education funding from the State. The School Funds also receive revenues from Grants such as National School Lunch and Breakfast Programs, and Title I and Section 611 Federal Grants, as well as from Charges for Services such as sale of meals and tuition for summer school, adult education, and driver education. The transfer from the City General Fund and support for capital expenses are not included in this chart.
CHESAPEAKE SCHOOL FUNDS - 900 THROUGH 942 REVENUES
6.3% 6.7%
12.9%
2.1%
7.4%
-1.2%
-10.7%
2.6%
-3.2% -2.2%
3.7%1.4%1.0%
-0.6% -1.0% -0.6% -0.2%
0.2%
-1.1% -0.5%
0.7%
-0.1%
-15%
-10%
-5%
0%
5%
10%
15%
2004 2006 2007 2008 2009 2010 2011 2012 2013 2014 Budget2015
2016 (est.)
PERCENT CHANGE IN SCHOOL OPERATING REVENUE& END-OF-YEAR STUDENT MEMBERSHIP
Revenue Membership
FY 2015-16 Operating Budget C-54 As Amended June 9, 2015
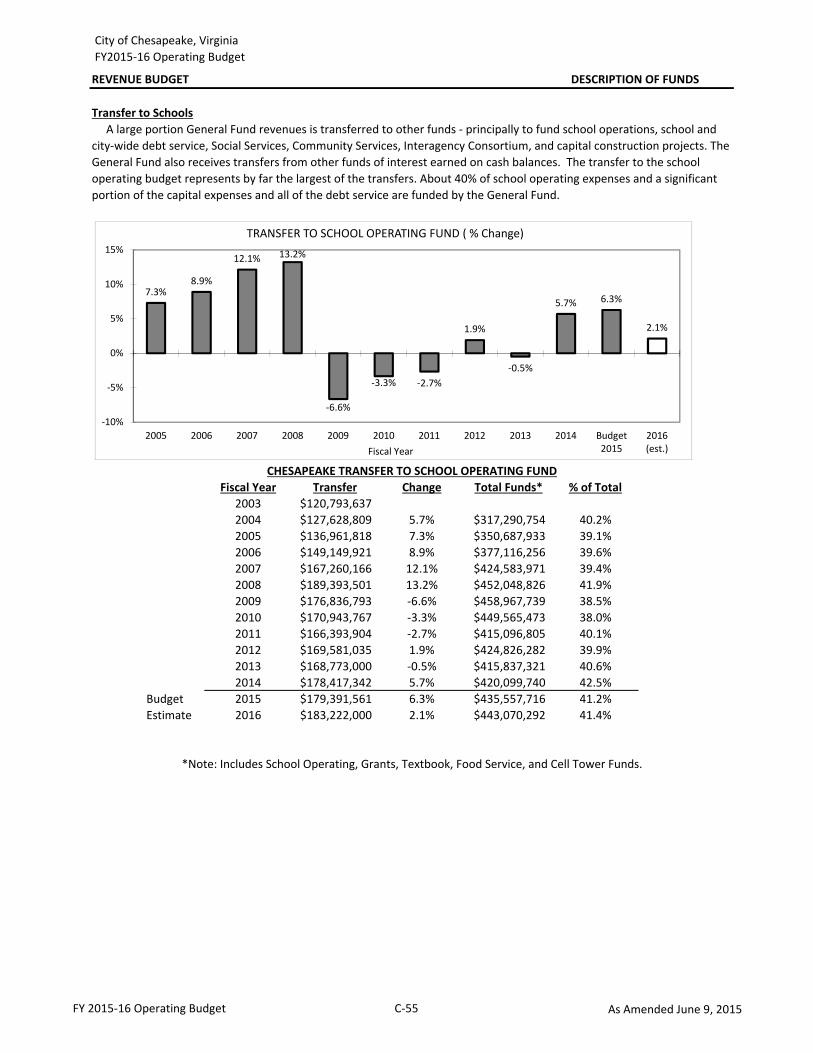
City of Chesapeake, Virginia FY2015-16 Operating Budget
REVENUE BUDGET DESCRIPTION OF FUNDS
Transfer to Schools
Fiscal Year Transfer Change Total Funds* % of Total2003 $120,793,6372004 $127,628,809 5.7% $317,290,754 40.2%2005 $136,961,818 7.3% $350,687,933 39.1%2006 $149,149,921 8.9% $377,116,256 39.6%2007 $167,260,166 12.1% $424,583,971 39.4%2008 $189,393,501 13.2% $452,048,826 41.9%2009 $176,836,793 -6.6% $458,967,739 38.5%2010 $170,943,767 -3.3% $449,565,473 38.0%2011 $166,393,904 -2.7% $415,096,805 40.1%2012 $169,581,035 1.9% $424,826,282 39.9%2013 $168,773,000 -0.5% $415,837,321 40.6%2014 $178,417,342 5.7% $420,099,740 42.5%
Budget 2015 $179,391,561 6.3% $435,557,716 41.2%Estimate 2016 $183,222,000 2.1% $443,070,292 41.4%
*Note: Includes School Operating, Grants, Textbook, Food Service, and Cell Tower Funds.
A large portion General Fund revenues is transferred to other funds - principally to fund school operations, school and city-wide debt service, Social Services, Community Services, Interagency Consortium, and capital construction projects. The General Fund also receives transfers from other funds of interest earned on cash balances. The transfer to the school operating budget represents by far the largest of the transfers. About 40% of school operating expenses and a significant portion of the capital expenses and all of the debt service are funded by the General Fund.
CHESAPEAKE TRANSFER TO SCHOOL OPERATING FUND
7.3%8.9%
12.1% 13.2%
-6.6%
-3.3% -2.7%
1.9%
-0.5%
5.7% 6.3%
2.1%
-10%
-5%
0%
5%
10%
15%
2005 2006 2007 2008 2009 2010 2011 2012 2013 2014 Budget2015
2016(est.)Fiscal Year
TRANSFER TO SCHOOL OPERATING FUND ( % Change)
FY 2015-16 Operating Budget C-55 As Amended June 9, 2015
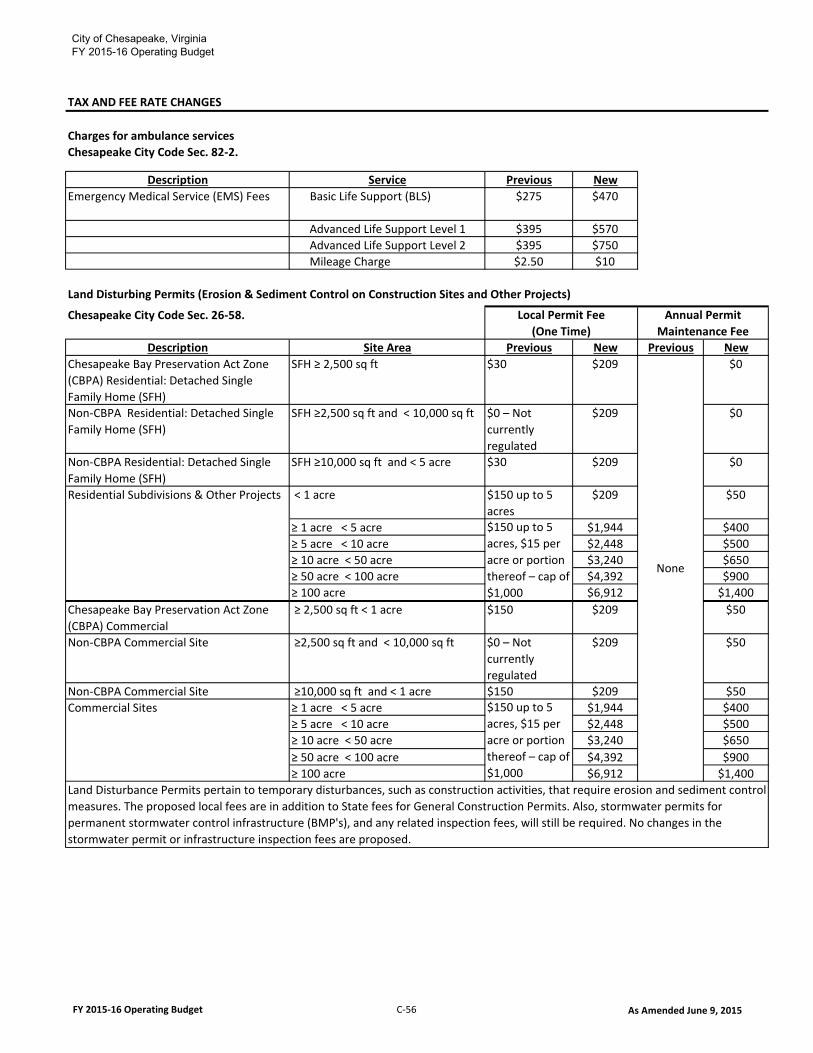
City of Chesapeake, VirginiaFY 2015-16 Operating Budget
TAX AND FEE RATE CHANGES
Charges for ambulance servicesChesapeake City Code Sec. 82-2.
Description Service Previous NewEmergency Medical Service (EMS) Fees Basic Life Support (BLS) $275 $470
Advanced Life Support Level 1 $395 $570 Advanced Life Support Level 2 $395 $750 Mileage Charge $2.50 $10
Description Site Area Previous New Previous NewChesapeake Bay Preservation Act Zone (CBPA) Residential: Detached Single Family Home (SFH)
SFH ≥ 2,500 sq ft $30 $209 $0
Non-CBPA Residential: Detached Single Family Home (SFH)
SFH ≥2,500 sq ft and < 10,000 sq ft $0 – Not currently regulated
$209 $0
Non-CBPA Residential: Detached Single Family Home (SFH)
SFH ≥10,000 sq ft and < 5 acre $30 $209 $0
< 1 acre $150 up to 5 acres
$209 $50
≥ 1 acre < 5 acre $1,944 $400 ≥ 5 acre < 10 acre $2,448 $500 ≥ 10 acre < 50 acre $3,240 $650 ≥ 50 acre < 100 acre $4,392 $900 ≥ 100 acre $6,912 $1,400
Chesapeake Bay Preservation Act Zone (CBPA) Commercial
≥ 2,500 sq ft < 1 acre $150 $209 $50
Non-CBPA Commercial Site ≥2,500 sq ft and < 10,000 sq ft $0 – Not currently regulated
$209 $50
Non-CBPA Commercial Site ≥10,000 sq ft and < 1 acre $150 $209 $50 ≥ 1 acre < 5 acre $1,944 $400 ≥ 5 acre < 10 acre $2,448 $500 ≥ 10 acre < 50 acre $3,240 $650 ≥ 50 acre < 100 acre $4,392 $900 ≥ 100 acre $6,912 $1,400
Land Disturbance Permits pertain to temporary disturbances, such as construction activities, that require erosion and sediment control measures. The proposed local fees are in addition to State fees for General Construction Permits. Also, stormwater permits for permanent stormwater control infrastructure (BMP's), and any related inspection fees, will still be required. No changes in the stormwater permit or infrastructure inspection fees are proposed.
Land Disturbing Permits (Erosion & Sediment Control on Construction Sites and Other Projects)
Chesapeake City Code Sec. 26-58. Local Permit Fee (One Time)
Annual Permit Maintenance Fee
None
Residential Subdivisions & Other Projects
$150 up to 5 acres, $15 per acre or portion thereof – cap of $1,000
Commercial Sites $150 up to 5 acres, $15 per acre or portion thereof – cap of $1,000
FY 2015-16 Operating Budget C-56 As Amended June 9, 2015