Embed Size (px)
Citation preview
Revaluation Versus Devaluation: A Study of Exchange-Rate Changes William R. Folks, Jr. and Stanley R. Stansell
The purpose of this study is to determine whether the technique of linear discriminant analysis can assist in exchange-risk management. Specifically, a discriminant function, using readily available or estimable macro-economic values is developed which will classify countries into two distinct groups: 1) countries whose currency value (relative to the value of the dollar) will decrease by 5 percent or more over a two-year period, and 2) countries whose currency value will not show such a decrease.
The authors believe that such a discriminant function, if reasonably accurate, is valuable in corporate exchange-risk management. Under normal operating conditions, U.S.-based corporations with direct investments overseas generally have an excess of assets over liabilities that are exposed to the risk of currency changes. Thus, a reduction in foreign-currency values causes, at least for accounting purposes, a loss in the value of exposed assets. Numerous strategies for adjusting the exchange-risk posture of the firm exist but require some warning for effective use. Some projection of the extent of currency-rate change is also required to prevent adoption of exchange-adjustment strategies which may prove more costly than the losses they were designed to prevent.
The authors hope that the discriminant function developed below will provide an early warning of impending downward exchange-rate changes. Armed with this warning, corroborated possibly by local sources, non-statistically based projections, and other information, the exchange-risk manager can then provide closer surveillance of the currency under suspicion, take long-range steps to adjust the exchange-risk posture of the firm, and develop contingency plans for short-term measures should the decrease in currency value become imminent.
William R. Folks, Jr. is a faculty member at the University of South Carolina and Stanley R. Stansell is a faculty member at the University of Houston. This paper was written in 1973.
© The Chicago Mercantile Exchange, 1979 www.cmegroup.com
144 SECTION 2: FORWARD-PRICING EFFICIENCY
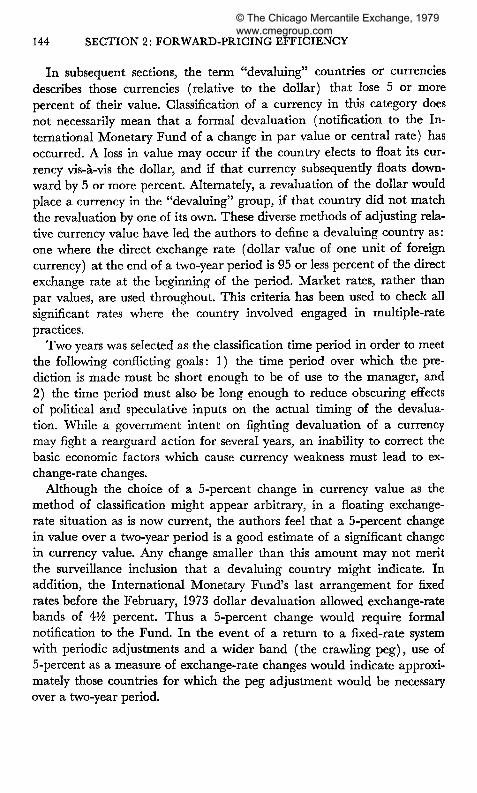
In subsequent sections, the term "devaluing" countries or currencies describes those currencies (relative to the dollar) that lose 5 or more percent of their value. Classification of a currency in this category does not necessarily mean that a formal devaluation (notification to the International Monetary Fund of a change in par value or central rate) has occurred. A loss in value may occur if the country elects to float its currency vis-a-vis the dollar, and if that currency subsequently floats downward by 5 or more percent. Alternately, a revaluation of the dollar would place a currency in the "devaluing" group, if that country did not match the revaluation by one of its own. These diverse methods of adjusting relative currency value have led the authors to define a devaluing country as: one where die direct exchange rate (dollar value of one unit of foreign currency) at the end of a two-year period is 95 or less percent of the direct exchange rate at the beginning of the period. Market rates, ratiier than par values, are used throughout. This criteria has been used to check all significant rates where the country involved engaged in multiple-rate practices.
Two years was selected as the classification time period in order to meet the following conflicting goals: 1) the time period over which the prediction is made must be short enough to be of use to the manager, and 2) the time period must also be long enough to reduce obscuring effects of political and speculative inputs on the actual timing of the devaluation. While a government intent on fighting devaluation of a currency may fight a rearguard action for several years, an inability to correct the basic economic factors which cause currency weakness must lead to exchange-rate changes.
Although the choice of a 5-percent change in currency value as die method of classification might appear arbitrary, in a floating exchange-rate situation as is now current, the authors feel that a 5-percent change in value over a two-year period is a good estimate of a significant change in currency value. Any change smaller than this amount may not merit the surveillance inclusion that a devaluing country might indicate. In addition, the International Monetary Fund's last arrangement for fixed rates before the February, 1973 dollar devaluation allowed exchange-rate bands of 4V& percent. Thus a 5-percent change would require formal notification to the Fund. In the event of a return to a fixed-rate system with periodic adjustments and a wider band (the crawling peg), use of 5-percent as a measure of exchange-rate changes would indicate approximately those countries for which the peg adjustment would be necessary over a two-year period.
© The Chicago Mercantile Exchange, 1979 www.cmegroup.com
Exchange-Rate Changes 145
DESIGN OF THE STUDY
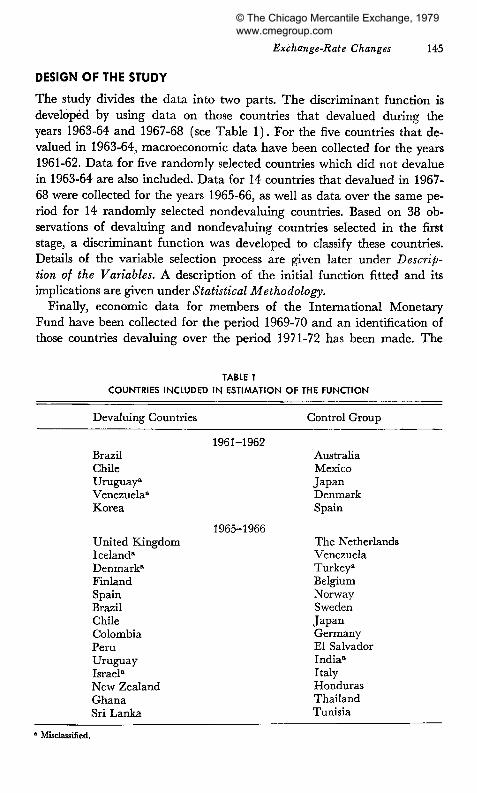
The study divides the data into two parts. The discriminant function is developed by using data on those countries that devalued during the years 1963-64 and 1967-68 (see Table 1). For the five countries that devalued in 1963-64, macroeconomic data have been collected for the years 1961-62. Data for five randomly selected countries which did not devalue in 1963-64 are also included. Data for 14 countries that devalued in 1967-68 were collected for the years 1965-66, as well as data over the same period for 14 randomly selected nondevaluing countries. Based on 38 observations of devaluing and nondevaluing countries selected in the first stage, a discriminant function was developed to classify these countries. Details of the variable selection process are given later under Description of the Variables. A description of the initial function fitted and its implications are given under Statistical Methodology.
Finally, economic data for members of die International Monetary Fund have been collected for the period 1969-70 and an identification of those countries devaluing over the period 1971-72 has been made. The
TABLE 1 COUNTRIES INCLUDED IN ESTIMATION OF THE FUNCTION
Devaluing Countries Control Group
1961-1962 Brazil Chile Uruguay3
Venezuela0
Korea
Australia Mexico Japan Denmark Spain
1965-1966 United Kingdom Iceland" Denmark" Finland Spain Brazil Chile Colombia Peru Uruguay Israel" New Zealand Ghana Sri Lanka
The Netherlands Venezuela Turkey" Belgium Norway Sweden Japan Germany El Salvador India" Italy Honduras Thailand Tunisia
• Misclassified.
© The Chicago Mercantile Exchange, 1979 www.cmegroup.com
146 SECTION 2: FORWARD-PRICING EFFICIENCY
final section of the study uses the function developed in Statistical Methodology to predict devaluations which occurred in 1971-72. This is the most rigorous possible test of the function. Results are presented under Results of the Analysis.
DESCRIPTION OF THE VARIABLES
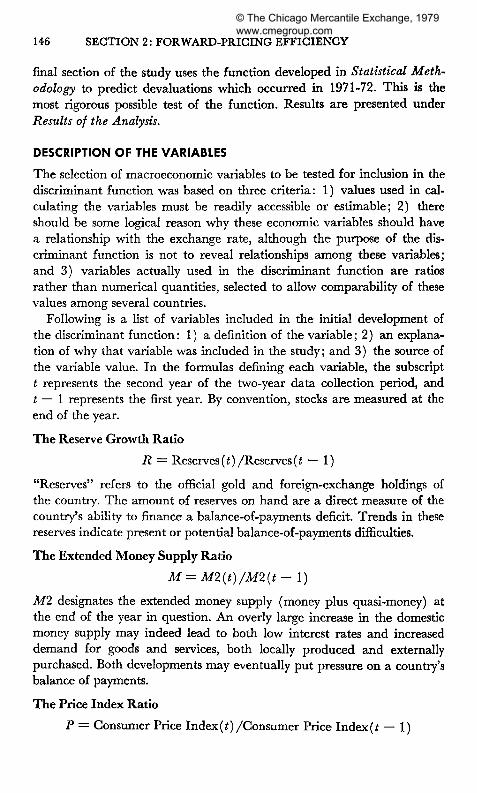
The selection of macroeconomic variables to be tested for inclusion in the discriminant function was based on three criteria: 1) values used in calculating die variables must be readily accessible or estimable; 2) there should be some logical reason why these economic variables should have a relationship with the exchange rate, although the purpose of the discriminant function is not to reveal relationships among these variables; and 3) variables actually used in the discriminant function are ratios rather than numerical quantities, selected to allow comparability of these values among several countries.
Following is a list of variables included in the initial development of the discriminant function: 1) a definition of the variable; 2) an explanation of why that variable was included in the study; and 3) the source of the variable value. In the formulas defining each variable, the subscript t represents the second year of the two-year data collection period, and t — 1 represents the first year. By convention, stocks are measured at the end of the year.
The Reserve Growth Ratio
R = Reserves (t) /Reserves (t — 1)
"Reserves" refers to the official gold and foreign-exchange holdings of the country. The amount of reserves on hand are a direct measure of the country's ability to finance a balance-of-payments deficit. Trends in tiiese reserves indicate present or potential balance-of-payments difficulties.
The Extended Money Supply Ratio
M = M2(t)/M2(t- 1)
Ml designates the extended money supply (money plus quasi-money) at the end of the year in question. An overly large increase in the domestic money supply may indeed lead to both low interest rates and increased demand for goods and services, both locally produced and externally purchased. Both developments may eventually put pressure on a country's balance of payments.
The Price Index Ratio
P = Consumer Price Index(t)/Consumer Price Index(r — 1)
© The Chicago Mercantile Exchange, 1979 www.cmegroup.com
Exchange-Rate Changes 147
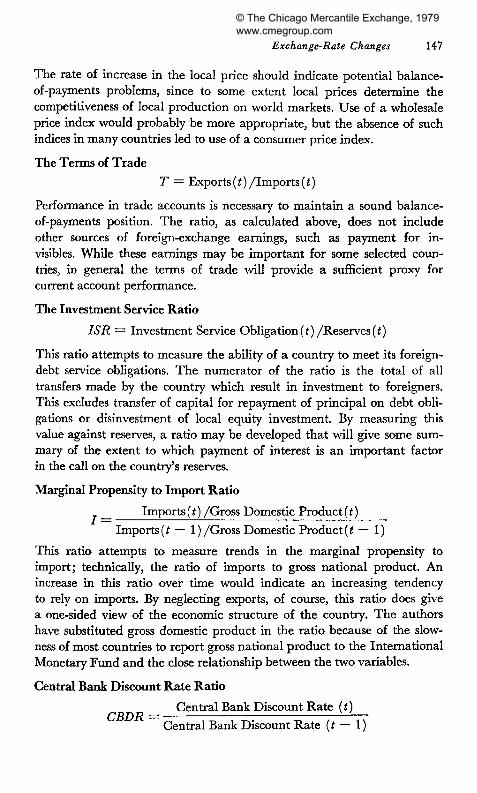
The rate of increase in the local price should indicate potential balance-of-payments problems, since to some extent local prices determine the competitiveness of local production on world markets. Use of a wholesale price index would probably be more appropriate, but the absence of such indices in many countries led to use of a consumer price index.
The Terms of Trade
T = Exports (t) /Imports (t)
Performance in trade accounts is necessary to maintain a sound balance-of-payments position. The ratio, as calculated above, does not include other sources of foreign-exchange earnings, such as payment for invisibles. While these earnings may be important for some selected countries, in general the terms of trade will provide a sufficient proxy for current account performance.
The Investment Service Ratio
ISR = Investment Service Obligation(t) /Reserves(t)
This ratio attempts to measure the ability of a country to meet its foreign-debt service obligations. The numerator of the ratio is the total of all transfers made by the country which result in investment to foreigners. This excludes transfer of capital for repayment of principal on debt obligations or disinvestment of local equity investment. By measuring this value against reserves, a ratio may be developed that will give some summary of the extent to which payment of interest is an important factor in the call on the country's reserves.
Marginal Propensity to Import Ratio
_ Imports (£) /Gross Domestic Product(t) Imports(t — 1)/Gross Domestic Product(t — 1)
This ratio attempts to measure trends in the marginal propensity to import; technically, the ratio of imports to gross national product. An increase in this ratio over time would indicate an increasing tendency to rely on imports. By neglecting exports, of course, this ratio does give a one-sided view of the economic structure of the country. The authors have substituted gross domestic product in the ratio because of the slowness of most countries to report gross national product to the International Monetary Fund and the close relationship between the two variables.
Central Bank Discount Rate Ratio
Central Bank Discount Rate (t) CBDR = Central Bank Discount Rate (t — 1)
© The Chicago Mercantile Exchange, 1979 www.cmegroup.com
148 SECTION 2: FORWARD-PRICING EFFICIENCY
Short-term money market rates may have an important influence on the cross-border speculative and nonspeculative short-term capital movements. A frequently adopted device of currency defense is an increase in the discount rate, as well as other monetary measures designed to tighten the money supply and attract foreign capital. Thus, die discount rate ratio serves as a proxy for the direction of change of money-market rates.
STATISTICAL METHODOLOGY
The statistical technique employed here involves the use of multiple discriminant analysis (hereafter, MDA). This approach has been used: to predict bankruptcy (Altaian, 1968); to predict bank capital adequacy (Dince, 1972); in consumer credit evaluation (Myers and Forgy, 1963); and in various manufacturing and financial institutions for predictive purposes (Myers and Forgy, 1963; Walter, 1959).
MDA allows an observation to be classified into one of several a priori groups based on the characteristics of that observation. This study classifies countries into two groups — those which have had significant downward exchange-rate changes relative to the dollar, and those which have not had such changes. The two groups are distinguished by qualitative differences, but the characteristics of the group must be quantifiable in order to use the MDA technique. In this study, various ratios of publicly available economic data are calculated to provide the test characteristics of each group. We would like to select that set of variables (ratios) which is most similar within groups, yet which best discriminates between groups. MDA then derives the linear combination of characteristics that best discriminates between these groups (i.e., between devaluing and nondevaluing countries). The entire characteristic profile and its interactions are considered by MDA, which is an obvious advantage when the number of characteristics is large. (Variables are sometimes very important in a multivariate analysis when they would be insignificant in a univariate analysis.)
Once the coefficients of the characteristics (in this case, the ratios) are obtained from a set of observations, a composite score (usually called a Z score) is calculated and employed as a dividing point between the two groups. Alternatively, the posterior probabilities of falling into a given group can be calculated. This latter technique is employed here. If the assumptions of the analysis are met, and if the characteristics employed are such that they, in fact, discriminate between the groups, the coefficients can then be applied to other data in a predictive fashion. The BMD07M stepwise discriminant analysis program is used to construct the function.
© The Chicago Mercantile Exchange, 1979 www.cmegroup.com
Exchange-Rate Changes 149
RESULTS OF THE ANALYSIS
The macroeconomic ratios described under Description of the Variables were calculated on the 38 countries listed in Table 1 to provide a data set from which the discriminant function is estimated. (The 1961-62 period and the 1965-66 period are assumed to be similar enough to combine samples from these periods.) Since the purpose of the model is to predict over an entirely different time period, observations from the 1961-62 period are combined witii those from 1965-66 to eliminate special factors which might have prevailed in only one period. As a precautionary measure, five control-group countries were selected from the 1961-62 period and 14 from the 1965-66 period to match the number of devaluing countries available during these respective periods.
Since relatively few countries devalue their currency, and since adequate data sets exist for even fewer countries, Table 1 includes in die set of devaluing countries three (Brazil, Chile, and Uruguay) which devalued twice — once in the 1961-62 period, and again in the 1965-66 period. Also included in the control group, are two countries (Spain and Venezuela) which had devalued during other time periods. Japan is included in the control group twice, once in each time period. These overlaps result from both the scarcity of devaluing countries and from the random-selection process. Including the same country twice in the same group probably spuriously increases within-group homogeneity, while including the same country in both groups (even when data are drawn from different time periods) probably reduces between-group differences. Were die model explanatory in nature, these criticisms would be valid. The crucial test of this model lies in its predictive capabilities.
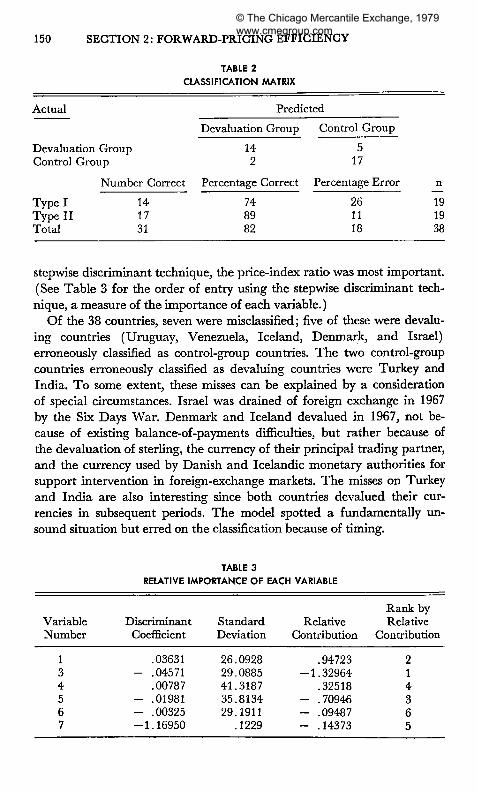
Using MDA, the discriminant function is estimated from data defined previously. The classification matrix is presented in Table 2. The model correctly classifies 82 percent of the sample. The Type I error is large, approximately 26 percent, while the Type II error is significantly smaller at 11 percent. Eitiier error, however, is considerably less than expected by chance (since both groups are of equal size, we would expect a .50 probability of being classified into either group), and is probably less than those incurred by the majority of foreign-exchange managers.
The model produced an F of 3.07 witii 6 and 31 degrees of freedom, significant at the 5-percent level. This tends to indicate that the model has significant discriminatory power, although results are biased.
The only variable not included from the original set is the money-supply ratio. This is somewhat surprising; possibly the effects of money-supply changes are adequately measured by other variables such as the price-index ratio. In terms of order of entry into the function using the
© The Chicago Mercantile Exchange, 1979 www.cmegroup.com
150 SECTION 2: FORWARD-PRICING EFFICIENCY
TABLE 2 CLASSIFICATION MATRIX
Actual
Devaluation Group Control Group
Number Correct
Type I 14 Type II 17 Total 31
Predicted
Devaluation Group
14 2
Percentage Correct
74 89 82
Control Group
5 17
Percentage Error
26 11 18
n
19 19 38
stepwise discriminant technique, the price-index ratio was most important. (See Table 3 for the order of entry using the stepwise discriminant technique, a measure of the importance of each variable.)
Of the 38 countries, seven were misclassified; five of these were devaluing countries (Uruguay, Venezuela, Iceland, Denmark, and Israel) erroneously classified as control-group countries. The two control-group countries erroneously classified as devaluing countries were Turkey and India. To some extent, these misses can be explained by a consideration of special circumstances. Israel was drained of foreign exchange in 1967 by the Six Days War. Denmark and Iceland devalued in 1967, not because of existing balance-of-payments difficulties, but rather because of the devaluation of sterling, the currency of their principal trading partner, and the currency used by Danish and Icelandic monetary authorities for support intervention in foreign-exchange markets. The misses on Turkey and India are also interesting since botii countries devalued their currencies in subsequent periods. The model spotted a fundamentally unsound situation but erred on the classification because of timing.
TABLE 3 RELATIVE IMPORTANCE OF EACH VARIABLE
Variable Number
1 3 4 5 6 7
Discriminant Coefficient
.03631 - .04571
.00787 - .01981 - .00325 -1.16950
Standard Deviation
26.0928 29.0885 41.3187 35.8134 29.1911
.1229
Relative Contribution
.94723 -1.32964
.32518 - .70946 - .09487 - .14373
Rank by Relative
Contribution
2 1 4 3 6 5
© The Chicago Mercantile Exchange, 1979 www.cmegroup.com
Exchange-Rate Changes 151
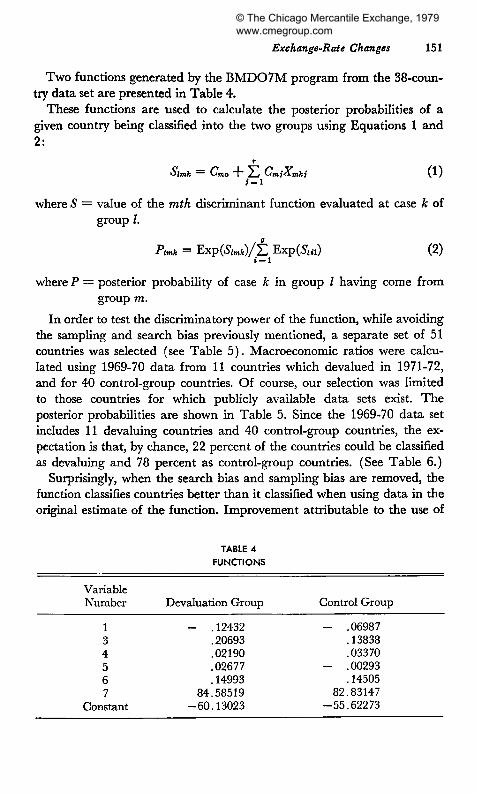
Two functions generated by the BMD07M program from the 38-coun-try data set are presented in Table 4.
These functions are used to calculate the posterior probabilities of a given country being classified into the two groups using Equations 1 and 2:
r Oimt = C m o "T~ 2-i (-'mjXmki ( 1 )
J = l
where S = value of the mth discriminant function evaluated at case k of group I.
Plmk = Exp(Slmh)/± ExpOS,*) (2) i = l
where P = posterior probability of case k in group I having come from group m.
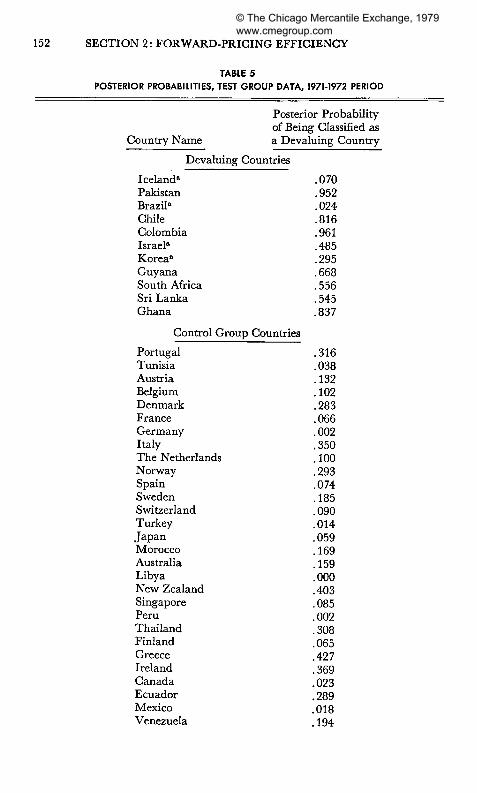
In order to test the discriminatory power of die function, while avoiding die sampling and search bias previously mentioned, a separate set of 51 countries was selected (see Table 5). Macroeconomic ratios were calculated using 1969-70 data from 11 countries which devalued in 1971-72, and for 40 control-group countries. Of course, our selection was limited to those countries for which publicly available data sets exist. The posterior probabilities are shown in Table 5. Since the 1969-70 data set includes 11 devaluing countries and 40 control-group countries, the expectation is that, by chance, 22 percent of the countries could be classified as devaluing and 78 percent as control-group countries. (See Table 6.)
Surprisingly, when the search bias and sampling bias are removed, the function classifies countries better than it classified when using data in the original estimate of the function. Improvement attributable to the use of
TABLE 4 FUNCTIONS
Variable Number
1 3 4 5 6 7
Constant
Devaluation Group
- .12432 .20693 .02190 .02677 .14993
84.58519 -60.13023
Control Group
- .06987 .13838 .03370
- .00293 .14505
82.83147 -55.62273
© The Chicago Mercantile Exchange, 1979 www.cmegroup.com
152 SECTION 2: FORWARD-PRICING EFFICIENCY
TABLE 5
POSTERIOR PROBABILITIES, TEST GROUP DATA, 1971-1972 PERIOD
Posterior Probability of Being Classified as
Country Name
Devaluing
Iceland" Pakistan Brazil" Chile Colombia Israel" Korea" Guyana South Africa Sri Lanka Ghana
Control Grot:
Portugal Tunisia Austria Belgium Denmark France Germany Italy The Netherlands Norway Spain Sweden Switzerland Turkey Japan Morocco Australia Libya New Zealand Singapore Peru Thailand Finland Greece Ireland Canada Ecuador Mexico Venezuela
a Devaluing Country
Countries
.070
.952
.024
.816
.961
.485
.295
.668
.556
.545
.837
ip Countries
.316
.038
.132
.102
.283
.066
.002
.350
.100
.293
.074
.185
.090
.014
.059
.169
.159
.000
.403
.085
.002
.308
.065
.427
.369
.023
.289
.018
.194
© The Chicago Mercantile Exchange, 1979 www.cmegroup.com
Exchange-Rate Changes 153
TABLE 5 (cont.)
Country Name
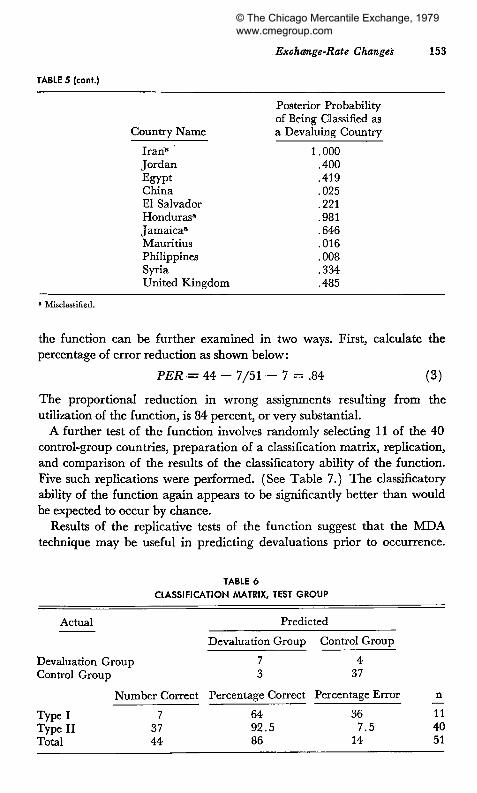
Iran" Jordan Egypt China El Salvador Honduras" Jamaica" Mauritius Philippines Syria United Kingdom
Posterior Probability of Being Classified as a Devaluing Country
1.000 .400 .419 .025 .221 .981 .646 .016 .008 .334 .485
a Misclassified.
the function can be further examined in two ways. First, calculate the percentage of error reduction as shown below:
PER = 44 - 7/51 — 7 = .84 (3)
The proportional reduction in wrong assignments resulting from the utilization of the function, is 84 percent, or very substantial.
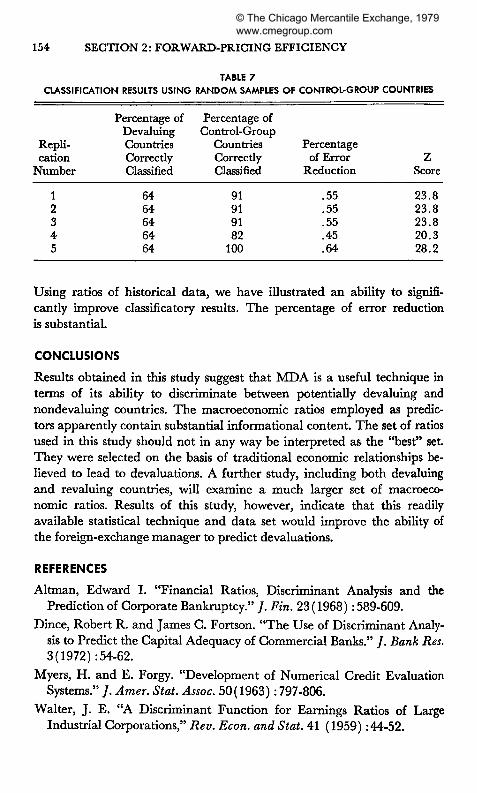
A further test of the function involves randomly selecting 11 of the 40 control-group countries, preparation of a classification matrix, replication, and comparison of die results of the classificatory ability of the function. Five such replications were performed. (See Table 7.) The classificatory ability of the function again appears to be significantly better than would be expected to occur by chance.
Results of the replicative tests of the function suggest that the MDA technique may be useful in predicting devaluations prior to occurrence.
TABLE 6 CLASSIFICATION MATRIX, TEST GROUP
Actual Predicted
Devaluation Group Control Group
Devaluation Group 7 4 Control Group 3 37
Number Correct Percentage Correct Percentage Error
Type I 7 64 36 Type II 37 92.5 7.5 Total 44 86 14
n
11 40 51
© The Chicago Mercantile Exchange, 1979 www.cmegroup.com
154 SECTION 2: FORWARD-PRICING EFFICIENCY
TABLE 7 CLASSIFICATION RESULTS USING RANDOM SAMPLES OF CONTROL-GROUP COUNTRIES
Replication
Number
1 2 3 4 5
Percentage of Devaluing Countries Correcdy Classified
64 64 64 64 64
Percentage of Control-Group
Countries Correcdy Classified
91 91 91 82
100
Percentage of Error
Reduction
.55
.55
.55
.45
.64
Z Score
23.8 23.8 23.8 20.3 28.2
Using ratios of historical data, we have illustrated an ability to significantly improve classificatory results. The percentage of error reduction is substantial.
CONCLUSIONS
Results obtained in this study suggest that MDA is a useful technique in terms of its ability to discriminate between potentially devaluing and nondevaluing countries. The macroeconomic ratios employed as predictors apparently contain substantial informational content. The set of ratios used in this study should not in any way be interpreted as the "best" set They were selected on the basis of traditional economic relationships believed to lead to devaluations. A further study, including both devaluing and revaluing countries, will examine a much larger set of macroeconomic ratios. Results of this study, however, indicate that this readily available statistical technique and data set would improve the ability of the foreign-exchange manager to predict devaluations.
REFERENCES
Altaian, Edward I. "Financial Ratios, Discriminant Analysis and the Prediction of Corporate Bankruptcy." / . Fin. 23 (1968) : 589-609.
Dince, Robert R. and James C. Fortson. "The Use of Discriminant Analysis to Predict the Capital Adequacy of Commercial Banks." / . Bank Res. 3(1972): 54-62.
Myers, H. and E. Forgy. "Development of Numerical Credit Evaluation Systems." / . Amer. Stat. Assoc. 50(1963): 797-806.
Walter, J. E. "A Discriminant Function for Earnings Ratios of Large Industrial Corporations," Rev. Econ. and Stat. 41 (1959):44-52.
© The Chicago Mercantile Exchange, 1979 www.cmegroup.com