Embed Size (px)
Citation preview
8/8/2019 Reval of Fixed Assets
http://slidepdf.com/reader/full/reval-of-fixed-assets 1/30
8/8/2019 Reval of Fixed Assets
http://slidepdf.com/reader/full/reval-of-fixed-assets 2/30
1. Introduction
This paper tests whether revaluations of fixed assets by UK firms are asso-
ciated with future firm performance, as measured by ex post realized operating
income and cash flow from operations. Our motivation for the inquiry stems
from the current debate among managers, investors, accounting standard-
setters, and capital market regulators about disclosure and recognition of
long-term nonfinancial assets at estimated value, rather than at depreciated
historical cost. Current values of assets likely are relevant to financial statement
users. However, US accounting standard-setters and others have expressed
concern that long-term non financial asset values are not reliably estimable. The
estimates’ potential lack of reliability derives from uncertainties inherent in the
estimation and from effects of the management discretion such estimationuncertainties admit. Although managers can exercise their discretion oppor-
tunistically, thereby reducing the estimates’ reliability, managers also can use
their discretion to reflect their private information. If asset revaluations reflect
asset values and are timely, we will find a positive association between revalu-
ations and future changes in firm performance. If revaluation amounts are
unreliable, we will not find a significant association.
We focus on UK firms because UK generally accepted accounting principles
(GAAP) permit fixed assets to be recognized in financial statements at revaluedamounts. Many publicly traded UK firms revalue assets, resulting in a large
sample of firms for our tests. Under UK GAAP, managers can increase or
decrease the carrying value of assets when asset values change. Thus, UK asset
revaluations provide an opportunity to test whether firms’ estimates of fixed
asset fair values reflect managers’ expectations about future firm performance.
We focus on upward revaluations because upward revaluations are discretion-
ary and not permitted under US GAAP, whereas, as under US GAAP, down-
ward revaluations are required when asset values fall.Prior research investigating asset revaluations by UK and Australian
firms focuses primarily on the relation between revaluation amounts and
share prices and/or returns (e.g., Amir et al., 1993; Easton et al., 1993; Barth
and Clinch, 1996; Barth and Clinch, 1998). Prices and returns summarize
not only investors’ assessments of firms’ asset values and expectations
about future operating performance, but also effects of firms’ investing and
financing decisions, e.g., associated with relaxing contracting constraints. Thus,
as Bernard (1993) points out, market-based tests provide only indirect evidenceabout the relation between asset revaluations and future operating performance.
We provide direct evidence on this relation. Such evidence is potentially
useful for analysis of financial statements containing revaluations and comp-
lements evidence based on share prices and returns (Bernard, 1993). Prior
research on UK asset revaluations focuses on revaluations by cross-listed firms
and does not investigate the contemporaneous relation between revaluations
150 D. Aboody et al. / Journal of Accounting and Economics 26 (1999) 149–178
8/8/2019 Reval of Fixed Assets
http://slidepdf.com/reader/full/reval-of-fixed-assets 3/30
These two motivations represent 45% and 40% of survey responses, respectively. The next most
commonly cited reason was mentioned by only 6% of respondents.
and returns. Thus, we also present findings from market-based tests for our
sample.
To test whether asset revaluations are positively associated with future
performance, we estimate the relation between upward fixed asset revaluations
by UK firms from 1983 to 1995 and changes in operating performance over the
subsequent one to three years. The analyses are based on handcollected revalu-
ation data for over 5,000 firm year observations. We define operating perfor-
mance as, alternatively, operating cash flows and operating accounting income,
before depreciation, amortization, and gains on asset disposals. Our tests con-
trol for current year changes in operating performance, risk, growth, and size. As
predicted, we find consistent evidence that current year revaluations are posit-
ively associated with changes in operating performance over all three horizons.
In our market-based tests, we estimate the relation between share prices andthe revaluation balance, net income, and book value of equity, where the
revaluation balance is the difference between revalued fixed assets measured at
the recognized revalued amount and at historical cost. As predicted, we find that
the revaluation balance is significantly positively related to share prices. We also
test the association between current year upward revaluations and returns.
Because when to revalue assets is management’s choice, this analysis provides
direct evidence on whether investors perceive revaluations as timely, i.e., the
revaluation occurs in the year asset values change. We find, as predicted, thatrevaluations are significantly positively related to returns, indicating that upward
UK revaluations reflect at least some changes in asset values on a timely basis.
Easton et al. (1993) report survey evidence that the primary reason Australian
managers revalue assets is to present true and fair financial statements. Our
analyses can be viewed as testing this motivation. Their survey also indicates
that the second most common motivation is to affect debt-to-equity ratios,
perhaps for debt contracting reasons. Thus, we estimate our equations permit-
ting the coefficients on revaluation variables to vary with debt-to-equity ratios,where equity excludes the revaluation balance. Consistent with a motive of
affecting the debt-to-equity ratio rather than solely presenting true and fair
financial statements, we find that the relation between revaluations and future
operating performance is weaker for firms with higher debt-to-equity ratios. We
also find an analogous weaker relation between revaluation amounts and share
prices and returns, indicating the weaker valuation effects associated with future
performance are not dominated by positive valuation effects associated with
relaxing debt constraints.Prior UK asset revaluation studies focus on cross-listed firms and provide
evidence of a significant negative relation between share prices and revaluation
D. Aboody et al. / Journal of Accounting and Economics 26 (1999) 149–178 151
8/8/2019 Reval of Fixed Assets
http://slidepdf.com/reader/full/reval-of-fixed-assets 4/30
balances, in contrast to our full sample findings. To investigate this inconsist-
ency, we permit the relations we test to differ for cross-listed firms. All findings
for non cross-listed firms are consistent with our full sample findings. However,
for cross-listed firms, although we find a significantly positive relation between
asset revaluations and future changes in operating income, the relation between
revaluations and future changes in cash from operations is insignificant. Also,
consistent with prior research, we find that asset revaluations by cross-listed
firms are negatively associated with share prices, suggesting investors’ assess-
ments of revaluations by these firms do not only reflect the revaluations’ relation
with future operating income.
Although a positive correlation between revaluations and firms’ investing in
operating entities can affect our tests, additional analyses find no evidence that
firms’ acquisition activity systematically affects the relation between revalu-ations and future performance or returns. We also we find that revaluations
before 1990, a period of increasing asset values, are more significantly related to
future performance and returns than those after 1990, a period of volatile
economic conditions.
Overall, our findings indicate revaluations reflect changes in values of assets
associated with future operating performance, and at least a portion is timely.
Taken together, the findings do not support claims that fixed assets’ fair values
are not reliably estimable. However, the findings also indicate that differingmotivations for revaluations can affect the relation between revaluations and
future performance, prices, and returns.
The paper proceeds as follows. Section 2 describes UK GAAP for asset
revaluations and discusses related research. UK revaluation activity is described
in Section 3. Sections 4 and 5 specify and present findings from our future
performance and market-based tests, respectively. Section 6 discusses findings
from additional analyses, including investigating debt-to-equity ratios as mo-
tivations for revaluations. Section 7 provides a summary and concluding re-marks.
2. UK accounting for fixed asset revaluations and relation to prior research
2.1. UK GAAP for fi xed asset revaluations
Companies Act of 1985 sets forth UK GAAP for asset revaluations, specifi-cally, Alternative Accounting Rules, Part C, Schedule 4. UK GAAP permits
upward revaluations of long-lived assets, including many types of intangible
assets, but not goodwill. Downward revaluations are required for all long-lived
assets, including goodwill, when the asset’s carrying amount exceeds its net
realizable value. Few UK firms revalue intangible assets, whereas revaluations
of tangible fixed assets, i.e., land, buildings, plant, and equipment, are common.
152 D. Aboody et al. / Journal of Accounting and Economics 26 (1999) 149–178
8/8/2019 Reval of Fixed Assets
http://slidepdf.com/reader/full/reval-of-fixed-assets 5/30
This differs from Australian GAAP, under which the portion of the revaluation reserve realized
through asset disposal cannot be taken to earnings.
For example, (1) Australian companies frequently revalue long-term investments and intangible
assets, as well as long-lived tangible assets (Barth and Clinch, 1998). (2) Australian firms seem to
more often have a practice of periodic asset revaluations, e.g., every three years, whereas UK
revaluations are less consistently periodic. (3) UK GAAP permits considerable discretion regarding
which assets are revalued. Under Australian GAAP, if one asset in a class is revalued, then all assets
in that class must be revalued. It also is possible that UK and Australian firms systematically
differently exercise discretion, e.g., in determining revaluation amounts. See Barth and Clinch (1996)
and Easton et al. (1993) for summaries of UK and Australian GAAP related to asset revaluations.
Thus, our tests focus on revaluations of tangible fixed assets. UK Statement of
Standard Accounting Practice No. 12 encourages revaluations of tangible fixed
assets on the ground that they provide “useful and relevant information to users
of accounts”.
Under UK GAAP, the difference between an asset’s carrying amount and its
revalued amount is credited to a separate equity revaluation reserve account if
the revaluation results in an increase in the asset’s carrying amount, i.e., an
upward revaluation. Largely at management’s discretion, transfers are permit-
ted between the revaluation reserve account and other equity reserves. Revalu-
ations affect earnings by (1) depreciation charges, which are based on the
revalued amount; (2) a downward revaluation, when it exceeds a previously
recognized upward revaluation of the same asset; and (3) a gain or loss on
disposition of the asset, which is based on the asset’s carrying amount, includingany associated revaluation reserve. Transfers are permitted from the revalu-
ation reserve to the profit and loss reserve for depreciation expense associated
with revaluations. Required disclosures under UK GAAP include the details of
changes to revaluation reserves, which, as described in Section 3, we use to
enhance the accuracy of our revaluation variables.
2.2. Relation to prior research
Prior asset revaluation research investigates the relation between revaluation
amounts and share prices and/or returns. Asset revaluations are permitted under
UK and Australian GAAP and, except for the treatment of realized revaluation
gains described in footnote 2, UK and Australian GAAP rules are similar.
However, revaluation practices in the two countries can differ, potentially result-
ing in differences in revaluations’ characteristics. Thus, some related research
focuses on UK revaluations and some focuses on Australian revaluations.
Prior research does not document a significantly positive relation betweenUK revaluations, the subject of this study, and share prices or returns. Although
Standish and Ung (1982) find a positive market reaction to upward revaluation
announcements from 1964 to 1973, a period that predates UK GAAP guidelines
D. Aboody et al. / Journal of Accounting and Economics 26 (1999) 149–178 153
8/8/2019 Reval of Fixed Assets
http://slidepdf.com/reader/full/reval-of-fixed-assets 6/30
Amir et al.’s (1993) sample includes Australian and UK firms, but their sample comprises
predominantly UK firms. Regarding interpretation of the findings of Barth and Clinch (1996) and
Amir et al. (1993), note that these authors define their revaluation balance variable as book value of
equity under US GAAP minus book value of equity under UK GAAP. Because the revaluation
balance causes book value of equity under UK GAAP to exceed book value of equity under US
GAAP, their revaluation balance variables are negative. We define RE» to be the positive amount of
the revaluation balance. Amir et al. (1993) (Table 11, Panel A) and Barth and Clinch (1996) (Table 4,
Panel B) report positive coefficients on book value of equity and their revaluation balance variable,
where the coefficients on book value of equity are smaller than those on the revaluation balancevariables. These coefficient estimates, coupled with Amir et al.’s (1993) and Barth and Clinch’s (1996)
revaluation balance variable definition, are consistent with a negative relation between the revalu-
ation balance component of book value of equity and share prices.
For a sample of Australian cross-listed firms, Barth and Clinch (1996) report a negative relation
between revaluation balances and share prices, consistent with findings based on UK cross-listed
firms, although small sample size precludes them from making strong inferences. We test for
differences between cross-listed and non cross-listed firms in Section 6.2.
for asset revaluations, the reaction is not correlated with the magnitude of the
revaluation. More recent studies focus on UK firms that cross-list securities in
US capital markets and provide evidence of a negative relation between share
prices and revaluation balances (Amir et al., 1993; Barth and Clinch, 1996).
Because these studies focus on UK-to-US GAAP reconciling items, they do not
investigate the relation between current year revaluations and returns.
Evidence on Australian revaluations generally supports their value-relevance.
Sharpe and Walker (1975) find a positive market reaction to revaluation an-
nouncements from 1960— 1970, a period that predates Australian GAAP guide-
lines for asset revaluations, although Brown and Finn (1980) suggest Sharpe and
Walker’s findings could be attributable to confounding contemporaneous an-
nouncements. More recently, Easton et al. (1993) find that although revaluation
increments have weak explanatory power for returns, the revaluation reservehas significant explanatory power for prices. They interpret their findings as
evidence that Australian revaluations are value-relevant, but not always timely.
Barth and Clinch (1998) investigate the relation between prices and returns and
Australian revaluations by asset class, among other partitions. They find consis-
tent evidence of value-relevance for investments and intangible assets, but
somewhat inconsistent evidence of value-relevance for property, plant, and
equipment revaluations, the focus of our study.
Our study’s primary contribution to extant asset revaluation literature istesting whether revaluations are associated with realized future operating per-
formance, as suggested by Bernard (1993) in his discussion of Easton et al.
(1993). Prior research focuses on testing the relation between asset revaluations
and expectations about future performance, as reflected in share prices and
returns. Prices and returns reflect not only investors’ expectations about future
operating performance, but also the valuation implications of managements’
154 D. Aboody et al. / Journal of Accounting and Economics 26 (1999) 149–178
8/8/2019 Reval of Fixed Assets
http://slidepdf.com/reader/full/reval-of-fixed-assets 7/30
Our tests will detect associations between future performance and revaluations of not only
operating assets, but also non operating assets whose value changes are correlated with future
changes in operating performance. For example, if real estate values increase and the increase is
correlated with increases in future performance, e.g., because of inflation, then we will detect
a significant relation between revaluations and future changes in operating performance. In either
case, revaluations provide information about changes in future operating performance.
financing and investing decisions. Thus, one could observe a positive relation
between revaluations and share prices and returns and an insignificant relation
between revaluations and changes in future operating performance. For
example, investors might increase their assessments of firm value when high
debt-to-equity ratio firms upwardly revalue assets because doing so reduces the
probability of debt default, even if the revaluations do not reflect changes in
asset values. Similarly, investors in UK firms might increase their assessment of
firm value because of anticipated benefits associated with relaxing a constraint
on acquisitions imposed by the London Stock Exchange (LSE) (Muller, 1998).
We investigate these examples in Sections 6.1 and 6.3. Also, because our operat-
ing performance measures exclude gains and losses on asset disposals, values of
assets not associated with operations could increase without correlated in-
creases in future operating performance.Focusing on future operating performance also has limitations. For example,
we have available only a few subsequent years of realized performance, reducing
our ability to detect a significant relation between revaluations of long-lived
fixed assets and future performance. Also, if firms’ investments in operating
entities are positively associated with revaluations, one could observe a positive
relation between revaluations and future operating performance that is attribu-
table to the effects of acquisitions on future operations. We investigate this in
Section 6.3.Relating revaluations to future realized operating income and/or cash from
operations provides direct evidence on the association between revaluations and
future operating performance and complements findings from price and returns
specifications. We also contribute to extant literature by documenting that UK
asset revaluations are significantly positively related to share prices and returns
for a large sample of firms that do not necessarily cross-list their equity securities
in US capital markets.
3. UK revaluation activity
We obtain data for our analyses from Datastream International (DI), which
includes market and accounting data for all UK industrial commercial firms. DI
includes 11,319 firm-year observations from 1983 to 1995 associated with 1,236
firms. We use the UK-domiciled DI database because it is more comprehensive
D. Aboody et al. / Journal of Accounting and Economics 26 (1999) 149–178 155
8/8/2019 Reval of Fixed Assets
http://slidepdf.com/reader/full/reval-of-fixed-assets 8/30
This process also enables us to verify the accuracy of the DI database. Specifically, we compared
all data that we use from the database to firms’ published financial statements. We noted only three
discrepancies related to the 5,485 firm-year observations we verified.
Note that because any marketwide index is the same for all firms in a given year, our fixed-year
effects estimation procedure described below precludes including it as an additional explanatory
variable. Its effects are reflected in the year-specific intercept.
for UK firms than other databases used in prior research, such as Global
Vantage. For example, DI provides cash flow data for UK firms, which is central
to our analyses, but Global Vantage does not. We handcollect from firms’
annual reports the details necessary to construct each year’s revaluation bal-
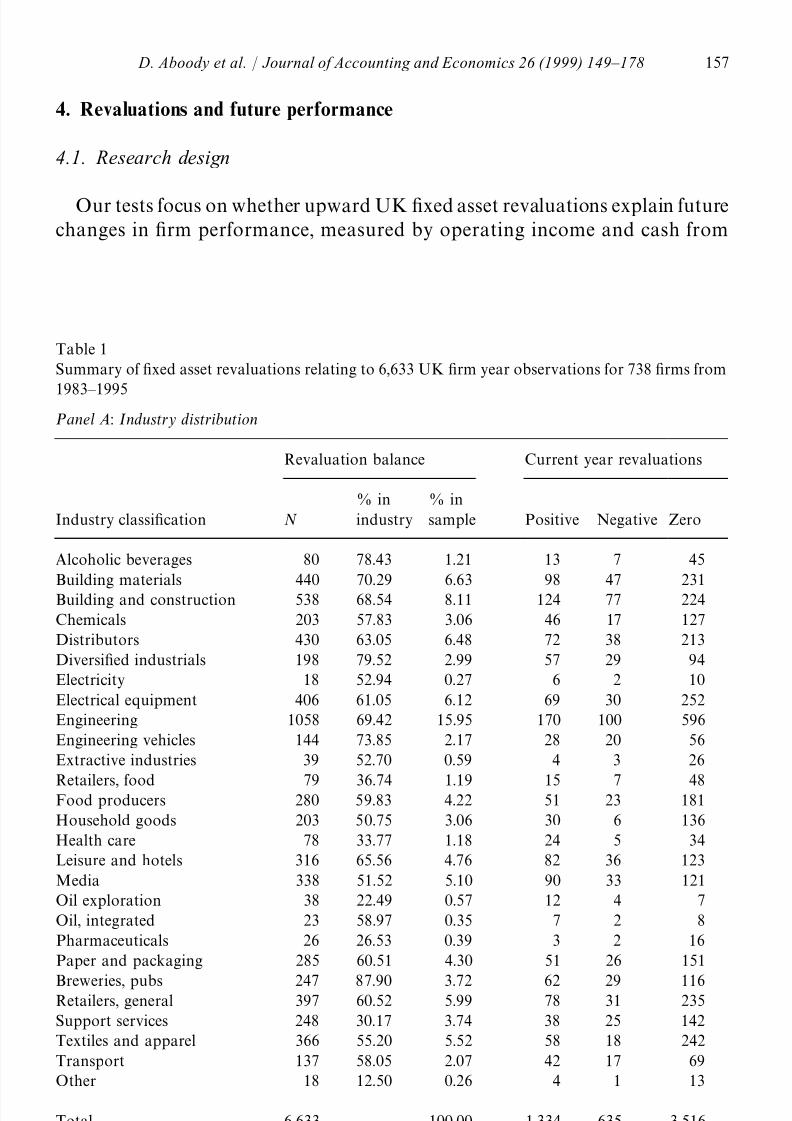
ance, and to identify precisely the amount of each current year revaluation.Table 1 presents descriptive statistics relating to UK fixed asset revaluation
activity. Panel A (Panel B) presents statistics by industry (by year). Panel
A reveals that upward revaluations are common in the UK; 6,633 of the possible
11,319 firm-year observations, 58.9%, have a non zero revaluation balance.
These revaluations are associated with 738 firms. Although revaluations are not
evenly distributed across industries, all but one of 32 DI industry classifications
have at least one observation with a non zero revaluation balance. However, in
no industry did all firms upwardly revalue fixed assets; the percentage rangesfrom 22.49 to 87.90. Panel A also reveals that current year revaluation data are
available for 5,485 observations; we are unable to locate 1,148 financial state-
ments, associated with 112 firms, on microfiche or on Laser Disclosure. Of the
available observations, 1,334 or 24.3% relate to upward current year revalu-
ations, which are the focus of this study, and 635 or 11.6% relate to downward
revaluations.
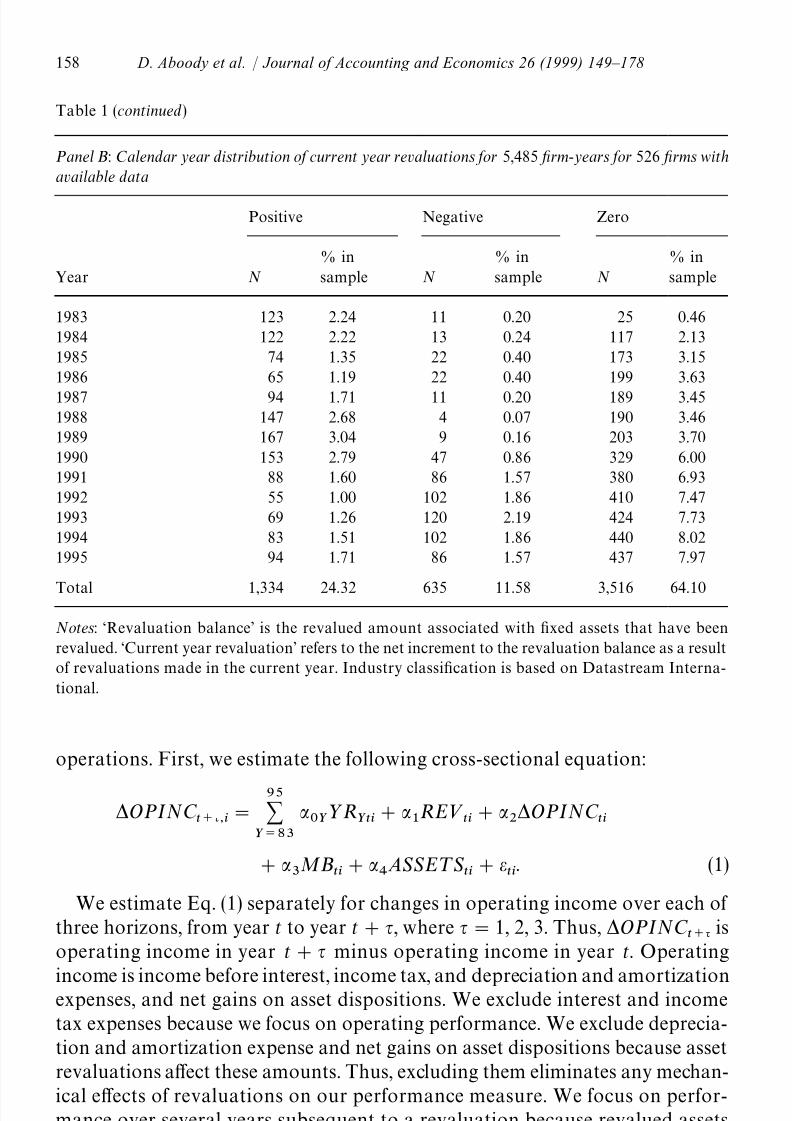
Untabulated statistics reveal that sample firms revalue at least some fixed
assets on average every 4.6 years, and the median is 3.5 years. However, Table 1,Panel B, reveals that although many firms revalue assets in each year, there are
noticeably more revaluations since the late 1980s. Also, revaluations are pre-
dominantly upward (downward) before (after) 1990. This shift coincides with
increased volatility in UK economic conditions evidenced by the Financial
¹imes UK real estate index, which increased steadily from 1985 to 1989 and then
dropped precipitously from 1989 to 1992. In 1993 it increased dramatically and
then began to slide again through 1995, falling back to approximately its 1987
level. Untabulated statistics reveal no significant association between the realestate index and the proportion of positive revaluations in a given year or with
one-year lead or lagged revaluations. This lack of correlation suggests revalu-
ations do not simply reflect changes in asset values associated with general
market conditions. Rather, it suggests either that values of revalued assets
depend on firm-specific factors or revaluations do not capture value changes.
Findings reported below of significant relations between revaluations and future
performance and returns indicate the former is a more plausible explanation.
156 D. Aboody et al. / Journal of Accounting and Economics 26 (1999) 149–178
8/8/2019 Reval of Fixed Assets
http://slidepdf.com/reader/full/reval-of-fixed-assets 9/30
4. Revaluations and future performance
4.1. Research design
Our tests focus on whether upward UK fixed asset revaluations explain future
changes in firm performance, measured by operating income and cash from
Table 1
Summary of fixed asset revaluations relating to 6,633 UK firm year observations for 738 firms from
1983— 1995
Panel A: Industry distribution
Revaluation balance Current year revaluations
% in % in
Industry classification N industry sample Positive Negative Zero
Alcoholic beverages 80 78.43 1.21 13 7 45
Building materials 440 70.29 6.63 98 47 231
Building and construction 538 68.54 8.11 124 77 224
Chemicals 203 57.83 3.06 46 17 127
Distributors 430 63.05 6.48 72 38 213
Diversified industrials 198 79.52 2.99 57 29 94
Electricity 18 52.94 0.27 6 2 10
Electrical equipment 406 61.05 6.12 69 30 252
Engineering 1058 69.42 15.95 170 100 596
Engineering vehicles 144 73.85 2.17 28 20 56
Extractive industries 39 52.70 0.59 4 3 26
Retailers, food 79 36.74 1.19 15 7 48Food producers 280 59.83 4.22 51 23 181
Household goods 203 50.75 3.06 30 6 136
Health care 78 33.77 1.18 24 5 34
Leisure and hotels 316 65.56 4.76 82 36 123
Media 338 51.52 5.10 90 33 121
Oil exploration 38 22.49 0.57 12 4 7
Oil, integrated 23 58.97 0.35 7 2 8
Pharmaceuticals 26 26.53 0.39 3 2 16
Paper and packaging 285 60.51 4.30 51 26 151
Breweries, pubs 247 87.90 3.72 62 29 116Retailers, general 397 60.52 5.99 78 31 235
Support services 248 30.17 3.74 38 25 142
Textiles and apparel 366 55.20 5.52 58 18 242
Transport 137 58.05 2.07 42 17 69
Other 18 12.50 0.26 4 1 13
Total 6,633 100.00 1,334 635 3,516
D. Aboody et al. / Journal of Accounting and Economics 26 (1999) 149–178 157
8/8/2019 Reval of Fixed Assets
http://slidepdf.com/reader/full/reval-of-fixed-assets 10/30
operations. First, we estimate the following cross-sectional equation:
OPINCR>OG
"
7
7
½R7RG
#
RE»RG
#OPINC
RG
#
MBRG
#
ASSE¹SRG
#RG
. (1)
We estimate Eq. (1) separately for changes in operating income over each of
three horizons, from year t to year t#, where "1, 2, 3. Thus, OPINCR>O
is
operating income in year t# minus operating income in year t. Operating
income is income before interest, income tax, and depreciation and amortizationexpenses, and net gains on asset dispositions. We exclude interest and income
tax expenses because we focus on operating performance. We exclude deprecia-
tion and amortization expense and net gains on asset dispositions because asset
revaluations affect these amounts. Thus, excluding them eliminates any mechan-
ical effects of revaluations on our performance measure. We focus on perfor-
mance over several years subsequent to a revaluation because revalued assets
Table 1 (continued)
Panel B: Calendar year distribution of current year revaluations for 5,485 firm-years for 526 firms with
available data
Positive Negative Zero
Year N
% in
sample N
% in
sample N
% in
sample
1983 123 2.24 11 0.20 25 0.46
1984 122 2.22 13 0.24 117 2.13
1985 74 1.35 22 0.40 173 3.15
1986 65 1.19 22 0.40 199 3.63
1987 94 1.71 11 0.20 189 3.451988 147 2.68 4 0.07 190 3.46
1989 167 3.04 9 0.16 203 3.70
1990 153 2.79 47 0.86 329 6.00
1991 88 1.60 86 1.57 380 6.93
1992 55 1.00 102 1.86 410 7.47
1993 69 1.26 120 2.19 424 7.73
1994 83 1.51 102 1.86 440 8.02
1995 94 1.71 86 1.57 437 7.97
Total 1,334 24.32 635 11.58 3,516 64.10
Notes: ‘Revaluation balance’ is the revalued amount associated with fixed assets that have been
revalued. ‘Current year revaluation’ refers to the net increment to the revaluation balance as a result
of revaluations made in the current year. Industry classification is based on Datastream Interna-
tional.
158 D. Aboody et al. / Journal of Accounting and Economics 26 (1999) 149–178
8/8/2019 Reval of Fixed Assets
http://slidepdf.com/reader/full/reval-of-fixed-assets 11/30
Changes in future performance over the three horizons are not perfectly correlated. Un-
tabulated Pearson correlations between one-year ahead changes in operating income (cash from
operations) and two- and three-year ahead changes in operating income (cash from operations) are
0.60 and 0.49 (0.66 and 0.53). Spearman correlations are similar in magnitude.
Regarding the one-year horizon, it is possible that management observes performance for the first
few months of the first subsequent year before deciding to revalue assets as of the prior year.
Although such behavior enhances our ability to detect a relation between revaluations and future
performance, it does not alter our inferences. That is, if managers revalue assets when performance
increases, then revaluations reflect changes in performance. Also, if the change in performance is
transitory and, thus, the revaluation was not based on anticipated long-term increases in perfor-mance, then we will not observe a significant relation in the two- and three-year ahead performance
tests. Nonetheless, to ensure our findings are insensitive to this potential confounding factor, we
estimated Eq. (1) using year t #1 as the base year. Our inferences regarding the association between
revaluations and changes in performance for the year t#2 and t#3 specifications are unaffected.
Also, lack of availability of data and information preclude us from designing more refined tests
relating to performance effects specific to particular assets. To the extent our performance measures
are imprecise, we will be unable to find evidence supporting our predictions.
are long-term and, thus, the operating effects of changes in their values occur
over several years. Lack of availability of subsequent data limits our tests to
three future years. We present findings for each horizon, even though they are
not independent, because we are uncertain when the future performance effects
will be evident.RE»
Ris the revaluation in year t, i.e., the increase to the revaluation reserve in
a particular year as a result of revaluing fixed assets. Its estimated coefficient,
,
is the focus of our inquiry. If revaluations reflect changes in values of assets
associated with operations, then revaluations will be positively associated with
future changes in performance and, thus, we predict
to be positive. However,
estimating values of fixed assets is subjective and prone to estimation error.
Thus, testing this prediction also provides evidence on whether managers of UK
firms use their discretion in revaluing fixed assets to recognize amounts thatreflect asset values. If they do, we will observe a positive relation between
revaluations and future changes in performance. However, to the extent man-
agement exercises its discretion opportunistically, recognized asset revaluations
will not reflect changes in asset values, and we will not observe a significant
positive relation. Our ability to detect a significant relation also is reduced to the
extent revaluations reflect changes in future performance beyond three years
because our tests likely do not capture the full effect of changes in future
performance.The change in operating income from year t!1 to year t, OPINC
R, controls
for the time-series properties of earnings that can affect future operating income.
The market-to-book ratio, where book value of equity excludes the revaluation
balance, MBR, controls for potential effects of risk and growth (Fama and
French, 1992). The logarithm of total assets at the end of year t, excluding the
D. Aboody et al. / Journal of Accounting and Economics 26 (1999) 149–178 159
8/8/2019 Reval of Fixed Assets
http://slidepdf.com/reader/full/reval-of-fixed-assets 12/30
Our inferences are unaffected by estimating the relation using undeflated variables (Barth and
Kallapur, 1996).
As specification check, following Sloan (1996), we also include change in working capital in
Eq. (1). Although it is a significant explanatory variable, it has no effect on our inferences.
We thank Ed Maydew for bringing to our attention omitted tax effects. These statistics are
based on assuming a 40% tax rate.
revaluation balance, ASSE¹SR, controls for potential effects of size. Finally, to
control for the possibility of omitted time-specific macro-economic effects, e.g.,
marketwide changes in property values, we permit the regression intercept to
vary across years. ½R7
is an indicator variable that equals one if an observation
is from year ½, and zero otherwise. We deflate both OPINC variables and
RE»R
by beginning of year t market value of equity. i represents firms.
We also estimate:
CFOR>OG
"
7
7
½R7RG
#
RE»RG
#CFO
RG#
¼C
RG
#
MBRG
#
ASSE¹SRG
# RG
. (2)
Eq. (2) is similar to Eq. (1) except for the focus on changes in cash fromoperations, CFO, and the inclusion of ¼C
R, the change in working capital
from year t!1 to year t. Both CFO variables and ¼CR
are deflated by
market value of equity at the beginning of year t. We include change in working
capital because of the documented significant association between operating
cash flows and lagged working capital accruals (e.g., Dechow, 1994). All other
variables are as previously defined. We expect current year revaluations to be
positively associated with future changes in cash from operations and, thus,
predict to be positive.
4.2. Descriptive statistics
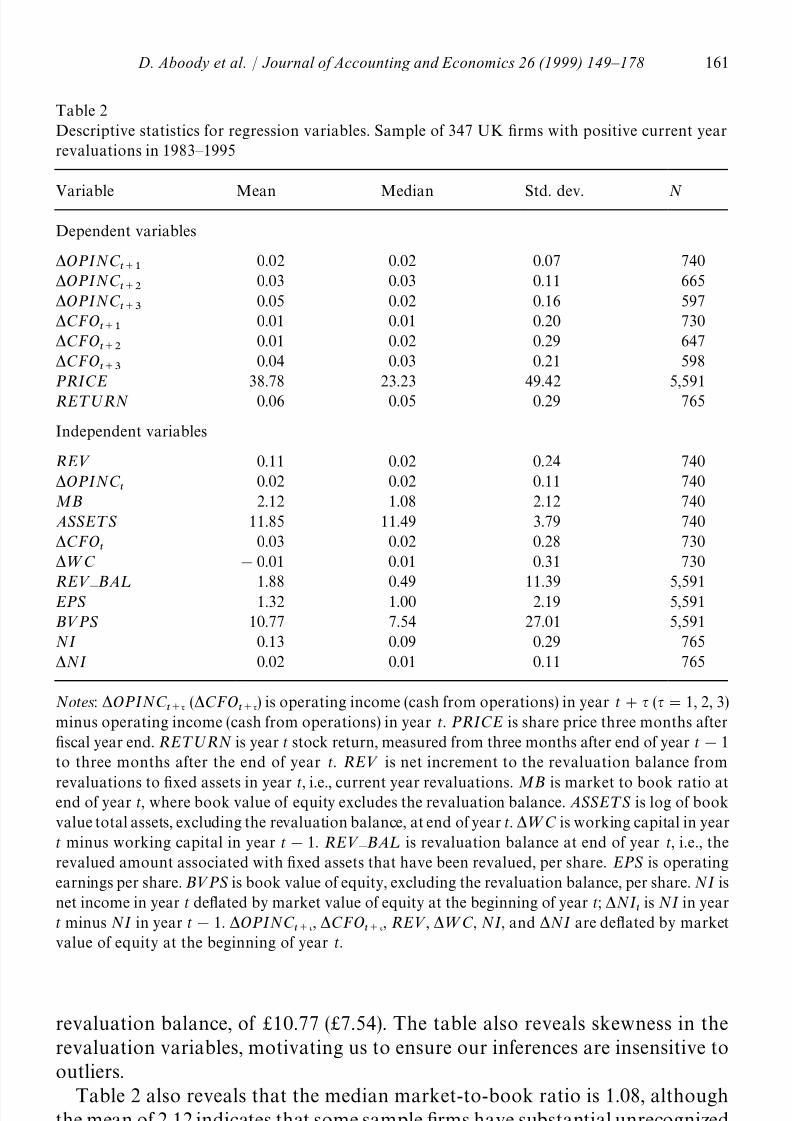
Table 2 presents descriptive statistics associated with our regression vari-
ables. It indicates that revaluations are potentially economically material; the
mean (median) of current year revaluations scaled by beginning of year market
value of equity, RE», is 11% (2%). Untabulated statistics indicate that the mean
(median) of current year revaluations, after adjusting for tax effects, scaled bybook value of equity exclusive of the revaluation balance is 9% (4%). Un-
tabulated statistics also reveal that current year revaluations are large in
relation to reported earnings; the mean (median) of revaluations, after adjusting
for tax effects, is 33% (19%) of current year net income. Table 2 shows that
mean (median) revaluation balance per share is £1.88 (£0.49), which is 17.5%
(6.5%) of the mean (median) book value of equity per share, excluding the
160 D. Aboody et al. / Journal of Accounting and Economics 26 (1999) 149–178
8/8/2019 Reval of Fixed Assets
http://slidepdf.com/reader/full/reval-of-fixed-assets 13/30
Table 2
Descriptive statistics for regression variables. Sample of 347 UK firms with positive current year
revaluations in 1983— 1995
Variable Mean Median Std. dev. N
Dependent variables
OPINCR>
0.02 0.02 0.07 740
OPINCR>
0.03 0.03 0.11 665
OPINCR>
0.05 0.02 0.16 597
CFOR>
0.01 0.01 0.20 730
CFOR>
0.01 0.02 0.29 647
CFOR>
0.04 0.03 0.21 598
PRICE 38.78 23.23 49.42 5,591
RE¹ºRN 0.06 0.05 0.29 765
Independent variables
RE» 0.11 0.02 0.24 740
OPINCR
0.02 0.02 0.11 740
MB 2.12 1.08 2.12 740
ASSE¹S 11.85 11.49 3.79 740
CFOR
0.03 0.02 0.28 730
¼C !0.01 0.01 0.31 730
RE»
— BA¸
1.88 0.49 11.39 5,591EPS 1.32 1.00 2.19 5,591
B»PS 10.77 7.54 27.01 5,591
NI 0.13 0.09 0.29 765
NI 0.02 0.01 0.11 765
Notes: OPINCR>O
(CFOR>O
) is operating income (cash from operations) in year t# ("1, 2, 3)
minus operating income (cash from operations) in year t. PRICE is share price three months after
fiscal year end. RE¹ºRN is year t stock return, measured from three months after end of year t!1
to three months after the end of year t. RE» is net increment to the revaluation balance from
revaluations to fixed assets in year t, i.e., current year revaluations. MB is market to book ratio atend of year t, where book value of equity excludes the revaluation balance. ASSE¹S is log of book
value total assets, excluding the revaluation balance, at end of year t. ¼C is working capital in year
t minus working capital in year t!1. RE»— BA¸ is revaluation balance at end of year t, i.e., the
revalued amount associated with fixed assets that have been revalued, per share. EPS is operating
earnings per share. B»PS is book value of equity, excluding the revaluation balance, per share. NI is
net income in year t deflated by market value of equity at the beginning of year t; NIR
is NI in year
t minus NI in year t!1. OPINCR>O
, CFOR>O
, RE», ¼C, NI, and NI are deflated by market
value of equity at the beginning of year t.
revaluation balance, of £10.77 (£7.54). The table also reveals skewness in the
revaluation variables, motivating us to ensure our inferences are insensitive to
outliers.
Table 2 also reveals that the median market-to-book ratio is 1.08, although
the mean of 2.12 indicates that some sample firms have substantial unrecognized
D. Aboody et al. / Journal of Accounting and Economics 26 (1999) 149–178 161
8/8/2019 Reval of Fixed Assets
http://slidepdf.com/reader/full/reval-of-fixed-assets 14/30
Observing an average market-to-book ratio above one does not indicate that sample firms are
not following UK GAAP; upward revaluations are discretionary. Also, an untabulated chi-squarestatistic reveals that firms with market-to-book ratios above (below) one, where book value of equity
excludes the revaluation balance, are significantly more likely to revalue assets upward (downward).
These extreme observations had a noticeable effect on two estimated coefficients. When these
observations are included, current year revaluations are significantly negatively related to one-year
ahead cash from operations, and insignificantly related to returns. We also eliminate one observa-
tion, which has a noticeable effect on some estimated coefficients and standard errors, but not on our
inferences regarding asset revaluations.
The procedure begins by calculating Cook’s D statistic and excludes observations with D'1.
Then, the regression is reestimated, weights for each observation are calculated based on absoluteresiduals, and the estimation is repeated using the weighted observations (Berk, 1990). This
procedure results in differing numbers of observations across specifications and can result in the
same observation having different weights in different specifications. Our inferences are unaltered if
we estimate the equations using ordinary least squares and if we remove observations with an
R-student statistic greater than three in absolute value, rather than use the robust regression
procedure. They also are unaltered using ranks of the regression variables.
We use the term significant to denote statistical significance at less than the 5% level.
net assets. Consistent with this, on average, sample firms are profitable, with
mean (median) net income per share of £1.32 (£1.00), which represents 13% (9%)
of beginning of year market value of equity. Sample firms also are growing, with
mean (median) increases in net income of 2% (1%) of beginning of year market
value of equity. They also have mean and median increases in operating income,
cash from operations, and working capital for all horizons.
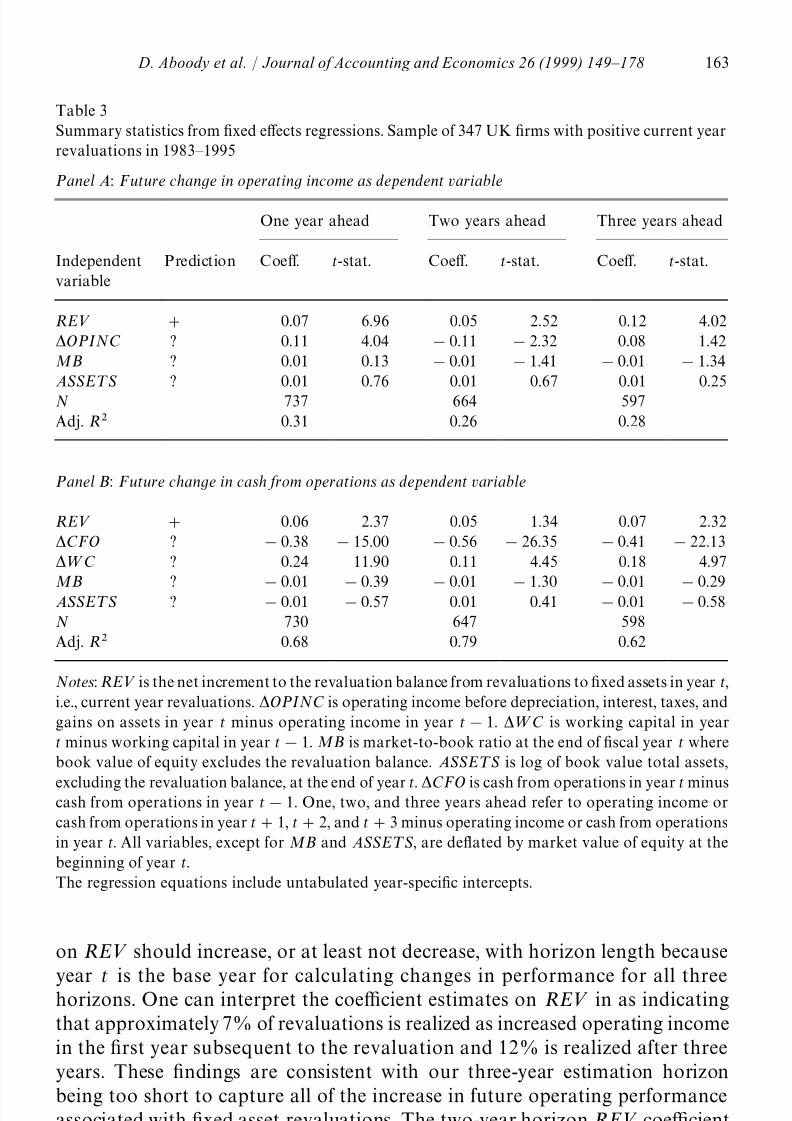
4.3. Findings relating to future firm performance
Table 3 presents regression summary statistics from Eq. (1), which relates
upward current year revaluations to future changes in firm performance. Panel
A (Panel B) presents findings for future performance defined as one-, two-, and
three-year ahead operating income (cash from operations). The reported statis-tics reflect elimination of observations for the largest 1% of current year
revaluations as a percentage of beginning of year market value of equity, which
exceeded 100%. Reported t-statistics are based on White (1980) standard
errors (Barth and Kallapur, 1996), and the estimation controls for outliers using
a robust regression technique.
Table 3, Panel A, provides strong evidence that current year revaluations are
positively associated with future performance, as measured by operating in-
come. In all three horizons, the coefficient on current year revaluations, RE», issignificantly positive as predicted (t-statistics"6.96, 2.52 and 4.02 for the one-,
two-, and three-year horizons). These findings are consistent with increases in
values of fixed assets being realized over extended time horizons, and with RE»
reflecting the value increases. If future performance is sustained, the coefficients
162 D. Aboody et al. / Journal of Accounting and Economics 26 (1999) 149–178
8/8/2019 Reval of Fixed Assets
http://slidepdf.com/reader/full/reval-of-fixed-assets 15/30
Table 3
Summary statistics from fixed effects regressions. Sample of 347 UK firms with positive current year
revaluations in 1983— 1995
Panel A: Future change in operating income as dependent variable
One year ahead Two years ahead Three years ahead
Independent
variable
Prediction Coeff. t-stat. Coeff. t-stat. Coeff. t-stat.
RE» # 0.07 6.96 0.05 2.52 0.12 4.02
OPINC ? 0.11 4.04 !0.11 !2.32 0.08 1.42
MB ? 0.01 0.13 !0.01 !1.41 !0.01 !1.34
ASSE¹S ? 0.01 0.76 0.01 0.67 0.01 0.25
N 737 664 597
Adj. R 0.31 0.26 0.28
Panel B: Future change in cash from operations as dependent variable
RE» # 0.06 2.37 0.05 1.34 0.07 2.32
CFO ? !0.38 !15.00 !0.56 !26.35 !0.41 !22.13
¼C ? 0.24 11.90 0.11 4.45 0.18 4.97
MB ?!
0.01!
0.39!
0.01!
1.30!
0.01!
0.29ASSE¹S ? !0.01 !0.57 0.01 0.41 !0.01 !0.58
N 730 647 598
Adj. R 0.68 0.79 0.62
Notes: RE» is the net increment to the revaluation balance from revaluations to fixed assets in year t,
i.e., current year revaluations. OPINC is operating income before depreciation, interest, taxes, and
gains on assets in year t minus operating income in year t!1. ¼C is working capital in year
t minus working capital in year t!1. MB is market-to-book ratio at the end of fiscal year t where
book value of equity excludes the revaluation balance. ASSE¹S is log of book value total assets,
excluding the revaluation balance, at the end of year t. CFO is cash from operations in year t minuscash from operations in year t!1. One, two, and three years ahead refer to operating income or
cash from operations in year t#1, t#2, and t#3 minus operating income or cash from operations
in year t. All variables, except for MB and ASSE¹S, are deflated by market value of equity at the
beginning of year t.
The regression equations include untabulated year-specific intercepts.
on RE» should increase, or at least not decrease, with horizon length because
year t is the base year for calculating changes in performance for all threehorizons. One can interpret the coefficient estimates on RE» in as indicating
that approximately 7% of revaluations is realized as increased operating income
in the first year subsequent to the revaluation and 12% is realized after three
years. These findings are consistent with our three-year estimation horizon
being too short to capture all of the increase in future operating performance
associated with fixed asset revaluations. The two-year horizon RE» coefficient
D. Aboody et al. / Journal of Accounting and Economics 26 (1999) 149–178 163
8/8/2019 Reval of Fixed Assets
http://slidepdf.com/reader/full/reval-of-fixed-assets 16/30
Untabulated findings reveal that the decrease in RE»’s coefficient between the one- and
two-year horizons is attributable to sample composition. In particular, estimating the Panel
A equations using observations common to all three horizon specifications results in coefficients on
RE» of 0.08, 0.10, and 0.14 for the one-, two-, and three-year ahead specifications, respectively. Theloss of observations across the three horizons results primarily from unavailability of future
performance variables for 1993 and 1994 revaluations, not from lack of survivorship of sample firms.
Estimating the relations based on the observations reported in Table 3, but using ranks of the
variables, also results in a monotonic increase in coefficient estimates with horizon length.
Approximately 1% of sample firms has negative book value of equity. Estimating all equations
omitting these firms results in untabulated inferences similar to those we tabulate.
Untabulated correlations indicate future changes in operating income and cash from opera-
tions are significantly positively correlated over all three horizons (Pearson (Spearman) correlations
equal 0.25, 0.45, and 0.86 (0.29, 0.38, and 0.50) for one-, two-, and three-year horizons) and, thus, theregressions reported in Panels A and B are not independent tests. Untabulated statistics also
indicate that when current year revaluations are regressed on the two performance measures
simultaneously, in the one- and three-year horizons changes in operating income (cash from
operations) provides significant (insignificant) explanatory power for revaluations incremental to
changes in cash from operations (operating income). For the two-year horizon, both provide
incremental explanatory power. Thus, henceforth we only tabulate findings relating to changes in
operating income.
is less than the one-year horizon coefficient, but the difference is not signifi-
cant.
Panel A also reveals that, as expected, the year t change in operating income is
significantly positively associated with one-year ahead changes in operating
income (t-statistic"4.04). It is significantly negatively (insignificantly) asso-
ciated with changes in operating income two (three) years ahead (t-statis-
tics"!2.32 and 1.42). Market-to-book ratios and total assets are insignific-
antly associated with future performance (t-statistics "0.13, !1.41, and
!1.34 and 0.76, 0.67, and 0.25 for one, two, and three years ahead, respec-
tively).
Table 3, Panel B, presents summary statistics from estimating Eq. (2), in
which performance is measured by cash from operations. Panel B reveals that,
as predicted and consistent with Panel A, current year revaluations are signifi-cantly positively related to one- and three-year ahead changes in cash from
operations (t-statistics "2.37 and 2.32). They are positively, but not signifi-
cantly, related to two-year ahead changes in cash from operations (t-statistic
"1.34). These findings corroborate those in Panel A in indicating that current
year revaluations are significantly positively associated with future perfor-
mance.
Regarding the control variables, Panel B reveals that year t change in cash
from operations, change in working capital, market-to-book ratio, and totalassets are significantly negatively, significantly positively, insignificantly, and
164 D. Aboody et al. / Journal of Accounting and Economics 26 (1999) 149–178
8/8/2019 Reval of Fixed Assets
http://slidepdf.com/reader/full/reval-of-fixed-assets 17/30
To test whether the significant relation between revaluations and future performance relates tothe act of revaluation, rather than the magnitude of the revaluation, we estimated Eqs. (1) and (2)
using all firms with available data and included an indicator variable that equals one if a firm
revalued its assets upward in a given year, and zero otherwise. The untabulated findings indicate the
significance of the coefficients on RE» is similar to those we tabulate and, in most cases, the
coefficient on the indicator variable insignificantly differs from zero.
We do not include the recognized revaluation reserve in our estimation equation because it is
affected by transactions unrelated to revaluations, e.g., exchange rate adjustments, discretionary
transfers among reserve accounts, additional depreciation attributable to revaluations, and sales of
revalued fixed assets (see Easton et al. (1993) for further discussion). Thus, we construct RE»
— BA¸
by handcollecting thirteen years of footnote disclosures and eliminating effects of these unrelated
transactions. This procedure yields the revaluation balance associated with recognized revalued
assets at the end of each year and changes in the reserve attributable to current year revaluations.
Estimating Eq. (3) using the recognized revaluation reserve yields inferences similar to those based
on RE»— BA¸.
Easton et al. (1993) and Amir et al. (1993) estimate Eq. (3) deflated by book value of equity. Our
inferences are unaltered when based on this alternative specification.
insignificantly associated with change in cash from operations for all three
horizons, respectively.
5. Market-based tests
5.1. Research design
Following prior research, our market-based tests use price and returns speci-
fications. First, we estimate a cross-sectional equation relating share prices to
revaluation balances:
PRICERG
"
7
7
½R7RG
#,$
$
FIRM$RG
#
RE»— BA¸RG
#
EPSRG
#
B»PSRG
#RG
, (3)
where PRICE is share price three months after fiscal year end. RE»— BA¸ is the
revaluation balance, EPS is earnings from continuing operations, and B»PS is
book value of equity, excluding the revaluation balance, all per share. The
revaluation balance is the recognized cumulative amount of upward revaluation
related to fixed assets. Eq. (3) is similar to specifications in Amir et al. (1993),Easton et al. (1993), and Barth and Clinch (1996). As in Eqs. (1) and (2), Eq. (3)
includes separate-year intercepts. Because a firm enters Eq. (3) in every year with
available data, not only when it revalues assets, we also include firm-specific
intercepts to mitigate intertemporal residual dependencies and to control for
D. Aboody et al. / Journal of Accounting and Economics 26 (1999) 149–178 165
8/8/2019 Reval of Fixed Assets
http://slidepdf.com/reader/full/reval-of-fixed-assets 18/30
Note, however, that the model of Ohlson (1995) requires clean surplus, which does not hold
under UK GAAP. Moreover, publicly available data are insufficient to restate UK financial
statements to a clean surplus basis.
firm-specific intertemporally constant omitted variables. FIRM$
, equals one for
firm F, and zero otherwise. N is the number of sample firms.
One can view Eq. (3) as based on the Ohlson (1995) valuation model, where
we permit the coefficient on book value of equity to vary for its revaluation and
non revaluation components. Alternatively, one can view Eq. (3) as deriving
from an asset-based valuation equation, where earnings is a proxy for unrecog-
nized net assets (Barth and Landsman, 1995). Both views lead to similar
interpretations of the coefficient on RE»— BA¸. In particular, assuming revalued
amounts are value-relevant incremental to their historical cost leads us to
predict
is positive. Also, if investors similarly assess the two components of
book value of equity, B»PS and RE»— BA¸,
will equal
. Based on prior
research, we also predict positive coefficients on earnings and book value of
equity,
and
.Because scale effects can affect inferences from levels specifications such as
Eq. (3), we deflate the regression variables, include firm-specific intercepts, and
focus our tests on variables less likely affected by scale than other included
variables, specifically RE»— BA¸ rather than B»PS or EPS (Barth and
Kallapur, 1996). Although a returns specification likely is less affected by scale,
correlated omitted variables can affect inferences from any regression specifica-
tion. If the omitted variables and their coefficients are constant (change) over
time, then a returns (levels) regression can be better-specified (Landsman andMagliolo, 1988). Thus, consistent evidence from a returns specification indicates
inferences from Eq. (3) are not attributable to intertemporally constant omitted
variables.
We also estimate a returns specification because it provides direct evidence on
asset revaluation timeliness. Managers of UK firms have considerable discretion
regarding when to revalue assets. Thus, it is possible that revaluations are not
timely in the sense that the underlying changes to asset values occur in years
other than those in which the revaluations occur. The future performancespecifications relate current year revaluations to changes in performance over
the next three years. However, they do not provide direct evidence of revalu-
ation timeliness. For example, if a revaluation occurs three years after a change
in asset value, but the asset has a ten-year life, we could detect a significant
relation between the revaluation and changes in performance in what is effec-
tively years four through seven of the asset’s life. Similarly, if revaluations
reliably reflect asset value changes but do not occur in the year of the change, i.e.,
are not timely, we can observe a significant relation in the price specification, but
166 D. Aboody et al. / Journal of Accounting and Economics 26 (1999) 149–178
8/8/2019 Reval of Fixed Assets
http://slidepdf.com/reader/full/reval-of-fixed-assets 19/30
We do not include the change in revaluations as an additional independent variable because
most firms do not revalue assets every year. Thus, for many firms, in a revaluation year RE» equals
RE» (the untabulated correlation between RE» and RE» is 0.88) and in the year following
a revaluation, RE»
equals!
RE»
R\. Nonetheless, we estimated Eq. (4) including RE»
as anadditional variable. Untabulated findings indicate that its inclusion does not alter our inferences
regarding RE»’s coefficient. RE»’s coefficient is significantly negative. However, the high correlation
and mechanical relation between RE» and RE» make RE»’s coefficient difficult to interpret.
Ohlson’s (1995) model predicts that the coefficient on book value of equity is less than or equal
to one, and is only equal to one if the coefficient on earnings equals zero, which it does not in
Table 4. As noted above, Ohlson’s model is based on the assumption of clean surplus, which does
not hold under UK GAAP.
not in the returns specification. Observing a significant relation in both is
evidence that at least a portion of revaluations is timely.
Thus, we estimate a cross-sectional equation relating returns to current year
revaluations:
RE¹ºRNRG
"
7
7
½R7RG
#
RE»RG
#
NIRG
#NI
RG#
RG, (4)
where RE¹ºRN is the firm’s year t share return, measured from three months
after year end for year t!1 to three months after year end for year t, and NI is
net income. NIR
is NIR
minus NIR\
and other variables are as previously
defined. All independent variables, except ½R, are deflated by market value of
equity at the beginning of year t. This specification is similar to those estimatedin Easton et al. (1993) and Barth and Clinch (1998). Assuming revaluations
provide at least some timely value-relevant information, we predict
is posi-
tive. As in prior returns/earnings research (e.g., Easton and Harris, 1991), we also
predict
and
are positive.
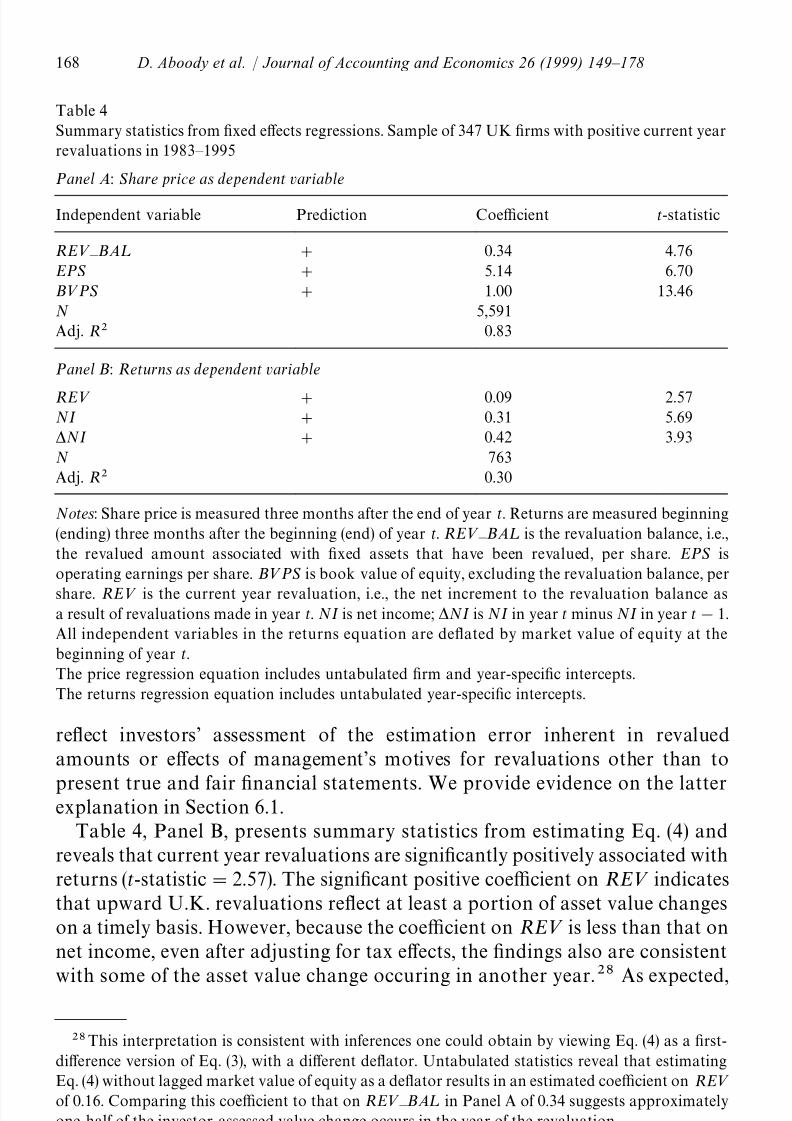
5.2. Findings from market-based tests
Table 4, Panel A, presents summary statistics from estimating Eq. (3). Aspredicted, revaluation balances are significantly positively related to share
prices, after controlling for earnings and book value of equity (t-statistic"4.76).
Also as expected, the coefficients on earnings, EPS, and book value of equity,
B»PS, are significantly positive (t-statistics"6.70 and 13.46).
Untabulated statistics indicate that the coefficient on the revaluation balance,
RE»— BA¸, 0.34, is significantly smaller than that on B»PS, 1.00, (p-value
"0.001). Assuming a 40% tax rate, the coefficient on a tax adjusted RE»— BA¸
would be 0.57, which also is significantly less than that on B»PS, consistent with
the market discounting RE»— BA¸ relative to other net assets. The relatively
larger coefficient on B»PS could reflect depressed UK equity balances attribu-
table to, e.g., direct write-off of purchased goodwill. However, it also could
D. Aboody et al. / Journal of Accounting and Economics 26 (1999) 149–178 167
8/8/2019 Reval of Fixed Assets
http://slidepdf.com/reader/full/reval-of-fixed-assets 20/30
Table 4
Summary statistics from fixed effects regressions. Sample of 347 UK firms with positive current year
revaluations in 1983— 1995
Panel A: Share price as dependent variable
Independent variable Prediction Coefficient t-statistic
RE»— BA¸ # 0.34 4.76
EPS # 5.14 6.70
B»PS # 1.00 13.46
N 5,591
Adj. R 0.83
Panel B: Returns as dependent variable
RE» # 0.09 2.57NI # 0.31 5.69
NI # 0.42 3.93
N 763
Adj. R 0.30
Notes: Share price is measured three months after the end of year t. Returns are measured beginning
(ending) three months after the beginning (end) of year t. RE»— BA¸ is the revaluation balance, i.e.,
the revalued amount associated with fixed assets that have been revalued, per share. EPS is
operating earnings per share. B»PS is book value of equity, excluding the revaluation balance, per
share. RE» is the current year revaluation, i.e., the net increment to the revaluation balance asa result of revaluations made in year t. NI is net income; NI is NI in year t minus NI in year t!1.
All independent variables in the returns equation are deflated by market value of equity at the
beginning of year t.
The price regression equation includes untabulated firm and year-specific intercepts.
The returns regression equation includes untabulated year-specific intercepts.
This interpretation is consistent with inferences one could obtain by viewing Eq. (4) as a first-
difference version of Eq. (3), with a different deflator. Untabulated statistics reveal that estimating
Eq. (4) without lagged market value of equity as a deflator results in an estimated coefficient on RE»
of 0.16. Comparing this coefficient to that on RE»— BA¸ in Panel A of 0.34 suggests approximately
one-half of the investor-assessed value change occurs in the year of the revaluation.
reflect investors’ assessment of the estimation error inherent in revalued
amounts or effects of management’s motives for revaluations other than to
present true and fair financial statements. We provide evidence on the latterexplanation in Section 6.1.
Table 4, Panel B, presents summary statistics from estimating Eq. (4) and
reveals that current year revaluations are significantly positively associated with
returns (t-statistic"2.57). The significant positive coefficient on RE» indicates
that upward U.K. revaluations reflect at least a portion of asset value changes
on a timely basis. However, because the coefficient on RE» is less than that on
net income, even after adjusting for tax effects, the findings also are consistent
with some of the asset value change occuring in another year.
As expected,
168 D. Aboody et al. / Journal of Accounting and Economics 26 (1999) 149–178
8/8/2019 Reval of Fixed Assets
http://slidepdf.com/reader/full/reval-of-fixed-assets 21/30
Panel B also reveals that net income and change in net income are significantly
positively associated with returns (t-statistics"5.69 and 3.93).
6. Additional analyses
6.1. Debt-to-equity ratios
We next investigate whether the relations we document in Section 5 are
systematically associated with cross-sectional differences in debt-to-equity ra-
tios. Specifically, we estimate all equations permitting coefficients on the revalu-
ation variables to vary with debt-to-equity ratios. Because we expect revalu-
ations associated with debt-to-equity ratio motivations are less likely to reflectfuture performance than revaluations intended to reflect true and fair financial
statements, we predict negative incremental coefficients on revaluations interac-
ted with debt-to-equity ratios in Eq. (1). This prediction is consistent with debt
contracting motivations for revaluations and with Lin and Peasnell (1998) who
argue that equity depletion motivates UK managers to revalue assets.
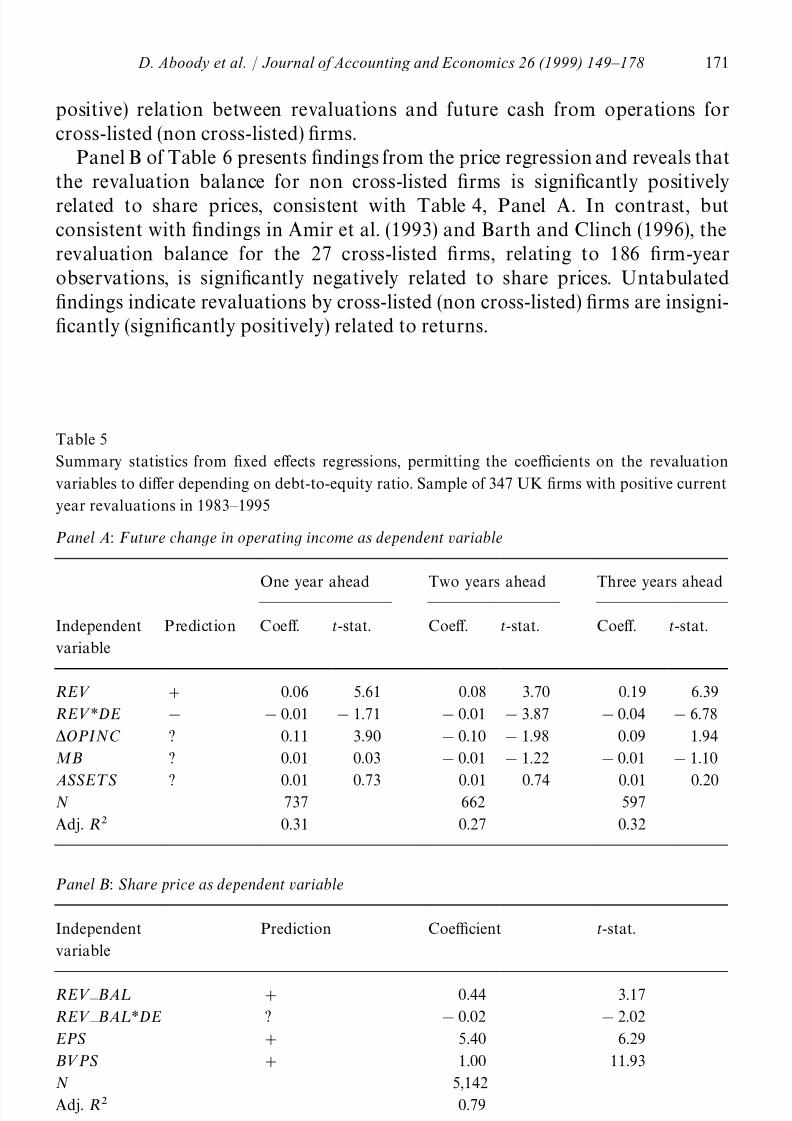
Table 5, Panel A, presents the findings. Consistent with predictions, the
incremental coefficients on revaluations interacted with debt-to-equity ratios,
RE»*DE, are significantly negative in all three future performance horizons(t-statistics"!1.71, !3.87, and !6.78), indicating revaluations of firms with
higher debt-to-equity ratios have weaker associations with future changes in
performance. Table 5, Panel A, also reveals that the base coefficient on revalu-
ations, RE», is significantly positive in all three horizons (t-statistics"5.61,
3.70, 6.39), consistent with Table 3. The sum of the coefficients on RE» and
RE»*DE also is significantly positive. Because DE is less than five for all sample
firms, this indicates that revaluations are positively related to future perfor-
mance regardless of debt-to-equity ratio. Untabulated findings from regressionsbased on changes in operating cash flows are similar to those in Panel A. The
untabulated findings also are similar to those in Table 3, Panel B, except the
coefficient on RE» for the two-year horizon is significantly positive when the
estimating equation includes RE»*DE.
The findings in Panel A indicate revaluations by firms with higher debt-to-
equity ratios are less positively related to future performance, supporting a pre-
diction of a negative incremental coefficient on RE»— BA¸*DE in the price
regressions. Such a prediction is analogous to Barth, Beaver, and Landsman(1996) who predict and find a significantly negative incremental relation be-
tween share prices and loans fair values for banks with low regulatory capital.
However, prices could reflect implications for firm value not directly related to
the revaluations’ association with future operating performance, such as benefits
from relaxing debt constraints. Thus, we could observe a positive incremental
coefficient or, if the positive and negative valuation effects offset, an incremental
D. Aboody et al. / Journal of Accounting and Economics 26 (1999) 149–178 169
8/8/2019 Reval of Fixed Assets
http://slidepdf.com/reader/full/reval-of-fixed-assets 22/30
Easton et al. (1993) suggest that if firms with higher debt-to-equity ratios revalue assets more
frequently, their revaluation balances could reflect more current values than the revaluation
balances of low debt-to-equity ratio firms. This could offset the lower association with future
performance we document in Panel A and also lead to an ambiguous prediction for the incremental
coefficient in the price regression.
coefficient insignificantly different from zero. Thus, we do not predict the sign of
the coefficient on RE»— BA¸*DE in the price regression.
Table 5, Panel B, reveals that the incremental coefficient on the revaluation
balance interacted with debt-to-equity ratios, RE»— BA¸*DE, is significantly
negative (t-statistic"!2.02), indicating that revaluations of firms with higher
debt-to-equity ratios are less positively associated with share prices. The base
coefficient on the revaluation balance, RE»— BA¸, is significantly positive,
consistent with Table 4 (t-statistic"3.17). Also, as in Panel A, the sum of the
coefficients on RE»— BA¸ and RE»— BA¸*DE is significantly positive, indicat-
ing the revaluation balance is significantly positively related to prices, even for
firms with high debt-to-equity ratios. Further, untabulated statistics indicate
that equality of coefficients on book value of equity, B»PS, and RE»— BA¸
cannot be rejected, after adjusting for tax effects (p-value"0.28). Althoughfailure to reject the null hypothesis is not strong evidence, it is inconsistent with
investors perceiving the revaluation balance as significantly less reliable than
other components of book value of equity.
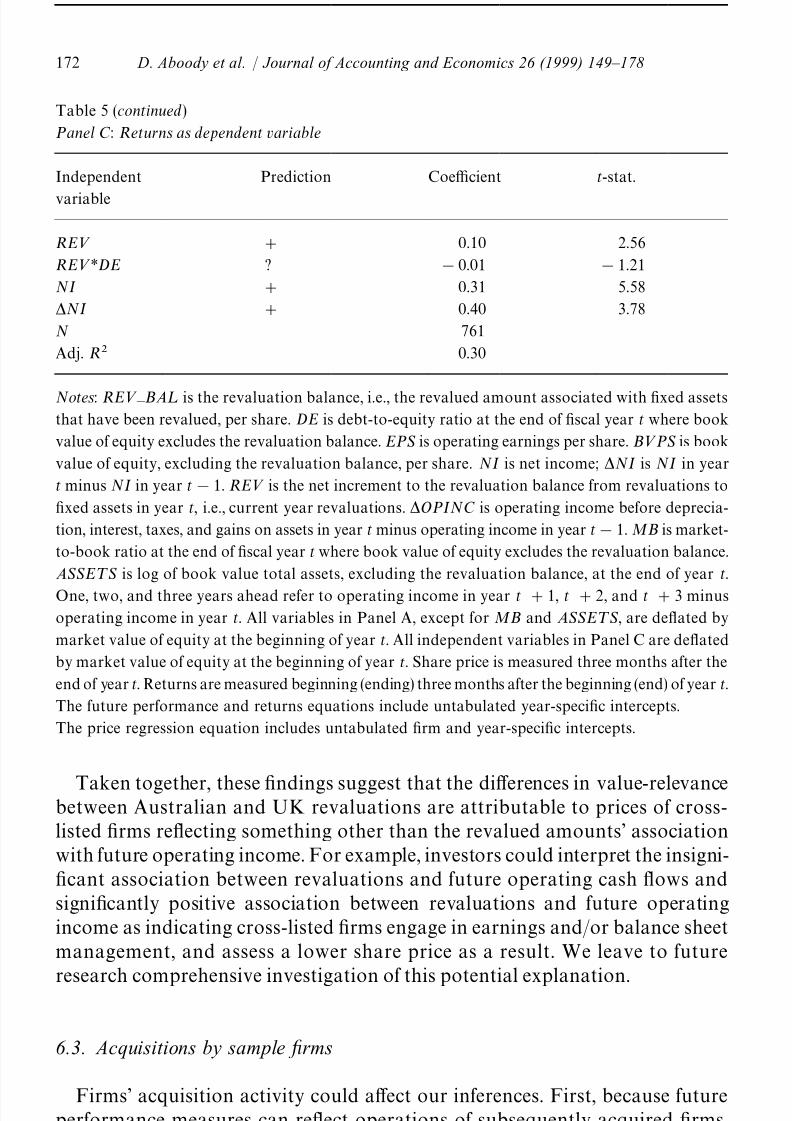
For reasons analogous to those relating to prices, we do not predict the sign of
the incremental coefficient on current year revaluations, i.e., that on RE»*DE,
in the returns regression. Table 5, Panel C indicates it is negative, but not
significantly so (t-statistic"!1.21). Consistent with Table 4, the base coeffi-
cient on revaluations, RE», is significantly positive (t-statistic"2.56) indicatingthe association between returns and revaluations is significantly positive, re-
gardless of the debt-to-equity ratio. Untabulated statistics indicate that, as in
Table 4, the coefficient on RE» is significantly smaller than that on net income,
NI, even after adjusting for tax effects.
6.2. Cross-listed versus non cross-listed firms
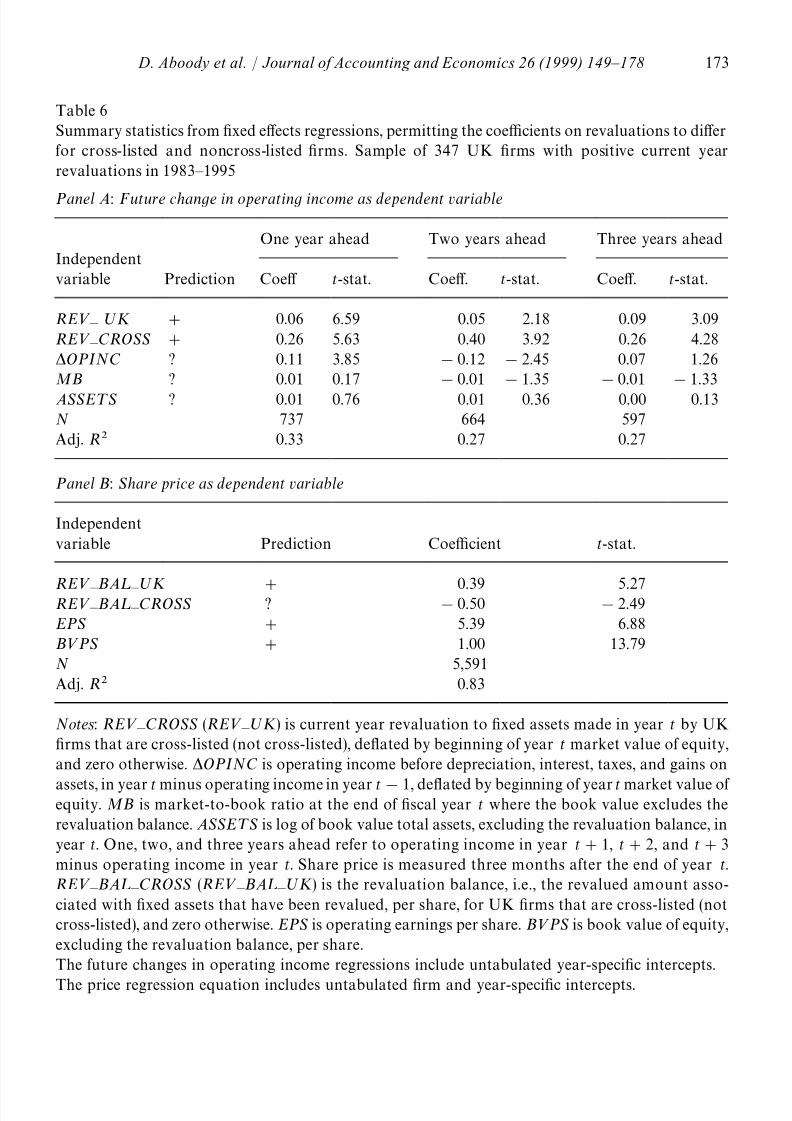
Findings from our price specification differ from those in prior researchfocusing on UK firms that cross-list equity shares in US markets. Thus, Table 6,
Panel A, presents summary statistics from the future performance regression,
permitting different coefficients on current year revaluations for non cross-listed
firms and the 15 cross-listed firms, relating to 31 firm year observations. The
findings reveal that, consistent with Table 3, Panel A, revaluations by both types
of firms have a significant positive relation with future changes in operating
income. However, untabulated statistics reveal an insignificant (significantly
170 D. Aboody et al. / Journal of Accounting and Economics 26 (1999) 149–178
8/8/2019 Reval of Fixed Assets
http://slidepdf.com/reader/full/reval-of-fixed-assets 23/30
positive) relation between revaluations and future cash from operations for
cross-listed (non cross-listed) firms.
Panel B of Table 6 presents findings from the price regression and reveals that
the revaluation balance for non cross-listed firms is significantly positively
related to share prices, consistent with Table 4, Panel A. In contrast, but
consistent with findings in Amir et al. (1993) and Barth and Clinch (1996), the
revaluation balance for the 27 cross-listed firms, relating to 186 firm-year
observations, is significantly negatively related to share prices. Untabulated
findings indicate revaluations by cross-listed (non cross-listed) firms are insigni-
ficantly (significantly positively) related to returns.
Table 5
Summary statistics from fixed effects regressions, permitting the coefficients on the revaluation
variables to differ depending on debt-to-equity ratio. Sample of 347 UK firms with positive current
year revaluations in 1983— 1995
Panel A: Future change in operating income as dependent variable
One year ahead Two years ahead Three years ahead
Independent
variable
Prediction Coeff. t-stat. Coeff. t-stat. Coeff. t-stat.
RE» # 0.06 5.61 0.08 3.70 0.19 6.39
RE»*DE ! !0.01 !1.71 !0.01 !3.87 !0.04 !6.78
OPINC ? 0.11 3.90 !0.10 !1.98 0.09 1.94
MB ? 0.01 0.03 !0.01 !1.22 !0.01 !1.10
ASSE¹S ? 0.01 0.73 0.01 0.74 0.01 0.20N 737 662 597
Adj. R 0.31 0.27 0.32
Panel B: Share price as dependent variable
Independent
variable
Prediction Coefficient t-stat.
RE»— BA¸ # 0.44 3.17
RE»— BA¸*DE ? !0.02 !2.02
EPS # 5.40 6.29
B»PS # 1.00 11.93
N 5,142
Adj. R 0.79
D. Aboody et al. / Journal of Accounting and Economics 26 (1999) 149–178 171
8/8/2019 Reval of Fixed Assets
http://slidepdf.com/reader/full/reval-of-fixed-assets 24/30
Taken together, these findings suggest that the differences in value-relevancebetween Australian and UK revaluations are attributable to prices of cross-
listed firms reflecting something other than the revalued amounts’ association
with future operating income. For example, investors could interpret the insigni-
ficant association between revaluations and future operating cash flows and
significantly positive association between revaluations and future operating
income as indicating cross-listed firms engage in earnings and/or balance sheet
management, and assess a lower share price as a result. We leave to future
research comprehensive investigation of this potential explanation.
6.3. Acquisitions by sample firms
Firms’ acquisition activity could affect our inferences. First, because future
performance measures can reflect operations of subsequently acquired firms,
Table 5 (continued)
Panel C: Returns as dependent variable
Independent
variable
Prediction Coefficient t-stat.
RE» # 0.10 2.56
RE»*DE ? !0.01 !1.21
NI # 0.31 5.58
NI # 0.40 3.78
N 761
Adj. R 0.30
Notes: RE»— BA¸ is the revaluation balance, i.e., the revalued amount associated with fixed assets
that have been revalued, per share. DE is debt-to-equity ratio at the end of fiscal year t where book
value of equity excludes the revaluation balance. EPS is operating earnings per share. B»PS is book
value of equity, excluding the revaluation balance, per share. NI is net income; NI is NI in year
t minus NI in year t!1. RE» is the net increment to the revaluation balance from revaluations to
fixed assets in year t, i.e., current year revaluations. OPINC is operating income before deprecia-
tion, interest, taxes, and gains on assets in year t minus operating income in year t!1. MB is market-
to-book ratio at the end of fiscal year t where book value of equity excludes the revaluation balance.
ASSE¹S is log of book value total assets, excluding the revaluation balance, at the end of year t.
One, two, and three years ahead refer to operating income in year t #1, t #2, and t #3 minus
operating income in year t. All variables in Panel A, except for MB and ASSE¹S, are deflated by
market value of equity at the beginning of year t. All independent variables in Panel C are deflated
by market value of equity at the beginning of year t. Share price is measured three months after the
end of year t. Returns are measured beginning (ending) three months after the beginning (end) of year t.
The future performance and returns equations include untabulated year-specific intercepts.
The price regression equation includes untabulated firm and year-specific intercepts.
172 D. Aboody et al. / Journal of Accounting and Economics 26 (1999) 149–178
8/8/2019 Reval of Fixed Assets
http://slidepdf.com/reader/full/reval-of-fixed-assets 25/30
Table 6
Summary statistics from fixed effects regressions, permitting the coefficients on revaluations to differ
for cross-listed and noncross-listed firms. Sample of 347 UK firms with positive current year
revaluations in 1983— 1995
Panel A: Future change in operating income as dependent variable
One year ahead Two years ahead Three years ahead
Independent
variable Prediction Coeff t-stat. Coeff. t-stat. Coeff. t-stat.
RE»— ºK # 0.06 6.59 0.05 2.18 0.09 3.09
RE»— CROSS # 0.26 5.63 0.40 3.92 0.26 4.28
OPINC ? 0.11 3.85 !0.12 !2.45 0.07 1.26
MB ? 0.01 0.17 !0.01 !1.35 !0.01 !1.33
ASSE¹S ? 0.01 0.76 0.01 0.36 0.00 0.13
N 737 664 597
Adj. R 0.33 0.27 0.27
Panel B: Share price as dependent variable
Independent
variable Prediction Coefficient t-stat.
RE»— BA¸— ºK # 0.39 5.27RE»— BA¸— CROSS ? !0.50 !2.49
EPS # 5.39 6.88
B»PS # 1.00 13.79
N 5,591
Adj. R 0.83
Notes: RE»— CROSS (RE»— ºK) is current year revaluation to fixed assets made in year t by UK
firms that are cross-listed (not cross-listed), deflated by beginning of year t market value of equity,
and zero otherwise. OPINC is operating income before depreciation, interest, taxes, and gains on
assets, in year t minus operating income in year t!1, deflated by beginning of year t market value of equity. MB is market-to-book ratio at the end of fiscal year t where the book value excludes the
revaluation balance. ASSE¹S is log of book value total assets, excluding the revaluation balance, in
year t. One, two, and three years ahead refer to operating income in year t#1, t#2, and t#3
minus operating income in year t. Share price is measured three months after the end of year t.
RE»— BA¸— CROSS (RE»— BA¸— ºK) is the revaluation balance, i.e., the revalued amount asso-
ciated with fixed assets that have been revalued, per share, for UK firms that are cross-listed (not
cross-listed), and zero otherwise. EPS is operating earnings per share. B»PS is book value of equity,
excluding the revaluation balance, per share.
The future changes in operating income regressions include untabulated year-specific intercepts.
The price regression equation includes untabulated firm and year-specific intercepts.
D. Aboody et al. / Journal of Accounting and Economics 26 (1999) 149–178 173
8/8/2019 Reval of Fixed Assets
http://slidepdf.com/reader/full/reval-of-fixed-assets 26/30
confounding our tests relating to changes in performance, we include in
Eq. (1) an incremental intercept and incremental coefficient on revaluations for
firms making an acquisition in the revaluation year. Untabulated findings reveal
that although approximately 35% of the sample firms revalue assets and make
an acquisition in the same year, acquisition activity does not explain our
findings. That is, the base coefficient on revaluations, RE», is significantly
positive for all three horizons. The incremental intercepts are significantly
positive for all horizons, indicating acquisition activity is positively associated
with future changes in operating income. However, the incremental coeffi-
cients on RE» vary in sign and significance across horizons, indicating no
pattern to RE»’s relation to future performance associated with acquisition
activity.
Second, as explained in Section 2, the positive association we observe betweenrevaluations and returns could result from benefits associated with removing
a potentially binding constraint on acquisitions imposed by the LSE. The LSE
requires shareholder approval for acquisitions exceeding a size criterion based
on book value of equity. Thus, we estimate Eq. (4), after including the incremen-
tal intercept and incremental coefficient on RE» described in the previous
paragraph. Consistent with benefits associated with removing a contracting
constraint, the untabulated findings indicate that the incremental intercept is
significantly positive, i.e., mean returns are larger for firms making acquisitionsin the revaluation year. However, the findings also indicate, consistent with our
primary results, that RE»’s base coefficient is significantly positive and its
incremental coefficient is insignificantly different from zero, indicating no signifi-
cant difference in the relation between revaluations and returns for firms with
acquisition activity.
Third, to investigate further potential effects of the LSE constraint, we
estimate Eq. (4) after including an incremental intercept for firms with low book
value of equity, exclusive of the revaluation balance, scaled by sales. Inconsistentwith expectations based on the LSE constraint, untabulated findings indicate
firms with low book value of equity have significantly lower returns. How-
ever, consistent with our primary findings, RE»’s coefficient is significantly
positive.
6.4. Changes during sample period
As noted in Section 3, there was a notable shift in firms’ revaluation activity
around 1990, coinciding with increased volatility in economic conditions. Thus,
we estimate the future performance and returns equations permitting the rela-
tions between current year revaluations and future performance and returns to
vary before and after 1990. We exclude 1990 revaluations to provide a clean
174 D. Aboody et al. / Journal of Accounting and Economics 26 (1999) 149–178
8/8/2019 Reval of Fixed Assets
http://slidepdf.com/reader/full/reval-of-fixed-assets 27/30
Untabulated findings from future cash from operations regressions also reveal that revaluations
before 1990 are significantly positively related to changes in performance over all three horizons.
However, revaluations after 1990 are insignificantly related to changes in cash from operations,
except for the three-year horizon in which the relation is significantly negative.
cutoff for the partition. We do not estimate the price specification because we
cannot distinguish the revaluation balance relating to revaluations before and
after 1990.
Untabulated findings reveal that revaluations before and after 1990 are
significantly positively related to future changes in operating income, except for
revaluations after 1990, which are insignificant in the two-year horizon. How-
ever, revaluations before 1990 have a stronger relation with future profitability
than do those after 1990, in that the coefficients are significantly larger, with
larger t-statistics, for all horizons. Untabulated returns findings reveal that the
significant positive relation between revaluations and returns documented in
Table 4 is attributable to revaluations before 1990; those after 1990 are insigni-
ficantly related to returns.
7. Summary and concluding remarks
We test whether upward revaluations of fixed assets by UK firms are posit-
ively associated with realized future changes in firm operating performance.
Prior research focuses primarily on the relation between asset revaluations and
share prices and returns and presents mixed findings regarding asset revalu-
ations’ value-relevance. Share prices reflect investors’ assessments of asset valuesand expectations about future operating performance. However, they also
reflect valuation effects of firms’ investing and financing decisions. Thus, mar-
ket-based tests provide only indirect evidence about the relation between asset
revaluations and future changes in operating performance. We directly test this
relation where future performance is measured as changes in operating income
and cash from operations.
We find that asset revaluations by UK firms are significantly positively
associated with future changes in operating performance, over one, two, andthree years subsequent to the revaluation. Our tests control for current changes
in performance, risk, growth, and size. These findings provide strong evidence
that revaluations reflect changes in asset values that are realized in subsequent
operations.
We also test the association between revaluation amounts and share prices
and annual returns. As predicted, we find that the revaluation balance is
D. Aboody et al. / Journal of Accounting and Economics 26 (1999) 149–178 175
8/8/2019 Reval of Fixed Assets
http://slidepdf.com/reader/full/reval-of-fixed-assets 28/30
significantly positively associated with prices incremental to net income and
book value of equity. This finding is consistent with prices reflecting revalu-
ations’ association with future performance, and with prior research on Austra-
lian revaluations. We also find, as predicted, that current year upward revalu-
ations are significantly positively associated with returns. Prior UK revaluation
research does not investigate this relation; findings from prior Australian revalu-
ation research are not consistently strong. This finding not only complements
our future performance and price regressions findings, but also indicates that
revaluations by UK firms reflect at least a portion of asset value changes on
a timely basis.
Upward revaluation of assets is discretionary under UK GAAP, and thus
management’s revaluation motive could affect the revaluation amounts. One
such motive relates to managing debt-to-equity ratios, perhaps because of debt covenants. Consistent with this motive conflicting, in part, with present-
ing true and fair financial statements, we find that the relations between
revaluation amounts and future performance, prices, and returns are weaker
for firms with high debt-to-equity ratios. After controlling for effects associated
with debt-to-equity ratios, we find evidence inconsistent with investors per-
ceiving revaluations as significantly less reliable than other assets and
liabilities.
Prior UK revaluation research focuses on UK firms that list their shares inUS equity markets and provides evidence of a significant negative relation
between asset revaluation balances and share prices. Permitting the relations we
test to differ for cross-listed sample firms yields similar findings. In particular,
although we find that revaluations by both types of firms are significantly
positively associated with future changes in operating income, those of cross-
listed firms are insignificantly related to future changes in operating cash flow
and significantly negatively related to share prices, consistent with prior re-
search and in contrast to non cross-listed firms. These findings suggest prices of cross-listed firms reflect something other than the revaluations’ relation with
future operating performance. We leave to future research comprehensive in-
vestigation of this finding.
We find no evidence that acquisition activity affects the relation between
revaluations and future performance or returns, indicating that a positive
correlation between revaluations and firms investing in operating entities does
not affect our inferences. Finally, we find that upward revaluations are more
significantly related to future performance and returns in a period of consis-tently increasing asset values than in a period of economic volatility.
Our evidence provides input to the debate about the efficacy of disclosing and
recognizing long-term non financial assets at estimated value, rather than at
depreciated historical cost. Consistently finding that revaluations are positively
associated with future performance, share prices, and returns suggest that
fixed asset revaluation amounts are not unreliable. We also find evidence that
176 D. Aboody et al. / Journal of Accounting and Economics 26 (1999) 149–178
8/8/2019 Reval of Fixed Assets
http://slidepdf.com/reader/full/reval-of-fixed-assets 29/30
revaluations reflect at least some changes in underlying asset values on a timely
basis. Because revaluations are discretionary, our findings are consistent with
asset revaluations reflecting changes in management expectations about future
firm performance.
References
Amir, E., Harris, T.S., Venuti, E.K., 1993. A comparison of US versus non-US GAAP accounting
measures using Form 20-F reconciliations. Journal of Accounting Research, 31 230— 275.
Barth, M.E., Clinch, G., 1996. International accounting differences and their relation to share prices:
Evidence from U.K. Australian, and Canadian firms, Contemporary Accounting Research 13,135— 170.
Barth, M.E., Clinch, G., 1998. Revalued financial, tangible, and intangible assets: Associations
with share prices and non market-based estimates. Journal of Accounting Research 36,
199— 233.
Barth, M.E., Beaver, W.H., Landsman, W.R., 1996. Value-relevance of banks’ fair value disclosures
under SFAS No. 107. The Accounting Review 71, 513— 37.
Barth, M.E., Kallapur, S., 1996. The effects of cross-sectional scale differences on regression results in
empirical accounting research. Contemporary Accounting Research 13, 527— 567.
Barth, M.E., Landsman, W.R., 1995. Fundamental issues related to using fair value accounting for
financial reporting. Accounting Horizons 9, 97— 107.
Berk, 1990. R.A., A primer on robust regression. In Modern Methods of Data Analysis. Fox, J.,
Long, J.S. (Eds.), Saga Publications Newbury Park, CA, pp. 292— 324.
Bernard, V.L., 1993. Discussion of an investigation of revaluations of tangible long-lived assets.
Journal of Accounting Research 31, 39— 45.
Brown, P.D., Finn, F.J., 1980. Asset revaluations and stock prices: Alternative interpretations of
a study by Sharpe and Walker. In: Share Markets and Portfolio Theory, Ball, R. et al. (Eds.), St.
Lucia: University of Queensland Press, pp. 349— 354.
Dechow, P.M., 1994. Accounting earnings and cash flows as measures of firm performance: The role
of accounting accruals. Journal of Accounting and Economics 18, 3— 42.Easton, P.D., Eddey, P.H., Harris, T.S., 1993. An investigation of revaluations of tangible long-lived
assets. Journal of Accounting Research 31, 1— 38.
Easton, P.D., Harris, T.S., 1991. Earnings as an explanatory variable for returns. Journal of
Accounting Research 29, 19— 36.
Fama, E.F., French, K.R., 1992. The cross-section of expected stock returns. Journal of Finance 47,
427— 465.
Landsman, W.R., Magliolo, J., 1988. Cross-sectional capital market research and model specifica-
tion. The Accounting Review 63, 586— 604.
Lin, Y.C., Peasnell, K.V., 1998. Fixed asset revaluation and equity depletion in the UK. Workingpaper, Lancaster University.
Muller, K.A., 1998. An examination of the voluntary recognition of acquired brand names in the
United Kingdom. Journal of Accounting and Economics, this issue.
Ohlson, J., 1995. Earnings, book values and dividends in security valuation. Contemporary Ac-
counting Research 12, 661— 687.
Sloan, R.G., 1996. Do stock prices fully reflect information in accruals and cash flows about future
earnings?. The Accounting Review 71, 289— 315.
D. Aboody et al. / Journal of Accounting and Economics 26 (1999) 149–178 177

8/8/2019 Reval of Fixed Assets
http://slidepdf.com/reader/full/reval-of-fixed-assets 30/30
Sharpe, I.G., Walker, R.G., 1975. Asset revaluations and stock market prices. Journal of Accounting
Research 13, 293— 310.
Standish, P., Ung, S., 1982. Corporate signaling, asset revaluations and the stock prices of British
companies. The Accounting Review 62, 701— 715.
White, H., 1980. A heteroskedasticity-consistent covariance matrix estimator and a direct test forheteroskedasticity. Econometrica 48, 817— 838.
178 D. Aboody et al. / Journal of Accounting and Economics 26 (1999) 149–178