Embed Size (px)
Citation preview
1
Reuse of Food Processing Wastewater in Washington State
Iftaykhairul Alam, Lynne Carpenter-Boggs and Indranil Chowdhury Department of Civil & Environmental Engineering,
Washington State University, Pullman, WA 99164, USA
2
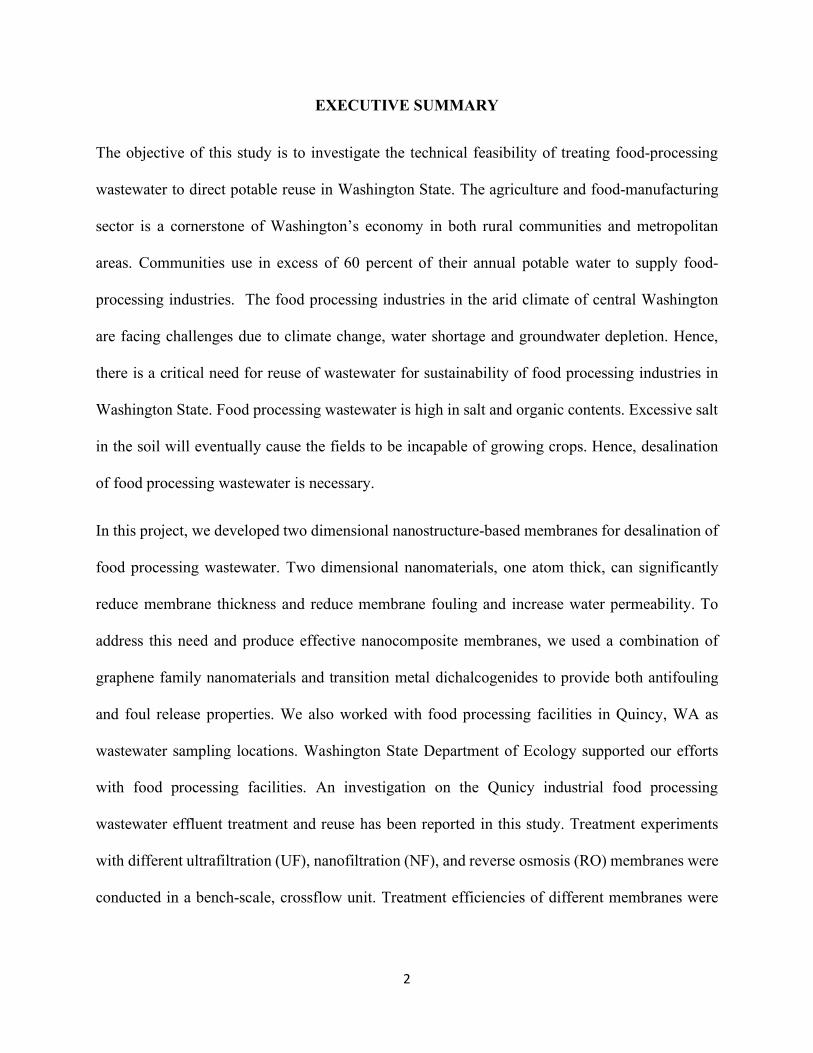
EXECUTIVE SUMMARY
The objective of this study is to investigate the technical feasibility of treating food-processing
wastewater to direct potable reuse in Washington State. The agriculture and food-manufacturing
sector is a cornerstone of Washington’s economy in both rural communities and metropolitan
areas. Communities use in excess of 60 percent of their annual potable water to supply food-
processing industries. The food processing industries in the arid climate of central Washington
are facing challenges due to climate change, water shortage and groundwater depletion. Hence,
there is a critical need for reuse of wastewater for sustainability of food processing industries in
Washington State. Food processing wastewater is high in salt and organic contents. Excessive salt
in the soil will eventually cause the fields to be incapable of growing crops. Hence, desalination
of food processing wastewater is necessary.
In this project, we developed two dimensional nanostructure-based membranes for desalination of
food processing wastewater. Two dimensional nanomaterials, one atom thick, can significantly
reduce membrane thickness and reduce membrane fouling and increase water permeability. To
address this need and produce effective nanocomposite membranes, we used a combination of
graphene family nanomaterials and transition metal dichalcogenides to provide both antifouling
and foul release properties. We also worked with food processing facilities in Quincy, WA as
wastewater sampling locations. Washington State Department of Ecology supported our efforts
with food processing facilities. An investigation on the Qunicy industrial food processing
wastewater effluent treatment and reuse has been reported in this study. Treatment experiments
with different ultrafiltration (UF), nanofiltration (NF), and reverse osmosis (RO) membranes were
conducted in a bench-scale, crossflow unit. Treatment efficiencies of different membranes were
3
reported in terms of total dissolved solids (TDS) removal, initial water flux, operating pressure,
and flux decline due to fouling.
Results show that graphene oxide (GO)- molybdenum disulfide (MoS2) nanocomposite
membranes could be used for decreasing the TDS concentration of the Quincy industrial
wastewater effluent to 500 mg/L required for irrigation usage. Further modification of the
composite membrane (i.e., changing the ratio of GO and MoS2 in the mixtures, increasing the
amount of nanomaterials, etc.) could result in even higher TDS removal efficiency. Though the
commercial RO membrane showed a maximum 95% TDS removal efficiency, water permeability
through the RO membrane was very low and it was susceptible to fast-flux decline due to fouling.
On the other hand, antifouling GO-MoS2 composite membrane treated 3 times higher wastewater
effluent volume than RO membrane before each wash cycle, which will result in less frequent
wash intervals and minimize the operating costs. Overall, considerable TDS removal, high initial
water flux, and low operating pressure of the GO-MoS2 composites, thus enables high productivity
at reduced operational costs. Furthermore, superior antifouling behavior of the nanocomposite NF
membranes would require less frequent membrane wash and could be reused for a longer time.
The results of this study will be useful for designing a membrane-based treatment system in the
industries for producing high-quality effluent. This would enable industrialists to reuse and recycle
the polluted wastewater effluent for industrial and irrigation purposes.
4
1. INTRODUCTION
While population and industrial growth, and escalating climate change in this century are creating
tremendous stresses in food-energy-water (FEW) systems, communities need efficient usage of
resources and waste materials in FEW systems to combat these challenges. Wastewater is one of
the largest waste materials in FEW systems, which communities can recover and recycle for the
use in the FEW cycle. In North America alone, communities generate 19 trillion gallons of
wastewater each year (Sato et al. 2013). Although 75% of this wastewater is treated, communities
currently reuse only 3.8% for agricultural or other beneficial purposes. The total amount of
wastewater in North America is 42% of agricultural water withdrawals, indicating that wastewater
could help decrease stress on fresh water supplies and groundwater withdrawal. Food processing
wastewater is one of the largest sources of wastewater. Therefore, there is a critical need in
developing engineering solutions for sustainable recycling of food processing wastewater in food-
energy-water systems.
Washington is a leading producer of numerous crops and key supplier of food throughout the
world. Agriculture and food processing industries are the cornerstones of economy of Washington
and other industries depend on the food-production industry such as transportation, machinery,
fertilizers, etc. However, the food processing industries in the arid climate of Washington are
facing challenges due to climate change, water shortage and groundwater depletion. Changing
weather patterns are creating stresses on water availability. Moreover, in Washington State, major
source of water for food processing is groundwater. Hence, communities need alternative sources
of water for sustainability of food processing industries in Washington.
Wastewaters generated from food processing industries are large quantities and can be alternative
sources of potable water. Currently the design discharge of wastewater treatment are limiting the
5
production at food processing industries. Currently the industries use water to create food for
human consumption. The industries discharge the process water to a treatment facility as
wastewater. The food industries could increase production if the seasonal discharge or the cost of
treatment did not limit the beneficial use. A beneficial reuse for the food-producing wastewater
could be a source water for a water treatment facility or a combined process water and drinking
water facility. So, the community could immediately use the full discharge by discharging the
drinking water into the potable water system. This would eliminate the cost of a storage lagoon for
seasonal discharge, the cost of purple pipe for reuse of water, and decrease the amount of water
the community withdraws from the ground. This increase in production would mean an increase
in job opportunities in Washington State and a decrease in energy costs to pump the water out of
the ground.
The main challenge with the reuse of food processing wastewater for a potable water system is
contaminants. Food processing wastewater is generally high in salt content leading to high rates
of biofouling during treatment. Rapid development of membranes for nanofiltration, reverse
osmosis, and forward osmosis (Pendergast et al., 2011) during the last few decades has shown that
these processes are viable approaches for separating contaminants from water. However, the
advancement of membrane technology is severely hampered by the long-standing problem of
fouling, which is caused by the accumulation of foreign substances, such as salts, on membrane
surfaces or inside pores (Zodrow et al., 2014; Li et al., 2004). Fouling can seriously deteriorate
membrane performance by reducing water permeability, lowering product water quality,
increasing energy consumption, shortening membrane life, increasing operating costs, and
releasing chemical wastes into the environment. Thus, there is a critical need to focus on improving
the antifouling properties of membranes for desalination of food processing wastewater.
6
One promising approach for improving the antifouling properties of membranes is the use of
nanotechnology. Rapid advances in nanotechnology have resulted in numerous nanomaterials
with properties that are potentially useful in membrane processes. Among these nanomaterials,
two dimensional nanostructures have emerged with numerous and unprecedented properties that
can make state-of-the art membranes resistant to fouling (Geim and Grigorieva, 2013; Wang et
al., 2012). Prior research has shown that two dimensional nanomaterials, one-atom thick (~1
nm), can significantly reduce the membrane thickness and membrane fouling (Zhang 2015). Hu
et al. (2010) showed that graphene family two dimensional nanomaterials have both antibacterial
and anti-corrosive properties. In addition, other two dimensional nanostructures called transition
metal dichalcogenides, including molybdenum disulfide (MoS2) and tungsten disulfide (WS2),
are highly hydrophobic and have extremely low friction, which can deter settlement of fouling
agents and provide low adhesion of any fouling that may occur (Wang, Kalantar-Zadeh et al.
2012, Heiranian, Farimani et al. 2015). Our results confirm that both graphene oxide and
molybdenum disulfide demonstrate provide superior antifouling properties.
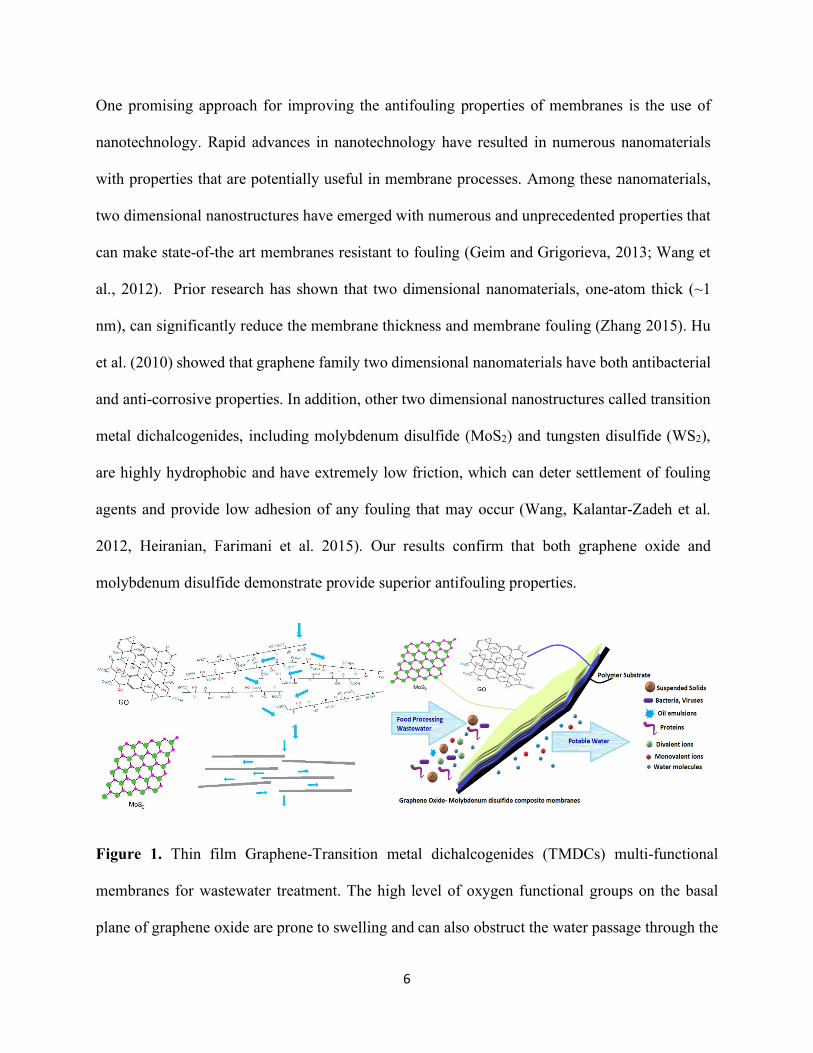
Figure 1. Thin film Graphene-Transition metal dichalcogenides (TMDCs) multi-functional
membranes for wastewater treatment. The high level of oxygen functional groups on the basal
plane of graphene oxide are prone to swelling and can also obstruct the water passage through the
7
nanochannels. Absence of functional groups on TMDCs provide an additional advantage in
stability and help in fast water transport through its nanochannels. These modified thin-film
nanocomposites would offer high salt rejection and antifouling performance maintaining fast water
transport.
By combining the properties of both graphene family nanomaterials and transition metal
dichalcogenides, we developed the creation of advanced antifouling membranes that can
simultaneously provide low adhesion and antifouling capabilities. The overall objective of this
project is to develop membranes for desalination of food processing wastewater. Figure 1 presents
the overall schematic of our membrane development process. Based on our prior work, we have
developed a combination of graphene family nanomaterials and transition metal dichalcogenides
that will provide antifouling properties to nanocomposite membranes. We have utilized food
processing facilities in Quincy, WA as wastewater sampling locations to test the membranes with
alternative sources of food processing wastewater.
2. BACKGROUND
While the global population quadrupled, the world water demand was increased by seven times
since the last century (Pendergast and Hoek 2011). The global water demand will continue to climb
and would result in an increase of 20-30% above the present level of water use by 2050 due to the
rising demand in the domestic and industrial sectors (WWAP 2019). There is no doubt that
domestic, agriculture, industry, and energy demands on water resources would be growing even
faster than never before (Bouman 2007). The United Nations World Water Development 2019
Report states that over 2 billion people experience high water stress, while 4 billion people face
8
severe water shortage at least one month of the year (WWAP 2019). Better water treatment
technology is required not only to protect the existing freshwater resources but also to develop
new water resources for meeting the world’s growing demand (Pendergast and Hoek 2011).
Membrane-based water treatment technologies are becoming increasingly popular for seawater
desalination, industrial wastewater recycling, and drinking water treatment applications (Hilal, Al-
Zoubi et al. 2004). Membrane separation is one such treatment technology that selectively
separates contaminants from water by retaining particles larger than its pore size. Contaminants
with a smaller diameter than the rated pore size either pass through the membrane or may be
captured by other mechanisms within the membrane structure. In addition, pressure-driven
membrane processes, other separation processes like gas separation, pervaporation, and
electrochemical membranes processes are also getting attention for industrial and environmental
separations (Ulbricht 2006). Membrane-based separation offers high-quality effluent, fast
installation and easy modification efforts, and requires less footprint to operate compared to the
conventional water treatment processes. The applications of membranes range from large, utility-
scale installation, to small point-of-use systems in homes (Karagiannis and Soldatos 2008, Sobsey,
Stauber et al. 2008). Membranes are preferred over other water treatment technologies, such as
disinfection, distillation, and media filtration, as they require no chemical additives, thermal inputs,
or require surface regeneration of the used media (Pendergast and Hoek 2011). However, the
advancement of membrane technology is severely hampered by the long-standing problem of
fouling. Accumulation of foreign substances on membrane surfaces or inside pores causes fouling.
Fouling deteriorates the performance of the membrane by lowering water permeability and also
responsible for poor product water quality, increased energy consumption, short membrane life,
etc. (Li and Elimelech 2004, Zodrow, Bar-Zeev et al. 2014). Biofouling, colloidal fouling, organic
9
fouling, and scaling remain the most significant problems for the efficient application of nano-
filtration and reverse osmosis (Nguyen, Roddick et al. 2012, Ruiz-García, Melián-Martel et al.
2017). Many surfactants such as sodium dodecyl sulfate (SDS), poly(oxyethylene) isooctyl phenyl
ether and oxidizing agents, such as hydrogen peroxide (H2O2), are used for membrane cleaning
(Madaeni, Rostami et al. 2010). Chemical cleaning depends on a lot of parameters such as duration,
temperature, shear stress, and pressure, which are difficult to control in operating condition.
Moreover, depending on the fouling type different cleaning agents are required (Beyer,
Laurinonyte et al. 2017). Therefore, there is a critical need to mitigate membrane fouling for
effectively using the membrane-based treatment. Considerable efforts have been made in the past
few years to modify polymeric membranes with different antifouling nanomaterials (Pramauro,
Prevot et al. 1998, Bianco Prevot and Pramauro 1999, Lin and Murad 2001, Bahnemann 2004,
Akhavan and Ghaderi 2010, Hoek, Pendergast et al. 2014, Perreault, Tousley et al. 2014,
Chowdhury, Mansukhani et al. 2015). Fouling has been one of the significant drawbacks of the
membrane-based treatment, antifouling performance evaluation of some commercial and lab-
prepared membranes has been investigated besides their rejection performance.
The main objective of this study is to investigate the TDS removal efficiency of the some
commercial NF, UF, and RO membranes and as well as one lab prepared GO-MoS2 nanocomposite
membrane. A systematic study was needed to identify the potential application of membrane-based
food processing wastewater effluent treatment. Membranes were evaluated with respect to TDS
removal efficiency, initial water flux, operating pressure, and their antifouling performance.
3. PROBLEMS
Wastewater recycling has become a trend to meet the rising global water demand for beneficial
purposes such as irrigation, industrial processes, groundwater replenishing. (Grant, Saphores et al.
10
2012). Planned recycling of industrial wastewater can contribute significantly to the reduced
withdrawal of freshwater from the system (Tong and Elimelech 2016). The ability to treat salty
wastewater in a cost-effective and environmentally sustainable manner is critical to the food, drug,
and chemical industries. Discharge of salty wastewater poses a severe risk to aquatic life (Cañedo-
Argüelles, Kefford et al. 2018), influences nitrogen removal efficiency in wastewater treatment
plants (Glass and Silverstein 1999, Campos, Mosquera-Corral et al. 2002) and markedly increases
the emission of the greenhouse gas nitrous oxide (N2O) from the plants (Tsuneda, Mikami et al.
2005). In addition, for irrigation purposes, total dissolved solids concentration needs to be less than
500 mg/L (~Electrical conductivity of 0.78 mmhos/cm) (Landschoot 2014). Conventional
industrial wastewater treatment/management practices can hardly remove salts from water to reuse
in irrigation and other industrial processes (Angelakis and Snyder 2015). Membrane-based
separation processes (e.g., Reverse/forward osmosis) are becoming popular for removing salts
from industrial wastewater, which can even achieve 100% resource recovery by zero-liquid
discharge (ZLD) (Mays 2007, Oren, Korngold et al. 2010, Muhammad and Lee 2019). On the
other hand, UF and NF membranes may not attain ZLD, but can certainly remove the maximum
amount of contaminants and salts from water before discharge (Jiraratananon, Sungpet et al. 2000,
Lau and Ismail 2009, Coskun, Debik et al. 2010). UF/NF incorporated into the industrial treatment
processes can produce water that can be recycled and reused.
Fouling has been the major drawback of membrane-based water treatment. Membranes suffering
from biofouling, organic, and inorganic fouling during operation, lead to poor product water
quality and require frequent wash and sometimes replacement. The development of novel
strategies for fouling prevention has been a long-active area in membrane research (de Lannoy,
Jassby et al. 2013). Though commercial polymeric membranes such as polyamide (PA),
11
polysulfone (PSf), and polyethersulfone (PES) show excellent rejection, wide range pH tolerance,
and chemical stability, they suffer greatly from fouling due to their hydrophobic nature (Sagle and
Freeman 2004, Mi and Elimelech 2010, Shin, Kim et al. 2011, Gu, Jun et al. 2012, Liu and Mi
2012). So, the antifouling performance of the commercial and GO-MoS2 composite membranes
was systematically investigated besides their TDS rejection performance.
4. MATERIALS AND METHODS
4.1 Selection of membranes
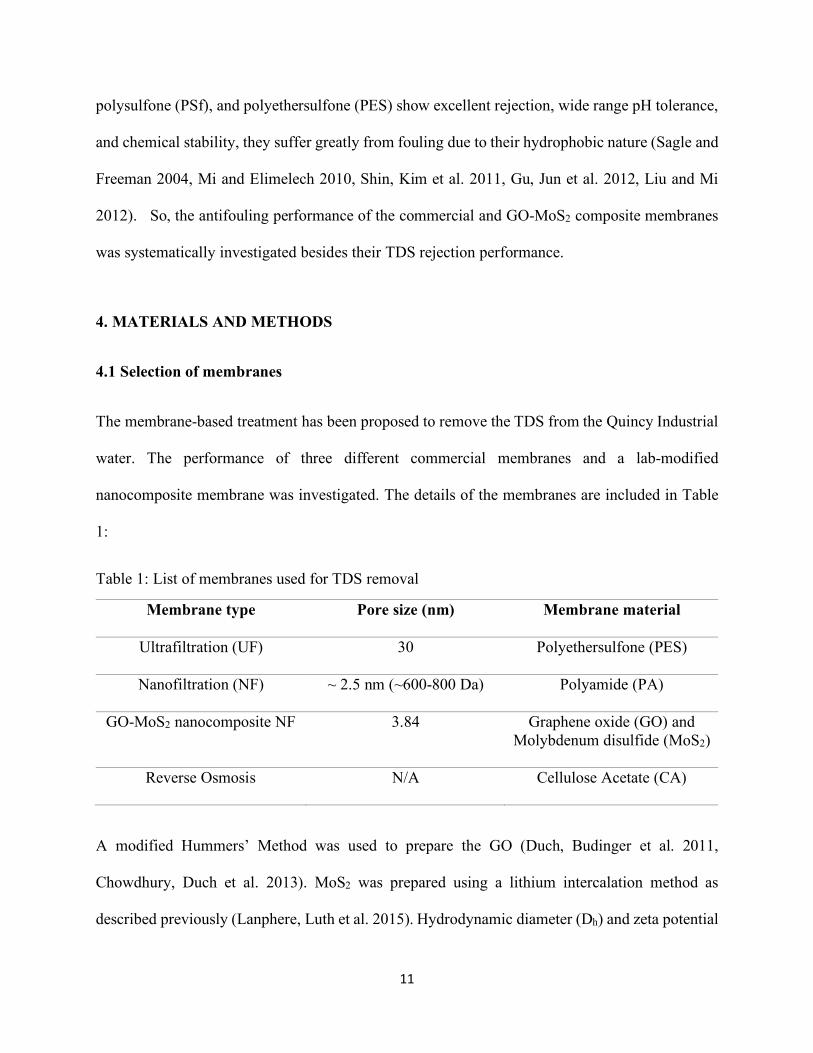
The membrane-based treatment has been proposed to remove the TDS from the Quincy Industrial
water. The performance of three different commercial membranes and a lab-modified
nanocomposite membrane was investigated. The details of the membranes are included in Table
1:
Table 1: List of membranes used for TDS removal
Membrane type Pore size (nm) Membrane material
Ultrafiltration (UF) 30 Polyethersulfone (PES)
Nanofiltration (NF) ~ 2.5 nm (~600-800 Da) Polyamide (PA)
GO-MoS2 nanocomposite NF 3.84 Graphene oxide (GO) and Molybdenum disulfide (MoS2)
Reverse Osmosis N/A Cellulose Acetate (CA)
A modified Hummers’ Method was used to prepare the GO (Duch, Budinger et al. 2011,
Chowdhury, Duch et al. 2013). MoS2 was prepared using a lithium intercalation method as
described previously (Lanphere, Luth et al. 2015). Hydrodynamic diameter (Dh) and zeta potential
12
(ζ-potential) of the materials were measured using a Zeta Sizer Nano ZS (Malvern Instruments,
Worcestershire, U.K.) as described in previous articles (Childress and Elimelech 1996,
Chowdhury, Duch et al. 2013, Lanphere, Luth et al. 2015, Esfahani, Languri et al. 2016).
4.2 Thin-Film Selective Layer Synthesis
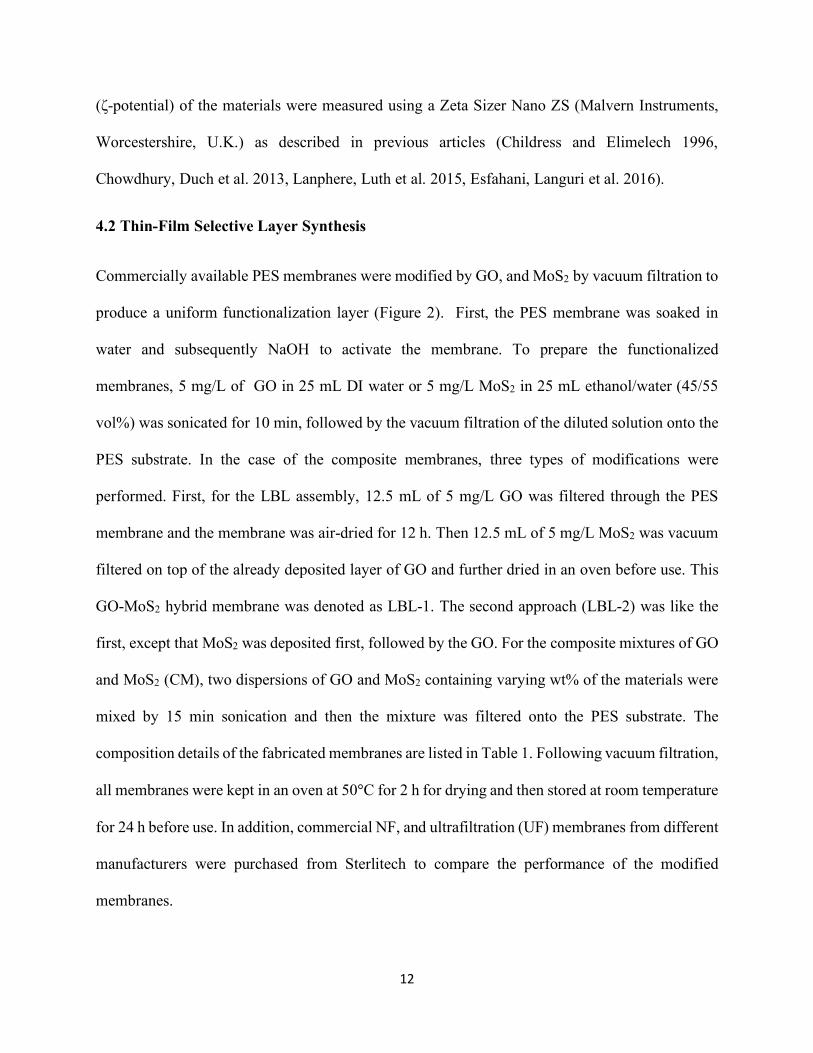
Commercially available PES membranes were modified by GO, and MoS2 by vacuum filtration to
produce a uniform functionalization layer (Figure 2). First, the PES membrane was soaked in
water and subsequently NaOH to activate the membrane. To prepare the functionalized
membranes, 5 mg/L of GO in 25 mL DI water or 5 mg/L MoS2 in 25 mL ethanol/water (45/55
vol%) was sonicated for 10 min, followed by the vacuum filtration of the diluted solution onto the
PES substrate. In the case of the composite membranes, three types of modifications were
performed. First, for the LBL assembly, 12.5 mL of 5 mg/L GO was filtered through the PES
membrane and the membrane was air-dried for 12 h. Then 12.5 mL of 5 mg/L MoS2 was vacuum
filtered on top of the already deposited layer of GO and further dried in an oven before use. This
GO-MoS2 hybrid membrane was denoted as LBL-1. The second approach (LBL-2) was like the
first, except that MoS2 was deposited first, followed by the GO. For the composite mixtures of GO
and MoS2 (CM), two dispersions of GO and MoS2 containing varying wt% of the materials were
mixed by 15 min sonication and then the mixture was filtered onto the PES substrate. The
composition details of the fabricated membranes are listed in Table 1. Following vacuum filtration,
all membranes were kept in an oven at 50°C for 2 h for drying and then stored at room temperature
for 24 h before use. In addition, commercial NF, and ultrafiltration (UF) membranes from different
manufacturers were purchased from Sterlitech to compare the performance of the modified
membranes.
13
4.3 Cross-flow filtration set-up
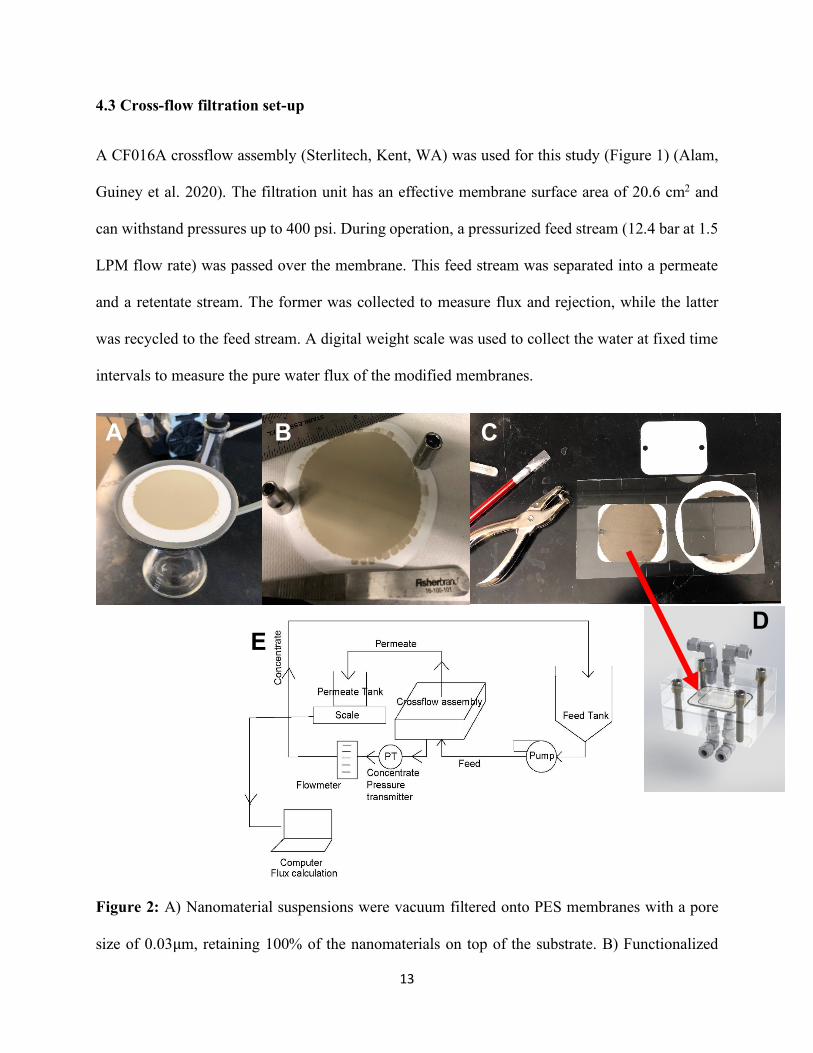
A CF016A crossflow assembly (Sterlitech, Kent, WA) was used for this study (Figure 1) (Alam,
Guiney et al. 2020). The filtration unit has an effective membrane surface area of 20.6 cm2 and
can withstand pressures up to 400 psi. During operation, a pressurized feed stream (12.4 bar at 1.5
LPM flow rate) was passed over the membrane. This feed stream was separated into a permeate
and a retentate stream. The former was collected to measure flux and rejection, while the latter
was recycled to the feed stream. A digital weight scale was used to collect the water at fixed time
intervals to measure the pure water flux of the modified membranes.
Figure 2: A) Nanomaterial suspensions were vacuum filtered onto PES membranes with a pore
size of 0.03µm, retaining 100% of the nanomaterials on top of the substrate. B) Functionalized
A
E
C B
D
14
membranes were thermally treated at 60°C and then kept at room temperature overnight. The
modified membranes were cut to the desired sizes to fit into the cross-flow assembly (C & D). E)
Schematic of the crossflow assembly used for the fouling studies.
GO-MoS2 nanomaterials were vacuum filtered onto a PES substrate first and then were placed into
the system (Figure 2A-D). All the commercial membranes were placed directly in the cross-flow
assembly (Figure 2D) and the system was equilibrated till a stable water flux was achieved.
4.4 Characterization of materials and membrane
4.4.1 Electrokinetic and hydrodynamic characterization
Zeta Sizer Nano ZS from Malvern Instruments, Worcestershire, U.K. was used to determine the
zeta (ζ) potential and size (Dh) and of the GO and MoS2 nanosheets.(Childress and Elimelech 1996,
Lanphere, Luth et al. 2015). The instrument is equipped with a He-Ne laser that had a fixed 633
nm wavelength and uses the Stokes-Einstein equation for calculating the average size (Elimelech,
Gregory et al. 2013). Zeta potentials of the nanosheets were also measured using the same
instrument. For potential calculations, the instrument uses dynamic light scattering (DLS) for
determining the electrophoretic mobility of charged particles (Bouchard, Ma et al. 2009). ZetaSizer
Nano ZS is programmed to use the Smoluchowski equation to calculate the zeta-potential from the
electrophoretic mobility (Elimelech, Gregory et al. 2013).
15
4.4.2 XPS analysis and SEM imaging
XPS samples were prepared and analyzed using an ESCALAB 250Xi (Thermo Scientific)
following a similar procedure as described previously published work (Hou, Chowdhury et al.
2015, Alam, Guiney et al. 2020). 5 mg of each sample was vacuum filtered onto a 0.1 µm PTFE
membrane. The deposited film was left to settle for 15 minutes followed by rinsing and drying in
DI water and air, respectively. XPS was also used to determine the surface composition and
chemistry of the modified membranes using a procedure similar to previously published work
(Hou, Chowdhury et al. 2015).
SEM Tescan Vega3 with EDAX capability was used to investigate the surface morphology and
cross-section of the modified and unmodified membranes. Membranes were cut into small pieces
and placed on the sample stubs using conductive carbon tabs. To avoid charging artifacts during
imaging a gold coater (Technics Hummer V Sputter) was used for coating the SEM samples with
a 5 nm conductive layer of gold. Thickness was controlled by manipulating the time and voltage.
3 min at 10 milliamps resulted in a coating thickness of approximately 7-10 nm on top of the
samples. For the thickness measurements, the membranes were cut into small pieces and
submerged in liquid nitrogen for the 60-90s. The frozen membranes were cleaved and kept in the
desiccator to dry completely followed by sputter-coated before imaging.
Transmission electron microscopy (TEM) was used to determine the thickness of the deposited
nanomaterials onto PES substrate. Before TEM analysis, membranes were cast into SPURR resin
for a week and then cured in an oven for overnight. After that, the cured membranes embedded
blocks were microtomed (Leica Reichert Ultracut R ultramicrotome) to 50 nm slices before being
analyzed under TEM.
16
4.4.3 Contact Angle Measurement
The hydrophilicity of unmodified and modified membranes was evaluated using the contact angle
(CA) analysis. Droplets of 2 µL were brought into contact with the membrane surface, and a side
view image was taken immediately using a Data Physics OCA15 Contact Angle Analyzer. 2 µL
droplets were brought into the contact of the membrane surface, and images were taken
immediately to measure the water contact angles of the modified membranes. At first clean SiO2
wafers were coated with 0.02 mg mL-1 GO, rGO, and MoS2 dispersions (25 µL). Water droplets
of 2 µL were injected onto the surface of interests, and the water contact angles were measured
immediately. 5 replicates were taken from different areas of each membrane.
4.4.4. Pore Size Determination
Altered pore size (rm) of the modified membranes was determined from the Gueroute Elforde Ferry
equation(Wu, Gan et al. 2008):
𝑟$ = &[(2.9 − 1.75 ∗ 𝜀)(8 ∗ µ ∗ 𝜁 ∗ 𝑄6)]
(𝜀 ∗ 𝐴$ ∗ ∆𝑃)(1)
where ζ is the membrane thickness including the thickness of the deposited nanosheets (m), QW is
the water flux (m3 s-1) after 24 h equilibration at constant operating pressure (7 bar), Am is the
active membrane area (m2), µ is the water viscosity (Pa. s), ∆P is the applied pressure (MPa), and
ε is the membrane porosity that was determined using the following equation(Vatanpour, Madaeni
et al. 2012):
𝜀 = =1>=2
?m∗A∗B6 (2)
17
where ω1 and ω2 are the weight of the wet and dry membrane respectively, and dw is the density
of water (998 kg m-3).
4.5 Water flux and TDS removal performance evaluation
The TDS removal and water flux of the membranes were evaluated using the cross-flow assembly.
Prior to any measurement, the membrane was compacted with pure water at a pressure of 12.4 bar
for 24 h in order to achieve a steady-state condition. The pure water flux rejection of each
membrane was evaluated in this study. All filtration experiments were conducted at room
temperature. Water flux of the commercial and lab-prepared membranes was determined in terms
of equilibrated pure water flux (Lm-2h1). The equilibrated water flux and wastewater flux were
calculated using the following equation:
𝐽o=D
?m∗∆E
where M is the weight of the permeate pure water (kg) and Δt is the permeation time (h). The TDS
removal, R (%), of the membranes, was determined using the equation:
𝑅= G1- IJIKL ∗ 100%
where Cf and Cp are the salt concentration in the feed and permeate solution, respectively. A bench
conductivity meter (ThermoFisher Scientific) was used to measure the salt concentration in the
feed and permeate solution. Then using a factor of 0.67, the conductivities of the solutions were
converted to TDS. For the experiment, Quincy industrial wastewater was used as the feed solution
at an operating pressure of 12.4 bar.
18
4.6 Antifouling performance of the membranes
Before each fouling experiment, the membranes were equilibrated for 24 h until a stable pure water
flux (J0) was attained. The flux decline was determined for all the membranes against the feed
wastewater. Before any fouling experiment, the water flux was re-equilibrated to 180 Lm-2h-1 by
adjusting the pressure to eliminate all other factors that can account for the flux decline of the
membranes except fouling. Fouling experiments with NF and GO-MoS2 composites NF were run
at 12.4 bar with a feed rate of 1.6 L min-1 and for UF and RO membrane the applied pressures on
the system were 10 bar and 17.5 bar respectively. However, even under that much high pressure,
the water flux of the RO membrane was only 55 Lm-2h-1. The initial low flux of the RO membrane
could result in less flux decline as it has been reported that the membranes with high initial flux
suffer higher flux decline during fouling study.(Seidel and Elimelech 2002) The experiments were
carried out at 20.5 ± 1 °C. The flux during the fouling study was calculated using the same equation
as pure water flux. The normalized flux decline (JB/JB0) was calculated, where JB0 is the flux at the
beginning of the fouling study and JB is the flux calculated at 5 min intervals during the fouling
study. Flux decline was reported as a function of total permeate volume. When the permeate flux
of the membranes declined to 30% of the initial flux, the membranes were cleaned for 15 min with
500 mg/L sodium hypochlorite (NaOCl) followed by 5 min DI water wash. During the wash, the
valve connected to the permeate side remained closed and the cleaning solution was only allowed
to flow across the membrane top surface. The 2nd cycle of the fouling study was conducted similar
to the 1st cycle.
The flux recovery ratio (FRR) was used to analyze the fouling resistance and regeneration
efficiency of the modified and unmodified membranes. The FRR was evaluated using the
following equation:
19
𝐹𝑅𝑅 = PQRQST ∗ 100%
5. Pressure-driven Water Transport Behavior and Antifouling Performance
of Two-Dimensional Nanomaterial Laminated Membranes
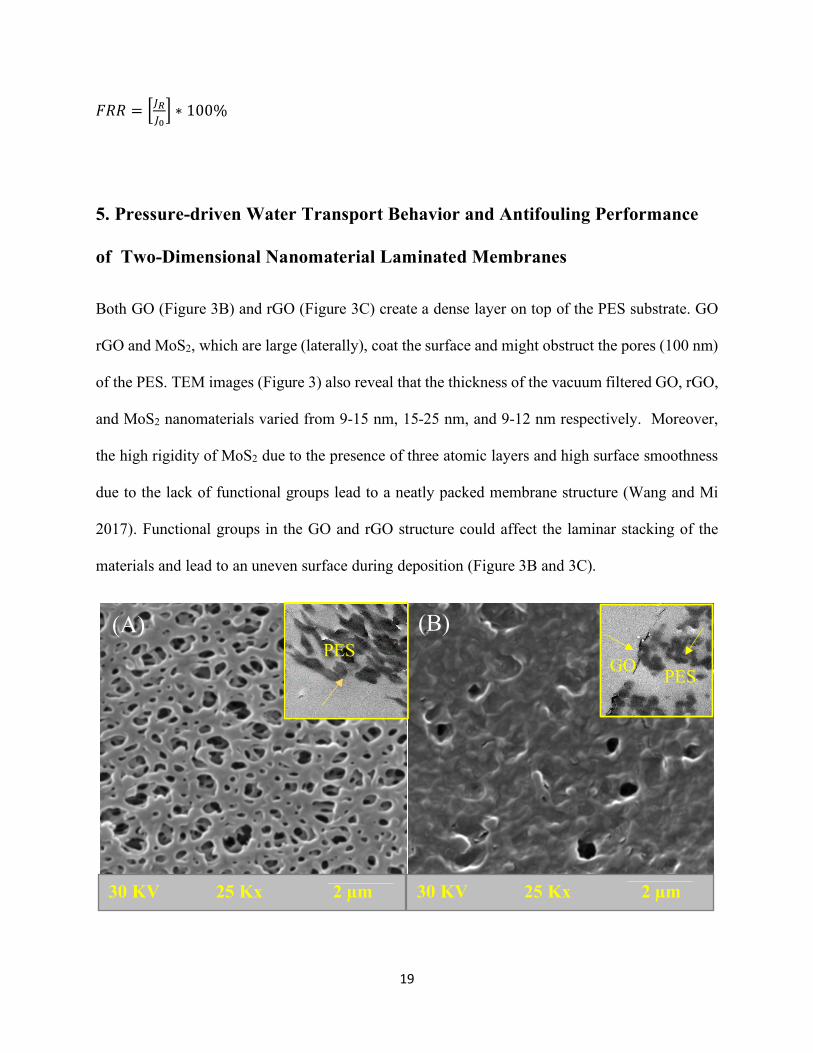
Both GO (Figure 3B) and rGO (Figure 3C) create a dense layer on top of the PES substrate. GO
rGO and MoS2, which are large (laterally), coat the surface and might obstruct the pores (100 nm)
of the PES. TEM images (Figure 3) also reveal that the thickness of the vacuum filtered GO, rGO,
and MoS2 nanomaterials varied from 9-15 nm, 15-25 nm, and 9-12 nm respectively. Moreover,
the high rigidity of MoS2 due to the presence of three atomic layers and high surface smoothness
due to the lack of functional groups lead to a neatly packed membrane structure (Wang and Mi
2017). Functional groups in the GO and rGO structure could affect the laminar stacking of the
materials and lead to an uneven surface during deposition (Figure 3B and 3C).
(A) (B)
30 KV 25 Kx 2 µm
30 KV 25 Kx 2 µm
GO PES PES
20
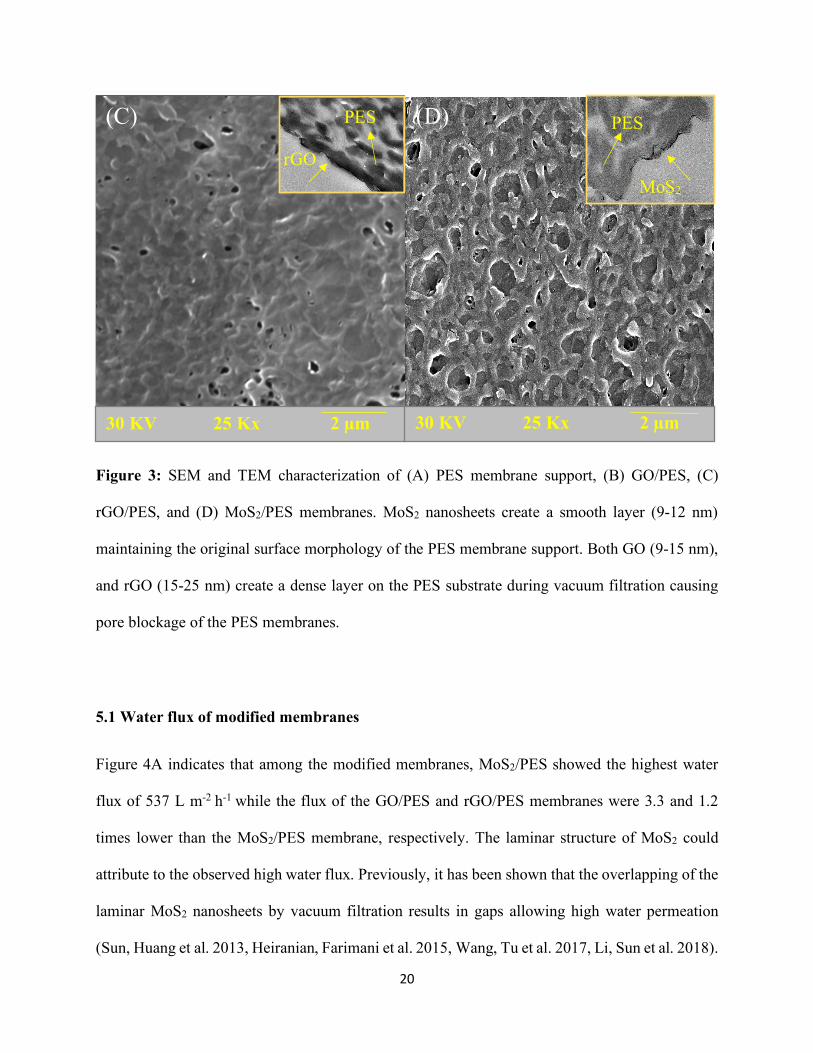
Figure 3: SEM and TEM characterization of (A) PES membrane support, (B) GO/PES, (C)
rGO/PES, and (D) MoS2/PES membranes. MoS2 nanosheets create a smooth layer (9-12 nm)
maintaining the original surface morphology of the PES membrane support. Both GO (9-15 nm),
and rGO (15-25 nm) create a dense layer on the PES substrate during vacuum filtration causing
pore blockage of the PES membranes.
5.1 Water flux of modified membranes
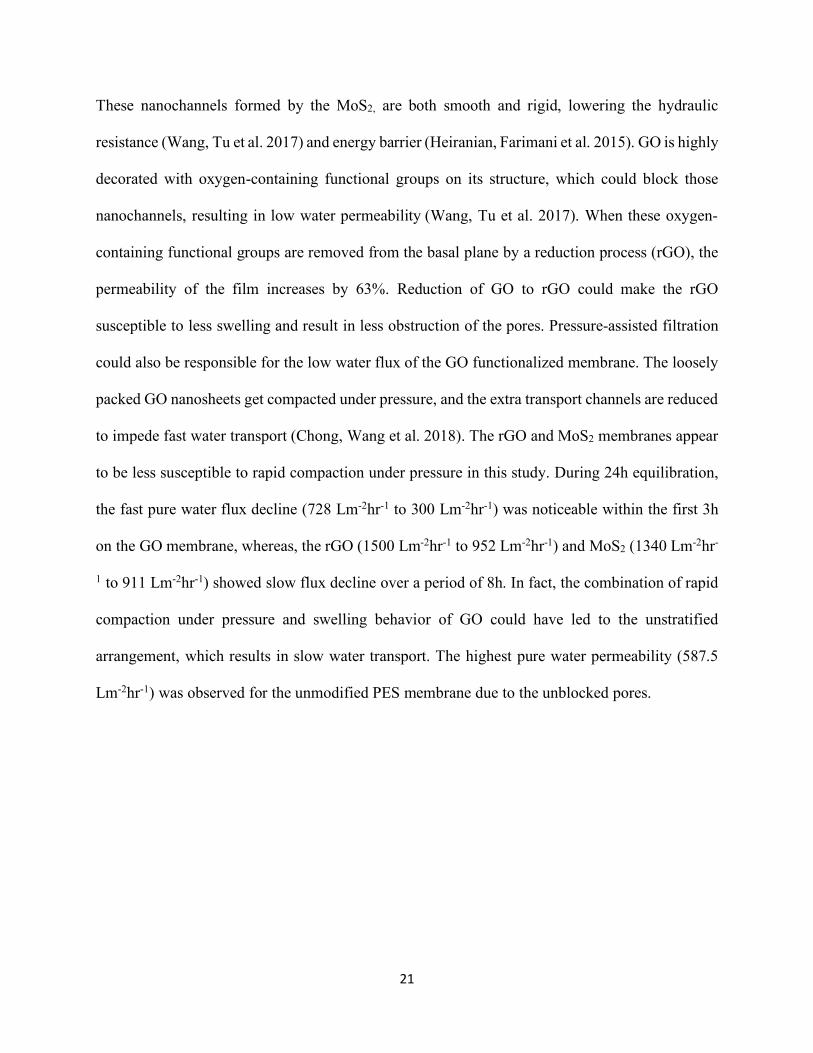
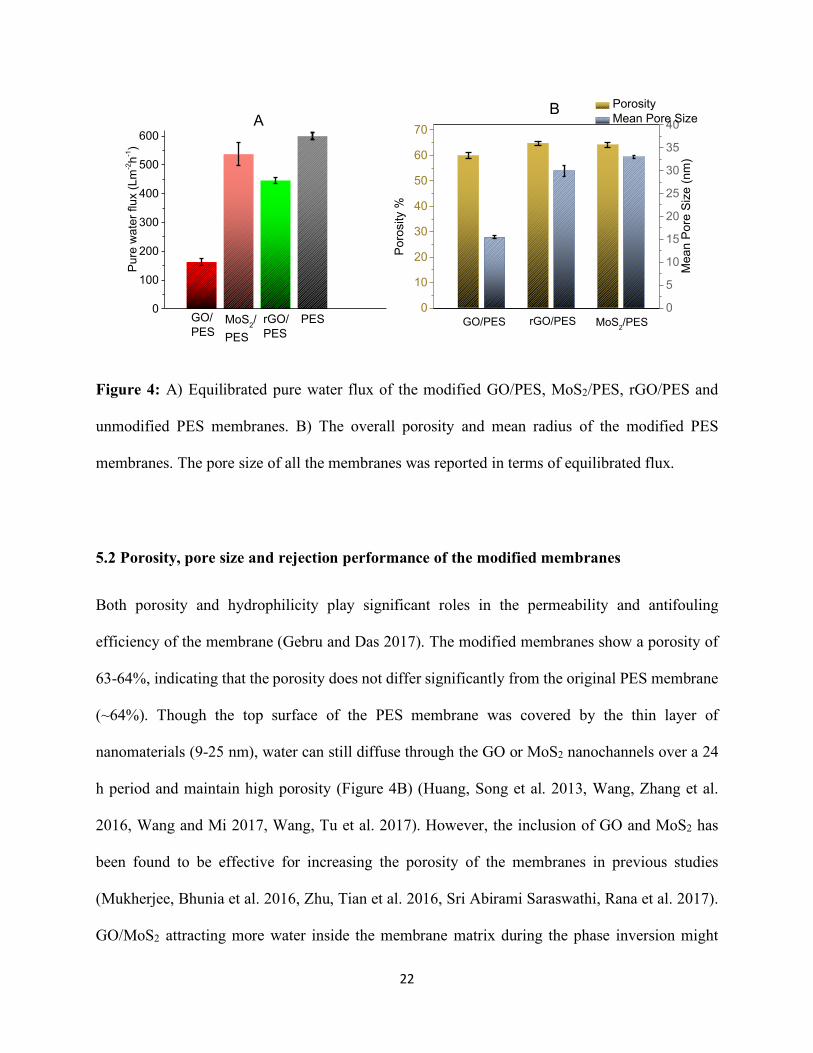
Figure 4A indicates that among the modified membranes, MoS2/PES showed the highest water
flux of 537 L m-2 h-1 while the flux of the GO/PES and rGO/PES membranes were 3.3 and 1.2
times lower than the MoS2/PES membrane, respectively. The laminar structure of MoS2 could
attribute to the observed high water flux. Previously, it has been shown that the overlapping of the
laminar MoS2 nanosheets by vacuum filtration results in gaps allowing high water permeation
(Sun, Huang et al. 2013, Heiranian, Farimani et al. 2015, Wang, Tu et al. 2017, Li, Sun et al. 2018).
(C)
30 KV 25 Kx 2 µm
30 KV 25 Kx 2 µm
rGO
PES PES
MoS2
(D)
21
These nanochannels formed by the MoS2, are both smooth and rigid, lowering the hydraulic
resistance (Wang, Tu et al. 2017) and energy barrier (Heiranian, Farimani et al. 2015). GO is highly
decorated with oxygen-containing functional groups on its structure, which could block those
nanochannels, resulting in low water permeability (Wang, Tu et al. 2017). When these oxygen-
containing functional groups are removed from the basal plane by a reduction process (rGO), the
permeability of the film increases by 63%. Reduction of GO to rGO could make the rGO
susceptible to less swelling and result in less obstruction of the pores. Pressure-assisted filtration
could also be responsible for the low water flux of the GO functionalized membrane. The loosely
packed GO nanosheets get compacted under pressure, and the extra transport channels are reduced
to impede fast water transport (Chong, Wang et al. 2018). The rGO and MoS2 membranes appear
to be less susceptible to rapid compaction under pressure in this study. During 24h equilibration,
the fast pure water flux decline (728 Lm-2hr-1 to 300 Lm-2hr-1) was noticeable within the first 3h
on the GO membrane, whereas, the rGO (1500 Lm-2hr-1 to 952 Lm-2hr-1) and MoS2 (1340 Lm-2hr-
1 to 911 Lm-2hr-1) showed slow flux decline over a period of 8h. In fact, the combination of rapid
compaction under pressure and swelling behavior of GO could have led to the unstratified
arrangement, which results in slow water transport. The highest pure water permeability (587.5
Lm-2hr-1) was observed for the unmodified PES membrane due to the unblocked pores.
22
Figure 4: A) Equilibrated pure water flux of the modified GO/PES, MoS2/PES, rGO/PES and
unmodified PES membranes. B) The overall porosity and mean radius of the modified PES
membranes. The pore size of all the membranes was reported in terms of equilibrated flux.
5.2 Porosity, pore size and rejection performance of the modified membranes
Both porosity and hydrophilicity play significant roles in the permeability and antifouling
efficiency of the membrane (Gebru and Das 2017). The modified membranes show a porosity of
63-64%, indicating that the porosity does not differ significantly from the original PES membrane
(~64%). Though the top surface of the PES membrane was covered by the thin layer of
nanomaterials (9-25 nm), water can still diffuse through the GO or MoS2 nanochannels over a 24
h period and maintain high porosity (Figure 4B) (Huang, Song et al. 2013, Wang, Zhang et al.
2016, Wang and Mi 2017, Wang, Tu et al. 2017). However, the inclusion of GO and MoS2 has
been found to be effective for increasing the porosity of the membranes in previous studies
(Mukherjee, Bhunia et al. 2016, Zhu, Tian et al. 2016, Sri Abirami Saraswathi, Rana et al. 2017).
GO/MoS2 attracting more water inside the membrane matrix during the phase inversion might
0
100
200
300
400
500
600
PESrGO/PES
MoS2/PES
Pure
wat
er fl
ux (L
m-2h-1
)
GO/PES
A
0
10
20
30
40
50
60
70
Poro
sity
%
MoS2/PESrGO/PESGO/PES0
5
10
15
20
25
30
35
40
Porosity Mean Pore Size
Mea
n Po
re S
ize
(nm
)
B
23
have increased the membrane porosity in those cases (Mukherjee, Bhunia et al. 2016). However,
a simple vacuum filtration was used to keep the nanomaterials exposed on the surfaces in this
study and the water uptake by the nanochannels of the thin-layered materials was minimal.
Moreover, water from the top surface of the wet membranes was further dried by the filter paper
during the porosity measurement, which removed the water held by the nanomaterials. Figure 4B
also shows that the pore size of the different membranes, calculated using Equation 3 where
equilibrated (after 24 h) pure water flux was used, differed significantly even if the same amount
of materials was deposited onto the substrate. The pore size of the GO/PES membrane was
significantly smaller (~15.4 nm) than MoS2/PES (~33 nm) and rGO/PES (~30 nm). Though
Gueroute Elforde Ferry equation uses water flux to measure the pore size, it was used to predict
the altered pore size of nanomaterial functionalized membranes in previous studies (Wu, Gan et
al. 2008, Wang, Zhu et al. 2018). It was clear that the pore size of the laminated membranes atop
0.1 µm PES substrate was in the ultrafiltration (UF) range and could be used for albumin protein,
virus, carbon black, and gelatin separation (Otaki, Yano et al. 1998, Lohwacharin, Oguma et al.
2009, Lin, Hu et al. 2018, Arumugham, Amimodu et al. 2019, Kim, Dehlinger et al. 2019).
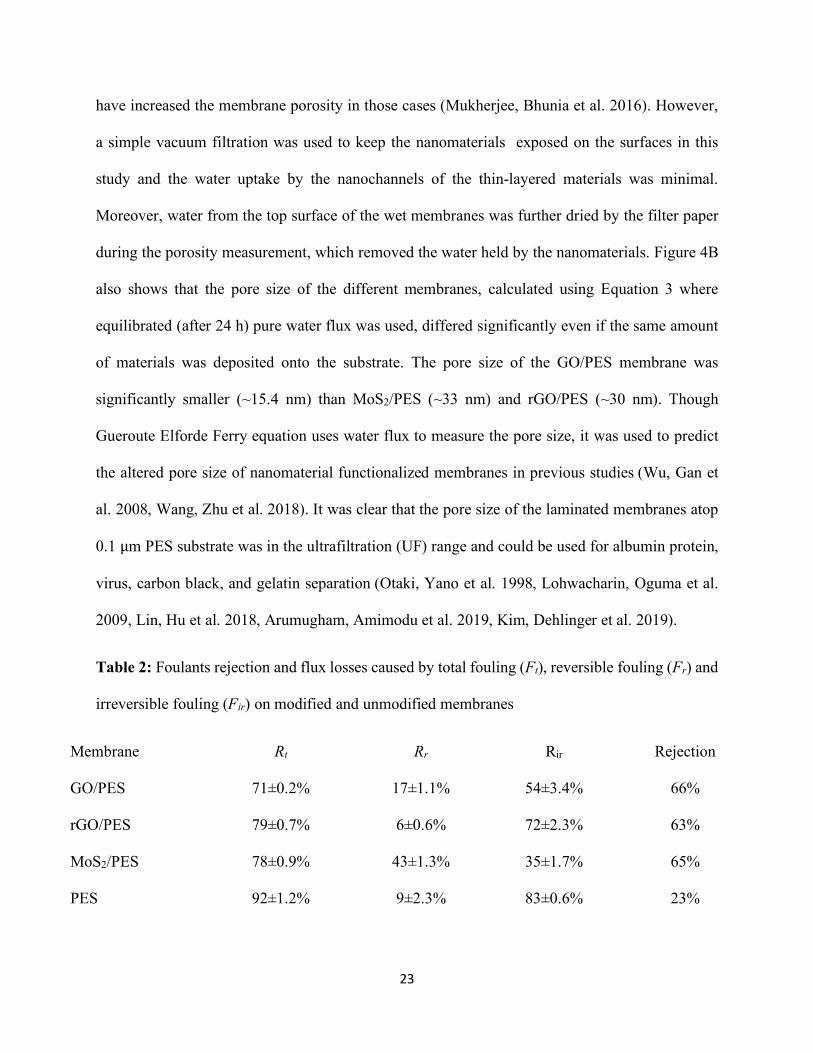
Table 2: Foulants rejection and flux losses caused by total fouling (Ft), reversible fouling (Fr) and
irreversible fouling (Fir) on modified and unmodified membranes
Membrane Rt Rr Rir Rejection
GO/PES 71±0.2% 17±1.1% 54±3.4% 66%
rGO/PES 79±0.7% 6±0.6% 72±2.3% 63%
MoS2/PES 78±0.9% 43±1.3% 35±1.7% 65%
PES 92±1.2% 9±2.3% 83±0.6% 23%
24
All modified membranes with larger pore diameter than BSA (~2.6 nm) (Erickson 2009) and SA
(~7 nm) (Dembczynski and Jankowski 2001) molecules still showed reasonable foulants rejection
(Table 2) performance (63-66%), indicating that size exclusion was not the dominating mechanism
for rejection. Both the modified membranes and BSA/SA are negatively charged in the
experimental condition and therefore the foulants were most likely rejected from the membrane
surface due to electrostatic repulsion (Bidsorkhi, Riazi et al. 2016, Sri Abirami Saraswathi, Rana
et al. 2017). The build-up of the additional hydration layer near the hydrophilic membrane surfaces
might also prevent the foulants from coming into contact with the surface, which results in higher
rejection (Emadzadeh, Lau et al. 2014).
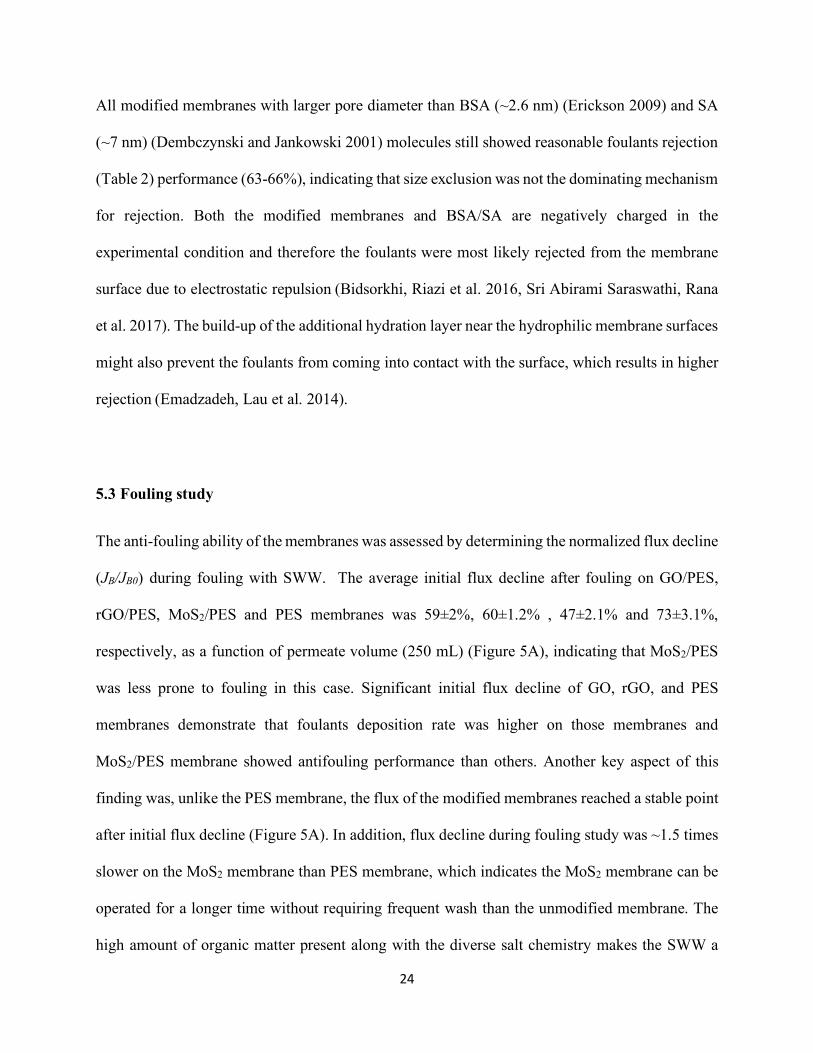
5.3 Fouling study
The anti-fouling ability of the membranes was assessed by determining the normalized flux decline
(JB/JB0) during fouling with SWW. The average initial flux decline after fouling on GO/PES,
rGO/PES, MoS2/PES and PES membranes was 59±2%, 60±1.2% , 47±2.1% and 73±3.1%,
respectively, as a function of permeate volume (250 mL) (Figure 5A), indicating that MoS2/PES
was less prone to fouling in this case. Significant initial flux decline of GO, rGO, and PES
membranes demonstrate that foulants deposition rate was higher on those membranes and
MoS2/PES membrane showed antifouling performance than others. Another key aspect of this
finding was, unlike the PES membrane, the flux of the modified membranes reached a stable point
after initial flux decline (Figure 5A). In addition, flux decline during fouling study was ~1.5 times
slower on the MoS2 membrane than PES membrane, which indicates the MoS2 membrane can be
operated for a longer time without requiring frequent wash than the unmodified membrane. The
high amount of organic matter present along with the diverse salt chemistry makes the SWW a
25
more complex environment. The absence of a conjugated structure in MoS2 could help avoid the
problem of mineral scaling and organic fouling (Wang and Mi 2017). On the other hand, because
of divalent cation-π, π-π, and electrostatic interactions, GO, and other graphene-based membranes
suffer severe mineral scaling, especially CaCO3 and CaSO4 (Ray, Tadepalli et al. 2015, Wang and
Mi 2017). Slightly higher FRR provides another advantage of the MoS2/PES and GO/PES
membranes over the rGO/PES and PES membranes (Figure 6B). High FRR of MoS2 membranes
suggests that it would require less frequent wash intervals than PES or rGO membranes. The
high/low flux recovery is directly related to the reversible/irreversible fouling occurring on the
respective membranes.
Figure 5: A) Normalized flux decline (JB/JBo) of modified and unmodified PES membranes during
the fouling study with SWW. B) Flux recovery of unmodified and modified PES membranes after
2 h during the fouling study with SWW and 15 min DI water wash.
0 50 100 150 200 2500.2
0.4
0.6
0.8
1.0 A
Nor
mal
ized
Flu
x, J
B/J B
0
Permeate Volume (mL)
GO/PESMoS2/PES rGO/PES PES
0.0
0.2
0.4
0.6
PESrGO/PES
MoS2/PES
Flux
reco
very
ratio
(FR
R)
GO/PES
B
26
Table 3 shows that the MoS2/PES surface was subjected to 43% reversible fouling while the GO
and rGO/PES surfaces experienced 17% and 6% reversible fouling. High irreversible
contamination on both the rGO and PES surfaces could be due to the hydrophobic nature of the
rGO and complex polymer matrices of PES, which was not easy to release by a simple DI wash.
Though the PES membrane used in this study is hydrophilic, as confirmed from the contact angle
measurement (50.6°±1.85°), it still suffered from severe fouling mainly due to its conjugated π
bonds.
Overall, from the fouling study, it is clear that the modified membranes demonstrate superior
antifouling performance over commercially available PES membranes. Moreover, under severe
fouling condition, MoS2 functionalized membranes outperform GO and rGO membranes due to
the absence of functional groups on its structure.
5.4 Summary
This work provides a deeper understanding of the pressure-driven water transport behavior and
antifouling performance of some exciting 2D nanomaterials (Figure 6). Pressure-assisted filtration
recognizes their potential for the membrane-based wastewater treatment in industries. Herein, a
facile method to laminate PES membranes with various 2D nanomaterials using vacuum filtration
is presented as the intention was to explore the surface chemistry of the nanomaterials on the
propensity of fouling. Overall, all modified membranes showed improved antifouling performance
over commercially available hydrophilic PES membranes. This assessment of the antifouling
performance under simulated fouling conditions will contribute to future studies especially
preparing membranes with MoS2 as it is a relatively new material in this field compared to GO
27
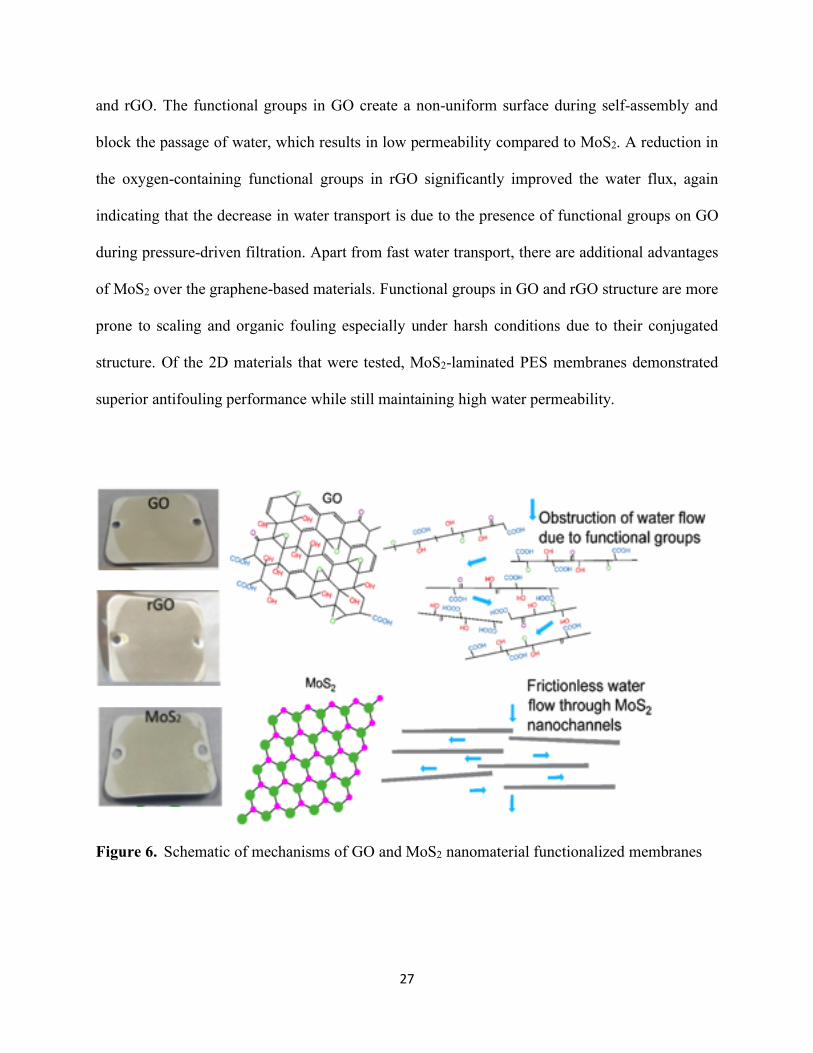
and rGO. The functional groups in GO create a non-uniform surface during self-assembly and
block the passage of water, which results in low permeability compared to MoS2. A reduction in
the oxygen-containing functional groups in rGO significantly improved the water flux, again
indicating that the decrease in water transport is due to the presence of functional groups on GO
during pressure-driven filtration. Apart from fast water transport, there are additional advantages
of MoS2 over the graphene-based materials. Functional groups in GO and rGO structure are more
prone to scaling and organic fouling especially under harsh conditions due to their conjugated
structure. Of the 2D materials that were tested, MoS2-laminated PES membranes demonstrated
superior antifouling performance while still maintaining high water permeability.
Figure 6. Schematic of mechanisms of GO and MoS2 nanomaterial functionalized membranes
28
6. Performance Evaluation of Two-Dimensional Nanomaterial-Based Composite Membranes for Wastewater Reuse
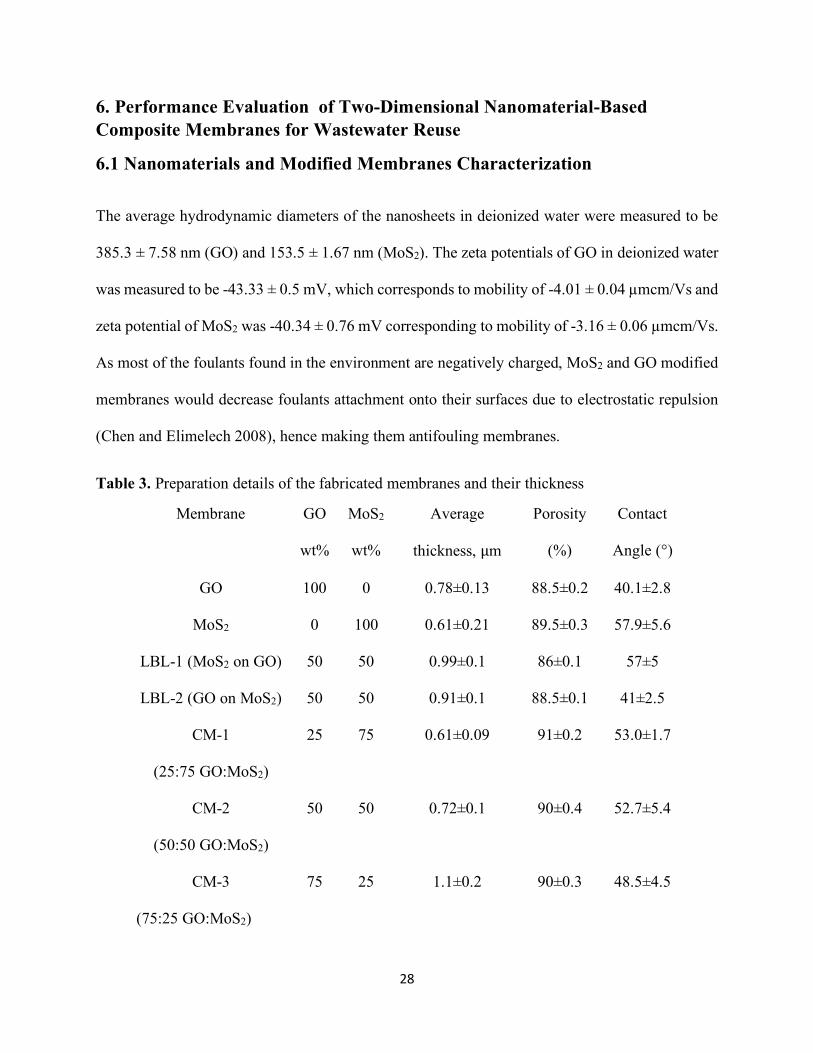
6.1 Nanomaterials and Modified Membranes Characterization
The average hydrodynamic diameters of the nanosheets in deionized water were measured to be
385.3 ± 7.58 nm (GO) and 153.5 ± 1.67 nm (MoS2). The zeta potentials of GO in deionized water
was measured to be -43.33 ± 0.5 mV, which corresponds to mobility of -4.01 ± 0.04 µmcm/Vs and
zeta potential of MoS2 was -40.34 ± 0.76 mV corresponding to mobility of -3.16 ± 0.06 µmcm/Vs.
As most of the foulants found in the environment are negatively charged, MoS2 and GO modified
membranes would decrease foulants attachment onto their surfaces due to electrostatic repulsion
(Chen and Elimelech 2008), hence making them antifouling membranes.
Table 3. Preparation details of the fabricated membranes and their thickness
Membrane GO
wt%
MoS2
wt%
Average
thickness, µm
Porosity
(%)
Contact
Angle (°)
GO 100 0 0.78±0.13 88.5±0.2 40.1±2.8
MoS2 0 100 0.61±0.21 89.5±0.3 57.9±5.6
LBL-1 (MoS2 on GO) 50 50 0.99±0.1 86±0.1 57±5
LBL-2 (GO on MoS2) 50 50 0.91±0.1 88.5±0.1 41±2.5
CM-1
(25:75 GO:MoS2)
25 75 0.61±0.09 91±0.2 53.0±1.7
CM-2
(50:50 GO:MoS2)
50 50 0.72±0.1 90±0.4 52.7±5.4
CM-3
(75:25 GO:MoS2)
75 25 1.1±0.2 90±0.3 48.5±4.5
29
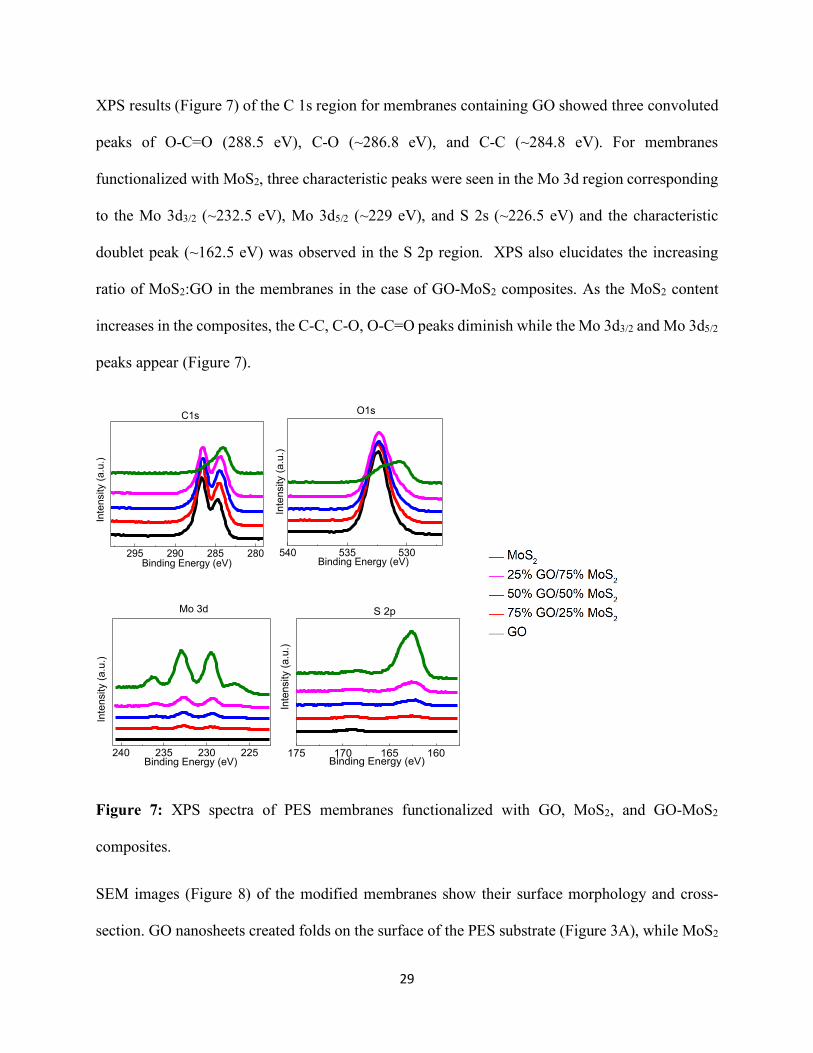
XPS results (Figure 7) of the C 1s region for membranes containing GO showed three convoluted
peaks of O-C=O (288.5 eV), C-O (~286.8 eV), and C-C (~284.8 eV). For membranes
functionalized with MoS2, three characteristic peaks were seen in the Mo 3d region corresponding
to the Mo 3d3/2 (~232.5 eV), Mo 3d5/2 (~229 eV), and S 2s (~226.5 eV) and the characteristic
doublet peak (~162.5 eV) was observed in the S 2p region. XPS also elucidates the increasing
ratio of MoS2:GO in the membranes in the case of GO-MoS2 composites. As the MoS2 content
increases in the composites, the C-C, C-O, O-C=O peaks diminish while the Mo 3d3/2 and Mo 3d5/2
peaks appear (Figure 7).
Figure 7: XPS spectra of PES membranes functionalized with GO, MoS2, and GO-MoS2
composites.
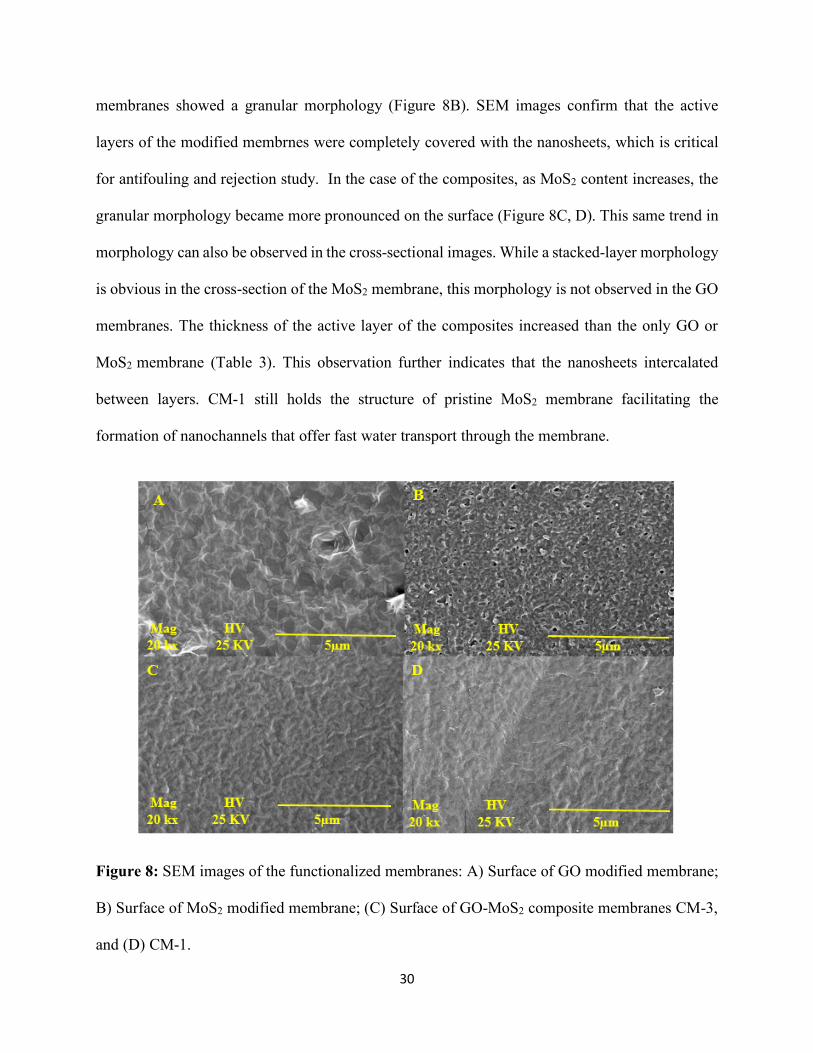
SEM images (Figure 8) of the modified membranes show their surface morphology and cross-
section. GO nanosheets created folds on the surface of the PES substrate (Figure 3A), while MoS2
280285290295
Inte
nsity
(a.u
.)
Binding Energy (eV)
C1s
530535540
Inte
nsity
(a.u
.)
Binding Energy (eV)
O1s
225230235240
Inte
nsity
(a.u
.)
Binding Energy (eV)
Mo 3d
160165170175
Inte
nsity
(a.u
.)
Binding Energy (eV)
S 2p
30
membranes showed a granular morphology (Figure 8B). SEM images confirm that the active
layers of the modified membrnes were completely covered with the nanosheets, which is critical
for antifouling and rejection study. In the case of the composites, as MoS2 content increases, the
granular morphology became more pronounced on the surface (Figure 8C, D). This same trend in
morphology can also be observed in the cross-sectional images. While a stacked-layer morphology
is obvious in the cross-section of the MoS2 membrane, this morphology is not observed in the GO
membranes. The thickness of the active layer of the composites increased than the only GO or
MoS2 membrane (Table 3). This observation further indicates that the nanosheets intercalated
between layers. CM-1 still holds the structure of pristine MoS2 membrane facilitating the
formation of nanochannels that offer fast water transport through the membrane.
Figure 8: SEM images of the functionalized membranes: A) Surface of GO modified membrane;
B) Surface of MoS2 modified membrane; (C) Surface of GO-MoS2 composite membranes CM-3,
and (D) CM-1.
31
The altered porosity of the functionalized membranes were calculated using Equations 1. The
porosity of all the membranes fell within the range of 86-92%. The porosity increased with the
addition of MoS2 (Table 3). The contact angle of the membranes increases with increasing ratio of
MoS2:GO in the membranes (Table 3) as a result of the hydrophilic nature of the GO. Thus, it is
anticipated that GO functionalized membranes will offer faster water transport (Wang, Zhu et al.
2018).
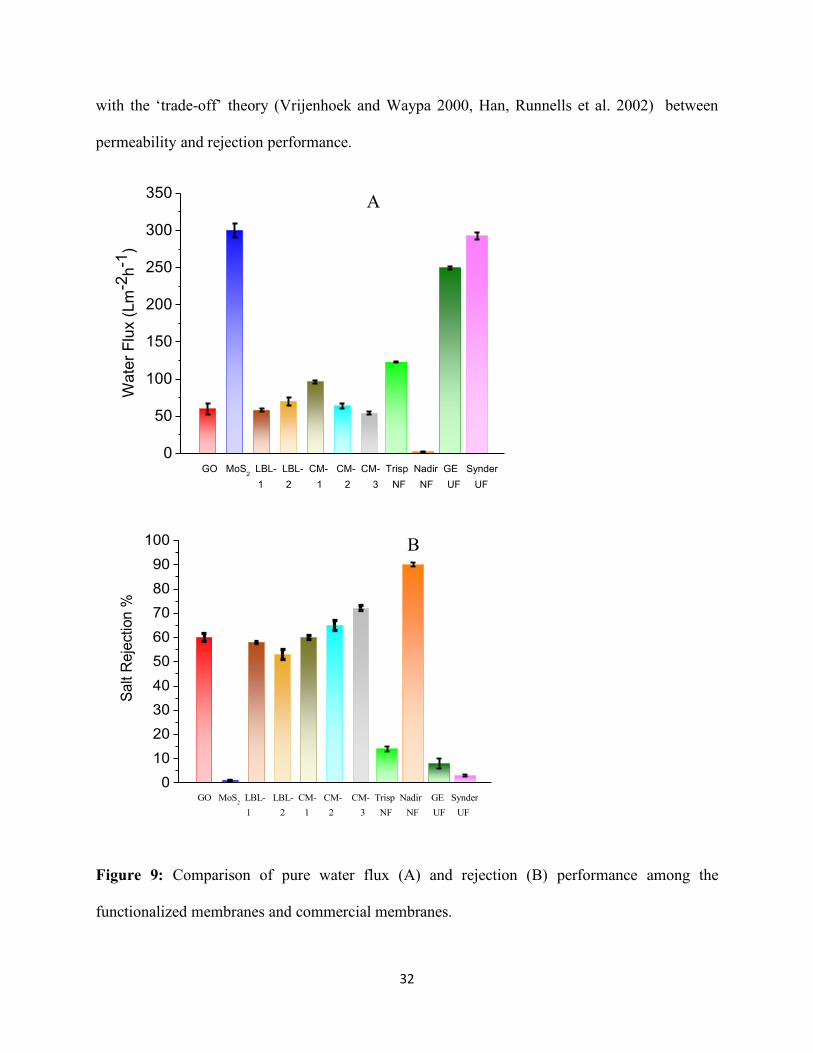
6.2 NF Performance of the GO/MoS2 Membranes
It is well-established that membrane permeability is directly related to the hydrophilicity and the
microstructure of the membrane. Although the membranes with high GO content were more
hydrophilic than MoS2 (Table 3), the water flux of the MoS2-modified PES membranes was 2.5-5
times higher than that of the GO-modified and composite membranes (Figure 9A). The laminated
MoS2 nanosheets could result in organized gaps and this attributes to the observed high water flux
(Sun, Huang et al. 2013, Wang, Tu et al. 2017, Li, Sun et al. 2018). Smooth and rigid MoS2
nanochannels lower the hydraulic resistance (Wang, Tu et al. 2017) and energy barrier (Heiranian,
Farimani et al. 2015). On the other hand, the side-pinning effect of the oxygenated functional
groups of GO affects fast water transport through its nanochannels (Wei, Peng et al. 2014, Zheng,
Tu et al. 2017, Alam, Guiney et al. 2020). Incorporation of MoS2 into a GO matrix results in higher
water flux, which increases with the addition of more MoS2 (Figure 9A). The slower water
transport behavior in the presence of more GO further supports the argument that the water flux is
decreased due to the side-pinning effect. On the other hand, the CM-3 composite (75 wt% GO/25
wt% MoS2) showed the highest salt rejection performance with a slight decrease in water
permeation rate compared to the GO membrane (Figure 9B). This observation is in accordance
32
with the ‘trade-off’ theory (Vrijenhoek and Waypa 2000, Han, Runnells et al. 2002) between
permeability and rejection performance.
Figure 9: Comparison of pure water flux (A) and rejection (B) performance among the
functionalized membranes and commercial membranes.
0
50
100
150
200
250
300
350
GO MoS2 LBL- LBL- CM- CM- CM- Trisp Nadir GE Synder 1 2 1 2 3 NF NF UF UF
Wat
er F
lux
(Lm
-2h-1
)
0102030405060708090
100
GO MoS2 LBL- LBL- CM- CM- CM- Trisp Nadir GE Synder 1 2 1 2 3 NF NF UF UF
Salt
Rej
ectio
n %
A
B
33
Due to the synergistic effect of the GO and MoS2, the trade-off relation between rejection and flux
has decreased. The CM-2 composite shows slightly higher salt rejection while maintaining a
similar water transport rate compared to the GO membrane. Similarly, the water flux of the CM-1
membrane was 1.6 times higher than the GO membrane while maintaining a similar rejection rate.
The Donnan exclusion mechanism, size exclusion, and non-swelling behavior could contribute to
the improved performance of the GO-MoS2 composites over the GO and MoS2 coated membranes
as will be discussed in the following section. Commercial NP010 (Microdyn NadirTM) showed
better rejection performance than the composite membranes, but permeate flux dropped
significantly from 54 Lm-2h-1 (CM-3) to 2.33 Lm-2h-1 (NP010) under the same operating
conditions. On the other hand, SBNF (TrisepTM) offered 2.5 times higher water flux, but it showed
22% less salt rejection than our CM-3 membrane. In addition, it can be seen that the water
permeability and rejection behavior of the composite GO-MoS2 membranes developed here were
comparable with NF membranes reported in the literature. Considering the flux-rejection “trade-
off” theory, it can be concluded that lab developed both LBL assembled and GO-MoS2 composite
(CM) membranes simultaneously offer high water flux and excellent rejection performance.
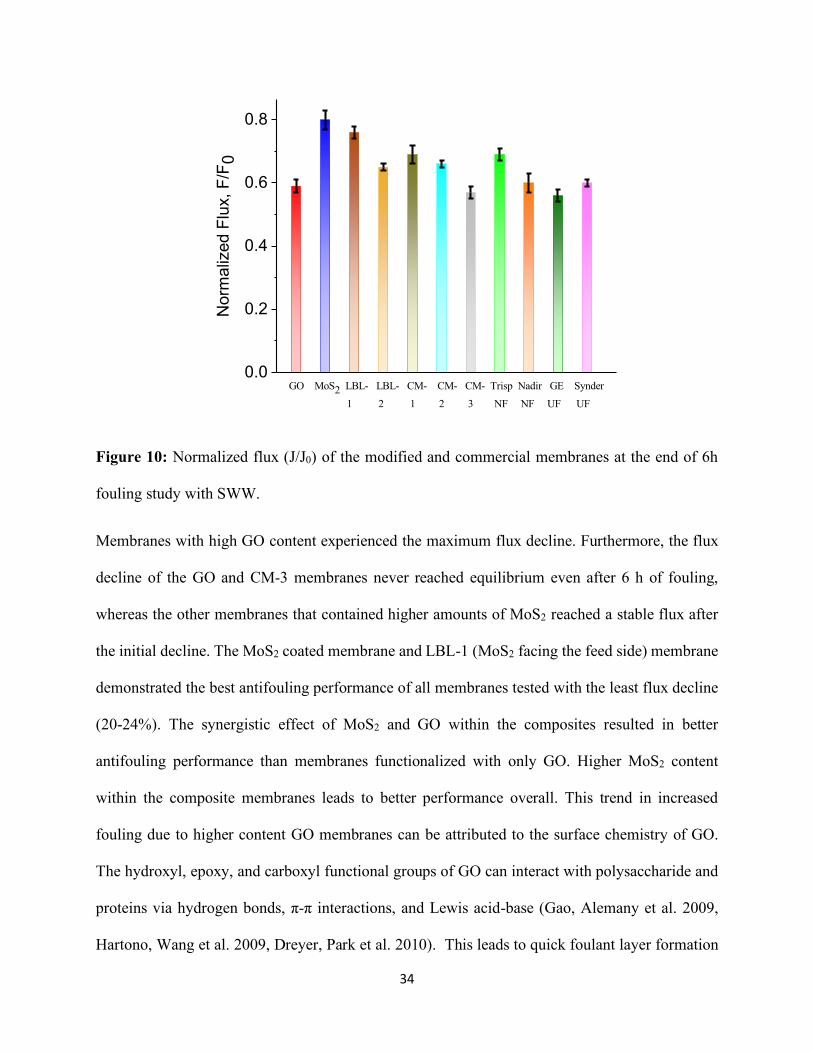
6.3 Antifouling Study
The antifouling performance of the membranes was assessed in terms of normalized flux decline
(JB/JB0) after 6h fouling study with synthetic wastewater (SWW) solution. Figure 10 shows that
the GO functionalized membranes were susceptible to fast-flux decline than MoS2 functionalized
membranes.
34
Figure 10: Normalized flux (J/J0) of the modified and commercial membranes at the end of 6h
fouling study with SWW.
Membranes with high GO content experienced the maximum flux decline. Furthermore, the flux
decline of the GO and CM-3 membranes never reached equilibrium even after 6 h of fouling,
whereas the other membranes that contained higher amounts of MoS2 reached a stable flux after
the initial decline. The MoS2 coated membrane and LBL-1 (MoS2 facing the feed side) membrane
demonstrated the best antifouling performance of all membranes tested with the least flux decline
(20-24%). The synergistic effect of MoS2 and GO within the composites resulted in better
antifouling performance than membranes functionalized with only GO. Higher MoS2 content
within the composite membranes leads to better performance overall. This trend in increased
fouling due to higher content GO membranes can be attributed to the surface chemistry of GO.
The hydroxyl, epoxy, and carboxyl functional groups of GO can interact with polysaccharide and
proteins via hydrogen bonds, π-π interactions, and Lewis acid-base (Gao, Alemany et al. 2009,
Hartono, Wang et al. 2009, Dreyer, Park et al. 2010). This leads to quick foulant layer formation
0.0
0.2
0.4
0.6
0.8
Nor
mal
ized
Flu
x, F
/F0
GO MoS2 LBL- LBL- CM- CM- CM- Trisp Nadir GE Synder
1 2 1 2 3 NF NF UF UF
35
on GO membranes (Alam, Guiney et al. 2018), hence fast flux decline. On the other hand, lack of
functional groups on MoS2 results in lower interaction with the functional groups of
polysaccharide and proteins (Alam, Guiney et al. 2018, Alam, Guiney et al. 2019, Alam, Guiney
et al. 2020). Less foulants attachment on MoS2 thus lead to least flux decline after 6h fouling study.
MoS2 functionalized membranes were also less prone to fouling than all the commercial
membranes, indicating the superior antifouling performance of MoS2 over polymeric membranes.
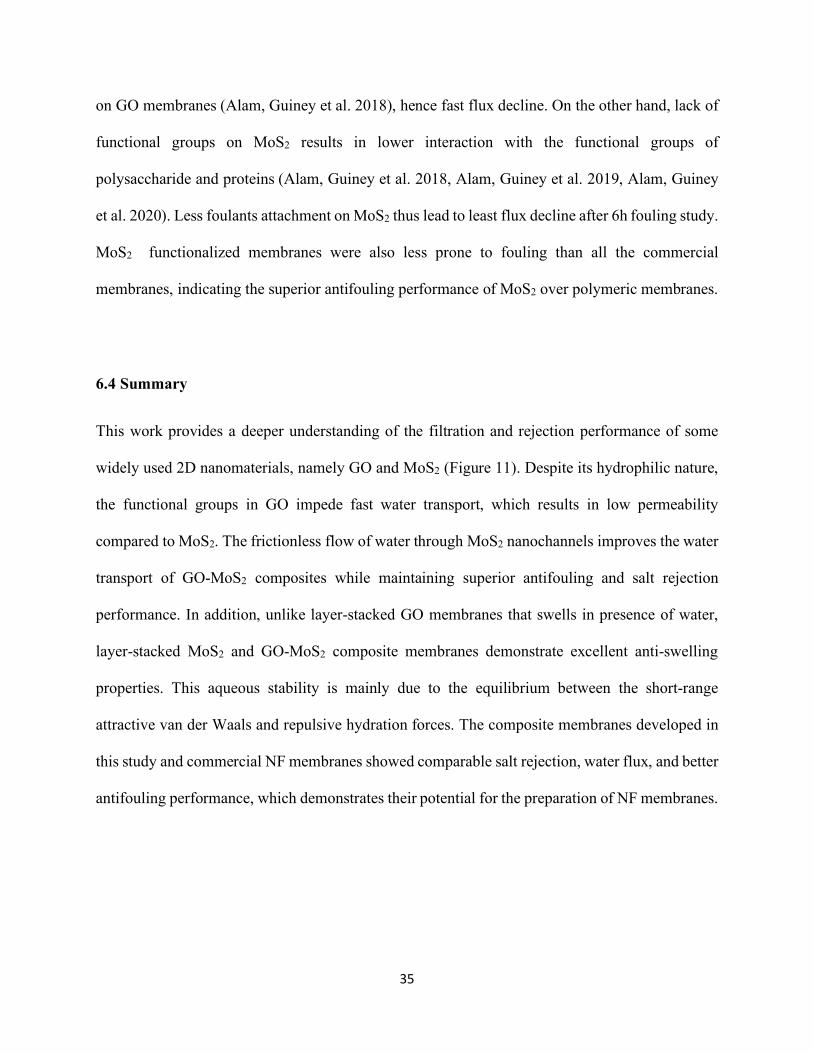
6.4 Summary
This work provides a deeper understanding of the filtration and rejection performance of some
widely used 2D nanomaterials, namely GO and MoS2 (Figure 11). Despite its hydrophilic nature,
the functional groups in GO impede fast water transport, which results in low permeability
compared to MoS2. The frictionless flow of water through MoS2 nanochannels improves the water
transport of GO-MoS2 composites while maintaining superior antifouling and salt rejection
performance. In addition, unlike layer-stacked GO membranes that swells in presence of water,
layer-stacked MoS2 and GO-MoS2 composite membranes demonstrate excellent anti-swelling
properties. This aqueous stability is mainly due to the equilibrium between the short-range
attractive van der Waals and repulsive hydration forces. The composite membranes developed in
this study and commercial NF membranes showed comparable salt rejection, water flux, and better
antifouling performance, which demonstrates their potential for the preparation of NF membranes.
36
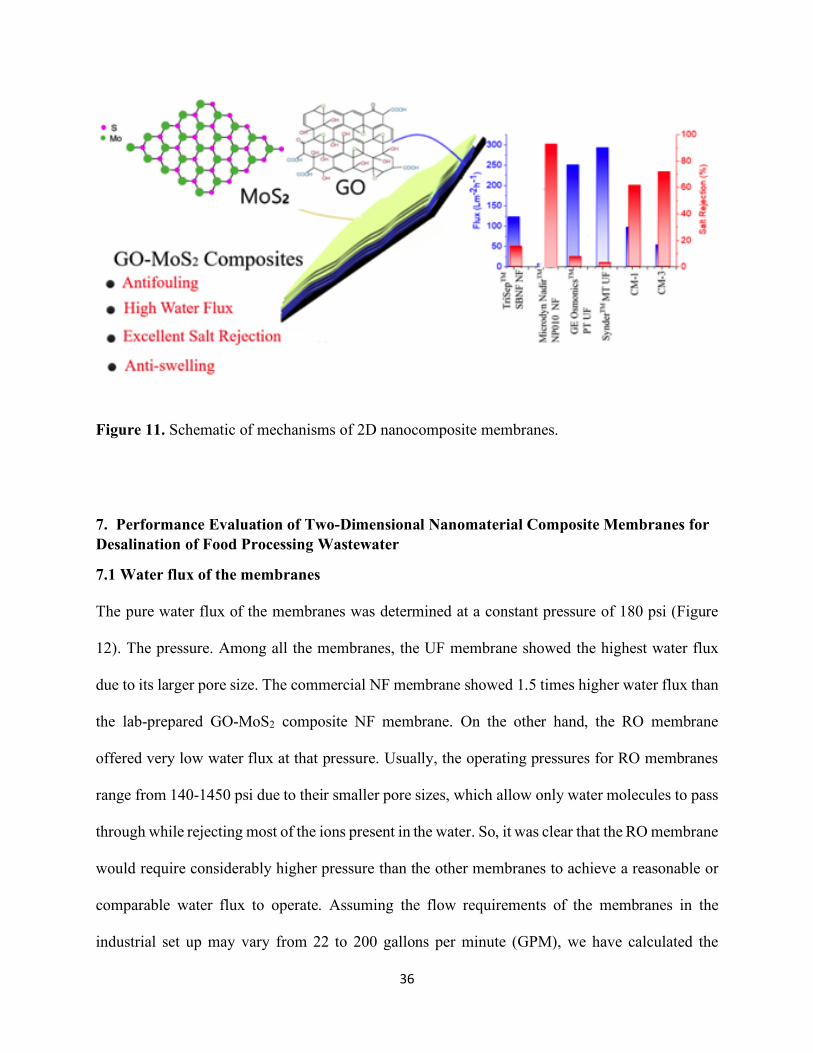
Figure 11. Schematic of mechanisms of 2D nanocomposite membranes.
7. Performance Evaluation of Two-Dimensional Nanomaterial Composite Membranes for Desalination of Food Processing Wastewater
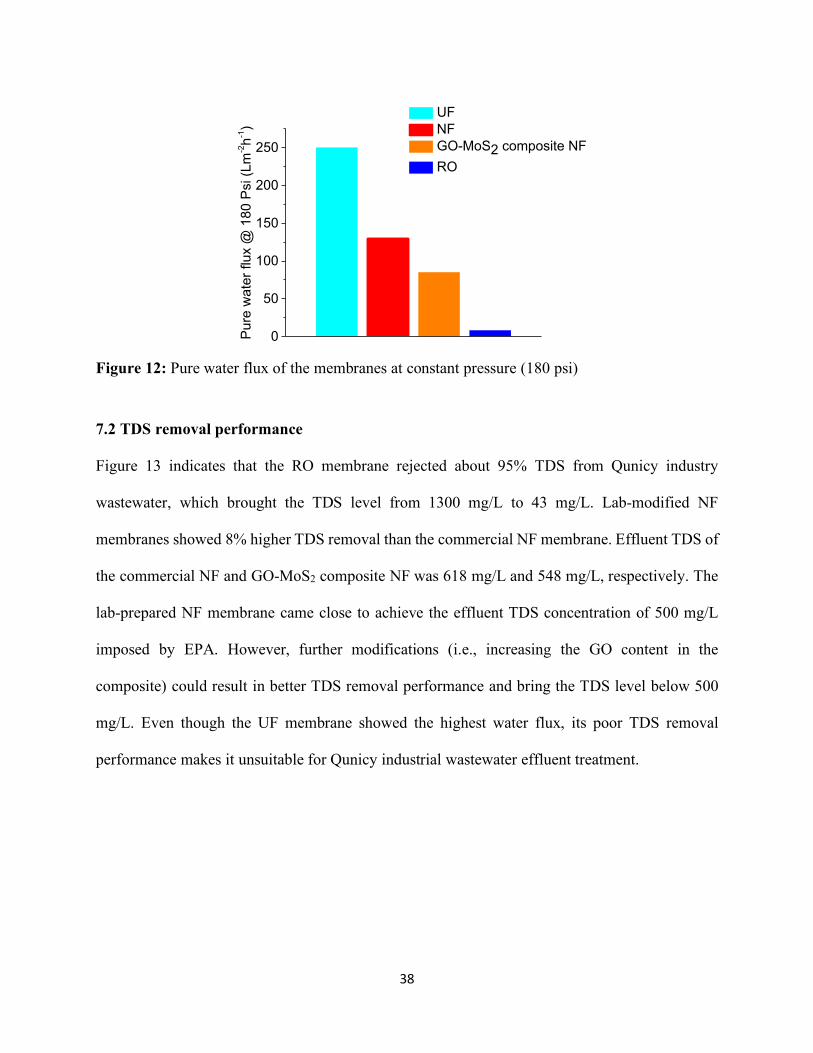
7.1 Water flux of the membranes
The pure water flux of the membranes was determined at a constant pressure of 180 psi (Figure
12). The pressure. Among all the membranes, the UF membrane showed the highest water flux
due to its larger pore size. The commercial NF membrane showed 1.5 times higher water flux than
the lab-prepared GO-MoS2 composite NF membrane. On the other hand, the RO membrane
offered very low water flux at that pressure. Usually, the operating pressures for RO membranes
range from 140-1450 psi due to their smaller pore sizes, which allow only water molecules to pass
through while rejecting most of the ions present in the water. So, it was clear that the RO membrane
would require considerably higher pressure than the other membranes to achieve a reasonable or
comparable water flux to operate. Assuming the flow requirements of the membranes in the
industrial set up may vary from 22 to 200 gallons per minute (GPM), we have calculated the
37
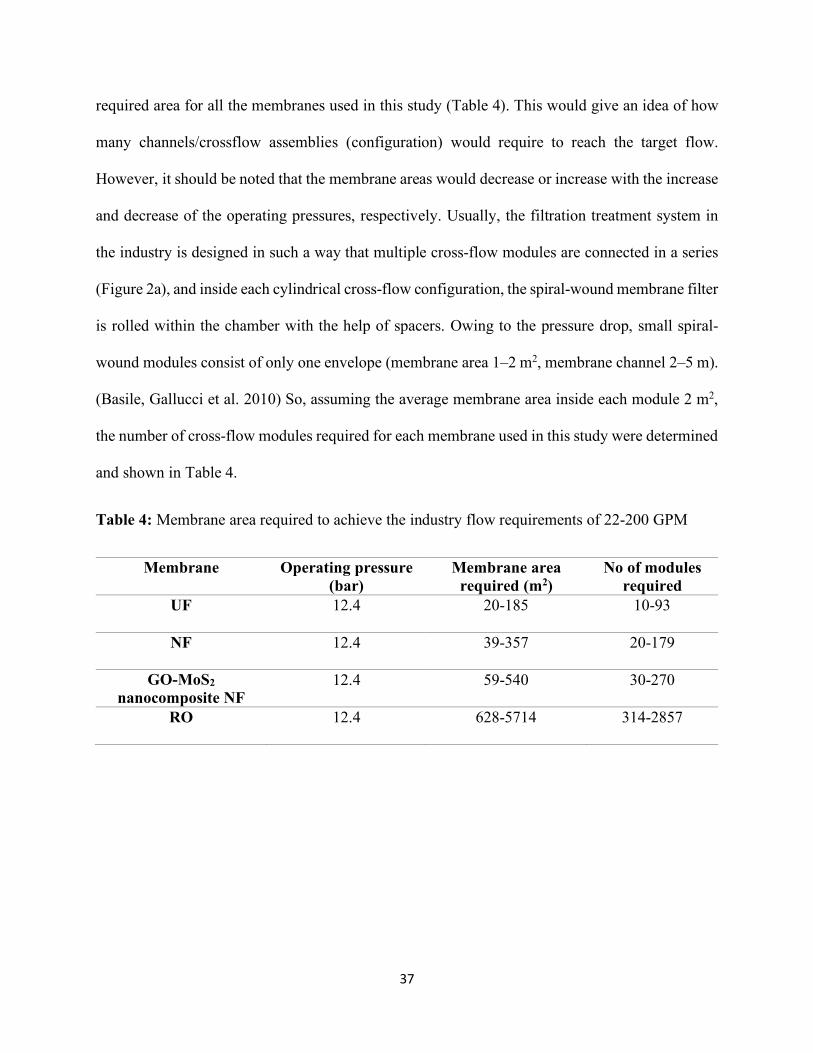
required area for all the membranes used in this study (Table 4). This would give an idea of how
many channels/crossflow assemblies (configuration) would require to reach the target flow.
However, it should be noted that the membrane areas would decrease or increase with the increase
and decrease of the operating pressures, respectively. Usually, the filtration treatment system in
the industry is designed in such a way that multiple cross-flow modules are connected in a series
(Figure 2a), and inside each cylindrical cross-flow configuration, the spiral-wound membrane filter
is rolled within the chamber with the help of spacers. Owing to the pressure drop, small spiral-
wound modules consist of only one envelope (membrane area 1–2 m2, membrane channel 2–5 m).
(Basile, Gallucci et al. 2010) So, assuming the average membrane area inside each module 2 m2,
the number of cross-flow modules required for each membrane used in this study were determined
and shown in Table 4.
Table 4: Membrane area required to achieve the industry flow requirements of 22-200 GPM
Membrane Operating pressure (bar)
Membrane area required (m2)
No of modules required
UF 12.4 20-185 10-93
NF 12.4 39-357 20-179
GO-MoS2 nanocomposite NF
12.4 59-540 30-270
RO 12.4 628-5714 314-2857
38
Figure 12: Pure water flux of the membranes at constant pressure (180 psi)
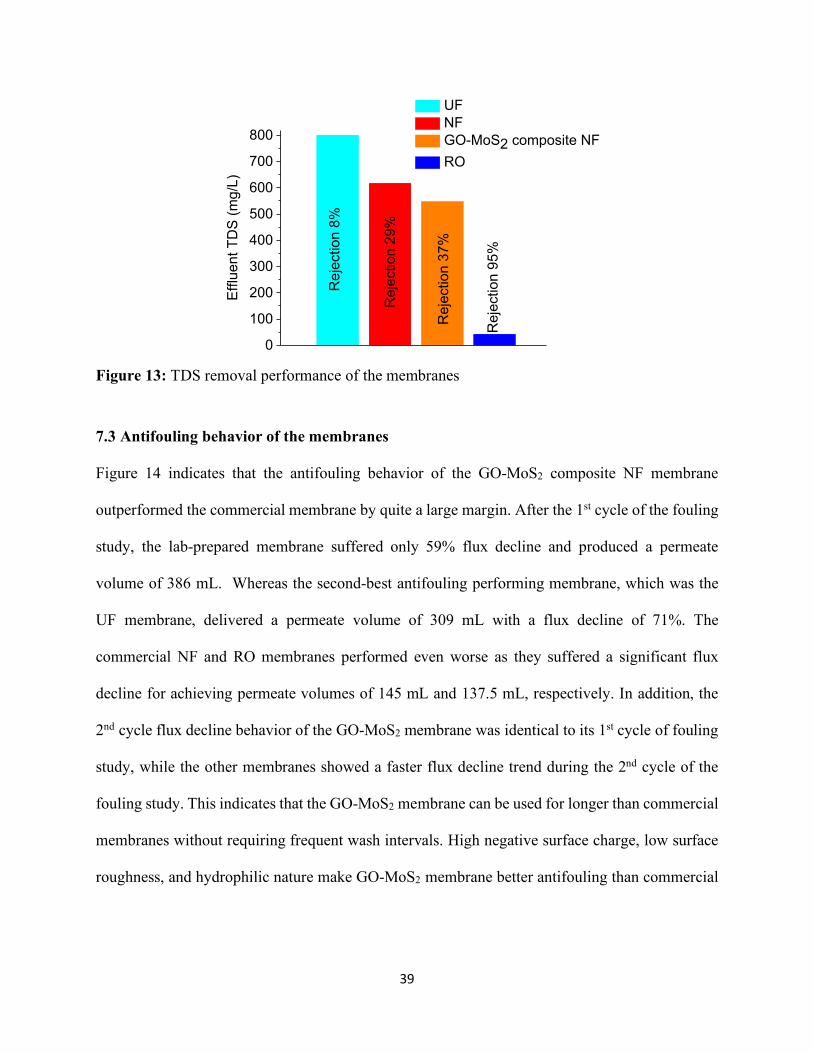
7.2 TDS removal performance
Figure 13 indicates that the RO membrane rejected about 95% TDS from Qunicy industry
wastewater, which brought the TDS level from 1300 mg/L to 43 mg/L. Lab-modified NF
membranes showed 8% higher TDS removal than the commercial NF membrane. Effluent TDS of
the commercial NF and GO-MoS2 composite NF was 618 mg/L and 548 mg/L, respectively. The
lab-prepared NF membrane came close to achieve the effluent TDS concentration of 500 mg/L
imposed by EPA. However, further modifications (i.e., increasing the GO content in the
composite) could result in better TDS removal performance and bring the TDS level below 500
mg/L. Even though the UF membrane showed the highest water flux, its poor TDS removal
performance makes it unsuitable for Qunicy industrial wastewater effluent treatment.
0
50
100
150
200
250
Pure
wat
er fl
ux @
180
Psi
(Lm
-2h-1
)
UF NF GO-MoS2 composite NF RO
39
Figure 13: TDS removal performance of the membranes
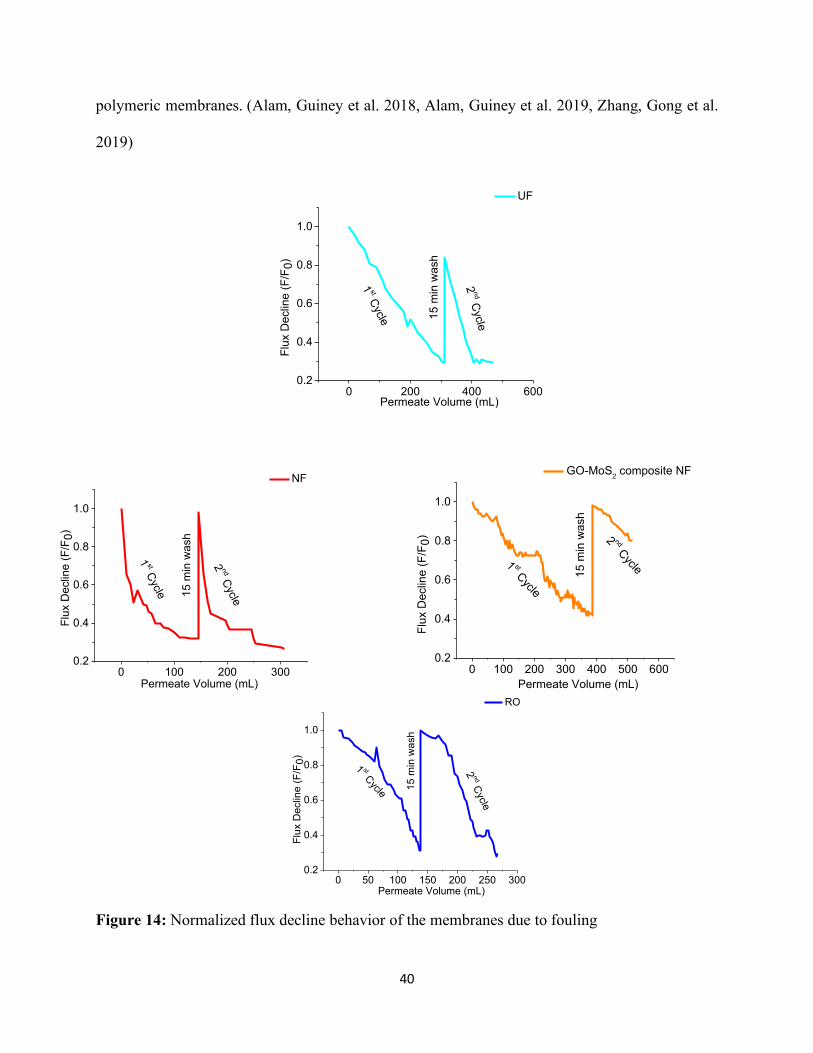
7.3 Antifouling behavior of the membranes
Figure 14 indicates that the antifouling behavior of the GO-MoS2 composite NF membrane
outperformed the commercial membrane by quite a large margin. After the 1st cycle of the fouling
study, the lab-prepared membrane suffered only 59% flux decline and produced a permeate
volume of 386 mL. Whereas the second-best antifouling performing membrane, which was the
UF membrane, delivered a permeate volume of 309 mL with a flux decline of 71%. The
commercial NF and RO membranes performed even worse as they suffered a significant flux
decline for achieving permeate volumes of 145 mL and 137.5 mL, respectively. In addition, the
2nd cycle flux decline behavior of the GO-MoS2 membrane was identical to its 1st cycle of fouling
study, while the other membranes showed a faster flux decline trend during the 2nd cycle of the
fouling study. This indicates that the GO-MoS2 membrane can be used for longer than commercial
membranes without requiring frequent wash intervals. High negative surface charge, low surface
roughness, and hydrophilic nature make GO-MoS2 membrane better antifouling than commercial
0
100
200
300
400
500
600
700
800
Rej
ectio
n 95
%
Rej
ectio
n 37
%
Rej
ectio
n 29
%
Rej
ectio
n 8%
Efflu
ent T
DS
(mg/
L)
UF NF GO-MoS2 composite NF RO
40
polymeric membranes. (Alam, Guiney et al. 2018, Alam, Guiney et al. 2019, Zhang, Gong et al.
2019)
Figure 14: Normalized flux decline behavior of the membranes due to fouling
0 200 400 6000.2
0.4
0.6
0.8
1.0
2 nd Cycle
1 st Cycle 15 m
in w
ash
Flux
Dec
line
(F/F
0)
Permeate Volume (mL)
UF
0 50 100 150 200 250 3000.2
0.4
0.6
0.8
1.0
2 nd Cycle
1 st Cycle 15 m
in w
ash
Flux
Dec
line
(F/F
0)
Permeate Volume (mL)
RO
0 100 200 3000.2
0.4
0.6
0.8
1.0
2 nd Cycle
1 st Cycle 15 m
in w
ash
Flux
Dec
line
(F/F
0)
Permeate Volume (mL)
NF
0 100 200 300 400 500 6000.2
0.4
0.6
0.8
1.0
2 nd Cycle1 st Cycle
15 m
in w
ash
Flux
Dec
line
(F/F
0)
Permeate Volume (mL)
GO-MoS2 composite NF
41
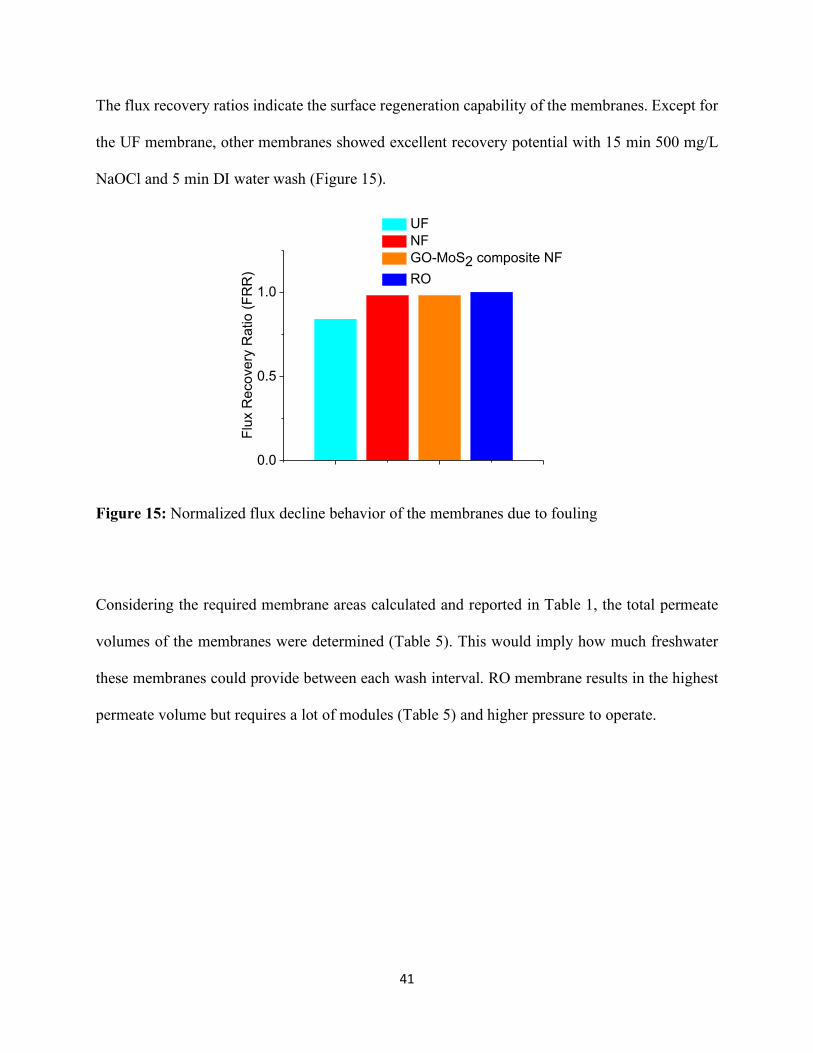
The flux recovery ratios indicate the surface regeneration capability of the membranes. Except for
the UF membrane, other membranes showed excellent recovery potential with 15 min 500 mg/L
NaOCl and 5 min DI water wash (Figure 15).
Figure 15: Normalized flux decline behavior of the membranes due to fouling
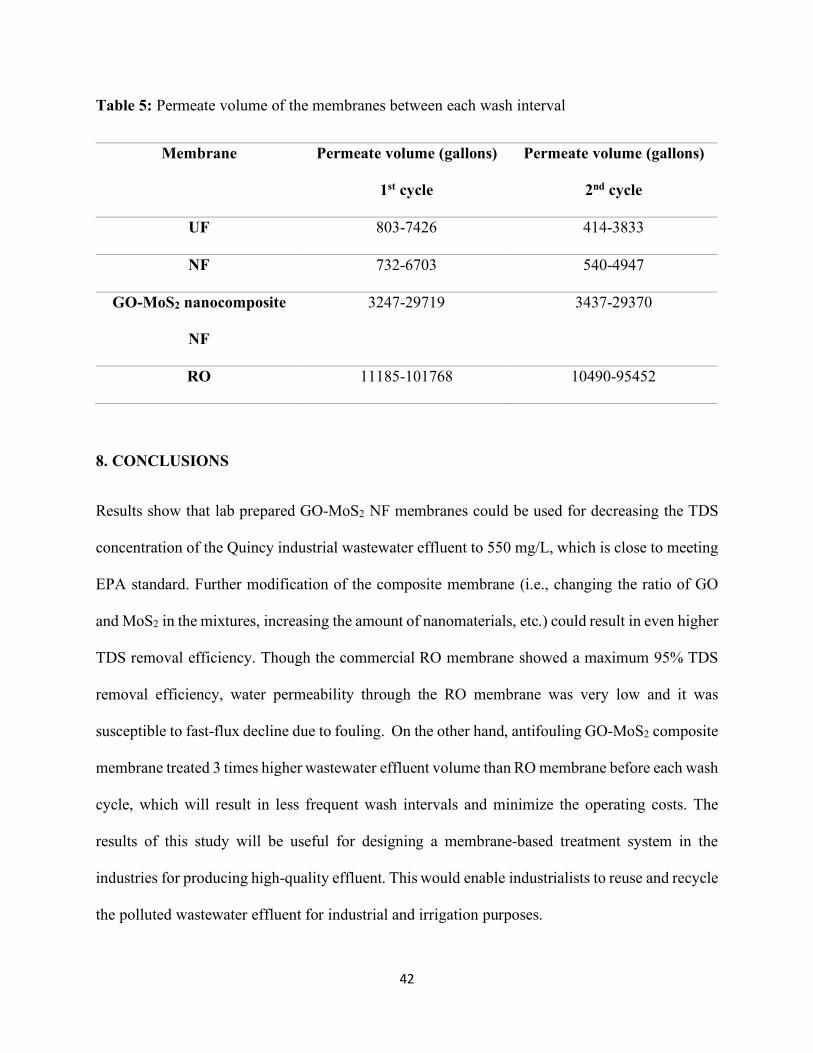
Considering the required membrane areas calculated and reported in Table 1, the total permeate
volumes of the membranes were determined (Table 5). This would imply how much freshwater
these membranes could provide between each wash interval. RO membrane results in the highest
permeate volume but requires a lot of modules (Table 5) and higher pressure to operate.
0.0
0.5
1.0
UF NF GO-MoS2 composite NF RO
Flux
Rec
over
y R
atio
(FR
R)
42
Table 5: Permeate volume of the membranes between each wash interval
Membrane Permeate volume (gallons)
1st cycle
Permeate volume (gallons)
2nd cycle
UF 803-7426 414-3833
NF 732-6703 540-4947
GO-MoS2 nanocomposite
NF
3247-29719 3437-29370
RO 11185-101768 10490-95452
8. CONCLUSIONS
Results show that lab prepared GO-MoS2 NF membranes could be used for decreasing the TDS
concentration of the Quincy industrial wastewater effluent to 550 mg/L, which is close to meeting
EPA standard. Further modification of the composite membrane (i.e., changing the ratio of GO
and MoS2 in the mixtures, increasing the amount of nanomaterials, etc.) could result in even higher
TDS removal efficiency. Though the commercial RO membrane showed a maximum 95% TDS
removal efficiency, water permeability through the RO membrane was very low and it was
susceptible to fast-flux decline due to fouling. On the other hand, antifouling GO-MoS2 composite
membrane treated 3 times higher wastewater effluent volume than RO membrane before each wash
cycle, which will result in less frequent wash intervals and minimize the operating costs. The
results of this study will be useful for designing a membrane-based treatment system in the
industries for producing high-quality effluent. This would enable industrialists to reuse and recycle
the polluted wastewater effluent for industrial and irrigation purposes.
43
ACKNOWLEDGMENTS
This work was supported by US Geological Survey grant number 11N-3815-558 via State of
Washington Water Research Center. Sample preparation and characterization by Professor Mark
C. Hersam and his group at Northwestern University were supported by the National Science
Foundation and the Environmental Protection Agency under Cooperative Agreement Number
DBI-1266377. We would like to thank Megan Rounds, Washington Department of Ecology for
collecting the food processing wastewater samples from Quincy, WA.
44
REFERENCES
Akhavan, O. and E. Ghaderi (2010). ACS Nano 4(10): 5731.
Alam, I., L. M. Guiney, M. C. Hersam and I. Chowdhury (2018). "Antifouling properties of two-
dimensional molybdenum disulfide and graphene oxide." Environmental Science: Nano 5(7):
1628-1639.
Alam, I., L. M. Guiney, M. C. Hersam and I. Chowdhury (2019). "Application of external voltage
for fouling mitigation from graphene oxide, reduced graphene oxide and molybdenum disulfide
functionalized surfaces." Environmental Science: Nano 6(3): 925-936.
Alam, I., L. M. Guiney, M. C. Hersam and I. Chowdhury (2020). "Pressure-driven water transport
behavior and antifouling performance of two-dimensional nanomaterial laminated membranes."
Journal of Membrane Science 599: 117812.
Angelakis, A. and S. Snyder (2015). Wastewater treatment and reuse: Past, present, and future,
Multidisciplinary Digital Publishing Institute.
Arumugham, T., R. G. Amimodu, N. J. Kaleekkal and D. Rana (2019). "Nano CuO/g-C3N4
sheets-based ultrafiltration membrane with enhanced interfacial affinity, antifouling and protein
separation performances for water treatment application." Journal of Environmental Sciences 82:
57-69.
Bahnemann, D. (2004). "Photocatalytic water treatment: solar energy applications." Solar Energy
77(5): 445-459.
Basile, A., F. Gallucci and P. Morrone (2010). 6 - Advanced carbon dioxide (CO2) gas separation
membrane development for power plants. Advanced Power Plant Materials, Design and
Technology. D. Roddy, Woodhead Publishing: 143-186.
45
Beyer, F., J. Laurinonyte, A. Zwijnenburg, A. J. M. Stams and C. M. Plugge (2017). "Membrane
Fouling and Chemical Cleaning in Three Full-Scale Reverse Osmosis Plants Producing
Demineralized Water." Journal of Engineering 2017: 14.
Bianco Prevot, A. and E. Pramauro (1999). "Analytical monitoring of photocatalytic treatments.
Degradation of 2,3,6-trichlorobenzoic acid in aqueous TiO2 dispersions1Work presented at the
5th Symposium on Analytical Sciences, Nice, France, June 1997.1." Talanta 48(4): 847-857.
Bidsorkhi, H. C., H. Riazi, D. Emadzadeh, M. Ghanbari, T. Matsuura, W. Lau and A. Ismail
(2016). "Preparation and characterization of a novel highly hydrophilic and antifouling
polysulfone/nanoporous TiO2 nanocomposite membrane." Nanotechnology 27(41): 415706.
Bouchard, D., X. Ma and C. Isaacson (2009). "Colloidal Properties of Aqueous Fullerenes:
Isoelectric Points and Aggregation Kinetics of C60 and C60 Derivatives." Environmental Science
& Technology 43(17): 6597-6603.
Bouman, B. (2007). Water management in irrigated rice: coping with water scarcity, Int. Rice Res.
Inst.
Campos, J. L., A. Mosquera-Corral, M. Sánchez, R. Méndez and J. M. Lema (2002). "Nitrification
in saline wastewater with high ammonia concentration in an activated sludge unit." Water
Research 36(10): 2555-2560.
Cañedo-Argüelles, M., B. Kefford and R. Schäfer (2018). "Salt in freshwaters: causes, effects and
prospects - introduction to the theme issue." Philosophical transactions of the Royal Society of
London. Series B, Biological sciences 374(1764): 20180002.
Chen, K. L. and M. Elimelech (2008). "Interaction of Fullerene (C60) Nanoparticles with Humic
Acid and Alginate Coated Silica Surfaces: Measurements, Mechanisms, and Environmental
Implications." Environ. Sci. Technol. 42(20): 7607.
46
Childress, A. E. and M. Elimelech (1996). "Effect of solution chemistry on the surface charge of
polymeric reverse osmosis and nanofiltration membranes." Journal of Membrane Science 119(2):
253-268.
Chong, J. Y., B. Wang and K. Li (2018). "Water transport through graphene oxide membranes:
the roles of driving forces." Chemical Communications 54(20): 2554-2557.
Chowdhury, I., M. C. Duch, N. D. Mansukhani, M. C. Hersam and D. Bouchard (2013). "Colloidal
Properties and Stability of Graphene Oxide Nanomaterials in the Aquatic Environment."
Environmental Science & Technology 47(12): 6288-6296.
Chowdhury, I., N. D. Mansukhani, L. M. Guiney, M. C. Hersam and D. Bouchard (2015).
"Aggregation and Stability of Reduced Graphene Oxide: Complex Roles of Divalent Cations, pH,
and Natural Organic Matter." Environmental Science & Technology 49(18): 10886-10893.
Coskun, T., E. Debik and N. M. Demir (2010). "Treatment of olive mill wastewaters by
nanofiltration and reverse osmosis membranes." Desalination 259(1): 65-70.
de Lannoy, C.-F., D. Jassby, K. Gloe, A. D. Gordon and M. R. Wiesner (2013). "Aquatic
Biofouling Prevention by Electrically Charged Nanocomposite Polymer Thin Film Membranes."
Environmental Science & Technology 47(6): 2760-2768.
Dembczynski, R. and T. Jankowski (2001). "Determination of pore diameter and molecular weight
cut-off of hydrogel-membrane liquid-core capsules for immunoisolation." Journal of biomaterials
science. Polymer edition 12: 1051-1058.
Dreyer, D. R., S. Park, C. W. Bielawski and R. S. Ruoff (2010). "The chemistry of graphene
oxide." Chemical Society Reviews 39(1): 228-240.
Duch, M. C., G. R. S. Budinger, Y. T. Liang, S. Soberanes, D. Urich, S. E. Chiarella, L. A.
Campochiaro, A. Gonzalez, N. S. Chandel, M. C. Hersam and G. M. Mutlu (2011). "Minimizing
47
Oxidation and Stable Nanoscale Dispersion Improves the Biocompatibility of Graphene in the
Lung." Nano Letters 11(12): 5201-5207.
Elimelech, M., J. Gregory, X. Jia and R. A. F. Williams (2013). Particle Deposition and
Aggregation: Measurement, Modelling and Simulation, Elsevier Science.
Emadzadeh, D., W. Lau, T. Matsuura, N. Hilal and A. Ismail (2014). "The potential of thin film
nanocomposite membrane in reducing organic fouling in forward osmosis process." Desalination
348: 82-88.
Erickson, H. P. (2009). "Size and shape of protein molecules at the nanometer level determined by
sedimentation, gel filtration, and electron microscopy." Biological procedures online 11(1): 32.
Esfahani, M. R., E. M. Languri and M. R. Nunna (2016). "Effect of particle size and viscosity on
thermal conductivity enhancement of graphene oxide nanofluid." International Communications
in Heat and Mass Transfer 76: 308-315.
Filtration Solutions, I. from https://filtsol.com/main/index.php/technical-info/super-hydrophilic-
membranes.
Geim, A.K. and Grigorieva, I.V. (2013) Nature 499(7459), 419-425.
Gao, W., L. B. Alemany, L. Ci and P. M. Ajayan (2009). "New insights into the structure and
reduction of graphite oxide." Nat Chem 1(5): 403-408.
Gebru, K. A. and C. Das (2017). "Removal of bovine serum albumin from wastewater using
fouling resistant ultrafiltration membranes based on the blends of cellulose acetate, and PVP-TiO2
nanoparticles." Journal of environmental management 200: 283-294.
Glass, C. and J. Silverstein (1999). "Denitrification of high-nitrate, high-salinity wastewater."
Water Research 33(1): 223-229.
Grant, S. B., J.-D. Saphores, D. L. Feldman, A. J. Hamilton, T. D. Fletcher, P. L. Cook, M.
Stewardson, B. F. Sanders, L. A. Levin and R. F. Ambrose (2012). "Taking the “waste” out of
48
“wastewater” for human water security and ecosystem sustainability." science 337(6095): 681-
686.
Gu, J.-E., B.-M. Jun and Y.-N. Kwon (2012). "Effect of chlorination condition and permeability
of chlorine species on the chlorination of a polyamide membrane." Water research 46(16): 5389-
5400.
Han, B., T. Runnells, J. Zimbron and R. Wickramasinghe (2002). "Arsenic removal from drinking
water by flocculation and microfiltration." Desalination 145(1): 293-298.
Hartono, T., S. Wang, Q. Ma and Z. Zhu (2009). "Layer structured graphite oxide as a novel
adsorbent for humic acid removal from aqueous solution." Journal of Colloid and Interface Science
333(1): 114-119.
Heiranian, M., A. B. Farimani and N. R. Aluru (2015). "Water desalination with a single-layer
MoS2 nanopore." Nat Commun 6.
Heiranian, M., A. B. Farimani and N. R. Aluru (2015). "Water desalination with a single-layer
MoS(2) nanopore." Nature Communications 6: 8616.
Hilal, N., H. Al-Zoubi, N. A. Darwish, A. W. Mohamma and M. Abu Arabi (2004). "A
comprehensive review of nanofiltration membranes:Treatment, pretreatment, modelling, and
atomic force microscopy." Desalination 170(3): 281-308.
Hoek, E. M., M. T. M. Pendergast and A. K. Ghosh (2014). Nanotechnology-based membranes
for water purification. Nanotechnology applications for clean water, Elsevier: 133-154.
Hou, W.-C., I. Chowdhury, D. G. Goodwin, W. M. Henderson, D. H. Fairbrother, D. Bouchard
and R. G. Zepp (2015). "Photochemical Transformation of Graphene Oxide in Sunlight."
Environmental Science & Technology 49(6): 3435-3443.
Hu, M. and Mi, B. (2014) Journal of Membrane Science 469, 80-87.
49
Huang, H., Z. Song, N. Wei, L. Shi, Y. Mao, Y. Ying, L. Sun, Z. Xu and X. Peng (2013). "Ultrafast
viscous water flow through nanostrand-channelled graphene oxide membranes." Nature
Communications 4(1): 2979.
Jiraratananon, R., A. Sungpet and P. Luangsowan (2000). "Performance evaluation of
nanofiltration membranes for treatment of effluents containing reactive dye and salt." Desalination
130(2): 177-183.
Karagiannis, I. C. and P. G. Soldatos (2008). "Water desalination cost literature: review and
assessment." Desalination 223(1): 448-456.
Kim, S., D. Dehlinger, J. Peña, H. Seol, M. Shusteff, N. M. Collette, M. Elsheikh, M. Davenport,
P. Naraghi-Arani and E. Wheeler (2019). "Virus concentration and purification by a microfluidic
filtering system with an integrated PEGylated antifouling membrane." Microfluidics and
Nanofluidics 23(1): 9.
Landschoot, P. (2014). Irrigation water quality guidelines for turfgrass sites.
Lanphere, J. D., C. J. Luth, L. M. Guiney, N. D. Mansukhani, M. C. Hersam and S. L. Walker
(2015). "Fate and Transport of Molybdenum Disulfide Nanomaterials in Sand Columns."
Environmental Engineering Science 32(2): 163-173.
Lau, W.-J. and A. F. Ismail (2009). "Polymeric nanofiltration membranes for textile dye
wastewater treatment: Preparation, performance evaluation, transport modelling, and fouling
control — a review." Desalination 245(1): 321-348.
Li, M.-N., X.-F. Sun, L. Wang, S.-Y. Wang, M. Z. Afzal, C. Song and S.-G. Wang (2018).
"Forward osmosis membranes modified with laminar MoS 2 nanosheet to improve desalination
performance and antifouling properties." Desalination 436: 107-113.
50
Li, Q. and M. Elimelech (2004). "Organic Fouling and Chemical Cleaning of Nanofiltration
Membranes: Measurements and Mechanisms." Environmental Science & Technology 38(17):
4683-4693.
Lin, J. and S. Murad (2001). "A computer simulation study of the separation of aqueous solutions
using thin zeolite membranes." Molecular Physics 99(14): 1175-1181.
Lin, Z., C. Hu, X. Wu, W. Zhong, M. Chen, Q. Zhang, A. Zhu and Q. Liu (2018). "Towards
improved antifouling ability and separation performance of polyethersulfone ultrafiltration
membranes through poly (ethylenimine) grafting." Journal of membrane science 554: 125-133.
Liu, Y. and B. Mi (2012). "Combined fouling of forward osmosis membranes: Synergistic foulant
interaction and direct observation of fouling layer formation." Journal of membrane science 407:
136-144.
Lohwacharin, J., K. Oguma and S. Takizawa (2009). "Ultrafiltration of natural organic matter and
black carbon: Factors influencing aggregation and membrane fouling." Water research 43(12):
3076-3085.
Madaeni, S. S., E. Rostami and A. Rahimpour (2010). "Surfactant cleaning of ultrafiltration
membranes fouled by whey." International journal of dairy technology 63(2): 273-283.
Mays, L. W. (2007). Water resources sustainability, McGraw-Hill New York.
Mi, B. and M. Elimelech (2010). "Organic fouling of forward osmosis membranes: fouling
reversibility and cleaning without chemical reagents." Journal of membrane science 348(1-2): 337-
345.
Muhammad, Y. and W. Lee (2019). "Zero-liquid discharge (ZLD) technology for resource
recovery from wastewater: A review." Science of The Total Environment 681: 551-563.
51
Mukherjee, R., P. Bhunia and S. De (2016). "Impact of graphene oxide on removal of heavy metals
using mixed matrix membrane." Chemical Engineering Journal 292: 284-297.
Nguyen, T., F. A. Roddick and L. Fan (2012). "Biofouling of Water Treatment Membranes: A
Review of the Underlying Causes, Monitoring Techniques and Control Measures." Membranes
2(4): 804-840.
Oren, Y., E. Korngold, N. Daltrophe, R. Messalem, Y. Volkman, L. Aronov, M. Weismann, N.
Bouriakov, P. Glueckstern and J. Gilron (2010). "Pilot studies on high recovery BWRO-EDR for
near zero liquid discharge approach." Desalination 261(3): 321-330.
Otaki, M., K. Yano and S. Ohgaki (1998). "Virus removal in a membrane separation process."
Water Science and Technology 37(10): 107-116.
Pendergast, M. M. and E. M. V. Hoek (2011). "A review of water treatment membrane
nanotechnologies." Energy & Environmental Science 4(6): 1946-1971.
Perreault, F., M. E. Tousley and M. Elimelech (2014). "Thin-Film Composite Polyamide
Membranes Functionalized with Biocidal Graphene Oxide Nanosheets." Environmental Science
& Technology Letters 1(1): 71-76.
Pramauro, E., A. B. Prevot, M. Vincenti and R. Gamberini (1998). "Photocatalytic degradation of
naphthalene in aqueous TiO2 dispersions: Effect of nonionic surfactants." Chemosphere 36(7):
1523-1542.
Ray, J. R., S. Tadepalli, S. Z. Nergiz, K.-K. Liu, L. You, Y. Tang, S. Singamaneni and Y.-S. Jun
(2015). "Hydrophilic, Bactericidal Nanoheater-Enabled Reverse Osmosis Membranes to Improve
Fouling Resistance." ACS Applied Materials & Interfaces 7(21): 11117-11126.
Ruiz-García, A., N. Melián-Martel and I. Nuez (2017). "A Critical Review on Predicting Fouling
in RO Desalination."
52
Sagle, A. and B. Freeman (2004). "Fundamentals of membranes for water treatment." The future
of desalination in Texas 2(363): 137.
Sato T, Qadir M, Yamamoto S, Endo T, Zahoor A, Agricultural Water Management, 2013, 130, 1.
Seidel, A. and M. Elimelech (2002). "Coupling between chemical and physical interactions in
natural organic matter (NOM) fouling of nanofiltration membranes: implications for fouling
control." Journal of Membrane Science 203(1): 245-255.
Shin, D. H., N. Kim and Y. T. Lee (2011). "Modification to the polyamide TFC RO membranes
for improvement of chlorine-resistance." Journal of membrane science 376(1-2): 302-311.
Sobsey, M. D., C. E. Stauber, L. M. Casanova, J. M. Brown and M. A. Elliott (2008). "Point of
Use Household Drinking Water Filtration: A Practical, Effective Solution for Providing Sustained
Access to Safe Drinking Water in the Developing World." Environmental Science & Technology
42(12): 4261-4267.
Sri Abirami Saraswathi, M. S., D. Rana, P. Vijayakumar, S. Alwarappan and A. Nagendran (2017).
"Tailored PVDF nanocomposite membranes using exfoliated MoS2 nanosheets for improved
permeation and antifouling performance." New Journal of Chemistry 41(23): 14315-14324.
Sun, L., H. Huang and X. Peng (2013). "Laminar MoS 2 membranes for molecule separation."
Chemical communications 49(91): 10718-10720.
Systems, P. C. I. W. from https://www.purichem-eg.com/services-item/desalination-plants/.
Tong, T. and M. Elimelech (2016). "The Global Rise of Zero Liquid Discharge for Wastewater
Management: Drivers, Technologies, and Future Directions." Environmental Science &
Technology 50(13): 6846-6855.
53
Tsuneda, S., M. Mikami, Y. Kimochi and A. Hirata (2005). "Effect of salinity on nitrous oxide
emission in the biological nitrogen removal process for industrial wastewater." Journal of
Hazardous Materials 119(1): 93-98.
Ulbricht, M. (2006). "Advanced functional polymer membranes." Polymer 47(7): 2217-2262.
Vatanpour, V., S. S. Madaeni, R. Moradian, S. Zinadini and B. Astinchap (2012). "Novel
antibifouling nanofiltration polyethersulfone membrane fabricated from embedding TiO2 coated
multiwalled carbon nanotubes." Separation and Purification Technology 90: 69-82.
Vrijenhoek, E. M. and J. J. Waypa (2000). "Arsenic removal from drinking water by a “loose”
nanofiltration membrane." Desalination 130(3): 265-277.
Wang, J., P. Zhang, B. Liang, Y. Liu, T. Xu, L. Wang, B. Cao and K. Pan (2016). "Graphene Oxide
as an Effective Barrier on a Porous Nanofibrous Membrane for Water Treatment." ACS Applied
Materials & Interfaces 8(9): 6211-6218.
Wang, Q. H., K. Kalantar-Zadeh, A. Kis, J. N. Coleman and M. S. Strano (2012). "Electronics and
optoelectronics of two-dimensional transition metal dichalcogenides." Nat Nano 7(11): 699-712.
Wang, W., L. Zhu, B. Shan, C. Xie, C. Liu, F. Cui and G. Li (2018). "Preparation and
characterization of SLS-CNT/PES ultrafiltration membrane with antifouling and antibacterial
properties." Journal of Membrane Science 548: 459-469.
Wang, Z. and B. Mi (2017). "Environmental Applications of 2D Molybdenum Disulfide (MoS2)
Nanosheets." Environmental Science & Technology 51(15): 8229-8244.
Wang, Z., Q. Tu, S. Zheng, J. J. Urban, S. Li and B. Mi (2017). "Understanding the Aqueous
Stability and Filtration Capability of MoS2 Membranes." Nano letters 17(12): 7289-7298.
Wei, N., X. Peng and Z. Xu (2014). "Understanding water permeation in graphene oxide
membranes." ACS applied materials & interfaces 6(8): 5877-5883.
54
Wu, G., S. Gan, L. Cui and Y. Xu (2008). "Preparation and characterization of PES/TiO2
composite membranes." Applied Surface Science 254(21): 7080-7086.
WWAP (2019). The United Nations World Water Development Report 2019: Leaving No One
Behind, UNESCO Paris.
Zhang, H. (2015). "Ultrathin Two-Dimensional Nanomaterials." ACS Nano 9(10): 9451-9469.
Zhang, P., J.-L. Gong, G.-M. Zeng, B. Song, W. Cao, H.-Y. Liu, S.-Y. Huan and P. Peng (2019).
"Novel “loose” GO/MoS2 composites membranes with enhanced permeability for effective salts
and dyes rejection at low pressure." Journal of Membrane Science 574: 112-123.
Zheng, S., Q. Tu, J. J. Urban, S. Li and B. Mi (2017). "Swelling of graphene oxide membranes in
aqueous solution: characterization of interlayer spacing and insight into water transport
mechanisms." ACS nano 11(6): 6440-6450.
Zhu, J., M. Tian, J. Hou, J. Wang, J. Lin, Y. Zhang, J. Liu and B. Van der Bruggen (2016). "Surface
zwitterionic functionalized graphene oxide for a novel loose nanofiltration membrane." Journal of
Materials Chemistry A 4(5): 1980-1990.
Zodrow, K. R., E. Bar-Zeev, M. J. Giannetto and M. Elimelech (2014). "Biofouling and Microbial
Communities in Membrane Distillation and Reverse Osmosis." Environmental Science &
Technology 48(22): 13155-13164.
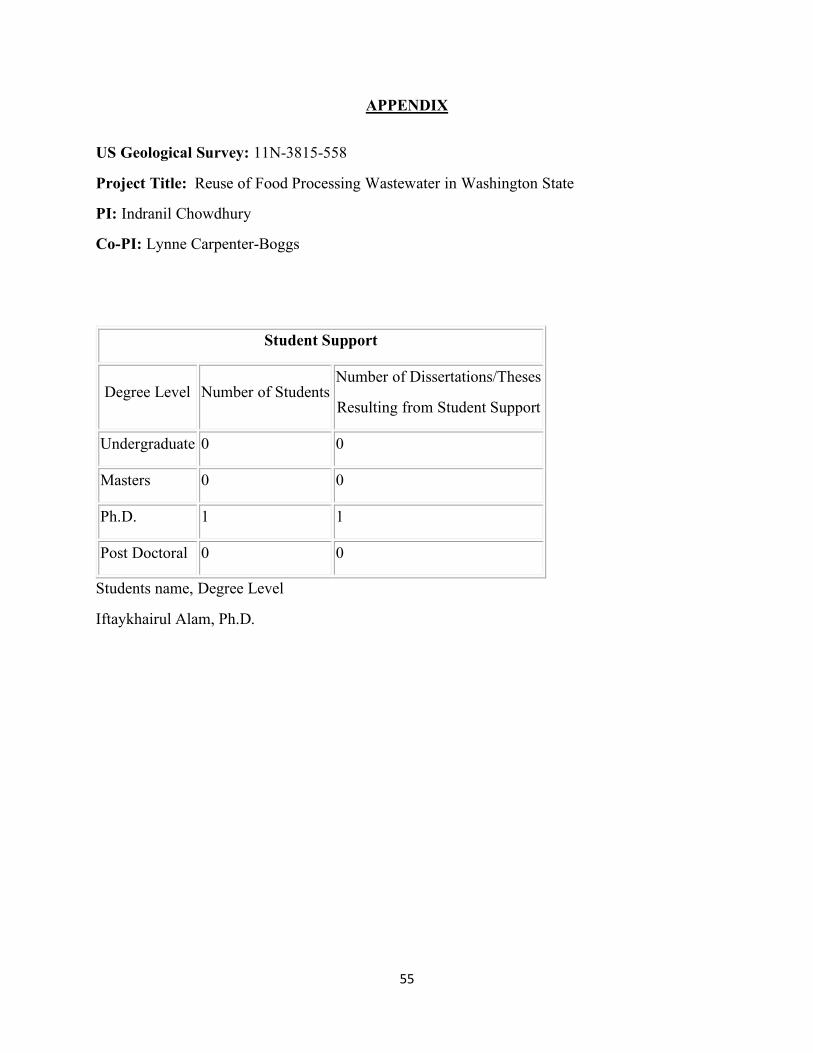
55
APPENDIX
US Geological Survey: 11N-3815-558
Project Title: Reuse of Food Processing Wastewater in Washington State
PI: Indranil Chowdhury
Co-PI: Lynne Carpenter-Boggs
Student Support
Degree Level Number of Students Number of Dissertations/Theses
Resulting from Student Support
Undergraduate 0 0
Masters 0 0
Ph.D. 1 1
Post Doctoral 0 0
Students name, Degree Level
Iftaykhairul Alam, Ph.D.
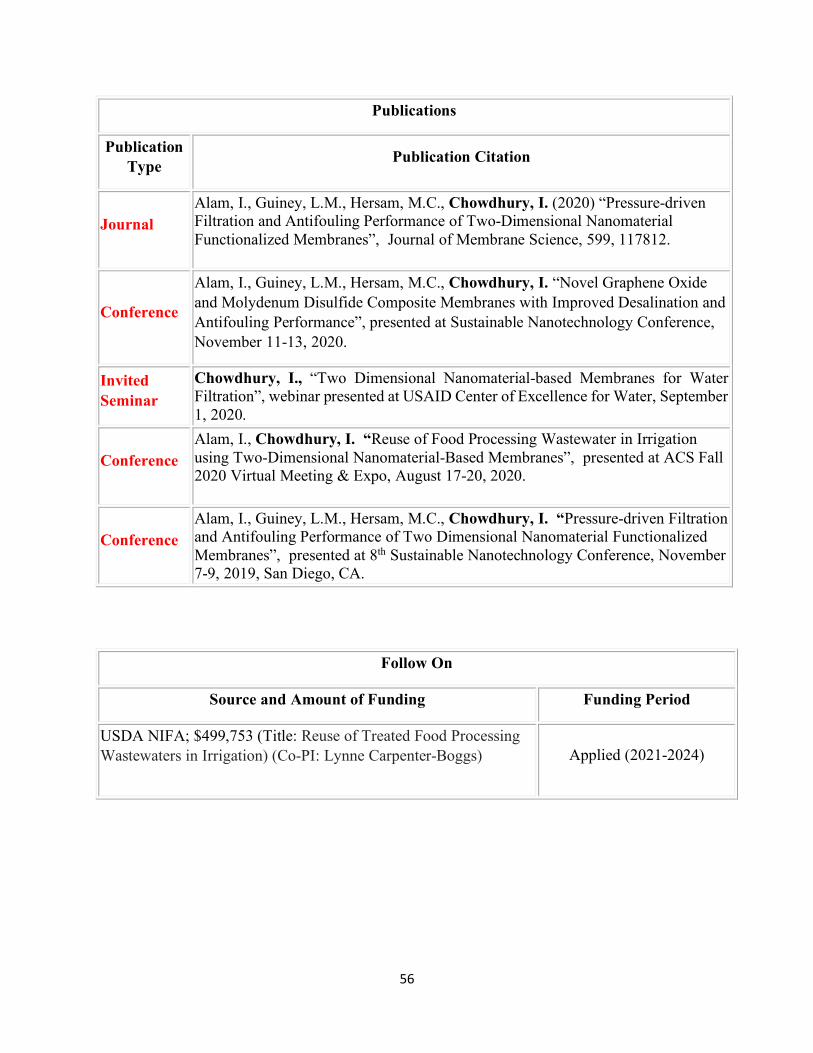
56
Publications
Publication Type Publication Citation
Journal Alam, I., Guiney, L.M., Hersam, M.C., Chowdhury, I. (2020) “Pressure-driven Filtration and Antifouling Performance of Two-Dimensional Nanomaterial Functionalized Membranes”, Journal of Membrane Science, 599, 117812.
Conference
Alam, I., Guiney, L.M., Hersam, M.C., Chowdhury, I. “Novel Graphene Oxide and Molydenum Disulfide Composite Membranes with Improved Desalination and Antifouling Performance”, presented at Sustainable Nanotechnology Conference, November 11-13, 2020.
Invited Seminar
Chowdhury, I., “Two Dimensional Nanomaterial-based Membranes for Water Filtration”, webinar presented at USAID Center of Excellence for Water, September 1, 2020.
Conference Alam, I., Chowdhury, I. “Reuse of Food Processing Wastewater in Irrigation using Two-Dimensional Nanomaterial-Based Membranes”, presented at ACS Fall 2020 Virtual Meeting & Expo, August 17-20, 2020.
Conference Alam, I., Guiney, L.M., Hersam, M.C., Chowdhury, I. “Pressure-driven Filtration and Antifouling Performance of Two Dimensional Nanomaterial Functionalized Membranes”, presented at 8th Sustainable Nanotechnology Conference, November 7-9, 2019, San Diego, CA.
Follow On
Source and Amount of Funding Funding Period
USDA NIFA; $499,753 (Title: Reuse of Treated Food Processing Wastewaters in Irrigation) (Co-PI: Lynne Carpenter-Boggs)
Applied (2021-2024)