Embed Size (px)
Citation preview
Building Radio frequency IDentification for the Global Environment
Reusable Asset Management Model
Authors: Paul Bowman, Jason Ng (BT), Mark Harrison (Cambridge), Alexander Illic (ETH)
June 2009 This work has been partly funded by the European Commission contract No: IST-2005-033546
About the BRIDGE Project:
BRIDGE (Building Radio frequency IDentification for the Global Environment) is a 13 million Euro RFID project running over 3 years and partly funded (€7,5 million) by the European Union. The objective of the BRIDGE project is to research, develop and implement tools to enable the deployment of EPCglobal applications in Europe. Thirty interdisciplinary partners from 12 countries (Europe and Asia) are working together on : Hardware development, Serial Look-up Service, Serial-Level Supply Chain Control, Security; Anti-counterfeiting, Drug Pedigree, Supply Chain Management, Manufacturing Process, Reusable Asset Management, Products in Service, Item Level Tagging for non-food items as well as Dissemination tools, Education material and Policy recommendations. For more information on the BRIDGE project: www.bridge-project.eu This document results from work being done in the framework of the BRIDGE project. It does not represent an official deliverable formally approved by the European Commission.
This document:
This deliverable provides a contextual model for management of reusable assets. Its purpose is to explain how the Track & Trace Analytics framework developed in D3.2 can be applied to the management and monitoring of reusable assets (and specifically, different categories of reusable transport items (RTI)) as they are used within the distribution processes of supply chains.
Disclaimer:
Copyright 2009 by (Cambridge, BT and ETH) All rights reserved. The information in this document is proprietary to these BRIDGE consortium members This document contains preliminary information and is not subject to any license agreement or any other agreement as between with respect to the above referenced consortium members. This document contains only intended strategies, developments, and/or functionalities and is not intended to be binding on any of the above referenced consortium members (either jointly or severally) with respect to any particular course of business, product strategy, and/or development of the above referenced consortium members. To the maximum extent allowed under applicable law, the above referenced consortium members assume no responsibility for errors or omissions in this document. The above referenced consortium members do not warrant the accuracy or completeness of the information, text, graphics, links, or other items contained within this material. This document is provided without a warranty of any kind, either express or implied, including but not limited to the implied warranties of merchantability, satisfactory quality, fitness for a particular purpose, or non-infringement. No licence to any underlying IPR is granted or to be implied from any use or reliance on the information contained within or accessed through this document. The above referenced consortium members shall have no liability for damages of any kind including without limitation direct, special, indirect, or consequential damages that may result from the use of these materials. This limitation shall not apply in cases of intentional or gross negligence. Because some jurisdictions do not allow the exclusion or limitation of liability for consequential or incidental damages, the above limitation may not apply to you. The statutory liability for personal injury and defective products is not affected. The above referenced consortium members have no control over the information that you may access through the use of hot links contained in these materials and does not endorse your use of third-party Web pages nor provide any warranty whatsoever relating to third-party Web page.

BRIDGE – Building Radio frequency IDentification solutions for the Global Environment
WP3: Reusable Asset Management, D3.4 3/53
BRIDGE – Building Radio frequency IDentification solutions for the Global Environment
WP3: Reusable Asset Management, D3.4 4/53
TABLE OF CONTENTS EXECUTIVE SUMMARY ........................................................................................................................ 6
GLOSSARY ............................................................................................................................................ 7
1 INTRODUCTION ............................................................................................................................ 8
1.1 AIMS ....................................................................................................................................... 8
1.2 RATIONALE .............................................................................................................................. 9
1.3 SCOPE .................................................................................................................................... 9
1.4 METHODOLOGY ...................................................................................................................... 11
2 RTI MODELS ............................................................................................................................... 12
2.1 TYPICAL RTI MODELS ............................................................................................................ 12
2.1.1 Exchange model (Closed-loop circulation) ...................................................................... 13
2.1.2 Pooling model (Open-loop circulation) ............................................................................ 14
2.1.3 Key observations ............................................................................................................. 14
2.1.3.1 Manufacturer ........................................................................................................................ 15
2.1.3.2 Retailer ................................................................................................................................ 15
2.1.3.3 Distribution centre ................................................................................................................ 15
2.1.3.4 Maintenance centre ............................................................................................................. 15
2.1.3.5 Supplier of new RTIs ........................................................................................................... 16
2.1.3.6 Third party logistics .............................................................................................................. 16
2.1.3.7 Pooling operator .................................................................................................................. 16
2.2 REUSABLE ASSETS IDENTIFICATION ......................................................................................... 16
2.2.1 Identifiers used with reusable assets .............................................................................. 16
2.2.2 Associations between the identifiers ............................................................................... 19
3 RTI USE CASES .......................................................................................................................... 21
3.1 OVERVIEW ............................................................................................................................. 21
3.2 WOODEN PALLET MANAGEMENT .............................................................................................. 21
3.3 PLASTIC PALLET MANAGEMENT ............................................................................................... 23
3.4 KEG MANAGEMENT ................................................................................................................. 24
3.5 FOLDING PLASTIC SECURITY CONTAINER MANAGEMENT ............................................................ 26
3.6 SUMMARY .............................................................................................................................. 27
4 RTI ANALYTICAL MODELS ....................................................................................................... 30
4.1 AIMS ..................................................................................................................................... 30
4.2 BACKGROUND ........................................................................................................................ 31
4.3 RTI MANAGEMENT MODEL....................................................................................................... 31
4.3.1 Qualitative analysis and assessments ............................................................................ 32
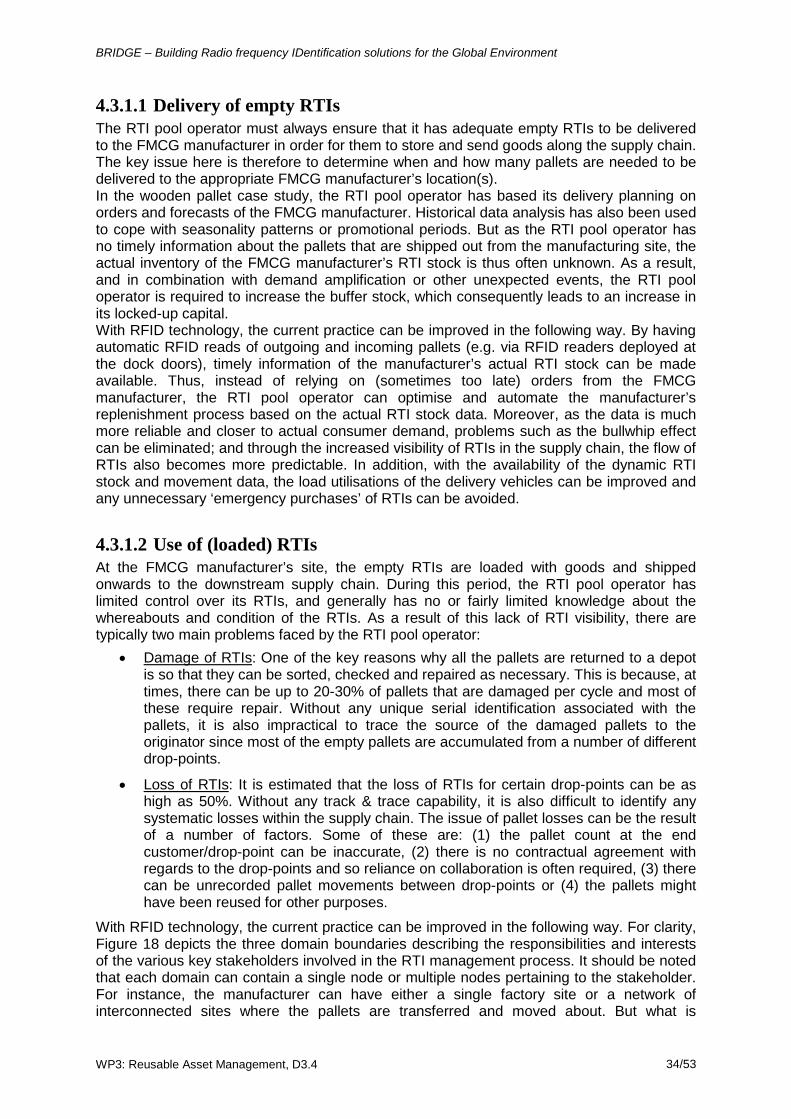
4.3.1.1 Delivery of empty RTIs ........................................................................................................ 34
4.3.1.2 Use of (loaded) RTIs ............................................................................................................ 34
4.3.1.3 Collection of empty RTIs ...................................................................................................... 35
4.3.1.4 Maintenance of RTIs ............................................................................................................ 36
4.3.1.5 RTI information management .............................................................................................. 37
BRIDGE – Building Radio frequency IDentification solutions for the Global Environment
WP3: Reusable Asset Management, D3.4 5/53
4.3.2 Quantitative analysis and assessments .......................................................................... 40
4.3.2.1 Cost benefit analysis ............................................................................................................ 40
4.3.2.2 Investment cost assessment ................................................................................................ 43
4.3.2.2.1 Pool operator perspective ............................................................................................... 43
4.3.2.2.2 FMCG manufacturer and retailer perspective ................................................................. 44
4.4 SUMMARY .............................................................................................................................. 45
5 END USER TRACK AND TRACE QUERIES .............................................................................. 46
5.1 AIMS ..................................................................................................................................... 46
5.2 END-USER QUERIES ............................................................................................................... 46
6 REFERENCES ............................................................................................................................. 49
BRIDGE – Building Radio frequency IDentification solutions for the Global Environment
WP3: Reusable Asset Management, D3.4 6/53
Executive Summary This deliverable provides a contextual model for management of reusable assets. Its purpose is to explain how the Track & Trace Analytics framework developed in D3.2 can be applied to the management and monitoring of reusable assets (and specifically, different categories of reusable transport items (RTI)) as they are used within the distribution processes of supply chains. We begin by examining different categories of reusable transport items and also distinct operational models for the flows of reusable transport items. In particular, we study closed-loop flow (the exchange model) and open-loop flow (the pooling model) and examine the roles of the different actors who are involved with the returnable transport items. These include the manufacturer, retailer, distribution centre, maintenance organisation, supplier of new returnable transport items, third party logistics providers and the pooling operators. We discuss how GS1 EPC standard identifiers such as the Global Returnable Asset Identifier (GRAI) can be applied to returnable transport items and the possible associations that can be made between the identity of the goods transported and the identity of the container. We provide an overview of a number of use cases, involving wooden pallets, plastic pallets, management of brewery kegs, as well as folding plastic security containers, identifying the key performance indicators and the metrics that are used for the management of the returnable transport items. We also discuss analytical models, examining what information is required by each actor, whether they are the hirer of the asset, the end user of the asset or the pool provider of the reusable asset. We also consider the needs for maintenance of the assets and the information management that is required to balance supply and demand of assets. We have provided a comparison of RTI management processes, looking at the impact of adding RFID to each process step. We also provide a quantitative cost benefit analysis of the impact of RFID on the existing cost structure, considering various parameters and the perspectives of the pool operator, manufacturer and retailer of fast moving consumer goods products. From this analysis, we identify a number of high-level track & trace queries that could be useful for monitoring and managing the flow of the reusable assets. Some of these are described in further detail in D3.5.
BRIDGE – Building Radio frequency IDentification solutions for the Global Environment
WP3: Reusable Asset Management, D3.4 7/53
Glossary 3PL Third-Party Logistics Provider DC Distribution Centre DS Discovery Service EDI Electronic Data Interchange EPC Electronic Product Code EPCIS Electronic Product Code Information Service FDIS Final Draft International Standard FMCG Fast Moving Consumer Goods FPSC Folding Plastic Security Container GDTI Global Document Type Identifier GIAI Global Individual Asset Identifier GLN Global Location Number GRAI Global Reusable Asset Identifier GSRN Global Service Relation Number GTIN Global Trade Item Number IBC Intermediate Bulk Container ISO International Organization for Standardization KPI Key Performance Indicator RFID Radio Frequency IDentification RPC Returnable Product Container RTI Returnable Transport Item SGTIN Serialized Global Trade Item Number SKU Stock Keeping Unit SRU Shelf Ready Unit SSCC Serial Shipping Container Code SSLT Site sub location type SSLTA Site Sub-Location. Type Attributes UII Unique Item Identifier URI Uniform Resource Identifier URL Uniform Resource Locator WIP Work In Progress XML eXtensible Markup Language
BRIDGE – Building Radio frequency IDentification solutions for the Global Environment
WP3: Reusable Asset Management, D3.4 8/53
1 Introduction Whenever raw materials are transported to production sites so that goods and items can be manufactured and distributed through onward supply chains to the end user, there is inevitably a need for containers for transport between the various stages. The associated packaging or containers might be disposable or, increasingly, they can be returnable for reuse. Although RTIs (Returnable Transport Items) can coexist with specific goods and be tracked in a similar manner to the goods for a period of time, they are inevitably separated and associated with different goods. This task will thus describe the contextual models for reusable asset management that are based on current typical practices in the RTI (Returnable Transport Item) industry. Reusable containers, pallets, roll-cages, etc are tagged with RFID tags and tracked in order to improve operational efficiency throughout their lifetime in the supply chain. Issues such as dwell time, cycle-time, loss & damage, etc. will also be addressed in this study. Consideration will also be given to the different stakeholders that are generally involved in the handling and management of RTIs. Relationships between these reusable entities and the products (both loaded and unloaded) will be examined from these different stakeholders’ domain of interest and perspective. With that, RFID based processes can then utilise the more fine grained information to improve hand-over processes and loss accounting. The implication of the increased information resolution has hence been shown to change the business model of the reusable asset management industry in a positive way.
1.1 Aims The main aims of this task are concerned with modelling RTI management based on current requirements as well as exploring the opportunities for improved processes as a result of the fined grained information made available by RFID technologies. It is intended that the approach taken is consistent with that of the track & trace supply chain model (D3.1) and the prototype software implementation (D3.2). All the assumptions are based on the assumption that any RFID implementation would be reliant on an EPCglobal network architecture [EPCglobal]; hence allowing queries that would exploit serial-level lookup services (Discovery Services) and EPC Information Service (EPCIS) interfaces to retrieve the RTI information.
BRIDGE – Building Radio frequency IDentification solutions for the Global Environment
WP3: Reusable Asset Management, D3.4 9/53
EPCnetwork
EPCIS Discovery Service
Software prototypeBRIDGE task 3.2
Track and Trace ModelBRIDGE task 3.1
Business applicationBRIDGE WP9
Reusable Asset Management ModelBRIDGE Task 3.4
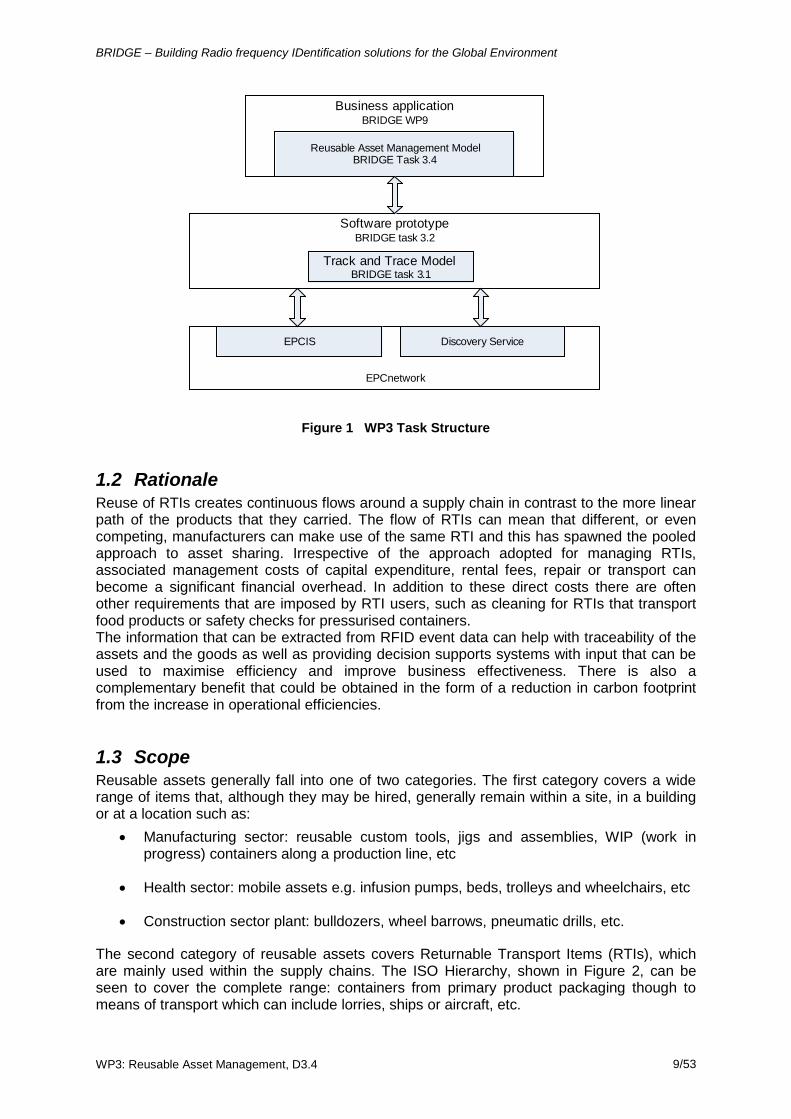
Figure 1 WP3 Task Structure
1.2 Rationale Reuse of RTIs creates continuous flows around a supply chain in contrast to the more linear path of the products that they carried. The flow of RTIs can mean that different, or even competing, manufacturers can make use of the same RTI and this has spawned the pooled approach to asset sharing. Irrespective of the approach adopted for managing RTIs, associated management costs of capital expenditure, rental fees, repair or transport can become a significant financial overhead. In addition to these direct costs there are often other requirements that are imposed by RTI users, such as cleaning for RTIs that transport food products or safety checks for pressurised containers. The information that can be extracted from RFID event data can help with traceability of the assets and the goods as well as providing decision supports systems with input that can be used to maximise efficiency and improve business effectiveness. There is also a complementary benefit that could be obtained in the form of a reduction in carbon footprint from the increase in operational efficiencies.
1.3 Scope Reusable assets generally fall into one of two categories. The first category covers a wide range of items that, although they may be hired, generally remain within a site, in a building or at a location such as:
• Manufacturing sector: reusable custom tools, jigs and assemblies, WIP (work in progress) containers along a production line, etc
• Health sector: mobile assets e.g. infusion pumps, beds, trolleys and wheelchairs, etc
• Construction sector plant: bulldozers, wheel barrows, pneumatic drills, etc.
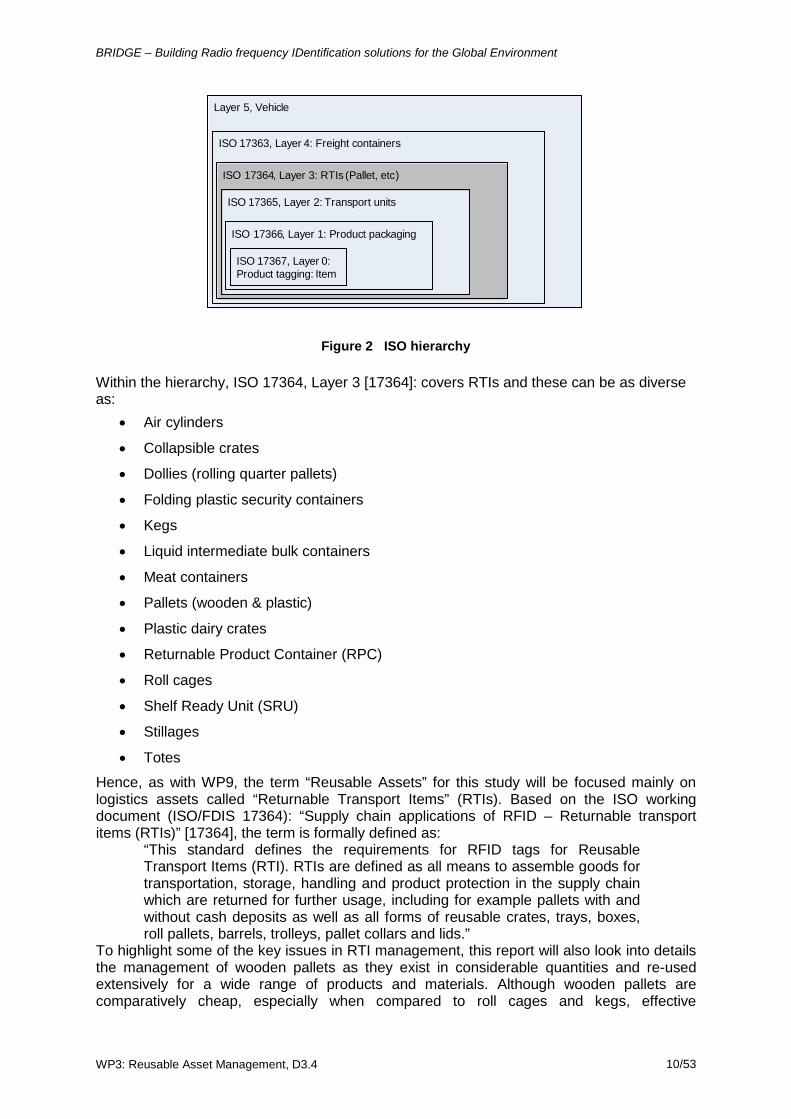
The second category of reusable assets covers Returnable Transport Items (RTIs), which are mainly used within the supply chains. The ISO Hierarchy, shown in Figure 2, can be seen to cover the complete range: containers from primary product packaging though to means of transport which can include lorries, ships or aircraft, etc.
BRIDGE – Building Radio frequency IDentification solutions for the Global Environment
WP3: Reusable Asset Management, D3.4 10/53
Layer 5, Vehicle
ISO 17363, Layer 4: Freight containers
ISO 17364, Layer 3: RTIs (Pallet, etc)
ISO 17365, Layer 2: Transport units
ISO 17366, Layer 1: Product packaging
ISO 17367, Layer 0: Product tagging: Item
Figure 2 ISO hierarchy
Within the hierarchy, ISO 17364, Layer 3 [17364]: covers RTIs and these can be as diverse as:
• Air cylinders
• Collapsible crates
• Dollies (rolling quarter pallets)
• Folding plastic security containers
• Kegs
• Liquid intermediate bulk containers
• Meat containers
• Pallets (wooden & plastic)
• Plastic dairy crates
• Returnable Product Container (RPC)
• Roll cages
• Shelf Ready Unit (SRU)
• Stillages
• Totes
Hence, as with WP9, the term “Reusable Assets” for this study will be focused mainly on logistics assets called “Returnable Transport Items” (RTIs). Based on the ISO working document (ISO/FDIS 17364): “Supply chain applications of RFID – Returnable transport items (RTIs)” [17364], the term is formally defined as:
“This standard defines the requirements for RFID tags for Reusable Transport Items (RTI). RTIs are defined as all means to assemble goods for transportation, storage, handling and product protection in the supply chain which are returned for further usage, including for example pallets with and without cash deposits as well as all forms of reusable crates, trays, boxes, roll pallets, barrels, trolleys, pallet collars and lids.”
To highlight some of the key issues in RTI management, this report will also look into details the management of wooden pallets as they exist in considerable quantities and re-used extensively for a wide range of products and materials. Although wooden pallets are comparatively cheap, especially when compared to roll cages and kegs, effective
BRIDGE – Building Radio frequency IDentification solutions for the Global Environment
WP3: Reusable Asset Management, D3.4 11/53
management is difficult to achieve when there is reliance on manual records. In addition, specific issues relating to the management of kegs and pallets based on folding plastic security container will also be considered.
1.4 Methodology The approach planned was to initially capture a range of user requirement from a series of survey interviews to gather information from RTI operators, hirers and users of RTIs. The aim was to obtain an insight into their current processes and explore the challenges that face the industry. The user requirements were intended to supplement the information reported in WP9.1 and then, following compilation and validation, enable a comprehensive list of requirements to be produced for the subsequent subtasks. All of the information was gathered through a series of face-to-face or phone interviews carried out with some representative suppliers and users of RTIs. The interviews were not limited to descriptions of existing RTI operations and a collation of their key drivers but also helped to provide a deeper understanding of their business operations. Attempts were also made to explore future business options that might be viable if an RFID/EPC network solution was to be implemented. The information gathered enabled an analysis of the scale of operations, the supply network topologies and typical flows to be modelled, for the respective organisations that handle the RTIs. This was later employed in the Returnable Transport Item (RTI) modelling work. The models developed were to take into consideration both the pooling and exchange modes of RTI use. This would then enable, a set of end user queries to be identified and consolidated in the task, with emphasis placed more specifically on the Returnable Transport Item domain.
BRIDGE – Building Radio frequency IDentification solutions for the Global Environment
WP3: Reusable Asset Management, D3.4 12/53
2 RTI Models
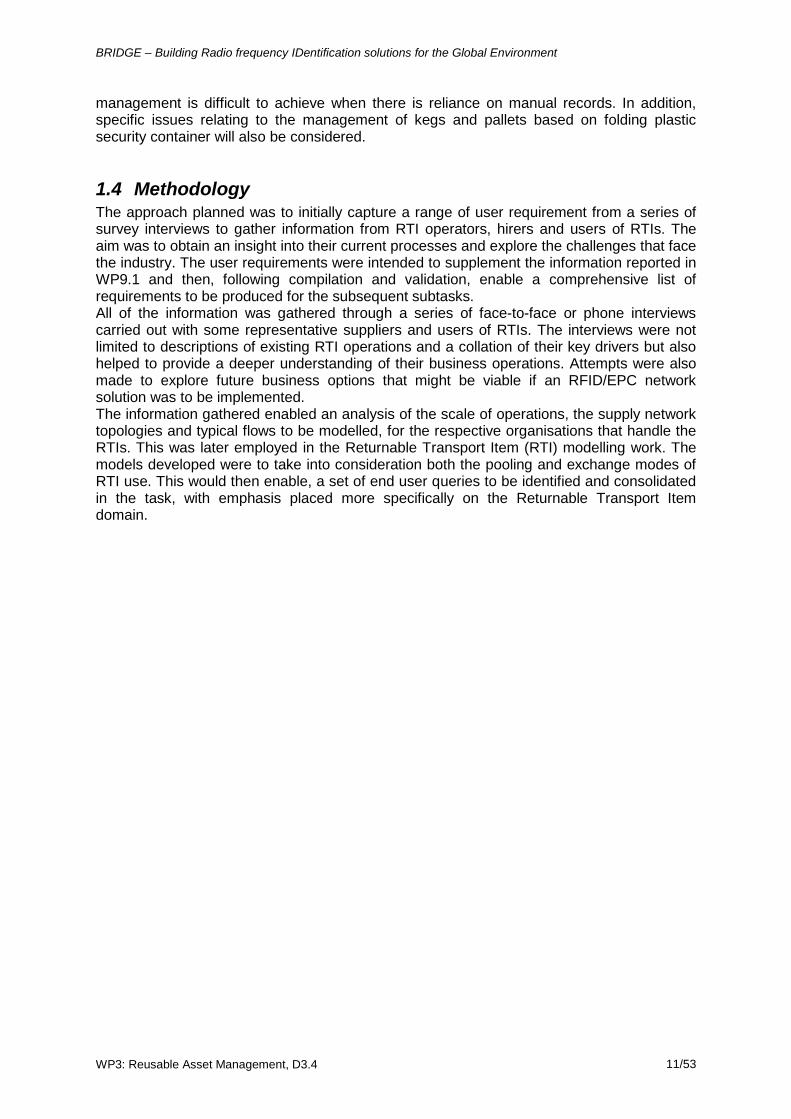
2.1 Typical RTI Models There are two main RTI models widely used in the reusable asset management context: (a) the exchange (or closed-loop) model and (b) pooling (or open-loop) model. The exchange (closed circulation) model is the simplest model which basically relies on a tally that is kept if the number of loaded RTIs is swapped for an equal number of empty RTIs. This approach suits some manufacturers that supply retailers directly and also those manufacturers that have their own custom RTIs. In the simplest form, the RTIs can be exchanged solely between two parties: the supplier and customers. The process requires a record of the type and quantity of RTIs being exchanged and a means to balance the exchanges ascertained. A basic variant on this model covers the case when the supplier owns the RTIs e.g. branded bottle crates and these RTIs are to be returned to the supplier. The alternative approach is known as pooling (open circulation) model. The model relies on the fact that a pool operator owns the RTIs and makes sure that the quality and quantity of these RTIs match the supply chain partners’ requirements. These RTIs are typically pooled between a number of customers and manufacturers. The pooling process includes managing the RTIs back from the delivery location and reconditioning before reissue. This is primarily based on a rental operation which means that the manufacturers do not need to have their capital tied up in RTI assets.
(a) exchange or closed-loop model (b) pooling or open-loop model
Figure 3 Typical RTI models
As with many industry practices, there are a few variants of the above that are customised and tailored for different customers. Different methods of accounting and charging processes are also reflected to suit their business requirements. Some of these variants include:
• Variable Pool Rental – A supply and return option, tracking volumes of trays, totes, hygiene pallets and other rental equipment issued and returned, applying agreed charges for only those in use.
• Dynamic Pooling – Fixed pricing option applied to the provision of a dedicated product pool with per unit charges applied to additional services i.e. washing, logistics.
BRIDGE – Building Radio frequency IDentification solutions for the Global Environment
WP3: Reusable Asset Management, D3.4 13/53
• Pool Brokerage – Operating as either Variable Pool Rental or Dynamic Pooling with direct invoicing to suppliers. This may be structured to provide a commissioned contribution to operating costs.
• One Way Rental – Variable pricing option charged on a ‘per trip' basis and managed using a pool of uniquely identified trays, totes or pallets (an established and cost effective alternative to RFID tagging).
The following analysis offers typical attributes and comments relating to the exchange and pooling models. This analysis is considered from the viewpoints of the various players that are involved in the supply, use and handling of RTIs and seeks to identify typical functions and highlight drivers for efficiency and cost reduction as well as the ability to manage in terms of basic count, audit and location and is predominantly based on current practise for RTIs in general.
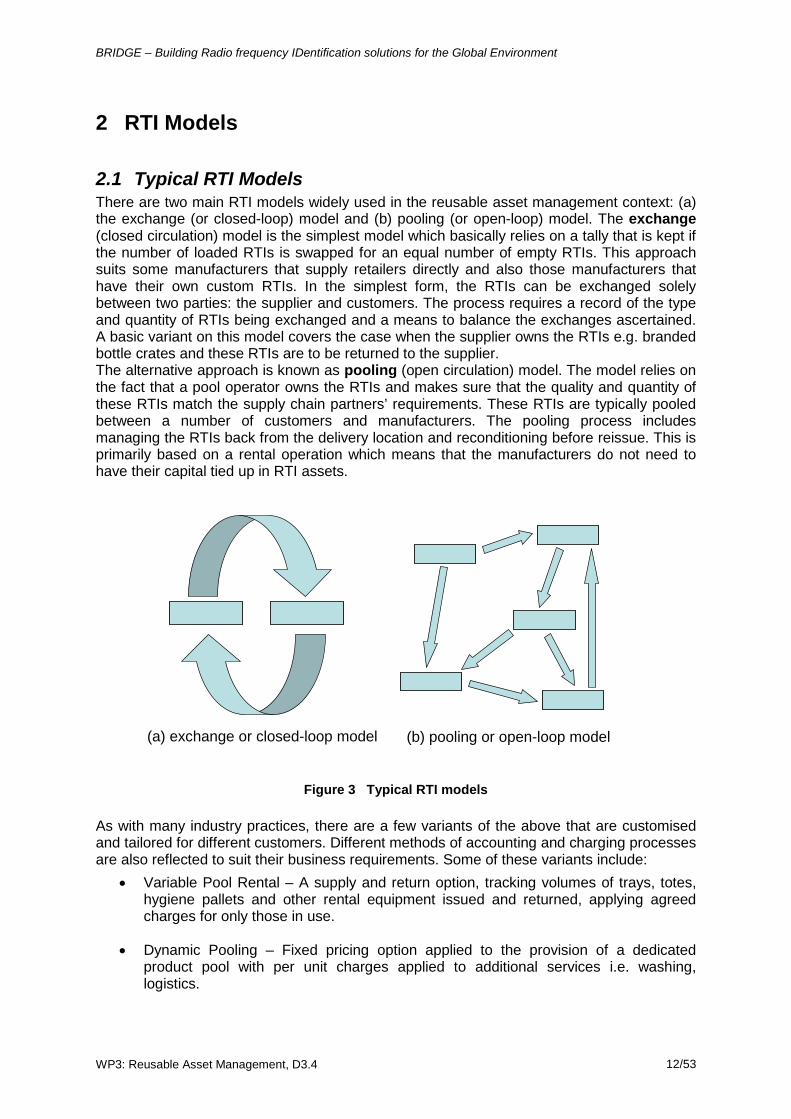
2.1.1 Exchange model (Closed-loop circulation) Figure 4 depicts the logical flow of both loaded and empty RTIs for a typical exchange model. For clarity, the 3PL logistics operator that might be employed to transport the empty or loaded RTIs has been omitted in the figure. Note that there may be some variations to the logical flow of the exchange model: for instance, the distribution centre illustrated could be associated with either the manufacturer or the retailer. Also, the supply and service of the RTI could be either managed by a separate company or possibly dealt with by the manufacturer. Some of companies or sectors that typically use the exchange model are: Arla (Swedish dairy industry), laundry and postal services. The typical issues and processes involved for each of the individual players in the exchange model are listed in the following sections.
Distribution Centre
Manufacturer Retailer
RTI supplier RTI service
Figure 4 Logical flow of RTIs, exchange model (bold lines = loaded RTI paths)
BRIDGE – Building Radio frequency IDentification solutions for the Global Environment
WP3: Reusable Asset Management, D3.4 14/53
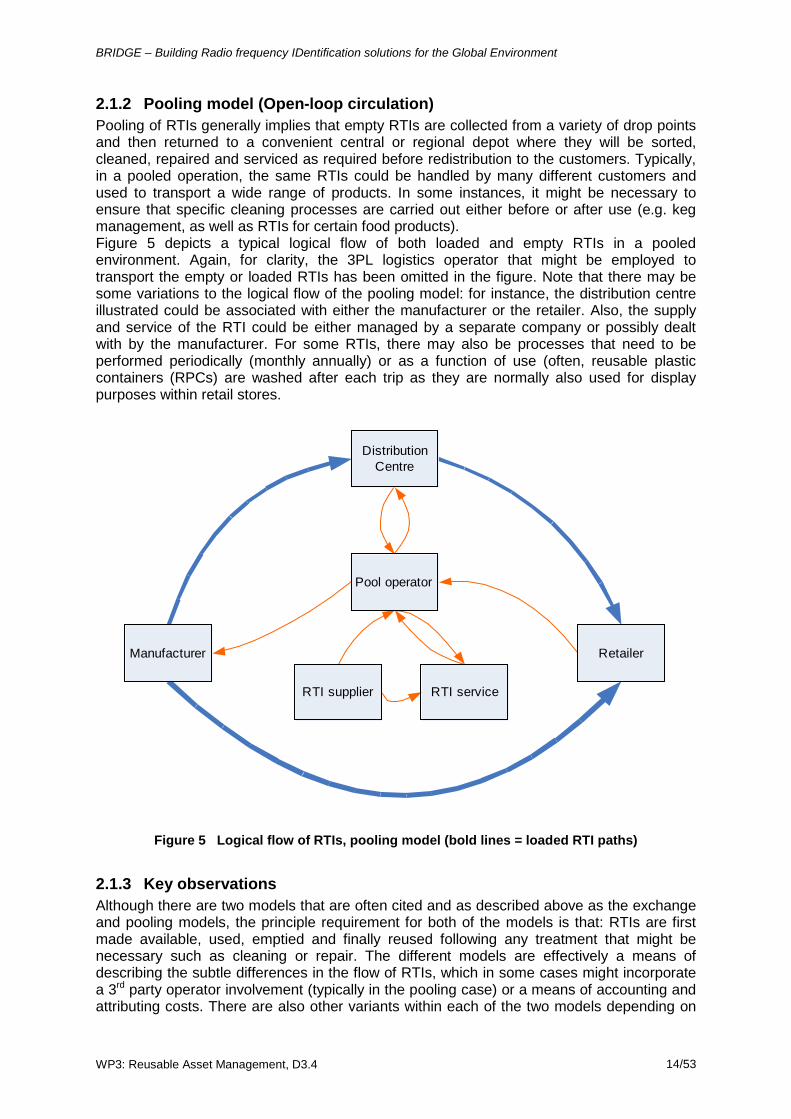
2.1.2 Pooling model (Open-loop circulation) Pooling of RTIs generally implies that empty RTIs are collected from a variety of drop points and then returned to a convenient central or regional depot where they will be sorted, cleaned, repaired and serviced as required before redistribution to the customers. Typically, in a pooled operation, the same RTIs could be handled by many different customers and used to transport a wide range of products. In some instances, it might be necessary to ensure that specific cleaning processes are carried out either before or after use (e.g. keg management, as well as RTIs for certain food products). Figure 5 depicts a typical logical flow of both loaded and empty RTIs in a pooled environment. Again, for clarity, the 3PL logistics operator that might be employed to transport the empty or loaded RTIs has been omitted in the figure. Note that there may be some variations to the logical flow of the pooling model: for instance, the distribution centre illustrated could be associated with either the manufacturer or the retailer. Also, the supply and service of the RTI could be either managed by a separate company or possibly dealt with by the manufacturer. For some RTIs, there may also be processes that need to be performed periodically (monthly annually) or as a function of use (often, reusable plastic containers (RPCs) are washed after each trip as they are normally also used for display purposes within retail stores.
Distribution Centre
Manufacturer Retailer
RTI supplier RTI service
Pool operator
Figure 5 Logical flow of RTIs, pooling model (bold lines = loaded RTI paths)
2.1.3 Key observations Although there are two models that are often cited and as described above as the exchange and pooling models, the principle requirement for both of the models is that: RTIs are first made available, used, emptied and finally reused following any treatment that might be necessary such as cleaning or repair. The different models are effectively a means of describing the subtle differences in the flow of RTIs, which in some cases might incorporate a 3rd party operator involvement (typically in the pooling case) or a means of accounting and attributing costs. There are also other variants within each of the two models depending on
BRIDGE – Building Radio frequency IDentification solutions for the Global Environment
WP3: Reusable Asset Management, D3.4 15/53
its industry sectors, scales of operation and, to some extent, the geographic reach and complexity of the supply chains. Nevertheless, these can be encompassed within the exchange and pooling flow model spectrum. In fact, without any loss of generality, the exchange model can be deemed to be a special case or constitute a subset of the larger pooling model. And a generalised set of observations can hence be collated, as shown below, so as to highlight the subtle differences between these two commonly-known models.
2.1.3.1 Manufacturer • Receives empty RTIs, loads them and ships them out into the supply chain.
• A buffer stock of empty RTIs is required to match production schedule. Without RTIs moving the finished products, it might be necessary, in some cases, to stop the production line.
• The number of RTIs required could fluctuate as a result of seasonal requirements as well as other less predictable events, e.g. weather.
• Large stock of empty RTIs is to be avoided as the redundant stock would have a cost implication and require storage space.
• When stock is produced and warehoused with a number of RTI, those RTIs are effectively out of circulation and this implies that the manufacturer would be in ‘debit’.
• RTIs could be expected to be loaded at the end of a production line. Prior to this point WIP (work in progress) containers or IBC (intermediate bulk containers) are often used and these do not enter the supply chain.
2.1.3.2 Retailer • Receives inbound RTIs that are loaded.
• All inbound loaded RTIs need to be emptied, stored and returned at the earliest opportunity.
• Retailers could handle RTIs from a number of sources and often need to sort out the emptied RTIs for later collection.
• Some of the RTIs function as display units for products and would remain in the store for longer periods. This might either be a simple stack of pallets or specific SRUs (shelf ready units).
2.1.3.3 Distribution centre • Receives loaded RTIs, handles RTI internally and ships loaded RTIs possibly with
mixed loads (Cross-docking).
• Might also require extra RTIs or might have a surplus of RTIs.
• Supplementary RTIs to create a buffer stock could be anticipated, for instance, when an RTI has its contents split across 2 or more RTIs for onward distribution.
• Distribution centres could handle RTIs from a number of sources/suppliers.
2.1.3.4 Maintenance centre • Provide cleaning, repair and servicing of RTIs
• Only handles empty RTIs
BRIDGE – Building Radio frequency IDentification solutions for the Global Environment
WP3: Reusable Asset Management, D3.4 16/53
• Servicing could be outsourced to a separate company that in turn might handle RTIs from other sources and different users
2.1.3.5 Supplier of new RTIs • Manufacture new RTIs to increase or replenish stocks in the supply chain
• Likely to supply the same or similar products to other RTI users
2.1.3.6 Third party logistics • Shipping of RTIs either loaded or empty, between nodes in the supply chain.
• Could also provide warehousing and other functions
• Transport might be integrated with an RTI user’s business. For example, a manufacturer might ship loaded RTIs direct to a retailer
2.1.3.7 Pooling operator • Only handles empty RTIs
• Pooling operators may have a number of DCs
2.2 Reusable assets identification
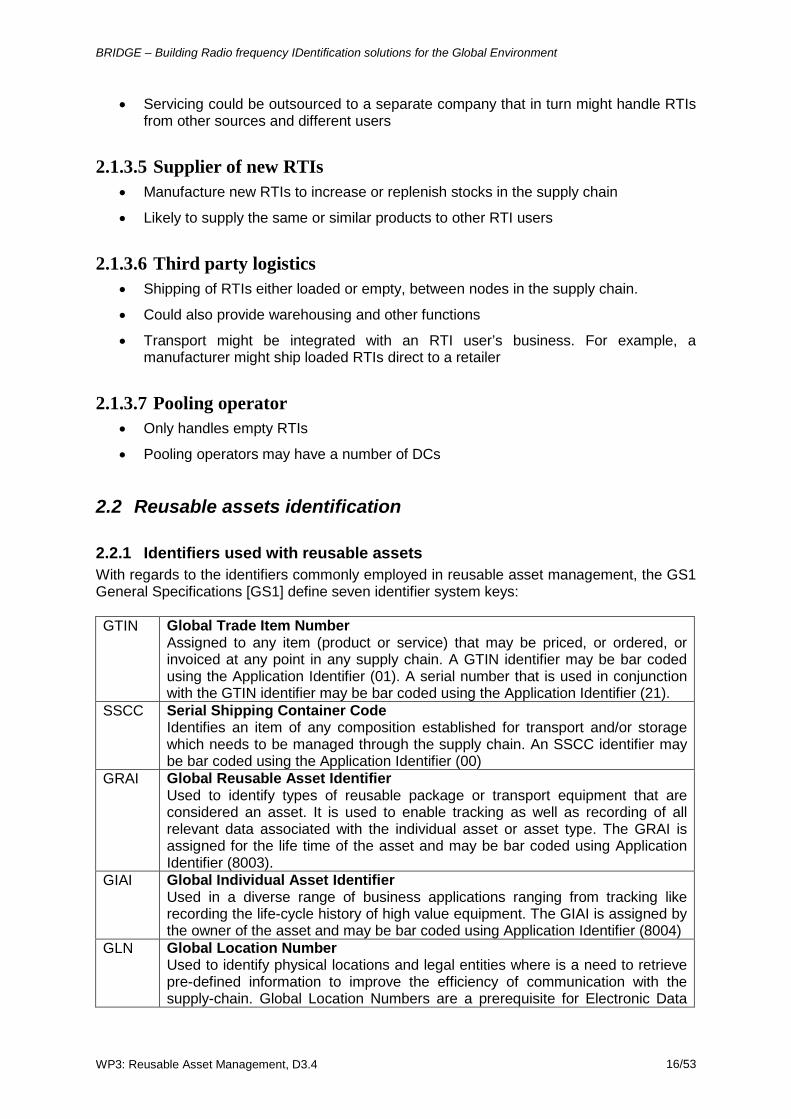
2.2.1 Identifiers used with reusable assets With regards to the identifiers commonly employed in reusable asset management, the GS1 General Specifications [GS1] define seven identifier system keys: GTIN Global Trade Item Number
Assigned to any item (product or service) that may be priced, or ordered, or invoiced at any point in any supply chain. A GTIN identifier may be bar coded using the Application Identifier (01). A serial number that is used in conjunction with the GTIN identifier may be bar coded using the Application Identifier (21).
SSCC Serial Shipping Container Code Identifies an item of any composition established for transport and/or storage which needs to be managed through the supply chain. An SSCC identifier may be bar coded using the Application Identifier (00)
GRAI Global Reusable Asset Identifier Used to identify types of reusable package or transport equipment that are considered an asset. It is used to enable tracking as well as recording of all relevant data associated with the individual asset or asset type. The GRAI is assigned for the life time of the asset and may be bar coded using Application Identifier (8003).
GIAI Global Individual Asset Identifier Used in a diverse range of business applications ranging from tracking like recording the life-cycle history of high value equipment. The GIAI is assigned by the owner of the asset and may be bar coded using Application Identifier (8004)
GLN Global Location Number Used to identify physical locations and legal entities where is a need to retrieve pre-defined information to improve the efficiency of communication with the supply-chain. Global Location Numbers are a prerequisite for Electronic Data
BRIDGE – Building Radio frequency IDentification solutions for the Global Environment
WP3: Reusable Asset Management, D3.4 17/53
Interchange (EDI) GSRN Global Service Relation Number
Used to identify the recipient of services in the context of a service relationship. It is used to enable access to a database entry for recording recurring services. The GSRN is normally assigned by the service provider and may be bar coded using Application Identifier (8018). Note that the GSRN is not an identifier for a person - but for a service relationship and should only be used within the context of a particular service.
GDTI Global Document Type Identifier An identifier for a document type combined with an optional serial number and used to access database information that is required for document control purposes. The GDTI is assigned for the life time of the document type and may be bar coded using Application Identifier (253)
Each of these identifiers can be encoded as an Electronic Product Code (EPC). The EPCglobal Tag Data Standard v1.4 specifies the URI representations that should be used within the EPC Network standards and data exchanges, as well as specifying the encoding and decoding procedures for writing/reading such identifiers to RFID tags in a compact binary format.
A reusable asset (including pallets, totes and other returnable transport items such as roll-cages, dollies and trolleys) will normally be assigned a GRAI identifier.
GRAI
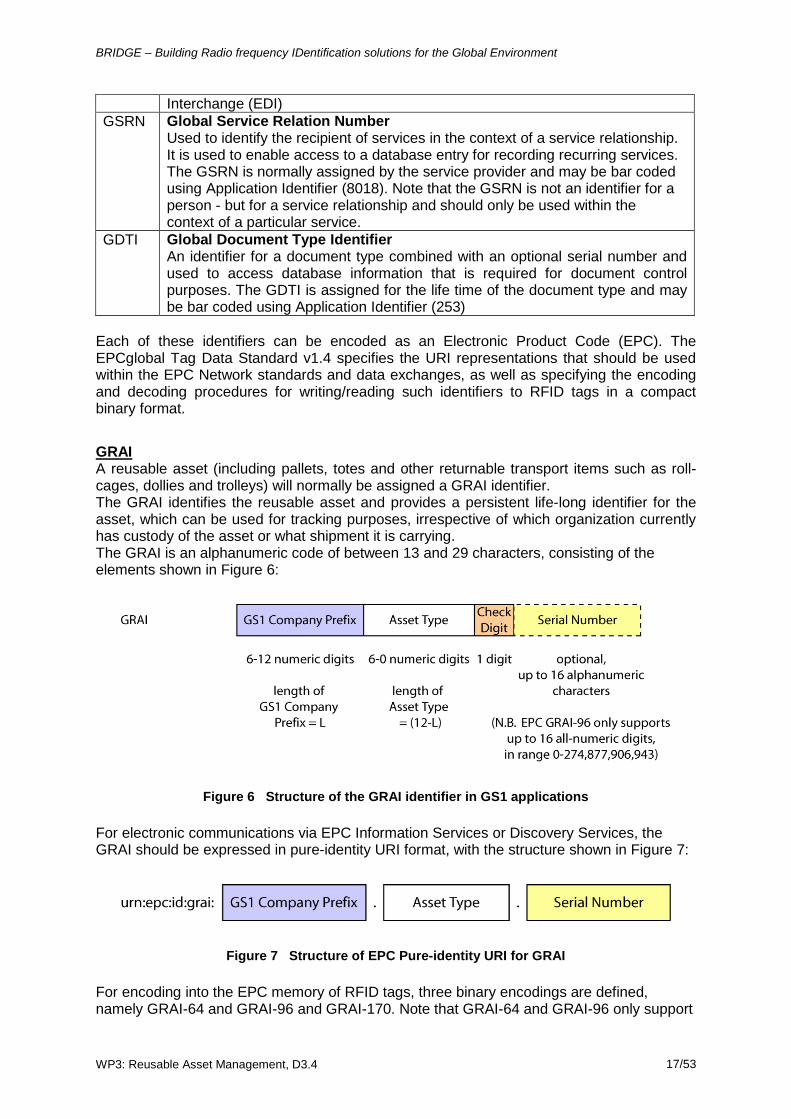
The GRAI identifies the reusable asset and provides a persistent life-long identifier for the asset, which can be used for tracking purposes, irrespective of which organization currently has custody of the asset or what shipment it is carrying. The GRAI is an alphanumeric code of between 13 and 29 characters, consisting of the elements shown in Figure 6:
Figure 6 Structure of the GRAI identifier in GS1 applications
For electronic communications via EPC Information Services or Discovery Services, the GRAI should be expressed in pure-identity URI format, with the structure shown in Figure 7:
Figure 7 Structure of EPC Pure-identity URI for GRAI
For encoding into the EPC memory of RFID tags, three binary encodings are defined, namely GRAI-64 and GRAI-96 and GRAI-170. Note that GRAI-64 and GRAI-96 only support
BRIDGE – Building Radio frequency IDentification solutions for the Global Environment
WP3: Reusable Asset Management, D3.4 18/53
all-numeric serial numbers, whereas GRAI-170 supports up to 16 alphanumeric characters in the serial number.
The Serial Shipping Container Code (SSCC) identifies a shipment during storage or transit. It does not indicate the type of product (product class or GTIN) contained within the shipment. As such, it is particularly suitable for the identification of mixed shipments that consist of a number of components from different product classes.
SSCC
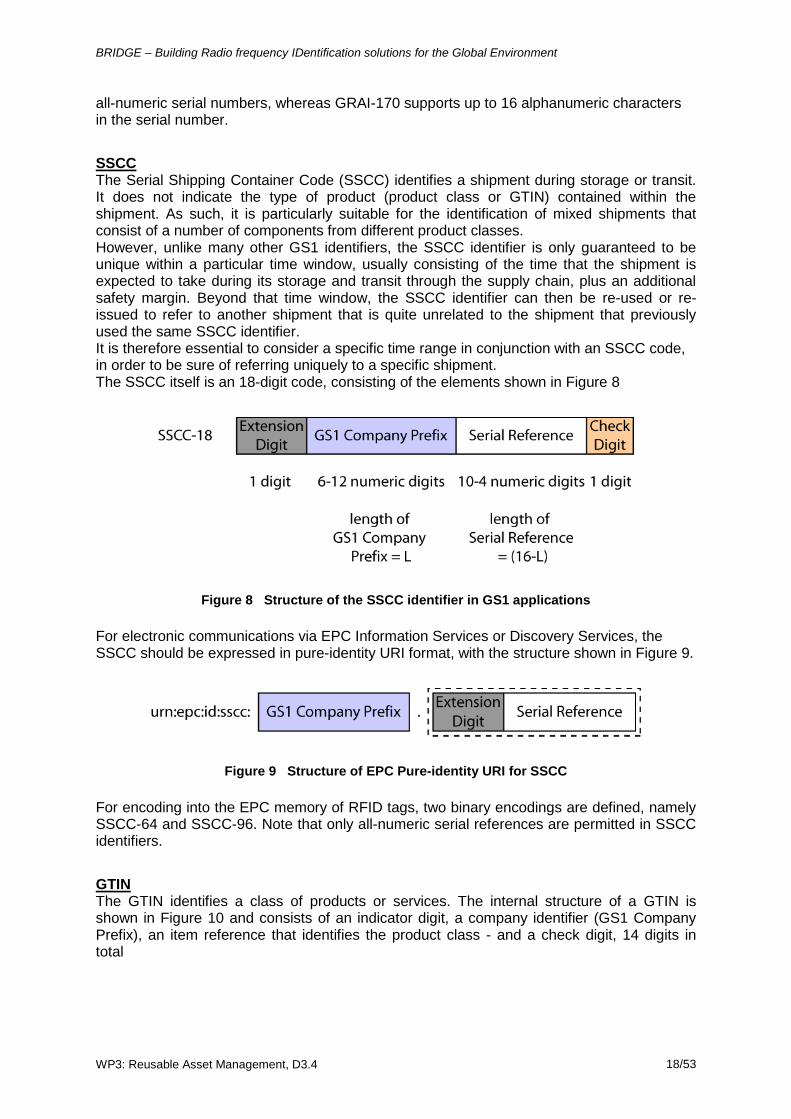
However, unlike many other GS1 identifiers, the SSCC identifier is only guaranteed to be unique within a particular time window, usually consisting of the time that the shipment is expected to take during its storage and transit through the supply chain, plus an additional safety margin. Beyond that time window, the SSCC identifier can then be re-used or re-issued to refer to another shipment that is quite unrelated to the shipment that previously used the same SSCC identifier. It is therefore essential to consider a specific time range in conjunction with an SSCC code, in order to be sure of referring uniquely to a specific shipment. The SSCC itself is an 18-digit code, consisting of the elements shown in Figure 8
Figure 8 Structure of the SSCC identifier in GS1 applications
For electronic communications via EPC Information Services or Discovery Services, the SSCC should be expressed in pure-identity URI format, with the structure shown in Figure 9.
Figure 9 Structure of EPC Pure-identity URI for SSCC
For encoding into the EPC memory of RFID tags, two binary encodings are defined, namely SSCC-64 and SSCC-96. Note that only all-numeric serial references are permitted in SSCC identifiers.
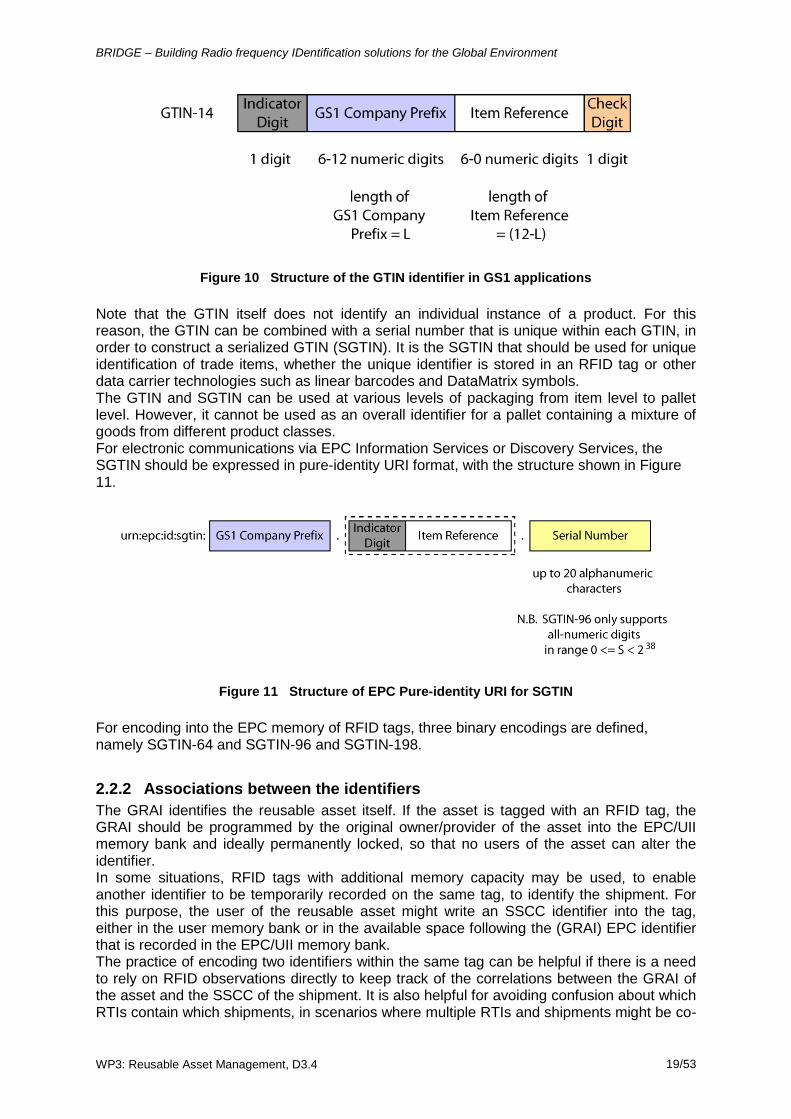
The GTIN identifies a class of products or services. The internal structure of a GTIN is shown in
GTIN
Figure 10 and consists of an indicator digit, a company identifier (GS1 Company Prefix), an item reference that identifies the product class - and a check digit, 14 digits in total
BRIDGE – Building Radio frequency IDentification solutions for the Global Environment
WP3: Reusable Asset Management, D3.4 19/53
Figure 10 Structure of the GTIN identifier in GS1 applications
Note that the GTIN itself does not identify an individual instance of a product. For this reason, the GTIN can be combined with a serial number that is unique within each GTIN, in order to construct a serialized GTIN (SGTIN). It is the SGTIN that should be used for unique identification of trade items, whether the unique identifier is stored in an RFID tag or other data carrier technologies such as linear barcodes and DataMatrix symbols. The GTIN and SGTIN can be used at various levels of packaging from item level to pallet level. However, it cannot be used as an overall identifier for a pallet containing a mixture of goods from different product classes. For electronic communications via EPC Information Services or Discovery Services, the SGTIN should be expressed in pure-identity URI format, with the structure shown in Figure 11.
Figure 11 Structure of EPC Pure-identity URI for SGTIN
For encoding into the EPC memory of RFID tags, three binary encodings are defined, namely SGTIN-64 and SGTIN-96 and SGTIN-198.
2.2.2 Associations between the identifiers The GRAI identifies the reusable asset itself. If the asset is tagged with an RFID tag, the GRAI should be programmed by the original owner/provider of the asset into the EPC/UII memory bank and ideally permanently locked, so that no users of the asset can alter the identifier. In some situations, RFID tags with additional memory capacity may be used, to enable another identifier to be temporarily recorded on the same tag, to identify the shipment. For this purpose, the user of the reusable asset might write an SSCC identifier into the tag, either in the user memory bank or in the available space following the (GRAI) EPC identifier that is recorded in the EPC/UII memory bank. The practice of encoding two identifiers within the same tag can be helpful if there is a need to rely on RFID observations directly to keep track of the correlations between the GRAI of the asset and the SSCC of the shipment. It is also helpful for avoiding confusion about which RTIs contain which shipments, in scenarios where multiple RTIs and shipments might be co-
BRIDGE – Building Radio frequency IDentification solutions for the Global Environment
WP3: Reusable Asset Management, D3.4 20/53
located during transportation or storage; if each tag only stored one identifier (either an SSCC or a GRAI), then it may be more difficult to determine which shipment SSCC corresponded to which RTI GRAI when simply reading a list of EPCs of tags within read range of the reader. In other situations, a reusable asset might be tagged with two or more separate tags, with at least one encoded with a GRAI and ideally permanently locked - and at least one tag available for writing by the current user of the asset, e.g. to store an SSCC of the shipment. A third scenario is that the reusable asset only carries a GRAI identifier and that the associations between the GRAI of the asset and the SSCC of the shipment is communicated via electronic information exchanges, either via EDI messages such as Advance Shipping Notices - or via EPCIS aggregation events, in which the parentID might be the GRAI of the asset and the childEPCs may be a list of one or more objects associated with that asset, i.e. either an SSCC for the shipment or a list of SGTINs for the individual products carried in/on that asset. Note that in the three scenarios above, an SGTIN could only be used to indicate the ID of a homogeneous shipment of a single product type, whereas an SSCC could be used to indicate the ID of a heterogeneous mixed shipment consisting of objects having different product types.
BRIDGE – Building Radio frequency IDentification solutions for the Global Environment
WP3: Reusable Asset Management, D3.4 21/53
3 RTI Use Cases
3.1 Overview Although there are trials and instances where RFID has been used with RTIs, there are currently very limited examples where the technology has been used to any significant extent. The approach taken for the study of RTI use was that of a series of interviews that were guided by a pre-prepared set of guidelines (see Appendix). The interviewees ranged from RTI operators, hirers, and users, as well as system integrators who were well placed to have a clear holistic view of the overall operation and issues. The majority of the following cases do not have significant on-going RFID processes in their existing operation, except for one which features a limited deployment. It is also worth noting to note that, although that particular case has managed to have the RFID infrastructure rolled out, it did not incorporate any of the elements of the EPC Network architecture. The rationale behind such limited use cases is due to the fact that, generally, the operations of existing non-RFID supply chains work rather well and tend to relatively efficient. As such, the main focus of our interviews is turned to the identification of the inherent weaknesses in the existing supply chain and their RTIs flow processes. In addition to cost efficiencies, the instances when problems occur which might be due to human error, breakdowns or unpredictable demand profiles are of particular interest as the knock-on effect to customers can be inconvenient and can result in increased costs and unnecessary inefficiencies. The following study of wooden pallet pooling is the most comprehensive and features all of the key partners. Wooden pallet pooling is in contrast with plastic pallet pooling and the key differences are highlighted. This is followed by an outline of keg management and a brief study of folding plastic security container highlighting some specific issues. It should be noted that these studies will not highlight all differences in operation that are likely to be found among different industry sectors and variations are likely to occur in different countries and for different manufacturers.
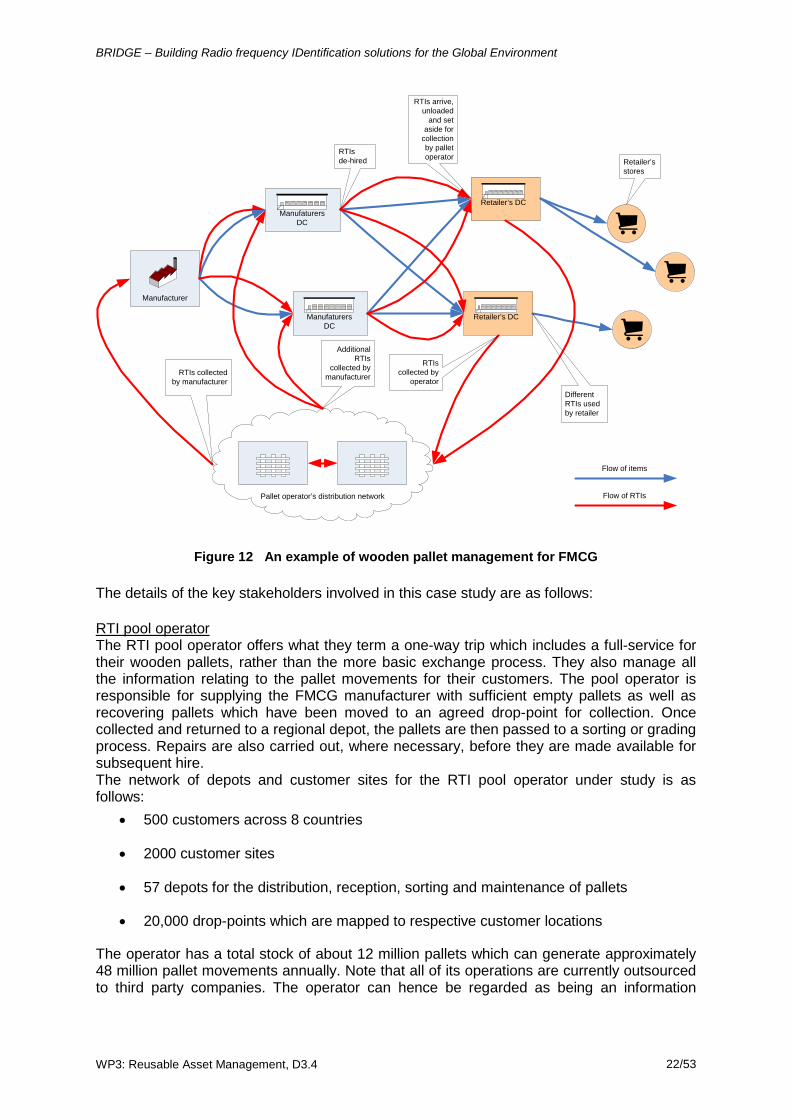
3.2 Wooden pallet management The wooden pallet management under study is a pooled operation whereby an FMCG manufacturer, with several manufacturing plants and warehouses uses pallets to store, handle and distribute goods. The pooling operation is as illustrated in Figure 12. In this particular study, the empty pallets (flow shown as red arrows) are collected from the pooling operator and delivered to the various manufacturing plants. When the manufacturer takes delivery of the required number pallets, they are then loaded with goods at the end of the production lines. In this case, the loaded pallets (flow shown as blue arrows), which generallycontain dry packaged goods,are distributed to the manufacturer’s customers (i.e. retailers and wholesalers) via the manufacturer’s distribution centres. At the retailers’ distribution centres the pallets are either cross-docked and shipped out directly to the larger stores, or the pallets are emptied and alternative RTIs are used, e.g. rollcages. When supermarket shelves are to be restocked then rollcages are often filled with a range of different items and rolled into the store for transfer to the shelves as pallet handling within a store is not always possible or practical. The points at which pallets are emptied can be at the retailers’ distribution centre or at the larger retail outlets. The collection of pallets, from drop-points, is generally mutually arrangedbetween the pooling operator and the party that accumulates the empty pallets. Any collection agreements that are madearebased on volumes and locations.
BRIDGE – Building Radio frequency IDentification solutions for the Global Environment
WP3: Reusable Asset Management, D3.4 22/53
Pallet operator’s distribution network
Manufacturer
Manufaturers DC
Manufaturers DC
Retailer’s DC
Retailer’s DC
Flow of items
Flow of RTIs
RTIs collected by manufacturer
RTIs collected by
operator
Different RTIs used by retailer
Additional RTIs
collected by manufacturer
RTIsde-hired
RTIs arrive, unloaded
and set aside for
collection by pallet operator Retailer’s
stores
Figure 12 An example of wooden pallet management for FMCG
The details of the key stakeholders involved in this case study are as follows:
The RTI pool operator offers what they term a one-way trip which includes a full-service for their wooden pallets, rather than the more basic exchange process. They also manage all the information relating to the pallet movements for their customers. The pool operator is responsible for supplying the FMCG manufacturer with sufficient empty pallets as well as recovering pallets which have been moved to an agreed drop-point for collection. Once collected and returned to a regional depot, the pallets are then passed to a sorting or grading process. Repairs are also carried out, where necessary, before they are made available for subsequent hire.
RTI pool operator
The network of depots and customer sites for the RTI pool operator under study is as follows:
• 500 customers across 8 countries
• 2000 customer sites
• 57 depots for the distribution, reception, sorting and maintenance of pallets
• 20,000 drop-points which are mapped to respective customer locations
The operator has a total stock of about 12 million pallets which can generate approximately 48 million pallet movements annually. Note that all of its operations are currently outsourced to third party companies. The operator can hence be regarded as being an information
BRIDGE – Building Radio frequency IDentification solutions for the Global Environment
WP3: Reusable Asset Management, D3.4 23/53
business that simply owns the pallets, handles the data for the customers and makes purchases of new pallet as and when required.
The FMCG manufacturer is a representative example of a large multinational organisation that not only owns several brands but also handles a diverse range of products. Their prime need of the pallets is for the transferral of goods at the end of the production lines from the various factory sites. Palleted goods are then stored at one of the manufacturer’s major distribution centres before downstreaming through the supply chain to their customers’ warehouses or distribution centres.
Fast Moving Consumer Goods manufacturer
Note that each pallet can be loaded with several cases of goods. A single SSCC (Serial Shipping Container Code) label is then applied to the aggregated goods on each of the pallets. This SSCC label is used to manage all the movements of the goods on the associated pallet, starting from the end of the production line, into the storage areas and distributions centres, up to the point where it is dispatched to the customer. Upon dispatch, the quantity of pallets and their destination are then declared to the pool operator. Note that following the declaration, the pallets are effectively “de-hired” from the manufacturer. The accumulated emptied pallets at the end customer (retailer) are finally collected by the pool operator. Notice that the pool operator has no knowledge of when the pallets are being used by the manufacturer and is only advised when a quantity of pallets has left for the customer/retailer sites. The operator has thus envisaged that without a unique identifier associated with each pallet, it would be difficult to introduce significant efficiency to the current processes. The manufacturer has also recognised that there would be a benefit in having a reliable and automated means of counting pallets at strategic points and knowing which type of platform (shelf-ready unit, pallet, etc) the goods had been stacked on.
The supermarket retailer in this study has an extensive chain of large, medium and small stores. The larger stores have a significant volume of goods arriving and as such the recovery of pallets by the pool provider is generally not an issue. The pool provider will also have some insight as to when there is a sufficient quantity to justify the transport. The smaller stores, on the other hand, will receive comparatively fewer pallets and might not merit a regular collection when the relative costs are taken into consideration.
Supermarket retailer
The date by which the pallets leave the manufacturer’s distribution centres effectively marks the end of the hire period. When the pallets arrive at the retailer’s sites they are credited to the retailer’s account although, in practice, they do not normally incur charges for the pallets in their possession. When the retailer frees up the pallets, they are then set aside for collection by the pool operator. Major retailers will generally know the flow-through of the pallets and have an appropriate arrangement with the pool operator for their periodic collection. However, not all of the retailers will have an arrangement or account with the pool operator. In such cases, pallets might be handled on an exchange basis; for example, if 20 loaded pallets are delivered, 20 empty pallets will be taken back in exchange. Although there are collaborative arrangements in place between the pool operator and the retailer, there is no guarantee that there will be any timely return of the pallets. In addition, it is difficult to accurately estimate the quantity of pallets that are held by the retailer at each of their locations.
3.3 Plastic pallet management Apart from the wooden pallets described in the main study, an alternative is pallets that are of a rugged plastic construction. These are managed in a similar way to the wooden pallets in which all trip and movements are accounted for using a basic count at strategic points
BRIDGE – Building Radio frequency IDentification solutions for the Global Environment
WP3: Reusable Asset Management, D3.4 24/53
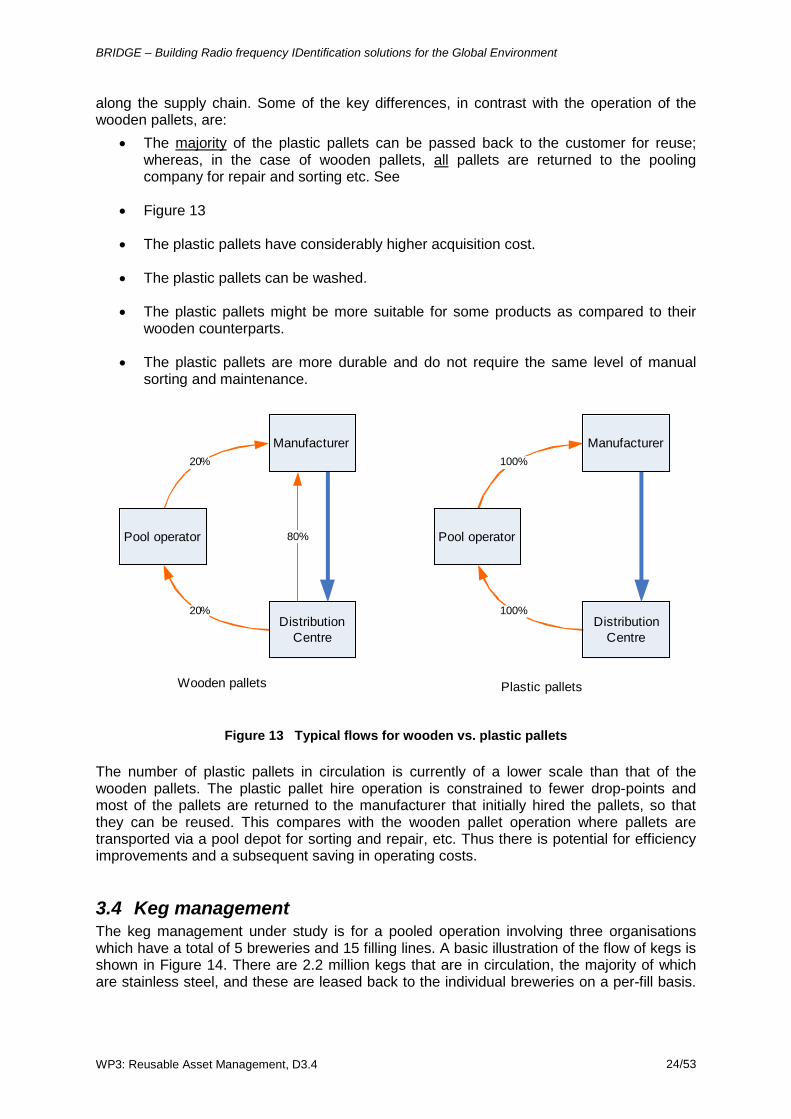
along the supply chain. Some of the key differences, in contrast with the operation of the wooden pallets, are:
• The majority of the plastic pallets can be passed back to the customer for reuse; whereas, in the case of wooden pallets, all
pallets are returned to the pooling
company for repair and sorting etc. See
• Figure 13
• The plastic pallets have considerably higher acquisition cost.
• The plastic pallets can be washed.
• The plastic pallets might be more suitable for some products as compared to their wooden counterparts.
• The plastic pallets are more durable and do not require the same level of manual sorting and maintenance.
20%
20%
80%
Distribution Centre
Pool operator
Manufacturer
100%
100%
Distribution Centre
Pool operator
Manufacturer
Wooden pallets Plastic pallets
Figure 13 Typical flows for wooden vs. plastic pallets
The number of plastic pallets in circulation is currently of a lower scale than that of the wooden pallets. The plastic pallet hire operation is constrained to fewer drop-points and most of the pallets are returned to the manufacturer that initially hired the pallets, so that they can be reused. This compares with the wooden pallet operation where pallets are transported via a pool depot for sorting and repair, etc. Thus there is potential for efficiency improvements and a subsequent saving in operating costs.
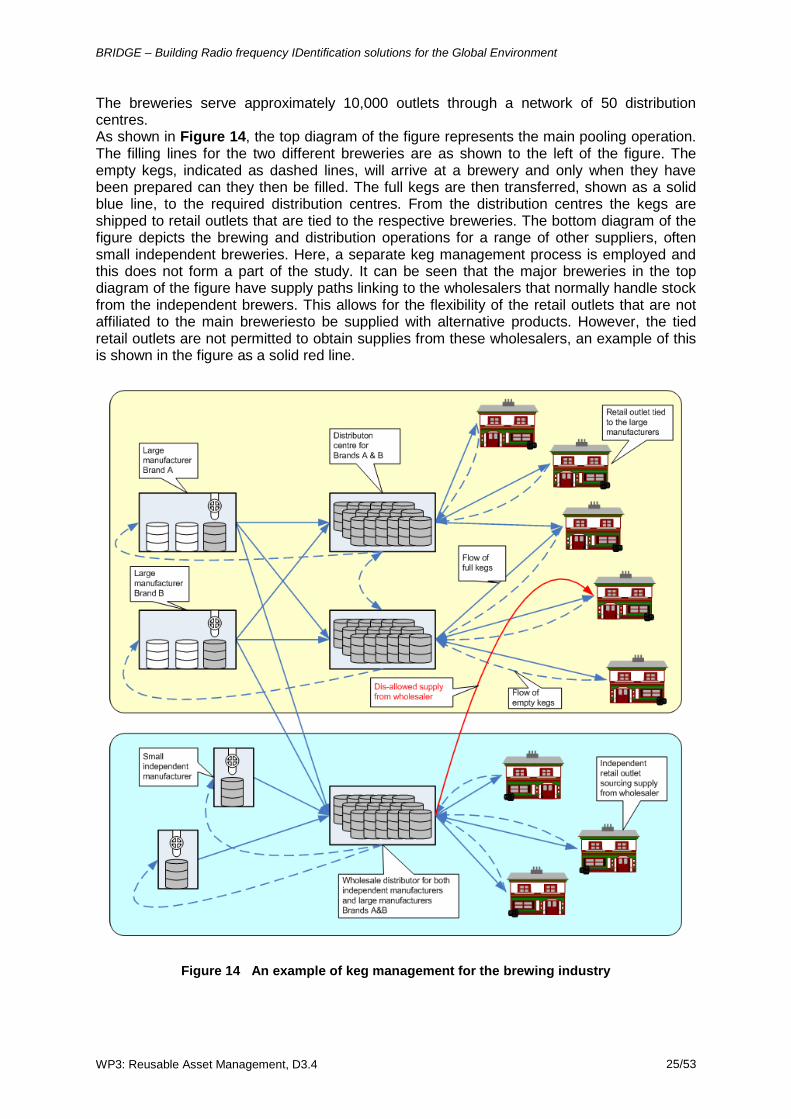
3.4 Keg management The keg management under study is for a pooled operation involving three organisations which have a total of 5 breweries and 15 filling lines. A basic illustration of the flow of kegs is shown in Figure 14. There are 2.2 million kegs that are in circulation, the majority of which are stainless steel, and these are leased back to the individual breweries on a per-fill basis.
BRIDGE – Building Radio frequency IDentification solutions for the Global Environment
WP3: Reusable Asset Management, D3.4 25/53
The breweries serve approximately 10,000 outlets through a network of 50 distribution centres. As shown in Figure 14, the top diagram of the figure represents the main pooling operation. The filling lines for the two different breweries are as shown to the left of the figure. The empty kegs, indicated as dashed lines, will arrive at a brewery and only when they have been prepared can they then be filled. The full kegs are then transferred, shown as a solid blue line, to the required distribution centres. From the distribution centres the kegs are shipped to retail outlets that are tied to the respective breweries. The bottom diagram of the figure depicts the brewing and distribution operations for a range of other suppliers, often small independent breweries. Here, a separate keg management process is employed and this does not form a part of the study. It can be seen that the major breweries in the top diagram of the figure have supply paths linking to the wholesalers that normally handle stock from the independent brewers. This allows for the flexibility of the retail outlets that are not affiliated to the main breweriesto be supplied with alternative products. However, the tied retail outlets are not permitted to obtain supplies from these wholesalers, an example of this is shown in the figure as a solid red line.
Figure 14 An example of keg management for the brewing industry
BRIDGE – Building Radio frequency IDentification solutions for the Global Environment
WP3: Reusable Asset Management, D3.4 26/53
When the kegs arrive at the brewery they are first cleaned before use and the specific cleaning process is dictated by the keg’s previous use. Depending on the use of the keg, some seal maintenance will be required. Typically, seals are replaced every 1-2 years but ideally they only require replacement after a specific number of times when the keg has been filled since the previous seal change. When the keg has been filled, batch information relating to the full keg is required for subsequent invoicing to the customer. Once the filled keg enters the distribution network, the ability to track each keg to and from the individual retail outlets is necessary to ensure compliance with contractual agreements. The breweries can have special arrangements with pubs, and especially pubs owned by the brewery, such that they have to purchase stock directly from the brewery, rather than from wholesalers, as part of their tenancy agreement. Thus, the monitoring of both the outbound and inbound kegs is of benefit as this is a means of detecting unauthorised keg movements. Among the key requirements, there is a need to better understand the dynamics of the complex cycle times associated with the kegs such that there could be a reduction in keg fleet size and a more accurate reflection of seasonal fluctuations. A typical cycle time depends on the product, the brand, etc and can range from an average of as little as approximately 20 days. For some cask beer, this could be 2 or 3 months and for the exports market it might be as long as 7 or 8 months. During busy periods, reverse logistics can be a problem as the collection of empty kegs is often delayed due to much of the effort being focussed on delivering full filled kegs. In this study, there are currently no charges associated with the kegs and hence there is no financial incentive for the relevant parties to return the empty kegs as quickly as possible – some keg management operations however levy a deposit on their kegs. When kegs are returned they can be mixed with others that do not belong to the same pool; these have to be sorted and set a side for return. As more than half of the kegs are returned before the average cycle time, the distribution of the cycle times does not conform to a normal distribution but rather closer to a Weibull distribution. If the returned kegs are not fully emptied, the remaining contents of the kegs, the ullage, can be recorded and the customer credited for what has been returned and/or the duty can be reclaimed. This is calculated by taking the difference in weight between the partially emptied/full keg and the empty keg, the amount of duty is then a function of the weight and alcohol content.
3.5 Folding plastic security container management Folding plastic security containers have a standard pallet sized footprint and can be collapsed when emptied. They can either have smooth internal sides or have perforation for ventilation purposes. Their prime use is for bulk packaging and transportation of a wide range of items ranging from automotive parts to bulk mailing.
BRIDGE – Building Radio frequency IDentification solutions for the Global Environment
WP3: Reusable Asset Management, D3.4 27/53
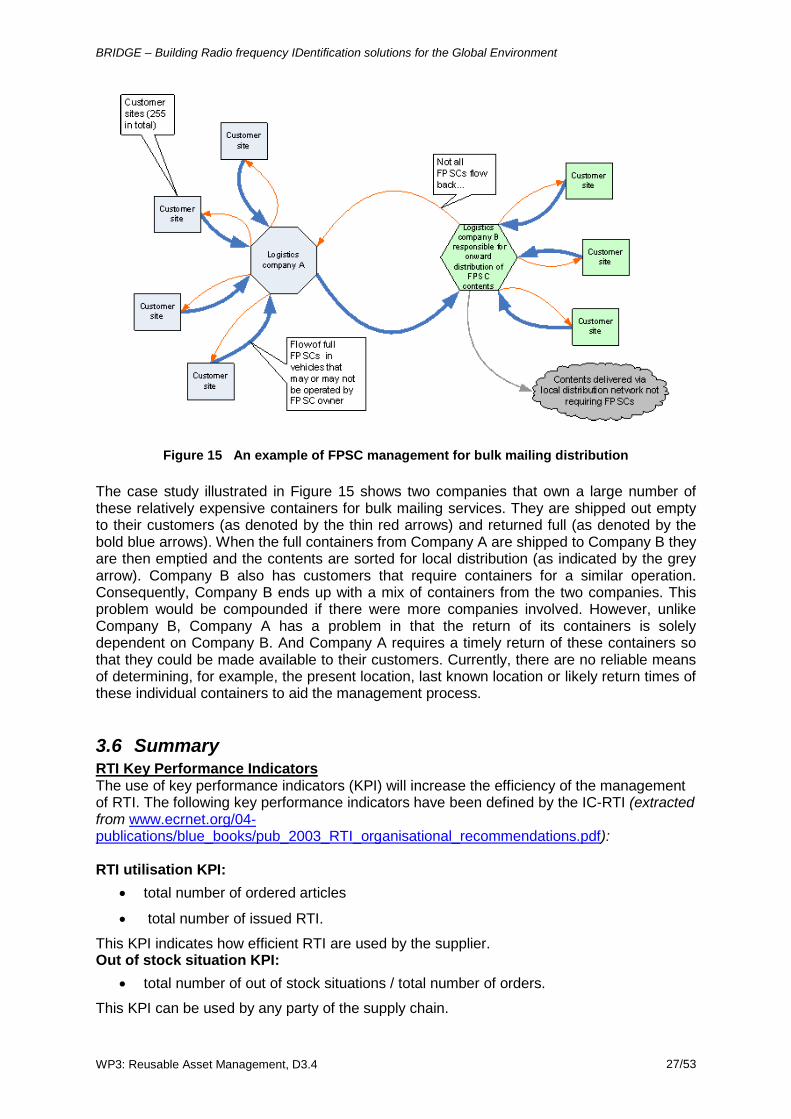
Figure 15 An example of FPSC management for bulk mailing distribution
The case study illustrated in Figure 15 shows two companies that own a large number of these relatively expensive containers for bulk mailing services. They are shipped out empty to their customers (as denoted by the thin red arrows) and returned full (as denoted by the bold blue arrows). When the full containers from Company A are shipped to Company B they are then emptied and the contents are sorted for local distribution (as indicated by the grey arrow). Company B also has customers that require containers for a similar operation. Consequently, Company B ends up with a mix of containers from the two companies. This problem would be compounded if there were more companies involved. However, unlike Company B, Company A has a problem in that the return of its containers is solely dependent on Company B. And Company A requires a timely return of these containers so that they could be made available to their customers. Currently, there are no reliable means of determining, for example, the present location, last known location or likely return times of these individual containers to aid the management process.
3.6 Summary
The use of key performance indicators (KPI) will increase the efficiency of the management of RTI. The following key performance indicators have been defined by the IC-RTI (extracted from
RTI Key Performance Indicators
www.ecrnet.org/04-publications/blue_books/pub_2003_RTI_organisational_recommendations.pdf): RTI utilisation KPI:
• total number of ordered articles
• total number of issued RTI.
This KPI indicates how efficient RTI are used by the supplier. Out of stock situation KPI:
• total number of out of stock situations / total number of orders.
This KPI can be used by any party of the supply chain.
BRIDGE – Building Radio frequency IDentification solutions for the Global Environment
WP3: Reusable Asset Management, D3.4 28/53
Product Quality KPI 1: • total number of damaged products within one way packaging
• total number of delivered products
Product Quality KPI 2: • total number of damaged products within RTI
• total number of delivered products
Product Quality KPI 3: • total number of damaged products within RTI
• total number of damaged products.
These KPI measure the performance of RTI compared to one way packaging. Efficiency KPI:
• total number of RTI rotations
• total number of issued RTI.
This KPI is strongly affected by the dwell time at the retailer. RTI Quality KPI:
• total number of damaged RTI
• total number of RTI.
This KPI is used mainly by the pool organiser to assess the quality of the RTI within the pool. Activity Based Costing KPI:
• cost per RTI / delivered SKU (stock keeping unit).
This KPI measures the cost efficiency for the use of RTI to bring the SKU to the point of sale.
BRIDGE – Building Radio frequency IDentification solutions for the Global Environment
WP3: Reusable Asset Management, D3.4 29/53
Metrics required for managing RTIs (Extracted from info based onWP3.4 interviews, WP8, WP9 etc). RTI Management Metrics
RTI quality KPI
• Rate of new RTI replenishment
• Rate of RTI lost or damaged – (wrt time or trip)
• Unaccountability rate of lost or damaged RTI – (Shrinkage)
• Average pallet lifetime
• Rate of goods damaged by RTI
RTI utilisation KPI • RTI Count in/out rate (daily / weekly / monthly / yearly)
• Rate or total number of RTI in circulation
• Size of RTI buffer stock at a specific location
• Frequency/size of shortage or surplus of RTI (according to demand)
• Usage frequency per RTI (number of times RTI transported from one site to another - measure of durability)
• Stock to hire ratio
• Physical to book comparison ratio
RTI efficiency KPI • Average RTI cycle time
• Average RTI dwell time at a particular location
• Average time to transport RTI
• Average time to service repair
• Average time to supply new RTIs
• Percentage of time RTI is empty versus loaded
RTI cost KPI • Average transportation cost per RTI (efficiency, i.e. a lorry with one RTI is costly)
• Average cost of cleaning or repair per RTI
• Hidden labour costs
• Cost per pallet.
BRIDGE – Building Radio frequency IDentification solutions for the Global Environment
WP3: Reusable Asset Management, D3.4 30/53
4 RTI Analytical Models Without any loss of generality, this section will conduct a critical analysis into a particular subset of returnable transport items (RTIs) in order to highlight some of concepts and findings which are readily applicable to the broader RTI categories. As detailed in the previous “RTI use cases” section, wooden pallets, which are relatively high volume and low value, are key elements for enabling smooth flow of goods throughout supply chains. Despite their importance, these RTIs are found to be prone to high loss and breakage rates. This problem is due to the fact that today’s RTI management processes are rather inefficient and are based on estimates about when, where and how RTIs are utilised. This limited visibility inevitably causes the involved parties to feel less responsible for the proper management of RTIs. As a consequence, inefficiencies created by a single party can result in a significant cost burden for the whole supply chain. This section therefore attempts to explore the impact of RFID (Radio Frequency IDentification) on these low-cost pallets, by using a combined case study and simulation approach, in order to achieve the required visibility and thus improve the RTI management process. We will also describe a solution based on RFID technology and quantify its impact from each individual stakeholder’s perspective.
4.1 Aims Reusable Transport Items (RTIs) such as pallets or reusable crates constitute the key ingredients for efficient logistic operations and the protection of goods during transport, storage and handling. One of the most widely used and important RTI types are wooden pallets. The global pool size of wooden pallets is estimated at 4 billion pallets with over 400 million new pallets produced every year [Ray, 2006]. Logistic operations heavily depend on the availability of pallets, as they ensure that goods can be easily moved, stacked, transported and integrated into sophisticated fully automated storage and conveyor systems. To ensure smooth operation, multiple companies often share a common pool of pallets, which is managed by an RTI pool operator. Despite the importance of RTIs for daily operations, pallets are prone to high loss rates (as a result of theft or misplacement) and are often subject to breakage. Two independent surveys conducted in [BRIDGE, 2007] and [Aberdeen, 2004] have found that the average loss rate for the pallets is around 9-10% annually. Besides losses, the RTI industry faces the problem that on average 9% of the assets are subject to breakage every year [BRIDGE, 2007] and might need to be repaired. The key problem in RTI management is that it is often not known, at any specific point in time, where the individual RTI are and in what condition they are in. This limited visibility creates the tendency for people and organisations to feel less responsible for the proper management of RTIs. As a consequence, unnecessary costs resulting from high loss rates, breakages and unavailability of RTIs are generated which have a negative impact on the overall performance of the whole supply chain. In order to improve the situation, RTI visibility and a proper management approach is needed to increase process efficiency and enhance RTI control. Technological solutions such as Radio Frequency IDentification (RFID) is reported to deliver efficient identification and tracking solutions [LogicaCMG, 2004] which could lead to improved visibility, more efficient processes and a higher turnover. In fact, RFID has already been successfully deployed for some closed-loop and high-value RTI applications such as container management in the automotive industry. However, the application of RFID for efficient inter-organisational management of a high volume and low value RTIs (such as pallets in the RTI industry) imposes different set of challenges and has yet to be explored. This aim of section is therefore to highlight the analytical models as well as impact of RFID technology on the RTI management industry through the example of a representative use case in the wooden pallet sector.
BRIDGE – Building Radio frequency IDentification solutions for the Global Environment
WP3: Reusable Asset Management, D3.4 31/53
4.2 Background To date, besides the qualitative studies carried out by solution providers, there exist only a few scholarly publications that aim to quantify the effect of RFID-based visibility on the RTI industry. [Angeles, 2005] investigated a retail RTI case study in which RFID technology was implemented to reduce shipment delays with rented RTI assets. The results showed that as much as 80% of detention and demurrage charges could be reduced through RTI visibility. As one of the first studies, [Johansson, 2007] unlike other previous works, have highlighted the relevance of RTI losses in conjunction with RTI visibility. They conducted a case study with high-value roll-containers and showed that a cost reduction of 34% was possible as a result of enhanced RTI visibility. One of their key conclusions is that further research is required for assessing the effect of asset visibility in a large-scale RTI pooling system. In order to extend the present body of knowledge, we aim to answer the following research question: What is the impact of RFID technology on inter-organisational RTI pool management processes? To answer this research question, we will use a combined case study and simulation approach. The advantage of this multi-method study is that each approach can be used in a complementary way to address the qualitative and quantitative aspects of supply chain management research [Hellström, 2006] To conduct an in-depth qualitative and quantitative analysis, this study will extend the wooden pallet use case as a representative example. As mentioned previously, this wooden pallet case is based on research work conducted with a major pool operator, a large FMCG (Fast Moving Consumer Goods) manufacturer and a key supermarket retailer, with a geographical focus within Europe. Data was collated using a semi-structured interview process drawing on a prepared set of open questions. Potential effects of RFID technology on the RTI management process and on the individual stakeholders were elicited from existing RTI literature and discussed in several meetings with the employees (mainly logistic managers, CIOs and CEOs) of participating companies.
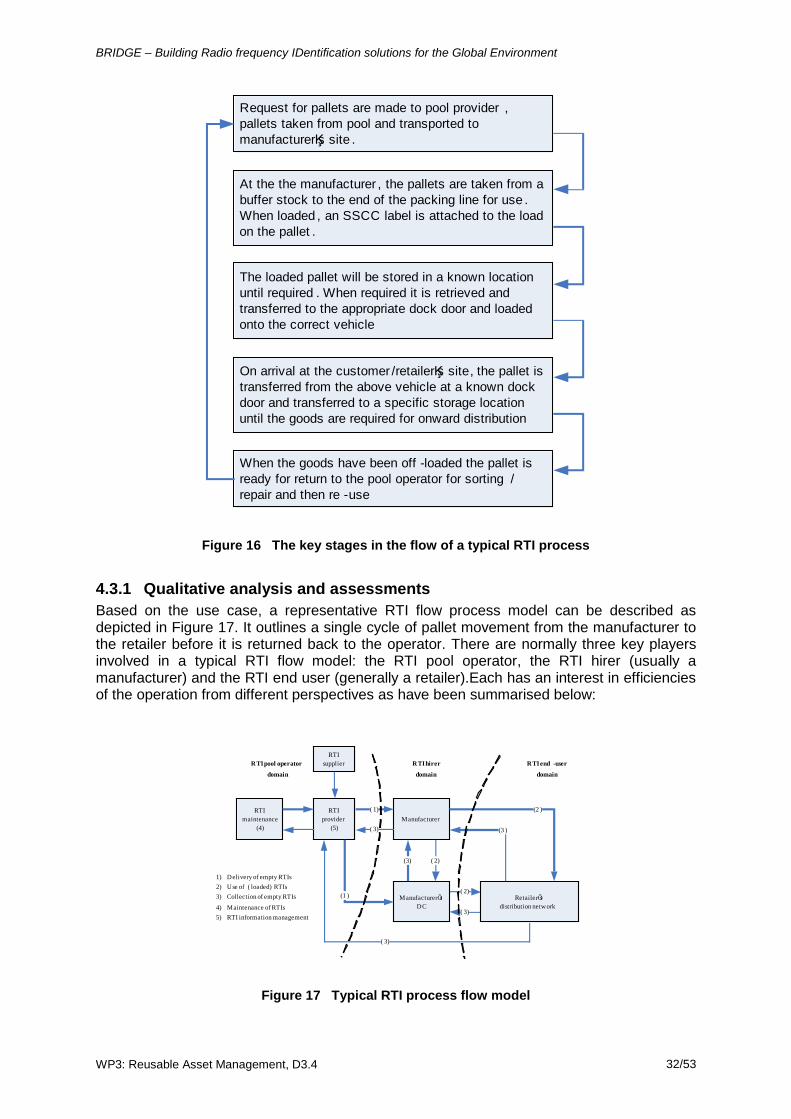
4.3 RTI management model This study focuses on a typical RTI scenario in the retail industry. An FMCG manufacturer rents pallets from a pool operator. The manufacturer places goods on the pallets and ships them to a retailer. After the goods are removed from the pallets, the empty pallets are collected by the pool operator and prepared for subsequent hire. Figure 16 describes these various key stages in the flow of a typical RTI process. Although all parties are responsible for the overall efficiency of the RTI management process, generally only the manufacturer is charged for the costs of the pallet rental by the pool operator. The retailer is, however, indirectly affected because the manufacturer can incorporate these costs into the selling price of the goods. In the following, we will describe, in greater detail, the parties involved in the RTI process together with their roles, properties and typical problems pertaining to the management of RTIs. Next, we will outline the RTI management model as it is today, its key issues and potential improvement areas as a result of RFID technology. Both its qualitative and quantitative assessments, with the aid of various analytical models, will also be outlined in the study.
BRIDGE – Building Radio frequency IDentification solutions for the Global Environment
WP3: Reusable Asset Management, D3.4 32/53
Request for pallets are made to pool provider , pallets taken from pool and transported to manufacturerĶs site .
At the the manufacturer , the pallets are taken from a buffer stock to the end of the packing line for use . When loaded , an SSCC label is attached to the load on the pallet .
The loaded pallet will be stored in a known location until required . When required it is retrieved and transferred to the appropriate dock door and loaded onto the correct vehicle
On arrival at the customer /retailerĶs site, the pallet is transferred from the above vehicle at a known dock door and transferred to a specific storage location until the goods are required for onward distribution
When the goods have been off -loaded the pallet is ready for return to the pool operator for sorting /repair and then re -use
Figure 16 The key stages in the flow of a typical RTI process
4.3.1 Qualitative analysis and assessments Based on the use case, a representative RTI flow process model can be described as depicted in Figure 17. It outlines a single cycle of pallet movement from the manufacturer to the retailer before it is returned back to the operator. There are normally three key players involved in a typical RTI flow model: the RTI pool operator, the RTI hirer (usually a manufacturer) and the RTI end user (generally a retailer).Each has an interest in efficiencies of the operation from different perspectives as have been summarised below:
( 3)
RTI maintenance
(4)
RTI provider
(5)Manufacturer
( 1)
(3) ( 2)
(2 )
(3 )
( 2)
( 3)
( 3)
(1 )
RTI pool operator
domain
RTI hirer
domain
RTI end -user
domain
ManufacturerÕs DC
RetailerÕsdistribution network
RTI supplier
1) Delivery of empty RTIs2) Use of ( loaded) RTIs3) Collection of empty RTIs
4) Maintenance of RTIs5) RTI information management
Figure 17 Typical RTI process flow model
BRIDGE – Building Radio frequency IDentification solutions for the Global Environment
WP3: Reusable Asset Management, D3.4 33/53
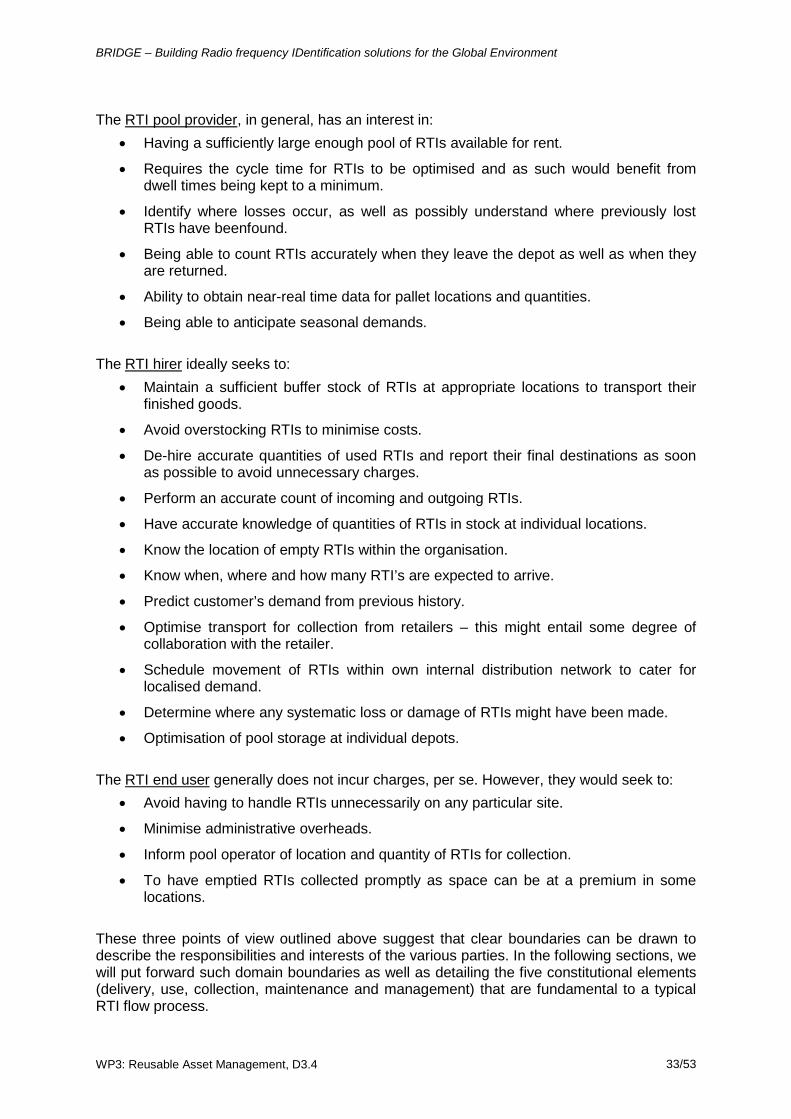
The RTI pool provider
• Having a sufficiently large enough pool of RTIs available for rent. , in general, has an interest in:
• Requires the cycle time for RTIs to be optimised and as such would benefit from dwell times being kept to a minimum.
• Identify where losses occur, as well as possibly understand where previously lost RTIs have beenfound.
• Being able to count RTIs accurately when they leave the depot as well as when they are returned.
• Ability to obtain near-real time data for pallet locations and quantities.
• Being able to anticipate seasonal demands.
The RTI hirer
• Maintain a sufficient buffer stock of RTIs at appropriate locations to transport their finished goods.
ideally seeks to:
• Avoid overstocking RTIs to minimise costs.
• De-hire accurate quantities of used RTIs and report their final destinations as soon as possible to avoid unnecessary charges.
• Perform an accurate count of incoming and outgoing RTIs.
• Have accurate knowledge of quantities of RTIs in stock at individual locations.
• Know the location of empty RTIs within the organisation.
• Know when, where and how many RTI’s are expected to arrive.
• Predict customer’s demand from previous history.
• Optimise transport for collection from retailers – this might entail some degree of collaboration with the retailer.
• Schedule movement of RTIs within own internal distribution network to cater for localised demand.
• Determine where any systematic loss or damage of RTIs might have been made.
• Optimisation of pool storage at individual depots.
The RTI end user
• Avoid having to handle RTIs unnecessarily on any particular site. generally does not incur charges, per se. However, they would seek to:
• Minimise administrative overheads.
• Inform pool operator of location and quantity of RTIs for collection.
• To have emptied RTIs collected promptly as space can be at a premium in some locations.
These three points of view outlined above suggest that clear boundaries can be drawn to describe the responsibilities and interests of the various parties. In the following sections, we will put forward such domain boundaries as well as detailing the five constitutional elements (delivery, use, collection, maintenance and management) that are fundamental to a typical RTI flow process.
BRIDGE – Building Radio frequency IDentification solutions for the Global Environment
WP3: Reusable Asset Management, D3.4 34/53
4.3.1.1 Delivery of empty RTIs The RTI pool operator must always ensure that it has adequate empty RTIs to be delivered to the FMCG manufacturer in order for them to store and send goods along the supply chain. The key issue here is therefore to determine when and how many pallets are needed to be delivered to the appropriate FMCG manufacturer’s location(s). In the wooden pallet case study, the RTI pool operator has based its delivery planning on orders and forecasts of the FMCG manufacturer. Historical data analysis has also been used to cope with seasonality patterns or promotional periods. But as the RTI pool operator has no timely information about the pallets that are shipped out from the manufacturing site, the actual inventory of the FMCG manufacturer’s RTI stock is thus often unknown. As a result, and in combination with demand amplification or other unexpected events, the RTI pool operator is required to increase the buffer stock, which consequently leads to an increase in its locked-up capital. With RFID technology, the current practice can be improved in the following way. By having automatic RFID reads of outgoing and incoming pallets (e.g. via RFID readers deployed at the dock doors), timely information of the manufacturer’s actual RTI stock can be made available. Thus, instead of relying on (sometimes too late) orders from the FMCG manufacturer, the RTI pool operator can optimise and automate the manufacturer’s replenishment process based on the actual RTI stock data. Moreover, as the data is much more reliable and closer to actual consumer demand, problems such as the bullwhip effect can be eliminated; and through the increased visibility of RTIs in the supply chain, the flow of RTIs also becomes more predictable. In addition, with the availability of the dynamic RTI stock and movement data, the load utilisations of the delivery vehicles can be improved and any unnecessary ‘emergency purchases’ of RTIs can be avoided.
4.3.1.2 Use of (loaded) RTIs At the FMCG manufacturer’s site, the empty RTIs are loaded with goods and shipped onwards to the downstream supply chain. During this period, the RTI pool operator has limited control over its RTIs, and generally has no or fairly limited knowledge about the whereabouts and condition of the RTIs. As a result of this lack of RTI visibility, there are typically two main problems faced by the RTI pool operator:
• Damage of RTIs
•
: One of the key reasons why all the pallets are returned to a depot is so that they can be sorted, checked and repaired as necessary. This is because, at times, there can be up to 20-30% of pallets that are damaged per cycle and most of these require repair. Without any unique serial identification associated with the pallets, it is also impractical to trace the source of the damaged pallets to the originator since most of the empty pallets are accumulated from a number of different drop-points.
Loss of RTIs
With RFID technology, the current practice can be improved in the following way. For clarity,
: It is estimated that the loss of RTIs for certain drop-points can be as high as 50%. Without any track & trace capability, it is also difficult to identify any systematic losses within the supply chain. The issue of pallet losses can be the result of a number of factors. Some of these are: (1) the pallet count at the end customer/drop-point can be inaccurate, (2) there is no contractual agreement with regards to the drop-points and so reliance on collaboration is often required, (3) there can be unrecorded pallet movements between drop-points or (4) the pallets might have been reused for other purposes.
Figure 18 depicts the three domain boundaries describing the responsibilities and interests of the various key stakeholders involved in the RTI management process. It should be noted that each domain can contain a single node or multiple nodes pertaining to the stakeholder. For instance, the manufacturer can have either a single factory site or a network of interconnected sites where the pallets are transferred and moved about. But what is
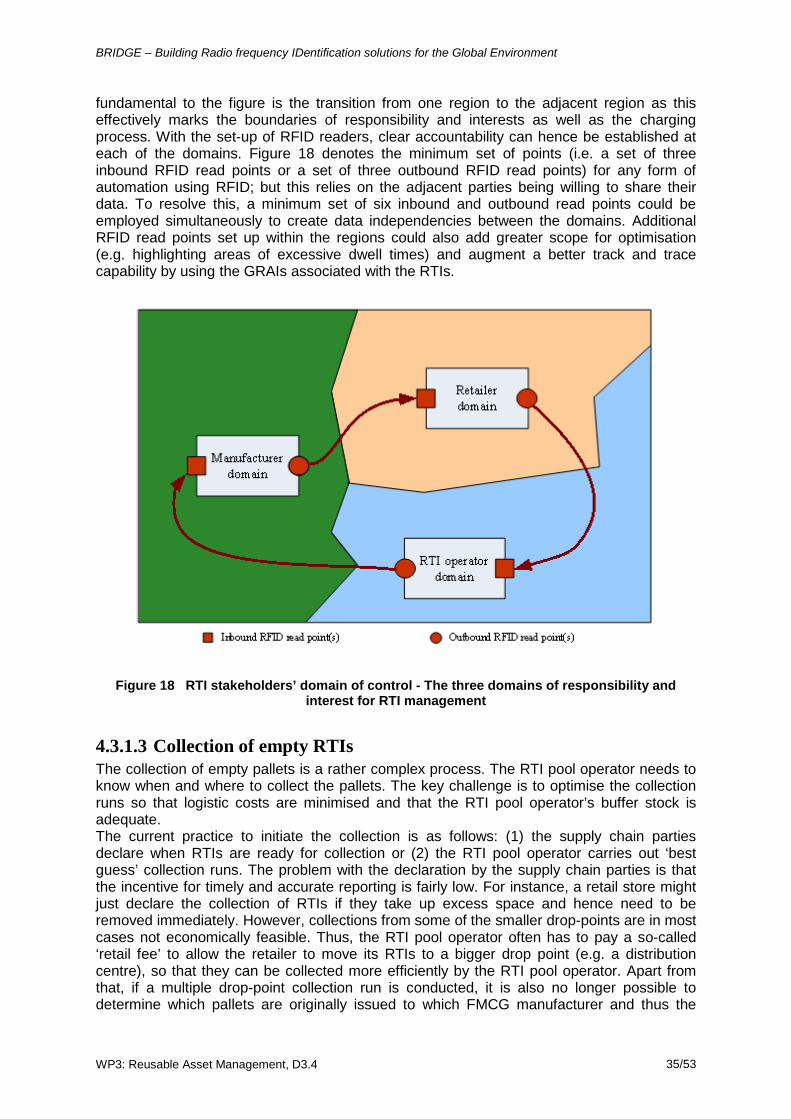
BRIDGE – Building Radio frequency IDentification solutions for the Global Environment
WP3: Reusable Asset Management, D3.4 35/53
fundamental to the figure is the transition from one region to the adjacent region as this effectively marks the boundaries of responsibility and interests as well as the charging process. With the set-up of RFID readers, clear accountability can hence be established at each of the domains. Figure 18 denotes the minimum set of points (i.e. a set of three inbound RFID read points or a set of three outbound RFID read points) for any form of automation using RFID; but this relies on the adjacent parties being willing to share their data. To resolve this, a minimum set of six inbound and outbound read points could be employed simultaneously to create data independencies between the domains. Additional RFID read points set up within the regions could also add greater scope for optimisation (e.g. highlighting areas of excessive dwell times) and augment a better track and trace capability by using the GRAIs associated with the RTIs.
Figure 18 RTI stakeholders’ domain of control - The three domains of responsibility and interest for RTI management
4.3.1.3 Collection of empty RTIs The collection of empty pallets is a rather complex process. The RTI pool operator needs to know when and where to collect the pallets. The key challenge is to optimise the collection runs so that logistic costs are minimised and that the RTI pool operator’s buffer stock is adequate. The current practice to initiate the collection is as follows: (1) the supply chain parties declare when RTIs are ready for collection or (2) the RTI pool operator carries out ‘best guess’ collection runs. The problem with the declaration by the supply chain parties is that the incentive for timely and accurate reporting is fairly low. For instance, a retail store might just declare the collection of RTIs if they take up excess space and hence need to be removed immediately. However, collections from some of the smaller drop-points are in most cases not economically feasible. Thus, the RTI pool operator often has to pay a so-called ‘retail fee’ to allow the retailer to move its RTIs to a bigger drop point (e.g. a distribution centre), so that they can be collected more efficiently by the RTI pool operator. Apart from that, if a multiple drop-point collection run is conducted, it is also no longer possible to determine which pallets are originally issued to which FMCG manufacturer and thus the
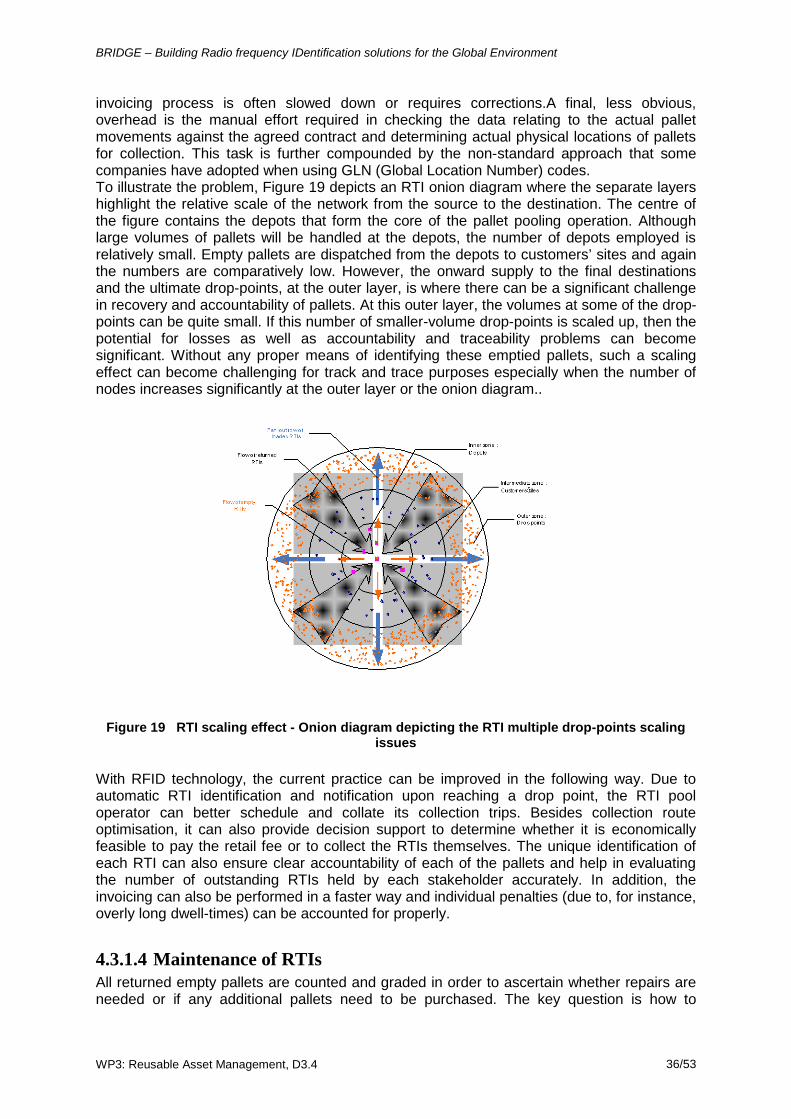
BRIDGE – Building Radio frequency IDentification solutions for the Global Environment
WP3: Reusable Asset Management, D3.4 36/53
invoicing process is often slowed down or requires corrections.A final, less obvious, overhead is the manual effort required in checking the data relating to the actual pallet movements against the agreed contract and determining actual physical locations of pallets for collection. This task is further compounded by the non-standard approach that some companies have adopted when using GLN (Global Location Number) codes. To illustrate the problem, Figure 19 depicts an RTI onion diagram where the separate layers highlight the relative scale of the network from the source to the destination. The centre of the figure contains the depots that form the core of the pallet pooling operation. Although large volumes of pallets will be handled at the depots, the number of depots employed is relatively small. Empty pallets are dispatched from the depots to customers’ sites and again the numbers are comparatively low. However, the onward supply to the final destinations and the ultimate drop-points, at the outer layer, is where there can be a significant challenge in recovery and accountability of pallets. At this outer layer, the volumes at some of the drop-points can be quite small. If this number of smaller-volume drop-points is scaled up, then the potential for losses as well as accountability and traceability problems can become significant. Without any proper means of identifying these emptied pallets, such a scaling effect can become challenging for track and trace purposes especially when the number of nodes increases significantly at the outer layer or the onion diagram..
Figure 19 RTI scaling effect - Onion diagram depicting the RTI multiple drop-points scaling issues
With RFID technology, the current practice can be improved in the following way. Due to automatic RTI identification and notification upon reaching a drop point, the RTI pool operator can better schedule and collate its collection trips. Besides collection route optimisation, it can also provide decision support to determine whether it is economically feasible to pay the retail fee or to collect the RTIs themselves. The unique identification of each RTI can also ensure clear accountability of each of the pallets and help in evaluating the number of outstanding RTIs held by each stakeholder accurately. In addition, the invoicing can also be performed in a faster way and individual penalties (due to, for instance, overly long dwell-times) can be accounted for properly.
4.3.1.4 Maintenance of RTIs All returned empty pallets are counted and graded in order to ascertain whether repairs are needed or if any additional pallets need to be purchased. The key question is how to
BRIDGE – Building Radio frequency IDentification solutions for the Global Environment
WP3: Reusable Asset Management, D3.4 37/53
efficiently count, grade and sort the pallets upon receipt and determine corresponding repair actions accordingly. The current practice is highly manual, time-consuming and error prone. The condition of the pallets, which normally arrive in bulk, is dependent on the way they have been used and the customers that have been using them. None of this information can currently be ascertained with any certainty as there is no easy means of determining (1) the product that has been associated with the pallets and (2) where the pallets might have been used or stored. For example, if a pallet has been used to transport packets of dry foodstuff or cardboard packaging material, then the pallet is likely to have been stored in a clean and dry condition. However, if a pallet has been used to transport items that are inherently heavy or stored outdoors, then there is a high probability that the pallet might have sustained damage or be wet and dirty. In fact, it is common for a large percentage of wooden pallets to require maintenance, as a result of either protruding nail heads or broken component parts which need to be replaced. With RFID technology, the current practice can be improved in the following way. Pallets can be counted in an efficient manner due to automatic read count and identification. The grading and sorting operation can also be upgraded to a semi-automatic process. Assets, based on their previous usage and age, can be identified quickly and the manual grading process can be augmented with detailed product lifecycle information. In summary, RFID can help to automate and speed up maintenance decisions and its corresponding actions. Such efficiency can result in a quicker update of the usable RTI stock count and thus help to minimise the RTI pool operator’s buffer stocks or emergency purchases.
4.3.1.5 RTI information management The RTI information management is primarily concerned with the tracking and tracing of where the pallets currently are and the detection and identification of the status they are in. This process is heavily information-driven and is key to proper stock management and control and in determining if any additional purchases of RTIs are required. The main role here is to try to optimise (i.e. reduce) the cycle times of RTIs so as to maximise the utilisation of the RTI stock capacity. Existing management processes simply rely on the exchange of information detailing the quantity, location and time data. This information is transmitted using a variety of means (e.g. phone, email, etc) but is not in real-time and is often received after several days or even weeks following a movement of pallets. With the current system, errors are difficult to correct and pallet counts are often imprecise. The result is that a degree of approximation has to be built in to initial contracts and this requires monitoring over a period of time to ensure that the charges are equitable. All pallet movements are declared using a variety of messaging formats and email which simply indicate the volume moved and their destination drop-point. These declarations are made weekly or monthly and can often have a delay of about a month. This delay is primarily due to the fact that more immediate declarations might contain errors and, with the current management systems, correcting erroneous declarations is prohibitively expensive. Typically, the data stored on their IT systems is about 13+ days old and this hence also hinders the arrangements for any timely collection of pallets. Consequently, collections are normally arranged manually and at times ad hoc third-party logistics are employed to facilitate the transportation. With RFID technology, the current practice can be improved in the following way. Automatic data identification and data acquisition can eliminate any errors as a result of manual data entry. All pallet movement data can be captured with a finer granularity and any prediction/analysis can be performed using a more reliable and accurate dataset. Standardised (e.g. EPCIS – EPC Information Service) event data can also help to avoid ambiguous data representations and the need to constantly adapt to different data formats. As RFID event data is dedicated specifically for tracking item movement data, unnecessary dependencies due to, for instance, extraction of data from invoices or other transactional related documents such as Advanced Shipping Notices (ASN) are removed. Hence, costly
BRIDGE – Building Radio frequency IDentification solutions for the Global Environment
WP3: Reusable Asset Management, D3.4 38/53
data acquisition processes across multiple mediums can be avoided and data can be made available in a timely manner for optimising stock and replenishment decisions. Note that currently, majority of the RTI management in the industry do not have a serial ID. It is only when the RTIs are loaded with goods that an ID, which is essential to track the goods throughout the supply chain, is applied. A comparison of these RFID and non-RFID based processes is as described in Table 1. As an overview, a brief summary of the information and availability of information with and without RFID is also provided as shown in Table 2.
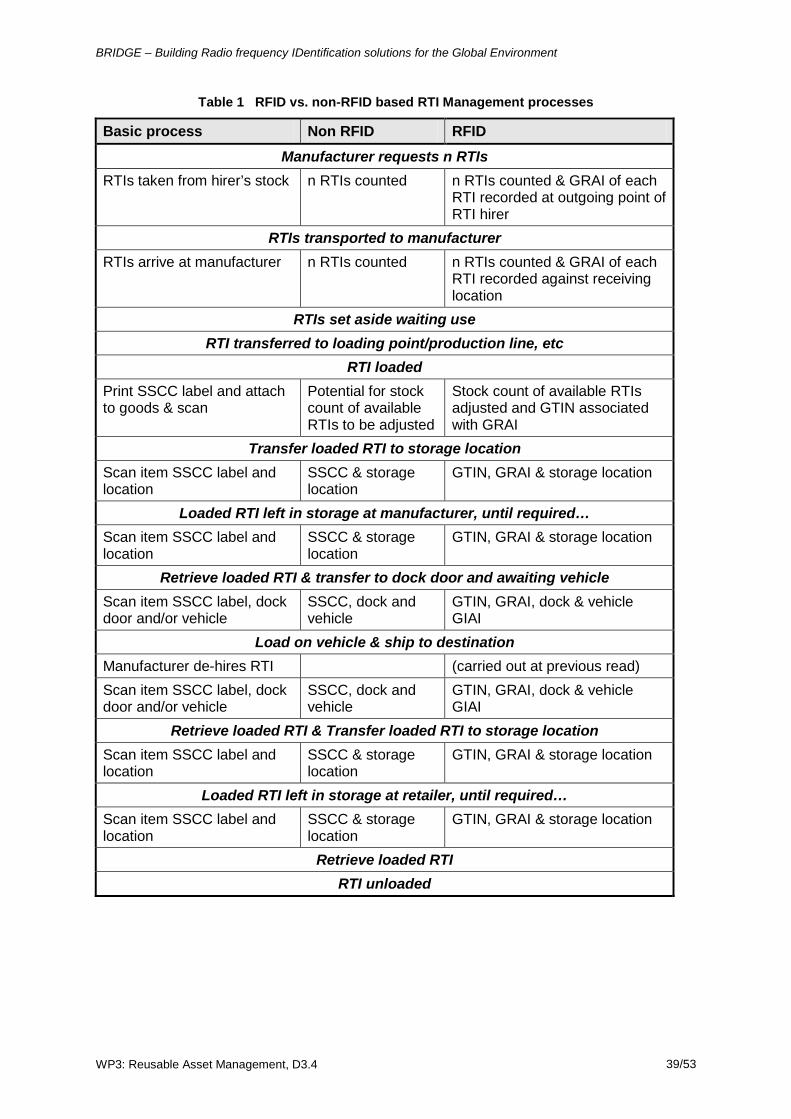
BRIDGE – Building Radio frequency IDentification solutions for the Global Environment
WP3: Reusable Asset Management, D3.4 39/53
Table 1 RFID vs. non-RFID based RTI Management processes
Basic process Non RFID RFID Manufacturer requests n RTIs
RTIs taken from hirer’s stock n RTIs counted n RTIs counted & GRAI of each RTI recorded at outgoing point of RTI hirer
RTIs transported to manufacturer RTIs arrive at manufacturer n RTIs counted n RTIs counted & GRAI of each
RTI recorded against receiving location
RTIs set aside waiting use RTI transferred to loading point/production line, etc
RTI loaded Print SSCC label and attach to goods & scan
Potential for stock count of available RTIs to be adjusted
Stock count of available RTIs adjusted and GTIN associated with GRAI
Transfer loaded RTI to storage location Scan item SSCC label and location
SSCC & storage location
GTIN, GRAI & storage location
Loaded RTI left in storage at manufacturer, until required… Scan item SSCC label and location
SSCC & storage location
GTIN, GRAI & storage location
Retrieve loaded RTI & transfer to dock door and awaiting vehicle Scan item SSCC label, dock door and/or vehicle
SSCC, dock and vehicle
GTIN, GRAI, dock & vehicle GIAI
Load on vehicle & ship to destination Manufacturer de-hires RTI (carried out at previous read) Scan item SSCC label, dock door and/or vehicle
SSCC, dock and vehicle
GTIN, GRAI, dock & vehicle GIAI
Retrieve loaded RTI & Transfer loaded RTI to storage location Scan item SSCC label and location
SSCC & storage location
GTIN, GRAI & storage location
Loaded RTI left in storage at retailer, until required… Scan item SSCC label and location
SSCC & storage location
GTIN, GRAI & storage location
Retrieve loaded RTI RTI unloaded
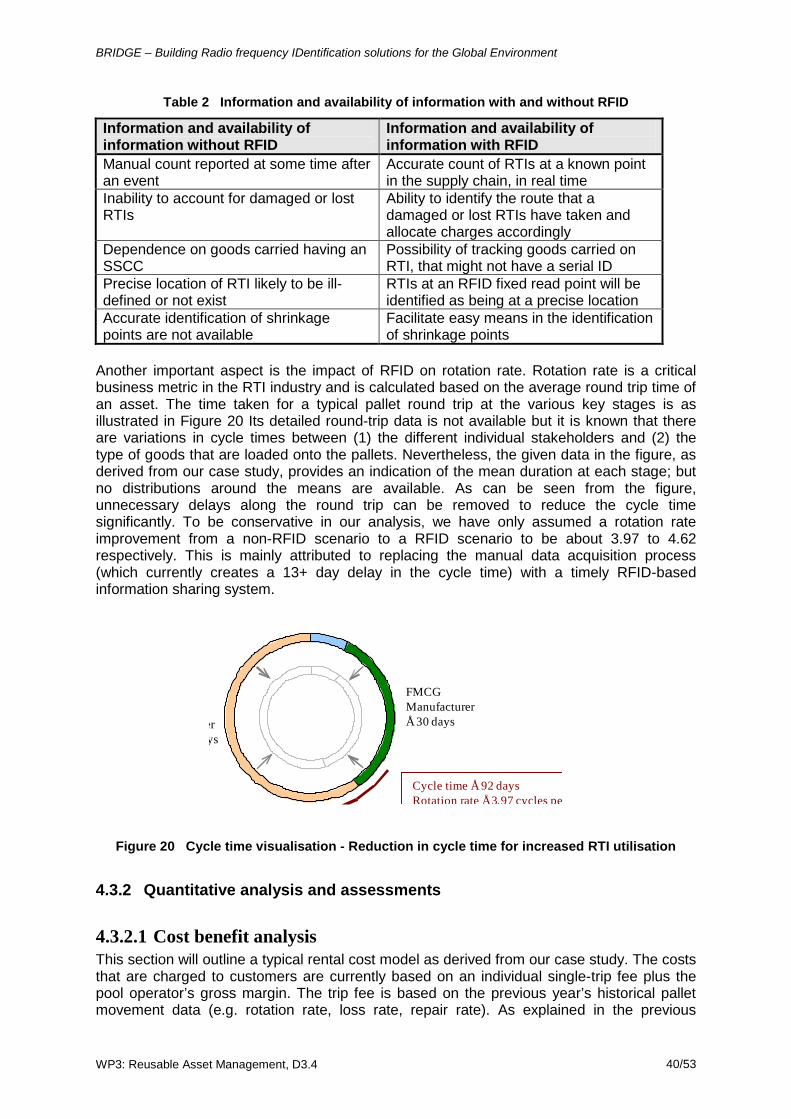
BRIDGE – Building Radio frequency IDentification solutions for the Global Environment
WP3: Reusable Asset Management, D3.4 40/53
Table 2 Information and availability of information with and without RFID
Information and availability of information without RFID
Information and availability of information with RFID
Manual count reported at some time after an event
Accurate count of RTIs at a known point in the supply chain, in real time
Inability to account for damaged or lost RTIs
Ability to identify the route that a damaged or lost RTIs have taken and allocate charges accordingly
Dependence on goods carried having an SSCC
Possibility of tracking goods carried on RTI, that might not have a serial ID
Precise location of RTI likely to be ill-defined or not exist
RTIs at an RFID fixed read point will be identified as being at a precise location
Accurate identification of shrinkage points are not available
Facilitate easy means in the identification of shrinkage points
Another important aspect is the impact of RFID on rotation rate. Rotation rate is a critical business metric in the RTI industry and is calculated based on the average round trip time of an asset. The time taken for a typical pallet round trip at the various key stages is as illustrated in Figure 20 Its detailed round-trip data is not available but it is known that there are variations in cycle times between (1) the different individual stakeholders and (2) the type of goods that are loaded onto the pallets. Nevertheless, the given data in the figure, as derived from our case study, provides an indication of the mean duration at each stage; but no distributions around the means are available. As can be seen from the figure, unnecessary delays along the round trip can be removed to reduce the cycle time significantly. To be conservative in our analysis, we have only assumed a rotation rate improvement from a non-RFID scenario to a RFID scenario to be about 3.97 to 4.62 respectively. This is mainly attributed to replacing the manual data acquisition process (which currently creates a 13+ day delay in the cycle time) with a timely RFID-based information sharing system.
FMCGManufacturerÅ 30 dayser
ys
Cycle time Å 92 days Rotation rate Å 3.97 cycles pe
Figure 20 Cycle time visualisation - Reduction in cycle time for increased RTI utilisation
4.3.2 Quantitative analysis and assessments
4.3.2.1 Cost benefit analysis This section will outline a typical rental cost model as derived from our case study. The costs that are charged to customers are currently based on an individual single-trip fee plus the pool operator’s gross margin. The trip fee is based on the previous year’s historical pallet movement data (e.g. rotation rate, loss rate, repair rate). As explained in the previous
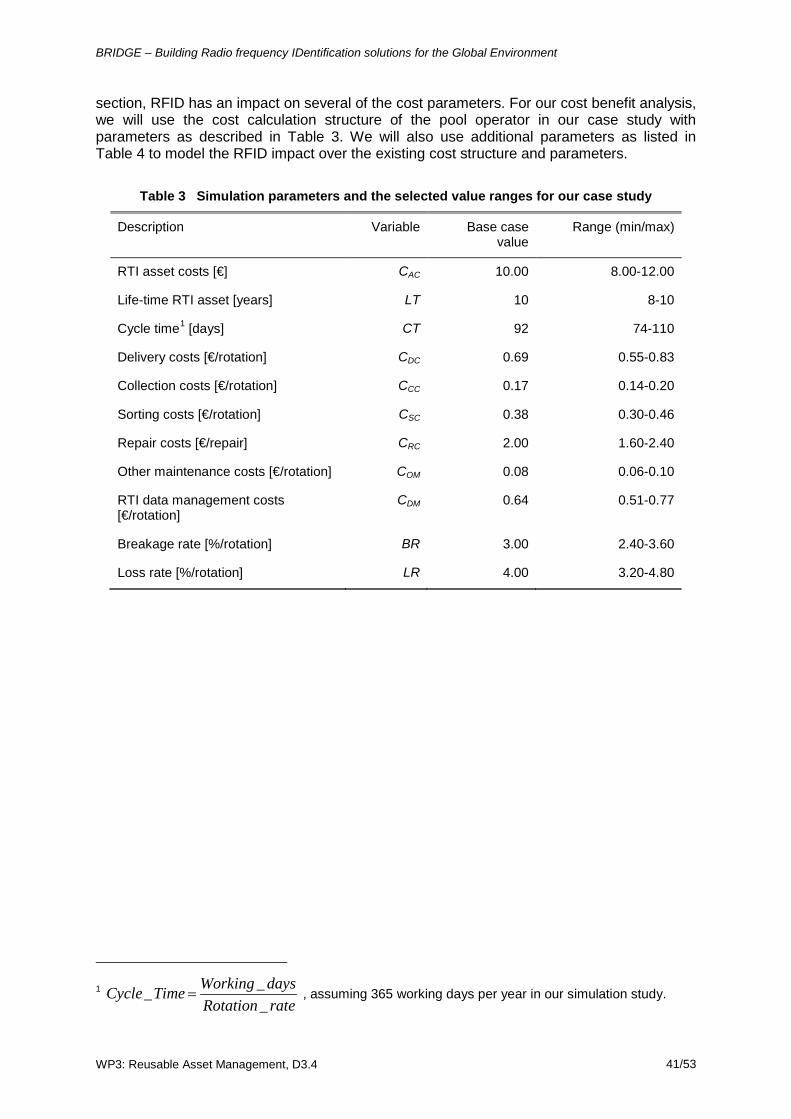
BRIDGE – Building Radio frequency IDentification solutions for the Global Environment
WP3: Reusable Asset Management, D3.4 41/53
section, RFID has an impact on several of the cost parameters. For our cost benefit analysis, we will use the cost calculation structure of the pool operator in our case study with parameters as described in Table 3. We will also use additional parameters as listed in Table 4 to model the RFID impact over the existing cost structure and parameters.
Table 3 Simulation parameters and the selected value ranges for our case study
Description Variable Base case value
Range (min/max)
RTI asset costs [€] CAC 10.00 8.00-12.00
Life-time RTI asset [years] LT 10 8-10
Cycle time1 CT [days] 92 74-110
Delivery costs [€/rotation] CDC 0.69 0.55-0.83
Collection costs [€/rotation] CCC 0.17 0.14-0.20
Sorting costs [€/rotation] CSC 0.38 0.30-0.46
Repair costs [€/repair] CRC 2.00 1.60-2.40
Other maintenance costs [€/rotation] COM 0.08 0.06-0.10
RTI data management costs [€/rotation]
CDM 0.64 0.51-0.77
Breakage rate [%/rotation] BR 3.00 2.40-3.60
Loss rate [%/rotation] LR 4.00 3.20-4.80
1
Cycle_Time =Working _ daysRotation_ rate
, assuming 365 working days per year in our simulation study.
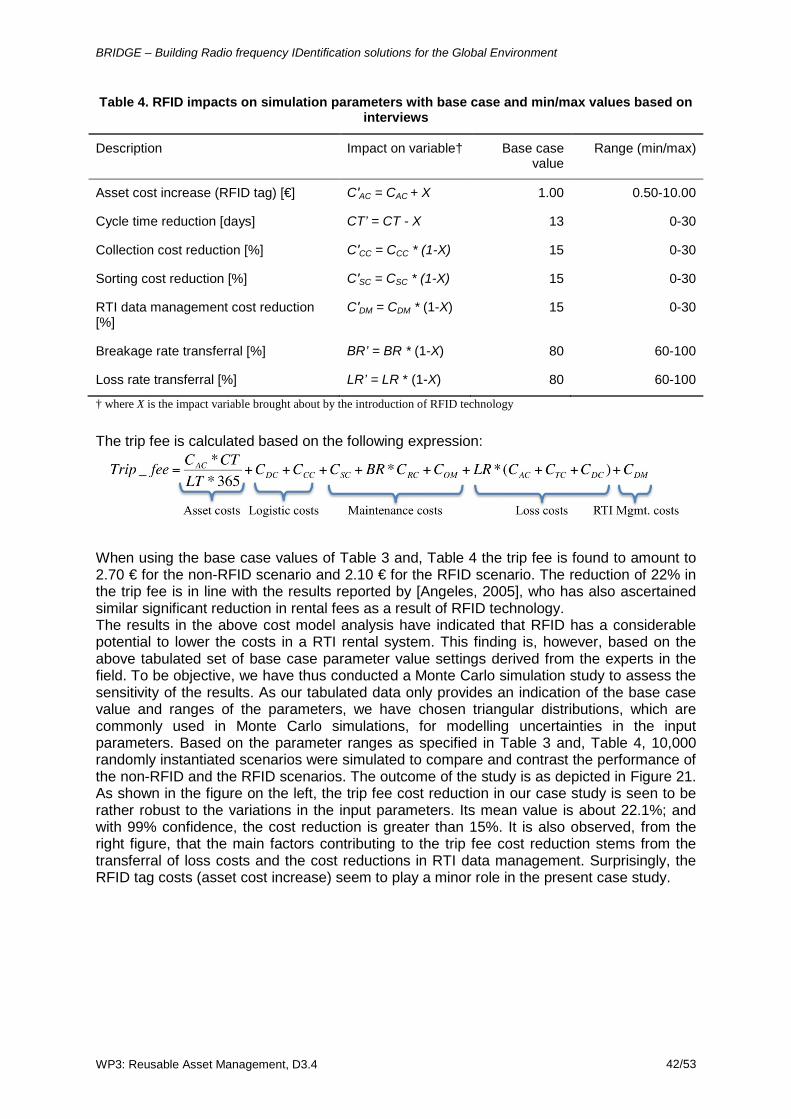
BRIDGE – Building Radio frequency IDentification solutions for the Global Environment
WP3: Reusable Asset Management, D3.4 42/53
Table 4. RFID impacts on simulation parameters with base case and min/max values based on interviews
Description Impact on variable† Base case value
Range (min/max)
Asset cost increase (RFID tag) [€] C′AC = CAC + X 1.00 0.50-10.00
Cycle time reduction [days] CT’ = CT - X 13 0-30
Collection cost reduction [%] C′CC = CCC * (1-X) 15 0-30
Sorting cost reduction [%] C′SC = CSC * (1-X) 15 0-30
RTI data management cost reduction [%]
C′DM = CDM * (1-X) 15 0-30
Breakage rate transferral [%] BR’ = BR * (1-X) 80 60-100
Loss rate transferral [%] LR’ = LR * (1-X) 80 60-100
† where X is the impact variable brought about by the introduction of RFID technology
The trip fee is calculated based on the following expression:
When using the base case values of Table 3 and, Table 4 the trip fee is found to amount to 2.70 € for the non-RFID scenario and 2.10 € for the RFID scenario. The reduction of 22% in the trip fee is in line with the results reported by [Angeles, 2005], who has also ascertained similar significant reduction in rental fees as a result of RFID technology. The results in the above cost model analysis have indicated that RFID has a considerable potential to lower the costs in a RTI rental system. This finding is, however, based on the above tabulated set of base case parameter value settings derived from the experts in the field. To be objective, we have thus conducted a Monte Carlo simulation study to assess the sensitivity of the results. As our tabulated data only provides an indication of the base case value and ranges of the parameters, we have chosen triangular distributions, which are commonly used in Monte Carlo simulations, for modelling uncertainties in the input parameters. Based on the parameter ranges as specified in Table 3 and, Table 4, 10,000 randomly instantiated scenarios were simulated to compare and contrast the performance of the non-RFID and the RFID scenarios. The outcome of the study is as depicted in Figure 21. As shown in the figure on the left, the trip fee cost reduction in our case study is seen to be rather robust to the variations in the input parameters. Its mean value is about 22.1%; and with 99% confidence, the cost reduction is greater than 15%. It is also observed, from the right figure, that the main factors contributing to the trip fee cost reduction stems from the transferral of loss costs and the cost reductions in RTI data management. Surprisingly, the RFID tag costs (asset cost increase) seem to play a minor role in the present case study.
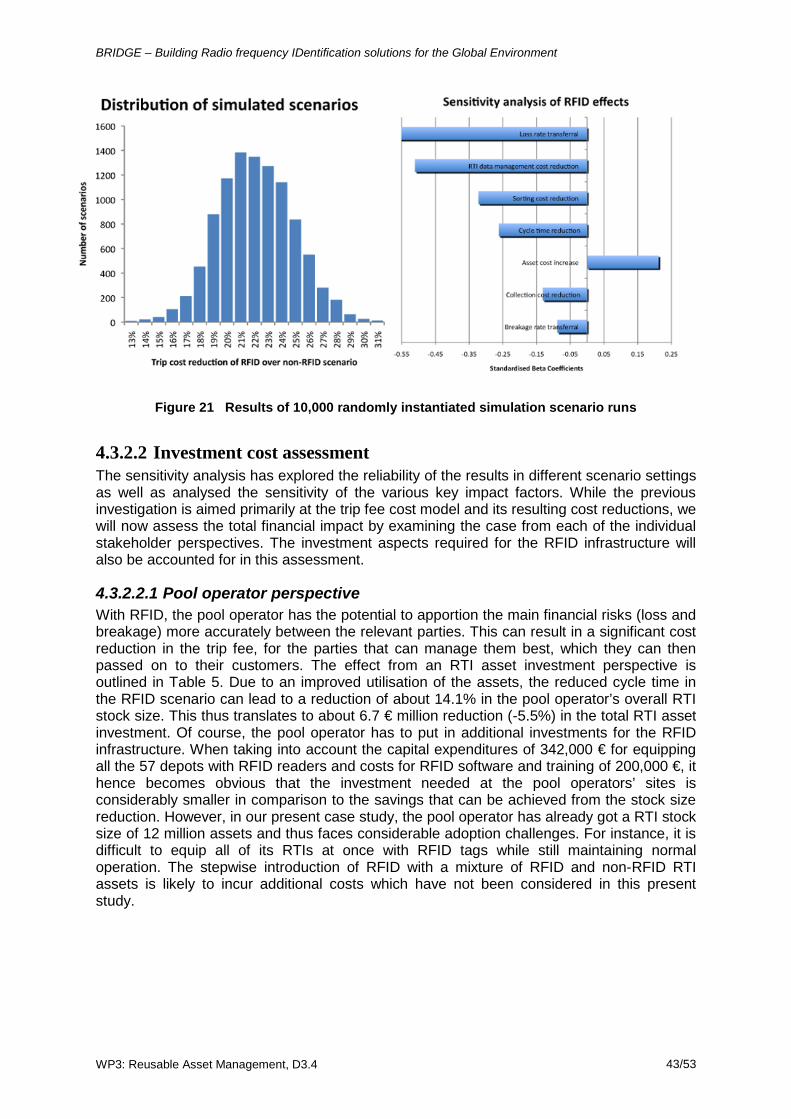
BRIDGE – Building Radio frequency IDentification solutions for the Global Environment
WP3: Reusable Asset Management, D3.4 43/53
Figure 21 Results of 10,000 randomly instantiated simulation scenario runs
4.3.2.2 Investment cost assessment The sensitivity analysis has explored the reliability of the results in different scenario settings as well as analysed the sensitivity of the various key impact factors. While the previous investigation is aimed primarily at the trip fee cost model and its resulting cost reductions, we will now assess the total financial impact by examining the case from each of the individual stakeholder perspectives. The investment aspects required for the RFID infrastructure will also be accounted for in this assessment.
4.3.2.2.1 Pool operator perspective With RFID, the pool operator has the potential to apportion the main financial risks (loss and breakage) more accurately between the relevant parties. This can result in a significant cost reduction in the trip fee, for the parties that can manage them best, which they can then passed on to their customers. The effect from an RTI asset investment perspective is outlined in Table 5. Due to an improved utilisation of the assets, the reduced cycle time in the RFID scenario can lead to a reduction of about 14.1% in the pool operator’s overall RTI stock size. This thus translates to about 6.7 € million reduction (-5.5%) in the total RTI asset investment. Of course, the pool operator has to put in additional investments for the RFID infrastructure. When taking into account the capital expenditures of 342,000 € for equipping all the 57 depots with RFID readers and costs for RFID software and training of 200,000 €, it hence becomes obvious that the investment needed at the pool operators’ sites is considerably smaller in comparison to the savings that can be achieved from the stock size reduction. However, in our present case study, the pool operator has already got a RTI stock size of 12 million assets and thus faces considerable adoption challenges. For instance, it is difficult to equip all of its RTIs at once with RFID tags while still maintaining normal operation. The stepwise introduction of RFID with a mixture of RFID and non-RFID RTI assets is likely to incur additional costs which have not been considered in this present study.
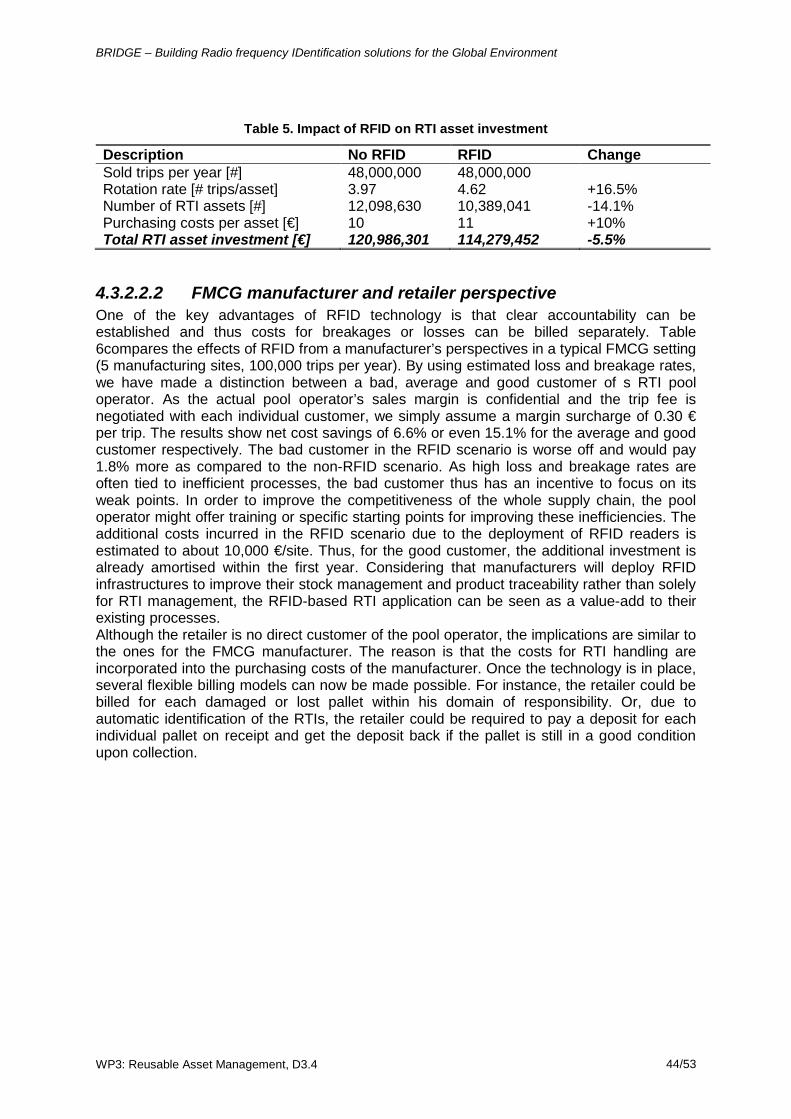
BRIDGE – Building Radio frequency IDentification solutions for the Global Environment
WP3: Reusable Asset Management, D3.4 44/53
Table 5. Impact of RFID on RTI asset investment
Description No RFID RFID Change Sold trips per year [#] 48,000,000 48,000,000 Rotation rate [# trips/asset] 3.97 4.62 +16.5% Number of RTI assets [#] 12,098,630 10,389,041 -14.1% Purchasing costs per asset [€] 10 11 +10% Total RTI asset investment [€] 120,986,301 114,279,452 -5.5%
4.3.2.2.2 FMCG manufacturer and retailer perspective One of the key advantages of RFID technology is that clear accountability can be established and thus costs for breakages or losses can be billed separately. Table 6compares the effects of RFID from a manufacturer’s perspectives in a typical FMCG setting (5 manufacturing sites, 100,000 trips per year). By using estimated loss and breakage rates, we have made a distinction between a bad, average and good customer of s RTI pool operator. As the actual pool operator’s sales margin is confidential and the trip fee is negotiated with each individual customer, we simply assume a margin surcharge of 0.30 € per trip. The results show net cost savings of 6.6% or even 15.1% for the average and good customer respectively. The bad customer in the RFID scenario is worse off and would pay 1.8% more as compared to the non-RFID scenario. As high loss and breakage rates are often tied to inefficient processes, the bad customer thus has an incentive to focus on its weak points. In order to improve the competitiveness of the whole supply chain, the pool operator might offer training or specific starting points for improving these inefficiencies. The additional costs incurred in the RFID scenario due to the deployment of RFID readers is estimated to about 10,000 €/site. Thus, for the good customer, the additional investment is already amortised within the first year. Considering that manufacturers will deploy RFID infrastructures to improve their stock management and product traceability rather than solely for RTI management, the RFID-based RTI application can be seen as a value-add to their existing processes. Although the retailer is no direct customer of the pool operator, the implications are similar to the ones for the FMCG manufacturer. The reason is that the costs for RTI handling are incorporated into the purchasing costs of the manufacturer. Once the technology is in place, several flexible billing models can now be made possible. For instance, the retailer could be billed for each damaged or lost pallet within his domain of responsibility. Or, due to automatic identification of the RTIs, the retailer could be required to pay a deposit for each individual pallet on receipt and get the deposit back if the pallet is still in a good condition upon collection.
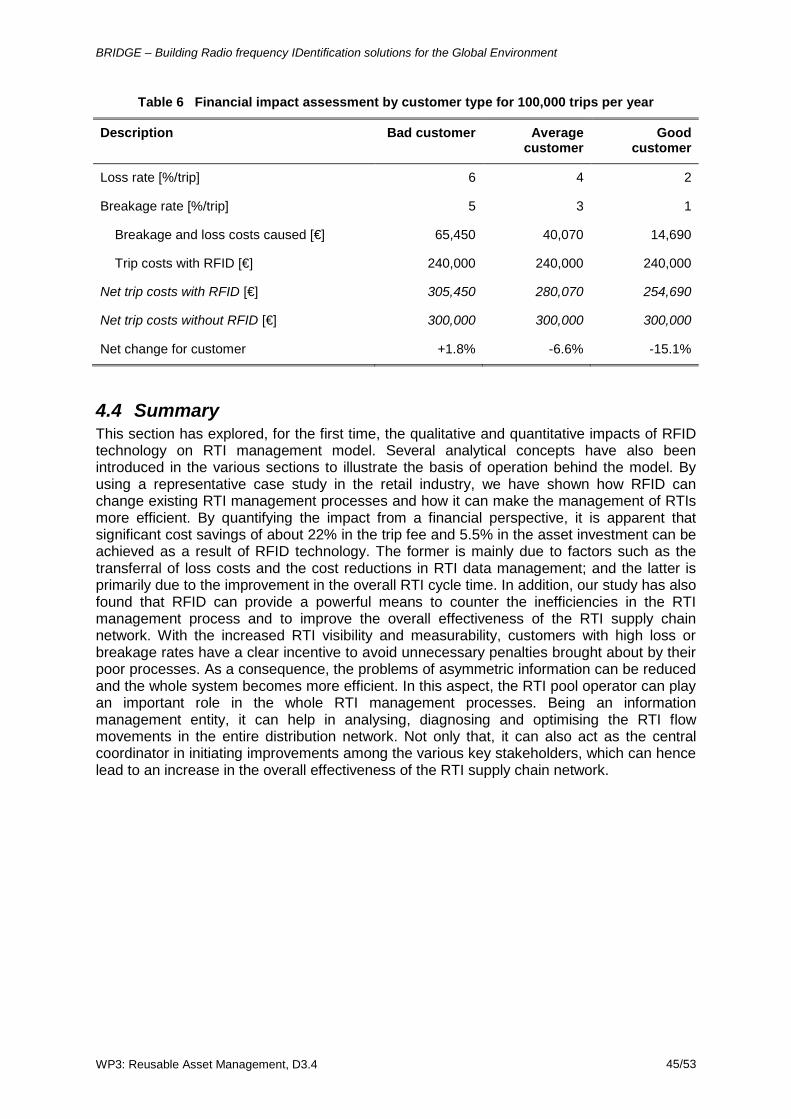
BRIDGE – Building Radio frequency IDentification solutions for the Global Environment
WP3: Reusable Asset Management, D3.4 45/53
Table 6 Financial impact assessment by customer type for 100,000 trips per year
Description Bad customer Average customer
Good customer
Loss rate [%/trip] 6 4 2
Breakage rate [%/trip] 5 3 1
Breakage and loss costs caused [€] 65,450 40,070 14,690
Trip costs with RFID [€] 240,000 240,000 240,000
Net trip costs with RFID [€] 305,450 280,070 254,690
Net trip costs without RFID [€] 300,000 300,000 300,000
Net change for customer +1.8% -6.6% -15.1%
4.4 Summary This section has explored, for the first time, the qualitative and quantitative impacts of RFID technology on RTI management model. Several analytical concepts have also been introduced in the various sections to illustrate the basis of operation behind the model. By using a representative case study in the retail industry, we have shown how RFID can change existing RTI management processes and how it can make the management of RTIs more efficient. By quantifying the impact from a financial perspective, it is apparent that significant cost savings of about 22% in the trip fee and 5.5% in the asset investment can be achieved as a result of RFID technology. The former is mainly due to factors such as the transferral of loss costs and the cost reductions in RTI data management; and the latter is primarily due to the improvement in the overall RTI cycle time. In addition, our study has also found that RFID can provide a powerful means to counter the inefficiencies in the RTI management process and to improve the overall effectiveness of the RTI supply chain network. With the increased RTI visibility and measurability, customers with high loss or breakage rates have a clear incentive to avoid unnecessary penalties brought about by their poor processes. As a consequence, the problems of asymmetric information can be reduced and the whole system becomes more efficient. In this aspect, the RTI pool operator can play an important role in the whole RTI management processes. Being an information management entity, it can help in analysing, diagnosing and optimising the RTI flow movements in the entire distribution network. Not only that, it can also act as the central coordinator in initiating improvements among the various key stakeholders, which can hence lead to an increase in the overall effectiveness of the RTI supply chain network.
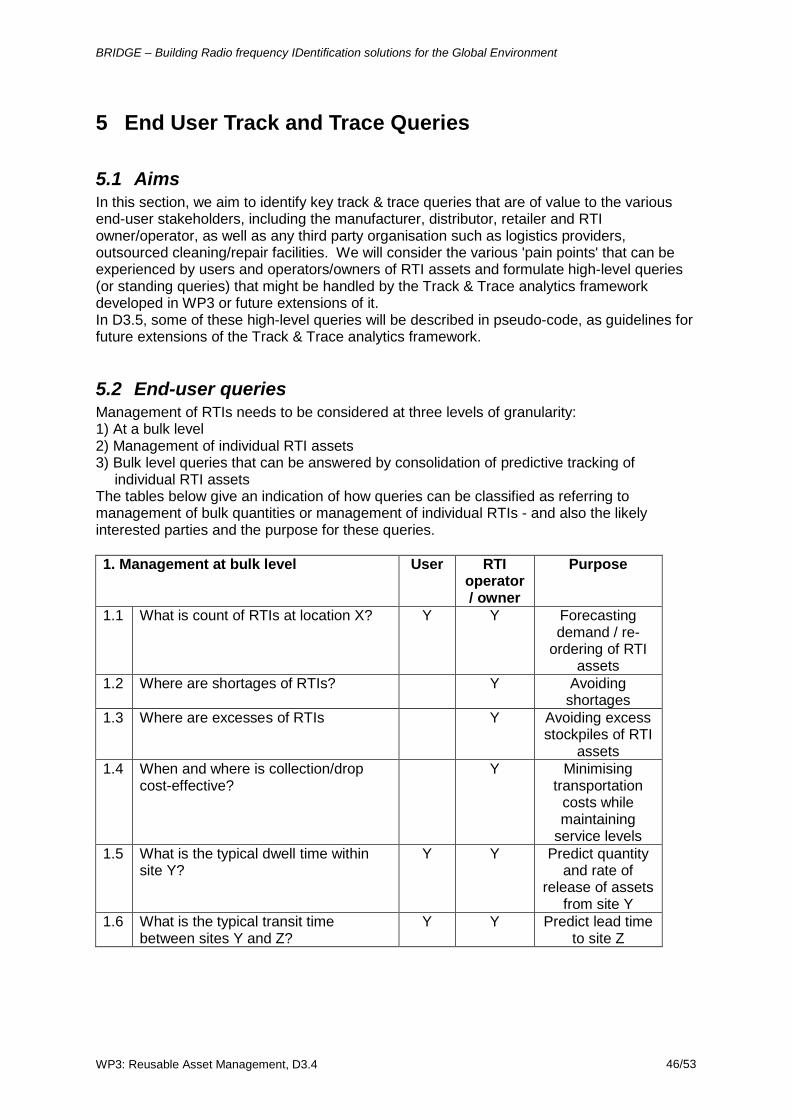
BRIDGE – Building Radio frequency IDentification solutions for the Global Environment
WP3: Reusable Asset Management, D3.4 46/53
5 End User Track and Trace Queries
5.1 Aims In this section, we aim to identify key track & trace queries that are of value to the various end-user stakeholders, including the manufacturer, distributor, retailer and RTI owner/operator, as well as any third party organisation such as logistics providers, outsourced cleaning/repair facilities. We will consider the various 'pain points' that can be experienced by users and operators/owners of RTI assets and formulate high-level queries (or standing queries) that might be handled by the Track & Trace analytics framework developed in WP3 or future extensions of it. In D3.5, some of these high-level queries will be described in pseudo-code, as guidelines for future extensions of the Track & Trace analytics framework.
5.2 End-user queries Management of RTIs needs to be considered at three levels of granularity: 1) At a bulk level 2) Management of individual RTI assets 3) Bulk level queries that can be answered by consolidation of predictive tracking of
individual RTI assets The tables below give an indication of how queries can be classified as referring to management of bulk quantities or management of individual RTIs - and also the likely interested parties and the purpose for these queries. 1. Management at bulk level User RTI
operator / owner
Purpose
1.1 What is count of RTIs at location X? Y Y Forecasting demand / re-
ordering of RTI assets
1.2 Where are shortages of RTIs? Y Avoiding shortages
1.3 Where are excesses of RTIs Y Avoiding excess stockpiles of RTI
assets 1.4 When and where is collection/drop
cost-effective? Y Minimising
transportation costs while maintaining
service levels 1.5 What is the typical dwell time within
site Y? Y Y Predict quantity
and rate of release of assets
from site Y 1.6 What is the typical transit time
between sites Y and Z? Y Y Predict lead time
to site Z
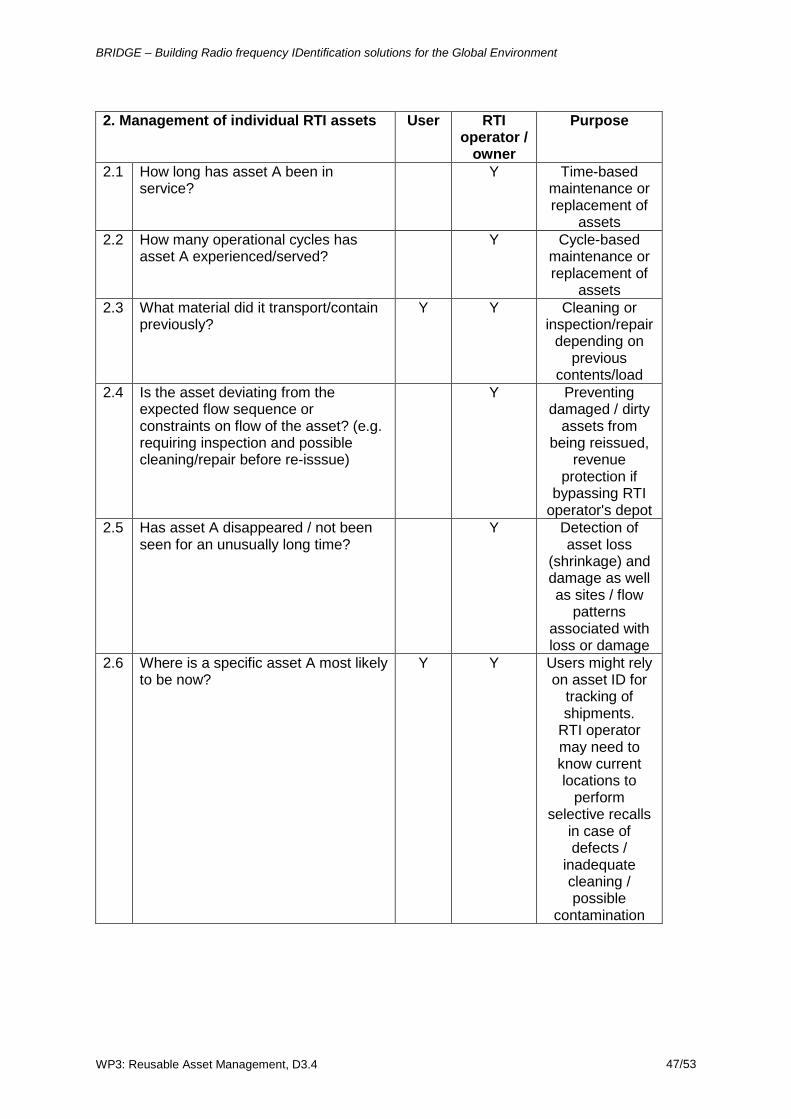
BRIDGE – Building Radio frequency IDentification solutions for the Global Environment
WP3: Reusable Asset Management, D3.4 47/53
2. Management of individual RTI assets User RTI
operator / owner
Purpose
2.1 How long has asset A been in service?
Y Time-based maintenance or replacement of
assets 2.2 How many operational cycles has
asset A experienced/served? Y Cycle-based
maintenance or replacement of
assets 2.3 What material did it transport/contain
previously? Y Y Cleaning or
inspection/repair depending on
previous contents/load
2.4 Is the asset deviating from the expected flow sequence or constraints on flow of the asset? (e.g. requiring inspection and possible cleaning/repair before re-isssue)
Y Preventing damaged / dirty
assets from being reissued,
revenue protection if
bypassing RTI operator's depot
2.5 Has asset A disappeared / not been seen for an unusually long time?
Y Detection of asset loss
(shrinkage) and damage as well as sites / flow
patterns associated with loss or damage
2.6 Where is a specific asset A most likely to be now?
Y Y Users might rely on asset ID for
tracking of shipments.
RTI operator may need to know current locations to
perform selective recalls
in case of defects /
inadequate cleaning / possible
contamination
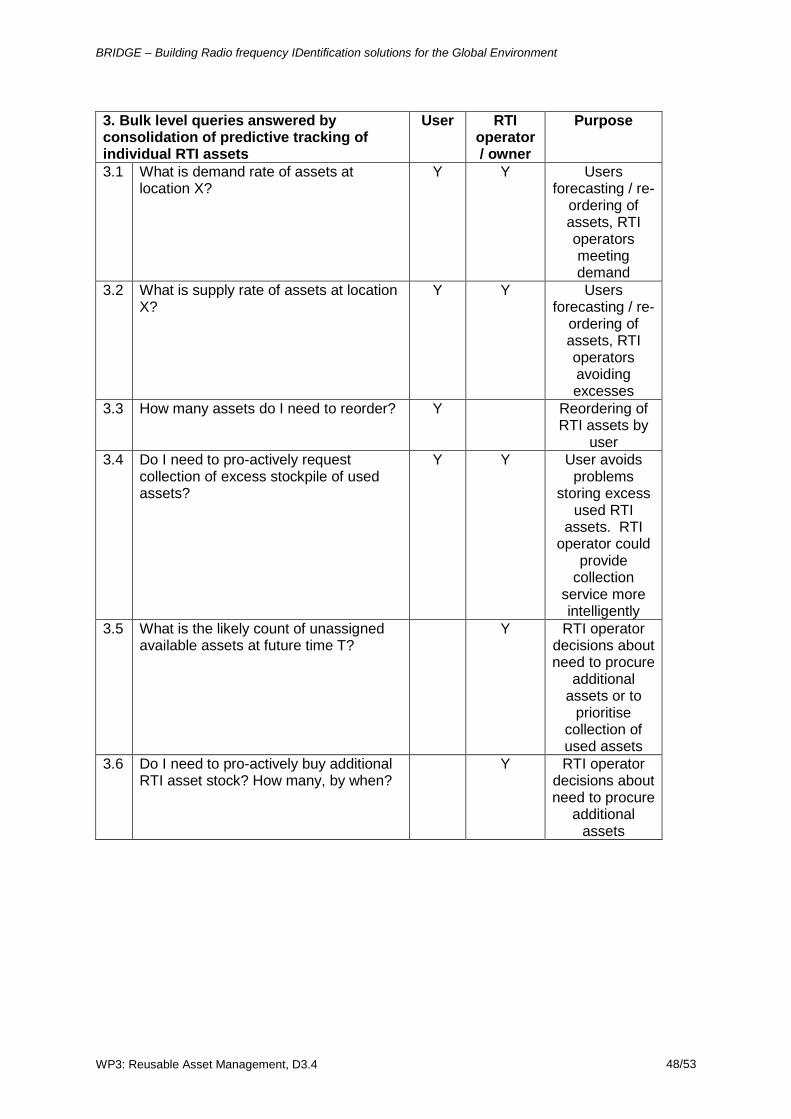
BRIDGE – Building Radio frequency IDentification solutions for the Global Environment
WP3: Reusable Asset Management, D3.4 48/53
3. Bulk level queries answered by consolidation of predictive tracking of individual RTI assets
User RTI operator / owner
Purpose
3.1 What is demand rate of assets at location X?
Y Y Users forecasting / re-
ordering of assets, RTI operators meeting demand
3.2 What is supply rate of assets at location X?
Y Y Users forecasting / re-
ordering of assets, RTI operators avoiding excesses
3.3 How many assets do I need to reorder? Y Reordering of RTI assets by
user 3.4 Do I need to pro-actively request
collection of excess stockpile of used assets?
Y Y User avoids problems
storing excess used RTI
assets. RTI operator could
provide collection
service more intelligently
3.5 What is the likely count of unassigned available assets at future time T?
Y RTI operator decisions about need to procure
additional assets or to
prioritise collection of used assets
3.6 Do I need to pro-actively buy additional RTI asset stock? How many, by when?
Y RTI operator decisions about need to procure
additional assets
BRIDGE – Building Radio frequency IDentification solutions for the Global Environment
WP3: Reusable Asset Management, D3.4 49/53
6 References [Aberdeen, 2004] Aberdeen Group, “RFID-enabled Logistics Asset Management Benchmark Report”. Boston, USA, 2004.
[Angeles, 2005] Angeles, R., “RFID Technologies: Supply-Chain Applications and Implementation Issues”. Information Systems Management, 22, 51-65, 2005.
[BRIDGE, 2007] BRIDGE , “Returnable Transport Items: The Market for EPCglobal Applications, Building Radio frequency IDentification solutions for the Global Environment”. available from http://www.bridge-project.eu ., 2007.
[EPCglobal] EPCglobal, “Architecture Framework v. 1.2”, EPCglobal, Brussels, Belgium, 2007.
[GS1] GS1. General Specifications. Retrieved from http://www.gs1uk.org/standards/general_specs.asp
[Hellstrom, 2006] Hellström, D. & Nilsson, F., “Combining case study and simulation methods in supply chain management research”. Proceedings of the 15th Annual IPSERA Conference, 2006.
[17364] ISO/FDIS 17364, “Supply chain applications of RFID -- Returnable transport items (RTIs)”.
[Johansson, 2007] Johansson, O. & Hellström, D., “The effect of asset visibility on managing returnable transport item”. International Journal of Physical Distribution & Logistics Management, 37, 799-815, 2007.
[LogicaCMG, 2004] LogicaCMG, “RFID Benchmark Study – Making Waves: RFID Adoption in Returnable Packaging”. Hoofddorp, the Netherlands, 2004.
[Ray, 2006] Ray, C. D., “The lean index: Operational ‘lean’ metrics for the wood products industry”. 38, 238, 2006.

Appendix
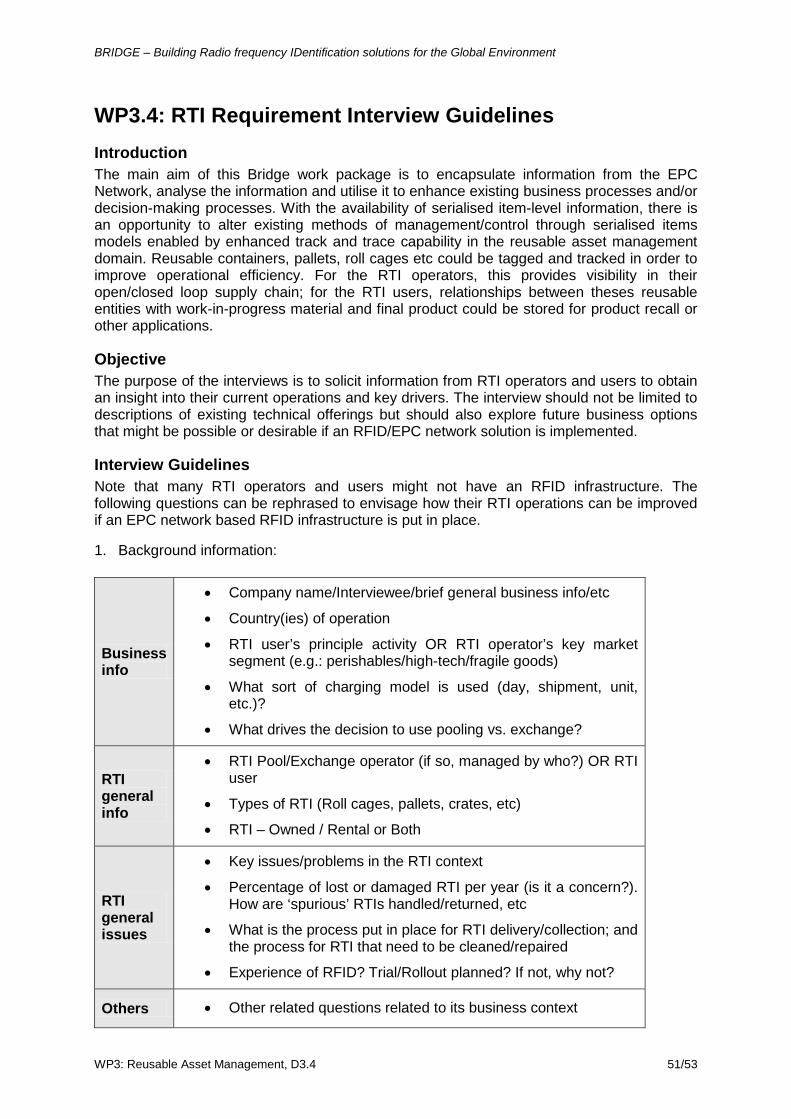
BRIDGE – Building Radio frequency IDentification solutions for the Global Environment
WP3: Reusable Asset Management, D3.4 51/53
WP3.4: RTI Requirement Interview Guidelines Introduction The main aim of this Bridge work package is to encapsulate information from the EPC Network, analyse the information and utilise it to enhance existing business processes and/or decision-making processes. With the availability of serialised item-level information, there is an opportunity to alter existing methods of management/control through serialised items models enabled by enhanced track and trace capability in the reusable asset management domain. Reusable containers, pallets, roll cages etc could be tagged and tracked in order to improve operational efficiency. For the RTI operators, this provides visibility in their open/closed loop supply chain; for the RTI users, relationships between theses reusable entities with work-in-progress material and final product could be stored for product recall or other applications.
Objective The purpose of the interviews is to solicit information from RTI operators and users to obtain an insight into their current operations and key drivers. The interview should not be limited to descriptions of existing technical offerings but should also explore future business options that might be possible or desirable if an RFID/EPC network solution is implemented.
Interview Guidelines Note that many RTI operators and users might not have an RFID infrastructure. The following questions can be rephrased to envisage how their RTI operations can be improved if an EPC network based RFID infrastructure is put in place.
1. Background information:
Business info
• Company name/Interviewee/brief general business info/etc
• Country(ies) of operation
• RTI user’s principle activity OR RTI operator’s key market segment (e.g.: perishables/high-tech/fragile goods)
• What sort of charging model is used (day, shipment, unit, etc.)?
• What drives the decision to use pooling vs. exchange?
RTI general info
• RTI Pool/Exchange operator (if so, managed by who?) OR RTI user
• Types of RTI (Roll cages, pallets, crates, etc)
• RTI – Owned / Rental or Both
RTI general issues
• Key issues/problems in the RTI context
• Percentage of lost or damaged RTI per year (is it a concern?). How are ‘spurious’ RTIs handled/returned, etc
• What is the process put in place for RTI delivery/collection; and the process for RTI that need to be cleaned/repaired
• Experience of RFID? Trial/Rollout planned? If not, why not?
Others • Other related questions related to its business context
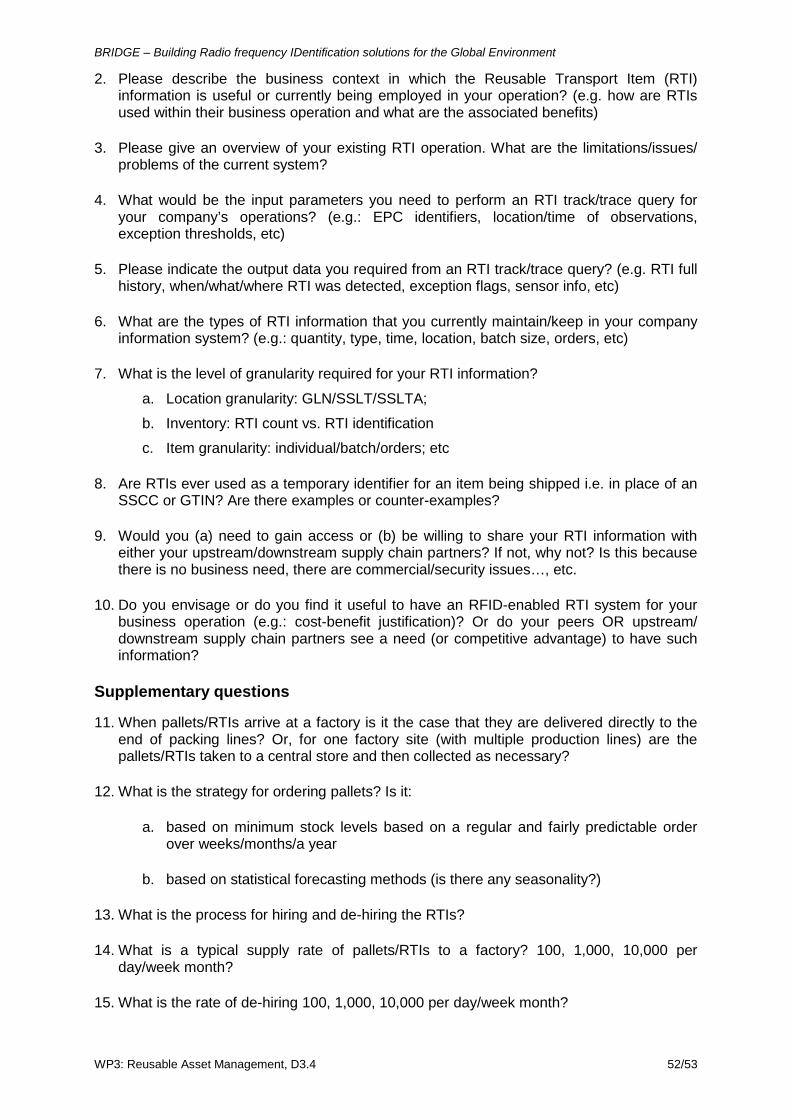
BRIDGE – Building Radio frequency IDentification solutions for the Global Environment
WP3: Reusable Asset Management, D3.4 52/53
2. Please describe the business context in which the Reusable Transport Item (RTI) information is useful or currently being employed in your operation? (e.g. how are RTIs used within their business operation and what are the associated benefits)
3. Please give an overview of your existing RTI operation. What are the limitations/issues/ problems of the current system?
4. What would be the input parameters you need to perform an RTI track/trace query for your company’s operations? (e.g.: EPC identifiers, location/time of observations, exception thresholds, etc)
5. Please indicate the output data you required from an RTI track/trace query? (e.g. RTI full history, when/what/where RTI was detected, exception flags, sensor info, etc)
6. What are the types of RTI information that you currently maintain/keep in your company information system? (e.g.: quantity, type, time, location, batch size, orders, etc)
7. What is the level of granularity required for your RTI information?
a. Location granularity: GLN/SSLT/SSLTA;
b. Inventory: RTI count vs. RTI identification
c. Item granularity: individual/batch/orders; etc
8. Are RTIs ever used as a temporary identifier for an item being shipped i.e. in place of an SSCC or GTIN? Are there examples or counter-examples?
9. Would you (a) need to gain access or (b) be willing to share your RTI information with either your upstream/downstream supply chain partners? If not, why not? Is this because there is no business need, there are commercial/security issues…, etc.
10. Do you envisage or do you find it useful to have an RFID-enabled RTI system for your business operation (e.g.: cost-benefit justification)? Or do your peers OR upstream/ downstream supply chain partners see a need (or competitive advantage) to have such information?
Supplementary questions
11. When pallets/RTIs arrive at a factory is it the case that they are delivered directly to the end of packing lines? Or, for one factory site (with multiple production lines) are the pallets/RTIs taken to a central store and then collected as necessary?
12. What is the strategy for ordering pallets? Is it:
a. based on minimum stock levels based on a regular and fairly predictable order over weeks/months/a year
b. based on statistical forecasting methods (is there any seasonality?)
13. What is the process for hiring and de-hiring the RTIs?
14. What is a typical supply rate of pallets/RTIs to a factory? 100, 1,000, 10,000 per day/week month?
15. What is the rate of de-hiring 100, 1,000, 10,000 per day/week month?
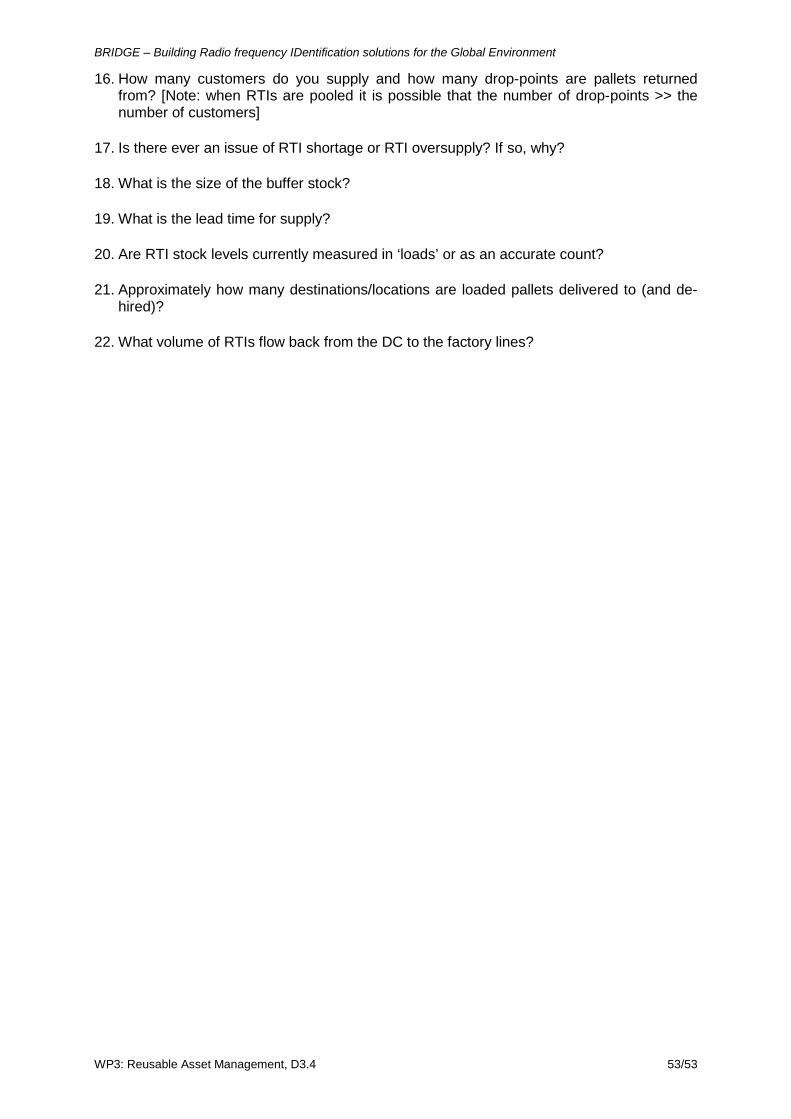
BRIDGE – Building Radio frequency IDentification solutions for the Global Environment
WP3: Reusable Asset Management, D3.4 53/53
16. How many customers do you supply and how many drop-points are pallets returned from? [Note: when RTIs are pooled it is possible that the number of drop-points >> the number of customers]
17. Is there ever an issue of RTI shortage or RTI oversupply? If so, why?
18. What is the size of the buffer stock?
19. What is the lead time for supply?
20. Are RTI stock levels currently measured in ‘loads’ or as an accurate count?
21. Approximately how many destinations/locations are loaded pallets delivered to (and de-hired)?
22. What volume of RTIs flow back from the DC to the factory lines?


![WP 9 Reusable Transport Items [RTI] - bridge-project.eu WP9 191207.pdf · Building Radio frequency IDentification solutions for the Global Environment WP 9 –Reusable Transport Items](https://img.pdfslide.us/doc/110x75/5a7c0d227f8b9a2e6e8c686d/wp-9-reusable-transport-items-rti-bridge-wp9-191207pdfbuilding-radio-frequency.jpg)