Embed Size (px)
DESCRIPTION
13. Return, Risk, and the Security Market Line. Expected Returns. Expected Rate of Return All possible outcomes and probabilities known Kμ = E(R) = P 1 K 1 + P 2 K 2 + P 3 K 3 Sample taken of past returns _ K = ΣK/n. Example: Expected Returns. - PowerPoint PPT Presentation
Citation preview
Chapter
McGraw-Hill/Irwin Copyright © 2006 by The McGraw-Hill Companies, Inc. All rights reserved.
13•Return, Risk, and the Security Market Line•Return, Risk, and the Security Market Line
13-2
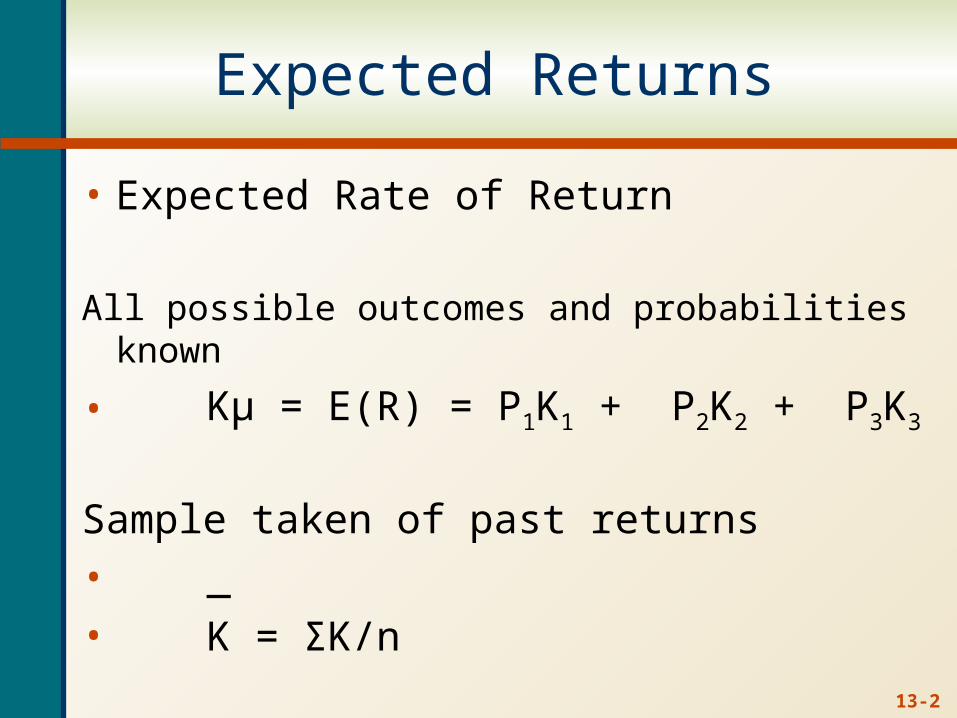
Expected Returns
• Expected Rate of Return
All possible outcomes and probabilities known
• Kμ = E(R) = P1K1 + P2K2 + P3K3
Sample taken of past returns
• _
• K = ΣK/n
13-3
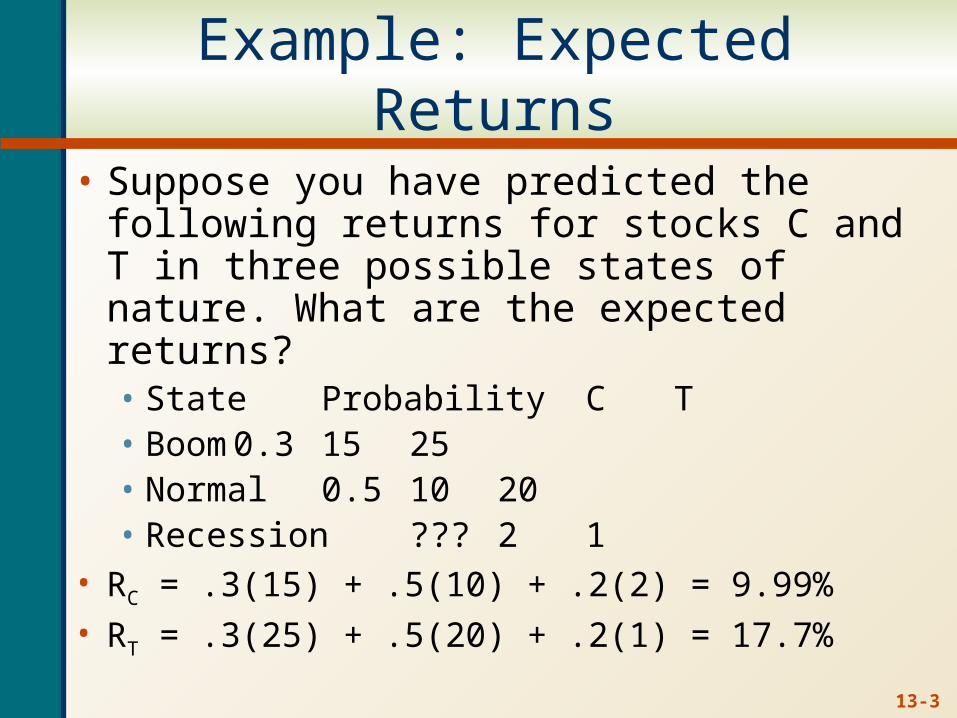
Example: Expected Returns
• Suppose you have predicted the following returns for stocks C and T in three possible states of nature. What are the expected returns?• State Probability C T• Boom 0.3 15
25• Normal 0.5 10 20• Recession ??? 2 1
• RC = .3(15) + .5(10) + .2(2) = 9.99%• RT = .3(25) + .5(20) + .2(1) = 17.7%

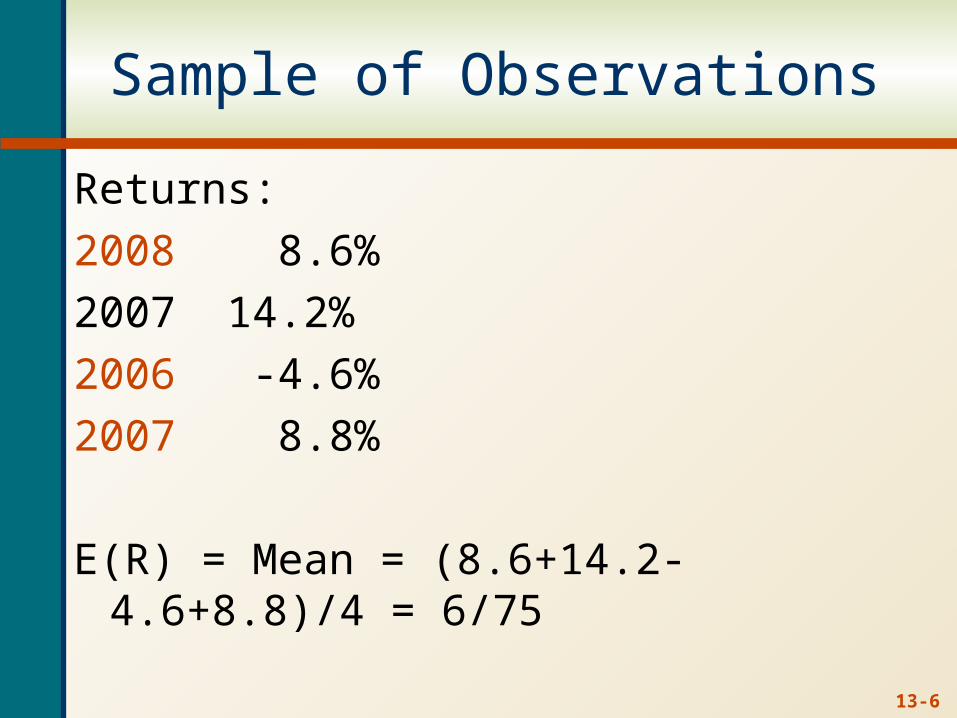
Sample of Observations
Returns:
2008 8.6%
2007 14.2%
2006 -4.6%
2007 8.8%
E(R) = Mean = (8.6+14.2-4.6+8.8)/4 = 6.75
13-4
13-5
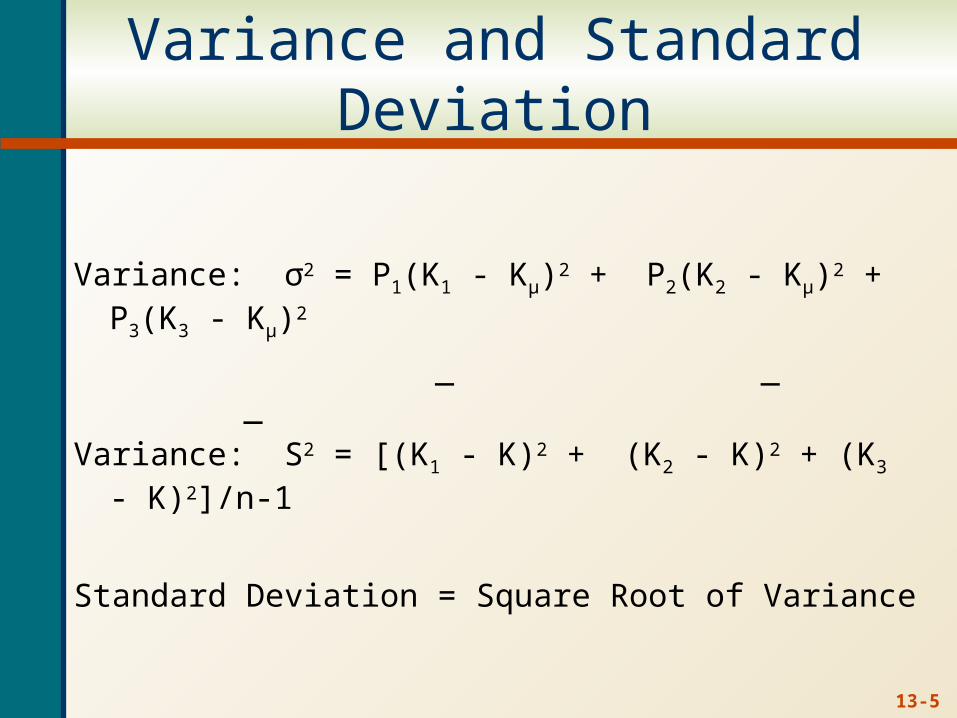
Variance and Standard Deviation
Variance: σ2 = P1(K1 - Kμ)2 + P2(K2 - Kμ)2 + P3(K3 - Kμ)2
_ _ _
Variance: S2 = [(K1 - K)2 + (K2 - K)2 + (K3 - K)2]/n-1
Standard Deviation = Square Root of Variance
Sample of Observations
Returns:
2008 8.6%
2007 14.2%
2006 -4.6%
2007 8.8%
E(R) = Mean = (8.6+14.2-4.6+8.8)/4 = 6/75
13-6
13-7
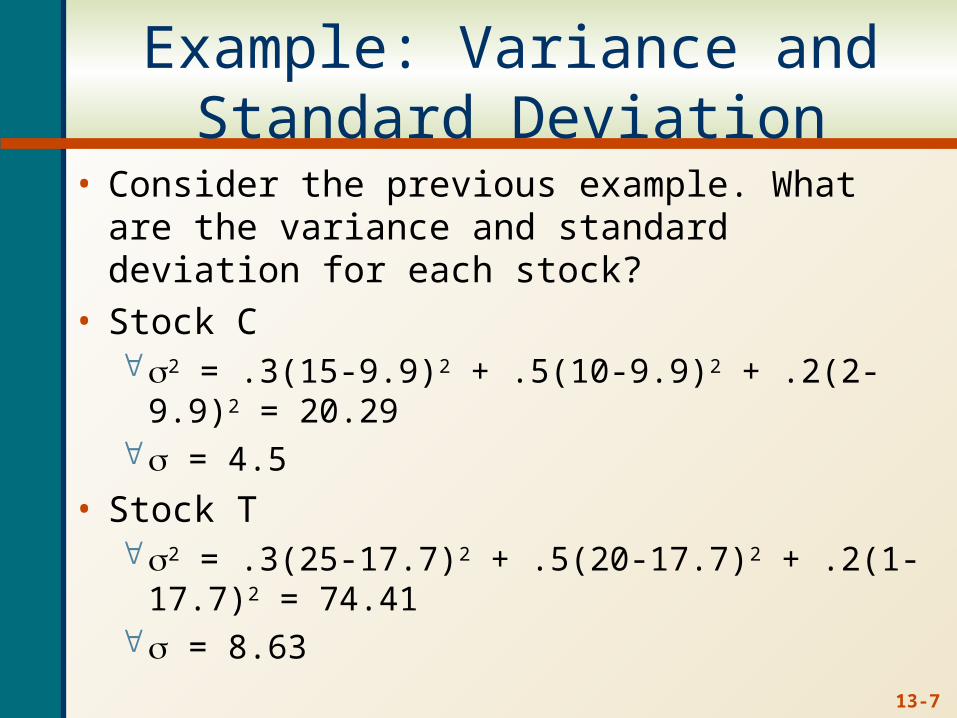
Example: Variance andStandard Deviation
• Consider the previous example. What are the variance and standard deviation for each stock?
• Stock C2 = .3(15-9.9)2 + .5(10-9.9)2 + .2(2-9.9)2 = 20.29 = 4.5
• Stock T2 = .3(25-17.7)2 + .5(20-17.7)2 + .2(1-17.7)2 =
74.41 = 8.63
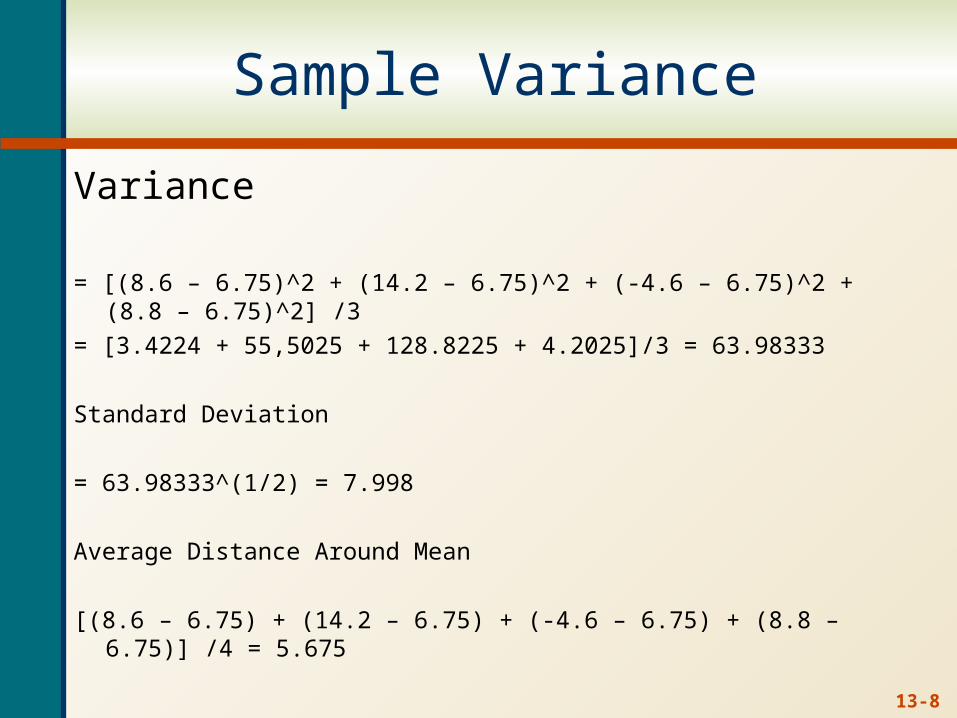
Sample Variance
Variance
= [(8.6 – 6.75)^2 + (14.2 – 6.75)^2 + (-4.6 – 6.75)^2 + (8.8 – 6.75)^2] /3
= [3.4224 + 55,5025 + 128.8225 + 4.2025]/3 = 63.98333
Standard Deviation
= 63.98333^(1/2) = 7.998
Average Distance Around Mean
[(8.6 – 6.75) + (14.2 – 6.75) + (-4.6 – 6.75) + (8.8 – 6.75)] /4 = 5.675
13-8
13-9
Portfolios vs. Individual Stocks
• A portfolio is a collection of assets
• An asset’s risk and return are important in how they affect the risk and return of the portfolio
• The risk-return trade-off for a portfolio is measured by the portfolio expected return and standard deviation, just as with individual assets
13-10
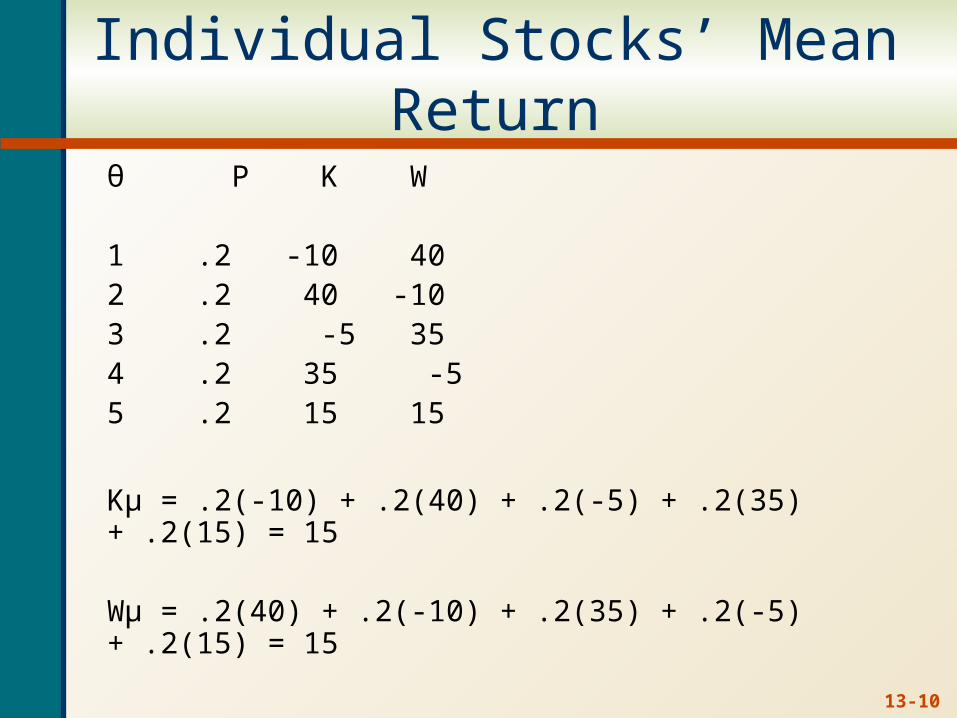
Individual Stocks’ Mean Return
θ P K W
1 .2 -10 402 .2 40 -103 .2 -5 354 .2 35 -55 .2 15 15
Kμ = .2(-10) + .2(40) + .2(-5) + .2(35) + .2(15) = 15
Wμ = .2(40) + .2(-10) + .2(35) + .2(-5) + .2(15) = 15
13-11
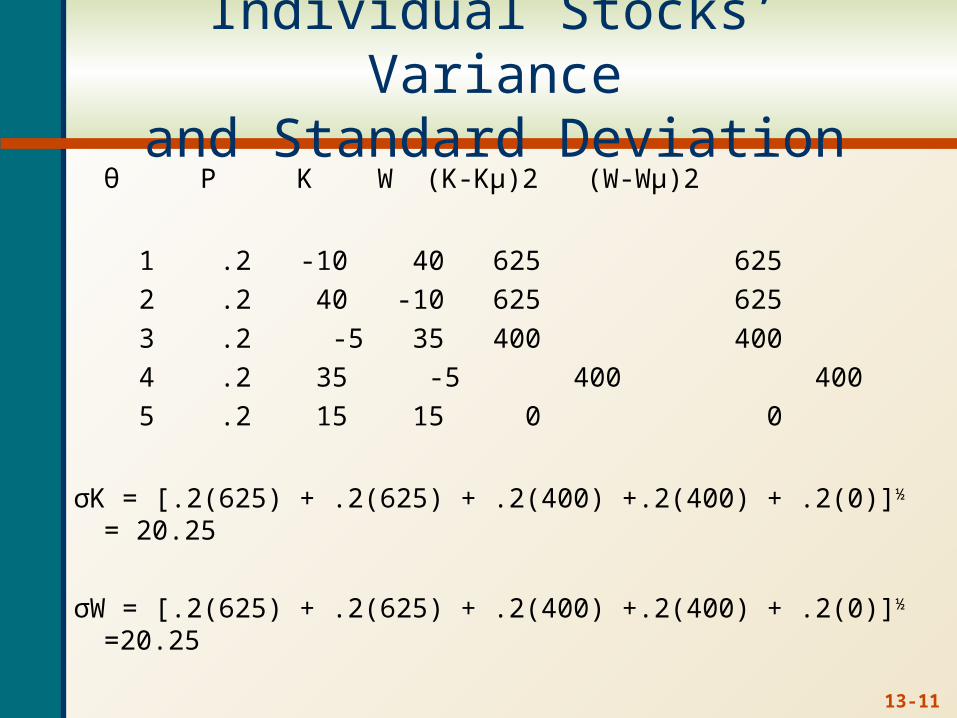
Individual Stocks’ Varianceand Standard Deviation
θ P K W (K-Kμ)2 (W-Wμ)2
1 .2 -10 40 625 625
2 .2 40 -10 625 625
3 .2 -5 35 400 400
4 .2 35 -5 400 400
5 .2 15 15 0 0
σK = [.2(625) + .2(625) + .2(400) +.2(400) + .2(0)]½ = 20.25
σW = [.2(625) + .2(625) + .2(400) +.2(400) + .2(0)]½ =20.25
13-12
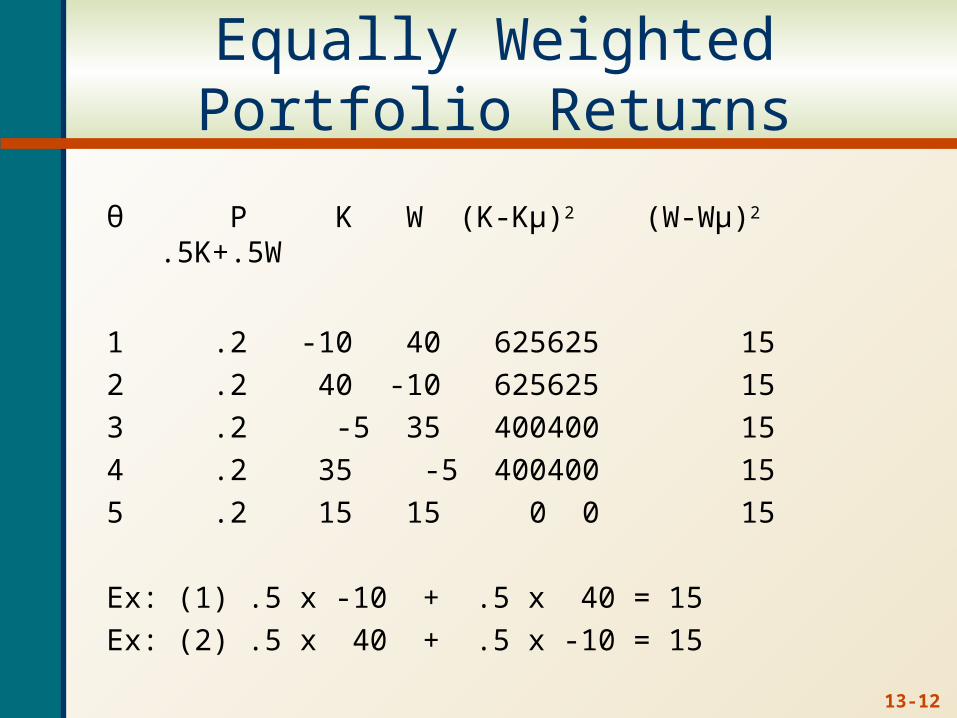
Equally WeightedPortfolio Returns
θ P K W (K-Kμ)2 (W-Wμ)2 .5K+.5W
1 .2 -10 40 625 625 15
2 .2 40 -10 625 625 15
3 .2 -5 35 400 400 15
4 .2 35 -5 400 400 15
5 .2 15 15 0 0 15
Ex: (1) .5 x -10 + .5 x 40 = 15
Ex: (2) .5 x 40 + .5 x -10 = 15
13-13
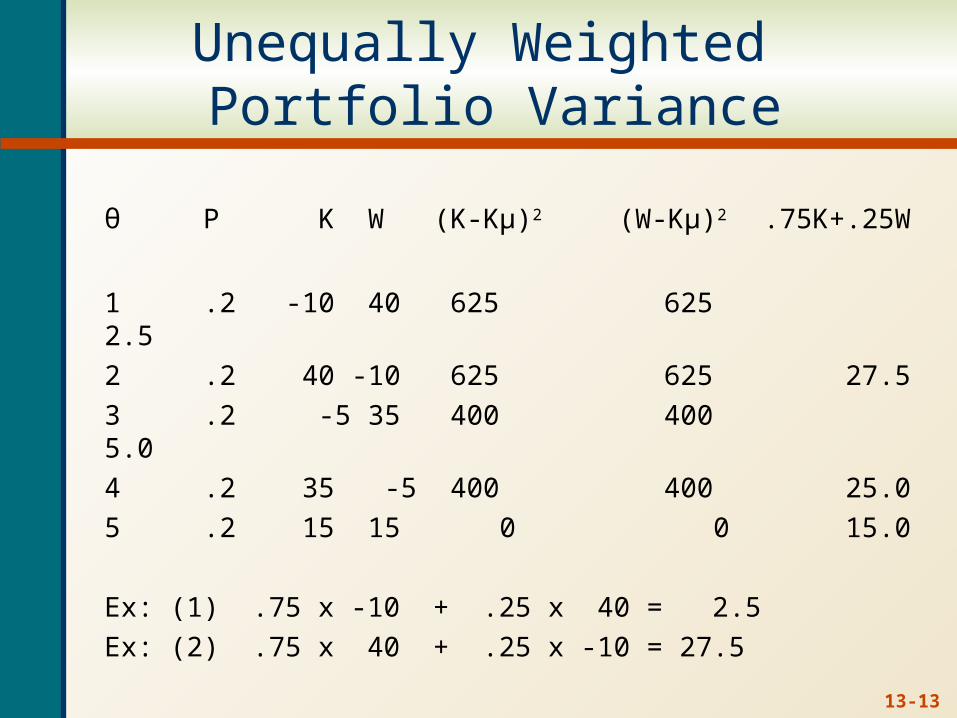
Unequally Weighted Portfolio Variance
θ P K W (K-Kμ)2 (W-Kμ)2 .75K+.25W
1 .2 -10 40 625 625 2.5
2 .2 40 -10 625 625 27.5
3 .2 -5 35 400 400 5.0
4 .2 35 -5 400 400 25.0
5 .2 15 15 0 0 15.0
Ex: (1) .75 x -10 + .25 x 40 = 2.5
Ex: (2) .75 x 40 + .25 x -10 = 27.5
13-14
Correlation of Security Returns
Perfect Positive = +1
Perfect Negative = -1
Uncorrelated = 0
13-15
Diversification
Total Risk = Nondiversifiable Risk + Diversifiable Risk
Total Risk = Systematic Risk + Unsystematic Risk
Total Risk = Market Risk + Firm Risk
13-16
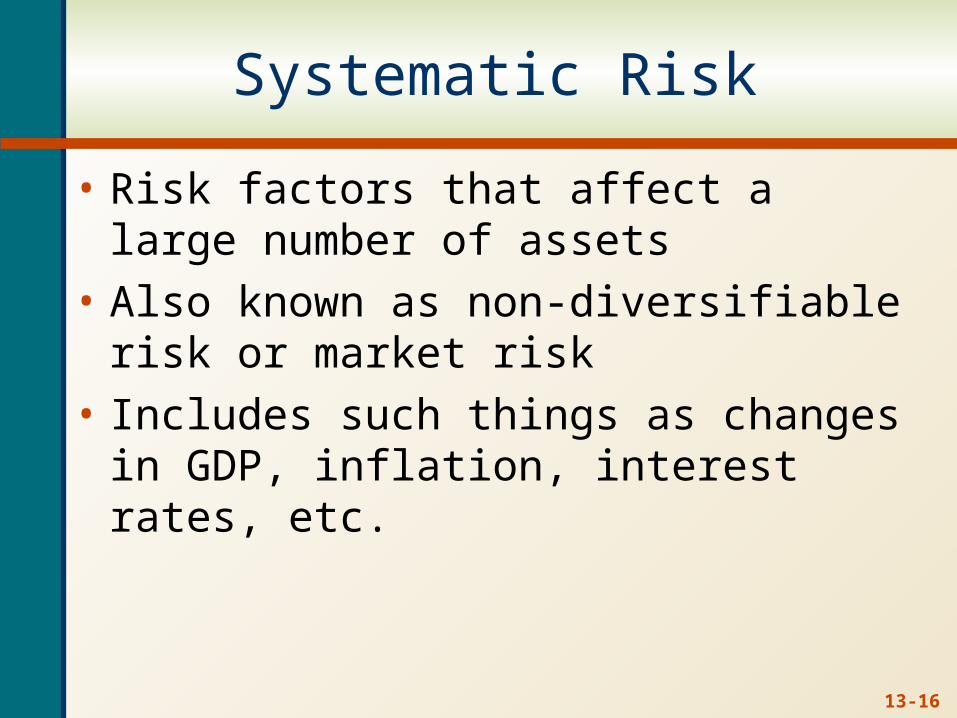
Systematic Risk
• Risk factors that affect a large number of assets
• Also known as non-diversifiable risk or market risk
• Includes such things as changes in GDP, inflation, interest rates, etc.
13-17
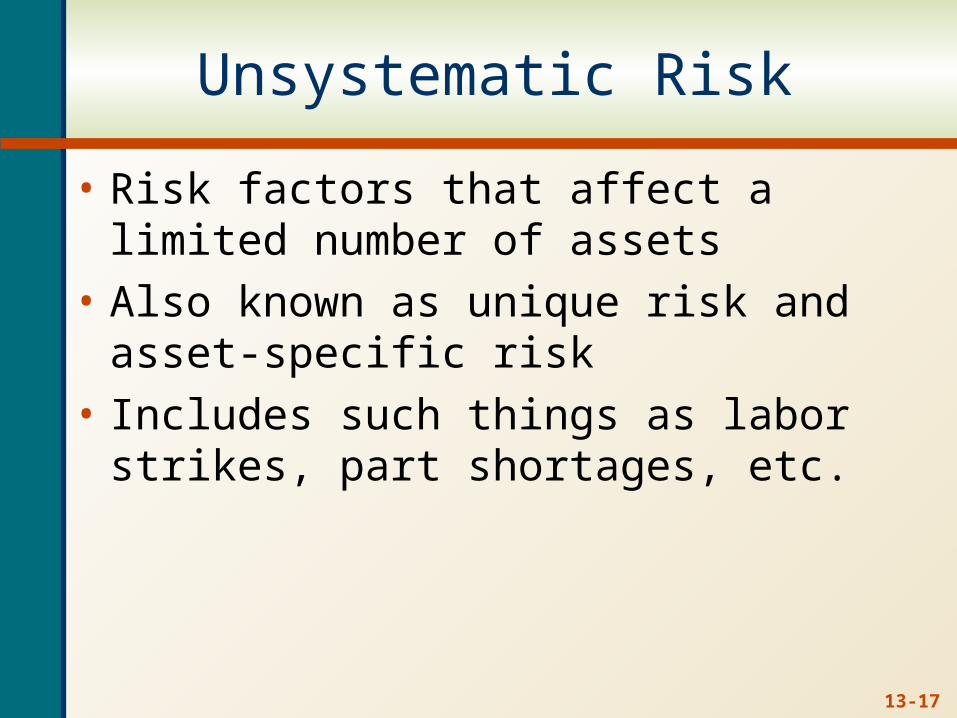
Unsystematic Risk
• Risk factors that affect a limited number of assets
• Also known as unique risk and asset-specific risk
• Includes such things as labor strikes, part shortages, etc.
13-18
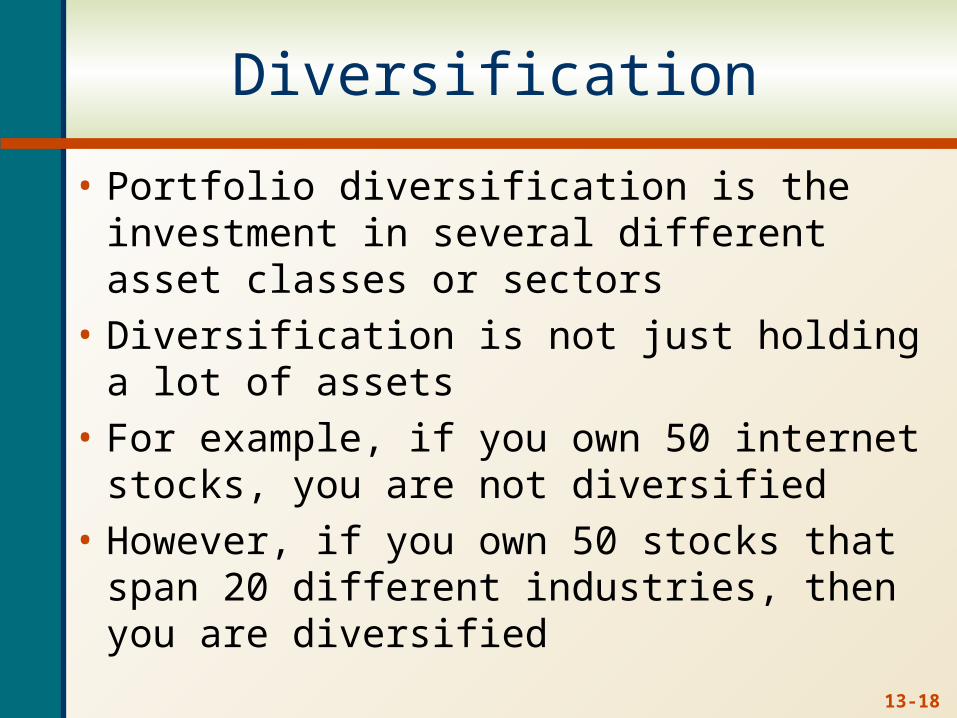
Diversification
• Portfolio diversification is the investment in several different asset classes or sectors
• Diversification is not just holding a lot of assets
• For example, if you own 50 internet stocks, you are not diversified
• However, if you own 50 stocks that span 20 different industries, then you are diversified
13-19
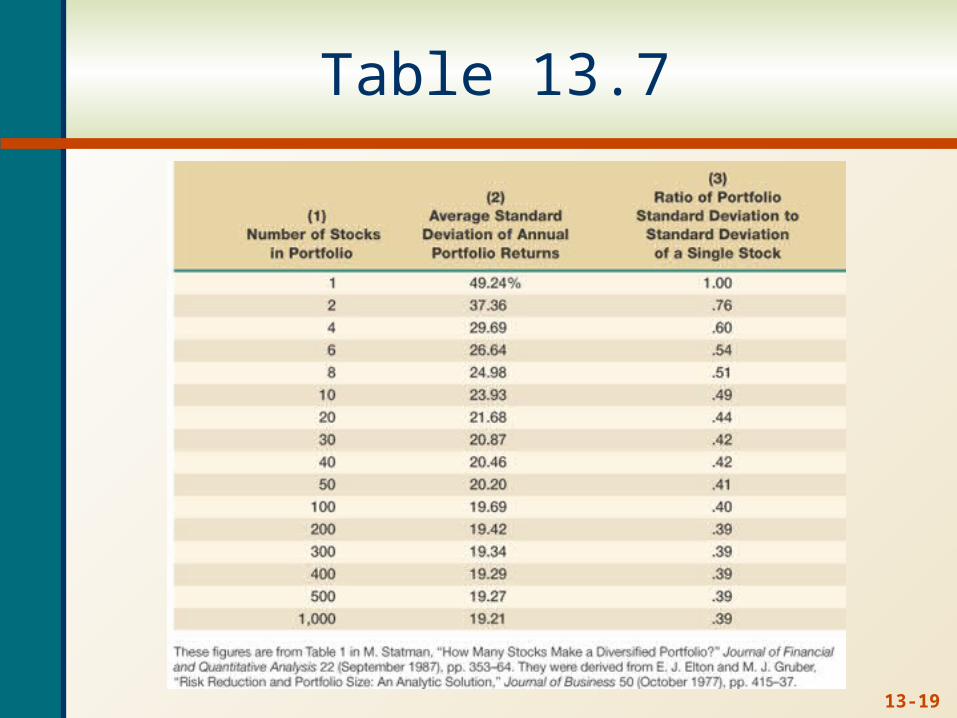
Table 13.7
13-20
The Principle of Diversification
• Diversification can substantially reduce the variability of returns without an equivalent reduction in expected returns
• This reduction in risk arises because worse than expected returns from one asset are offset by better than expected returns from another
• However, there is a minimum level of risk that cannot be diversified away and that is the systematic portion
13-21
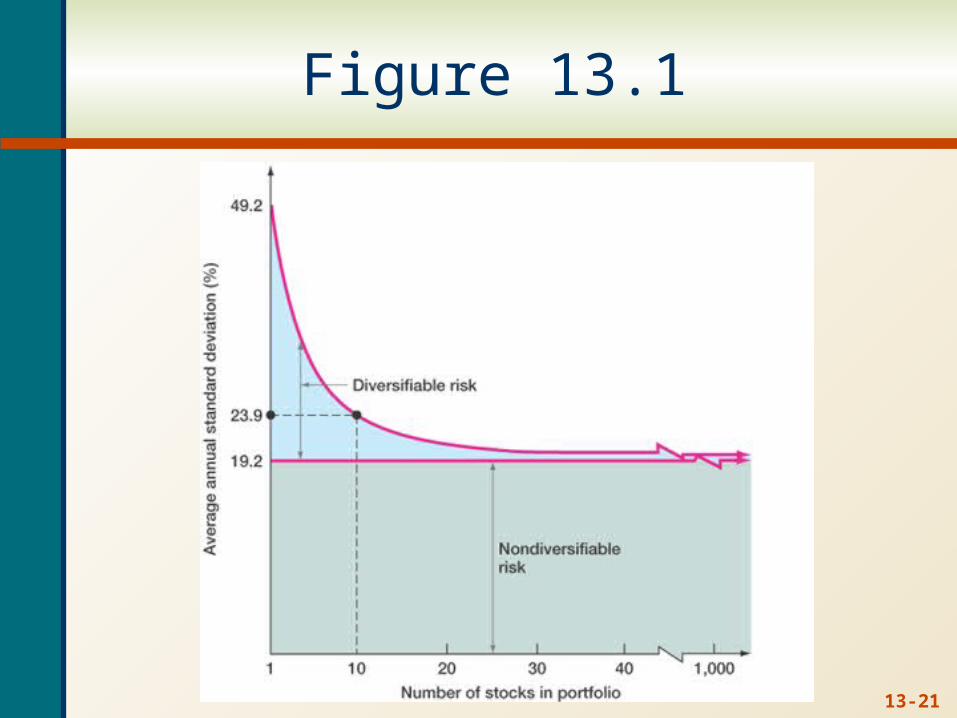
Figure 13.1
13-22
Diversifiable Risk
• The risk that can be eliminated by combining assets into a portfolio
• Often considered the same as unsystematic, unique or asset-specific risk
• If we hold only one asset, or assets in the same industry, then we are exposing ourselves to risk that we could diversify away
13-23
Total Risk
• Total risk = systematic risk + unsystematic risk
• The standard deviation of returns is a measure of total risk
• For well-diversified portfolios, unsystematic risk is very small
• Consequently, the total risk for a diversified portfolio is essentially equivalent to the systematic risk
13-24
Systematic Risk Principle
• There is a reward for bearing risk
• There is not a reward for bearing risk unnecessarily
• The expected return on a risky asset depends only on that asset’s systematic risk since unsystematic risk can be diversified away
13-25
Measuring Systematic Risk
• How do we measure systematic risk?• We use the beta coefficient to measure
systematic risk• What does beta tell us?
• A beta of 1 implies the asset has the same systematic risk as the overall market
• A beta < 1 implies the asset has less systematic risk than the overall market
• A beta > 1 implies the asset has more systematic risk than the overall market
13-26
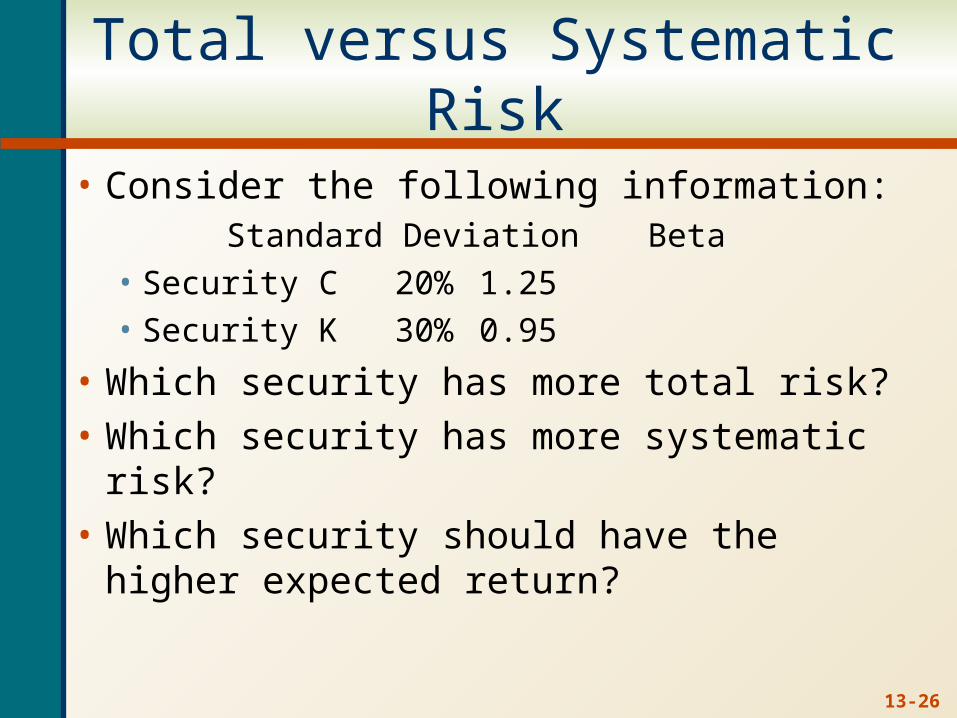
Total versus Systematic Risk
• Consider the following information: Standard Deviation Beta• Security C 20% 1.25• Security K 30% 0.95
• Which security has more total risk?
• Which security has more systematic risk?
• Which security should have the higher expected return?
13-27
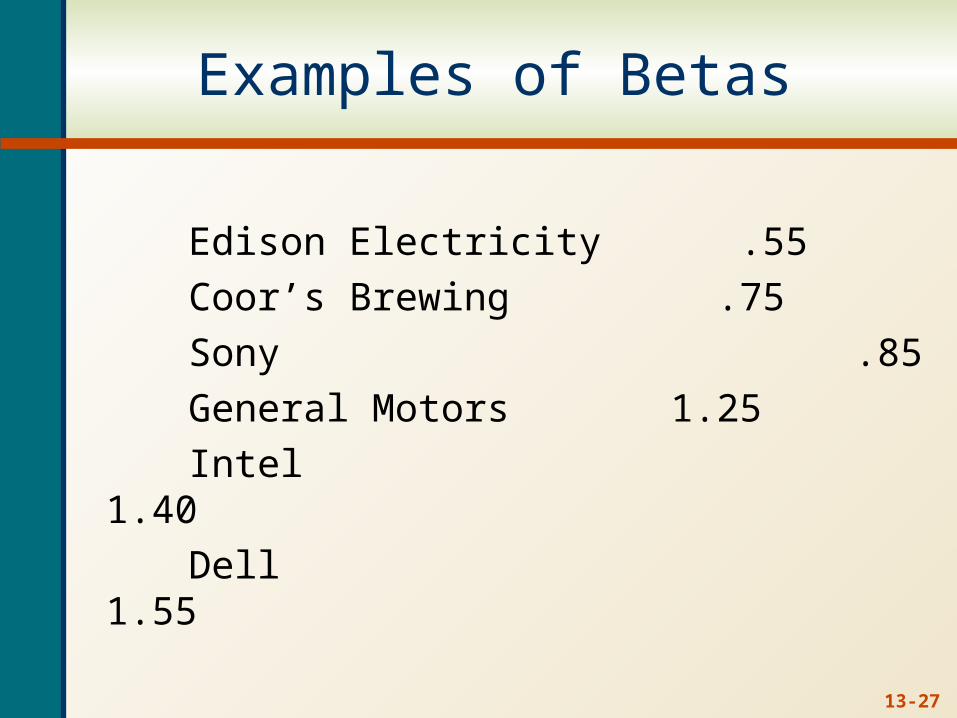
Examples of Betas
Edison Electricity .55
Coor’s Brewing .75
Sony .85
General Motors 1.25
Intel 1.40
Dell 1.55
13-28
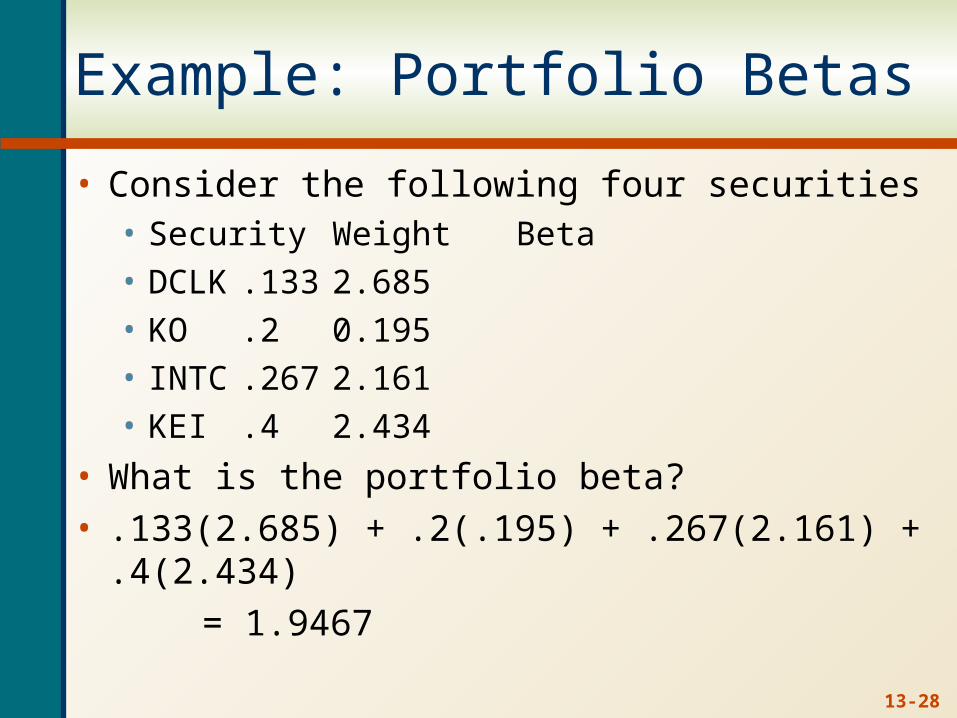
Example: Portfolio Betas
• Consider the following four securities• Security Weight Beta
• DCLK .133 2.685
• KO .2 0.195
• INTC .267 2.161
• KEI .4 2.434
• What is the portfolio beta?• .133(2.685) + .2(.195) + .267(2.161) + .4(2.434)
= 1.9467
13-29
Beta and the Risk Premium
• Remember that the risk premium = expected return – risk-free rate
• The higher the beta, the greater the risk premium should be
• Can we define the relationship between the risk premium and beta so that we can estimate the expected return?• YES!
13-30
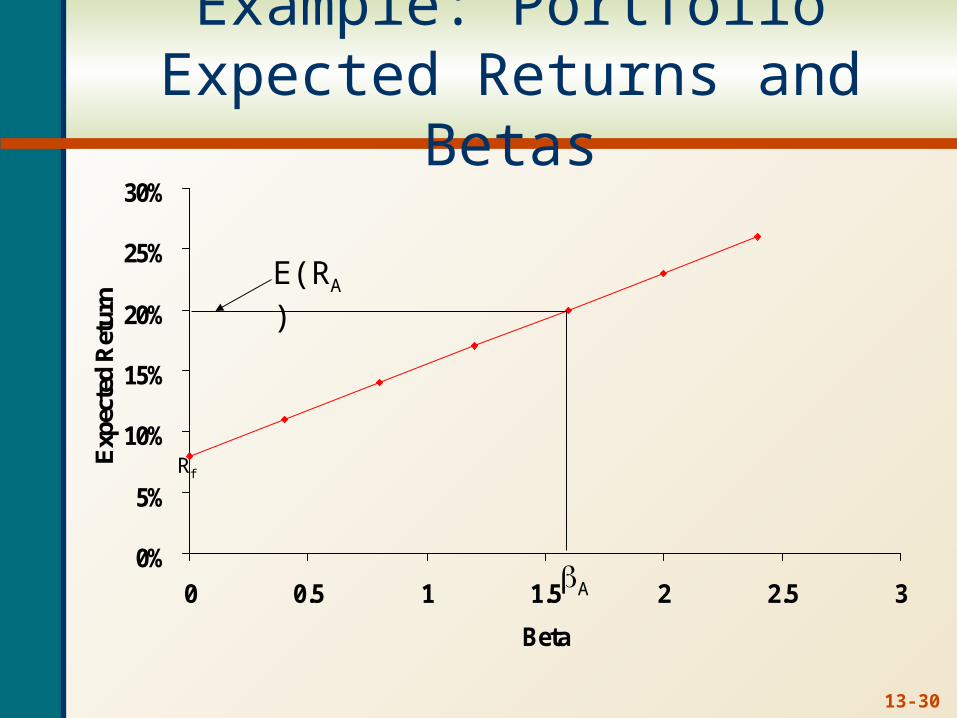
Example: Portfolio Expected Returns and Betas
0%
5%
10%
15%
20%
25%
30%
0 0.5 1 1.5 2 2.5 3
Beta
Exp
ecte
d R
etur
n
Rf
E(RA)
A
13-31
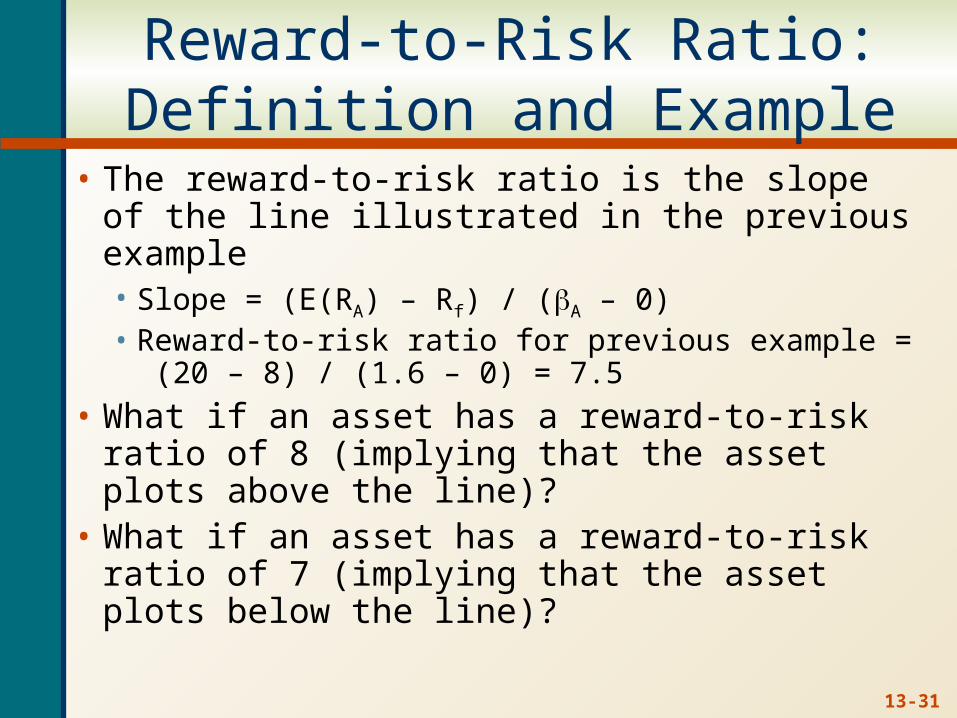
Reward-to-Risk Ratio: Definition and Example
• The reward-to-risk ratio is the slope of the line illustrated in the previous example• Slope = (E(RA) – Rf) / (A – 0)• Reward-to-risk ratio for previous example =
(20 – 8) / (1.6 – 0) = 7.5
• What if an asset has a reward-to-risk ratio of 8 (implying that the asset plots above the line)?
• What if an asset has a reward-to-risk ratio of 7 (implying that the asset plots below the line)?
13-32
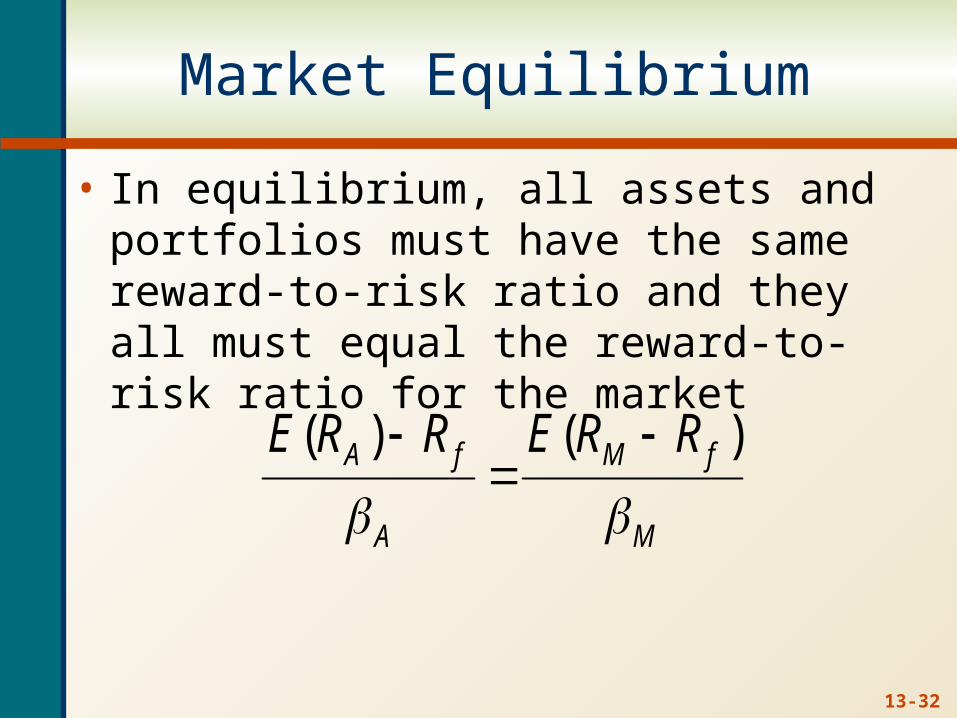
Market Equilibrium
• In equilibrium, all assets and portfolios must have the same reward-to-risk ratio and they all must equal the reward-to-risk ratio for the market
M
fM
A
fA RRERRE
)()(
13-33
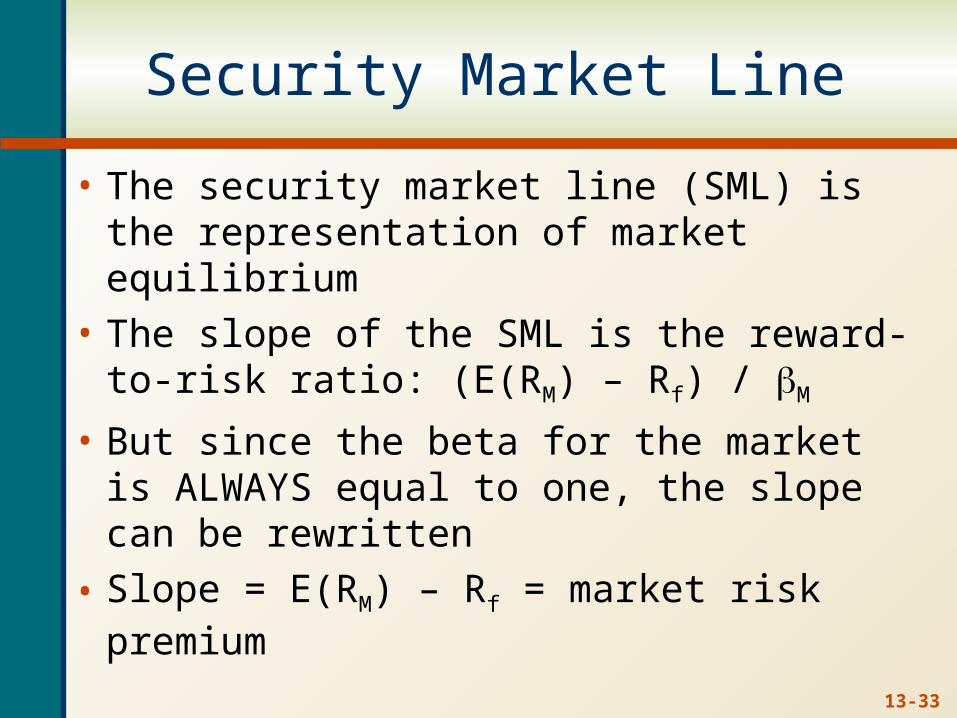
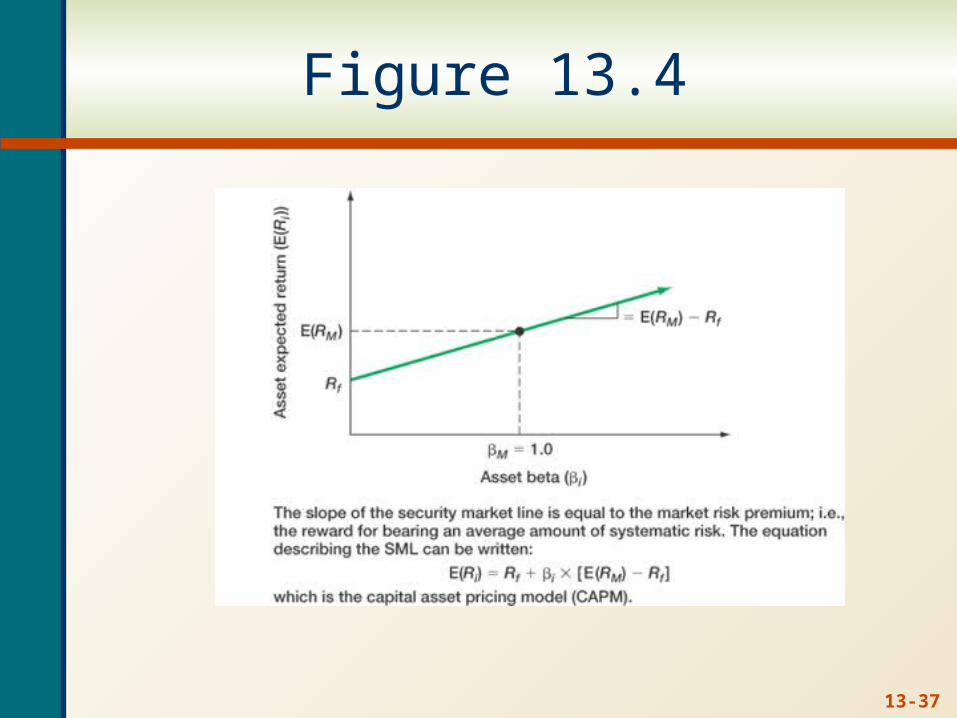
Security Market Line
• The security market line (SML) is the representation of market equilibrium
• The slope of the SML is the reward-to-risk ratio: (E(RM) – Rf) / M
• But since the beta for the market is ALWAYS equal to one, the slope can be rewritten
• Slope = E(RM) – Rf = market risk premium
13-34
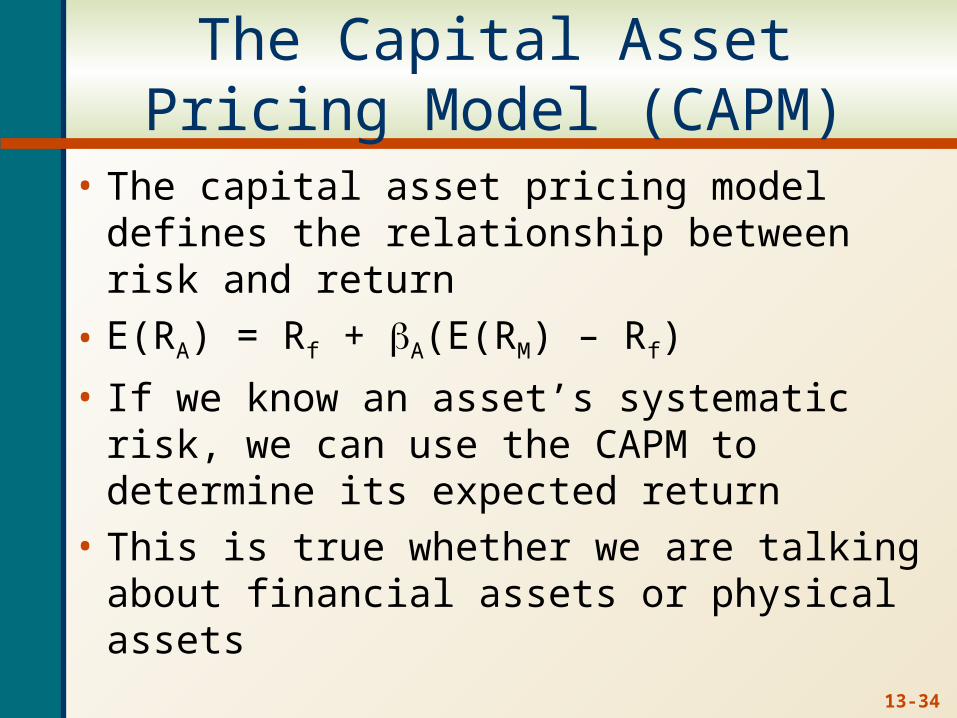
The Capital Asset Pricing Model (CAPM)
• The capital asset pricing model defines the relationship between risk and return
• E(RA) = Rf + A(E(RM) – Rf)
• If we know an asset’s systematic risk, we can use the CAPM to determine its expected return
• This is true whether we are talking about financial assets or physical assets
13-35
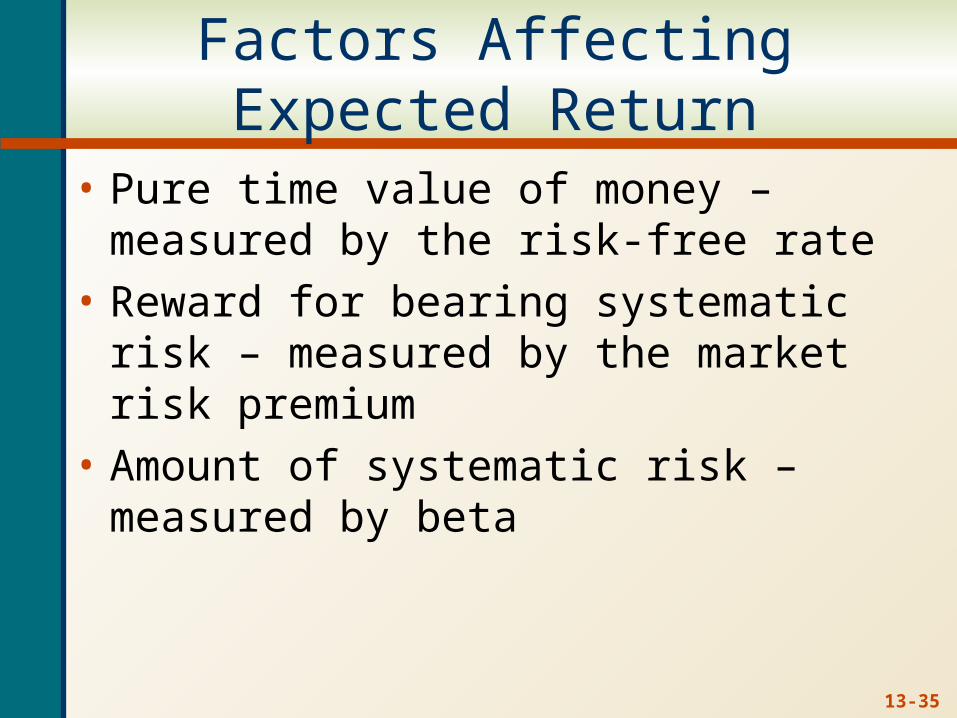
Factors Affecting Expected Return
• Pure time value of money – measured by the risk-free rate
• Reward for bearing systematic risk – measured by the market risk premium
• Amount of systematic risk – measured by beta
13-36
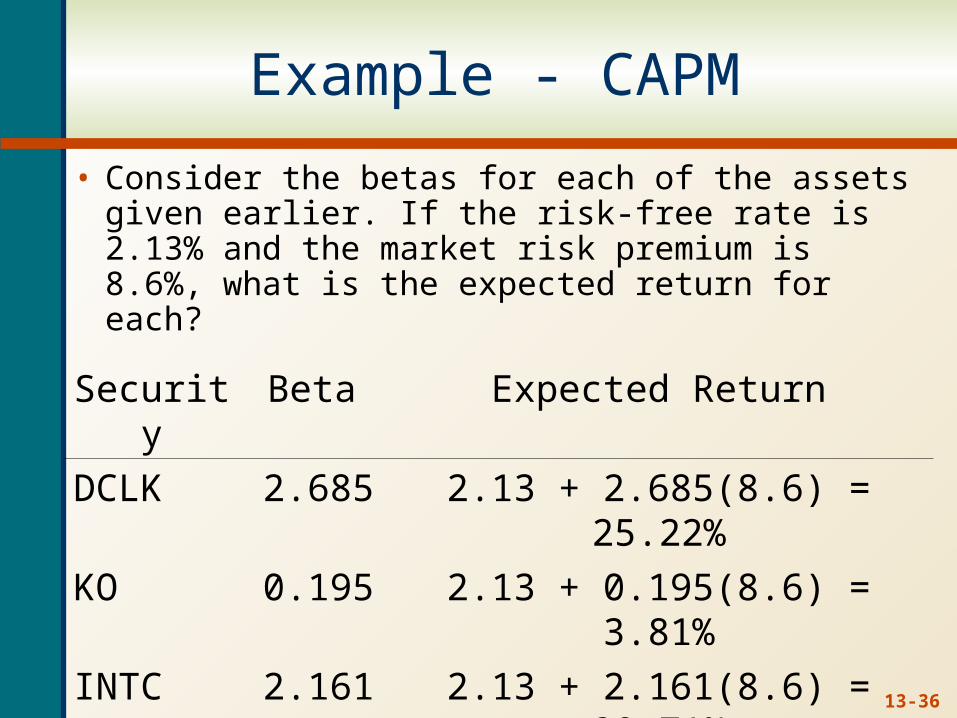
Example - CAPM
• Consider the betas for each of the assets given earlier. If the risk-free rate is 2.13% and the market risk premium is 8.6%, what is the expected return for each?
Security Beta Expected Return
DCLK 2.685 2.13 + 2.685(8.6) = 25.22%
KO 0.195 2.13 + 0.195(8.6) = 3.81%
INTC 2.161 2.13 + 2.161(8.6) = 20.71%
KEI 2.434 2.13 + 2.434(8.6) = 23.06%
13-37
Figure 13.4

Chapter
McGraw-Hill/Irwin Copyright © 2006 by The McGraw-Hill Companies, Inc. All rights reserved.
12
•End of Chapter•End of Chapter