Embed Size (px)
Citation preview
Return on Prevention:
An International Study –
Calculating the International
Return on Prevention
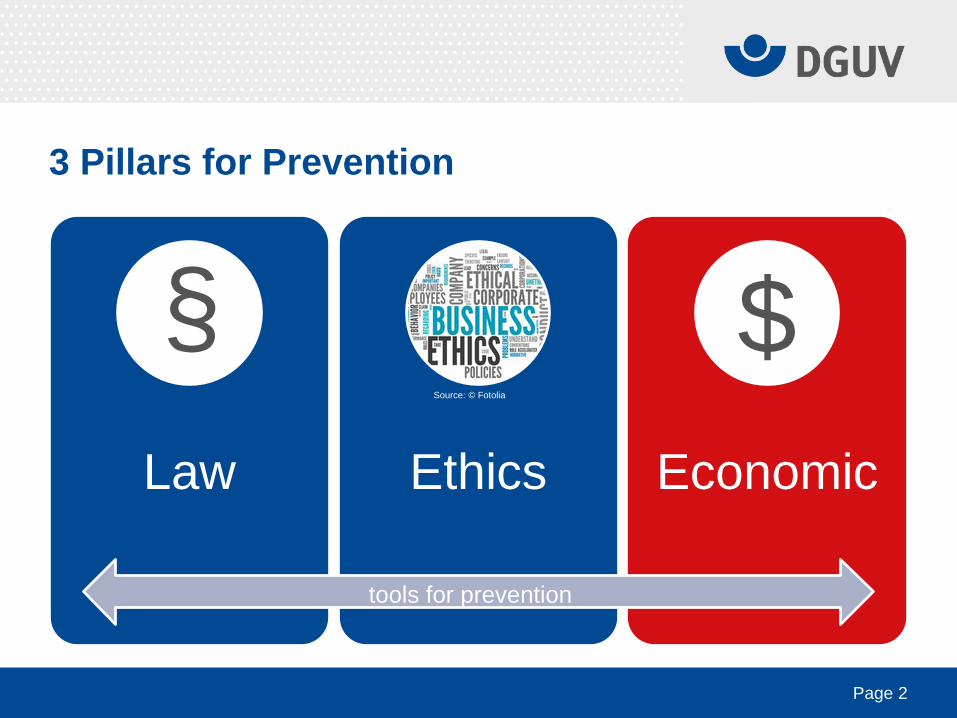
3 Pillars for Prevention
Law Ethics Economic
Page 2
$ §
tools for prevention
Source: © Fotolia

Partner
Page 3
Page 4
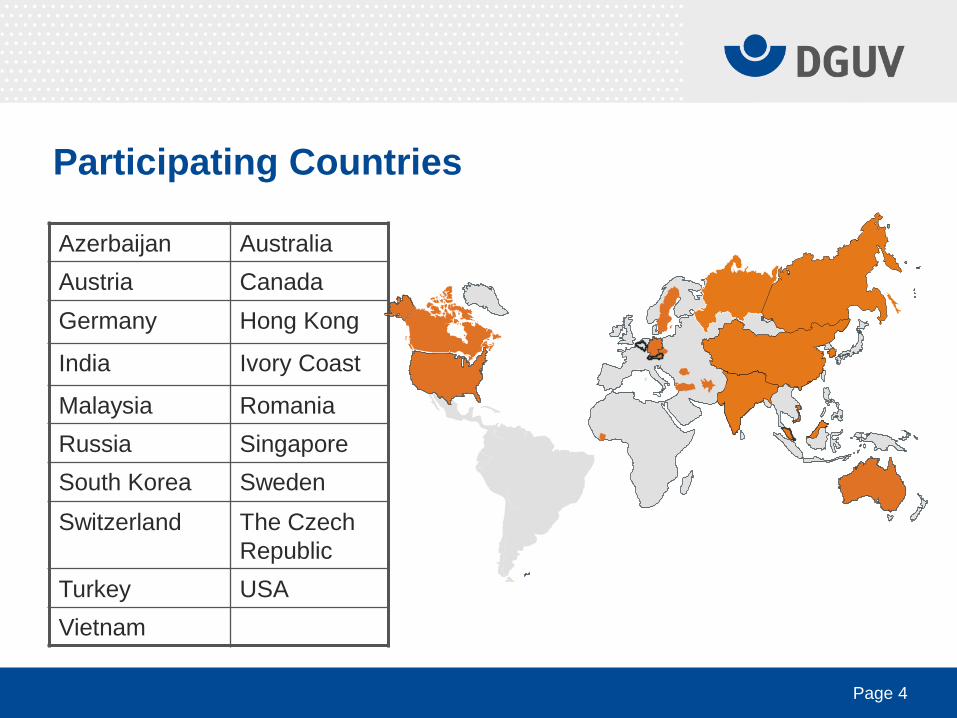
Participating Countries
Azerbaijan Australia
Austria Canada
Germany Hong Kong
India Ivory Coast
Malaysia Romania
Russia Singapore
South Korea Sweden
Switzerland The Czech
Republic
Turkey USA
Vietnam
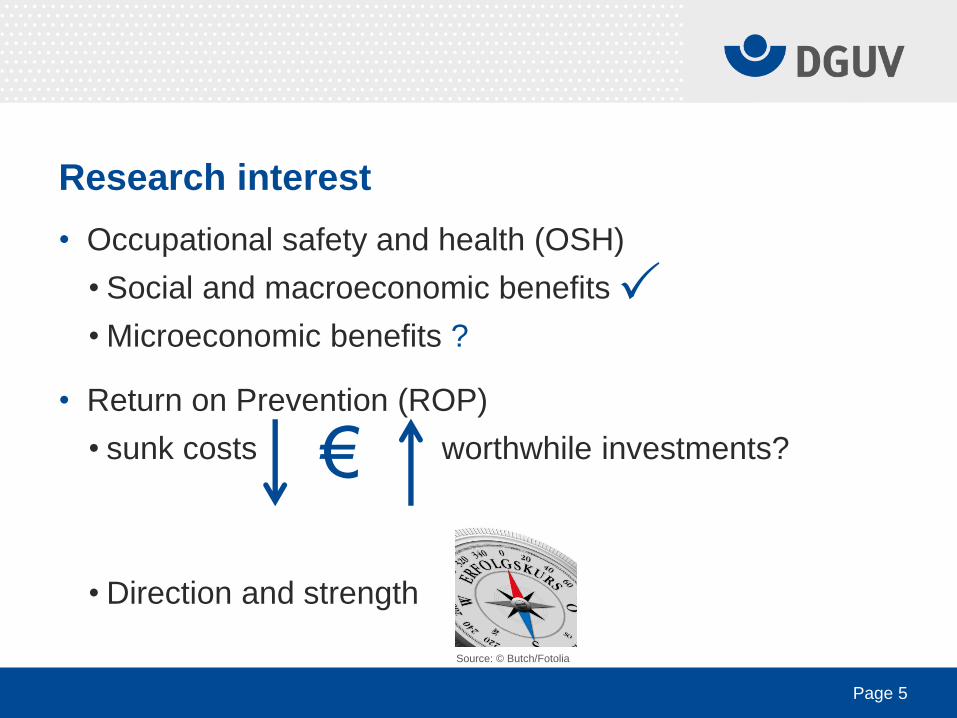
Research interest
• Occupational safety and health (OSH)
• Social and macroeconomic benefits
• Microeconomic benefits ?
• Return on Prevention (ROP)
• sunk costs worthwhile investments?
• Direction and strength
Page 5
€
Source: © Butch/Fotolia

Concept
Page 6
Bild Interview einfügen
Source: © IAG
• National coordinators
• Training
• Data statistically analysed
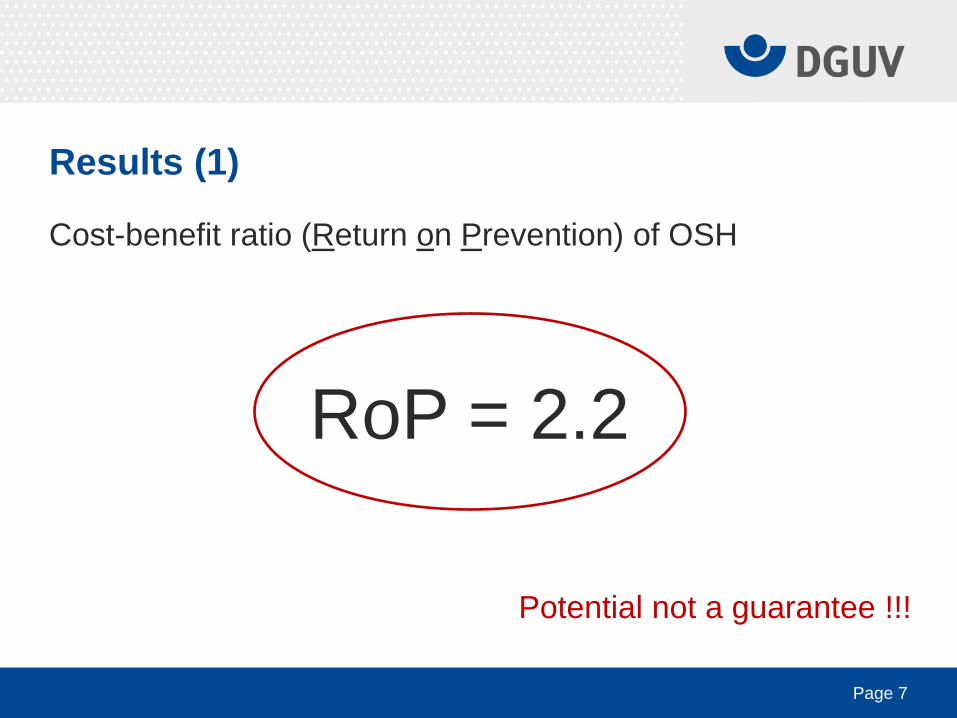
Results (1)
Cost-benefit ratio (Return on Prevention) of OSH
Page 7
RoP = 2.2
Potential not a guarantee !!!
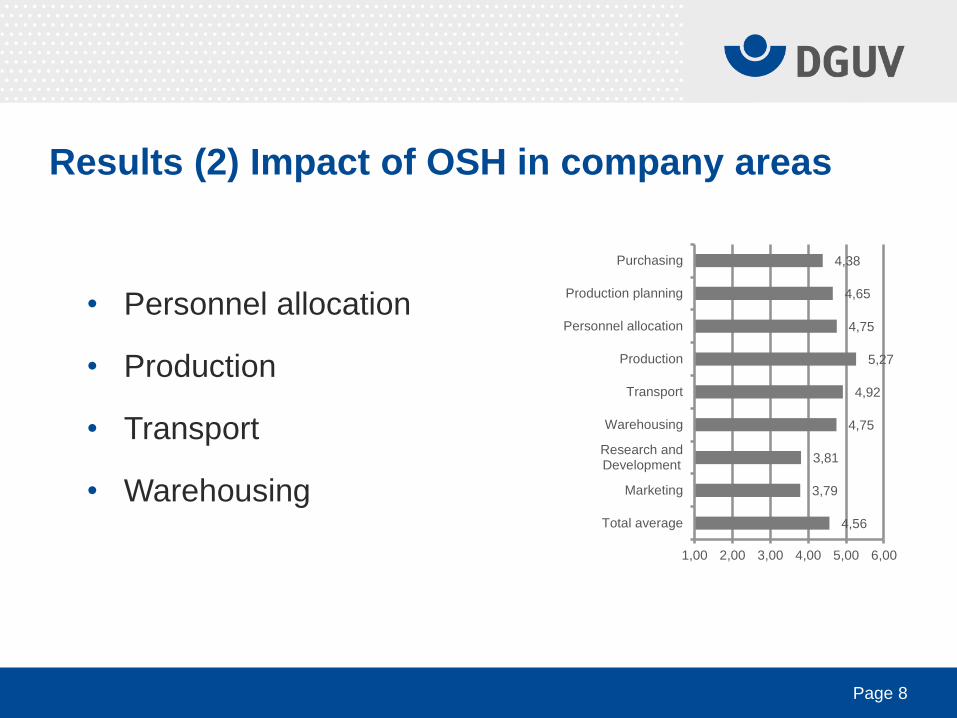
Results (2) Impact of OSH in company areas
4,38
4,65
4,75
5,27
4,92
4,75
3,81
3,79
4,56
1,00 2,00 3,00 4,00 5,00 6,00
Purchasing
Production planning
Personnel allocation
Production
Transport
Warehousing
Research andDevelopment
Marketing
Total average
Page 8
• Personnel allocation
• Production
• Transport
• Warehousing
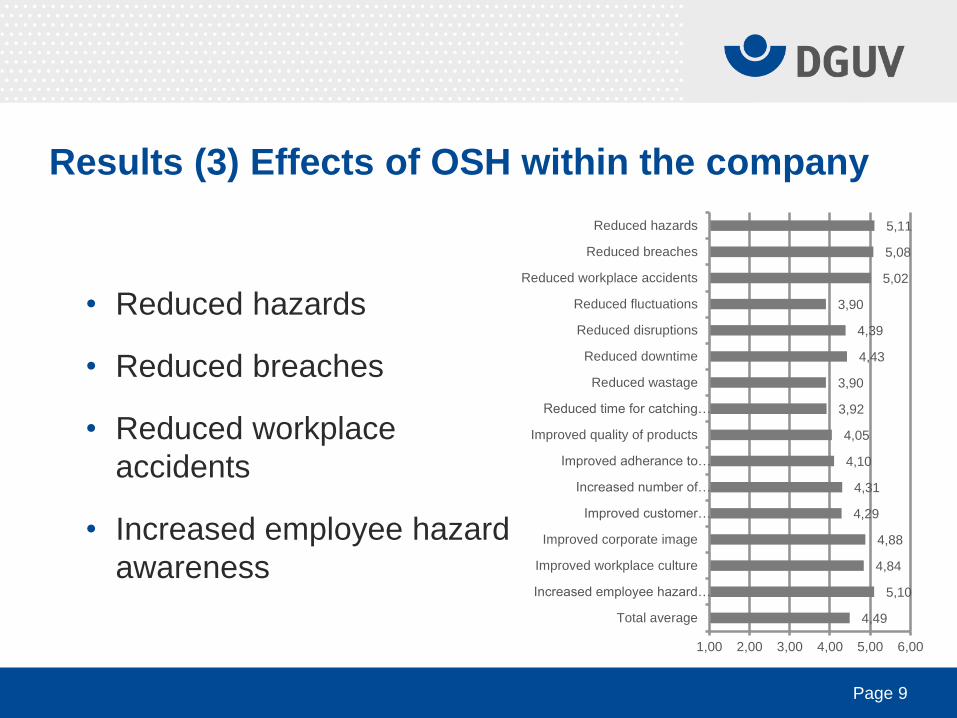
Results (3) Effects of OSH within the company
5,11
5,08
5,02
3,90
4,39
4,43
3,90
3,92
4,05
4,10
4,31
4,29
4,88
4,84
5,10
4,49
1,00 2,00 3,00 4,00 5,00 6,00
Reduced hazards
Reduced breaches
Reduced workplace accidents
Reduced fluctuations
Reduced disruptions
Reduced downtime
Reduced wastage
Reduced time for catching…
Improved quality of products
Improved adherance to…
Increased number of…
Improved customer…
Improved corporate image
Improved workplace culture
Increased employee hazard…
Total average
Page 9
• Reduced hazards
• Reduced breaches
• Reduced workplace
accidents
• Increased employee hazard
awareness
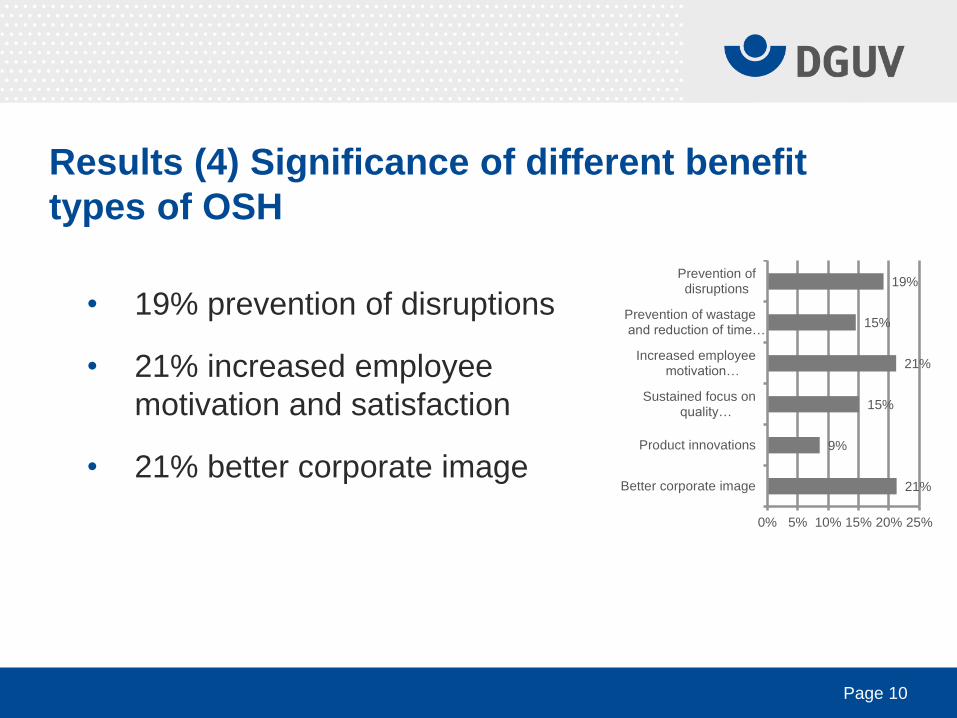
Results (4) Significance of different benefit
types of OSH
19%
15%
21%
15%
9%
21%
0% 5% 10% 15% 20% 25%
Prevention ofdisruptions
Prevention of wastageand reduction of time…
Increased employeemotivation…
Sustained focus onquality…
Product innovations
Better corporate image
Page 10
• 19% prevention of disruptions
• 21% increased employee
motivation and satisfaction
• 21% better corporate image
Results (5)
Further data analysis
• Large companies tended to rate the effect of OSH as
higher than smaller companies
• Asian companies tended to rate the impact/effect of
OSH as higher than companies in Europe
• ≈ 75% companies => additional investment in OSH
costs will be the same or decrease over the long term
Page 11
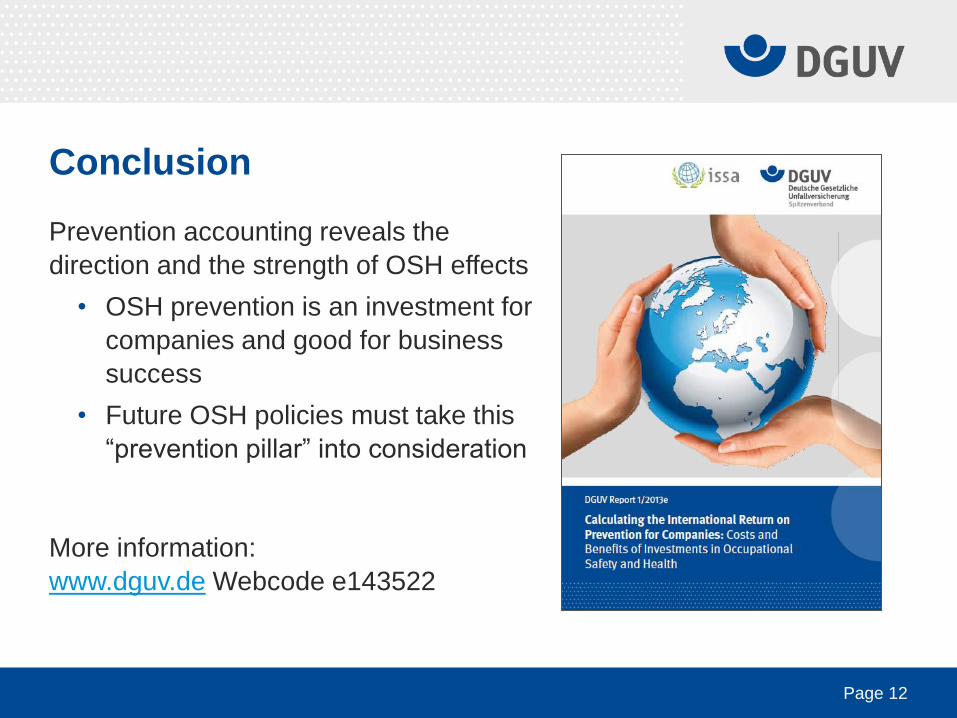
Conclusion
Prevention accounting reveals the
direction and the strength of OSH effects
• OSH prevention is an investment for
companies and good for business
success
• Future OSH policies must take this
“prevention pillar” into consideration
More information:
www.dguv.de Webcode e143522
Page 12
Return on Prevention:
An International Study
![Nitration of 5,11-dihydroindolo[3,2-b]carbazoles and synthetic applications of … · 2017-07-14 · Nitration of 5,11-dihydroindolo[3,2-b]carbazoles and synthetic applications of](https://img.pdfslide.us/doc/110x75/5e40160fbf6684163658d52d/nitration-of-511-dihydroindolo32-bcarbazoles-and-synthetic-applications-of-2017-07-14.jpg)