Embed Size (px)
Citation preview

Return on Investment in Information Technology
in the South African Post Office
A Research Report
presented to the
Graduate School of Business Leadership
University of South Africa
In partial fulfilment of the
requirements for the
MASTERS DEGREE IN BUSINESS LEADERSHIP
UNIVERSITY OF SOUTH AFRICA
by
SG GAYBBA
30 November 2006

Gaybba SG 7050 918 2
ii
Abstract
The South African Post Office is investing large amounts of money in IT.
Organisations were encouraged by the notion that investing in IT correlates
with higher returns and the delivery of expected results by replacing the
human component in organisations. The employment of IT within business
has often resulted in the replacement of old problems with new and the
expected business benefits of IT not realised.
The primary research objective was to determine the relationship between IT
expenditure and the financial performance of a firm. The secondary research
objective was to explore the perceived value of IT investment in SAPO.
The study followed an exploratory case study approach. In addressing the
primary research objective, statistical techniques were employed to determine
the relationship between IT expenditure and the financial performance of the
firm. The secondary research objective was addressed using survey research
to explore the perceived value of IT investment amongst a sample of
management within SAPO.
Results indicated that a significant positive relationship existed between IT
expenditure and net profit at a lag of around six to eight months. This
suggests that IT expenditure does in fact have a positive effect on the
financial performance of the SAPO, but as was found in similar other studies,
only after a time period.
The findings suggested that IT is considered a strategic and tactical
component within SAPO and therefore a necessary business expense. It is
also perceived by the majority to be efficient. However, the findings also
suggested that respondents were not convinced that IT is able to increase
sales, reduce cost or meet customer requirements.
In the light of the above, it is recommended that the value of IT, both on a
financial basis and perceived basis, be measured regularly. It should be

Gaybba SG 7050 918 2
iii
incorporated into review reports such as the Balanced Scorecard, to ensure
that personnel and management takes cognisance of IT expenditure and that
real effort should be made to evaluate its effect on the business at all levels.

Gaybba SG 7050 918 2
iv
Acknowledgements
This report is dedicated to my wife Rietha, sons Zander (10) and Waldo (8)
and the South African Post Office with my sincere thanks and appreciation.
I certify that, except as noted above, the report is my own work and all
references used are accurately reported.
SG Gaybba

Gaybba SG 7050 918 2
v
Table of contents
Abstract ................................................................................................................... ii
Acknowledgements ................................................................................................ iv
List of figures ........................................................................................................ vii
List of tables ......................................................................................................... viii
CHAPTER 1: ORIENTATION ................................................................................... 1
1.1 Introduction .................................................................................................. 1
1.2 Objectives of the study ................................................................................ 2
1.3 Scope of the study ....................................................................................... 2
1.4 Importance of the study .............................................................................. 2
1.5 Study environment ...................................................................................... 5
1.6 Clarification of concepts ............................................................................. 5
1.7 Outline of the research report ..................................................................... 6
CHAPTER 2: THEORETICAL FOUNDATION OF THE STUDY .............................. 7
2.1 Introduction .................................................................................................. 7
2.2 Finding suitable proxies for measuring ROI .............................................. 8
2.2.1 Financial perspective................................................................................... 9
2.2.2 Perceived value of IT investments ............................................................ 11
2.3 Sampling .................................................................................................... 13
2.4 Summary .................................................................................................... 13
CHAPTER 3: LITERATURE REVIEW .................................................................... 15
3.1 Introduction ................................................................................................ 15
3.2 The productivity paradox .......................................................................... 16
3.3 The relationship between IT investment and firm performance ............. 18
3.3.1 IT investment has a lagged effect ............................................................. 18
3.3.2 IT acts as a catalyst in an organisation .................................................... 22
3.3.3 There is no relationship between IT investment and ROI ....................... 24
3.4 Difficulty in measuring the value of IT and ROI ....................................... 26
3.5 Models and methods proposed to measure and track IT value .............. 28
3.5.1 IT Contribution Model ................................................................................ 29
3.5.2 The Balanced Scorecard ........................................................................... 31
3.5.3 Beyond Budgeting ..................................................................................... 34
3.5.4 Shareholder Value Analysis ...................................................................... 37
3.6 Summary .................................................................................................... 38

Gaybba SG 7050 918 2
vi
CHAPTER 4: PROBLEM STATEMENT AND HYPOTHESES ............................... 40
4.1 Introduction ................................................................................................ 40
4.2 Problem statement ..................................................................................... 40
4.2.1 .... Relationship between IT expenditure and the financial performance of a
firm ......................................................................................................................... 41
4.2.2 Perceived value of IT investment in a firm ............................................... 41
4.3 Summary .................................................................................................... 42
CHAPTER 5: RESEARCH DESIGN AND ANALYSIS ........................................... 44
5.1 Introduction ................................................................................................ 44
5.2 Research design ........................................................................................ 44
5.3 Sample ........................................................................................................ 44
5.4 Survey instrument ..................................................................................... 46
5.5 Data analysis .............................................................................................. 47
5.6 Limitations of the study ............................................................................. 48
5.7 Summary .................................................................................................... 49
CHAPTER 6: RESULTS ......................................................................................... 50
6.1 Introduction ................................................................................................ 50
6.2 The relationship between IT expenditure and financial performance .... 50
6.3 Perceived value of IT investment .............................................................. 56
6.4 Summary .................................................................................................... 59
CHAPTER 7: DISCUSSION, CONCLUSION AND RECOMMENDATIONS ........... 60
7.1 Introduction ................................................................................................ 60
7.2 Outcome of results of hypotheses ........................................................... 61
7.2.1 Relationship between IT expenditure and financial performance .......... 61
7.2.2 Perceived value of IT investment .............................................................. 61
7.3 Conclusions ............................................................................................... 62
7.4 Recommendations ..................................................................................... 63
ARTICLE ................................................................................................................ 64
BIBLIOGRAPHY & REFERENCES ........................................................................ 81
ANNEXURE A: FINANCIAL DATA ........................................................................ 85
ANNEXURE B: CROSS CORRELATION FUNCTION ............................................ 86
ANNEXURE C: SURVEY QUESTIONNAIRE ......................................................... 87
ANNEXURE D: SURVEY RESULTS ...................................................................... 89

Gaybba SG 7050 918 2
vii
List of figures
Figure 2.1: The Return-on-investment scenario (RMS, 2002) ............................. 10
Figure 3.1: Porter’s generic value chain (Porter, 1985) ...................................... 22
Figure 3.2: The IT Contribution Model (Epstein & Rejc, 2005) ........................... 30
Figure 6.1: Selective financial results for SAPO April 2002 to March 2006 ....... 51
Figure 6.2: Relationship between net profit and operating revenue .................. 52
Figure 6.3: Relationship between net profit and operating expenditure ........... 53
Figure 6.4: Relationship between net profit and IT operating expenditure ....... 54
Figure 6.5: Cross-correlation between net profit and IT operating expenditure 55
Figure 6.6: Predominant view of IT by senior management (n = 50) ................. 56
Figure 6.7: Use of IT within SAPO (n = 50) .......................................................... 57
Figure 6.8: Effectiveness of IT (n = 50) ................................................................ 57
Figure 6.9: Risks in IT investments (n = 50) ........................................................ 58

Gaybba SG 7050 918 2
viii
List of tables
Table 6.1: Agreement with statements about the perceived value of IT ............ 58

Gaybba SG 7050 918 2
1
CHAPTER 1: ORIENTATION
1.1 Introduction
The South African Post Office with turnover of more than four billion rand and
assets worth more than three billion recorded their first operating profit during
the 2003/4 financial year (SAPO, 2004). Since then, their operating profit has
increased marginally during 2004/5 and 2005/6.
According to the South African Post Office’s five year strategic plan that was
published in 2004, they have set a very ambitious operating profit target of
one billion rand to be reached by the 2009/10 financial year. For 2005/6 the
operating profit was reported to be R270,3 million (SAPO, 2006). This would
be a remarkable achievement when viewed from the world wide phenomena
that the traditional postal industry shows trends of a decline (SAPO, 2005).
In essence, the delivery of letters and parcels can be viewed as written
communication delivered manually and any electronic substitution will have a
direct impact on the South African Post Office letter volumes and subsequent
revenue. The evolution of information technology therefore has a profound
impact on the South African Post Office as a threat to decreasing traditional
postal revenue. However, it is also seen as an enabler to introduce new
products and services into the market.
SAPO, as with every other high ranking organisation in South Africa has
undergone a process of reform in the past few years. It has readdressed the
historical operational and service imbalances, while improving the scope,
scale and quality of service. It had significantly reduced and ultimately
eliminated cost and service inefficiencies and repositioned the postal service
to benefit from the growth in the overall communications world-wide. This was
done by also investing in information technology to meet the challenges of the
economy and their customers.

Gaybba SG 7050 918 2
2
This chapter will highlight the purpose of the research and problem statement.
The research objectives will be stated and the importance of the study noted.
1.2 Objectives of the study
The primary research objective was to determine the relationship between IT
expenditure and the financial performance of a firm.
The above research objective was supported by a secondary research
objective. The objective was:
• To explore the perceived value of IT investment in a company.
The study followed an exploratory case study approach, focusing on data
gathered from the South African Post Office.
1.3 Scope of the study
Based on the case study of the South African Post Office, the research
determined the relationship between IT expenditure and the perceived
returns.
1.4 Importance of the study
When computers were first introduced to organisations, they carried lots of
promise for the immediate achievement of results. Organisations started
investing in Information Technology (IT) with an insight that this would provide
a solution to all their organisational problems. Brynjollfsson (1993, 1994) and
Strassmann (1990) showed that computers carried a lot of promise.
Organisations were encouraged by the notion that investing in IT correlates
with higher returns and the delivery of expected results by replacing the
human component in organisations. Marketers continuously sell new and

Gaybba SG 7050 918 2
3
emerging technological solutions to organisations, thereby pressurising them
to invest into IT.
Guerreiro and Serrano, (2006) noted that firms invest in IT in order to improve
their economic performance and increase their net worth. IT can improve
information sharing, decision-making, coordination, product quality,
responsiveness and distribution (Al-Mudimigh 2001; Shin 2001) as well as to
differentiate their products, reduce the cost of their products or services,
provide innovative products or services, support growth, or form alliances with
suppliers and customers. IT is often designed to support and improve
medium to long-term business, based on a variety of corporate goals. The
employment of IT within business has often resulted in the replacement of old
problems with new and the expected business benefits of IT not realised.
Despite increasing expenditure on IT, productivity has not increased and this
has given rise to a productivity paradox (Love & Zahir, 2004).
For most of the past half-century, organisations have been increasing their
investments in IT, primarily because of the belief that IT has a significant
impact on organisational performance (Osey-Bryson & Ko, 2004). The initial
enthusiasm for IT during the 1970 and 1980 has long since been overtaken by
a sense of pragmatism. Management now seeks more concrete evidence of
the business and the real value of their often extensive IT investments
(Serafeimidis & Smithson, 2000). Despite massive investment in IT by both
the public and private sectors, there seems to be an apparent lack of evidence
concerning the impact on productivity and business performance of such
investments. During the past decade a great deal of attention has focused on
the impact of IT investment. However studies have frequently generated
controversial or inconsistent results. Success stories give impressive
examples of the effects of investment in IT on a firm’s performance and
competitive advantage, and therefore, become one of the key areas in
organisational investment strategies. At the same time, several empirical
studies have failed to find any positive relationships between extensive use of
IT and organisational efficiency, performance and success (Guerreiro &
Serrano, 2006). At firm, industry and economy level there is contradictory

Gaybba SG 7050 918 2
4
evidence on whether IT expenditure has resulted in business value. The
statistical uncertainty adds substance to a continuing business worry about
how the value of IT expenditure can be measured. Although it is important
that a firm should invest in IT and the competitive advantages from superior IT
investments be widely recognised (Brynjolfsson & Hitt, 1998), some research
(Harris & Katz, 1989) has shown that it is unlikely that higher expenditures on
IT alone will ensure a firm’s superior performance and actual returns received
on IT investments vary widely (Brynjolfsson & Hitt, 1998). It is opined that the
greatest benefits of IT appear to be realised by organisations when IT
investment is coupled with other complementary investments, such as
organisational reengineering, restructuring and redesign (Lee & Bose, 2002).
IT investments may not automatically improve financial performance; instead,
it is one essential tool, but needs to be coupled with organisational factors
such as business strategies to be truly effective (Shin, 2001).
Brynjollfsson (1993; 1994); and Strassmann (1990) revealed in their studies,
the following reasons why organisations invested in IT:
• a need to create wealth;
• with the idea to improve output levels in production;
• to benefit by producing quality products;
• to improve service delivery;
• to control communication activities;
• with the expectation to achieve customer satisfaction.
Organisations also expected IT would assist in the production of products with
a high level of speed and responsiveness. Firms expected to benefit from IT
by improving efficiency through gaining competitive advantage over their
competitors and increasing profits in organisations. They aimed to improve
the quality of life of the information worker by enabling them to share
information and knowledge and that IT would improve workers’ performance.
They also thought IT would enable workers to manage their work effortlessly
by saving time. Managers invested in IT with expectations that it would
facilitate their decision making processes.

Gaybba SG 7050 918 2
5
Today’s IT industry challenges to assist organisations to survive the global
economy competition and the information and knowledge-driven society. The
emergence of the internet, sophisticated IT tools, and communication
solutions influence managers’ perceptions towards IT as a solution.
Organisational expectations are being met through the changes that IT brings
towards improving organisational processes, and the way workers fulfil their
daily tasks. Information technology enables knowledge sharing, collaboration,
and supports management processes. IT allows for communication on
projects at any time and any place. New and emerging technology helps in
preserving the knowledge and information generated in organisations, and
delivers expected results although there are still some challenges or pitfalls
with such tools.
1.5 Study environment
The study follows an exploratory case study approach, focusing on data
gathered from the SAPO.
1.6 Clarification of concepts
Balanced scorecard – A frame work for setting and monitoring business
performance. Metrics are structured according to customer issues, internal
efficiency measures, financial measures and innovations.
Competitive advantage – In order to survive or expand, organizations must
seek to gain dominance over their competitors in the market place. This can
be achieved by using a variety of strategies to gain control of a market or
prevent others from gaining control.
Cost of ownership – The cost of ownership describes a range of different
expenses incurred by purchasing and maintaining a computer system. Such

Gaybba SG 7050 918 2
6
costs include the original cost of the hardware and software, upgrades,
maintenance, technical support and training.
Information technology - refers to the technology whereas Information
Systems refer to technology as well as how it is applied and managed to
contribute to business.
1.7 Outline of the research report
Chapter 1 served to orientate the reader. The concept of IT investment was
noted, the objectives of the research were stated and the importance of the
study defended. Chapter 2 focuses on the theoretical foundation of the study.
In chapter 3 prior theory and literature were discussed that has guided the
researcher in understanding the salient issues of this study. In chapter 4 the
research problem is formulated. The research methodology that was followed
in this study is spelled out in chapter 5. Chapter 6 depicts the results from the
research conducted. Chapter 7 provides a discussion of the results,
conclusion and recommendations.

Gaybba SG 7050 918 2
7
CHAPTER 2: THEORETICAL FOUNDATION
OF THE STUDY
2.1 Introduction
The use of Information Technology (IT) has since the beginning been targeted
for evaluation whether it pays off or not. The research entered a new phase in
the 1980s. This was mainly initiated with a statement from Solow (1987) as
cited by Loveman (1994), that IT investments were not giving a return to its
investors. This sparked further research and many jumped on the new hot
topic. Many researchers were following different approaches to investigate
and research around this area, some agreeing to what Solow stated
(Loveman 1994), and some not (Brynjolfsson, 1993; Brynjolfsson & Hitt 1996,
1998 & 2003). These different views are supported by Kohli and Devaraj
(2003) that noted in their study that payoff from IT has generated interest and
debate from both academics and practitioners. Various studies have found
mixed results when having investigated the relationship between investment
in IT and firm performance (Goh & Kauffman, 2005). From the many
empirical studies, there are probably as many different viewpoints and
findings to whether investing in IT is good or not. The one thing most
researchers agree with is that the outcomes of investments in IT are difficult to
measure.
Today's economic climate has forced the control of IT investments into
becoming a necessary and vital part of business behaviour. IT managers are
no longer able to approve large expenditure without a strong commercial
business case showing a high return on investment (ROI). Another factor
driving a commercial focus amongst IT managers are statistics that show that
a very high percentage of IT projects fail to deliver a ROI over an acceptable
time frame. The business environment is now dominated by prudent
investment decisions and recessionary attitudes. It is common practice that
organisations firstly consider the returns or value outcomes before making any
IT investments.

Gaybba SG 7050 918 2
8
Traditionally however when IT professionals and top-management discuss the
return of an IT investment, they mostly think of the financial benefits. Today,
business leaders and technologists also consider the non-financial benefits of
IT investments.
2.2 Finding suitable proxies for measuring ROI
Measuring the value of an investment is an inextricable part of business
planning. A Return on Investment (ROI) calculation is only a small part of the
total value of an investment. It is an internally focused metric giving a dollar
value only. An ROI calculation for a particular investment may, in fact, be
negative, but the intangible benefits such as customer satisfaction and easy
access to information, may justify the expense. ROI is an important metric,
but it needs to be balanced with a rigorous analysis of all the value factors in
an organisation.
IT’s value is determined by the relationship between what the organisation will
pay (costs) and what it will get back (financial and non-financial benefits). The
larger the benefit in relation to cost, the greater the value of the IT project.
This suggests by implication that the value or returns on investments need to
be calculated. A review of the literature by Kohli and Devaraj (2003) cites
inadequate sample size, lack of process orientation, and analysis methods
amongst the reasons studies have shown mixed results in establishing a
relationship between IT investment and firm performance. Another aspect
noted in the literature relates to the absence of a proper way to measure IT's
value-creating role and evaluate the payoffs of IT investments (Epstein &
Rejc, 2005). They also noted that even approaches such as the Balanced
Scorecard and shareholder value analysis, which do provide frameworks for
analysis and management, were insufficient in measuring the value of IT.

Gaybba SG 7050 918 2
9
2.2.1 Financial perspective
Westerlind (2004) noted that return on investment is often used in order to
calculate whether an investment is paying off or not. If the value that appears
from the calculations is negative the investment is undesirable and would use
more resources than it would produce. The returns are usually divided in
“hard-” or “soft returns”. Hard returns are easy to calculate, while there lies
more of a challenge to calculate soft returns. Soft returns are usually
intangible assets e.g. the effect of IT investment on the productivity of a firm.
Westerlind (2004) also postulated that Return on Investment indicator (ROI)
conveys gain (capital remuneration) against total investment as a ratio. The
Return of Investment indicator measures the productivity of an investment.
The latter affirmation can be explained and demonstrated by a detailing
process that starts from a company’s productivity concept.
A company’s productivity is the ratio between the total output and the total
inputs, the total inputs being the external resources and the internal resources
used by the company to make its activity work and the total output being the
value of the production. In everyday life it is easy to calculate the payback
period of an investment. When it comes to IT investments this is a factor that
will be measured in usually a time unit. Payback period is therefore a key
measurement of risk calculations; the shorter the period, the better. This
becomes important as technology changes rapidly.
When someone asks about return on investments (ROI), they are really
asking what they will get back for the money they have been asked to spend
or invest. ROI measures how effectively the firm uses its capital to generate
profit; the higher the ROI, the better.

Gaybba SG 7050 918 2
10
The figure below sketches this scenario.
Figure 2.1: The Return-on-investment scenario (RMS, 2002)
Cresswell (2004) noted that more than ever, decision makers must make the
most of scarce resources and at the same time respond to ever-increasing
demands for improved performance and new technology. These competing
demands generate close scrutiny of proposals for new information technology
(IT) investments.
Return on investment is a tool known to analysts as a very versatile and
simple method.
The ROI is dependant on five key points namely:
• life of project
• policy of capitalization
• rate of depreciation
• time lag in investment deployment of the projected cash flows
• rate of growth of the new investment
A meaningful return on investment (ROI) analysis in information technology is
an analysis based on different components. It is a collection of methods,
skills, tools, activities, and ideas. They can be combined and used in many
different ways to assess the relative value of an investment over time.
Applying this collection in a particular situation requires making many choices

Gaybba SG 7050 918 2
11
among the ideas and methods available and conducting an analysis
appropriate to the decision at hand. Different choices will produce different
results.
The choice of how to conduct the analysis should be based on four critical
principles pertaining to:
• the strategic objective(s) of the ROI analysis,
• the place (and importance) of the IT investment in the overall enterprise
architecture,
• the type of analysis that should be conducted (i.e., what data and
methods of analysis are best suited to those objectives)
• how the ROI analysis fits in the overall decision context for IT
investments.
Understanding the strategic objectives of an ROI analysis will determine how
the analysis is ultimately done and used. Choosing and using the various
methods of ROI analysis requires sound knowledge and judgment: knowledge
about the methods and judgment about how best to apply them.
2.2.2 Perceived value of IT investments
Traditional financial and accounting measures often fail to properly quantify
the business benefits of IT investments. According to Intel (2003), IT
investments are growing more complex, more strategic, and larger in scope.
At the same time, traditional financial and accounting measures often fail to
properly quantify the business benefits of those investments. This is
supported by the ROI forum (2006) stating that unlike financial returns, there
may be no widely accepted metrics that can be applied in measuring the
benefits of IT investment in a firm. However, IT’s potential for producing
positive impacts on business performance and mission results are undeniable.
The difficulty that most organisations encounter here is twofold: people aren’t
sure what to measure and they don’t know how to measure.

Gaybba SG 7050 918 2
12
Some IT projects provide indirect benefits to a company, such as improving IT
efficiency through optimised wide area network capacity while also delivering
a new IT business capability to employees at a reduced cost. Other projects
deliver direct benefits to a company by improving throughput, enhancing
productivity, and increasing revenues. These projects deliver business value
to the corporation but have no direct impact on the IT infrastructure.
Research conducted indicated various reasons for companies to invest in IT.
Sigala (2003) noted that many organisations have turned to information and
communication technologies as a way to cope with turbulent environments.
Hu and Plant (2001) postulated the attempt to secure a sustainable
competitive advantage as the driving force behind the large-scale investments
in information technology (IT) over the last three decades. This was
supported by Demirhan, Jacob and Raghunathan (2005) that investments in
information technology have become crucial for firms to improve the quality of
their products and services. It is clear that researchers and business
managers consider information technology investment as an enabler for
improved organisational efficiency and competitiveness (Kohli & Devaraj,
2003). According to a study by the Computer Science Corporation (2003) the
motivation for IT investment is driven by
• Increase efficiency
• Increase productivity
• Transaction efficiency
• Increase trade sales
• Cut purchase costs
Finally, decision-makers make IT project selection decisions based upon the
perceived value of the investment in part due to the difficulties and complexity
of calculating the exact pay-offs of investments in IT.

Gaybba SG 7050 918 2
13
2.3 Sampling
Another aspect that came under scrutiny during the earlier studies was the
issue of sample size and the variables taken into account for the analysis of
the data. In explaining the productivity paradox Brynjolfsson (1993) noted that
measurement errors contributed to this phenomena. There were obvious
problems in measuring and comparing IT investments owing to rapid price
and quality changes; and economic statistics generally fail to measure
qualitative improvements in the output of service industries (Gillin, 1994).
Simple bi-variate correlations between aggregate productivity and aggregate
IT capital stock did not take into account the impact of all variables which also
affect productivity. They were therefore likely to measure spurious effects
(Lehr & Lichtemberg, 1999) as cited by Brynjolfsson (1998)
Brynjolfsson (1998) noted that in the early 1990s new data became available
which allowed a re-examination of some of the previous results on IT
productivity. These data, for the first time, enabled researchers to look at the
IT investment behaviour and productivity of large numbers of firms rather than
focusing on higher level aggregates such as manufacturing industries or the
whole economy. This micro-level approach had a number of advantages.
While there is only one U.S. economy and only a few dozen manufacturing
industries, these data allowed analyses to be conducted on hundreds of firms
over several years. The increase in sample size enabled much more precise
estimates of IT’s contributions. Firm level data also enables the measurement
of at least some of the intangible value that was being created by computers
even if this value could not be directly observed. This was supported by
Oliner and Sichel (1994, 2000); Lehr and Lichtemberg (1999) and
Brynjolfsson and Hitt (1996) as noted by Brynjolfsson (1998).
2.4 Summary
This chapter explored the foundation of the study. Devaraj and Kohli (2002)
postulate that companies IT budgets are increasingly being squeezed and

Gaybba SG 7050 918 2
14
hacked away at with the same lack of understanding as they were senselessly
and wildly increased in the late 1990. The question is why is this happening?
Devaraj and Kohli (2003) argued that a lack in demonstrating the justification
of technology, companies will continue to spend their IT budgets on faith not
fact.
In large corporations information technology cuts across various departments,
whether operational, administrative or supporting functions. A change in one
of the information technology fields could most likely force changes in
software platforms, database administration, network configuration and
training for the new users as well as first line and maintenance support team.
The next chapter deals with the productivity paradox and the different
relationships that exist between IT investment and productivity and will
discuss the different actions and reactions of IT investment.

Gaybba SG 7050 918 2
15
CHAPTER 3: LITERATURE REVIEW
3.1 Introduction
When speaking to any financial manager in both small and large organisation
it is apparent that information technology has become a significant component
of new capital investment. Be it installing of new desktop computers, printers,
and software or incorporating enterprise resource planning (ERP) systems.
Brynjolfsson and Hitt (1998) noted that during the 1990's an important
question has been debated for almost a decade namely whether computers
contribute to productivity growth. Research conducted by Steven Roach, as
cited by Brynjolfsson and Hitt (1998), and published in 1987, found that the
amount of computing power per white-collar worker in the United States
service industry was growing dramatically over the 1970s and 1980s, yet the
measured productivity of this sector was flat. This drew the attention to the
so-called 'Productivity Paradox'.
The 'Productivity Paradox' created an increased awareness of the issue that
surround the questions: What value does information technology add to an
organisation (Hu & Plant, 2001). Since then numerous studies have been
conducted, investigating the relationship between IT investment and firm
performance.
In order to provide a structural layout of the chapter, section 3.2 provides a
brief review of the 'productivity paradox' and the most recent standings of
researchers towards this issue. Subsequent sections focus on the particular
findings of researchers towards investigating the relationship between IT
investment and firm performance. From these, various research questions
and hypotheses emerge, which form the foundation of this research study.

Gaybba SG 7050 918 2
16
3.2 The productivity paradox
The 'productivity paradox' phrase was coined when large investments in
information technology (IT) apparently failed to produce significant increases
in productivity on two levels. The first was at the industry or economy-wide
level and the second was observed at company level (Lim, Richardson &
Roberts, 2004).
Ryan (1999) asked the question do IT investments contribute to productivity
growth. He noted that early research into the subject had pointed out a
paradox that despite the spending of large amounts by firms during the 1990s,
the productivity benefits were patchy. Early research tended to focus on the
services sector, where IT spending in the 1980s generated minimal annual
growth in productivity. IT spending by firms in the 1980s amounted to about
one percent of revenues, a figure insufficiently large to materially impact
productivity. At the centre of the paradox is the fact that productivity appeared
to start slowing in the early 1970s, coinciding with the oil crises and,
surprisingly, the widespread use of IT.
Attention was first drawn to the productivity paradox in 1987 by Steven Roach,
who demonstrated that while the amount of computing power per white collar
worker in the services sector had grown dramatically over the 1970s and
1980s, measured productivity of the sector remained flat (Ryan, 1999).
Researchers conducted various studies and searched for a link between
productivity growth and computer investment in manufacturing industries.
From an economy-wide level perspective, the conventional wisdom was by
the late 1980s that IT was not contributing significantly to productivity
(Brynjolfsson & Hitt, 1998). Lim, Richardson and Roberts (2004) noted that
this view was also supported by findings from researchers such as Landauer
(1995), Loveman (1994), Mahmood (1993), Weill (1992), Roach (1987) and
Solow (1987). Brynjolfsson and Hitt (1998) remarked that a few studies did
find positive effects on intermediate factors such as cost efficiency or market
share, but it was difficult to tie these benefits to the bottom line. While early
research found little evidence of a relationship between IT and productivity,

Gaybba SG 7050 918 2
17
there was also little evidence that computers were unproductive, argued
Brynjolfsson and Hitt (1998). Most productivity measures are oriented around
numbers. Such measures of productivity are severely limiting and not the sole
reason for purchasing IT. Proof of this is the fact that most managers rate
customer service and quality above cost savings as the prime motivation for
IT investment. Productivity growth, argued Brynjolfsson and Hitt (1998), does
not come from working harder, as this increases labour input, but rather from
working smarter. In effect this means adopting new technologies and
techniques for production. Ryan (1999) postulated that these early research
into the subject of IT and productivity was skewed by the use of economy-
wide data, and the use of flawed data for several services sectors, making it
appear that computers had done little to boost productivity. Earlier research
conducted in the 1990's which focussed on the company- or firm-level, also
lacked evidence and supported the productivity paradox as there was a failure
of IT to produce significant increases in productivity despite large IT costs
incurred by organisations when they adopt IT. Research conducted by
Strassman (2004) found that there was no correlation between expenditure for
information technologies and any know measures for profitability (Lim,
Richardson & Roberts, 2004).
However, more recent studies conducted in 2000's showed that there are
positive payoffs from IT and have changed their position from doubts about
payoffs to when and why there are payoffs. Results of these later IT
investment studies showed a positive correlation between IT investment and
firm performance (Lim, Richardson & Roberts, 2004).
Productivity is a simple concept. It is the amount of output produced per unit
of input. While it is easy to define, it is notoriously difficult to measure,
especially in the modern economy (Brynjolfsson & Hitt, 1998). In particular,
there are two aspects of productivity that have increasingly defied precise
measurement: output and input. Properly measured, output should include
not just the number of widgets coming out of a factory, or the lines of code
produced by a programming team, but rather the value created for
consumers. In today's economy, value depends increasingly on product

Gaybba SG 7050 918 2
18
quality, timeliness, customisation, convenience, variety and other intangibles.
Similarly, a proper measure of inputs includes not only labour hours, but also
the quantity and quality of capital equipment used, materials and other
resources consumed, worker training and education, even the amount of
'organisational capital' required, such as supplier relationship cultivated and
investments in new business processes.
3.3 The relationship between IT investment and firm performance
“Better information technology (IT) makes a quantifiable, positive difference in
business performance.” That was the core finding of a research study from
Keystone Strategy, Inc. (2006). This section will explore the literature
regarding IT investment and a possible lagged effect; IT as a catalyst in an
organisation; and the non-relationship between IT investment and ROI.
3.3.1 IT investment has a lagged effect
Mann and Mahmood (2000) noted that some studies of relationships between
investment in IT and organisational performance and productivity (Alpar &
Kim, 1990; Brynjolfsson, 1993; Brynjolfsson & Hitt, 1996; Mahmood & Mann,
1993; Mitra & Chaya, 1996; Rai, Patnayakuni; & Patnayakuni, 1997) have
reported positive and significant effects of such investment. Some
researchers question these results on the grounds that the studies involved
examination of primarily cross-sectional data. This criticism stems at least in
part from the premise that the benefits of IT investment can be realised only
over longer periods of time. It is possible that in many instances IT has the
potential to provide important benefits within the same year the investment is
made. Research reflecting relationships between IT investment and
organisational performance and productivity might be more convincing if it
were based on IT investment in both current and earlier periods. Although
some researchers (Brynjolfsson, 1993; Loveman, 1994; Osterman, 1986)
have speculated on the lagged effects of IT investment, there have so far
been no empirical studies, with the exception of one reported in a conference

Gaybba SG 7050 918 2
19
(Mahmood, Mann, Dubrow & Skidmore, 1998), that have demonstrated a
relationship between such investment and organisational performance and
productivity in subsequent periods.
Another reason for disagreement among researchers involves the argument
that correlations reflecting relationships between IT investment and
organisational performance and productivity do not necessarily imply
causation, particularly if the correlations are based on data from the same
year only (Mitra & Chaya, 1996). It has also been emphasised that causality
cannot be established by using conventional statistical techniques. Mahmood
and Mann (2000) also encouraged researchers to apply multivariate and non-
parametric methods, as opposed to more commonly used methods such as
correlation and regression analyses, to enable them to infer causality, if
present, between IT investment and organisational performance and
productivity.
It has been argued that traditional IT investment-performance analyses have
not been very successful in the past because of their over reliance on financial
data. Some researchers (Brynjolfsson & Hitt, 1996) have called for additional
research to identify the hidden costs and benefits that are typically not
included in a traditional analysis of IT investment relationships with
organisational performance and productivity.
According to Brynjolfsson and Yang (1999) another explanation for the
paradox is that the benefits from information technology can take several
years to appear on the bottom line. The idea that new technologies may have
a delayed impact is a common one in business. A survey of executives
suggested that many expected it to take as long as five years for information
technology investments to pay off (Nolan & Norton, 1988). This accords with
an econometric study by Brynjolfsson (1991) which found lags of two to four
years before the strongest organisational impacts of information technology
were felt. Loveman (1994) also found slightly higher, albeit still very low,
productivity when small lags were introduced.

Gaybba SG 7050 918 2
20
Goh and Kauffman (2005) noted that the existence of lags has some basis in
theory. They stated that returns from IT investments are not instantaneous
and therefore cannot be measured based on a direct relationship. They also
cited Curley and Pyburn, (1982) and Scherer (1980) that postulated the
unusual complexity and novelty of IT may result that firms and individual users
require some experience before becoming proficient. According to dynamic
models of learning-by-using, the optimal investment strategy sets short term
marginal costs greater than short-term marginal benefits. This allows the firm
to ride the learning curve and reap benefits analogous to economies of scale.
If only short-term costs and benefits are measured, then the investment might
appear inefficient. Viewed in this framework, there is nothing irrational about
the experimentation phase firms are said to experience in which rigorous cost
or benefit analysis is not undertaken. Future information technology
investments tend to be large relative to current investments, therefore the
learning effect could be quite substantial. A similar pattern of costs and
benefits is predicted by an emerging literature that treats investments in
information technology as options, with short term costs, but with the potential
for long-term benefits (Kambil, 1991; Dixit & Pindyck, 1995). Goh and
Kauffman (2005) also cited Bharadway, Bharadway and Konsynski (1999),
which postulated that investments in IT systems might take years to add value
to a firm and are more likely to be reflected in the future profit streams of an
organisation.
Goh and Kauffman (2005) argued that returns on IT investment occur in three
key phases for value: dormancy, triggering and transformation. Phase 1,
value dormancy, occurs after an IT investment has been made by the firm, the
associated value flows take time to appear. Their timing will be influenced by
technology, people and processes (a set of firm activities) of the organisation.
This may come from existing firm structures and routines. For value flows to
occur within the firm in Phase 2, a primary set of value triggers needs to be in
place. This involves the triggering of value flows that result in changes in
organisational routines and structures that permit the flow of IT value. In this
phase, firms have to focus on setting off a series of timely value triggers. For
Gaybba SG 7050 918 2
21
effective value creation with constraining organisational structures and
routines, strong catalysts are necessary to support the changes. These
catalysts stem from the technology, people and processes within the
organisation. After the current impediments are overcome, the value creation
process will undergo a period of extensive change in Phase 3: value
transformation. In each phase, technology, people (stakeholders of the firm)
and firm processes shape the outcome and impact the value flows.
Brynjolfsson and Hitt (1996) as cited by Goh and Kauffman (2005), examined
the productivity paradox of IT, noting that returns to IT investments were
inconsistent over time, with a lag between initial investment and final payoff.
Similarly Brynjolfsson and Hitt (1996) found that an econometric analysis of
firm-level IT returns showed that long-term returns were two to eight times
greater than short term returns. This view is supported by Devaraj and Kohli
(2000). They argued that it is important to understand the factors and
circumstances that influence IT value latency and result in differential lag
lengths. When managers understand how IT investments reach their full
potential value, they will be prepared to anticipate and respond to changes
that impact projects. Having a theory based or empirical analysis-based
understanding of the value trajectory over time for different kinds of IT
investments will lead to appropriate managerial expectations for the benefits
the firm can obtain. This will also enable senior managers to track the
progress of IT returns, and help overcome myopic views about IT project
investment opportunities. The results from a study conducted in 2003 by the
Computer Science Corporation (CSC) also indicated that the expected
paybacks on IT projects typically are one to two years trending to shorter
payback periods.
The relationship between IT investment and firm performance considering the
information intensity of the industry is explored using a distributed lag model.
Findings indicate both a positive effect and a positive lag effect of IT
investment. The effects of IT investment in the high information-intensive
industry are significantly larger than in the low information-intensive industry.

Gaybba SG 7050 918 2
22
Furthermore, a lagged effect of IT investment is larger than an immediate
effect, regardless of the information intensity of the industry (Lee & Kim, 2006)
Before a new tool can be fully integrated and used to its full abilities, the users
need to be given the corresponding training in order to accept the new
technology. As the users gain the adequate experience, then investors would
be able to draw conclusions whether the investment had the wanted effect.
3.3.2 IT acts as a catalyst in an organisation
The case literature of the 1980s and 90s attempted to show that IT provided
competitive advantages to firms by adding value across all aspects of the
value chain, improving operational performance, reducing costs, increasing
decision quality and enhancing service innovation and differentiation. This
view was supported by Applegate (1996); Porter and Millar (1985); as cited by
Hu and Plant (2001).
Porter (1985) introduced a generic value chain model that comprises a
sequence of activities found to be common to a wide range of firms. He
identified primary and support activities as shown in the following figure:
Figure 3.1: Porter’s generic value chain (Porter, 1985)

Gaybba SG 7050 918 2
23
According to this figure (3.1) Information Technology is only regarded as an
activity in a supportive role to the primary activities, in order to create value in
a company. A company’s margin or profit depends on its effectiveness in
performing these activities efficiently. It is in these activities that a firm has the
opportunity to generate superior value. The value chain model is a useful
analysis tool for defining a company’s core competencies and the activities in
which it can pursue a competitive advantage.
According to Brynjolfsson and Hitt (1998) the success of a business depends
on its ability to deliver more real value for consumers without using more
labour, capital or other inputs. This is achieved by productivity growth.
Productivity growth comes from working smarter by means of adopting new
technologies and new techniques for production. The introduction of IT in
organisations has had mixed results in the productivity output. There have
been amazing success stories but on the other hand, there is also of stories
about cost overruns, abandoned systems investments and other IT failures.
The question remains if IT acts as a positive or negative catalyst in
organisations.
In their study Brynjolfsson and Hitt (1998) found that a positive consensus
was beginning to emerge regarding the catalyst effect of IT. This finding was
supported by Dewan and Min (1997). An even more important finding was
that while the average returns to IT investment were solidly positive there was
huge variation across organisations; some have spent vast sums on IT with
little benefit, while others have spent similar amounts with tremendous
success. The greatest benefits of IT appear to be realised when IT
investment was coupled with other complementary investments; new
strategies, new business processes and new organisations. These
complementary investments all appeared to be important in realising the
maximum benefit of IT. These changes are not easy since many
organisations would require a time consuming period of reengineering,
restructuring and organisational redesign in order to best utilise their IT
investments. The investments in change will position companies to reap the
benefits of continued technological progress in the IT industry.

Gaybba SG 7050 918 2
24
The above can be supported by Ross, Beath and Goodhue (1996 as cited by
Hu & Plant, 2001) which suggested that sustained competitive advantages
can be achieved through building and leveraging key IT assets such as
human resources, reusable technology and partnership between IT and
business management. The underlying theory is that these operational and
strategic improvements as a result of effective use of IT should lead to
corresponding improvements in productivity, revenue, and profits for those
firms which consistently make higher investment in IT than their competitors.
In the case of high-tech companies, IT is often the product or service that
directly contributes to revenue and profit. Johannessen, Olaisen and Olsen
(1999) cited Quinn (1996), also argued that although not reflected in
macroeconomics measures of productivity or financial measures of financial
performance, there is little doubt that IT has improved performance
enormously.
3.3.3 There is no relationship between IT investment and ROI
Over the past years numerous research studies had been conducted to find a
relationship between IT investment and the value it has for organisations. The
relationship between IT and productivity has been extensively debated over
the last three decades. In the 1980s and 1990s, empirical research generally
did not find relevant productivity improvements associated with IT investments
(Strassman, 1990; Loveman, 1988; Franke, 1987). The productivity paradox
concept then arose when Solow (1987) remarked that “You can see the
computers everywhere but in the productivity statistics”. Rei (2004) noted that
it can be argued that productivity growth has slowed as investments in IT have
grown. For many economists, this is proof that information technology does
not affect productivity. However, the available evidence is mixed and does
not solve the paradox. Brynjolfsson and Yang (1996) reviewed numerous
articles and found little empirical evidence supporting the idea that IT
investment has contributed to increases in output and productivity growth.
Gera, Gu and Lee (1999) came to the same conclusion after an extensive
literature review. Loveman (1994) concluded in his study that IT investment

Gaybba SG 7050 918 2
25
provided negligible benefits. Although computing power has increased
exponentially in the last three decades, productivity in firms, especially in the
service sector, has stagnated (Brynjolfsson, 1993).
Dasgupta, Sarkis and Talluri (1999) noted that a number of early studies did
not document a significant impact of information technology spending and firm
productivity or performance, giving credibility to the term: “productivity
paradox.” Roach (1991) in a study of information workers from 1970 to 1986
found that computers had limited effect on the productivity of workers. In fact,
some studies found a negative impact of information technology investment
on productivity (Franke, 1987). They also cited Barua, Kriebel and
Mukhopadhyay (1991) that investigated the effect of information technology
spending on intermediate measures like capacity utilisation, inventory
turnover, quality, relative price and new product introduction. They found that
spending was related to three out of the five measures, but these did not have
a significant effect on overall performance measures for the firms. Morrison
and Brendt (1990), using government reported data, found that information
technology provided only marginal returns, and concluded that there was a
general over-investment in information technology.
Some studies have considered information systems spending and its effect on
firm productivity in the service sector. In the banking sector a major share of
information technology investment has been in the form of automated teller
machines. In a study of banks, Banker, Kauffman, and Morey (1990) found
that there is no significant relationship between the number of ATM owned by
a bank and the number of local demand deposits and savings. These findings
have extended to service functions within an organisation (Dasgupta, Sarkis
and Talluri, 1999).
Using the Granger causality models and three samples of firm level financial
data, Hu and Plant (2001) found no statistical evidence that IT investments
have caused the improvement of financial performance of the firms in the
samples. Rei (2004) compiled a summary of the studies on the IT productivity

Gaybba SG 7050 918 2
26
relationship and found that Loveman (1988), Strassman (1990) and Harris
and Katz (1991) found no or weak relationships between IT investment and
productivity. Loveman (1994) in his research of 60 strategic business units
found that the contribution of information technology capital to output was
approximately zero for almost every sub-sample considered (Dasgupta,
Sarkis and Talluri, 1999).
Strassman (2004), a leading figure in research regarding IT investment also
stated that according to his knowledge nobody has been able to demonstrate
that there is positive correlation between money spent on IT and sustainable
profits. His research found that companies spending more money on
information technology, including a higher ratio of information technology
(costs) to labour costs, don't necessarily have better financial performance.
This suggests that investments in information technology have no discernible
impact on financial performance.
3.4 Difficulty in measuring the value of IT and ROI
Understanding, measuring and monitoring the benefits delivered by IT is
becoming vital to successfully exploiting business technology. Measuring the
value of an investment is an inextricable part of business planning. This was
sustained by Lee (2004) noting that because of increasing competition and
limited capital budgets, firms need to carefully assess every information
technology opportunity to ensure that their resources are spent judiciously.
Conventional wisdom holds that IT has enormous potential. However,
organisations continue to question the benefits of IT in conjunction with new
corporate initiatives such as business process re-engineering, e-commerce,
and enterprise resource planning. Despite the potential benefits derived from
IT investment, traditional capital budgeting models have failed to estimate true
IT values due to their inability to measure complex interactions between IT
and organisational performance.

Gaybba SG 7050 918 2
27
Despite significant discussions in both the managerial and academic literature
concerning the importance of evaluating the payoffs of IT investments, there
has been little guidance on how to design or implement an appropriate IT
performance evaluation system, i.e. how to identify and document the
contribution of information technology to high-performance organisations. On
the one hand there is a shortage of relevant metrics. On the other, there is an
absence of a proper methodology to evaluate the payoffs of IT investments
(Epstein & Rejc, 2005). They report that in a survey published in 2004
(McKinsey on IT), more than two thirds of CIO’s reported they had no process
for auditing the performance of their IT projects. Results also showed that
non-IT executives were less aware of the programs to measure IT success
and the return on investment effect of technology investment was unclear.
This lack of understanding is supported in the finding that IT organisations and
the business units that act as their customers should be able to demonstrate
confidently, and continually the value of their investments over time. The
uncomfortable fact remains that most companies have done an abysmal job of
determining accurately the economic, strategic and operational returns on
their IT investment (Maynard, 2006).
Johannessen, Olaisen and Olsen (1999) noted that although they observed a
general optimism, in society as a whole, concerning IT’s potential for creating
sustainable competitive advantages, they had some concern about the lack of
empirical support for the positive economic impact of IT on businesses.

Gaybba SG 7050 918 2
28
3.5 Models and methods proposed to measure and track IT value
Today, financial managers and other decision-makers increasingly want the IT
requests to be framed in a ROI or shareholder value format so that they can
be effectively compared with alternative potential company investments
(Epstein & Rejc, 2005). Typical large IT investments, e-commerce
investments, and very large ERP system implementations thus all face the
same challenges of demonstrating the value of the investments, and historical
difficulties in estimating both revenues and total costs. Despite significant
discussions in both the managerial and academic literature concerning the
importance of evaluating the payoffs of IT investments, there has been little
guidance on how to design or implement an appropriate IT performance
evaluation system, i.e. how to identify and document the contribution of
information technology to high-performance organisations. On the one hand
there is a shortage of relevant metrics. On the other, there is an absence of a
proper methodology to evaluate the payoffs of IT investments. Even
approaches such as the Balanced Scorecard and shareholder value analysis,
which do provide frameworks for analysis and management is considered
insufficient per se (Epstein & Rejc, 2005). Financial statements have lost
considerable meaning as the source of wealth creation in the global economy
and have changed over time. A new set of metrics must be formulated and
agreed on (Grasenick & Low, 2004).
Measurement instruments have been developed during the last decade with
the purpose of reporting the contribution of human competencies, knowledge
and skills to a firm’s value and to foster their further expansion. Correlation
between intangibles and other drivers of value show clear empirical evidence
of their importance; it has been shown, however, that their interaction cannot
be explained easily within a consistent theoretical framework. Grasenick &
Low, 2004 noted that the most well-known representatives are the balanced
scorecard (Kaplan & Norton, 1996), the intangible asset monitor (Sveiby,
1997), the intellectual capital approach (Edvinsson & Malone, 1997) and the
IC-index (Roos et al., 1997), the performance prism (Neely et al, 2003),

Gaybba SG 7050 918 2
29
MERITUM guidelines (Canibano et al, 2002), Danish guidelines (Mouritsen et
al, 2003a).
Companies try to identify, measure and manage primarily those intangibles
they have assessed as the most important for their long-term value creation.
However, the cause effect relation is not easy to establish and to demonstrate
to the satisfaction of constituencies that must be convinced. At this stage in
the evolution of the field it is the perception of the firm and not a generally
accepted fact that establishes value at a particular level (Grasenick & Low,
2004).
3.5.1 IT Contribution Model
Epstein and Rejc (2005) developed a model for evaluating performance in
information technology in order for management to better justify and evaluate
IT initiatives. The IT Contribution Model for evaluating performance in
information technology is a general model of key factors that helps
organisations identify and measure the costs and benefits of IT and properly
assess the payoffs of investments in IT. They suggest that the identification
and measurement of the impacts of IT investments starts with a careful
examination of the critical factors for corporate success in IT integration. IT
success ultimately must be measured by its contribution to overall
organisational success. The IT Contribution Model can be applied equally
effectively to both for-profit and non-profit organisations. The following model
shows the inputs, processes, outputs and outcomes of IT contribution in an
organisation.

Gaybba SG 7050 918 2
30
Figure 3.2: The IT Contribution Model (Epstein & Rejc, 2005)
The guideline for this model includes the following:
• It describes the key factors for organisational success in IT integration
that relate to the critical inputs and processes that lead to success in IT
outputs and ultimately to overall organisational success (outcome).
• It outlines the specific drivers of IT success based on inputs,
processes, outputs, and outcomes, and identifies the causal
relationships between the drivers.
• It provides the specific measures of IT performance to track
performance of IT initiatives along the four dimensions outlined in the
IT model above. The metrics can be used for both IT project
justifications prior to implementation (planning) as well as for evaluation
after completion (performance measurement).
• Since many organisations have little experience assigning monetary
values to IT outputs and the measurement of IT payoffs, the guideline
provides examples of how to assign monetary values to non-financial
IT outputs (benefits).

Gaybba SG 7050 918 2
31
The guideline also includes a detailed scheme of how to calculate ROI. An
organisation’s IT success is dependent on various inputs which include its
existing corporate strategy, structure, and systems that provide both
opportunities and constraints on IT initiatives. These, along with available
resources and the external environment, are critical inputs that affect choices
in the formulation and implementation of IT strategies. Other factors, such as
leadership and IT strategy, IT structure, and IT systems or processes also
significantly impact the performance and success of IT initiatives.
Both the inputs and processes affect various IT outputs that can be classified
as either internal output such as improvement in productivity, time savings,
increased use of capacities, improved quality, and overall cost reduction, as
well as external outputs such as channel optimisation, customer acquisition,
satisfaction, and loyalty, and overall value capture.
If the IT strategy formulation and implementation is successful, these outputs
should ultimately be realized in improved overall corporate profitability
(outcome). Based on the IT Contribution Model, organisations need to
determine company specific IT performance objectives relating to relevant
inputs, processes, internal and external outputs, as well as outcomes of IT
activities.
3.5.2 The Balanced Scorecard
The balanced scorecard developed by Kaplan and Norton (1992, 1993)
describes the strategy and strategic hypotheses using a set of explicit and
testable cause-and-effect relationships.
The balanced scorecard concept, developed in the early 1990s, recognises
the incompleteness of many business measurement processes – too often
totally reliant on financial measures (Sanger, 1998). Financial measures are
useful but they tend to measure the past and they tend to measure the easily-
measurable. They are thus unbalanced measures taking a particular view of
a situation. They also often tell us what has happened but fail to explain why

Gaybba SG 7050 918 2
32
it has happened. They may suggest where things are going wrong, but again
often fail to highlight where things are going well. To analyse causes, it may
require managers to sift through significant amounts of data. This inevitably
means that some critical issues will not be identified, and may mean that by
the time causes are identified, it is too late to make changes before the next
measurement and reporting cycle. This suggests that a measurement regime,
to be really effective, should include predictors of future behaviour and
performance, as well as offering comments on the past. Thus the
measurement regime has to identify the drivers of performance in any
situation. It also suggests that a measurement regime should include
effective presentation of results as a key component; data should be
presented in a simple, consistent form which allows readers to focus on the
important issues. More data is not necessarily better. The data should
highlight issues and help in assessing priorities. The balanced scorecard
attempts to overcome the deficiencies of existing measurement systems – it is
used to measure performance and develop strategies by analyzing results
across a range of activities. At the very heart of the balanced scorecard
method is the belief that organisational success can best be achieved and
measured when viewed objectively from four perspectives:
(1) Financial. How will we look to our stake holders?
(2) Customer. How must we look to our customers?
(3) Internal. What internal processes must we excel at?
(4) Innovation. How can the organisation learn and improve?
This well-rounded assessment provides management with a balanced view of
the business. Epstein and Rejc (2005) noted that an IT performance and
measurement system must focus on the causal relationship and linkages
within the organisation and the actions managers can take to improve both
customer and corporate profitability and drive increase value. A company
should determine the key drivers of IT success and the causal relationships
among them and develop numerous performance measures to track IT
performance. They have developed an IT balanced scorecard using the same
four perspectives that was originally specified by Kaplan and Norton (1996).

Gaybba SG 7050 918 2
33
An organization's IT success is dependent on various IT learning and growth
related elements, such as appropriate resources (capital and people), suitable
corporate systems (training, information, performance measurement and
incentive systems, organizational culture and climate), and behavioural
effects. IT learning and growth affects IT internal processes, such as
standardization; integration and consolidation; security; and overall quality of
IT processes, products, and services. Both the IT learning and growth and
internal processes have an impact on customer satisfaction. Because both
internal and external customers play a critical role in the IT function, the
customer perspective was divided into internal and external customers.
Internal customers' satisfaction reflects in their increased productivity,
creativity, and quality of work. External customers' satisfaction, on the other
hand, will reflect in higher loyalty, new customer acquisitions, and greater
sales. From the financial perspective, both customer dimensions lead to
either higher revenue growth or cost reduction (Epstein and Rejc, 2005a).
Epstein and Rejc (2005a) also argued that a careful and clear articulation of
the most influential drivers of IT success helps managers understand the
causal relationships leading from the learning and growth perspective to the
internal processes and then flowing to the desired customer outputs and
financial results. Causal relationships among drivers within each of the four
dimensions as well as among drivers in different dimensions are based on
hypothetical assumptions of causes and effects, i.e., leading and lagging
elements. As such, they need to be continuously tested and revised. All four
perspectives connect in a chain of cause and effect: IT learning and growth
improve internal business processes, and internal business processes
improve customer satisfaction, both internal and external, which in turn leads
to improved financial performance. This is a continuum where one category
of drivers and measures drives performance in the next. These drivers and
subsequent measures should reinforce each other so that all contribute to
increased corporate financial performance. The financial perspective relating
to the outcomes of the IT initiatives helps managers keep score in the
traditional sense.

Gaybba SG 7050 918 2
34
The Balanced Scorecard aims at the improvement of organisations’ processes
and economic performance, but by incorporating both financial and non-
financial aspects, it can be seen as an open-structured management
instrument that provides a high potential concerning the management of, for
example, corporate sustainability.
3.5.3 Beyond Budgeting
Fraser, Hope and Bunce (2003) postulated that working with budgets, as
practiced in most corporations, should be abolished. This is a radical
proposition, but it is merely a step in a long running battle to change
organisations from centralised hierarchies towards devolved networks. Firms
have invested huge sums in quality programs, IT networks, process
reengineering, and a range of management tools including VA, balanced
scorecards, and activity accounting. They are unable to realise the new
ideas, because the budget, and the command and control culture it supports,
remains predominant. Beyond Budgeting (BB) is an alternative that is more
adaptive and devolved. It replaces the budgeting model with a more adaptive
and devolved alternative. It defines a set of principles that guides leaders
towards a new management model, which is lean, adaptive and ethical.
Beyond Budgeting is not a process. It is a management model based on two
sets of principles namely the six principles of managing with adaptive
management processes, and the six devolution-based principles. These 12
beyond-budgeting principles include (Hope & Fraser, 2003; De Waal et al.,
2004):
Creating a flexible organisational structure (principles 1 through 6):
1. A self-governance framework
2. Empowered managers
3. Accountability for dynamic outcomes
4. Network organisations
5. Market coordination
6. Supportive leadership
Gaybba SG 7050 918 2
35
Designing an adaptive management process (principles 7 through 12):
7. Relative targets
8. Continuous strategy-setting
9. Anticipatory systems
10. Resources on demand
11. Fast, distributed information
12. Relative team rewards
Fraser and De Waal (2001) noted that in the private sector, managers are
forced to consider current and future opportunities and threats, particularly
where rolling monthly forecasts of financial performance operate together with
a focus on other non-financial value drivers. In essence, the 'beyond
budgeting' model entails devolved managerial responsibility where power and
responsibility go hand in hand. The view held by proponents of the beyond
budgeting model is that the following benefits may accrue as a result of its
successful application by management:
• It creates and fosters a performance climate based on competitive
success. Goals are agreed via reference to external benchmarks as
opposed to internally-negotiated fixed targets. Managerial focus shifts
from beating other managers for a slice of resources to beating the
competition.
• It motivates people by giving those challenges, responsibilities and
clear values as guidelines. Rewards are team-based, in recognition of
the fact that no single person can act alone to achieve goals.
• It devolves performance responsibilities to operational management
who are closer to the action. This uses the 'know-how' of individuals
and teams interfacing with the customer, which in turn enables a far
more rapid adaptation to changing market needs.
• It empowers operational managers to act by removing resource
constraints. Key ratios are set, rather than detailed line-by-line
budgets. For example, gearing and liquidity ratios may be used to
show there is enough cash in the bank to meet liabilities. Local access
to resources is thus based on agreed parameters rather than line-by-

Gaybba SG 7050 918 2
36
line budget authorisations. This is aimed at speeding up the response
to environmental threats and enabling quick exploitation of new
opportunities.
• It establishes customer-orientated teams that are accountable for
profitable customer outcomes. These teams agree resource and
service-level requirements with service departments via the
establishment of service level agreements.
• It creates transparent and open information systems throughout the
organisation, which should provide fast, open and distributed
information to facilitate control at all levels. The IT system is crucial in
flexing the key performance indicators as part of the rolling forecast
process.
The Beyond Budgeting model enables a more decentralised way of
managing. In place of the traditional hierarchy and centralised leadership, it
enables decision-making and performance accountability to be devolved to
line managers and creates a self-managed working environment and a culture
of personal responsibility. This causes increased motivation, higher
productivity and better customer service. Individually these two main features
can produce significant benefits but in combination they can help to realise a
leadership vision that until now was strong on vision, but was weak on
delivery because BB is a coherent model in which all of its components work
in harmony, it can produce outstanding and sustained success. This success
is driven by four direct value drivers: innovative strategies, low costs, loyal and
profitable customers, and ethical reporting. However, these drivers will be
ineffective unless front line people have the scope, knowledge and power to
deliver. The result is an organisation that is lean, adaptive and ethical and
that has the potential to remain at the top of its peer group league table.
There are many possibilities, on the scale of traditional budgeting to beyond
budgeting, to modernise the budgeting process. However, the beyond-
budgeting model deserves serious consideration because it enables an
organisation to look with a fresh view at its budgeting process, other planning
processes, and organisational structure. Each organisation should at least

Gaybba SG 7050 918 2
37
explore the benefits of introducing one or more beyond-budgeting principles.
Research has shown that the more beyond-budgeting principles an
organisation implements, the better it performs (Fraser & De Waal, 2001).
The Chartered Institute of Management Accountants (CIMA, 2004) noted that
throughout the late 1980s and 1990s there have been a growing number of
concerns raised about traditional accounting measures. These criticisms are
primarily concerned with the scope for subjectivity that even the most
comprehensive accounting standards allow. A number of consultants, such
as Rappaport (1986) and Stewart (1991), recognised these problems. As a
result, they turned to the concept of shareholder value and how this can be
created and sustained. This has, in turn, led to the development of a number
of “value metrics”, the most significant of which are:
● shareholder value analysis (SVA)
● economic profit (EP) and economic value added (EVA)
● cash flow return on investment (CFROI)
● total business returns (TBR)
Each of these types of metrics is advocated by a number of consultants and
has been adopted by companies in the UK and elsewhere. It is argued that
these metrics can be used for numerous purposes, including valuation,
strategy, evaluation and the monitoring of performance. There are significant
differences between the different value metrics but in each case it is agreed
that the primary objective of a company should be to maximise shareholder
wealth. Therefore, each of the metrics attempts to measure value creation for
shareholders.
3.5.4 Shareholder Value Analysis
The shareholder value analysis (SVA) approach was developed by Alfred
Rappaport in the 1980s. It can be used to estimate the value of the
shareholders’ stake in a company or business unit, and can also be used as
the basis for formulating and evaluating strategic decisions. The value of the
operations of a business is determined by discounting expected future

Gaybba SG 7050 918 2
38
operating free cash flows at an appropriate cost of capital. In order to find
shareholder value, the value of marketable securities and other investments
must be added to, and the value of debt must be subtracted from, the
business valuation. Free cash flow reflects the cash flow from the operations
of a business for a period, id est. before taking into account any financing-
related cash flows, such as those relating to share or debt issues, dividend
and interest payments, etcetera.
3.6 Summary
The earlier-mentioned studies by Brynjollfsson (1993, 1994); and Strassmann
(1990) were conducted in search of a relationship between IT and
investments, and revealed several problems that were still being experienced
in organisations regardless of what had been achieved. These researchers
highlighted that although managers make investment decisions, they tend to
play a passive role in ensuring that such systems are used effectively and
efficiently. Many people in organisations embraced IT, and some suffered
major psychological and physical challenges, such as the information
overload. The inability of managers to document any contribution IT has
made over the years is also human centric in nature. The researchers found
that there were lags between costs and benefit, showing poor short-term
results. This is seen between the time of learning and development among
workers, and between the new technology or other business processes and
the changes that are inevitable in organisations, which take into account the
benefits and return on investments in IT that do not show immediately. These
systems still crash and lead to a loss of valuable information and knowledge in
organisations. Managers are also affected by the many difficulties in
quantifying the benefits of IT, e.g. the difficulties in finding appropriate
measurement instruments. This brings about hitches to the benefits and
rewards if work and incentives are not appropriately adjusted. The result is
that IT might increase organisational slack instead of output or profits. In
some instances, the rewards are directly immeasurable. The truth is there are

Gaybba SG 7050 918 2
39
no comprehensive models to measure the changes IT brings. In addition,
investigations on IT and productivity have not been at all satisfactory, which
raises frustration and misunderstanding of the measures and methods
commonly used to assess productivity in organisations and the industries.

Gaybba SG 7050 918 2
40
CHAPTER 4: PROBLEM STATEMENT
AND HYPOTHESES
4.1 Introduction
In the previous chapter a detailed literature review was conducted. The
relationships between IT investment and productivity were discussed. The
different models and methods to measure and track IT value were evaluated.
In this chapter the problem statement will be highlighted. In previous studies,
Hu and Plant (2001) argued that the promise of increased advantage was the
driving force behind large-scale investment in IT since the 1970’s. Current
debate continues amongst managers and academics with reference to the
measurable benefits of IT investment. Return on Investment (ROI) and other
performance measures in academic literature, indicates conflicting empirical
findings. The strategic importance of IT investment and the importance of IT
investment decisions by business managers will be emphasised.
4.2 Problem statement
Earlier studies revealed that there existed no evidence of a relationship
between IT spend and the financial performance of a firm. More recent
studies did reveal significant relationships but in general studies have found
mixed results.
Studies that have found relationships indicated that a lagged effect exist
between IT investment and the financial performance of a firm. Another group
of researchers also noted the indirect value of IT saying that it act as a
catalyst.
The reasons for the mixed results were contributed to data reliability, analysis
methods and the lack of proper ways to measure the effect of IT investment.

Gaybba SG 7050 918 2
41
The South African Post Office (SAPO), as with other organisation, also
considers the return on their investments. With their strategic plan set out to
have an operating profit of one billion rand, they are faced with evaluating the
value of their IT spend.
Given the above the following two primary research questions were
formulated for this study:
• Does a relationship exist between IT expenditure and the financial
performance of a firm?
• What is the perceived value of IT investment in a firm?
4.2.1 Relationship between IT expenditure and the financial
performance of a firm
The literature indicated that studies have found in various cases a positive
lagged effect. The following hypothesis was therefore formulated.
Hypothesis 1: There is a positive lag effect of IT expenditure on the financial
performance of the firm.
4.2.2 Perceived value of IT investment in a firm
From the literature (Johannessen, Olaisen & Olsen, 1999) the indirect value of
IT relate to areas such as:
• increased effectiveness
• ease the work
• develop new ways to manage the company
• increase customer service quality
• increase internal connectance
• planning
• decrease costs
• differentiate service
• improve internal communication

Gaybba SG 7050 918 2
42
• improve external communication
• change existing work processes
• increase access to market information
• contribute to employees access to common information foundation
The Computer Sciences Corporation (2003) also noted that IT investment
have an indirect influence following aspects of a firm:
• way to reduce costs
• supports needs of business
• aligned to business strategy
• good job in meeting customer requirements
• plays integral role in customer requirements
• important part of business
• tactical aspect of business
• ability to increase sales
• competitive advantage
• IT is a core competency
In light of the literature, the following hypothesis was therefore formulated.
Hypothesis 2: IT is perceived by line-management to have indirect value on
the performance of the firm.
4.3 Summary
Regardless of theoretical arguments and professional belief in favour of a
positive relation between investment in IT and firm performance, empirical
evidence on this relation has been inconclusive and has arrived at
multifaceted conclusions that have sometimes been conflicting (Lee & Bose,
2002). Beyond theory development, numerous attempts have been made to
relate IS/IT expenditures, computational intensity, MIS budget, or other
particular strategies to firm performance (Guerreiro & Serrano, 2006).

Gaybba SG 7050 918 2
43
Several empirical studies and ample anecdotal evidence indicate that
companies that spend more on IT are not rewarded with superior financial
performance (Stratopoulos & Dehning 2000). Stratopoulos and Dehning
(2000) report empirical evidence that suggests the financial performance of a
firm is more related to the way IT assets are managed than the level of
organisational spending on new technology, and thus, adding further
dimensions to the productivity paradox.

Gaybba SG 7050 918 2
44
CHAPTER 5: RESEARCH DESIGN
AND ANALYSIS
5.1 Introduction
Chapters 2 and 3 served to provide a framework for the study. In chapter 4
the research problem was stated. Chapter 5 gives an exposition of how the
study was conducted. More specifically the areas of research design, sample
design, data gathering and data analysis are dealt with, which were chosen
according to the study's research objectives.
5.2 Research design
The research design is the series of steps to be carried out in order to answer
the research objectives (McDaniel & Gates, 2001). The study followed an
exploratory case study approach. In addressing the primary research
objective, statistical techniques were employed to determine the relationship
between IT expenditure and the financial performance of the firm. The
secondary research objective was addressed using survey research to
explore the perceived value of IT investment amongst a sample of
management within SAPO.
5.3 Sample
In addressing the primary research objective, monthly financial data was
obtained from SAPO for the period April 2002 to March 2006, giving 48 data
points in total. Audited financial figures were provided for four variables,
namely:
• Operating Revenue
• Operating Expenses
• Net Profit

Gaybba SG 7050 918 2
45
• IT Operating Expenses
The net profit of the SAPO was chosen as indicator variable for the financial
performance of the firm, whereas IT operating expenditure would serve as
proxy for IT expenditure of the firm. Annexure A shows the financial data for
the four mentioned variables.
The secondary research objective explored perceptions. A non-probability
purposive approach was used to gather data from a quota specified sample of
50 managers at SAPO across the five main operational and support
departments. Respondents were selected based on their perceived
knowledge and insight into IT investment within the firm and intended
outcomes. Quotas were also specified to obtain a representation of managers
across the noted departments given research budget and time constraints,
restricting gathering data from all employees.
The sample details (n = 50) are summarised below:
Gender: Male 54%
Female: 46%
Age: 18 - 24 yrs 4%
25 - 34 yrs 30%
35 - 49 yrs 58%
50 - 59 yrs 8%
Employee level: General Staff/ Administrative 28%
Supervisory/ Junior Management 16%
Middle Management 30%
Senior Management 12%
General Management 4%
Executive Summary 10%
Department: Finance 20%

Gaybba SG 7050 918 2
46
Human Resources 20%
Operations 20%
Information Technology 20%
Support Services 20%
5.4 Survey instrument
A semi-structured self-administering questionnaire was used as data
gathering instrument (refer to Annexure A). The questionnaire consisted of a
number of questions being categorical and was grouped into two sections.
Section A dealt with respondent’s demographic characteristics and gathered
the following information from respondents:
• Gender
• Age
• Employee level
• Department
Section B dealt with respondent’s perspectives on IT and consisted of the
following questions and statements:
• What is the predominant view of Information Technology by senior
management?
• How would you characterise your organisation’s use of Information
Technology?
• How do you rate the effectiveness of your IT organisation?
• IT provides our company the ability to increase sales
• IT provides a way for our company to reduce costs
• IT gives our company competitive advantage
• IT supports and is aligned to business strategy
• IT is an important component of our business strategy
• IT is a tactical aspect of our business
• IT is a core competence in our company
• IT supports the needs of the business

Gaybba SG 7050 918 2
47
• IT plays an integral role in meeting customer requirements
• IT does a good job in meeting customer requirements
• What do you believe are the risks or issues that would make you
hesitate in investing in IT?
Respondents were asked to rate the statements using a 5-point Likert scale
where 1 = Strongly disagree; 2 = Disagree; 3 = Neither agree nor disagree;
4 = Agree; and 5 = Strongly agree.
A copy of the questionnaire used is provided in Annexure C of this report.
5.5 Data analysis
The analysis of financial data from SAPO to determine the relationship
between IT expenditure and the financial performance of the firm involved
both regression and time series analysis. Data was exported to a statistical
software package, namely SPSS for Windows. With the assistance of a
statistician, regression analysis was performed to investigate the linear
relationship between operating and IT expenditure and operating revenue and
profit/loss. The analysis however did not include investigating the possible
time effect of IT expenditure on revenue, as hypothesised by a number of
authors (Brynjolfsson & Hitt, 1998; Lee & Kim, 2006), but merely to investigate
if any relationship could be detected irrespective of time-dependence. In
order to investigate a possible lagged effect, time series analysis was utilised.
The cross-correlation function (CCF) in SPSS's Time Series module was
used. This CCF shows the correlation between two series of data at the same
time and also with each series leading by one or more lags (SPSS Inc, 1994).
Cross-Correlation procedures should only be used on data series that are
stationary. A series is stationary if its mean and variance stay about the same
over the length of the series. Visual inspection of the financial data used in
the analysis revealed that the data needed to be made stationary before the

Gaybba SG 7050 918 2
48
CCF could be used. Differencing was used to make the series stationary.
Refer to Annexure B for CCF results.
The second part of the study involved survey research. Completed
questionnaires obtained from respondents were captured first in Excel and
validated using various control checks that ensure that no data capturing
errors were evident. The data were henceforth exported to SPSS for
Windows.
The next step involved the analysis of the survey data. Churchill (1979)
stated that the purpose of analysis is to obtain meaning from the collected
data.
Hussey and Hussey (1997) noted that most statistical literature commonly
draws a distinction between exploratory data analysis and descriptive
statistics, which is used to summarise or display quantitative data, and
confirmatory data analysis or inferential statistics, which involves using
quantitative data collected from a sample to draw conclusions about a
complete population. In this study, the focus fell primarily on exploratory data
analysis, and involved the construction of one-dimensional frequency tables
(refer to Annexure D). This provided a base for summarising and presenting
of data, which enabled patterns and relationships to be discovered which were
not apparent in the raw data.
5.6 Limitations of the study
The research aimed to determine the relationship between IT investment and
the financial performance of a firm and to explore the perceived value of IT
investment in SAPO. The scope of this study was limited to the South African
Post Office and only included data from this company.

Gaybba SG 7050 918 2
49
5.7 Summary
This study followed an exploratory case study approach. Data were obtained
from two sources, namely financial company records as well survey data. In
addressing the primary research objective, monthly financial data was
obtained from SAPO for the period April 2002 to March 2006. The secondary
research objective explored perceptions. A non-probability purposive
approach was used to gather data from a quota specified sample of 50
managers at SAPO across the five main operational and support
departments. A semi-structured questionnaire was used as data gathering
instrument. The data was analysed using various basic and advanced
statistical analysis techniques.
The results of the analysis are depicted in Chapter 6.

Gaybba SG 7050 918 2
50
CHAPTER 6: RESULTS
6.1 Introduction
A review of literature revealed that more recent studies found significant
relationships between IT expenditure and the financial performance of a firm
(Guerreiro & Serrano, 2006; Al-Mudimigh, 2001 & Shin 2001). In general,
however, studies have found mixed results.
Studies that have found relationships indicated that a lagged effect exist
between IT expenditure and the financial performance of a firm. Another
group of researchers also noted the indirect value of IT saying that it act as a
catalyst.
This chapter depicts the results from the analysis of data collected from the
field. It addresses two main hypotheses namely:
Hypothesis 1: There is a positive lag effect of IT expenditure on the financial
performance of the firm.
Hypothesis 2: IT is perceived by line-management to have indirect value on
the performance of the firm.
6.2 The relationship between IT expenditure and financial
performance
Figure 6.1 shows the operating revenue, operating expenditure, IT
expenditure and net profit for the South African Post Office over the period
April 2002 to March 2006. From the figure it is evident that operating revenue,
net profit and operating expenditure showed positive trends over the period,
suggesting that operating expenditure resulted in positive returns of revenue.
IT operating expenditure however remained stable over the period, showing
neither a downward nor upward trend.

Gaybba SG 7050 918 2
51
Figure 6.1: Selective financial results for SAPO April 2002 to March 2006
A plot of net profit by operating revenue confirms a positive relationship
between the two variables. This is shown in figure 6.2 and in line with the
deduction made from figure 6.1. The R-square value of 0.674 shows that the
fitted regression line, which signifies the positive relationship, explains 67% of
the total variation in the data.

Gaybba SG 7050 918 2
52
Figure 6.2: Relationship between net profit and operating revenue
250,000 300,000 350,000 400,000 450,000
OPERATING REVENUE
-150,000
-100,000
-50,000
0
50,000
100,000
NE
T (
PR
OF
IT)/
LO
SS
R Sq Linear = 0.674
Further results show that net profit is also positively associated with operating
expenses. The R-square value of 0.169 however suggests a less strong
positive relationship. Refer to figure 6.3 for the results.
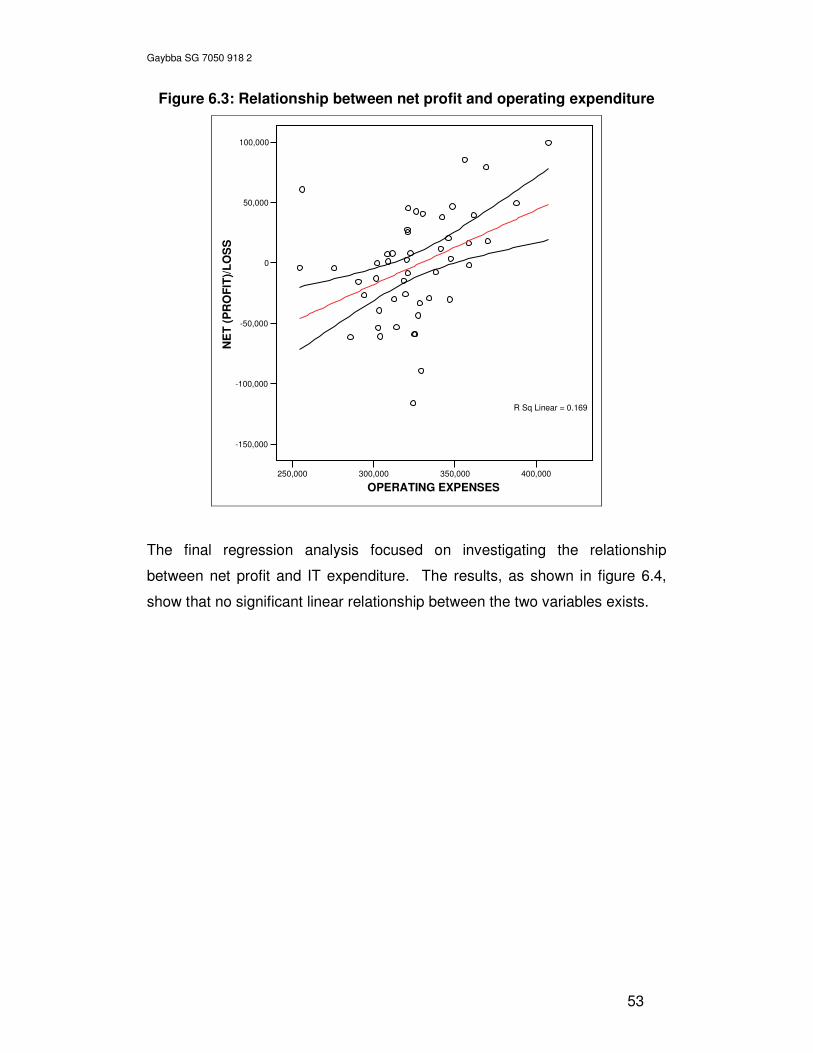
Gaybba SG 7050 918 2
53
Figure 6.3: Relationship between net profit and operating expenditure
250,000 300,000 350,000 400,000
OPERATING EXPENSES
-150,000
-100,000
-50,000
0
50,000
100,000
NE
T (
PR
OF
IT)/
LO
SS
R Sq Linear = 0.169
The final regression analysis focused on investigating the relationship
between net profit and IT expenditure. The results, as shown in figure 6.4,
show that no significant linear relationship between the two variables exists.

Gaybba SG 7050 918 2
54
Figure 6.4: Relationship between net profit and IT operating expenditure
0 10,000 20,000 30,000 40,000 50,000 60,000
IT OPERATING EXPENSES
-150,000
-100,000
-50,000
0
50,000
100,000
NE
T (
PR
OF
IT)/
LO
SS
R Sq Linear = 8.661E-4
The second part of the analysis focused on determining if IT expenditure had
a lagged effect on the financial performance of the firm. The results of the
cross-correlation function between net profit and IT operating expenditure are
shown in figure 6.5.
As shown in the figure, most of the correlations are small. There is a
significant positive correlation evident of 0.410 at lag 8. A positive lag
suggests that first series, namely IT expenditure leads the second series net
profit. The correlation also suggests that increases in IT expenditure are
associated with increases in net profit.
The results therefore accept the hypothesis stated earlier, namely that IT
expenditure has a lagged effect on the financial performance of the firm. It is
however of importance to note that the relationship, although significant, is
considered mediocre.

Gaybba SG 7050 918 2
55
Figure 6.5: Cross-correlation between net profit and IT operating
expenditure

Gaybba SG 7050 918 2
56
6.3 Perceived value of IT investment
The second part of the study considered the hypothesis that investment in IT
is perceived to have an indirect value in the firm. In general, respondents
viewed IT as a strategic and tactical component and regarded it as a
necessary business expense that produced a return on investment. However,
although the majority of respondents (60%) felt IT to be effective, a significant
proportion were not convinced that IT is able to increase sales or meet
customer requirements. IT is also not providing the SAPO a way to reduce
cost.
Figure 6.6 shows that respondents perceived IT to be regarded as a
necessary business expense by senior management (46%). Respondents
also felt that senior management regards IT as a strategic asset (26%) and a
return-producing investment (18%). Only a small percentage of the sample
(10%) felt that senior management perceived IT to be a non-value adding
cost.
Figure 6.6: Predominant view of IT by senior management (n = 50)
10%
46%
18%
26%
Non-value adding cost
Necessary business
expense
Return-producing
investment
Strategic asset
Figure 6.7 show that the SAPO is perceived to stay current on technology, but
without getting too far ahead of competition (32%). SAPO thus takes a
conservative approach (28%) to IT investment where it is seen as critical and
essential (28%).

Gaybba SG 7050 918 2
57
Figure 6.7: Use of IT within SAPO (n = 50)
Figure 6.8 show that IT’s effectiveness is perceived by 46% to be acceptable,
while 14% noted IT to be effective. Four out of 10 respondents (4% and 36%
respectively), however, indicated IT in SAPO to be not effective at all or only
effective to a limited extent.
Figure 6.8: Effectiveness of IT (n = 50)
4%
36%
46%
14%
Not at all effective Somewhat effective Acceptable Affective
Although IT is perceived by most respondents (Table 6.1) to be an important
(80%) and tactical component (72%) of SAPO's business strategy, a
significant proportion of respondents doubted the perceived value of IT with
regard to providing SAPO with the ability to increase sales, reduce cost and
meet customer demands.
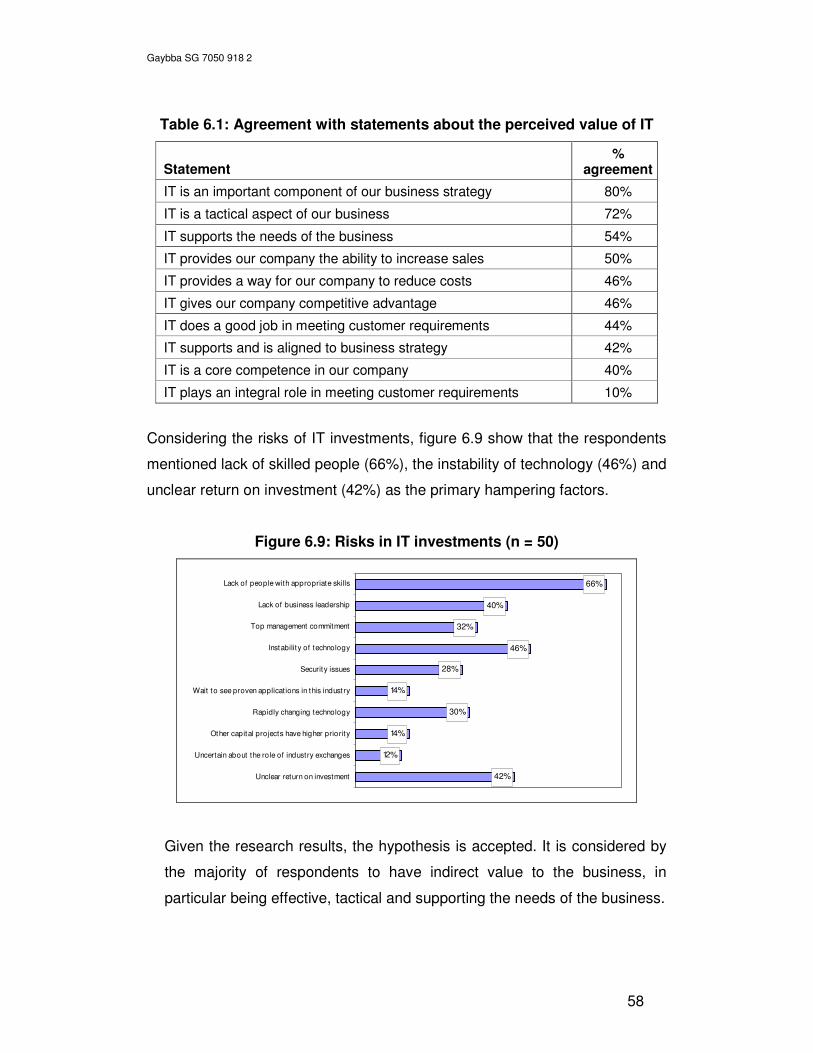
Gaybba SG 7050 918 2
58
Table 6.1: Agreement with statements about the perceived value of IT
Statement %
agreement
IT is an important component of our business strategy 80%
IT is a tactical aspect of our business 72%
IT supports the needs of the business 54%
IT provides our company the ability to increase sales 50%
IT provides a way for our company to reduce costs 46%
IT gives our company competitive advantage 46%
IT does a good job in meeting customer requirements 44%
IT supports and is aligned to business strategy 42%
IT is a core competence in our company 40%
IT plays an integral role in meeting customer requirements 10%
Considering the risks of IT investments, figure 6.9 show that the respondents
mentioned lack of skilled people (66%), the instability of technology (46%) and
unclear return on investment (42%) as the primary hampering factors.
Figure 6.9: Risks in IT investments (n = 50)
42%
12%
14%
30%
14%
28%
46%
32%
40%
66%
Unclear return on investment
Uncertain about the role of industry exchanges
Other capital projects have higher priority
Rapidly changing technology
Wait to see proven applications in this industry
Security issues
Instability of technology
Top management commitment
Lack of business leadership
Lack of people with appropriate skills
Given the research results, the hypothesis is accepted. It is considered by
the majority of respondents to have indirect value to the business, in
particular being effective, tactical and supporting the needs of the business.

Gaybba SG 7050 918 2
59
6.4 Summary
This chapter depicted the results that were obtained from the analysis of the
financial and survey data. The first part of the chapter considered the results
relating to testing if there is a positive lag effect of IT investment on the
financial performance of the firm. The second part of the chapter considered
the value of IT as perceived by SAPO line en top management.
Chapter 7 provides a discussion of the results and drawing of conclusions.

Gaybba SG 7050 918 2
60
CHAPTER 7: DISCUSSION, CONCLUSION
AND RECOMMENDATIONS
7.1 Introduction
When computers were first introduced to organisations, they carried lots of
promise for the immediate achievement of results. This led to increased
investment by organisations in Information Technology (IT), primarily because
of the belief that IT has a significant impact on organisational performance,
achieving higher returns, and improving their economic performance.
Success stories give impressive examples of the effects of investment in IT on
a firm’s performance and competitive advantage, and therefore, become one
of the key areas in organisational investment strategies. However, despite the
continuous heavy investment that takes place within companies towards IT, a
review of the literature suggests that the enthusiasm for IT has in some
instances been overtaken by a sense of pragmatism. This has also been
brought about from several empirical studies, which have failed to find any
positive relationships between the extensive investment in IT and
organisational efficiency, performance and success (Guerreiro & Serrano,
2006; Goh & Kauffman, 2005; Love & Zahir, 2004).
Serafeimidis and Smithson already noted in 2000 that management
increasingly seek more concrete evidence of the business and the real value
of their often extensive IT investments.
At firm, industry and economy level there is contradictory evidence on whether
IT expenditure has resulted in business value. Although it is important that a
firm should invest in IT and the competitive advantages from superior IT
investments be widely recognised (Brynjolfsson & Hitt, 1998), some research
(Harris & Katz, 1989) has shown that it is unlikely that higher expenditures on
IT alone will ensure a firm’s superior performance and actual returns received
on IT investments vary widely (Brynjolfsson & Hitt, 1998). IT investments may
not automatically improve financial performance; instead, it is one essential

Gaybba SG 7050 918 2
61
tool, but needs to be coupled with organisational factors such as business
strategies to be truly effective (Shin, 2001).
7.2 Outcome of results of hypotheses
7.2.1 Relationship between IT expenditure and financial performance
The first hypothesis aimed to investigate if a positive lag effect exists between
IT expenditure and the financial performance of the firm.
In the case of the South African Post Office (SAPO), it was found that a
significant positive relationship existed between IT expenditure and net profit
at a lag of around 6 to 8 months. This suggests that IT expenditure is having
a delayed positive effect of around 6 month on the financial performance of
the SAPO. In the light of this finding, the hypothesis is accepted.
In accepting the hypothesis it is also important to keep in mind the extent of
the relationship. Although the statistical relationship was significant, the
relationship was considered to be mediocre, suggesting that IT is not the only
contributor to the financial performance of a firm but is also driven by other
factors, jointly working towards driving performance.
7.2.2 Perceived value of IT investment
The second hypothesis considered if IT is perceived by line-management in
SAPO to have indirect value on the performance of the firm.
Given the research results, the hypothesis is accepted. It is considered by the
majority of respondents to have indirect value to the business, in particular
being effective, tactical and supporting the needs of the business. The survey
did, however, reveal that although the majority of respondents (60%) felt IT to
be effective, a significant proportion were not convinced that IT is able to
increase sales, meet customer requirements or reduce cost. IT is also not
perceived to be effective by all.

Gaybba SG 7050 918 2
62
7.3 Conclusions
From the literature it is apparent that there are probably as many different
viewpoints and findings to whether investing in IT is good or not.
The findings of this study related with findings reported by other researchers
on the positive relationship between investment in IT and organisational
performance (Mahmood, Mann, Dubrow & Skidmore, 1998. Rai, Patnayakuni;
& Patnayakuni, 1997. Mitra & Chaya, 1996. Brynjolfsson & Hitt, 1996.
Mahmood & Mann, 1993. Brynjolfsson, 1993. Alpar & Kim, 1990). The
literature did, however, reveal that some researchers question these results
on the grounds that the studies involved examination of primarily cross-
sectional data. This criticism stems at least in part from the premise that the
benefits of IT investment can be realised only over longer periods of time. It is
possible that in many instances IT has the potential to provide important
benefits within the same year the investment is made, as was found in the
case of the SAPO. These benefits is not necessarily restricted to a single
year and the total ripple effects are difficult to measure as IT investments do
not occur in single events, but rather on a continuous basis.
Another important conclusion that is made is that IT provides competitive
advantages to firms by adding value across all aspects of the value chain,
improving operational performance, reducing costs, increasing decision
quality and enhancing service innovation and differentiation.
According to Porter’s Value Chain, Information Technology functions in a
supportive role to the primary activities, in order to create value in a company.
A company’s margin or profit depends on its effectiveness in performing these
activities efficiently. It is in these activities that a firm has the opportunity to
generate superior value. The greatest benefits of IT appear to be realised
when IT investment was coupled with other complementary investments; new
strategies, new business processes and new organisations. This furthermore
supported by Ross, Beath and Goodhue (1996 as cited by Hu & Plant, 2001)
which suggested that sustained competitive advantages can be achieved

Gaybba SG 7050 918 2
63
through building and leveraging key IT assets such as human resources,
reusable technology and partnership between IT and business management.
The underlying theory is that these operational and strategic improvements as
a result of effective use of IT should lead to corresponding improvements in
productivity, revenue, and profits for those firms which consistently make
higher investment in IT than their competitors. In the case of high-tech
companies, IT is often the product or service that directly contributes to
revenue and profit.
7.4 Recommendations
In the light of the above, it is recommended that the value of IT, both on a
financial basis and perceived basis, be measured on an ongoing basis. It
should be incorporated into review reports such as the Balanced Scorecard,
to ensure that cognisance is taken of expenditure and that real effort should
be made to evaluate its effect on the business.

Gaybba SG 7050 918 2
64
ARTICLE
Return on Investment in Information Technology
in the South African Post Office.
SG Gaybba
25 Ratel Avenue
Lydiana
Pretoria
0184

Gaybba SG 7050 918 2
65
Return on Investment in Information Technology
in the South African Post Office.
Abstract
The South African Post Office is investing large amounts of money in IT.
Organisations were encouraged by the notion that investing in IT correlates
with higher returns and the delivery of expected results by replacing the
human component in organisations. The employment of IT within business
has often resulted in the replacement of old problems with new and the
expected business benefits of IT not realised. This study explored the return
on IT investment in the South African Post Office and aimed to determine the
relationship between IT expenditure and the financial performance of a firm.
Results indicated that a significant positive relationship existed between IT
expenditure and net profit at a lag of around 6 to 8 months. This suggests
that IT expenditure is having a delayed positive effect of around 6 month on
the financial performance of the SAPO. The findings of this study related with
findings reported by other researchers on the positive relationship between
investment in IT and organisational performance.
The findings suggested that IT is considered a strategic and tactical
component within SAPO and therefore a necessary business expense. It is
also perceived by the majority to be efficient. However, the findings also
suggested that respondents were not convinced that IT is able to increase
sales, reduce cost or meet customer requirements.
In the light of the above, it is recommended that the value of IT, both on a
financial basis and perceived basis, be measured regularly. It should be
incorporated into review reports such as the Balanced Scorecard, to ensure
that personnel and management takes cognisance of IT expenditure and that
real effort should be made to evaluate its effect on the business at all levels.

Gaybba SG 7050 918 2
66
Introduction and theoretical background
The South African Post Office with turnover of more than four billion rand and
assets worth more than three billion recorded their first operating profit during
the 2003/4 financial year (SAPO, 2004). Since then, their operation profit has
increased marginally during 2004/5 and 2005/6. SAPO, as with every other
high ranking organisation in South Africa has undergone a process of reform
in the past few years. It has readdressed the historical operational and
service imbalances, while improving the scope, scale and quality of service. It
had significantly reduced and ultimately eliminated cost and service
inefficiencies and repositioned the postal service to benefit from the growth in
the overall communications world-wide. This was done by also investing in
information technology to meet the challenges of the economy and their
customers.
The use of Information Technology (IT) has since the beginning been targeted
for evaluation whether it pays off or not. The research entered a new phase in
the 1980s. This was mainly initiated with a statement from Solow (1987) as
cited by Loveman (1994), that IT investments were not giving a return to its
investors. This sparked further research and many jumped on the new hot
topic. Many researchers were following different approaches to investigate
and research around this area, some agreeing to what Solow stated
(Loveman 1994), and some not (Brynjolfsson, 1993; Brynjolfsson & Hitt 1996,
1998 & 2003). These different views are supported by Kohli and Devaraj
(2003) that noted in their study that payoff from IT has generated interest and
debate from both academics and practitioners. Various studies have found
mixed results when having investigated the relationship between investment
in IT and firm performance (Goh & Kauffman, 2005). From the many
empirical studies, there are probably as many different viewpoints and
findings to whether investing in IT is good or not. The one thing most
researchers agree with is that the outcomes of investments in IT are difficult to
measure.
Today's economic climate has forced the control of IT investments into
becoming a necessary and vital part of business behaviour. IT managers are

Gaybba SG 7050 918 2
67
no longer able to approve large expenditure without a strong commercial
business case showing a high return on investment (ROI). Another factor
driving a commercial focus amongst IT managers are statistics that show that
a very high percentage of IT projects fail to deliver a ROI over an acceptable
time frame. The business environment is now dominated by prudent
investment decisions and recessionary attitudes. It is common practice that
organisations firstly consider the returns or value outcomes before making any
IT investments.
Guerreiro and Serrano, (2006) noted that firms invest in IT in order to improve
their economic performance and increase their net worth. IT is often designed
to support and improve medium to long-term business, based on a variety of
corporate goals. The employment of IT within business has often resulted in
the replacement of old problems with new and the expected business benefits
of IT not realised. Despite increasing expenditure on IT, productivity has not
increased and this has given rise to a productivity paradox (Love & Zahir,
2004).
The 'productivity paradox' phrase was coined when large investments in
information technology (IT) apparently failed to produce significant increases
in productivity on two levels. The first was at the industry or economy-wide
level and the second was observed at company level (Lim, Richardson &
Roberts, 2004). Ryan (1999) noted that early research into the subject had
pointed out a paradox that despite the spending of large amounts by firms
during the 1990s, the productivity benefits were patchy. Early research
tended to focus on the services sector, where IT spending in the 1980s
generated minimal annual growth in productivity. At the centre of the paradox
is the fact that productivity appeared to start slowing in the early 1970s,
coinciding with the oil crises and, surprisingly, the widespread use of IT.
Attention was first drawn to the productivity paradox in 1987 by Steven Roach,
who demonstrated that while the amount of computing power per white collar
worker in the services sector had grown dramatically over the 1970s and
1980s, measured productivity of the sector remained flat (Ryan, 1999).
Researcher conducted various studies and searched for a link between

Gaybba SG 7050 918 2
68
productivity growth and computer investment in manufacturing industries.
From an economy-wide level perspective, the conventional wisdom was by
the late 1980s that IT was not contributing significantly to productivity
(Brynjolfsson & Hitt, 1998). Brynjolfsson and Hitt (1998) remarked that a few
studies did find positive effects on intermediate factors such as cost efficiency
or market share, but it was difficult to tie these benefits to the bottom line.
While early research found little evidence of a relationship between IT and
productivity, there was also little evidence that computers were unproductive
Most productivity measures are oriented around numbers. Such measures of
productivity are severely limiting and not the sole reason for purchasing IT.
Proof of this is the fact that most managers rate customer service and quality
above cost savings as the prime motivation for IT investment. Ryan (1999)
postulated that early research into the subject of IT and productivity was
skewed by the use of economy-wide data, and the use of flawed data for
several services sectors, making it appear that computers had done little to
boost productivity. Earlier research conducted in the 1990's which focussed
on the company- or firm-level, also lacked evidence and supported the
productivity paradox as there was a failure of IT to produce significant
increases in productivity despite large IT costs incurred by organisations when
they adopt IT. Research conducted by Strassman (2004) found that there
was no correlation between expenditure for information technologies and any
known measures for profitability (Lim, Richardson & Roberts, 2004). More
recent studies conducted in 2000's showed that there were positive payoffs
from IT and have changed their position from doubts about payoffs to when
and why there are payoffs. Results of these later IT investment studies
showed a positive correlation between IT investment and firm performance
(Lim, Richardson & Roberts, 2004).
Research reflecting relationships between IT investment and organisational
performance and productivity might be more convincing if it were based on IT
investment in both current and earlier periods. Although some researchers
(Brynjolfsson, 1993; Loveman, 1994; Osterman, 1986) have speculated on
the lagged effects of IT investment, there have so far been no empirical

Gaybba SG 7050 918 2
69
studies, with the exception of one reported in a conference (Mahmood, Mann,
Dubrow & Skidmore, 1998), that have demonstrated a relationship between
such investment and organisational performance and productivity in
subsequent periods. It has also been argued that traditional IT investment-
performance analyses have not been very successful in the past because of
their over reliance on financial data. Some researchers (Brynjolfsson & Hitt,
1996) have called for additional research to identify the hidden costs and
benefits that are typically not included in a traditional analysis of IT investment
relationships with organisational performance and productivity.
According to Brynjolfsson and Yang (1999) another explanation for the
paradox is that the benefits from information technology can take several
years to appear on the bottom line. The idea that new technologies may have
a delayed impact is a common one in business. A survey of executives
suggested that many expected it to take as long as five years for information
technology investments to pay off (Nolan & Norton, 1988). This accords with
an econometric study by Brynjolfsson (1991) which found lags of two to four
years before the strongest organisational impacts of information technology
were felt. Loveman (1994) also found slightly higher, albeit still very low,
productivity when small lags were introduced.
Goh and Kauffman (2005) argued that returns on IT investment occur in three
key phases for value: dormancy, triggering and transformation. Phase 1,
value dormancy, occurs after an IT investment has been made by the firm, the
associated value flows take time to appear. Their timing will be influenced by
technology, people and processes (a set of firm activities) of the organisation.
This may come from existing firm structures and routines. For value flows to
occur within the firm in Phase 2, a primary set of value triggers needs to be in
place. This involves the triggering of value flows that result in changes in
organisational routines and structures that permit the flow of IT value. In this
phase, firms have to focus on setting off a series of timely value triggers. For
effective value creation with constraining organisational structures and
routines, strong catalysts are necessary to support the changes. These
catalysts stem from the technology, people and processes within the
Gaybba SG 7050 918 2
70
organisation. After the current impediments are overcome, the value creation
process will undergo a period of extensive change in Phase 3: value
transformation. In each phase, technology, people (stakeholders of the firm)
and firm processes shape the outcome and impact the value flows.
Brynjolfsson and Hitt (1996) noted that returns to IT investments were
inconsistent over time, with a lag between initial investment and final payoff.
Brynjolfsson and Hitt (1996) also found that an econometric analysis of firm-
level IT returns showed that long-term returns were two to eight times greater
than short term returns. Devaraj and Kohli (2000) argued that it is important
to understand the factors and circumstances that influence IT value latency
and result in differential lag lengths. When managers understand how IT
investments reach their full potential value, they will be prepared to anticipate
and respond to changes that impact projects. Having a theory based or
empirical analysis-based understanding of the value trajectory over time for
different kinds of IT investments will lead to appropriate managerial
expectations for the benefits the firm can obtain. This will also enable senior
managers to track the progress of IT returns, and help overcome myopic
views about IT project investment opportunities.
There has also been studies that implied that there is no relationship between
IT investment and ROI (Strassman, 1990; Loveman, 1988; Franke, 1987).
The productivity paradox concept then arose when Solow (1987) remarked
that “You can see the computers everywhere but in the productivity statistics”.
Rei (2004) noted that it can be argued that productivity growth has slowed as
investments in IT have grown. For many economists, this is proof that
information technology does not affect productivity. However, the available
evidence is mixed and does not solve the paradox. Brynjolfsson and Yang
(1996) reviewed numerous articles and found little empirical evidence
supporting the idea that IT investment has contributed to increases in output
and productivity growth. Strassman (2004), a leading figure in research
regarding IT investment also stated that according to his knowledge nobody
has been able to demonstrate that there is positive correlation between
money spent on IT and sustainable profits. His research found that

Gaybba SG 7050 918 2
71
companies spending more money on information technology, including a
higher ratio of information technology (costs) to labour costs, don't necessarily
have better financial performance. This suggests that investments in
information technology have no discernible impact on financial performance.
Brynjollfsson (1993; 1994); and Strassmann (1990) revealed in their studies,
the reasons why organisations invested in IT namely a need to create wealth;
the idea to improve output levels in production; in order to benefit by
producing quality products; to improve service delivery; to control
communication activities; and with the expectation to achieve customer
satisfaction. Organisations also expected IT would assist in the production of
products with a high level of speed and responsiveness. Firms expected to
benefit from IT by improving efficiency through gaining competitive advantage
over their competitors and increasing profits in organisations. They aimed to
improve the quality of life of the information worker by enabling them to share
information and knowledge and that IT would improve workers’ performance.
They also thought IT would enable workers to manage their work effortlessly
by saving time. Managers invested in IT with expectations that it would
facilitate their decision making processes.
Organisational expectations are being met through the changes that IT brings
towards improving organisational processes, and the way workers fulfil their
daily tasks. Information technology enables knowledge sharing, collaboration,
and supports management processes. IT allows for communication on
projects at any time and any place. New and emerging technology helps in
preserving the knowledge and information generated in organisations, and
delivers expected results although there are still some challenges or pitfalls
with such tools.
Measuring the value of an investment is an inextricable part of business
planning. A Return on Investment (ROI) calculation is only a small part of the
total value of an investment. Understanding, measuring and monitoring the
benefits delivered by IT is becoming vital to successfully exploiting business
technology. Organisations continue to question the benefits of IT in

Gaybba SG 7050 918 2
72
conjunction with new corporate initiatives such as business process re-
engineering, e-commerce, and enterprise resource planning. Despite the
potential benefits derived from IT investment, traditional capital budgeting
models have failed to estimate true IT values due to their inability to measure
complex interactions between IT and organisational performance.
Despite significant discussions in both the managerial and academic literature
concerning the importance of evaluating the payoffs of IT investments, there
has been little guidance on how to design or implement an appropriate IT
performance evaluation system. Epstein and Rejc (2005) noted that there is a
shortage of relevant metrics and an absence of a proper methodology to
evaluate the payoffs of IT investments. They report that in a survey published
in 2004 (McKinsey on IT), more than two thirds of CIO’s reported they had no
process for auditing the performance of their IT projects. Results also showed
that non-IT executives were less aware of the programs to measure IT
success and the return on investment effect of technology investment was
unclear. The uncomfortable fact remains that most companies have done an
abysmal job of determining accurately the economic, strategic and operational
returns on their IT investment (Maynard, 2006).
The earlier-mentioned studies by Brynjollfsson (1993, 1994); and Strassmann
(1990) were conducted in search of a relationship between IT and
investments, and revealed several problems that were still being experienced
in organisations regardless of what had been achieved. These researchers
highlighted that although managers make investment decisions, they tend to
play a passive role in ensuring that such systems are used effectively and
efficiently. Many people in organisations embraced IT, and some suffered
major psychological and physical challenges, such as the information
overload. The inability of managers to document any contribution IT has
made over the years is also human centric in nature. The researchers found
that there were lags between costs and benefit, showing poor short-term
results. This is seen between the time of learning and development among
workers, and between the new technology or other business processes and
the changes that are inevitable in organisations, which take into account the

Gaybba SG 7050 918 2
73
benefits and return on investments in IT that do not show immediately. These
systems still crash and lead to a loss of valuable information and knowledge in
organisations. Managers are also affected by the many difficulties in
quantifying the benefits of IT, e.g. the difficulties in finding appropriate
measurement instruments. This brings about hitches to the benefits and
rewards if work and incentives are not appropriately adjusted. The result is
that IT might increase organisational slack instead of output or profits. In
some instances, the rewards are directly immeasurable. The truth is there are
no comprehensive models to measure the changes IT brings. In addition,
investigations on IT and productivity have not been at all satisfactory, which
raises frustration and misunderstanding of the measures and methods
commonly used to assess productivity in organisations and the industries.
The purpose, problem statement and objectives of the study
When computers were first introduced to organisations, they carried lots of
promise for the immediate achievement of results. Organisations started
investing in Information Technology (IT) with an insight that this would provide
a solution to all their organisational problems. Organisations were
encouraged by the notion that investing in IT correlates with higher returns
and the delivery of expected results by replacing the human component in
organisations. Marketers continuously sell new and emerging technological
solutions to organisations, thereby pressurising them to invest into IT.
For most of the past half-century, organisations have been increasing their
investments in IT, primarily because of the belief that IT has a significant
impact on organisational performance (Osey-Bryson & Ko, 2004).
Management now seeks more concrete evidence of the business and the real
value of their often extensive IT investments (Serafeimidis & Smithson, 2000).
Despite massive investment in IT by both the public and private sectors, there
seems to be an apparent lack of evidence concerning the impact on
productivity and business performance of such investments. During the past
decade a great deal of attention has focused on the impact of IT investment.
However studies have frequently generated controversial or inconsistent
results. Success stories give impressive examples of the effects of

Gaybba SG 7050 918 2
74
investment in IT on a firm’s performance and competitive advantage, and
therefore, become one of the key areas in organisational investment
strategies. At the same time, several empirical studies have failed to find any
positive relationships between extensive use of IT and organisational
efficiency, performance and success (Guerreiro & Serrano, 2006). At firm,
industry and economy level there is contradictory evidence on whether IT
expenditure has resulted in business value. The statistical uncertainty adds
substance to a continuing business worry about how the value of IT
expenditure can be measured.
Although it is important that a firm should invest in IT and the competitive
advantages from superior IT investments be widely recognised (Brynjolfsson
& Hitt, 1998), some research (Harris & Katz, 1989) has shown that it is
unlikely that higher expenditures on IT alone will ensure a firm’s superior
performance and actual returns received on IT investments vary widely
(Brynjolfsson & Hitt, 1998). It is opined that the greatest benefits of IT appear
to be realised by organisations when IT investment is coupled with other
complementary investments, such as organisational reengineering,
restructuring and redesign (Lee & Bose, 2002). IT investments may not
automatically improve financial performance; instead, it is one essential tool,
but needs to be coupled with organisational factors such as business
strategies to be truly effective (Shin, 2001).
Earlier studies revealed that there existed no evidence of a relationship
between IT spend and the financial performance of a firm. More recent
studies did reveal significant relationships but in general studies have found
mixed results. Studies that have found relationships indicated that a lagged
effect exist between IT investment and the financial performance of a firm.
Another group of researchers also noted the indirect value of IT saying that it
act as a catalyst. The reasons for the mixed results were contributed to data
reliability, analysis methods and the lack of proper ways to measure the effect
of IT investment. The South African Post Office (SAPO), as with other
organisation, also considers the return on their investments. With their

Gaybba SG 7050 918 2
75
strategic plan set out to have an operating profit of one billion rand by
2009/10, they are faced with evaluating the value of their IT spend.
The primary research objective of this study was to determine the relationship
between IT expenditure and the financial performance of a firm. The study
also explored the perceived value of IT investment in a company. Based on
the case study of the South African Post Office, the research determined the
relationship between IT expenditure and the perceived returns. Regardless of
theoretical arguments and professional belief in favour of a positive relation
between investment in IT and firm performance, empirical evidence on this
relation has been inconclusive and has arrived at multifaceted conclusions
that have sometimes been conflicting (Lee & Bose, 2002). Beyond theory
development, numerous attempts have been made to relate IS/IT
expenditures, computational intensity, MIS budget, or other particular
strategies to firm performance (Guerreiro & Serrano, 2006).
Several empirical studies and ample anecdotal evidence indicate that
companies that spend more on IT are not rewarded with superior financial
performance (Stratopoulos & Dehning 2000). Stratopoulos and Dehning
(2000) report empirical evidence that suggests the financial performance of a
firm is more related to the way IT assets are managed than the level of
organisational spending on new technology, and thus, adding further
dimensions to the productivity paradox.
Methodology
The study followed an exploratory case study approach. In addressing the
primary research objective, statistical techniques were employed to determine
the relationship between IT expenditure and the financial performance of the
firm. The secondary research objective was addressed using survey research
to explore the perceived value of IT investment amongst a sample of
management within SAPO. In addressing the primary research objective,
monthly financial data was obtained from SAPO for the period April 2002 to
March 2006, giving 48 data points in total. Audited financial figures were
provided for four variables, namely operating revenue; operating expenses;

Gaybba SG 7050 918 2
76
net profit; and IT operating expenses. The net profit of the SAPO was chosen
as indicator variable for the financial performance of the firm, whereas IT
operating expenditure would serve as proxy for IT expenditure of the firm.
Annexure A shows the financial data for the four mentioned variables.
The secondary research objective explored perceptions. A non-probability
purposive approach was used to gather data from a quota specified sample of
50 managers at SAPO across the five main operational and support
departments. Respondents were selected based on their perceived
knowledge and insight into IT investment within the firm and intended
outcomes. Quotas were also specified to obtain a representation of managers
across the noted departments given research budget and time constraints,
restricting gathering data from all employees.
A semi-structured self-administering questionnaire was used as data
gathering instrument. The questionnaire consisted of a number of questions
being categorical and was grouped into two sections. Section A dealt with
respondent’s demographic characteristics and section B dealt with
respondent’s perspectives on IT. The analysis of financial data from SAPO to
determine the relationship between IT expenditure and the financial
performance of the firm involved both regression and time series analysis.
Regression analysis was performed to investigate the linear relationship
between operating and IT expenditure and operating revenue and profit/loss.
The analysis however did not include investigating the possible time effect of
IT expenditure on revenue, as hypothesised by a number of authors
(Brynjolfsson & Hitt, 1998; Lee & Kim, 2006), but merely to investigate if any
relationship could be detected irrespective of time-dependence. In order to
investigate a possible lagged effect, time series analysis was utilised.
The next step involved the analysis of the survey data. Hussey and Hussey
(1997) noted that most statistical literature commonly draws a distinction
between exploratory data analysis and descriptive statistics, which is used to
summarise or display quantitative data, and confirmatory data analysis or
inferential statistics, which involves using quantitative data collected from a

Gaybba SG 7050 918 2
77
sample to draw conclusions about a complete population. In this study, the
focus fell primarily on exploratory data analysis, and involved the construction
of one-dimensional frequency tables. This provided a base for summarising
and presenting of data, which enabled patterns and relationships to be
discovered which were not apparent in the raw data.
Interpretation of the data collected
The first hypothesis aimed to investigate if a positive lag effect exists between
IT expenditure and the financial performance of the firm. In the case of the
South African Post Office (SAPO), it was found that a significant positive
relationship existed between IT expenditure and net profit at a lag of around 6
to 8 months. This suggests that IT expenditure is having a delayed positive
effect of around 6 month on the financial performance of the SAPO. In the
light of this finding, the hypothesis is accepted.
The second hypothesis considered if IT is perceived by line-management in
SAPO to have indirect value on the performance of the firm. The findings
suggested that IT is considered a strategic and tactical component within
SAPO and therefore a necessary business expense. It is also perceived by
the majority to be efficient. However, the findings also suggested that
respondents were not convinced that IT is able to increase sales, reduce cost
or meet customer requirements.
Summary and conclusions
From the literature it is apparent that there are probably as many different
viewpoints and findings to whether investing in IT is good or not. The findings
of this study related with findings reported by other researchers on the positive
relationship between investment in IT and organisational performance
(Mahmood, Mann, Dubrow & Skidmore, 1998. Rai, Patnayakuni; &
Patnayakuni, 1997. Mitra & Chaya, 1996. Brynjolfsson & Hitt, 1996. Mahmood
& Mann, 1993. Brynjolfsson, 1993. Alpar & Kim, 1990). The literature did,
however, reveal that some researchers question these results on the grounds
that the studies involved examination of primarily cross-sectional data. This
criticism stems at least in part from the premise that the benefits of IT

Gaybba SG 7050 918 2
78
investment can be realised only over longer periods of time. It is possible that
in many instances IT has the potential to provide important benefits within the
same year the investment is made, as was found in the case of the SAPO.
These benefits is not necessarily restricted to a single year and the total ripple
effects are difficult to measure as IT investments do not occur in single
events, but rather on a continuous basis.
Another important conclusion that is made is that IT provides competitive
advantages to firms by adding value across all aspects of the value chain,
improving operational performance, reducing costs, increasing decision
quality and enhancing service innovation and differentiation.
According to Porter’s Value Chain, Information Technology functions in a
supportive role to the primary activities, in order to create value in a company.
A company’s margin or profit depends on its effectiveness in performing these
activities efficiently. It is in these activities that a firm has the opportunity to
generate superior value. The greatest benefits of IT appear to be realised
when IT investment was coupled with other complementary investments; new
strategies, new business processes and new organisations. This furthermore
supported by Ross, Beath and Goodhue (1996 as cited by Hu & Plant, 2001)
which suggested that sustained competitive advantages can be achieved
through building and leveraging key IT assets such as human resources,
reusable technology and partnership between IT and business management.
The underlying theory is that these operational and strategic improvements as
a result of effective use of IT should lead to corresponding improvements in
productivity, revenue, and profits for those firms which consistently make
higher investment in IT than their competitors. In the case of high-tech
companies, IT is often the product or service that directly contributes to
revenue and profit.
In the light of the above, it is recommended that the value of IT, both on a
financial basis and perceived basis, be measured regularly. It should be
incorporated into review reports such as the Balanced Scorecard, to ensure

Gaybba SG 7050 918 2
79
that personnel and management takes cognisance of IT expenditure and that
real effort should be made to evaluate its effect on the business at all levels.

Gaybba SG 7050 918 2
80
South African Journal of Business Management: Instructions to Authors
Lay-out of manuscripts: Articles should be submitted on computer diskette.
The following particulars must appear on the diskette: author’s surname;
name of computer program used (e.g. Word 2000); and file name (e.g.
LIB280.DOC). With the diskette three paper copies and three copies of all
figures (the originals plus two copies) should be submitted to the Editor. Use
A4-size paper, 1.5 spacing and margins of 30mm for the paper copies of the
manuscript. The first page must contain the title with the name and complete
address of the author to whom correspondence is to be sent. The title, which
should be concise but sufficiently informative for information retrieval
purposes, should also appear on the second page without the names of the
authors. Articles should not exceed 20 pages. The text of the manuscript
must be preceded by an abstract in English of about 200 words. Papers in
another official language must carry an extended English summary to facilitate
information retrieval by international abstracting agencies. The extended
abstract must consist of some 1000 words.
Manuscripts for publication should be submitted to the Scientific Editor:
Professor Eon Smit, South African Journal of Business Management, Director,
Graduate School of Business, University of Stellenbosch, PO Box 610,
Bellville 7535 South Africa. E-mail address: [email protected]
Instructions to authors appear in English only. No articles will be published
without first undergoing an anonymous but rigorous refereeing procedure.
The editor reserves the right to make the final decision with respect to
publication.

Gaybba SG 7050 918 2
81
BIBLIOGRAPHY & REFERENCES
Al-Mudimigh, A. Zairi M, and Al-Mashari M., 2001, ERP Implementation: An
Integrative Methodology. E-Commerce-Induced Reengineering,
European Journal of Information Systems, 10: 216-226
Brynjolfsson, E. Hitt, L.M., 1998, Beyond the productivity paradox.
Forthcoming in the Communications of the ACM. June Edition.
Byrd, T.A., Lewis, B.R. and Bryan, R.W., 2006, The leveraging influence of
strategic alignment on IT investment: An empirical examination.
Information & Management, Amsterdam. Vol. 43, Issue 3 pp.308, April.
Churchill, G.A., Suprenant, C., 1982, An investigation into the determinants of
customer satisfaction. Journal of Marketing Research, Vol 16
Computer Science Corporation. 2003 Information Technology Investment
Study, Grocery Manufacturers of America, Washington DC
Cresswell, A.M., 2004, return on investment in Information Technology: A
guide for managers. Center for Technology in Government, University
of Albany
Dasgupta, S. Sarkis, J. and Talluri, S., 1999, Influence of information
technology investment on firm productivity: a cross-sectional study.
Logistics Information Management Vol. 12 Numbers 1/2, MCB
University Press
Demirhan, D., Jacob, V.S. and Raghunathan, S., 2005, Information
technology investment strategies under declining technology cost.
Journal of Management Information Systems, Armonk, Winter 2005-
2006, Vol. 22, Issue 3 p.321

Gaybba SG 7050 918 2
82
Devaraj, S. and Kohli, R. 2003, Measuring information technology pay-off: A
meta-analysis of structural variables in firm-level empirical research.
Information Systems Research Vol. 14, No 2 pp.127 - 145.
Epstein, M.J., Rejc, A., 2005a, How to measure and improve the value of IT.
Strategic Finance. October Edition.
Epstein, M.J., Rejc, A., 2005b, Measuring the payoffs of IT investments. CMA
Management. December 2004/January 2005. Vol. 78 Issue 8 p.20.
Goh, K.H. and Kauffman, R.J., 2005, Towards a theory of value latency for IT
investments. Proceedings of the 38th Hawaii International Conference
on System Sciences.
Grasenick, K., Low, J., 2004, Shaken, not stirred: Defining and connecting
indicators for measurement and valuation of intangibles, Journal of
Intellectual Capital, Vol. 5 No. 2, pp. 268-281, Emerald Group
Publishing Limited
Guerreiro, A. Serrano, A., 2006, IS/IT investments, stakeholders and firm
performance, European and Mediterranean Conference on Information
Systems (EMCIS) 2006, July 6-7 2006, Costa Blanca, Alicante, Spain
Harris, S.E.; Katz, J.L., 1989. Predicting organizational performance using
information technology managerial control ratios. Proceedings, 22nd
Hawaiian International Conference on Systems Sciences, Honolulu, HI,
USA.
Hu, Q. Plant, R., 2001, An empirical study of the causal relationship between
IT investment and firm performance. Information Resources
Management Journal. July - September Edition, Idea Group Publishing

Gaybba SG 7050 918 2
83
Hussey, J., and Hussey, R., 1997, Business Research: A practical guide for
undergraduate and post graduate students. Macmillan Press LTD,
London
Intel, 2004, Managing IT investments. Intel’s Information Technology White
Paper, Intel Corporation USA
Johannessen, J., Olaisen, J. and Olsen, B., 1999, Strategic use of information
technology for increased innovation and performance, Information
Management & Computer Security 7/1, 5±22, MCB University Press
Kaplan, R.S. and Norton, D.P., 1996, The Balanced Scorecard, Harvard
Business School Press, Boston, MA.
Leedy, P., Ormrod, J., 2001, Practical research: Planning and design. Upper
Saddle River, NJ, Prentice-Hall.
Lim, J.H., Richardson, V.J. and Roberts, T.L., 2004, Information technology
investment and firm performance: A meta-analysis. Proceedings of the
38th Hawaii International Conference on System Sciences.
Lee, S. and Kim, S.H., 2006, A lag effect of IT investment on firm
performance. Information Resource Management Journal, Hershey,
Jan-Mar 2006, Vol. 19, Issue 1 p.43
Love, P.E.D. and Zahir, I., 2004, An Exploratory Study of Psychological
Adjustment and Coping among Information Technology Personnel in
Australia, ECIS
Maynard, C., 2006, Measuring the value of IT investment. Journal of
Commerce, New York

Gaybba SG 7050 918 2
84
Osey-Bryson, K. and Ko, M., 2004, Exploring the relationship between
information technology investments and firm performance using
regression splines analysis. Information & Management, 42: 1-13.
Porter, M.E., 1985, Competitive advantage: creating and sustaining superior
performance. New York: The Free Press
Rei, C., 2004, Causal evidence on the “productivity paradox” and implications
for managers, International Journal of Productivity and Performance
Management Vol. 53 No. 2, pp. 129-142
RESOURCE MANAGEMENT SYSTEMS, INC, 2006, FAQ: IT Budgeting
[online]. Available on: http://www.rms.net/lc_faq_other_roi.htm
(Accessed 19 March 2006)
SAPO (South African Post Office Limited), 2004, Consolidated Annual
Financial Statements for the year ended 31 March 2004
Sigala, M., 2003, The information and communication technologies
productivity impact on the UK hotel sector, International Journal of
Operations & Production Management, Vol. 23 No. 10, pp. 1224-1245,
MCB UP Limited
Strassmann, P.A., 2004, Six rules for finding IT value. Cutter IT Journal. Vol.
17, No 8.
Serafeimidis, V. & Smithson, S., 2000, Information Systems Evaluation in
Practice: A Case Study of Organizational Change, Journal of
Information Technology, Vol 15, No 2, pp 93-105.
Westerlind, K., 2004, Evaluating return on information technology investment.
School of Economics and Commercial Law Gothenburg University,
Department of Informatics

Gaybba SG 7050 918 2
85
ANNEXURE A: FINANCIAL DATA

Gaybba SG 7050 918 2
86
ANNEXURE B: CROSS CORRELATION FUNCTION
Cross Correlations: IT_OP_EXP IT OPERATING EXPENSES
NET_PR_1 DIFF(NET_PROF,1)
Cross Stand.
Lag Corr. Err. -1 -.75 -.5 -.25 0 .25 .5 .75 1
����������������������������������������� -18 .004 .183 . * .
-17 -.116 .180 . ** .
-16 .055 .177 . * .
-15 .042 .174 . * .
-14 -.041 .171 . * .
-13 -.009 .169 . * .
-12 .046 .167 . * .
-11 .000 .164 . * .
-10 .009 .162 . * .
-9 -.137 .160 . *** .
-8 .111 .158 . ** .
-7 .048 .156 . * .
-6 -.008 .154 . * .
-5 -.163 .152 . *** .
-4 .153 .151 . *** .
-3 -.020 .149 . * .
-2 -.026 .147 . * .
-1 -.014 .146 . * .
0 .003 .144 . * .
1 -.009 .146 . * .
2 .074 .147 . * .
3 -.124 .149 . ** .
4 .020 .151 . * .
5 .135 .152 . *** .
6 -.011 .154 . * .
7 -.342 .156 *.***** .
8 .410 .158 . *****.**
9 -.231 .160 .***** .
10 .097 .162 . ** .
11 -.027 .164 . * .
12 -.041 .167 . * .
13 -.005 .169 . * .
14 .173 .171 . *** .
15 -.069 .174 . * .
16 -.218 .177 . **** .
17 .330 .180 . *******
18 -.136 .183 . *** .
Plot Symbols: Autocorrelations * Two Standard Error Limits .
Total cases: 48 Computable 0-order correlations: 48

Gaybba SG 7050 918 2
87
ANNEXURE C: SURVEY QUESTIONNAIRE
QUESTIONNAIRE
THE RELATIONSHIP BETWEEN IT CAPITAL INVESTMENT
AND THE FINANCIAL PERFORMANCE OF A FIRM
Dear respondent
This questionnaire aims at measuring your perceptions on value of information technology (IT) in your
department. The completion of this questionnaire will take approximately 10 minutes. Thank you for
participating in this study.
Notes to respondent
• There are no right or wrong answers
• Your honest input is appreciated
• Your responses will be treated confidentially
SECTION A: DEMOGRAPHIC INFORMATION Please circle the appropriate code
Male 1 1. Gender:
Female 2 /1
18 - 24 years 1
25 – 34 years 2
35 – 49 years 3
50 – 59 years 4
2. Age:
60+ years 5 /2
General Staff / Administrative 1
Supervisory / Junior Management 2
Middle Management 3
Senior Management 4
General Manager 5
3: Employee level:
Executive Management 6 /3
Finance 1
Human Resources 2
Operations 3
Information Technology 4
4. Department:
Support Services 5 /4

Gaybba SG 7050 918 2
88
Non-value adding cost 1
Necessary business expense 2
Return-producing investment 3
5. What is the predominantly view of Information Technology by senior management? Strategic asset 4 /5
We compete at the cutting edge of innovation and use IT as a competitive weapon
1
We view IT as a critical and essential investment area, and invest in leading, but proven, technologies
2
We stay current on technology, without getting too far ahead our competition
3
We take a conservative approach using proven, mature technologies
4
6. How would you characterise your organisation’s use of IT [please circle only one]
Other (please specify) 5 /6
Not at all effective 1
Somewhat effective 2
Acceptable 3
Effective 4
7. How do you rate the effectiveness of your IT organisation?
Very effective 5 /7
Indicate in the appropriate block to what extent you agree or disagree to the following statements:
Strongly disagree Disagree
Neither agree nor disagree Agree
Strongly agree
8. IT provides our company the ability to increase sales
1 2 3 4 5 /8
9. IT provides a way for our company to reduce costs
1 2 3 4 5 /9
10. IT gives our company competitive advantage
1 2 3 4 5 /10
11. IT supports and is aligned to business strategy
1 2 3 4 5 /11
12. IT is an important component of our business strategy
1 2 3 4 5 /12
13. IT is a tactical aspect of our business 1 2 3 4 5 /13
14. IT is a core competence in our company 1 2 3 4 5 /14
15. IT supports the needs of the business 1 2 3 4 5 /15
16. IT plays an integral role in meeting customer requirements
1 2 3 4 5 /16
17. IT does a good job in meeting customer requirements
1 2 3 4 5 /17
Unclear return on investments 1
Uncertain about the role of industry exchanges 2
Other capital projects have higher priority 3
Rapidly changing technology 4
Wait to see proven applications in this industry 5
Security issues 6
Instability of technology 7
Top management commitment 8
Lack of business leadership 9
Lack of people with appropriate skills 10
18. What do you believe are the risks or issues that would make you hesitate in investing in IT? [please tick all that apply]
Other (please specify)
11 /18

Gaybba SG 7050 918 2
89
ANNEXURE D: SURVEY RESULTS
n %
1. Gender: Male 27 54.0%
Female 23 46.0%
Total 50 100.0%
n %
2. Age: 18 - 24 yrs 2 4.0%
25 - 34 yrs 15 30.0%
35 - 49 yrs 29 58.0%
50 - 59 yrs 4 8.0%
Total 50 100.0%
n %
3. Employee level: General Staff/ Administrative 14 28.0%
Supervisory/ Junior Management 8 16.0%
Middle Management 15 30.0%
Senior Management 6 12.0%
General Management 2 4.0%
Executive Summary 5 10.0%
Total 50 100.0%
n %
4. Department: Finance 10 20.0%
Human Resources 10 20.0%
Operations 10 20.0%
Information Technology 10 20.0%
Support Services 10 20.0%
Total 50 100.0%
n %
5. What is the predominantly view of IT by senior management?
Non-value adding cost 5 10.0%
Necessary business expense 23 46.0%
Return-producing investment 9 18.0%
Strategic asset 13 26.0%
Total 50 100.0%
n %
6. How would you characterise your organisation's use of IT?
We compete at the cutting edge of innovation and use IT as a competitive weapon
6 12.0%
We view IT as a critical and essential investment area, and invest in leading, but proven, technologies
14 28.0%
We stay current on technology, without getting too far ahead our competition
16 32.0%
We take a conservative approach using proven, mature technologies
14 28.0%
Total 50 100.0%

Gaybba SG 7050 918 2
90
n %
7. How do you rate the effectiveness of your IT organisation?
Not at all effective 2 4.0%
Somewhat effective 18 36.0%
Acceptable 23 46.0%
Affective 7 14.0%
Total 50 100.0%
n %
8. IT provides our company the ability to increase sales
Strongly disagree 4 8.0%
Disagree 12 24.0%
Neither agree nor disagree 9 18.0%
Agree 20 40.0%
Strongly agree 5 10.0%
Total 50 100.0%
n %
9. IT provides a way for our company to reduce costs
Strongly disagree 4 8.0%
Disagree 13 26.0%
Neither agree nor disagree 10 20.0%
Agree 17 34.0%
Strongly agree 6 12.0%
Total 50 100.0%
n %
10. IT gives our company competitive advantage
Strongly disagree 3 6.0%
Disagree 13 26.0%
Neither agree nor disagree 11 22.0%
Agree 16 32.0%
Strongly agree 7 14.0%
Total 50 100.0%
n %
11. IT supports and is aligned to business strategy
Strongly disagree 3 6.0%
Disagree 15 30.0%
Neither agree nor disagree 11 22.0%
Agree 18 36.0%
Strongly agree 3 6.0%
Total 50 100.0%
n %
12. IT is an important component of our business strategy
Strongly disagree 1 2.0%
Disagree 4 8.0%
Neither agree nor disagree 5 10.0%
Agree 28 56.0%
Strongly agree 12 24.0%
Total 50 100.0%

Gaybba SG 7050 918 2
91
n %
13. IT is a tactical aspect of our business
Strongly disagree 2 4.0%
Disagree 4 8.0%
Neither agree nor disagree 8 16.0%
Agree 30 60.0%
Strongly agree 6 12.0%
Total 50 100.0%
n %
14. IT is a core competence in our company
Strongly disagree 3 6.0%
Disagree 14 28.0%
Neither agree nor disagree 13 26.0%
Agree 13 26.0%
Strongly agree 7 14.0%
Total 50 100.0%
n %
15. IT supports the needs of the business
Strongly disagree 2 4.0%
Disagree 8 16.0%
Neither agree nor disagree 13 26.0%
Agree 21 42.0%
Strongly agree 6 12.0%
Total 50 100.0%
n %
16. IT plays an integral role in meeting customer requirements
Strongly disagree 10 20.0%
Disagree 7 14.0%
Neither agree nor disagree 28 56.0%
Strongly agree 5 10.0%
Total 50 100.0%
n %
17. IT does a good job in meeting customer requirements
Strongly disagree 6 12.0%
Disagree 10 20.0%
Neither agree nor disagree 12 24.0%
Agree 18 36.0%
Strongly agree 4 8.0%
Total 50 100.0%

Gaybba SG 7050 918 2
92
n %
18. What do you believe are the risks or issues that would make you hesitate in investing in IT?
Unclear return on investment 21 42.0%
Uncertain about the role of industry exchanges 6 12.0%
Other capital projects have higher priority 7 14.0%
Rapidly changing technology 15 30.0%
Wait to see proven applications in this industry 7 14.0%
Security issues 14 28.0%
Instability of technology 23 46.0%
Top management commitment 16 32.0%
Lack of business leadership 20 40.0%
Lack of people with appropriate skills 33 66.0%
Total 50