Embed Size (px)
Citation preview

Return on Capital Employed
2013 Review of the NZ Listed Sector and NZ Crown Entities
June 2014
2013 Return on Capital Employed
1 | P a g e
Contents
Foreword 2
Executive Summary 3
Top 10 Performers 4
Distribution of Results 5
Markets 6
International Comparison 7
Crown Entities 8
Non-Listed Companies 9
Sector Performance 10
Individual Entities 12
Background on Armillary Private Capital 16
Sources of Data 16
Appendix 1 – Detailed Results 17
Appendix 2 – ROCE Explained 23
Disclaimer
The information contained in this report has been prepared by Armillary Private Capital ('Armillary'). While the intention is to provide
accurate information based on historical performance and market information, Armillary accepts no liability for any errors or
inaccuracies in this report. The reader is advised to perform their own research to confirm the accuracy of the information contained
in this report before relying on it for any investment decision making. This report has been prepared as a 'class service' as defined by
the Financial Advisers Act and is general in nature.
2013 Return on Capital Employed
2 | P a g e
Foreword
We are delighted to bring you the third Armillary Private Capital Return on Capital Employed (ROCE) report. This year we have
added several more Crown Entities to our data set of NZX, NZAX, Unlisted and selected Crown entities bringing the total number of
entities reviewed to 160. In addition to these, we have also reviewed a sample of 37 non-listed companies and compared their results
to the overall dataset although we have not identified the entities individually.
The ROCE methodology we have used in this report was developed by Du Pont Corporation and therefore is not proprietary to us,
although we are proponents. As it is simple to apply, anyone who understands the methodology can use it. We regularly use this
methodology as a tool in our client engagements and in our financial training curriculum.
A benefit of the ROCE methodology is that the performance of an entity can be broken down into its components of profitability and
activity, for deeper analysis. Profitability, as measured by EBIT margin, provides an indication of operational efficiency; activity, as
measured by asset turn-over, provides an indication of balance-sheet efficiency. A full explanation of ROCE is included in Appendix 2.
This year’s report includes an overview of the major sectors in the economy to demonstrate the effect that differences in business
models has had in the subsequent profitability, activity and overall ROCE performance. We have then explored these differences in
more depth by comparing the six electricity generator-retailers by ROCE and its components.
We continue to advocate the ROCE methodology in our work with businesses as a simple to use and easily understood tool for
measuring business performance, identifying improvement strategies, creating incentive remuneration programs, and for testing
budgets and forecasts, especially those applied in valuations. We also see the data and results in this report as providing useful
benchmarks for business performance in the New Zealand market.
We trust that the insights contained in this report provide value to investors, business owners and managers alike.
David Wallace
Managing Director
2013 Return on Capital Employed
3 | P a g e
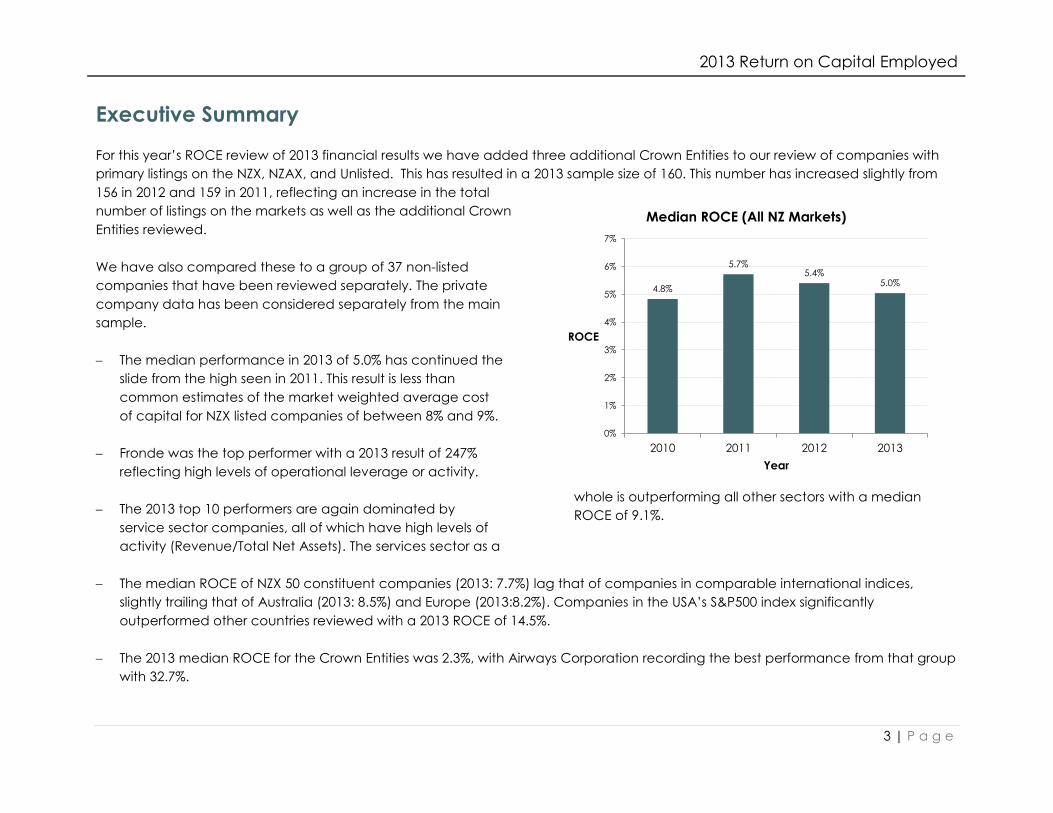
Executive Summary
For this year’s ROCE review of 2013 financial results we have added three additional Crown Entities to our review of companies with
primary listings on the NZX, NZAX, and Unlisted. This has resulted in a 2013 sample size of 160. This number has increased slightly from
156 in 2012 and 159 in 2011, reflecting an increase in the total
number of listings on the markets as well as the additional Crown
Entities reviewed.
We have also compared these to a group of 37 non-listed
companies that have been reviewed separately. The private
company data has been considered separately from the main
sample.
The median performance in 2013 of 5.0% has continued the
slide from the high seen in 2011. This result is less than
common estimates of the market weighted average cost
of capital for NZX listed companies of between 8% and 9%.
Fronde was the top performer with a 2013 result of 247%
reflecting high levels of operational leverage or activity.
The 2013 top 10 performers are again dominated by
service sector companies, all of which have high levels of
activity (Revenue/Total Net Assets). The services sector as a
whole is outperforming all other sectors with a median
ROCE of 9.1%.
The median ROCE of NZX 50 constituent companies (2013: 7.7%) lag that of companies in comparable international indices,
slightly trailing that of Australia (2013: 8.5%) and Europe (2013:8.2%). Companies in the USA’s S&P500 index significantly
outperformed other countries reviewed with a 2013 ROCE of 14.5%.
The 2013 median ROCE for the Crown Entities was 2.3%, with Airways Corporation recording the best performance from that group
with 32.7%.
4.8%
5.7%5.4%
5.0%
0%
1%
2%
3%
4%
5%
6%
7%
2010 2011 2012 2013
ROCE
Year
Median ROCE (All NZ Markets)

2013 Return on Capital Employed
4 | P a g e
Top 10 Performers
The top 10 entities by 2013 ROCE performance are dominated by businesses that in general have high levels of activity
(revenue/assets), like technology, retail and service-oriented businesses.
Fronde, as the top named performer, had a 6.4% Profitability ratio (up from 4.2% in 2012) and a 38.5x Activity Ratio in 2013 (down from
39.6x in 2012). Diligent Board Member Services (‘Diligent’), last year’s top performer1, produced a 2013 Profitability Ratio of 16.0%,
down from 19.5% in 2012 and its Activity Ratio of 5.7x was also down from 8.1x in 2012. After having restated its financial reports and
incurred significant cost in doing so, Diligent’s ROCE has slipped from 157.1% in 2012 to 91.3% in 2013.
The top three ROCE values achieved in 2013 for each of the
four markets analysed were as follows;
For the NZX market, Diligent 91.3%, Briscoe Group 80.2%,
and Hallenstein Glasson 57.3%;
For the NZAX market, Burger Fuel 28.9%, Just Water 15.0%
and Livestock Improvement 10.4%;
For the Unlisted market, the top three performers were
Fronde 246.8%, Connexionz 24.0% and Skyline 13.6%; and
Of the 9 Crown Entities sampled the top performers were
Airways Corporation 32.7%, Metservice 14.8%, and Kordia
9.4%.
1 Before restatement. Diligent has since restated its 2012 results which would place it as the second best performer for 2012.
Comparative 2012 figures are as per the restatement.
(150%)
(100%)
(50%)
0%
50%
100%
150%
200%
250%
A2 C
orp
ora
tio
n
So
uth
Po
rt N
ew
Ze
ala
nd
Bu
rge
r Fu
el W
orld
wid
e
Airw
ays
Co
rpo
ratio
n O
f N
Z
AW
F G
rou
p
NZX
Ha
llen
ste
in G
lass
on
Ho
ldin
gs
Brisc
oe
Gro
up
Dili
ge
nt
Bo
ard
Me
mb
er
Se
rvic
es
Fro
nd
e S
yst
em
s G
rou
p
ROCE
Top 10 ROCE 2013
2011
2012
2013
2013 Return on Capital Employed
5 | P a g e
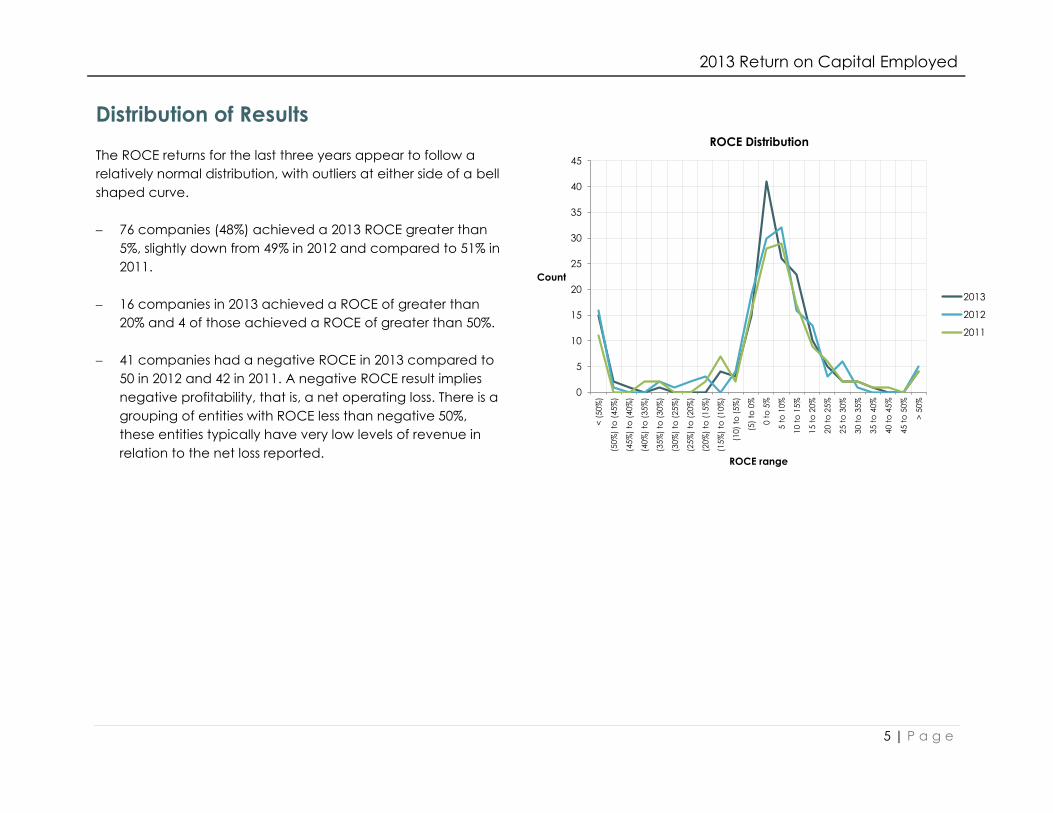
Distribution of Results
The ROCE returns for the last three years appear to follow a
relatively normal distribution, with outliers at either side of a bell
shaped curve.
76 companies (48%) achieved a 2013 ROCE greater than
5%, slightly down from 49% in 2012 and compared to 51% in
2011.
16 companies in 2013 achieved a ROCE of greater than
20% and 4 of those achieved a ROCE of greater than 50%.
41 companies had a negative ROCE in 2013 compared to
50 in 2012 and 42 in 2011. A negative ROCE result implies
negative profitability, that is, a net operating loss. There is a
grouping of entities with ROCE less than negative 50%,
these entities typically have very low levels of revenue in
relation to the net loss reported.
0
5
10
15
20
25
30
35
40
45
< (
50%
)
(50%
) to
(45%
)
(45%
) to
(40%
)
(40%
) to
(35%
)
(35%
) to
(30%
)
(30%
) to
(25%
)
(25%
) to
(20%
)
(20%
) to
(15%
)
(15%
) to
(10%
)
(10)
to (
5%
)
(5)
to 0
%
0 t
o 5
%
5 t
o 1
0%
10 t
o 1
5%
15 t
o 2
0%
20 t
o 2
5%
25 t
o 3
0%
30 t
o 3
5%
35 t
o 4
0%
40 t
o 4
5%
45 t
o 5
0%
> 5
0%
Count
ROCE range
ROCE Distribution
2013
2012
2011

2013 Return on Capital Employed
6 | P a g e
Markets
The median ROCE performance by market for the last three years shows:
The NZX listed entities had a consistent median performance ranging between 6.3% to 6.4%;
Those entities listed on the NZAX market have been consistent median under-performers compared to the overall median for all
entities. Note that of the 19 issuers reviewed from the NZAX, eight had either less than $1m in revenue or no revenue at all. The
negative median ROCE is representative of the mix of young loss-making companies and non-operating or pre-revenue
businesses present;
Unlisted issuers median performance
fell from 5.6% to 4.4% for 2013;
The Crown Entities reviewed are not
performing as well as their listed
counterparts, although all produced
positive ROCE in 2013; and
Our sample of private non-listed
companies had a significantly higher
ROCE than their NZ listed counterparts
with a median 2013 ROCE of 10.3%.
However, the cost of capital for these
private companies, in particular the
cost of equity, will be significantly
higher. (50.0%)
(40.0%)
(30.0%)
(20.0%)
(10.0%)
0.0%
10.0%
20.0%
NZX NZAX Unlisted Crown Private
ROCE
Market
Median Annual ROCE by Market
2011
2012
2013
2013 Return on Capital Employed
7 | P a g e
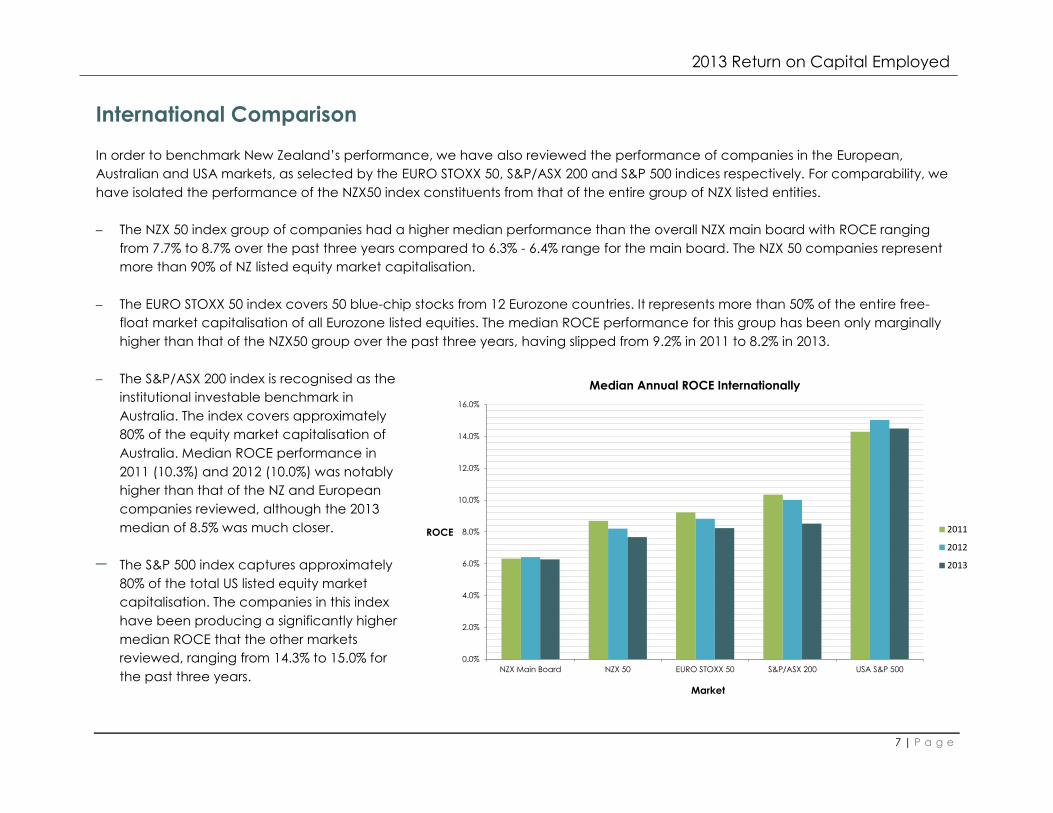
International Comparison
In order to benchmark New Zealand’s performance, we have also reviewed the performance of companies in the European,
Australian and USA markets, as selected by the EURO STOXX 50, S&P/ASX 200 and S&P 500 indices respectively. For comparability, we
have isolated the performance of the NZX50 index constituents from that of the entire group of NZX listed entities.
The NZX 50 index group of companies had a higher median performance than the overall NZX main board with ROCE ranging
from 7.7% to 8.7% over the past three years compared to 6.3% - 6.4% range for the main board. The NZX 50 companies represent
more than 90% of NZ listed equity market capitalisation.
The EURO STOXX 50 index covers 50 blue-chip stocks from 12 Eurozone countries. It represents more than 50% of the entire free-
float market capitalisation of all Eurozone listed equities. The median ROCE performance for this group has been only marginally
higher than that of the NZX50 group over the past three years, having slipped from 9.2% in 2011 to 8.2% in 2013.
The S&P/ASX 200 index is recognised as the
institutional investable benchmark in
Australia. The index covers approximately
80% of the equity market capitalisation of
Australia. Median ROCE performance in
2011 (10.3%) and 2012 (10.0%) was notably
higher than that of the NZ and European
companies reviewed, although the 2013
median of 8.5% was much closer.
The S&P 500 index captures approximately
80% of the total US listed equity market
capitalisation. The companies in this index
have been producing a significantly higher
median ROCE that the other markets
reviewed, ranging from 14.3% to 15.0% for
the past three years. 0.0%
2.0%
4.0%
6.0%
8.0%
10.0%
12.0%
14.0%
16.0%
NZX Main Board NZX 50 EURO STOXX 50 S&P/ASX 200 USA S&P 500
ROCE
Market
Median Annual ROCE Internationally
2011
2012
2013
2013 Return on Capital Employed
8 | P a g e
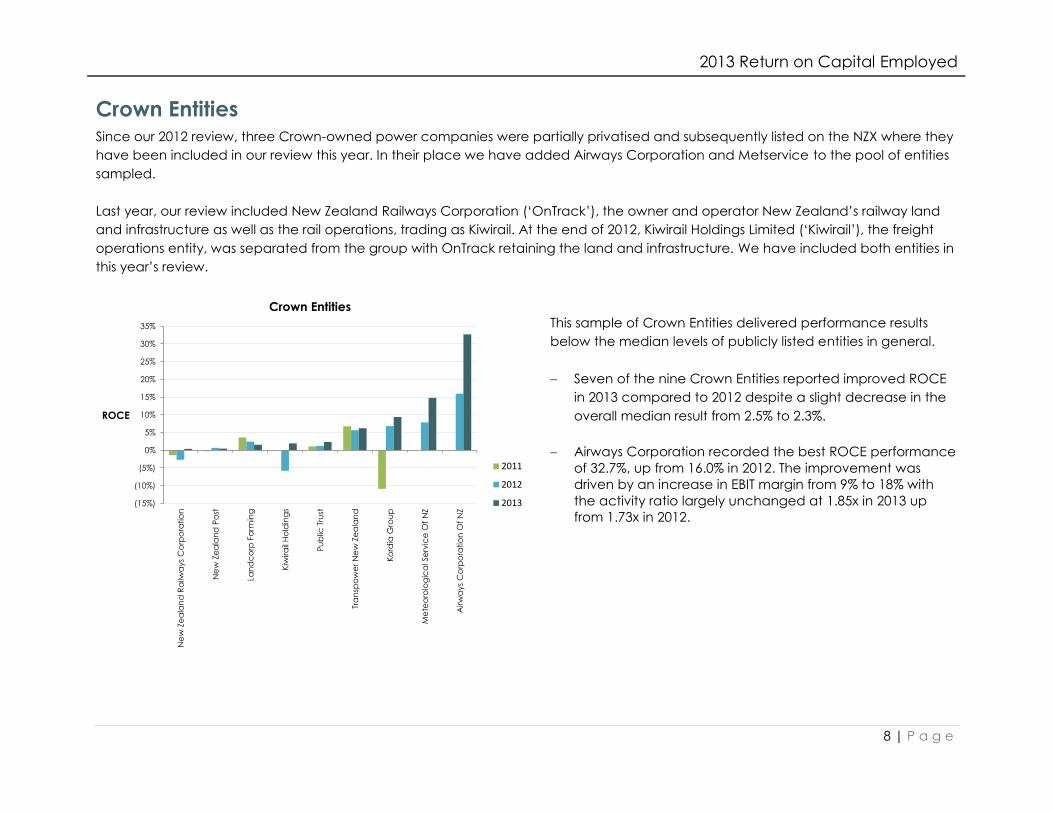
Crown Entities Since our 2012 review, three Crown-owned power companies were partially privatised and subsequently listed on the NZX where they
have been included in our review this year. In their place we have added Airways Corporation and Metservice to the pool of entities
sampled.
Last year, our review included New Zealand Railways Corporation (‘OnTrack’), the owner and operator New Zealand’s railway land
and infrastructure as well as the rail operations, trading as Kiwirail. At the end of 2012, Kiwirail Holdings Limited (‘Kiwirail’), the freight
operations entity, was separated from the group with OnTrack retaining the land and infrastructure. We have included both entities in
this year’s review.
This sample of Crown Entities delivered performance results
below the median levels of publicly listed entities in general.
Seven of the nine Crown Entities reported improved ROCE
in 2013 compared to 2012 despite a slight decrease in the
overall median result from 2.5% to 2.3%.
Airways Corporation recorded the best ROCE performance
of 32.7%, up from 16.0% in 2012. The improvement was
driven by an increase in EBIT margin from 9% to 18% with
the activity ratio largely unchanged at 1.85x in 2013 up
from 1.73x in 2012.
(15%)
(10%)
(5%)
0%
5%
10%
15%
20%
25%
30%
35%
Ne
w Z
ea
lan
d R
ailw
ays
Co
rpo
ratio
n
Ne
w Z
ea
lan
d P
ost
Lan
dc
orp
Fa
rmin
g
Kiw
ira
il H
old
ing
s
Pu
blic
Tru
st
Tra
nsp
ow
er
Ne
w Z
ea
lan
d
Ko
rdia
Gro
up
Me
teo
rolo
gic
al S
erv
ice
Of
NZ
Airw
ays
Co
rpo
ratio
n O
f N
Z
ROCE
Crown Entities
2011
2012
2013

2013 Return on Capital Employed
9 | P a g e
Non-Listed Companies
This year we have also reviewed a selection of 37 non-listed companies to compare how they are performing in relation to their listed
peers.
This sample is not large enough to make definitive conclusions regarding the nature of private companies in New Zealand and there is
a bias towards younger, growing companies in the dataset. In terms of industry representation, 23 of these companies are involved in
the manufacturing or retail of goods, nine are involved in services, particularly technology, and five operate in the primary sector.
In summary:
There was a significant grouping of performance with more
than 40% of ROCE results falling between 0% and 25% for both
2012 and 2013;
There were also a large number of outliers present with more
than 35% of ROCE results with less than negative 50% or
greater than 50%; and
The median ROCE fell from 14.2% to 10.3% from 2012 to 2013.
Although the median ROCE is higher than that reported for the NZ
listed sector, ROCE needs to be judged against the weighted
average cost of capital of the entity. In the case of these typically
younger, growing companies, the capital weighting will typically
be biased towards equity rather than debt. In addition to equity
being more expensive than debt in general, the cost of equity for private companies is significantly higher than that of listed
companies due to investors requiring a premium for higher risk. For example, higher risk relates to smaller sized, less mature firms
potentially with less depth and/or quality of management, lower quality of information disclosure and lack of liquidity or marketability
of the equity holding. Therefore the 2013 median ROCE of 10.3% would suggest that the majority of the private companies reviewed
are not generating a return above their weighted average cost of capital, which for public companies is around 8%-9%.
0
1
2
3
4
5
6
7
8
9
10
< (
50
%)
(50%
) to
(4
0%
)
(40%
) to
(3
0%
)
(30%
) to
(2
0%
)
(20)
to (
10%
)
(10)
to 0
%
0 t
o 1
0%
10 t
o 2
0%
20 t
o 3
0%
30 t
o 4
0%
40 t
o 5
0%
> 5
0%
Count
ROCE range
ROCE Distribution, Private Companies
2013
2012
2013 Return on Capital Employed
10 | P a g e
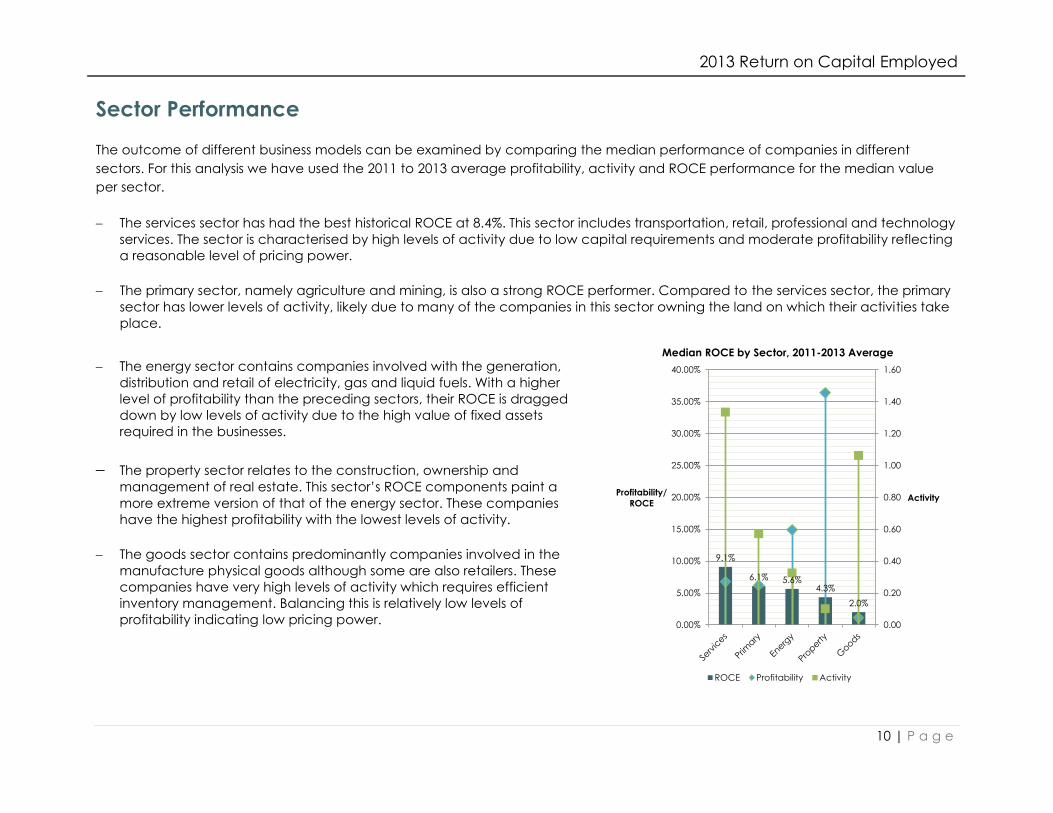
Sector Performance
The outcome of different business models can be examined by comparing the median performance of companies in different
sectors. For this analysis we have used the 2011 to 2013 average profitability, activity and ROCE performance for the median value
per sector.
The services sector has had the best historical ROCE at 8.4%. This sector includes transportation, retail, professional and technology
services. The sector is characterised by high levels of activity due to low capital requirements and moderate profitability reflecting
a reasonable level of pricing power.
The primary sector, namely agriculture and mining, is also a strong ROCE performer. Compared to the services sector, the primary
sector has lower levels of activity, likely due to many of the companies in this sector owning the land on which their activities take
place.
The energy sector contains companies involved with the generation,
distribution and retail of electricity, gas and liquid fuels. With a higher
level of profitability than the preceding sectors, their ROCE is dragged
down by low levels of activity due to the high value of fixed assets
required in the businesses.
The property sector relates to the construction, ownership and
management of real estate. This sector’s ROCE components paint a
more extreme version of that of the energy sector. These companies
have the highest profitability with the lowest levels of activity.
The goods sector contains predominantly companies involved in the
manufacture physical goods although some are also retailers. These
companies have very high levels of activity which requires efficient
inventory management. Balancing this is relatively low levels of
profitability indicating low pricing power.
9.1%
6.1% 5.6%4.3%
2.0%
0.00
0.20
0.40
0.60
0.80
1.00
1.20
1.40
1.60
0.00%
5.00%
10.00%
15.00%
20.00%
25.00%
30.00%
35.00%
40.00%
ActivityProfitability/
ROCE
Median ROCE by Sector, 2011-2013 Average
ROCE Profitability Activity
2013 Return on Capital Employed
11 | P a g e
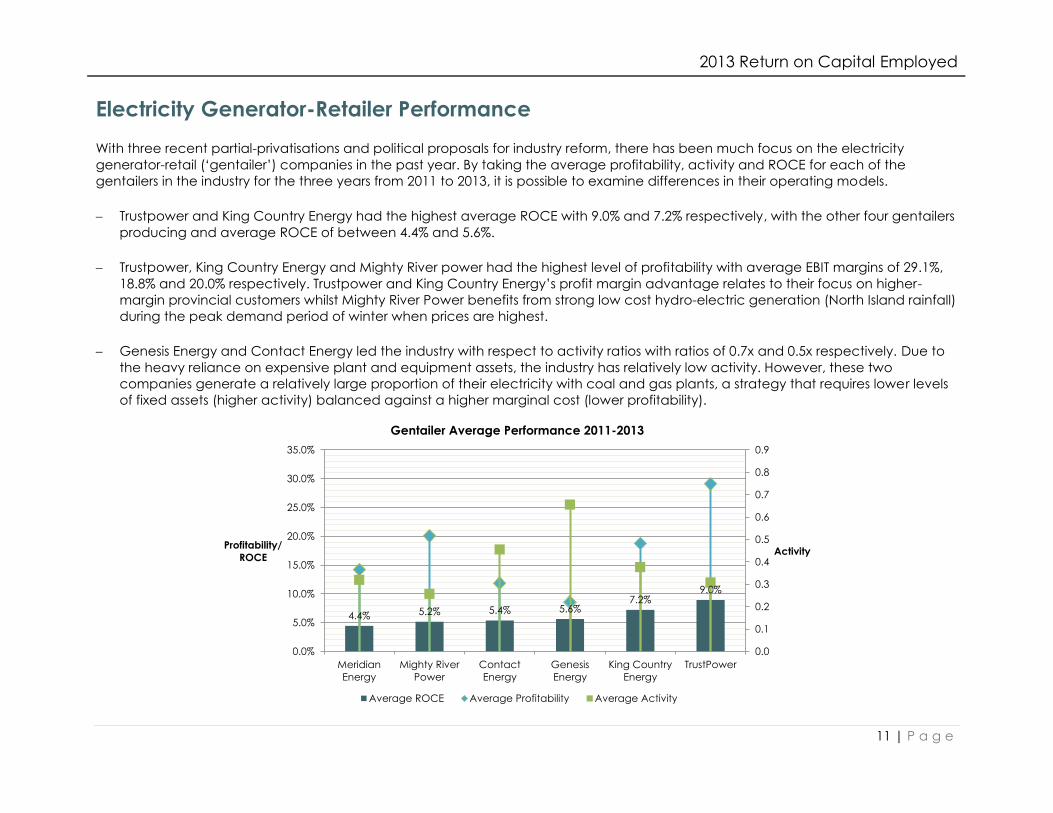
Electricity Generator-Retailer Performance
With three recent partial-privatisations and political proposals for industry reform, there has been much focus on the electricity
generator-retail (‘gentailer’) companies in the past year. By taking the average profitability, activity and ROCE for each of the
gentailers in the industry for the three years from 2011 to 2013, it is possible to examine differences in their operating models.
Trustpower and King Country Energy had the highest average ROCE with 9.0% and 7.2% respectively, with the other four gentailers
producing and average ROCE of between 4.4% and 5.6%.
Trustpower, King Country Energy and Mighty River power had the highest level of profitability with average EBIT margins of 29.1%,
18.8% and 20.0% respectively. Trustpower and King Country Energy’s profit margin advantage relates to their focus on higher-
margin provincial customers whilst Mighty River Power benefits from strong low cost hydro-electric generation (North Island rainfall)
during the peak demand period of winter when prices are highest.
Genesis Energy and Contact Energy led the industry with respect to activity ratios with ratios of 0.7x and 0.5x respectively. Due to
the heavy reliance on expensive plant and equipment assets, the industry has relatively low activity. However, these two
companies generate a relatively large proportion of their electricity with coal and gas plants, a strategy that requires lower levels
of fixed assets (higher activity) balanced against a higher marginal cost (lower profitability).
4.4% 5.2% 5.4% 5.6%7.2%
9.0%
0.0
0.1
0.2
0.3
0.4
0.5
0.6
0.7
0.8
0.9
0.0%
5.0%
10.0%
15.0%
20.0%
25.0%
30.0%
35.0%
Meridian
Energy
Mighty River
Power
Contact
Energy
Genesis
Energy
King Country
Energy
TrustPower
ActivityProfitability/
ROCE
Gentailer Average Performance 2011-2013
Average ROCE Average Profitability Average Activity

2013 Return on Capital Employed
12 | P a g e
Individual Entities
The following four charts show the individual ROCE performance for each of the 160 listed and Crown entities reviewed in 2013. Note
for the purposes of presenting this chart, entities with ROCE greater than 75% have been capped at 75% as they are relative outliers.
The 40 entities in the top quartile are dominated by technology, retail and service related companies, and top quartile ROCE
performance ranges from 12.1% to 246.8%.
0%
10%
20%
30%
40%
50%
60%
70%
Tea
mta
lk
Sc
ott
Te
ch
no
log
y
Ch
oru
s
Tele
co
m
Turn
ers
Au
ctio
ns
Fish
er
& P
ayke
l He
alth
ca
re
Me
thve
n
He
llab
y H
old
ing
s
Ea
stp
ac
k
Skylin
e E
nte
rprise
s
SK
YC
ITY
En
tert
ain
me
nt
Gro
up
Co
lon
ial M
oto
r C
o.
Tra
de
Me
Gro
up
Me
teo
rolo
gic
al S
erv
ice
Of
NZ
Just
Wa
ter
Inte
rna
tio
na
l
Ma
infr
eig
ht
Ne
w Z
ea
lan
d O
il &
Ga
s
Wa
reh
ou
se G
rou
p
De
leg
at's
Gro
up
Fre
igh
twa
ys
Pu
mp
kin
Pa
tch
Ph
arm
ac
yb
ran
ds
Ka
thm
an
du
Ho
ldin
gs
Mic
ha
el H
ill In
tern
atio
na
l
Ske
lleru
p H
old
ing
s
CD
L In
ve
stm
en
ts N
Z
Op
us
Inte
rna
tio
na
l Co
nsu
lta
nts
Co
nn
exio
nz
Re
sta
ura
nt
Bra
nd
s N
ew
Ze
ala
nd
A2 C
orp
ora
tio
n
So
uth
Po
rt N
ew
Ze
ala
nd
Bu
rge
r Fu
el W
orld
wid
e
Airw
ays
Co
rpo
ratio
n O
f N
Z
AW
F G
rou
p
NZX
Ha
llen
ste
in G
lass
on
Ho
ldin
gs
Brisc
oe
Gro
up
Dili
ge
nt
Bo
ard
Me
mb
er
Se
rvic
es
Fro
nd
e S
yst
em
s G
rou
p
2013 ROCE - Top Quartile
2013 Return on Capital Employed
13 | P a g e
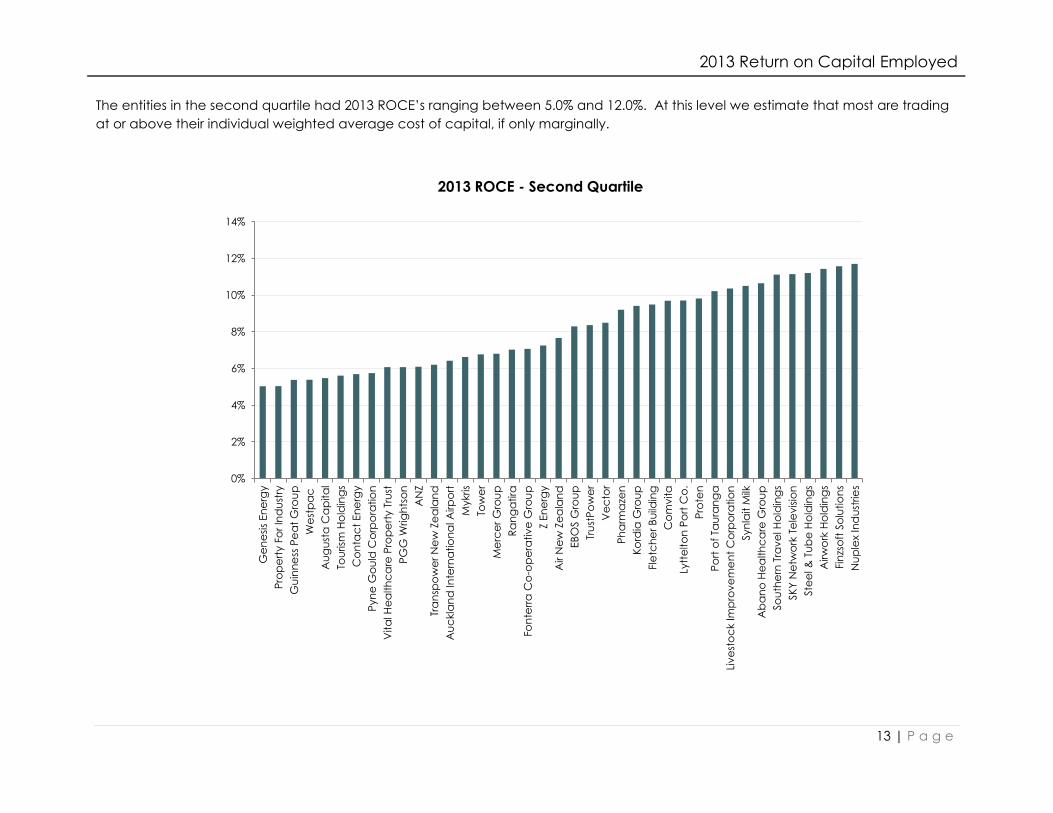
The entities in the second quartile had 2013 ROCE’s ranging between 5.0% and 12.0%. At this level we estimate that most are trading
at or above their individual weighted average cost of capital, if only marginally.
0%
2%
4%
6%
8%
10%
12%
14%
Ge
ne
sis
En
erg
y
Pro
pe
rty F
or
Ind
ust
ry
Gu
inn
ess
Pe
at
Gro
up
We
stp
ac
Au
gu
sta
Ca
pita
l
Tou
rism
Ho
ldin
gs
Co
nta
ct
En
erg
y
Pyn
e G
ou
ld C
orp
ora
tio
n
Vita
l He
alth
ca
re P
rop
ert
y T
rust
PG
G W
rig
hts
on
AN
Z
Tra
nsp
ow
er
Ne
w Z
ea
lan
d
Au
ckla
nd
In
tern
atio
na
l Airp
ort
Mykris
Tow
er
Me
rce
r G
rou
p
Ra
ng
atira
Fon
terr
a C
o-o
pe
rativ
e G
rou
p
Z E
ne
rgy
Air N
ew
Ze
ala
nd
EB
OS G
rou
p
Tru
stP
ow
er
Ve
cto
r
Ph
arm
aze
n
Ko
rdia
Gro
up
Fle
tch
er
Bu
ildin
g
Co
mv
ita
Lytt
elto
n P
ort
Co
.
Pro
ten
Po
rt o
f Ta
ura
ng
a
Liv
est
oc
k Im
pro
ve
me
nt
Co
rpo
ratio
n
Syn
lait M
ilk
Ab
an
o H
ea
lth
ca
re G
rou
p
So
uth
ern
Tra
ve
l Ho
ldin
gs
SK
Y N
etw
ork
Te
lev
isio
n
Ste
el &
Tu
be
Ho
ldin
gs
Airw
ork
Ho
ldin
gs
Fin
zso
ft S
olu
tio
ns
Nu
ple
x In
du
strie
s
2013 ROCE - Second Quartile
2013 Return on Capital Employed
14 | P a g e
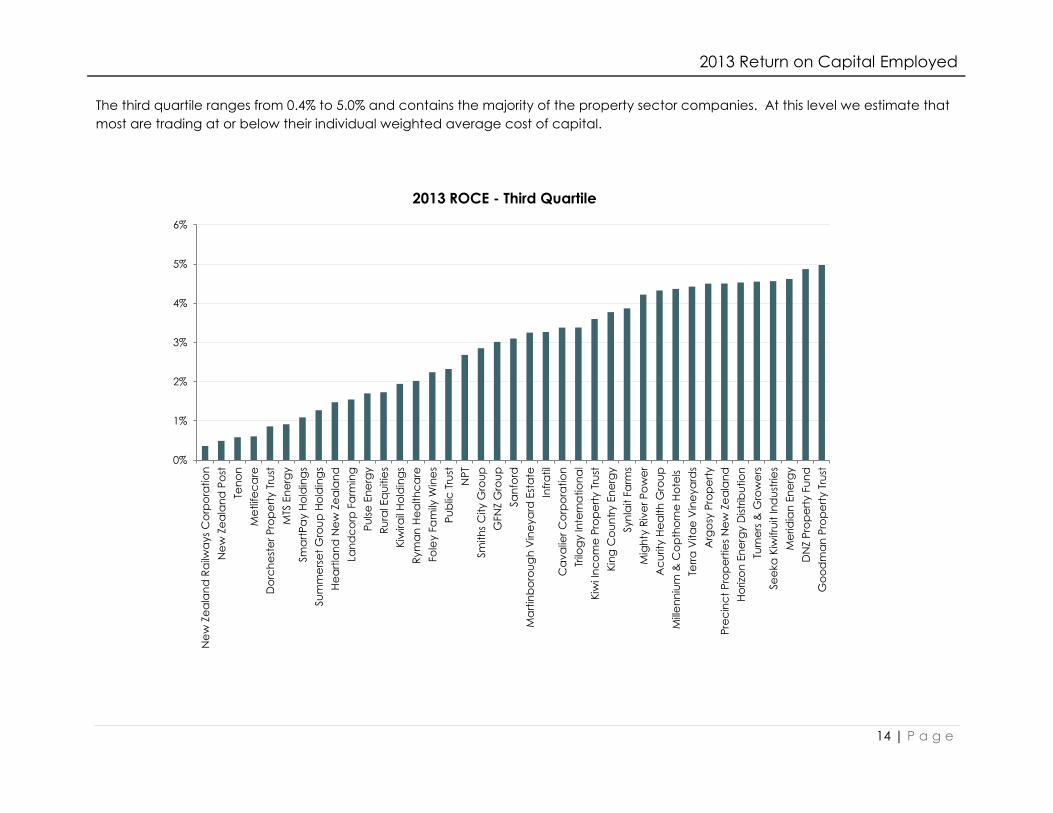
The third quartile ranges from 0.4% to 5.0% and contains the majority of the property sector companies. At this level we estimate that
most are trading at or below their individual weighted average cost of capital.
0%
1%
2%
3%
4%
5%
6%
Ne
w Z
ea
lan
d R
ailw
ays
Co
rpo
ratio
n
Ne
w Z
ea
lan
d P
ost
Ten
on
Me
tlife
ca
re
Do
rch
est
er
Pro
pe
rty T
rust
MTS
En
erg
y
Sm
art
Pa
y H
old
ing
s
Su
mm
ers
et
Gro
up
Ho
ldin
gs
He
art
lan
d N
ew
Ze
ala
nd
Lan
dc
orp
Fa
rmin
g
Pu
lse
En
erg
y
Ru
ral E
qu
itie
s
Kiw
ira
il H
old
ing
s
Rym
an
He
alth
ca
re
Fole
y F
am
ily W
ine
s
Pu
blic
Tru
st
NP
T
Sm
ith
s C
ity G
rou
p
GFN
Z G
rou
p
Sa
nfo
rd
Ma
rtin
bo
rou
gh
Vin
eya
rd E
sta
te
Infr
atil
Ca
va
lier
Co
rpo
ratio
n
Trilo
gy In
tern
atio
na
l
Kiw
i In
co
me
Pro
pe
rty T
rust
Kin
g C
ou
ntr
y E
ne
rgy
Syn
lait F
arm
s
Mig
hty
Riv
er
Po
we
r
Ac
urity
He
alth
Gro
up
Mill
en
niu
m &
Co
pth
orn
e H
ote
ls
Terr
a V
ita
e V
ine
ya
rds
Arg
osy
Pro
pe
rty
Pre
cin
ct
Pro
pe
rtie
s N
ew
Ze
ala
nd
Ho
rizo
n E
ne
rgy D
istr
ibu
tio
n
Turn
ers
& G
row
ers
Se
eka
Kiw
ifru
it In
du
strie
s
Me
rid
ian
En
erg
y
DN
Z P
rop
ert
y F
un
d
Go
od
ma
n P
rop
ert
y T
rust
2013 ROCE - Third Quartile

2013 Return on Capital Employed
15 | P a g e
The fourth quartile of entities are those entities with a ROCE of 0.3% or less. Note that for the purposes of this chart those entities with a
ROCE of less than negative 75% have been constrained to negative 75%. Those entities with negative ROCE reported negative EBIT
margins.
We note that some of the entities at the bottom of this quartile are focused on a significant growth strategy at the expense of
profitability. Xero and Moa are examples of this strategy. Those mature businesses in this quartile need to reconsidering the viability of
their business models.
Appendix 1 contains a table of individual entity results including 2012 and 2013 Profitability (EBIT margin) and Activity Ratios in addition
to the 2011, 2012 and 2013 and three-year average ROCE.
(75%)
(65%)
(55%)
(45%)
(35%)
(25%)
(15%)
(5%)
Sn
akk M
ed
ia
Pa
cific
Ed
ge
Ge
oO
p
Pro
mis
ia In
teg
rative
VM
ob
Gro
up
Wo
ol E
qu
itie
s
Ve
tilo
t
Win
dflo
w T
ec
hn
olo
gy
Orio
n M
ine
rals
Gro
up
Alli
ed
Fa
rme
rs
Mo
a G
rou
p
Xe
ro
SLI
Syst
em
s
BLI
S T
ec
hn
olo
gie
s
We
llin
gto
n D
rive
Te
ch
no
log
ies
Re
na
issa
nc
e C
orp
ora
tio
n
Wyn
ya
rd G
rou
p
En
erg
y M
ad
Po
stie
Plu
s G
rou
p
NZF G
rou
p
So
lutio
n D
yn
am
ics
Sp
eirs
Gro
up
Co
oks
Glo
ba
l Fo
od
s
Blu
e S
ky M
ea
ts
Ra
ko
n
Kirkc
ald
ie &
Sta
ins
Ao
rere
Re
sou
rce
s
NZ W
ind
farm
s
RIS
Gro
up
Silv
er
Fern
Fa
rms
Ch
ath
am
Ro
ck P
ho
sph
ate
Ne
w T
alis
ma
n G
old
Min
es
Ne
w Z
ea
lan
d R
efin
ing
Co
.
Se
ale
gs
Co
rpo
ratio
n
No
rth
lan
d P
ort
Co
rpo
ratio
n
Do
rch
est
er
Pa
cific
Ba
thu
rst
Re
sou
rce
s
Ru
bic
on
Mo
wb
ray C
olle
cta
ble
s
2013 ROCE - Bottom Quartile
2013 Return on Capital Employed
16 | P a g e
About Armillary Private Capital
Armillary Private Capital is a specialist investment banking, asset and markets management, financial training and advisory firm
focused on the NZ capital markets. Our purpose is enabling success for businesses, business owners and investors.
Our approach is based on a combination of influences grounded in our purpose, methodology and experiences. We have worked
with a range of New Zealand businesses through all stages of the business lifecycle from start-up to maturity. Be they private, listed or
government-related we have seen and experienced the roller-coaster rides business owners and managers endure. These
experiences allow us to quickly identify a client’s needs and find the right solution.
An important part of our approach is the use of proven financial tools and methodologies to provide a concise but comprehensive
view of business performance. A key methodology that underpins our work is the DuPont method as used in this report. This powerful
but highly practical method of analysis allows us to develop a rapid understanding of the underlying performance of a business and
to identify key business drivers. This disciplined approach helps us with quality decision-making in our work.
Sources of Data
The data for this analysis and report has been compiled by Armillary Private Capital from annual reports and data obtained through
FactSet Research Systems.

2013 Return on Capital Employed
17 | P a g e
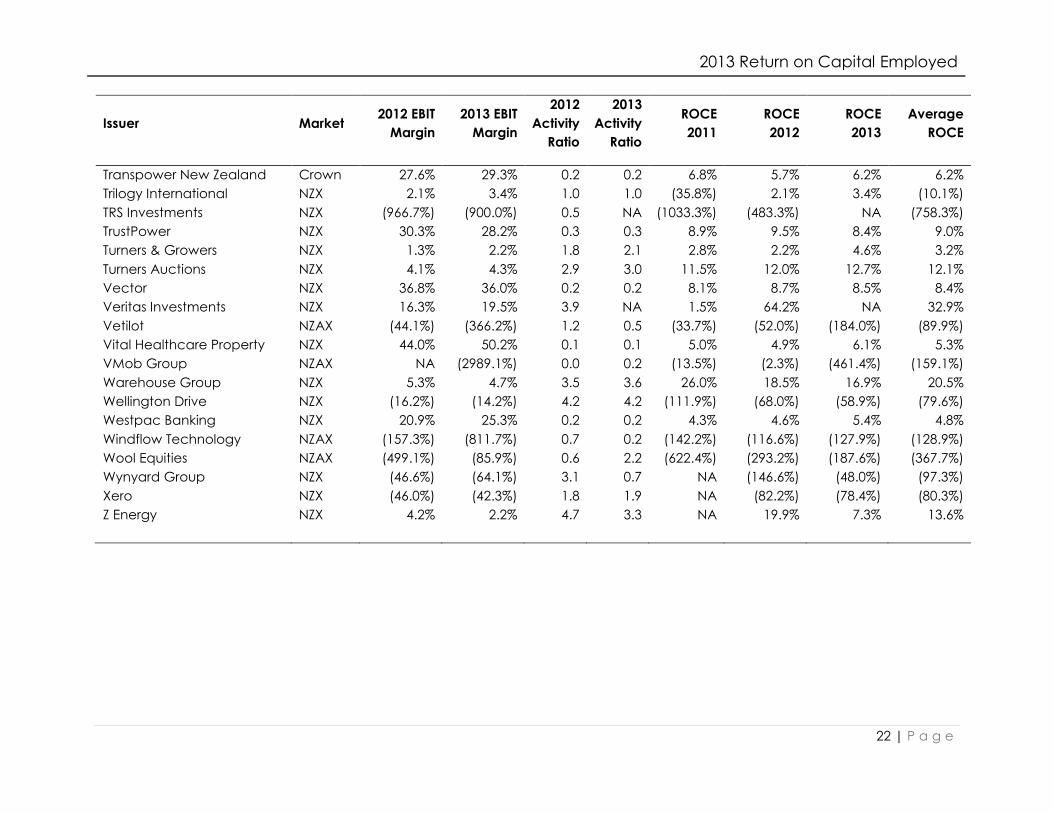
Appendix 1 – Detailed Results
Issuer Market 2012 EBIT
Margin
2013 EBIT
Margin
2012
Activity
Ratio
2013
Activity
Ratio
ROCE
2011
ROCE
2012
ROCE
2013
Average
ROCE
A2 Corporation NZX 6.2% 9.7% 2.3 2.5 23.8% 14.3% 24.3% 20.8%
Abano Healthcare Group NZX 8.4% 9.1% 1.3 1.2 9.5% 11.1% 10.7% 10.4%
Acurity Health Group NZX 12.0% 8.8% 0.6 0.5 7.2% 6.9% 4.3% 6.2%
Air New Zealand NZX 5.4% 6.2% 1.2 1.2 11.6% 6.7% 7.7% 8.7%
Airways Corporation Crown 9.3% 17.7% 1.7 1.9 NA 16.0% 32.7% 24.3%
Airwork Holdings NZX 13.9% 14.9% NA 0.8 NA NA 11.4% 11.4%
Allied Farmers NZX (70.3%) (42.6%) 0.8 2.3 (12.7%) (57.8%) (98.7%) (56.4%)
Aorere Resources NZX NA (77.0%) 0.0 0.1 NA NA (6.3%) (6.3%)
Argosy Property NZX 28.2% 45.7% 0.1 0.1 3.7% 3.2% 4.5% 3.8%
Auckland International
Airport
NZX 57.6% 57.8% 0.1 0.1 6.3% 6.1% 6.4% 6.3%
Augusta Capital NZX 35.4% 43.8% 0.1 0.1 0.5% 3.5% 5.5% 3.2%
ANZ NZX 19.8% 25.4% 0.3 0.2 5.7% 5.9% 6.1% 5.9%
AWF Group NZX 5.1% 5.8% 5.5 5.9 31.8% 28.2% 34.3% 31.4%
Bathurst Resources NZX (52.3%) NA 0.1 0.0 (3.1%) (4.2%) (0.0%) (2.4%)
BLIS Technologies NZX (87.3%) (156.5%) 0.6 0.4 (57.7%) (49.4%) (63.9%) (57.0%)
Blue Sky Meats Unlisted (0.3%) (4.8%) 2.3 2.1 16.3% (0.6%) (10.1%) 1.8%
Briscoe Group NZX 8.4% 9.0% 8.7 8.9 54.7% 72.9% 80.2% 69.3%
Burger Fuel Worldwide NZAX 3.1% 6.0% 4.8 4.8 (147.2%) 14.7% 28.9% (34.6%)
Cavalier Corporation NZX 2.5% 2.7% 1.3 1.2 15.6% 3.2% 3.4% 7.4%
CDL Investments NZ NZX 46.5% 45.4% 0.3 0.5 5.6% 14.4% 20.6% 13.6%
Chatham Rock Phosphate NZAX NA NA NA 0.0 NA NA (2.2%) (2.2%)
Chorus NZX 34.3% 32.5% 0.2 0.4 NA 8.4% 12.4% 10.4%
Colonial Motor Co. NZX 3.3% 3.6% 3.6 3.8 5.7% 11.8% 13.9% 10.5%
Comvita NZX 11.5% 9.9% 1.0 1.0 7.0% 11.3% 9.7% 9.3%
Connexionz Unlisted (8.1%) 7.0% 4.2 3.4 (1.4%) (33.7%) 24.0% (3.7%)

2013 Return on Capital Employed
18 | P a g e
Issuer Market 2012 EBIT
Margin
2013 EBIT
Margin
2012
Activity
Ratio
2013
Activity
Ratio
ROCE
2011
ROCE
2012
ROCE
2013
Average
ROCE
Contact Energy NZX 11.0% 12.9% 0.5 0.4 5.1% 5.4% 5.7% 5.4%
Cooks Global Foods NZAX NA NA NA 0.0 (7250.0%) NA (10.2%) (3630.1%)
Delegat's Group NZX 18.1% 26.9% 0.7 0.7 13.5% 12.8% 17.5% 14.6%
Diligent Board Member
Services
NZX 19.5% 16.0% 8.1 5.7 (35.1%) 157.1% 91.3% 71.1%
DNZ Property Fund NZX 48.6% 52.6% 0.1 0.1 3.3% 4.6% 4.9% 4.3%
Dorchester Pacific NZX (17.0%) (0.6%) 0.2 0.3 23.6% (3.2%) (0.2%) 6.7%
Dorchester Property Trust Unlisted 8.1% 5.9% 0.2 0.1 1.7% 1.3% 0.9% 1.3%
Eastpack Unlisted 17.3% 7.0% 1.7 1.9 37.7% 29.3% 13.1% 26.7%
EBOS Group NZX 2.8% 3.1% 5.9 2.7 19.0% 16.7% 8.3% 14.7%
Energy Mad NZX (25.6%) (28.6%) 0.9 1.6 NA (22.1%) (47.1%) (34.6%)
Finzsoft Solutions NZX (6.8%) 4.7% 2.4 2.5 17.6% (16.6%) 11.6% 4.2%
Fisher & Paykel Healthcare NZX 8.7% 12.1% 1.1 1.1 14.9% 9.2% 12.8% 12.3%
Fletcher Building NZX 5.8% 6.4% 1.5 1.5 10.3% 8.9% 9.5% 9.6%
Foley Family Wines NZAX (7.7%) 7.2% 0.2 0.3 NA (1.2%) 2.2% 0.5%
Fonterra Co-operative
Group
NZX 4.3% 4.2% 1.8 1.7 8.7% 8.0% 7.1% 7.9%
Freightways NZX 16.2% 15.9% 1.1 1.1 17.2% 17.5% 17.6% 17.4%
Fronde Systems Group Unlisted 4.2% 6.4% 39.6 38.5 124.7% 166.8% 246.8% 179.4%
Genesis Energy NZX 9.9% 8.3% 0.7 0.6 5.1% 6.7% 5.0% 5.6%
GeoOp NZAX (37.5%) (307.5%) 7.7 1.7 NA (288.9%) (518.1%) (403.5%)
GFNZ Group NZAX (0.0%) 13.6% 0.2 0.2 (7.4%) (0.0%) 3.0% (1.5%)
Goodman Property Trust NZX 52.9% 56.2% 0.1 0.1 5.0% 5.1% 5.0% 5.0%
Guinness Peat Group NZX 1.9% 3.4% 1.0 1.6 3.3% 1.9% 5.4% 3.5%
Hallenstein Glasson
Holdings
NZX 12.2% 11.5% 5.3 5.0 60.8% 65.3% 57.3% 61.1%
Heartland New Zealand NZX 12.2% 15.3% 0.1 0.1 1.4% 1.4% 1.5% 1.4%
Hellaby Holdings NZX 5.2% 5.2% 3.1 2.5 14.0% 16.1% 13.0% 14.4%
Horizon Energy Distribution NZX 30.4% 7.7% 0.3 0.6 9.6% 10.6% 4.5% 8.2%
Infratil NZX 7.8% 6.0% 0.5 0.5 3.0% 4.1% 3.3% 3.4%
Just Water International NZAX 14.0% 12.8% 1.1 1.2 10.2% 15.2% 15.0% 13.5%
Kathmandu Holdings NZX 16.7% 16.5% 1.1 1.2 22.0% 18.3% 19.2% 19.9%
2013 Return on Capital Employed
19 | P a g e
Issuer Market 2012 EBIT
Margin
2013 EBIT
Margin
2012
Activity
Ratio
2013
Activity
Ratio
ROCE
2011
ROCE
2012
ROCE
2013
Average
ROCE
King Country Energy Unlisted 23.3% 11.3% 0.4 0.3 9.0% 8.9% 3.8% 7.2%
Kirkcaldie & Stains NZX (5.6%) (8.3%) 1.1 0.8 (3.8%) (6.0%) (6.5%) (5.5%)
Kiwi Income Property Trust NZX 38.9% 34.6% 0.1 0.1 4.4% 4.4% 3.6% 4.1%
Kiwirail Holdings Crown (32.4%) 6.4% 0.2 0.3 NA (5.8%) 1.9% (1.9%)
Kordia Group Crown 3.5% 4.6% 1.9 2.0 (10.9%) 6.8% 9.4% 1.8%
Landcorp Farming Crown 17.3% 11.7% 0.1 0.1 3.6% 2.5% 1.5% 2.5%
Livestock Improvement
Corporation
NZAX 10.9% 11.2% 0.9 0.9 14.5% 10.0% 10.4% 11.6%
Lyttelton Port Co. NZX 21.8% 22.4% 0.4 0.4 9.6% 9.5% 9.7% 9.6%
Mainfreight NZX 5.8% 5.6% 3.6 2.9 19.6% 20.8% 16.5% 18.9%
Martinborough Vineyard
Estate
Unlisted 23.5% 9.7% 0.4 0.3 0.9% 9.5% 3.3% 4.5%
Mercer Group NZX (1.4%) 3.9% 1.4 1.7 (13.0%) (2.0%) 6.8% (2.7%)
Meridian Energy NZX 9.2% 12.9% 0.3 0.4 5.7% 3.0% 4.6% 4.4%
Meteorological Service Crown 5.8% 10.9% 1.4 1.4 NA 7.9% 14.8% 11.3%
Methven NZX 9.8% 8.2% 1.6 1.6 12.6% 15.8% 13.0% 13.8%
Metlifecare NZX 4.3% 10.5% 0.1 0.1 0.5% 0.2% 0.6% 0.4%
Michael Hill International NZX 8.8% 9.1% 2.2 2.2 20.8% 19.0% 19.7% 19.8%
Mighty River Power NZX 18.1% 17.5% 0.3 0.2 6.3% 5.0% 4.2% 5.2%
Millennium & Copthorne
Hotels
NZX 19.8% 21.6% 0.2 0.2 1.9% 3.6% 4.4% 3.3%
Moa Group NZX (118.1%) (85.4%) 1.6 1.0 NA (191.0%) (85.9%) (138.5%)
Mowbray Collectables NZX 0.7% 0.5% 0.6 0.6 6.3% 0.4% 0.3% 2.3%
MTS Energy Unlisted 5.4% 1.3% 0.2 0.7 NA 1.1% 0.9% 1.0%
Mykris NZAX (78.0%) 11.7% NA 0.6 NA NA 6.6% 6.6%
New Talisman Gold Mines NZX NA NA 0.0 0.0 (1.3%) (1.5%) (1.7%) (1.5%)
New Zealand Oil & Gas NZX 46.1% 45.4% 0.4 0.4 11.6% 18.6% 16.6% 15.6%
New Zealand Post Crown 6.6% 3.9% 0.1 0.1 (0.3%) 0.7% 0.5% 0.3%
New Zealand Railways
Corporation
Crown (32.4%) 14.8% 0.1 0.0 (1.4%) (2.7%) 0.4% (1.2%)
New Zealand Refining Co. NZX 18.4% (2.9%) 0.4 0.3 6.6% 6.5% (0.7%) 4.1%
Northland Port Corporation NZX (34.5%) (38.6%) 0.0 0.0 (0.5%) (0.4%) (0.5%) (0.5%)
NPT NZX 38.0% 23.3% 0.2 0.1 4.6% 6.7% 2.7% 4.7%
2013 Return on Capital Employed
20 | P a g e
Issuer Market 2012 EBIT
Margin
2013 EBIT
Margin
2012
Activity
Ratio
2013
Activity
Ratio
ROCE
2011
ROCE
2012
ROCE
2013
Average
ROCE
Nuplex Industries NZX 6.2% 5.7% 2.2 2.0 16.9% 13.4% 11.7% 14.0%
NZ Windfarms NZX (46.0%) (40.5%) 0.1 0.1 (4.5%) (4.2%) (3.8%) (4.2%)
NZF Group NZX (131.0%) (23.2%) 0.0 1.4 (1.9%) (6.5%) (31.6%) (13.3%)
NZX NZX 27.3% 30.8% 0.8 1.3 24.2% 23.0% 39.7% 28.9%
Oceanagold Corporation NZX 13.8% NA 0.5 NA 10.9% 7.2% NA 9.1%
Opus International
Consultants
NZX 7.2% 7.3% 4.8 3.2 42.3% 34.4% 22.9% 33.2%
Orion Minerals Group NZAX NA NA 0.0 0.0 (191.5%) (136.7%) (121.3%) (149.8%)
Pacific Edge NZX (48059.5%) (48743.9%) 0.0 0.0 (757.9%) (982.6%) (911.7%) (884.1%)
PGG Wrightson NZX 3.1% 3.1% 1.7 2.0 3.4% 5.4% 6.1% 5.0%
Pharmacybrands NZX 7.6% 11.4% 2.4 1.7 (18.9%) 17.9% 18.9% 6.0%
Pharmazen Unlisted 8.5% 11.4% 1.0 0.8 8.6% 8.4% 9.2% 8.7%
Port of Tauranga NZX 42.7% 42.8% 0.2 0.2 8.2% 9.9% 10.2% 9.4%
Postie Plus Group NZX 1.2% (11.6%) 3.5 3.4 7.5% 4.3% (39.9%) (9.4%)
Precinct Properties NZX 45.9% 42.7% 0.1 0.1 6.3% 4.9% 4.5% 5.2%
Promisia Integrative NZX (882.4%) (326.3%) 0.2 1.6 (15.3%) (165.3%) (514.3%) (231.6%)
Property For Industry NZX 67.3% 63.6% 0.1 0.1 6.3% 5.6% 5.0% 5.7%
Proten Unlisted 41.9% 43.4% 0.2 0.2 10.7% 9.8% 9.8% 10.1%
Public Trust Crown 17.5% 25.5% 0.1 0.1 1.1% 1.2% 2.3% 1.5%
Pulse Energy NZAX (10.8%) 0.1% 13.5 15.7 (168.1%) (146.8%) 1.7% (104.4%)
Pumpkin Patch NZX 5.9% 6.0% 2.8 3.0 20.3% 16.7% 17.9% 18.3%
Pyne Gould Corporation NZX (33.1%) 49.2% 0.2 0.1 (2.8%) (5.9%) 5.8% (1.0%)
Rakon NZX (3.9%) (10.3%) 0.8 0.9 4.9% (3.3%) (8.8%) (2.4%)
Rangatira Unlisted 36.1% 26.3% 0.2 0.3 7.6% 8.9% 7.0% 7.9%
Renaissance Corporation NZX (4.3%) (13.7%) 4.5 3.7 (29.9%) (19.3%) (50.0%) (33.1%)
Restaurant Brands NZX 8.6% 8.1% 3.0 3.0 35.3% 25.5% 24.3% 28.4%
RIS Group NZAX (215.2%) NA 0.3 0.0 (13.6%) (73.9%) (2.7%) (30.1%)
Rubicon NZX (2.1%) 0.2% 1.4 1.4 (0.8%) (2.9%) 0.2% (1.2%)
Rural Equities Unlisted 40.0% 33.2% 0.1 0.1 3.4% 2.2% 1.7% 2.4%
Ryman Healthcare NZX 22.3% 22.1% 0.1 0.1 2.1% 2.0% 2.0% 2.0%
2013 Return on Capital Employed
21 | P a g e
Issuer Market 2012 EBIT
Margin
2013 EBIT
Margin
2012
Activity
Ratio
2013
Activity
Ratio
ROCE
2011
ROCE
2012
ROCE
2013
Average
ROCE
Sanford NZX 6.7% 4.8% 0.6 0.6 3.7% 4.2% 3.1% 3.7%
Scott Technology NZX 7.6% 8.1% 1.9 1.5 6.1% 14.3% 12.1% 10.9%
SeaDragon NZX NA (2.7%) NA NA NA NA NA NA
Sealegs Corporation NZX (11.7%) (0.2%) 2.3 3.0 (68.6%) (26.6%) (0.6%) (31.9%)
Seeka Kiwifruit Industries NZX 9.4% 3.8% 1.3 1.2 13.4% 12.0% 4.6% 10.0%
Silver Fern Farms Unlisted (0.8%) (0.8%) 3.6 3.0 11.1% (3.0%) (2.3%) 1.9%
Skellerup Holdings NZX 16.7% 13.7% 1.7 1.5 24.0% 27.6% 20.1% 23.9%
SKY Network Television NZX 22.2% 23.1% 0.5 0.5 9.9% 10.1% 11.2% 10.4%
SKYCITY Entertainment
Group
NZX 26.4% 25.3% 0.5 0.5 14.8% 14.5% 13.8% 14.3%
Skyline Enterprises Unlisted 34.6% 30.3% 0.5 0.4 14.7% 16.4% 13.6% 14.9%
SLI Systems NZX 0.6% (52.4%) 20.3 1.3 NA 12.9% (68.4%) (27.8%)
SmartPay Holdings NZX (31.3%) 2.2% 0.7 0.5 3.8% (23.1%) 1.1% (6.1%)
Smiths City Group NZX 0.0% 1.7% 1.5 1.7 (5.2%) 0.0% 2.9% (0.8%)
Snakk Media NZAX (31.5%) (33.1%) 329.2 297.5 NA (10367.9%) (9844.5%) (10106.2%)
Solution Dynamics NZAX (7.7%) (2.0%) 4.3 5.6 0.0% (32.9%) (11.1%) (14.7%)
South Port New Zealand NZX 32.1% 31.6% 0.8 0.9 28.7% 27.3% 27.6% 27.9%
Southern Travel Holdings Unlisted 0.3% 2.5% 4.4 4.5 (10.7%) 1.5% 11.1% 0.6%
Speirs Group NZAX (7.0%) (3.0%) 2.8 3.5 (13.9%) (19.5%) (10.5%) (14.6%)
Steel & Tube Holdings NZX 4.7% 5.3% 2.1 2.1 13.8% 10.0% 11.2% 11.6%
Summerset Group Holdings NZX 11.0% 14.7% 0.1 0.1 0.7% 0.7% 1.3% 0.9%
Synlait Farms Unlisted 31.3% 24.4% 0.2 0.2 12.4% 5.6% 3.9% 7.3%
Synlait Milk NZX 4.1% 6.4% 1.9 1.7 (0.2%) 7.7% 10.5% 6.0%
Teamtalk NZX 24.2% 17.5% 0.6 0.7 14.2% 15.0% 12.0% 13.7%
Telecom NZX 6.0% 8.3% 1.1 1.5 10.3% 6.6% 12.4% 9.8%
Tenon NZX (1.5%) 0.3% 2.1 2.1 (0.0%) (3.1%) 0.6% (0.9%)
Terra Vitae Vineyards Unlisted 31.8% 35.5% 0.1 0.1 3.3% 3.3% 4.4% 3.7%
Tourism Holdings NZX 8.3% 6.8% 0.8 0.8 2.5% 6.4% 5.6% 4.8%
Tower NZX 20.6% 7.2% 1.1 0.9 18.1% 22.6% 6.8% 15.8%
Trade Me Group NZX 71.3% 69.4% 0.4 0.2 103.9% 25.6% 14.6% 48.0%
2013 Return on Capital Employed
22 | P a g e
Issuer Market 2012 EBIT
Margin
2013 EBIT
Margin
2012
Activity
Ratio
2013
Activity
Ratio
ROCE
2011
ROCE
2012
ROCE
2013
Average
ROCE
Transpower New Zealand Crown 27.6% 29.3% 0.2 0.2 6.8% 5.7% 6.2% 6.2%
Trilogy International NZX 2.1% 3.4% 1.0 1.0 (35.8%) 2.1% 3.4% (10.1%)
TRS Investments NZX (966.7%) (900.0%) 0.5 NA (1033.3%) (483.3%) NA (758.3%)
TrustPower NZX 30.3% 28.2% 0.3 0.3 8.9% 9.5% 8.4% 9.0%
Turners & Growers NZX 1.3% 2.2% 1.8 2.1 2.8% 2.2% 4.6% 3.2%
Turners Auctions NZX 4.1% 4.3% 2.9 3.0 11.5% 12.0% 12.7% 12.1%
Vector NZX 36.8% 36.0% 0.2 0.2 8.1% 8.7% 8.5% 8.4%
Veritas Investments NZX 16.3% 19.5% 3.9 NA 1.5% 64.2% NA 32.9%
Vetilot NZAX (44.1%) (366.2%) 1.2 0.5 (33.7%) (52.0%) (184.0%) (89.9%)
Vital Healthcare Property NZX 44.0% 50.2% 0.1 0.1 5.0% 4.9% 6.1% 5.3%
VMob Group NZAX NA (2989.1%) 0.0 0.2 (13.5%) (2.3%) (461.4%) (159.1%)
Warehouse Group NZX 5.3% 4.7% 3.5 3.6 26.0% 18.5% 16.9% 20.5%
Wellington Drive
Technologies
NZX (16.2%) (14.2%) 4.2 4.2 (111.9%) (68.0%) (58.9%) (79.6%)
Westpac Banking
Corporation
NZX 20.9% 25.3% 0.2 0.2 4.3% 4.6% 5.4% 4.8%
Windflow Technology NZAX (157.3%) (811.7%) 0.7 0.2 (142.2%) (116.6%) (127.9%) (128.9%)
Wool Equities NZAX (499.1%) (85.9%) 0.6 2.2 (622.4%) (293.2%) (187.6%) (367.7%)
Wynyard Group NZX (46.6%) (64.1%) 3.1 0.7 NA (146.6%) (48.0%) (97.3%)
Xero NZX (46.0%) (42.3%) 1.8 1.9 NA (82.2%) (78.4%) (80.3%)
Z Energy NZX 4.2% 2.2% 4.7 3.3 NA 19.9% 7.3% 13.6%
2013 Return on Capital Employed
23 | P a g e
Appendix 2 – ROCE explained
What is Return on Capital Employed and what does it show?
Return on Capital Employed (“ROCE”) is a measure of business effectiveness and capital efficiency. ROCE is a function of profitability,
how much profit a business generates before interest on debt and tax (EBIT) and activity, how much a business has invested in
operating assets to generate that level of profitability.
In the 1920’s Du Pont Corporation developed what is commonly known as Du Pont accounting and ROCE as a measure of business
performance to enable it to compare the performance of its many different business units. The Du Pont accounting method is a
powerful and relatively simple approach to determine the impact of management decisions on financial performance. The
advantage of this method is that it provides a consistent form of evaluation for a business to use when measuring performance.
At an individual business level ROCE:
allows comparison between business units of different size over time;
shows where to invest further and where to cut back;
shows whether it is worth borrowing further to invest;
shows if expectations of shareholders are being met;
indicates the maximum sustainable growth of a business; and
is used to track whether or not a project is performing according to plan.
ROCE can be used to test operational efficiency, balance sheet management efficiency and the adequacy of return on total
capital employed to make an assessment of a business’s performance.
ROCE can be used to help management improve both the profitability (EBIT) and balance sheet management. Improvements in
these areas will lead to improvements in the Return on Capital employed.

2013 Return on Capital Employed
24 | P a g e
Calculating ROCE
It is important to note that some changes need to be made to traditional thinking to gain the benefits of this dynamic approach. To
achieve this there are two concepts that need to be considered:
Concepts
(i) The separation of funding from operating decisions
Consider the traditional formula for presenting financial statements.
EQUITY = (Current Assets + Cash - Current Liabilities) + Non-current Assets - Debt
In order to calculate ROCE, all forms of funding need to be removed from the right hand side of the equation. Total net assets should
be void of any external funding or debt thereby representing the true value of scarce resources employed in the business.
The financial analysis format can now be structured as follows.
DEBT - CASH + EQUITY = (Current Assets - Current Liabilities) + Non-Current Assets
TOTAL CAPITAL EMPLOYED (TCE) = TOTAL NET OPERATING ASSETS (TNA)
The movement in TNA reflects operating changes made to the employment of scarce resources, whilst net Debt (debt – cash) and
Equity reflects how these changes are funded. It should be noted that where the directors of a business elect to retain minimum
levels of cash this cash should be included in TNA.
(ii) Balance sheet efficiency – ACTIVITY RATIO.
Definition: A measurement of how well the business manages its scarce resources
Formula: Revenue
Total Net Assets
2013 Return on Capital Employed
25 | P a g e
The Activity Ratio is a measure of how many times a business turns over its TNA in a financial year.
By way of example, an Activity ratio of 2.5 means that for every $1 invested in TNA the business produces $2.50 in sales. It answers the
question of whether or not the net operating assets are being utilised efficiently in the production of income.
The activity drivers are:
Stock, Work in Progress, Inventory: the value of raw materials, work in progress and finished goods the business holds;
Trade Debtors: how much the business has locked up in sales revenues receivable;
Trade Creditors: how much the business owes to its suppliers for goods and services provided; and
Non-Current Assets: how much is invested in plant and equipment and intangible assets is required to operate the business and
produce the goods sold.
Other current assets and liabilities such as prepayments and accruals are included in trade debtors and creditors.
Adjusting one or more of the activity drivers will increase or decrease the activity ratio and therefore improve or worsen ROCE.
(iii) Operational Efficiency – PROFITABILITY MARGIN.
Definition: A measurement of the Return on Sales purely from an operating perspective.
Formula: Earnings before interest & tax
Revenue
The above formula ignores the impact of funding and concentrates on the entity's ability to produce a return from revenue.
The four key profitability drivers are:
Price: how much a business receives for the goods it sells;
2013 Return on Capital Employed
26 | P a g e
Volume: how many goods the business sells;
Cost of Goods Sold: how much it costs the business to produce the goods it sells; and
Expenses: the overhead expenses of the business.
Adjusting one or more of the profitability drivers will increase or decrease the profitability ratio and therefore improve or worsen
ROCE.
(iv) Return on Capital Employed – ROCE
The link between the Balance Sheet and Profit & Loss is dynamically reflected in ROCE.
Definition: The percentage return yielded from the employment of scarce resources in the form of profit before interest and tax
Formula: EBIT
TNA
OR
Profitability x Activity
The interactive nature of this ratio is seen in the alternative formula as the product of Profitability and Activity. Operational and
Balance Sheet efficiency are brought to life in one single ratio. This should be the first area of review in the process of corporate
performance assessment, and it should be determined as to whether or not ROCE is adequate and which of its components
contribute to both the strengths and weaknesses of the financial strategy.
2013 Return on Capital Employed
27 | P a g e
Irrespective of the type of industry ROCE should at least be equal to or greater than the weighted average cost of capital (WACC) in
order for a business to create shareholder value.
Example:
Revenue 100,000
EBIT 10,000
Profitability Ratio 10%
TNA 50,000
Activity Ratio 2x
ROCE 10% x 2 = 20%
It is worth noting that average TNA for the period over which Revenue and EBIT are derived will give a better result that just
considering TNA and the end of the period being measured.
It should also be remembered that ROCE does not change when EQUITY is substituted for DEBT. This highlights the impact of a true
operational performance measurement.
(v) Interfacing Profit and Loss/(Cash) with the Balance Sheet
The Balance Sheet is just a snapshot of the assets and liabilities of a business at a point in time. However its interaction with profit and
loss, through Earnings before Interest and Tax (EBIT), provides the platform for developing a totally dynamic analytical structure.
Two businesses, producing the same sales and return on sales can be viewed from an operational point of view as being identical
even if one were funded by debt and the other by equity. This is because the cost of borrowing is purely a financial issue.
2013 Return on Capital Employed
28 | P a g e
ROCE Uses
ROCE can be used in many ways by organisations and management teams as a performance measure and as a tool when
preparing budgets and valuations.
One of these ways is that the management team may set ROCE goals for either the entire organisation or its sub-units and decision
making in respect of investing in new projects to ensure that the business is performing at a level that is greater than WACC.
ROCE is also able to be used to set up a performance remuneration plan for management and employees. As it is simple to
calculate, ROCE provides a transparent model for such programs.
Budgeting and Valuation
Businesses and analysts can often make an underlying error in budgeting or forecasting business performance which impacts a
business valuation. When undertaking a valuation the biggest error usually arises from utilising overly optimistic forecasts. Discount
rates are generally less susceptible to such errors.
Consider the following 4 charts which simplistically compare Profitability, Activity, Capex to Revenue and ROCE ratios for a mature
business and a growth business. The underlying issue is that most budgets for mature businesses more than often assume expanding
profitability, increasing activity, reducing levels of capital expenditure for every dollar of sales and therefore increasing ROCE. More
often than not a mature business is unlikely to see these improvements on an ongoing basis. While some improvement is always
possible continuous expansion is unlikely to be experienced on an ongoing basis and the art of getting the forecasts correct is
challenging such ongoing expansion assumptions.
Forecasts for growth businesses often have the opposite issues. It is rare to find a business in NZ that can achieve EBIT margins in
excess of 20% on an ongoing basis. At those levels competitors are likely to enter a market and customers generally start looking
elsewhere or in-housing the supply. Revenue growth will also demand additional lock up in working capital and additional fixed
assets to support the growth. Therefore to create robust forecasts for a growth business at some juncture these charts are likely to
level out and this levelling is usually earlier than anticipated generally because the business becomes loose with expenditure.
Taking into account the ratios in the chart helps to reduce the risk of making a budget or forecast error and therefore improves the
quality of the budget or forecast and by extension the quality of any valuation based off the same.

2013 Return on Capital Employed
29 | P a g e
What is a “Good” ROCE
ROCE is a measure of a company’s profitability and its activity. Quite simply, a good ROCE is a level that exceeds the weighted
average cost of capital for the business. Where this is the case the business will be creating value for its shareholders.
0%
5%
10%
15%
20%
25%
1 2 3 4 5 6
Profitability
Mature Growth
0.0
1.0
2.0
3.0
4.0
1 2 3 4 5 6
Activity
Mature Growth
0%
1%
2%
3%
4%
5%
6%
1 2 3 4 5 6
Capex/Revenue
Mature Growth
0%
20%
40%
60%
80%
1 2 3 4 5 6
ROCE
Mature Growth


![An Indian Multinational Investor Presentation - IFGL · PDF fileCost Revenue in Acquisition Year 2015 Revenue ... Slide Gate & Purging Refractories ... Return on Capital Employed [%]](https://img.pdfslide.us/doc/110x75/5ab9aaa57f8b9ac10d8e83ee/an-indian-multinational-investor-presentation-ifgl-revenue-in-acquisition-year.jpg)