Embed Size (px)
Citation preview
LSHTM – Mortality in Somalia, 2014-2018 Page 1 of 35
Retrospective estimation of mortality in Somalia,
2014-2018: a statistical analysis
January 2020
Abdihamid Warsame MSc
Séverine Frison PhD
Amy Gimma MSc
Francesco Checchi PhD*
Department of Infectious Disease Epidemiology
Faculty of Epidemiology and Population Health
London School of Hygiene and Tropical Medicine
* Corresponding author: [email protected]
LSHTM – Mortality in Somalia, 2014-2018 Page 2 of 35
Abstract
Background
Somalia regularly experiences drought-related crises, against the backdrop of a thirty-year old armed conflict. During
2010-2012, extreme food insecurity and famine were estimated to account for 256,000 deaths. Since 2014 Somalia has
experienced recurrent below-average rainfall, with consecutive failed rains in late 2016 and 2017 leading to large-scale
drought, displacement and epidemics. We wished to estimate mortality across Somalia from 2014 to 2018, and measure
the excess death toll attributable to the 2017-2018 drought-triggered crisis.
Methods
We used a statistical approach akin to small-area estimation, and relying solely on existing data. We identified and re-
analysed 91 household surveys done at the district level and estimating the crude (CDR) and under 5 years death rate
(U5DR) over retrospective periods of 3-4 months. We captured datasets of candidate predictors of mortality with availability
by district and month, as per a causal framework including climate, armed conflict intensity, forced displacement, food
insecurity, nutritional status, disease burden, humanitarian and health service domains. We also reconstructed population
denominators by district-month combining alternative census estimates and displacement data. We combined these data
inputs into predictive models to estimate CDR and U5DR even where no ground data were available, and combined the
predictions with population estimates to project death tolls. Excess mortality was estimated by constructing counterfactual
no-crisis scenarios.
Results
Between 2013 and 2018, Somalia’s population increased from 12.0 to 13.5 million, and internally displaced people or
returnees reached 20% of the population. Using models comprising the incidence of armed conflict events, rate of
nutritional therapy admissions, incidence of malaria and measles occurrence, we estimated that CDR ranged between 0.3
and 0.5 per 10,000 person-days during 2014-2018, but with an increase of about 15% during 2017-2018, translating to
an excess death toll of 44,700 in the most likely counterfactual scenario, and as high as 163,800 in a pessimistic scenario.
By contrast to 2010-2012, excess deaths were widespread across Somalia, including central and northern regions.
Discussion
This analysis suggests that the 2017-2018 crisis had a lower, albeit still very substantial, mortality impact than its 2010-
2012 predecessor. Despite modest elevations in death rate, crisis conditions were widespread and affected a population
of millions. Potential study limitations we have identified include error in population estimates and under-reporting of child
deaths, which we explore in sensitivity analyses. Humanitarian response to drought-related crises in Somalia needs to be
strengthened, target the most vulnerable and emphasise very early interventions.
LSHTM – Mortality in Somalia, 2014-2018 Page 3 of 35
Acknowledgments
This document is an output from a project funded by the UK Department for International Development through the
Research for Evidence Division (RED) for the benefit of developing countries. However, the views expressed and
information contained in it are not necessarily those of or endorsed by DFID, which can accept no responsibility for such
views or information or for any reliance placed on them.
We are particularly indebted to Sandrine Foldvari Tobelem and Prof Nicholas Jewell for statistical advice and
encouragement. We are grateful to Anna Carnegie for project management support and Chris Jarvis for geospatial analysis
advice. We are also grateful to the Ministry of Health of Somalia and numerous individuals with DFID and various United
Nations agencies, in particular the Food Security and Nutrition Analysis Unit, Somalia for facilitating access to or sharing
data with us. We thank Daniel Maxwell and Peter Hailey for advice on interpreting findings.
Disclaimer
Geographical names and boundaries presented in this report are used solely for the purpose of producing scientific
estimates, and do not necessarily represent the views or official positions of the authors, the London School of Hygiene
and Tropical Medicine, any of the agencies that have supplied data for this analysis, or the donor. Within this report, the
denominations ‘Somalia’ and ‘greater Somalia’ are adopted for simplicity to encompass south-central Somalia, Puntland
and Somaliland.
The authors are solely responsible for the analyses presented here, and acknowledgment of data sources does not imply
that the agencies providing data or the donor endorse the results of the analysis.
List of tables and figures
Table 1. Candidate predictors of mortality considered in the analysis. ................................................................................ 9
Table 2. Most likely, worst-case and best-case counterfactual scenarios. ......................................................................... 10
Table 3. Crude summary statistics for eligible mortality surveys, overall and by year. ...................................................... 12
Table 4. Predictive models for crude and under 5 years death rate. .................................................................................. 13
Table 5. Total and crisis-attributable deaths, by year and counterfactual scenario. ........................................................... 13
Table 6. Crude death rate, excess death rate and excess death toll by region, under the most likely counterfactual scenario,
for all ages and children under 5 years. ............................................................................................................................. 14
Table 7. Assessment of strength of evidence of the estimates. .......................................................................................... 17
Table 8. Point estimates of crude death rate, excess death rate and excess death toll, under the most likely counterfactual
scenario, by district, for all ages and for children under 5y. .............................................................................................. 31
Figure 1. Rainfall levels compared to the historical average and number of people newly displaced, by region, 2016-2018.
.............................................................................................................................................................................................. 6
Figure 2. Schematic of estimation steps and required inputs. ............................................................................................. 7
Figure 3. Schematic of mortality survey availability. ........................................................................................................... 11
Figure 4. Evolution of total estimated population, by source. ............................................................................................ 12 Figure 5. Trends in the estimated actual (point estimate: red line, 95%CI: grey range) and counterfactual (dashed green
line) crude death rate. ......................................................................................................................................................... 15
Figure 6. Trends in the estimated actual (point estimate: red line, 95%CI: grey range) and counterfactual (dashed green
line) under 5 years death rate. ............................................................................................................................................ 15
Figure 7. Correlation between Integrated Phase Classification projections (early 2017) and estimated excess death rate
(2017-2018), by region. ..................................................................................................................................................... 17
LSHTM – Mortality in Somalia, 2014-2018 Page 4 of 35
Figure 8. Schematic of survey district-month coverage. .................................................................................................... 21
Figure 9. Frequency distribution of survey quality score. .................................................................................................. 22
Figure 10. Crude trends in the crude death rate over the survey’s recall period. .............................................................. 22
Figure 11. Crude trends in the under 5 years death rate over the survey’s recall period. ................................................. 23
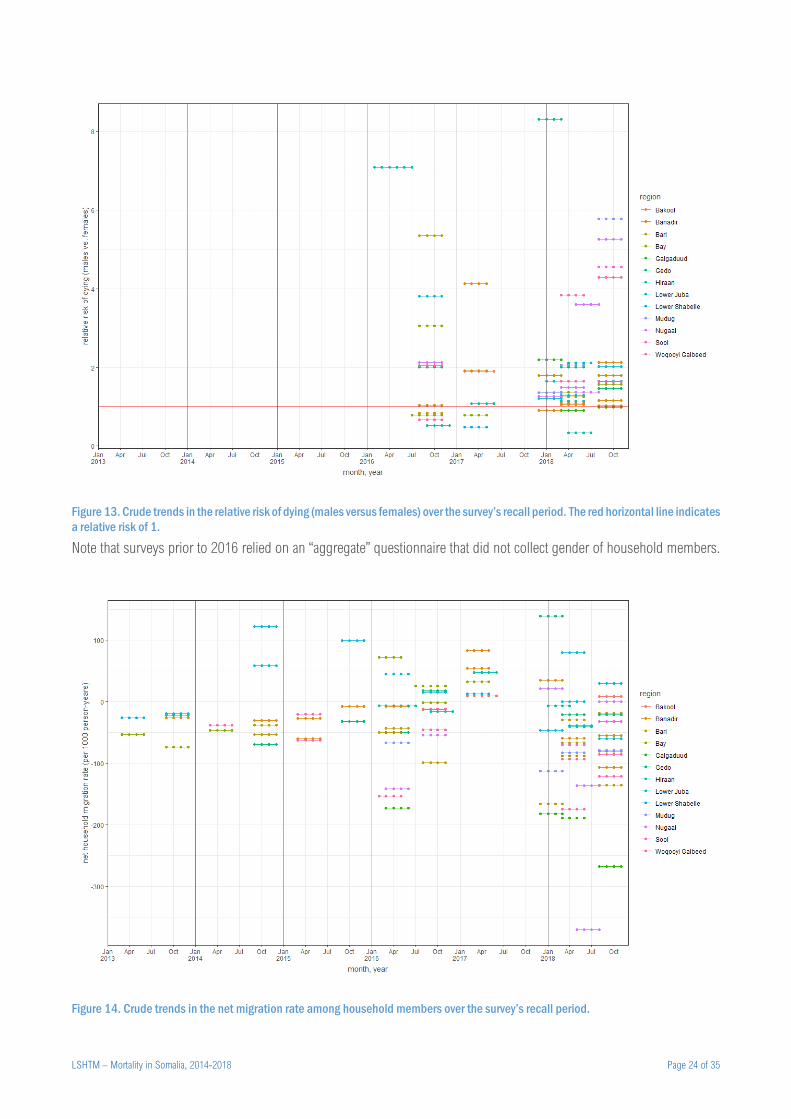
Figure 12. Crude trends in the injury-specific death rate over the survey’s recall period. ................................................. 23 Figure 13. Crude trends in the relative risk of dying (males versus females) over the survey’s recall period. The red
horizontal line indicates a relative risk of 1. ........................................................................................................................ 24
Figure 14. Crude trends in the net migration rate among household members over the survey’s recall period. .............. 24
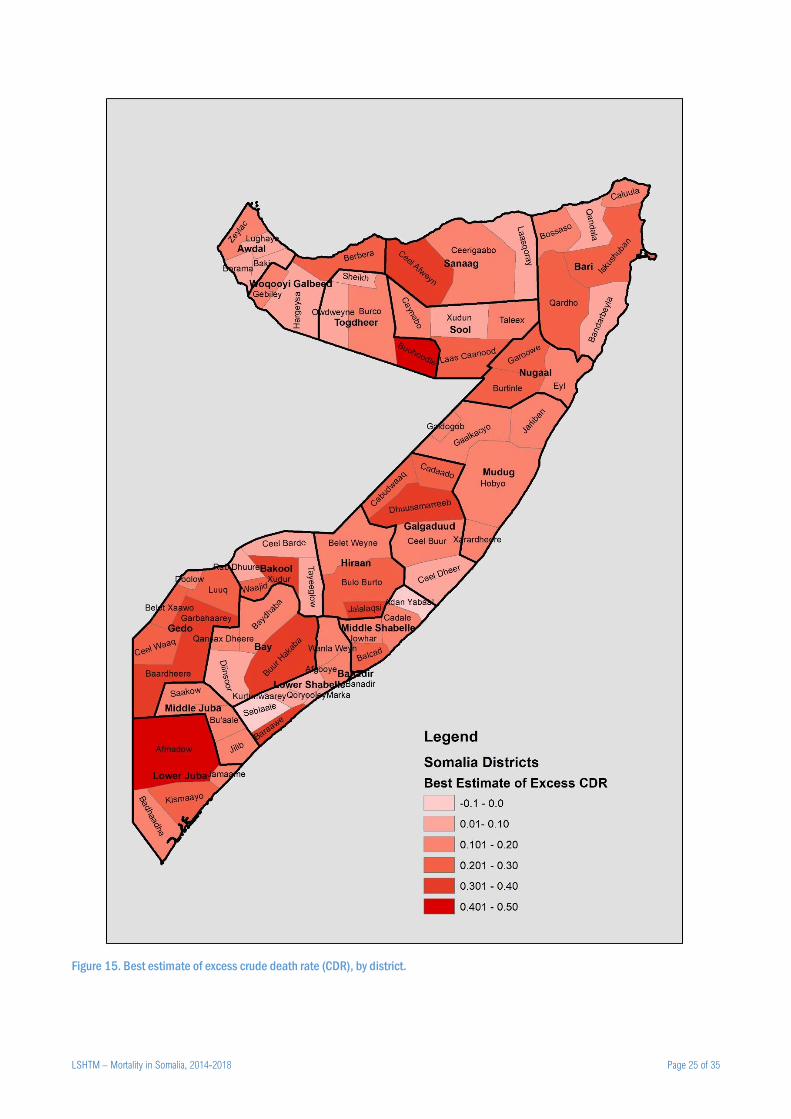
Figure 15. Best estimate of excess crude death rate (CDR), by district. ............................................................................ 25
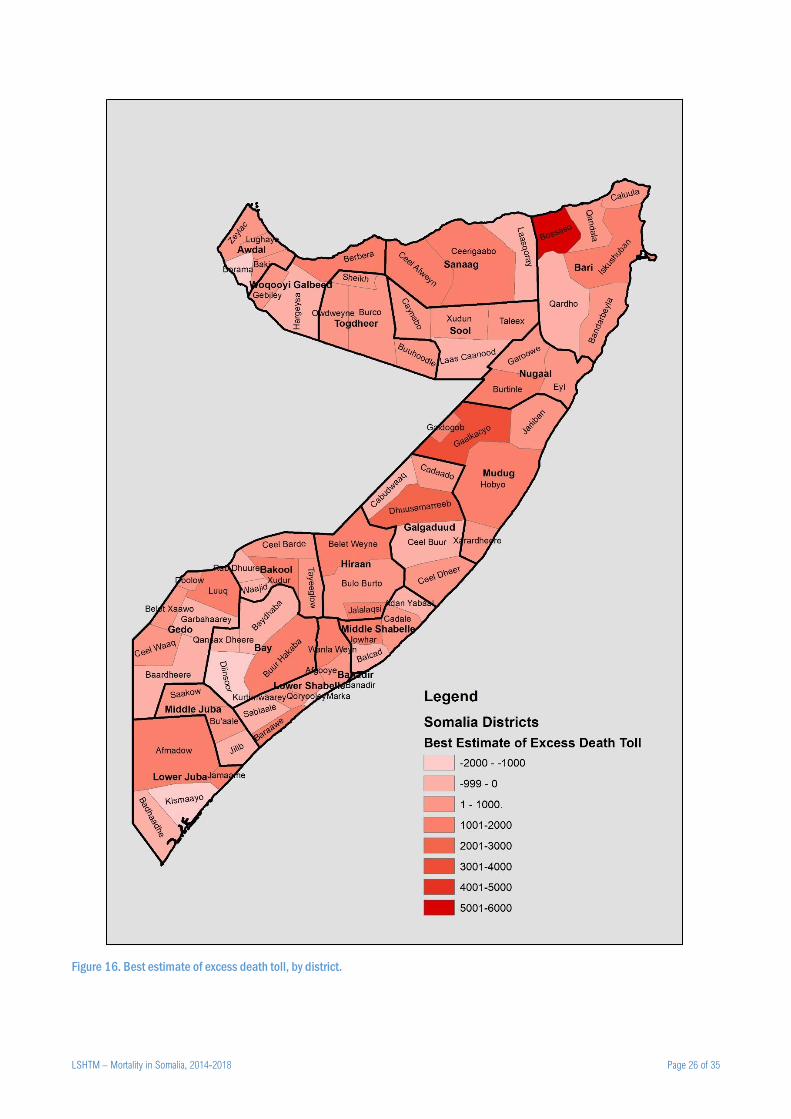
Figure 16. Best estimate of excess death toll, by district. .................................................................................................. 26
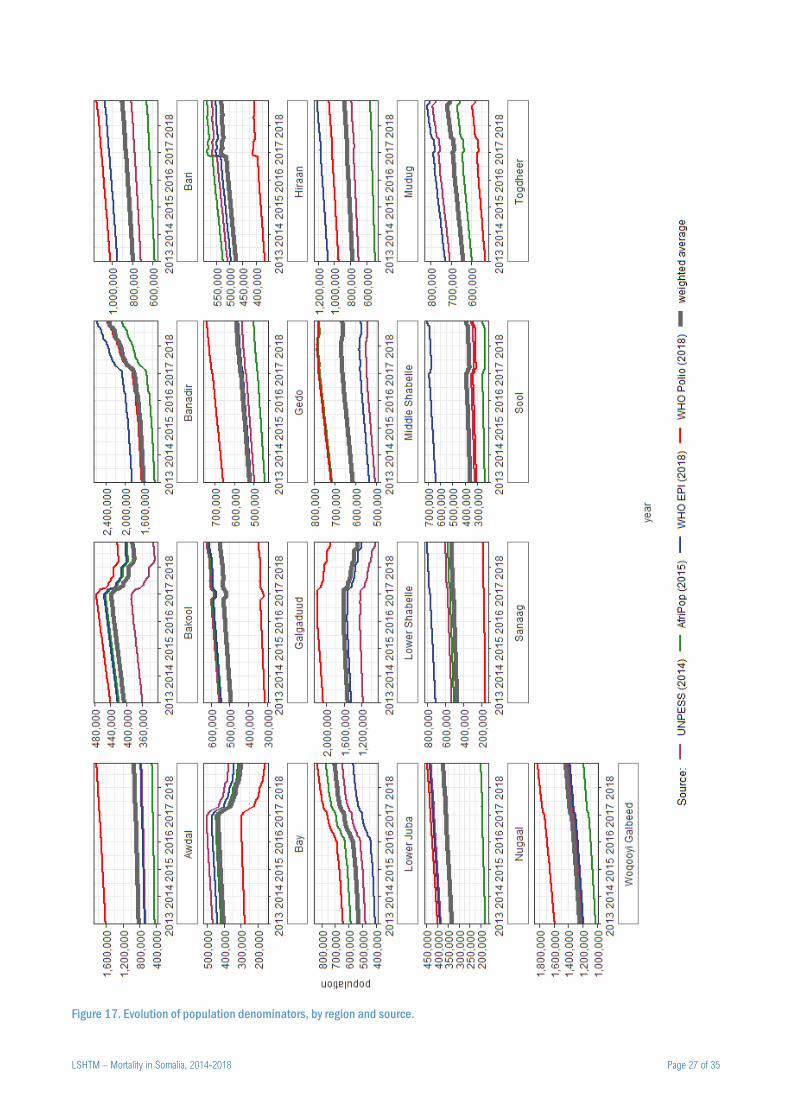
Figure 17. Evolution of population denominators, by region and source. ......................................................................... 27
Figure 18. Evolution of the proportion of IDPs and returnees across Somalia. ................................................................. 28
Figure 19. Evolution of the proportion of IDPs and returnees, by region. ......................................................................... 28
Figure 20. Observed versus predicted number of all-age deaths, by stratum (district), after 10-fold cross-validation (top
panel) and prediction on the holdout sample (bottom panel). The red line indicates perfect fit. ....................................... 29
Figure 21. Observed versus predicted number of under 5y deaths, by stratum (district), after 10-fold cross-validation (top
panel) and prediction on the holdout sample (bottom panel). The red line indicates perfect fit. ....................................... 30
Figure 22. Trends in terms of trade (daily wage vs. cereal, medium-quality goat vs. cereal), by region........................... 33
Figure 23. Estimated actual, counterfactual and excess death toll for all age groups, by sensitivity value of the ratio of true
to reported population estimates. Each panel presents results for different sensitivity values of the true number of internal
displacements (as a ratio to the observed/reported value). Only the most likely counterfactual scenario is presented. ... 34
Figure 24. Estimated actual, counterfactual and excess death toll for all age groups and children under 5y, by sensitivity
value of the ratio of true to reported U5DR. Only the most likely counterfactual scenario is presented. ........................... 35
LSHTM – Mortality in Somalia, 2014-2018 Page 5 of 35
Background
Crisis in Somalia
Somalia has experienced recurrent climate- and armed conflict-driven crises over the past 30 years. As a result, the
population has limited resilience and is vulnerable to shocks brought on by such crises. In 2010-2012, largely as a result
of consecutive failed rains and limited humanitarian access and assistance, a famine occurred across south-central
Somalia. A study we conducted, commissioned by the United Nations, estimated 256,000 deaths attributable to exceptional
food insecurity during this period, of which approximately half in children under 5 years.1
The two years following the famine saw modest improvements, coinciding with intensified humanitarian assistance and
moderate rainfall. By end 2014, however, reduced humanitarian access due to renewed insecurity, as well as below-
average rainfall, had returned pockets of Somalia to acute emergency conditions.2 The years 2015 and 2016 saw a mixture
of failed seasonal rains and exceptional flooding, complicated by the return of Somalis from Kenya refugee camps and
war-stricken Yemen.3
In 2016, the sustained underperformance of seasonal rains in Puntland and Somaliland triggered both governments to
declare states of emergency. Most regions of Somalia experienced far below-average rainfall in September-December
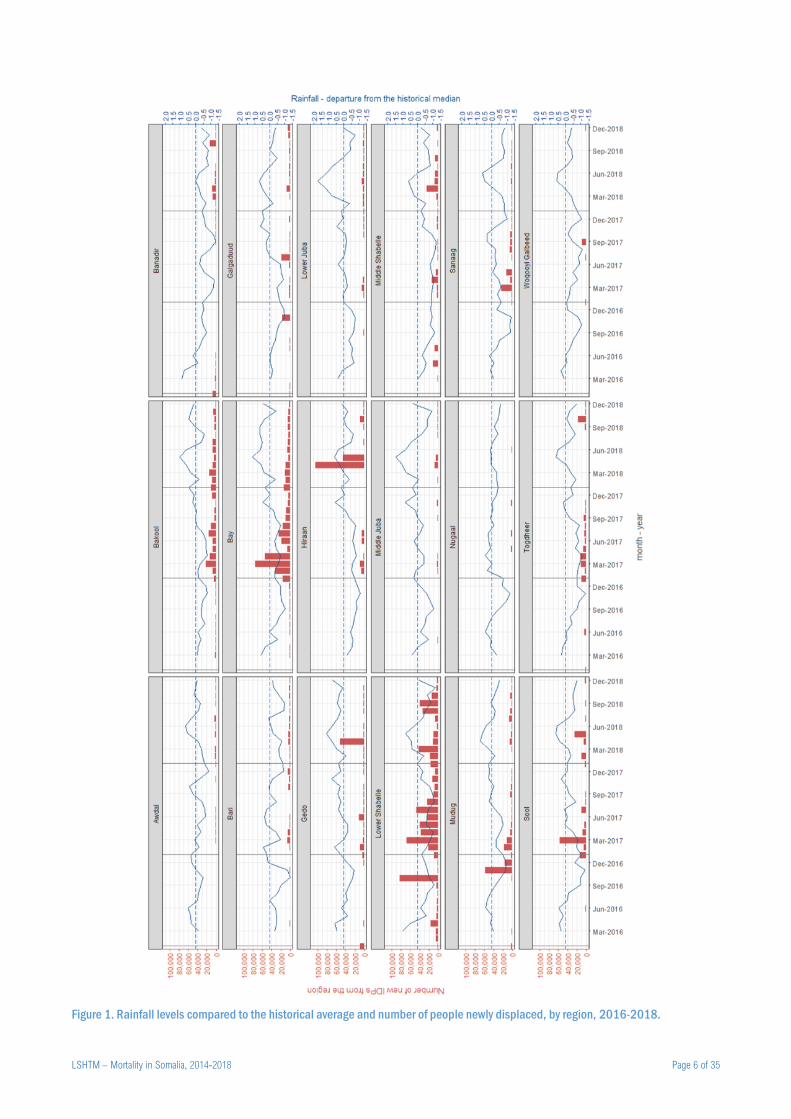
2016, compromising key harvests and livestock viability4; as shown in Figure 1, in some regions drought persisted into
2017, and large movements of internally displaced persons (IDPs) were seen, topping 2.6 million by end 2018 (see
sources below). Large-scale epidemics of cholera and measles, typical of food insecurity and displacement situations,
also occurred during this period.5 Abundant rainfall was however recorded from mid-2018 (Figure 1).
Scope of this study
Protracted armed conflicts are characterised by increased population mortality, both directly (violence) and indirectly
(increased risk of disease, reduced access to healthcare) attributable to the crisis.6 Information on this “excess” mortality
can inform the ongoing humanitarian response, provide evidence for resource mobilisation, and support conflict
resolution.7 In Somalia specifically, it was hypothesised that the humanitarian response in 2017-2018 had been quicker
and more effective than in 2010-2012, but there was no evidence on the extent to which the latest crisis had increased
population mortality. We wished to update our 2010-2012 analysis by estimating mortality across Somalia during 2014-
2018, while also quantifying the excess death toll attributable to drought during 2017-2018.
Methods
Study design
An extensive paper with methodological details, as well as analysis scripts, are published separately. Source data are
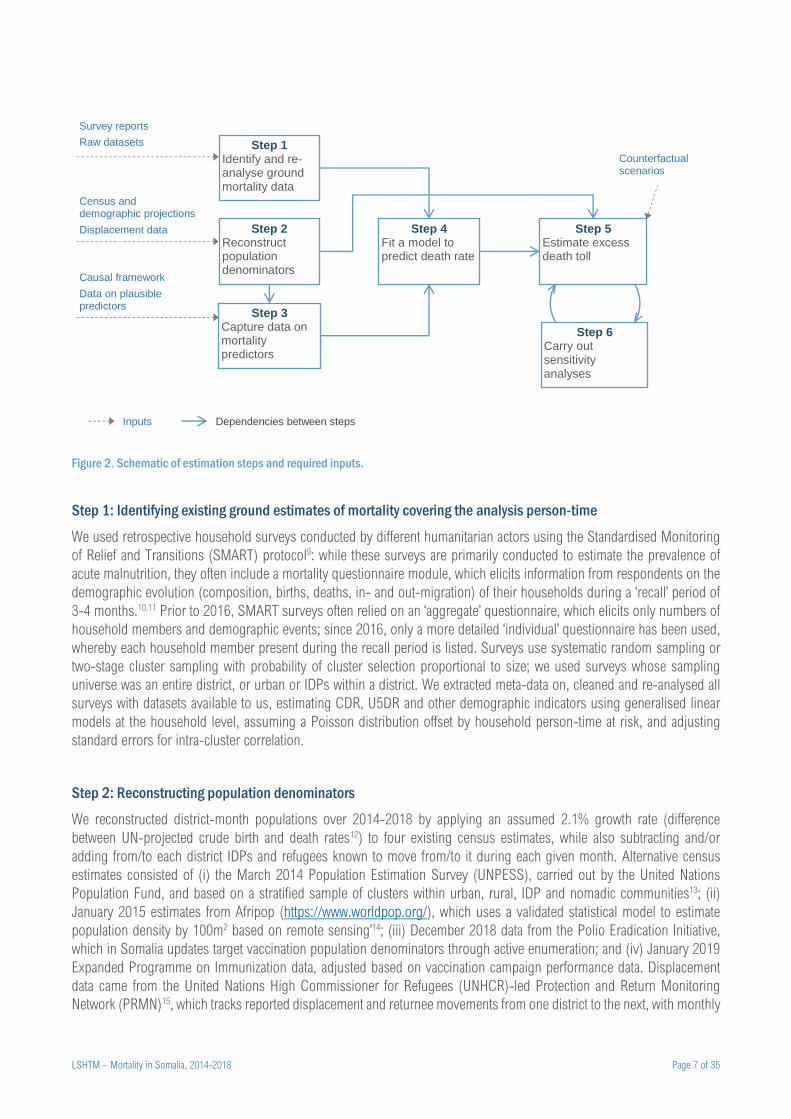
included here. The following is an abridged presentation of methods. Briefly, our method consists of six mostly sequential
steps, summarised in Figure 2, and is broadly classifiable as a small-area estimation approach.8 It rests on constructing a
model to predict mortality based on a combination of previously collected data, and using the model, in conjunction with
population denominators, to estimates death rates and tolls across the crisis-affected population and period of interest.
The model is also used to predict mortality in counterfactual scenarios of no crisis, and the difference between these
predictions and the estimated actual mortality is taken as the excess, crisis-attributable mortality.
Our analysis covered all of Somalia (including Somaliland and Puntland) and was stratified by district and month, spanning
the period January 2014 to December 2018, with excess mortality estimated for 2017-2018, the crisis-affected period of
interest. We sought to estimate all-age and under 5y mortality: corresponding indicators are the crude death rate (CDR)
and the under 5 years death rate (U5DR); the latter, unlike under 5y mortality ratios (which measure the probability of
survival to age 5y), expresses the incidence of death among children.
LSHTM – Mortality in Somalia, 2014-2018 Page 6 of 35
Figure 1. Rainfall levels compared to the historical average and number of people newly displaced, by region, 2016-2018.
LSHTM – Mortality in Somalia, 2014-2018 Page 7 of 35
Figure 2. Schematic of estimation steps and required inputs.
Step 1: Identifying existing ground estimates of mortality covering the analysis person-time
We used retrospective household surveys conducted by different humanitarian actors using the Standardised Monitoring
of Relief and Transitions (SMART) protocol9: while these surveys are primarily conducted to estimate the prevalence of
acute malnutrition, they often include a mortality questionnaire module, which elicits information from respondents on the
demographic evolution (composition, births, deaths, in- and out-migration) of their households during a ‘recall’ period of
3-4 months.10,11 Prior to 2016, SMART surveys often relied on an ‘aggregate’ questionnaire, which elicits only numbers of
household members and demographic events; since 2016, only a more detailed ‘individual’ questionnaire has been used,
whereby each household member present during the recall period is listed. Surveys use systematic random sampling or
two-stage cluster sampling with probability of cluster selection proportional to size; we used surveys whose sampling
universe was an entire district, or urban or IDPs within a district. We extracted meta-data on, cleaned and re-analysed all
surveys with datasets available to us, estimating CDR, U5DR and other demographic indicators using generalised linear
models at the household level, assuming a Poisson distribution offset by household person-time at risk, and adjusting
standard errors for intra-cluster correlation.
Step 2: Reconstructing population denominators
We reconstructed district-month populations over 2014-2018 by applying an assumed 2.1% growth rate (difference
between UN-projected crude birth and death rates12) to four existing census estimates, while also subtracting and/or
adding from/to each district IDPs and refugees known to move from/to it during each given month. Alternative census
estimates consisted of (i) the March 2014 Population Estimation Survey (UNPESS), carried out by the United Nations
Population Fund, and based on a stratified sample of clusters within urban, rural, IDP and nomadic communities13; (ii)
January 2015 estimates from Afripop (https://www.worldpop.org/), which uses a validated statistical model to estimate
population density by 100m2 based on remote sensing’14; (iii) December 2018 data from the Polio Eradication Initiative,
which in Somalia updates target vaccination population denominators through active enumeration; and (iv) January 2019
Expanded Programme on Immunization data, adjusted based on vaccination campaign performance data. Displacement
data came from the United Nations High Commissioner for Refugees (UNHCR)-led Protection and Return Monitoring
Network (PRMN)15, which tracks reported displacement and returnee movements from one district to the next, with monthly
Step 1 Identify and re-analyse ground mortality data
Step 2 Reconstruct population denominators
Step 3 Capture data on mortality predictors
Step 4 Fit a model to predict death rate
Step 5 Estimate excess death toll
Census and demographic projections
Displacement data
Survey reports Raw datasets
Causal framework
Data on plausible predictors
Inputs Dependencies between steps
Step 6 Carry out sensitivity analyses
Counterfactual scenarios
LSHTM – Mortality in Somalia, 2014-2018 Page 8 of 35
data available from January 2016 to December 2018. We also reviewed situation reports on the humanitarian ReliefWeb
information platform (www.reliefweb.int) and on the UNHCR web site (www.unhcr.org) to approximate refugee flows in
and out of districts. We applied the median proportion of children under 5y (25.0%) as measured by the household
surveys we reviewed.
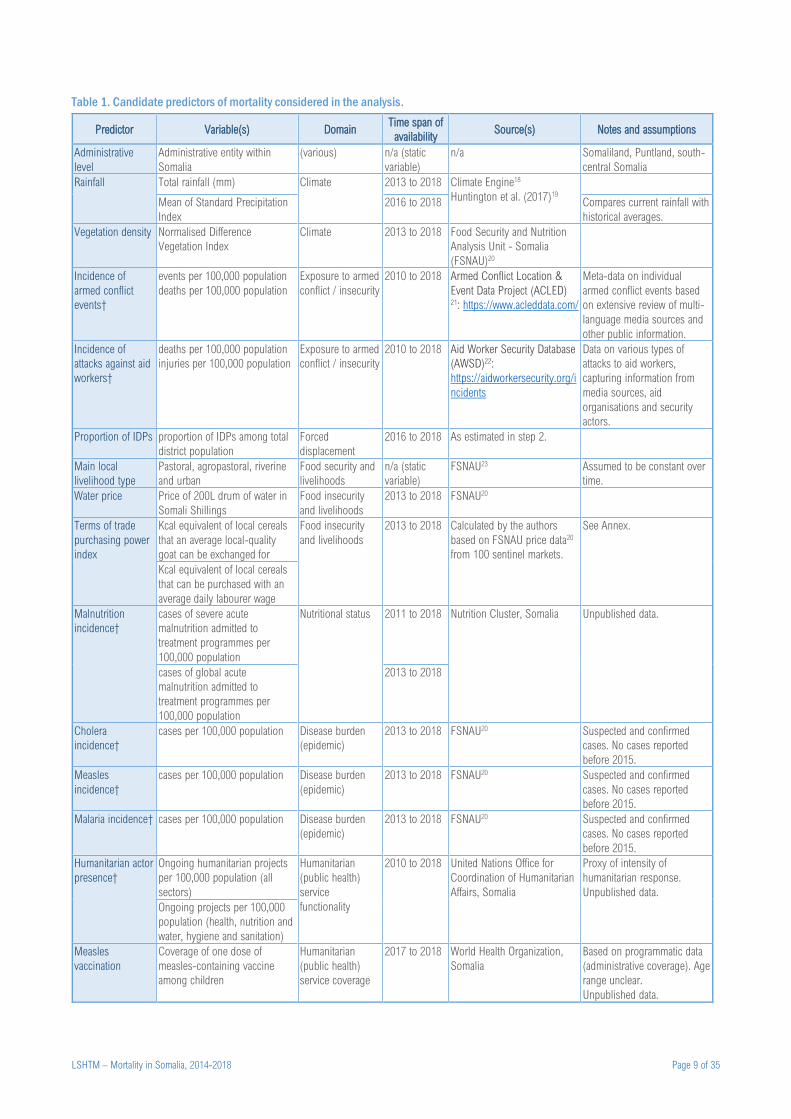
Step 3: Capturing data on predictors of mortality
We used a published causal framework16 of excess mortality in crises to identify possible predictors of death rate for which
datasets with reasonable completeness (≥ 70% complete for ≥ 70% district-months) were available. Candidate predictors
for which we found data are detailed in Table 1. Where relevant, we divided predictor values by reconstructed population
denominators. We used manual imputation and spline smoothing to remove missingness and minimise outliers.
Step 4: Fitting a predictive model
We evaluated the accuracy of different candidate sets of predictors to predict mortality (CDR and U5DR) by fitting quasi-
Poisson models of these predictors to mortality survey data (household-level counts of deaths, offset by household
person-time at risk during the recall period); average values of each predictor over the survey’s recall period, and in the
district surveyed, were used. After screening out predictors with poor fit, we did a brute-force search across all possible
candidate models, selecting the final model out of the top 20% best-fitting alternatives: given comparable predictive
accuracy, we gave preference to the most parsimonious model and predictors (e.g. epidemic occurrence) that were
plausibly sensitive to crisis conditions, and thus could be used to meaningfully construct counterfactual scenarios (see
below). We explored both categorical and continuous versions of variables, and lags up to 6 months where plausible. We
introduced random effects (survey cluster and district) and plausible interactions, but retained neither as they worsened
model fit. Lastly, we computed robust coefficient standard errors. To validate models for prediction on new data, we fit all
models on an 80% random ‘training’ sample of surveys and observed predictive accuracy on the remaining 20% ‘holdout’
sample. We also did ten-fold cross-validation within the training sample.
Step 5: Estimating excess death tolls
Working with the selected models for CDR and U5DR, we predicted death rates and (after multiplying by population
denominators) tolls, by district-month. We also estimated what mortality would have been in the most likely, most
pessimistic and most optimistic counterfactual scenarios (Table 2): each scenario was constructed by varying both
population denominators and model predictor values in accordance with assumptions on what would have happened in
the absence of a crisis. We generated 10,000 bootstrap sets of actual and counterfactual predictions by sampling from
model error distributions, and for each set computed excess mortality as the difference. We then computed point estimates
(modes) and 95% percentile intervals from the distributions of bootstrap samples.
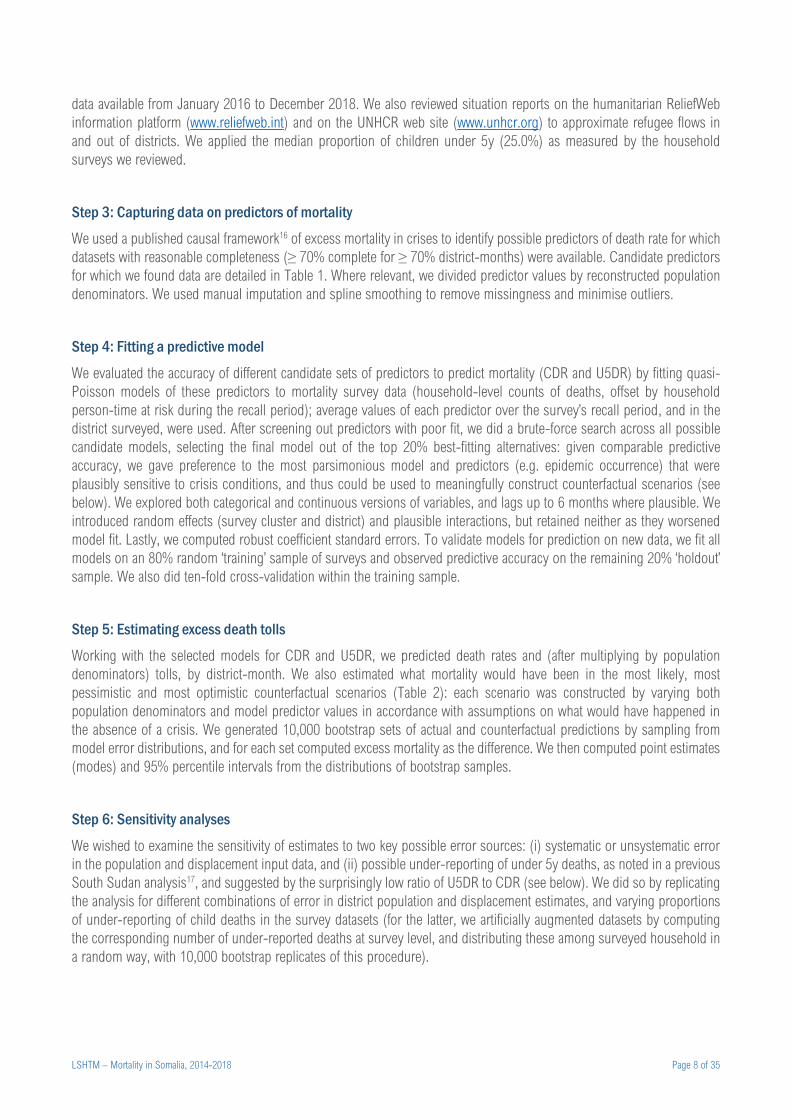
Step 6: Sensitivity analyses
We wished to examine the sensitivity of estimates to two key possible error sources: (i) systematic or unsystematic error
in the population and displacement input data, and (ii) possible under-reporting of under 5y deaths, as noted in a previous
South Sudan analysis17, and suggested by the surprisingly low ratio of U5DR to CDR (see below). We did so by replicating
the analysis for different combinations of error in district population and displacement estimates, and varying proportions
of under-reporting of child deaths in the survey datasets (for the latter, we artificially augmented datasets by computing
the corresponding number of under-reported deaths at survey level, and distributing these among surveyed household in
a random way, with 10,000 bootstrap replicates of this procedure).
LSHTM – Mortality in Somalia, 2014-2018 Page 9 of 35
Table 1. Candidate predictors of mortality considered in the analysis.
Predictor Variable(s) Domain Time span of
availability Source(s) Notes and assumptions
Administrative
level
Administrative entity within
Somalia
(various) n/a (static
variable)
n/a Somaliland, Puntland, south-
central Somalia
Rainfall Total rainfall (mm) Climate 2013 to 2018 Climate Engine18
Huntington et al. (2017)19
Mean of Standard Precipitation
Index
2016 to 2018 Compares current rainfall with
historical averages.
Vegetation density Normalised Difference
Vegetation Index
Climate 2013 to 2018 Food Security and Nutrition
Analysis Unit - Somalia
(FSNAU)20
Incidence of
armed conflict
events†
events per 100,000 population
deaths per 100,000 population
Exposure to armed
conflict / insecurity
2010 to 2018 Armed Conflict Location &
Event Data Project (ACLED) 21: https://www.acleddata.com/
Meta-data on individual
armed conflict events based
on extensive review of multi-
language media sources and
other public information.
Incidence of
attacks against aid
workers†
deaths per 100,000 population
injuries per 100,000 population
Exposure to armed
conflict / insecurity
2010 to 2018 Aid Worker Security Database
(AWSD)22:
https://aidworkersecurity.org/i
ncidents
Data on various types of
attacks to aid workers,
capturing information from
media sources, aid
organisations and security
actors.
Proportion of IDPs proportion of IDPs among total
district population
Forced
displacement
2016 to 2018 As estimated in step 2.
Main local
livelihood type
Pastoral, agropastoral, riverine
and urban
Food security and
livelihoods
n/a (static
variable)
FSNAU23 Assumed to be constant over
time.
Water price Price of 200L drum of water in
Somali Shillings
Food insecurity
and livelihoods
2013 to 2018 FSNAU20
Terms of trade
purchasing power
index
Kcal equivalent of local cereals
that an average local-quality
goat can be exchanged for
Food insecurity
and livelihoods
2013 to 2018 Calculated by the authors
based on FSNAU price data20
from 100 sentinel markets.
See Annex.
Kcal equivalent of local cereals
that can be purchased with an
average daily labourer wage
Malnutrition
incidence†
cases of severe acute
malnutrition admitted to
treatment programmes per
100,000 population
Nutritional status 2011 to 2018 Nutrition Cluster, Somalia Unpublished data.
cases of global acute
malnutrition admitted to
treatment programmes per
100,000 population
2013 to 2018
Cholera
incidence†
cases per 100,000 population Disease burden
(epidemic)
2013 to 2018 FSNAU20 Suspected and confirmed
cases. No cases reported
before 2015.
Measles
incidence†
cases per 100,000 population Disease burden
(epidemic)
2013 to 2018 FSNAU20 Suspected and confirmed
cases. No cases reported
before 2015.
Malaria incidence† cases per 100,000 population Disease burden
(epidemic)
2013 to 2018 FSNAU20 Suspected and confirmed
cases. No cases reported
before 2015.
Humanitarian actor
presence†
Ongoing humanitarian projects
per 100,000 population (all
sectors)
Humanitarian
(public health)
service
functionality
2010 to 2018 United Nations Office for
Coordination of Humanitarian
Affairs, Somalia
Proxy of intensity of
humanitarian response.
Unpublished data.
Ongoing projects per 100,000
population (health, nutrition and
water, hygiene and sanitation)
Measles
vaccination
Coverage of one dose of
measles-containing vaccine
among children
Humanitarian
(public health)
service coverage
2017 to 2018 World Health Organization,
Somalia
Based on programmatic data
(administrative coverage). Age
range unclear.
Unpublished data.
LSHTM – Mortality in Somalia, 2014-2018 Page 10 of 35
Predictor Variable(s) Domain Time span of
availability Source(s) Notes and assumptions
Food security
humanitarian
services†
Proportion of the population that
are a beneficiary of any food
security service
Humanitarian
(public health)
service coverage
Jan 2013 to
Apr 2018
Food Security Cluster,
Somalia
Unpublished data.
Proportion of the population that
are a beneficiary of cash-based
food security services
Humanitarian
(public health)
service coverage
Proportion of the population that
are a beneficiary of food
distributions
Humanitarian
(public health)
service coverage
Quality of SAM
treatment
Proportion of SAM admissions
that exit the treatment
programme cured
Humanitarian
(public health)
service quality
2011 to 2018 Nutrition Cluster, Somalia Unpublished data.
† Divided by district population estimates to obtain a population rate.
Ethics
All data were previously collected for routine humanitarian response and/or health service provision purposes, and were
either in the public domain or shared in fully anonymised format. The study was approved by the Ethics Committee of the
London School of Hygiene & Tropical Medicine (ref. 15334) and the Research and the Ethics Review Committee of the
Ministry of Health and Human Services, Somali Federal Republic (ref. MOH&HS/DGO/1944/Dec/2018).
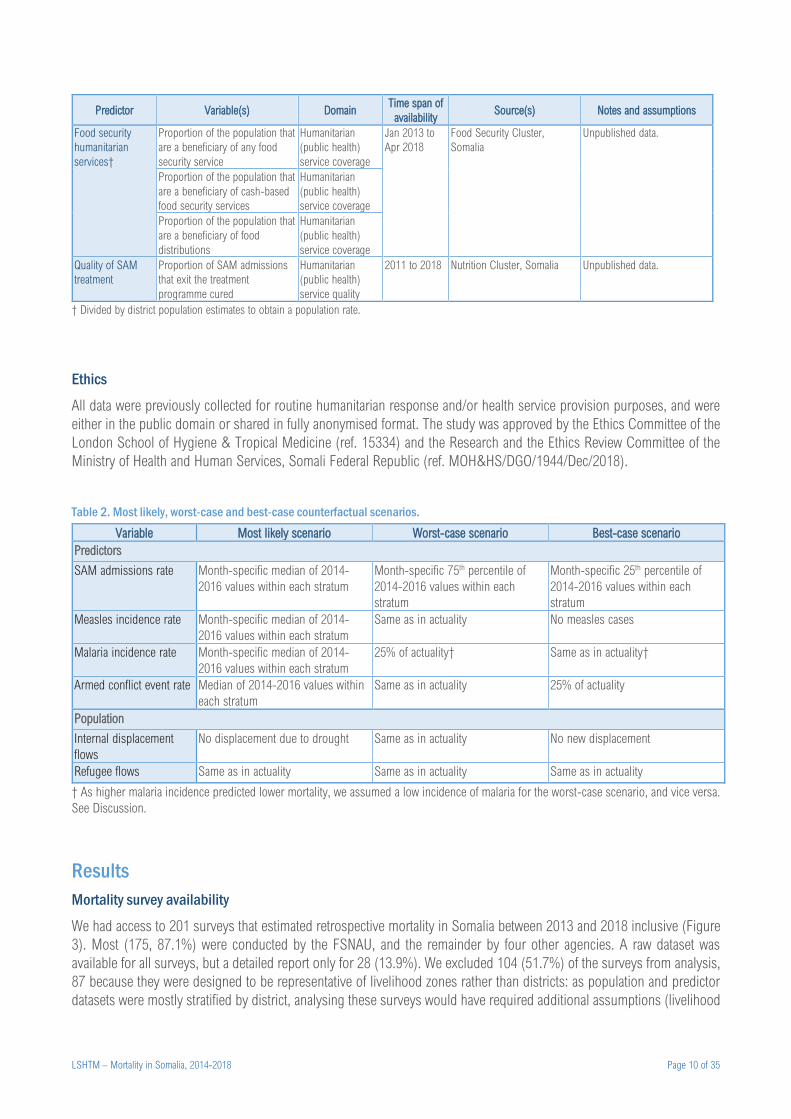
Table 2. Most likely, worst-case and best-case counterfactual scenarios.
Variable Most likely scenario Worst-case scenario Best-case scenario
Predictors
SAM admissions rate Month-specific median of 2014-
2016 values within each stratum
Month-specific 75th percentile of
2014-2016 values within each
stratum
Month-specific 25th percentile of
2014-2016 values within each
stratum
Measles incidence rate Month-specific median of 2014-
2016 values within each stratum
Same as in actuality No measles cases
Malaria incidence rate Month-specific median of 2014-
2016 values within each stratum
25% of actuality† Same as in actuality†
Armed conflict event rate Median of 2014-2016 values within
each stratum
Same as in actuality 25% of actuality
Population
Internal displacement
flows
No displacement due to drought Same as in actuality No new displacement
Refugee flows Same as in actuality Same as in actuality Same as in actuality
† As higher malaria incidence predicted lower mortality, we assumed a low incidence of malaria for the worst-case scenario, and vice versa.
See Discussion.
Results
Mortality survey availability
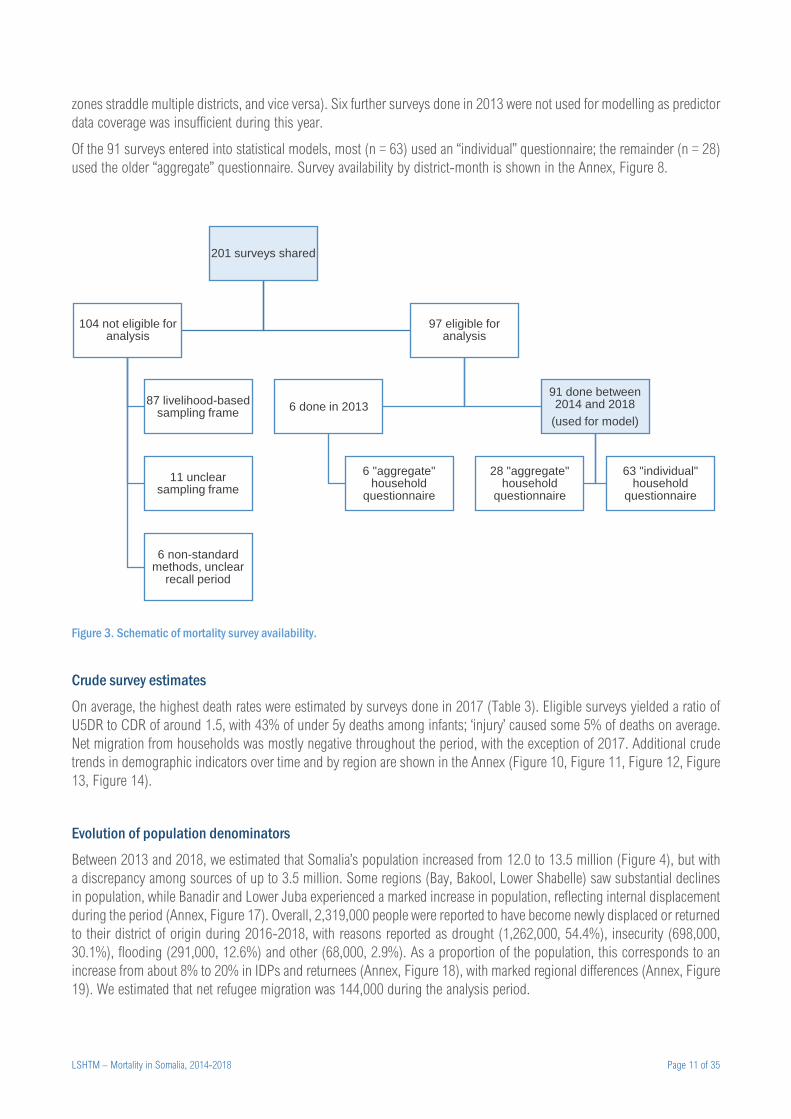
We had access to 201 surveys that estimated retrospective mortality in Somalia between 2013 and 2018 inclusive (Figure
3). Most (175, 87.1%) were conducted by the FSNAU, and the remainder by four other agencies. A raw dataset was
available for all surveys, but a detailed report only for 28 (13.9%). We excluded 104 (51.7%) of the surveys from analysis,
87 because they were designed to be representative of livelihood zones rather than districts: as population and predictor
datasets were mostly stratified by district, analysing these surveys would have required additional assumptions (livelihood
LSHTM – Mortality in Somalia, 2014-2018 Page 11 of 35
zones straddle multiple districts, and vice versa). Six further surveys done in 2013 were not used for modelling as predictor
data coverage was insufficient during this year.
Of the 91 surveys entered into statistical models, most (n = 63) used an “individual” questionnaire; the remainder (n = 28)
used the older “aggregate” questionnaire. Survey availability by district-month is shown in the Annex, Figure 8.
Figure 3. Schematic of mortality survey availability.
Crude survey estimates
On average, the highest death rates were estimated by surveys done in 2017 (Table 3). Eligible surveys yielded a ratio of
U5DR to CDR of around 1.5, with 43% of under 5y deaths among infants; ‘injury’ caused some 5% of deaths on average.
Net migration from households was mostly negative throughout the period, with the exception of 2017. Additional crude
trends in demographic indicators over time and by region are shown in the Annex (Figure 10, Figure 11, Figure 12, Figure
13, Figure 14).
Evolution of population denominators
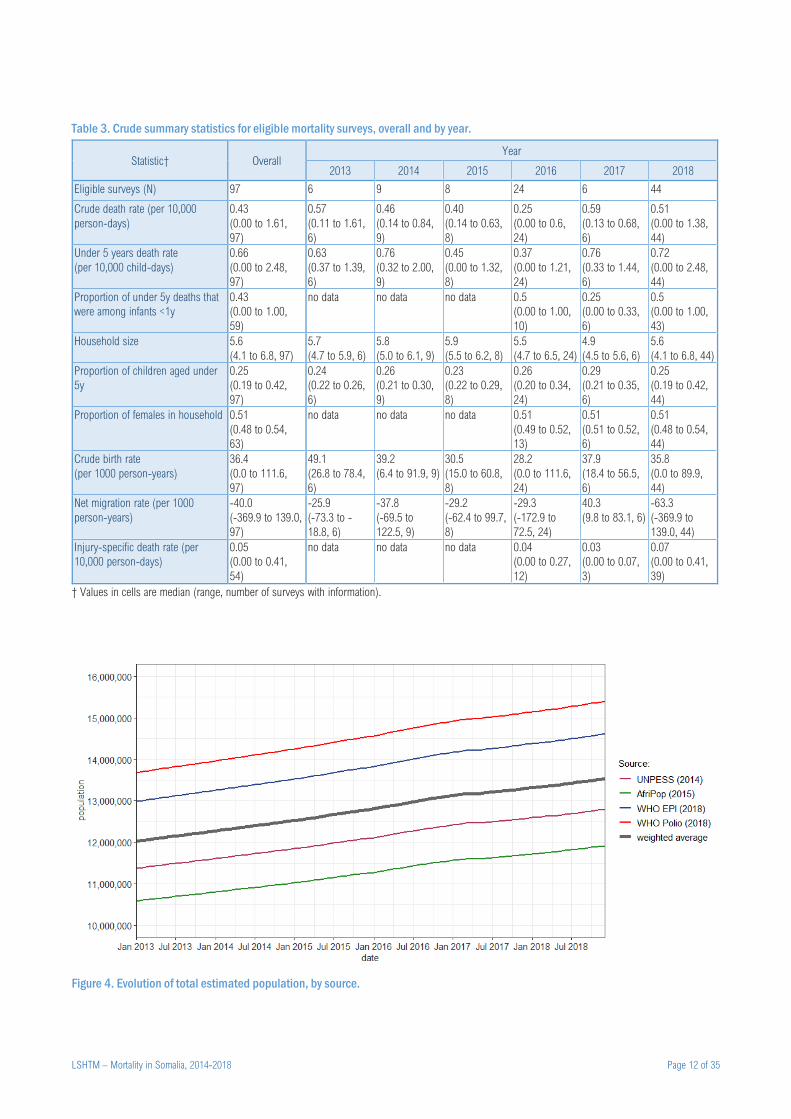
Between 2013 and 2018, we estimated that Somalia’s population increased from 12.0 to 13.5 million (Figure 4), but with
a discrepancy among sources of up to 3.5 million. Some regions (Bay, Bakool, Lower Shabelle) saw substantial declines
in population, while Banadir and Lower Juba experienced a marked increase in population, reflecting internal displacement
during the period (Annex, Figure 17). Overall, 2,319,000 people were reported to have become newly displaced or returned
to their district of origin during 2016-2018, with reasons reported as drought (1,262,000, 54.4%), insecurity (698,000,
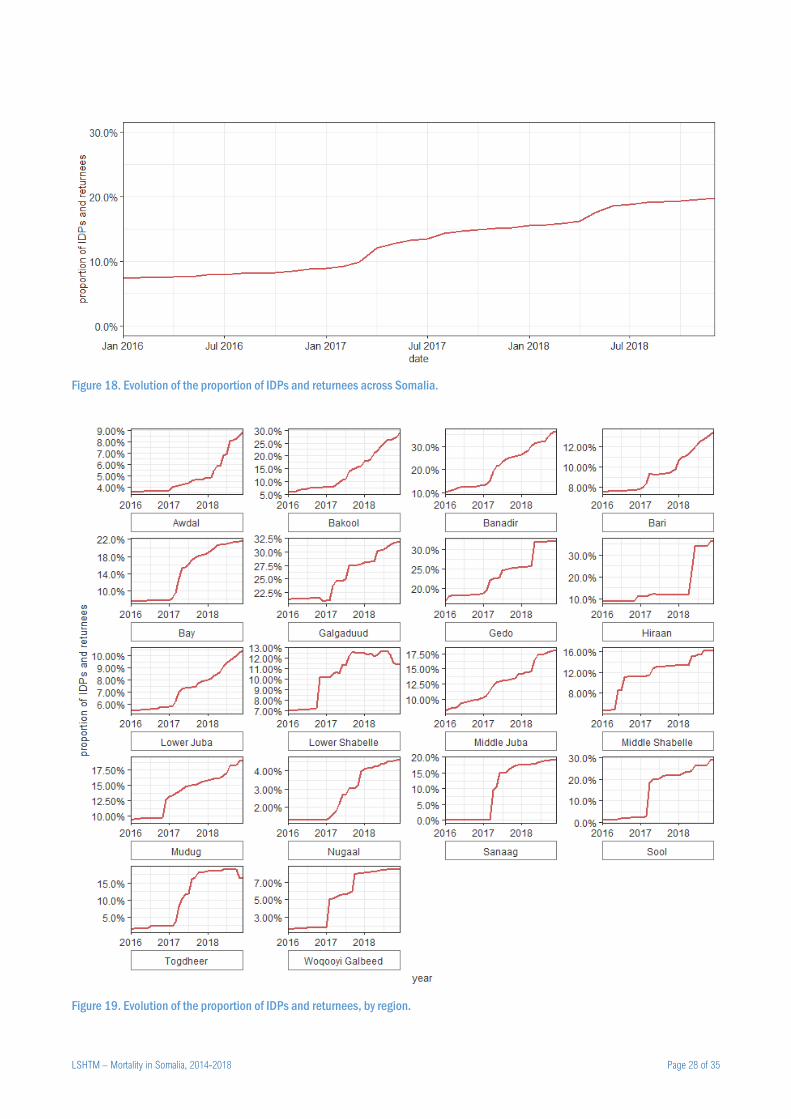
30.1%), flooding (291,000, 12.6%) and other (68,000, 2.9%). As a proportion of the population, this corresponds to an
increase from about 8% to 20% in IDPs and returnees (Annex, Figure 18), with marked regional differences (Annex, Figure
19). We estimated that net refugee migration was 144,000 during the analysis period.
201 surveys shared
104 not eligible for analysis
87 livelihood-based sampling frame
11 unclear sampling frame
6 non-standard methods, unclear
recall period
97 eligible for analysis
6 done in 2013
6 "aggregate" household
questionnaire
91 done between 2014 and 2018
(used for model)
28 "aggregate" household
questionnaire
63 "individual" household
questionnaire
LSHTM – Mortality in Somalia, 2014-2018 Page 12 of 35
Table 3. Crude summary statistics for eligible mortality surveys, overall and by year.
Statistic† Overall Year
2013 2014 2015 2016 2017 2018
Eligible surveys (N) 97 6 9 8 24 6 44
Crude death rate (per 10,000
person-days)
0.43
(0.00 to 1.61,
97)
0.57
(0.11 to 1.61,
6)
0.46
(0.14 to 0.84,
9)
0.40
(0.14 to 0.63,
8)
0.25
(0.00 to 0.6,
24)
0.59
(0.13 to 0.68,
6)
0.51
(0.00 to 1.38,
44)
Under 5 years death rate
(per 10,000 child-days)
0.66
(0.00 to 2.48,
97)
0.63
(0.37 to 1.39,
6)
0.76
(0.32 to 2.00,
9)
0.45
(0.00 to 1.32,
8)
0.37
(0.00 to 1.21,
24)
0.76
(0.33 to 1.44,
6)
0.72
(0.00 to 2.48,
44)
Proportion of under 5y deaths that
were among infants <1y
0.43
(0.00 to 1.00,
59)
no data no data no data 0.5
(0.00 to 1.00,
10)
0.25
(0.00 to 0.33,
6)
0.5
(0.00 to 1.00,
43)
Household size 5.6
(4.1 to 6.8, 97)
5.7
(4.7 to 5.9, 6)
5.8
(5.0 to 6.1, 9)
5.9
(5.5 to 6.2, 8)
5.5
(4.7 to 6.5, 24)
4.9
(4.5 to 5.6, 6)
5.6
(4.1 to 6.8, 44)
Proportion of children aged under
5y
0.25
(0.19 to 0.42,
97)
0.24
(0.22 to 0.26,
6)
0.26
(0.21 to 0.30,
9)
0.23
(0.22 to 0.29,
8)
0.26
(0.20 to 0.34,
24)
0.29
(0.21 to 0.35,
6)
0.25
(0.19 to 0.42,
44)
Proportion of females in household 0.51
(0.48 to 0.54,
63)
no data no data no data 0.51
(0.49 to 0.52,
13)
0.51
(0.51 to 0.52,
6)
0.51
(0.48 to 0.54,
44)
Crude birth rate
(per 1000 person-years)
36.4
(0.0 to 111.6,
97)
49.1
(26.8 to 78.4,
6)
39.2
(6.4 to 91.9, 9)
30.5
(15.0 to 60.8,
8)
28.2
(0.0 to 111.6,
24)
37.9
(18.4 to 56.5,
6)
35.8
(0.0 to 89.9,
44)
Net migration rate (per 1000
person-years)
-40.0
(-369.9 to 139.0,
97)
-25.9
(-73.3 to -
18.8, 6)
-37.8
(-69.5 to
122.5, 9)
-29.2
(-62.4 to 99.7,
8)
-29.3
(-172.9 to
72.5, 24)
40.3
(9.8 to 83.1, 6)
-63.3
(-369.9 to
139.0, 44)
Injury-specific death rate (per
10,000 person-days)
0.05
(0.00 to 0.41,
54)
no data no data no data 0.04
(0.00 to 0.27,
12)
0.03
(0.00 to 0.07,
3)
0.07
(0.00 to 0.41,
39)
† Values in cells are median (range, number of surveys with information).
Figure 4. Evolution of total estimated population, by source.
LSHTM – Mortality in Somalia, 2014-2018 Page 13 of 35
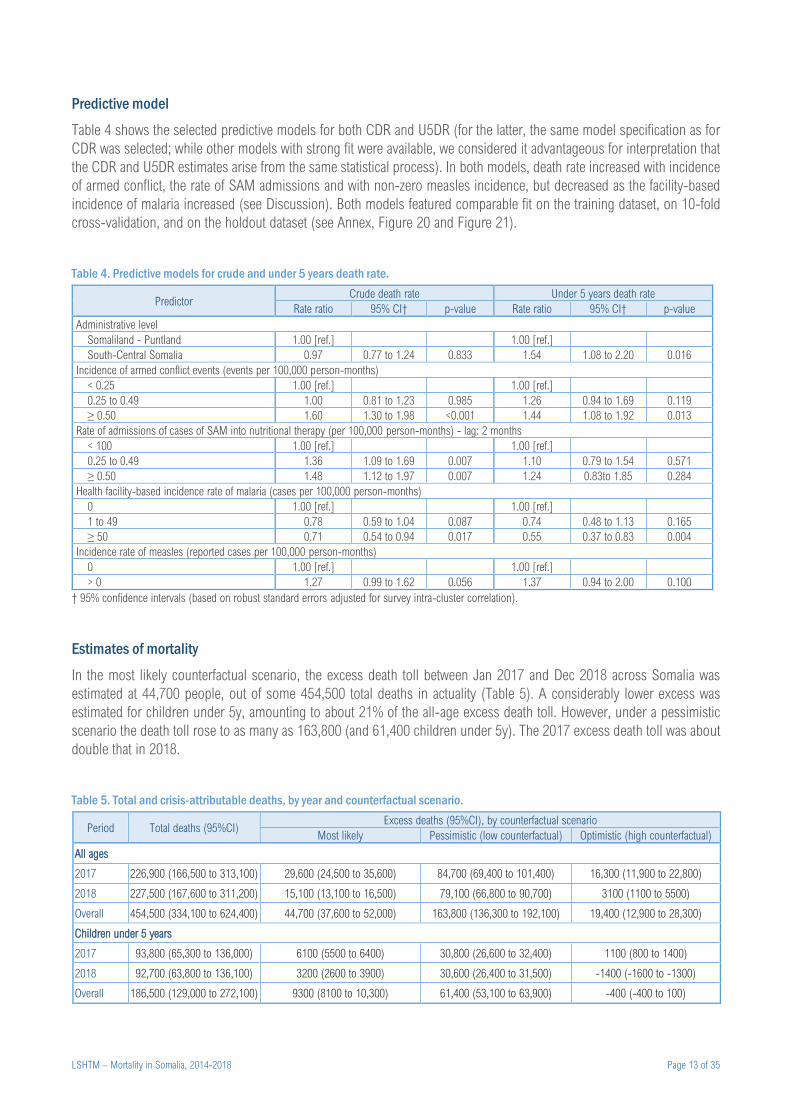
Predictive model
Table 4 shows the selected predictive models for both CDR and U5DR (for the latter, the same model specification as for
CDR was selected; while other models with strong fit were available, we considered it advantageous for interpretation that
the CDR and U5DR estimates arise from the same statistical process). In both models, death rate increased with incidence
of armed conflict, the rate of SAM admissions and with non-zero measles incidence, but decreased as the facility-based
incidence of malaria increased (see Discussion). Both models featured comparable fit on the training dataset, on 10-fold
cross-validation, and on the holdout dataset (see Annex, Figure 20 and Figure 21).
Table 4. Predictive models for crude and under 5 years death rate.
Predictor Crude death rate Under 5 years death rate
Rate ratio 95% CI† p-value Rate ratio 95% CI† p-value
Administrative level
Somaliland - Puntland 1.00 [ref.] 1.00 [ref.]
South-Central Somalia 0.97 0.77 to 1.24 0.833 1.54 1.08 to 2.20 0.016
Incidence of armed conflict events (events per 100,000 person-months)
< 0.25 1.00 [ref.] 1.00 [ref.]
0.25 to 0.49 1.00 0.81 to 1.23 0.985 1.26 0.94 to 1.69 0.119
≥ 0.50 1.60 1.30 to 1.98 <0.001 1.44 1.08 to 1.92 0.013
Rate of admissions of cases of SAM into nutritional therapy (per 100,000 person-months) - lag: 2 months
< 100 1.00 [ref.] 1.00 [ref.]
0.25 to 0.49 1.36 1.09 to 1.69 0.007 1.10 0.79 to 1.54 0.571
≥ 0.50 1.48 1.12 to 1.97 0.007 1.24 0.83to 1.85 0.284
Health facility-based incidence rate of malaria (cases per 100,000 person-months)
0 1.00 [ref.] 1.00 [ref.]
1 to 49 0.78 0.59 to 1.04 0.087 0.74 0.48 to 1.13 0.165
≥ 50 0.71 0.54 to 0.94 0.017 0.55 0.37 to 0.83 0.004
Incidence rate of measles (reported cases per 100,000 person-months)
0 1.00 [ref.] 1.00 [ref.]
> 0 1.27 0.99 to 1.62 0.056 1.37 0.94 to 2.00 0.100
† 95% confidence intervals (based on robust standard errors adjusted for survey intra-cluster correlation).
Estimates of mortality
In the most likely counterfactual scenario, the excess death toll between Jan 2017 and Dec 2018 across Somalia was
estimated at 44,700 people, out of some 454,500 total deaths in actuality (Table 5). A considerably lower excess was
estimated for children under 5y, amounting to about 21% of the all-age excess death toll. However, under a pessimistic
scenario the death toll rose to as many as 163,800 (and 61,400 children under 5y). The 2017 excess death toll was about
double that in 2018.
Table 5. Total and crisis-attributable deaths, by year and counterfactual scenario.
Period Total deaths (95%CI) Excess deaths (95%CI), by counterfactual scenario
Most likely Pessimistic (low counterfactual) Optimistic (high counterfactual)
All ages
2017 226,900 (166,500 to 313,100) 29,600 (24,500 to 35,600) 84,700 (69,400 to 101,400) 16,300 (11,900 to 22,800)
2018 227,500 (167,600 to 311,200) 15,100 (13,100 to 16,500) 79,100 (66,800 to 90,700) 3100 (1100 to 5500)
Overall 454,500 (334,100 to 624,400) 44,700 (37,600 to 52,000) 163,800 (136,300 to 192,100) 19,400 (12,900 to 28,300)
Children under 5 years
2017 93,800 (65,300 to 136,000) 6100 (5500 to 6400) 30,800 (26,600 to 32,400) 1100 (800 to 1400)
2018 92,700 (63,800 to 136,100) 3200 (2600 to 3900) 30,600 (26,400 to 31,500) -1400 (-1600 to -1300)
Overall 186,500 (129,000 to 272,100) 9300 (8100 to 10,300) 61,400 (53,100 to 63,900) -400 (-400 to 100)
LSHTM – Mortality in Somalia, 2014-2018 Page 14 of 35
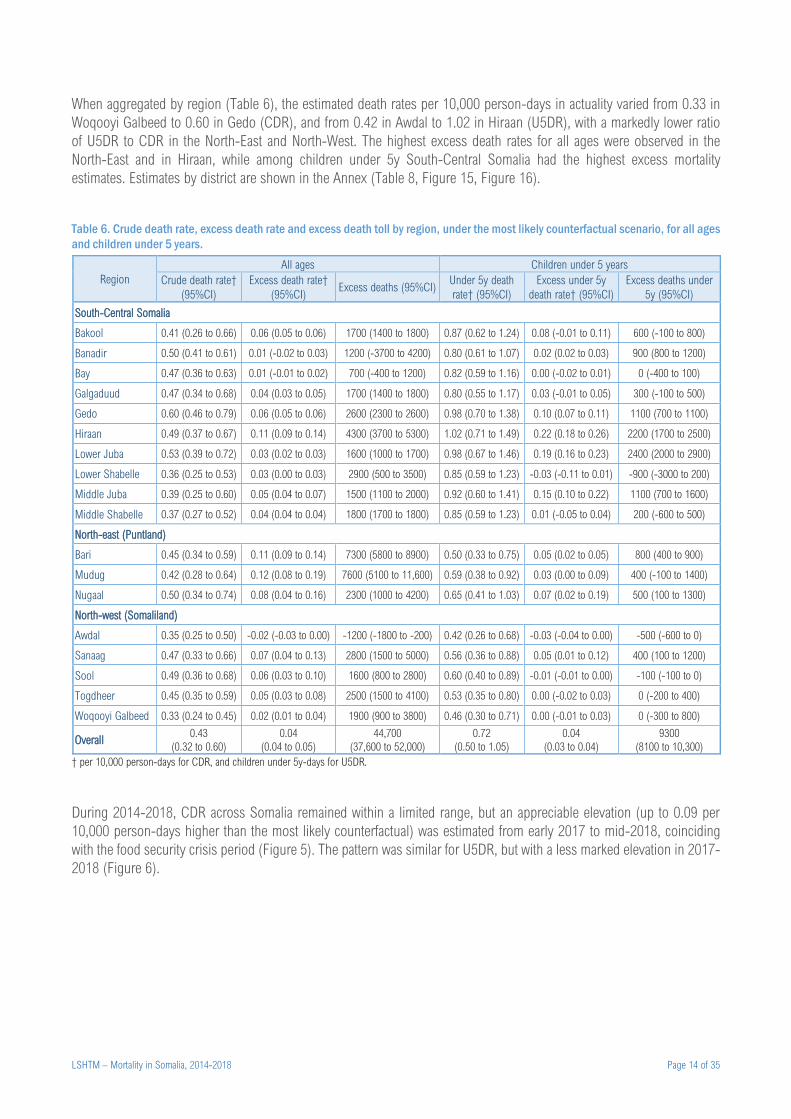
When aggregated by region (Table 6), the estimated death rates per 10,000 person-days in actuality varied from 0.33 in
Woqooyi Galbeed to 0.60 in Gedo (CDR), and from 0.42 in Awdal to 1.02 in Hiraan (U5DR), with a markedly lower ratio
of U5DR to CDR in the North-East and North-West. The highest excess death rates for all ages were observed in the
North-East and in Hiraan, while among children under 5y South-Central Somalia had the highest excess mortality
estimates. Estimates by district are shown in the Annex (Table 8, Figure 15, Figure 16).
Table 6. Crude death rate, excess death rate and excess death toll by region, under the most likely counterfactual scenario, for all ages
and children under 5 years.
Region
All ages Children under 5 years
Crude death rate†
(95%CI)
Excess death rate†
(95%CI) Excess deaths (95%CI)
Under 5y death
rate† (95%CI)
Excess under 5y
death rate† (95%CI)
Excess deaths under
5y (95%CI)
South-Central Somalia
Bakool 0.41 (0.26 to 0.66) 0.06 (0.05 to 0.06) 1700 (1400 to 1800) 0.87 (0.62 to 1.24) 0.08 (-0.01 to 0.11) 600 (-100 to 800)
Banadir 0.50 (0.41 to 0.61) 0.01 (-0.02 to 0.03) 1200 (-3700 to 4200) 0.80 (0.61 to 1.07) 0.02 (0.02 to 0.03) 900 (800 to 1200)
Bay 0.47 (0.36 to 0.63) 0.01 (-0.01 to 0.02) 700 (-400 to 1200) 0.82 (0.59 to 1.16) 0.00 (-0.02 to 0.01) 0 (-400 to 100)
Galgaduud 0.47 (0.34 to 0.68) 0.04 (0.03 to 0.05) 1700 (1400 to 1800) 0.80 (0.55 to 1.17) 0.03 (-0.01 to 0.05) 300 (-100 to 500)
Gedo 0.60 (0.46 to 0.79) 0.06 (0.05 to 0.06) 2600 (2300 to 2600) 0.98 (0.70 to 1.38) 0.10 (0.07 to 0.11) 1100 (700 to 1100)
Hiraan 0.49 (0.37 to 0.67) 0.11 (0.09 to 0.14) 4300 (3700 to 5300) 1.02 (0.71 to 1.49) 0.22 (0.18 to 0.26) 2200 (1700 to 2500)
Lower Juba 0.53 (0.39 to 0.72) 0.03 (0.02 to 0.03) 1600 (1000 to 1700) 0.98 (0.67 to 1.46) 0.19 (0.16 to 0.23) 2400 (2000 to 2900)
Lower Shabelle 0.36 (0.25 to 0.53) 0.03 (0.00 to 0.03) 2900 (500 to 3500) 0.85 (0.59 to 1.23) -0.03 (-0.11 to 0.01) -900 (-3000 to 200)
Middle Juba 0.39 (0.25 to 0.60) 0.05 (0.04 to 0.07) 1500 (1100 to 2000) 0.92 (0.60 to 1.41) 0.15 (0.10 to 0.22) 1100 (700 to 1600)
Middle Shabelle 0.37 (0.27 to 0.52) 0.04 (0.04 to 0.04) 1800 (1700 to 1800) 0.85 (0.59 to 1.23) 0.01 (-0.05 to 0.04) 200 (-600 to 500)
North-east (Puntland)
Bari 0.45 (0.34 to 0.59) 0.11 (0.09 to 0.14) 7300 (5800 to 8900) 0.50 (0.33 to 0.75) 0.05 (0.02 to 0.05) 800 (400 to 900)
Mudug 0.42 (0.28 to 0.64) 0.12 (0.08 to 0.19) 7600 (5100 to 11,600) 0.59 (0.38 to 0.92) 0.03 (0.00 to 0.09) 400 (-100 to 1400)
Nugaal 0.50 (0.34 to 0.74) 0.08 (0.04 to 0.16) 2300 (1000 to 4200) 0.65 (0.41 to 1.03) 0.07 (0.02 to 0.19) 500 (100 to 1300)
North-west (Somaliland)
Awdal 0.35 (0.25 to 0.50) -0.02 (-0.03 to 0.00) -1200 (-1800 to -200) 0.42 (0.26 to 0.68) -0.03 (-0.04 to 0.00) -500 (-600 to 0)
Sanaag 0.47 (0.33 to 0.66) 0.07 (0.04 to 0.13) 2800 (1500 to 5000) 0.56 (0.36 to 0.88) 0.05 (0.01 to 0.12) 400 (100 to 1200)
Sool 0.49 (0.36 to 0.68) 0.06 (0.03 to 0.10) 1600 (800 to 2800) 0.60 (0.40 to 0.89) -0.01 (-0.01 to 0.00) -100 (-100 to 0)
Togdheer 0.45 (0.35 to 0.59) 0.05 (0.03 to 0.08) 2500 (1500 to 4100) 0.53 (0.35 to 0.80) 0.00 (-0.02 to 0.03) 0 (-200 to 400)
Woqooyi Galbeed 0.33 (0.24 to 0.45) 0.02 (0.01 to 0.04) 1900 (900 to 3800) 0.46 (0.30 to 0.71) 0.00 (-0.01 to 0.03) 0 (-300 to 800)
Overall 0.43
(0.32 to 0.60)
0.04
(0.04 to 0.05)
44,700
(37,600 to 52,000)
0.72
(0.50 to 1.05)
0.04
(0.03 to 0.04)
9300
(8100 to 10,300)
† per 10,000 person-days for CDR, and children under 5y-days for U5DR.
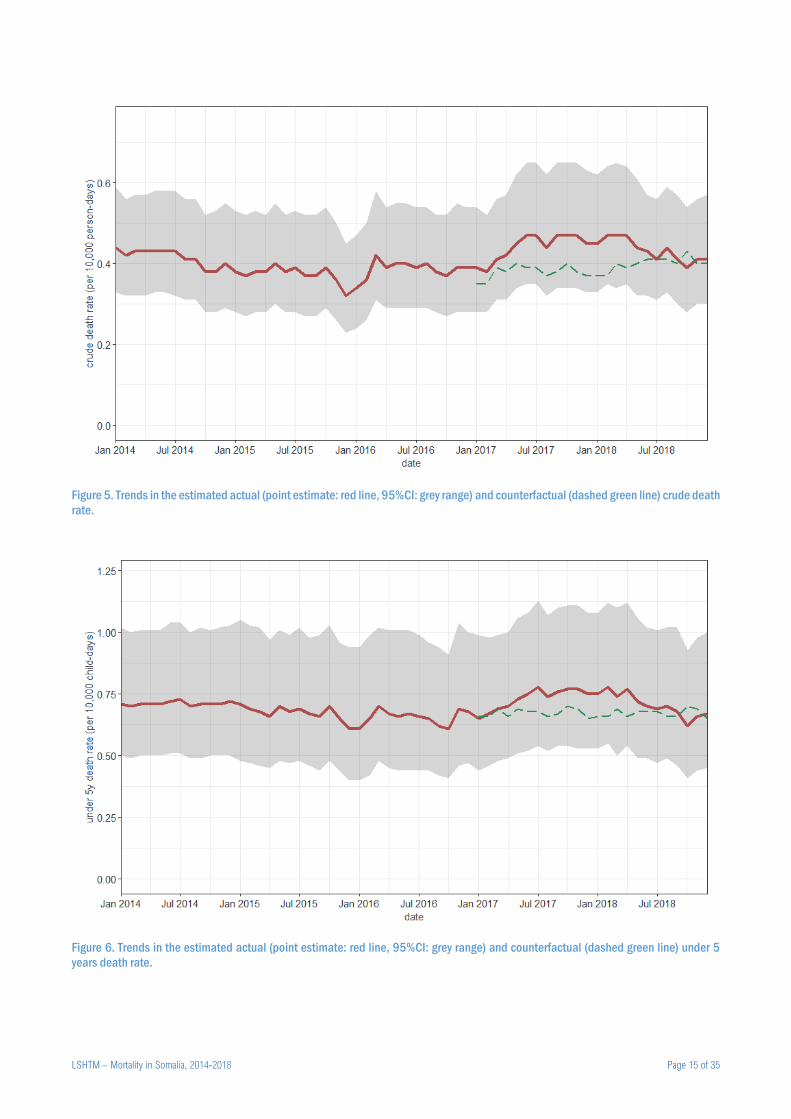
During 2014-2018, CDR across Somalia remained within a limited range, but an appreciable elevation (up to 0.09 per
10,000 person-days higher than the most likely counterfactual) was estimated from early 2017 to mid-2018, coinciding
with the food security crisis period (Figure 5). The pattern was similar for U5DR, but with a less marked elevation in 2017-
2018 (Figure 6).
LSHTM – Mortality in Somalia, 2014-2018 Page 15 of 35
Figure 5. Trends in the estimated actual (point estimate: red line, 95%CI: grey range) and counterfactual (dashed green line) crude death
rate.
Figure 6. Trends in the estimated actual (point estimate: red line, 95%CI: grey range) and counterfactual (dashed green line) under 5
years death rate.
LSHTM – Mortality in Somalia, 2014-2018 Page 16 of 35
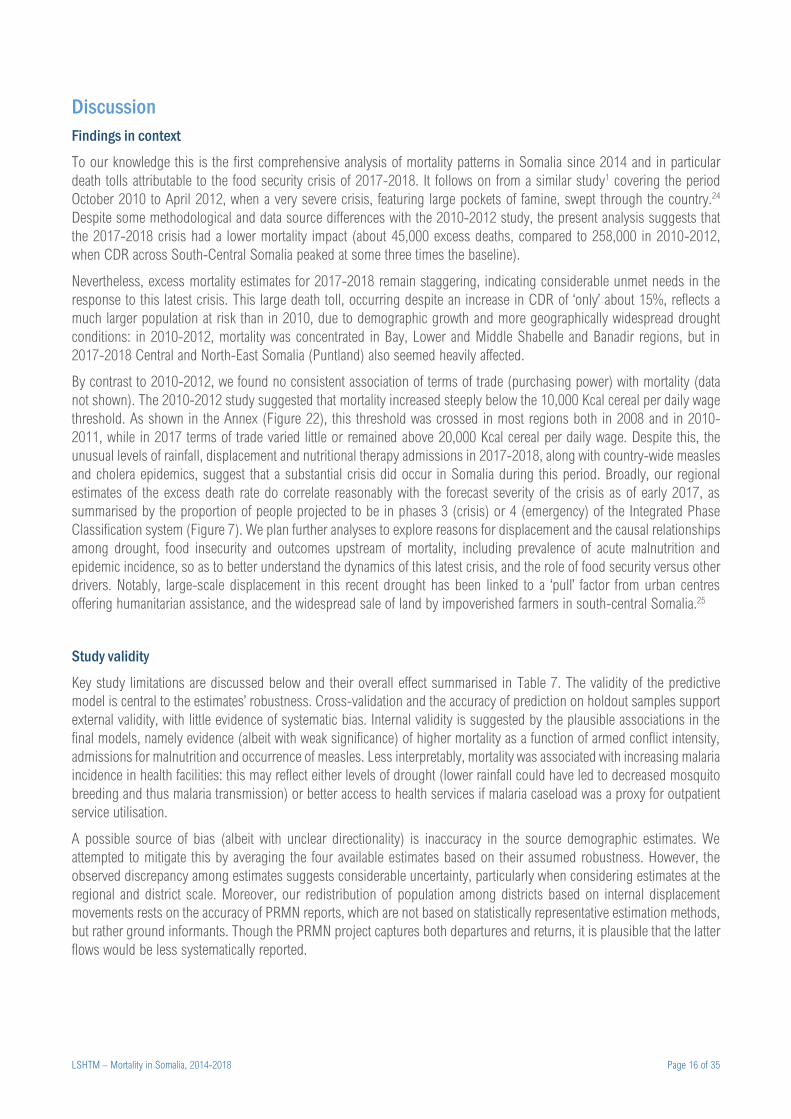
Discussion
Findings in context
To our knowledge this is the first comprehensive analysis of mortality patterns in Somalia since 2014 and in particular
death tolls attributable to the food security crisis of 2017-2018. It follows on from a similar study1 covering the period
October 2010 to April 2012, when a very severe crisis, featuring large pockets of famine, swept through the country.24
Despite some methodological and data source differences with the 2010-2012 study, the present analysis suggests that
the 2017-2018 crisis had a lower mortality impact (about 45,000 excess deaths, compared to 258,000 in 2010-2012,
when CDR across South-Central Somalia peaked at some three times the baseline).
Nevertheless, excess mortality estimates for 2017-2018 remain staggering, indicating considerable unmet needs in the
response to this latest crisis. This large death toll, occurring despite an increase in CDR of ‘only’ about 15%, reflects a
much larger population at risk than in 2010, due to demographic growth and more geographically widespread drought
conditions: in 2010-2012, mortality was concentrated in Bay, Lower and Middle Shabelle and Banadir regions, but in
2017-2018 Central and North-East Somalia (Puntland) also seemed heavily affected.
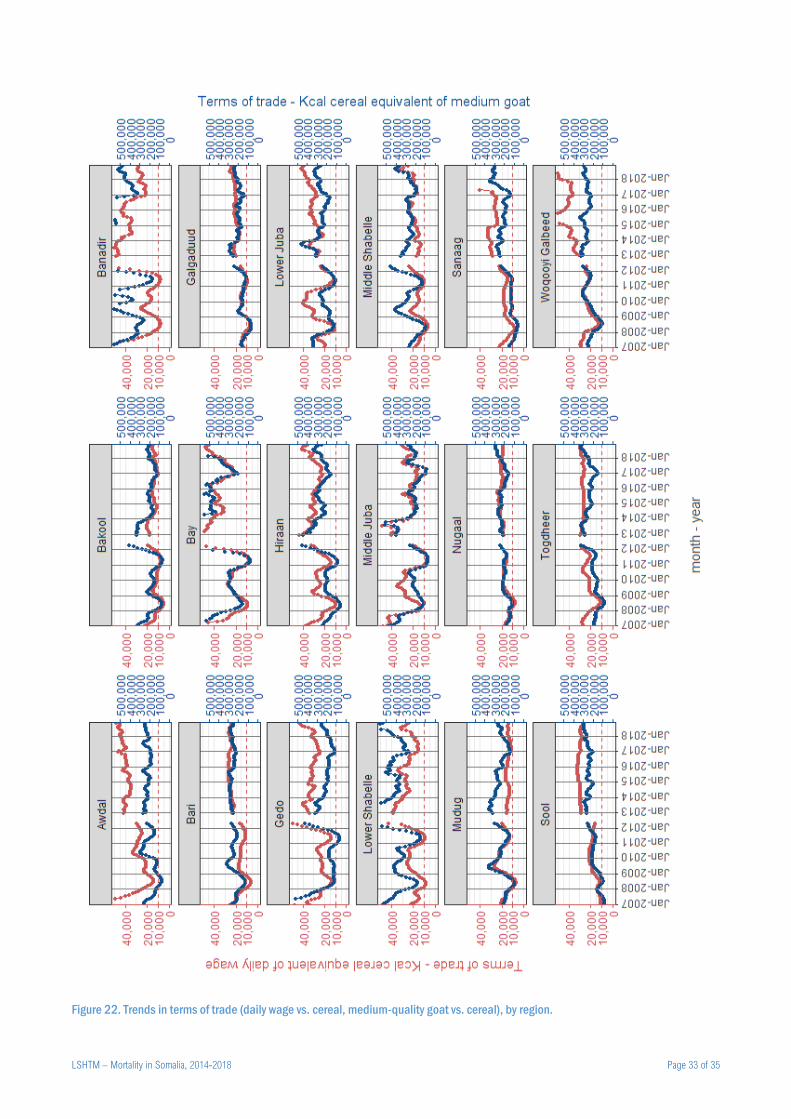
By contrast to 2010-2012, we found no consistent association of terms of trade (purchasing power) with mortality (data
not shown). The 2010-2012 study suggested that mortality increased steeply below the 10,000 Kcal cereal per daily wage
threshold. As shown in the Annex (Figure 22), this threshold was crossed in most regions both in 2008 and in 2010-
2011, while in 2017 terms of trade varied little or remained above 20,000 Kcal cereal per daily wage. Despite this, the
unusual levels of rainfall, displacement and nutritional therapy admissions in 2017-2018, along with country-wide measles
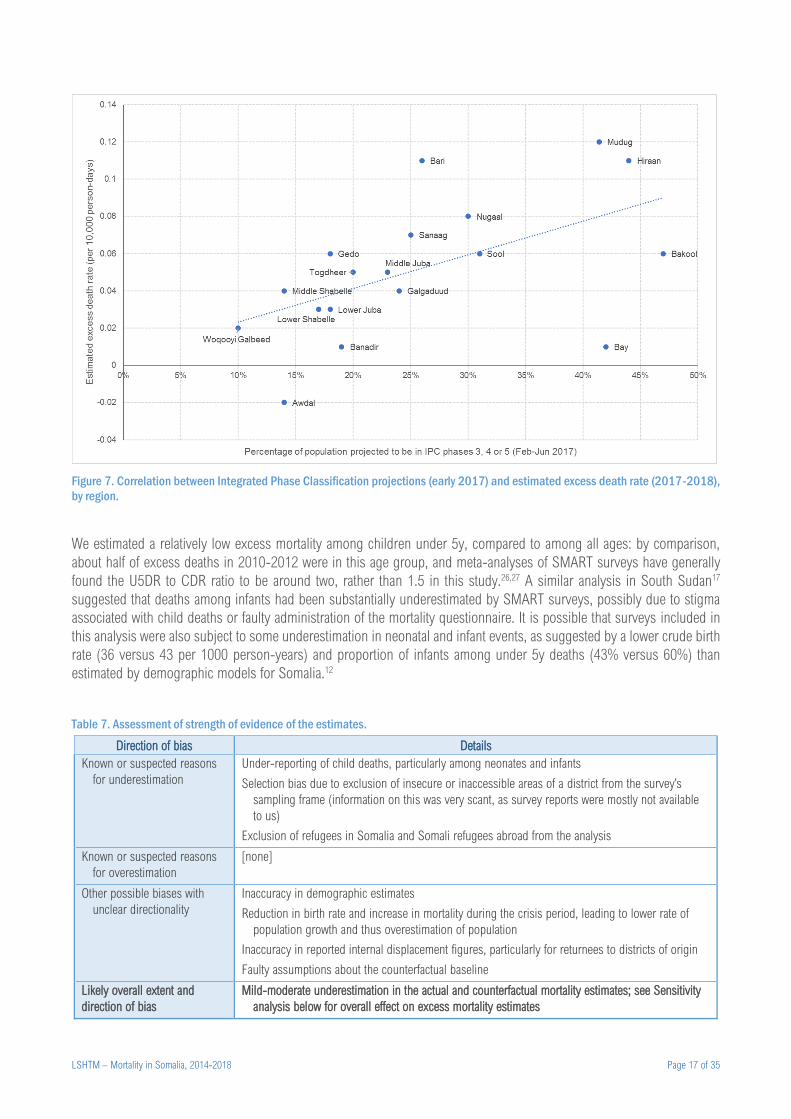
and cholera epidemics, suggest that a substantial crisis did occur in Somalia during this period. Broadly, our regional
estimates of the excess death rate do correlate reasonably with the forecast severity of the crisis as of early 2017, as
summarised by the proportion of people projected to be in phases 3 (crisis) or 4 (emergency) of the Integrated Phase
Classification system (Figure 7). We plan further analyses to explore reasons for displacement and the causal relationships
among drought, food insecurity and outcomes upstream of mortality, including prevalence of acute malnutrition and
epidemic incidence, so as to better understand the dynamics of this latest crisis, and the role of food security versus other
drivers. Notably, large-scale displacement in this recent drought has been linked to a ‘pull’ factor from urban centres
offering humanitarian assistance, and the widespread sale of land by impoverished farmers in south-central Somalia.25
Study validity
Key study limitations are discussed below and their overall effect summarised in Table 7. The validity of the predictive
model is central to the estimates’ robustness. Cross-validation and the accuracy of prediction on holdout samples support
external validity, with little evidence of systematic bias. Internal validity is suggested by the plausible associations in the
final models, namely evidence (albeit with weak significance) of higher mortality as a function of armed conflict intensity,
admissions for malnutrition and occurrence of measles. Less interpretably, mortality was associated with increasing malaria
incidence in health facilities: this may reflect either levels of drought (lower rainfall could have led to decreased mosquito
breeding and thus malaria transmission) or better access to health services if malaria caseload was a proxy for outpatient
service utilisation.
A possible source of bias (albeit with unclear directionality) is inaccuracy in the source demographic estimates. We
attempted to mitigate this by averaging the four available estimates based on their assumed robustness. However, the
observed discrepancy among estimates suggests considerable uncertainty, particularly when considering estimates at the
regional and district scale. Moreover, our redistribution of population among districts based on internal displacement
movements rests on the accuracy of PRMN reports, which are not based on statistically representative estimation methods,
but rather ground informants. Though the PRMN project captures both departures and returns, it is plausible that the latter
flows would be less systematically reported.
LSHTM – Mortality in Somalia, 2014-2018 Page 17 of 35
Figure 7. Correlation between Integrated Phase Classification projections (early 2017) and estimated excess death rate (2017-2018),
by region.
We estimated a relatively low excess mortality among children under 5y, compared to among all ages: by comparison,
about half of excess deaths in 2010-2012 were in this age group, and meta-analyses of SMART surveys have generally
found the U5DR to CDR ratio to be around two, rather than 1.5 in this study.26,27 A similar analysis in South Sudan17
suggested that deaths among infants had been substantially underestimated by SMART surveys, possibly due to stigma
associated with child deaths or faulty administration of the mortality questionnaire. It is possible that surveys included in
this analysis were also subject to some underestimation in neonatal and infant events, as suggested by a lower crude birth
rate (36 versus 43 per 1000 person-years) and proportion of infants among under 5y deaths (43% versus 60%) than
estimated by demographic models for Somalia.12
Table 7. Assessment of strength of evidence of the estimates.
Direction of bias Details
Known or suspected reasons
for underestimation
Under-reporting of child deaths, particularly among neonates and infants
Selection bias due to exclusion of insecure or inaccessible areas of a district from the survey’s
sampling frame (information on this was very scant, as survey reports were mostly not available
to us)
Exclusion of refugees in Somalia and Somali refugees abroad from the analysis
Known or suspected reasons
for overestimation
[none]
Other possible biases with
unclear directionality
Inaccuracy in demographic estimates
Reduction in birth rate and increase in mortality during the crisis period, leading to lower rate of
population growth and thus overestimation of population
Inaccuracy in reported internal displacement figures, particularly for returnees to districts of origin
Faulty assumptions about the counterfactual baseline
Likely overall extent and
direction of bias
Mild-moderate underestimation in the actual and counterfactual mortality estimates; see Sensitivity
analysis below for overall effect on excess mortality estimates
LSHTM – Mortality in Somalia, 2014-2018 Page 18 of 35
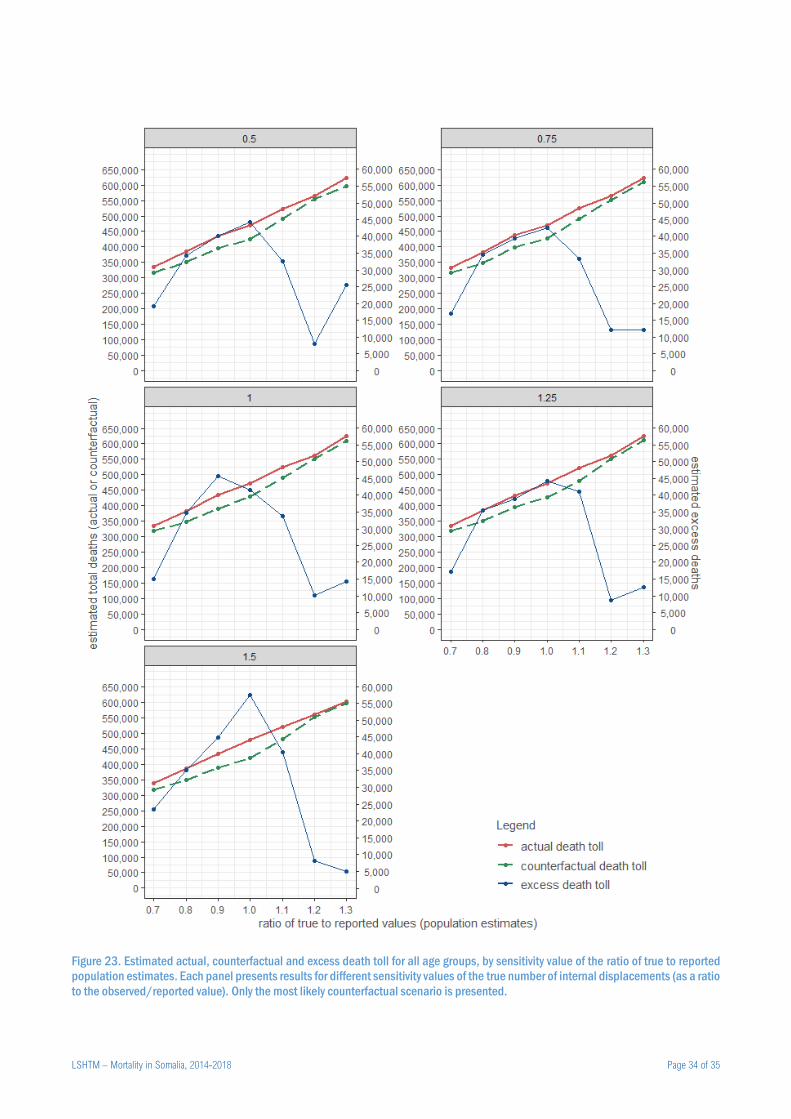
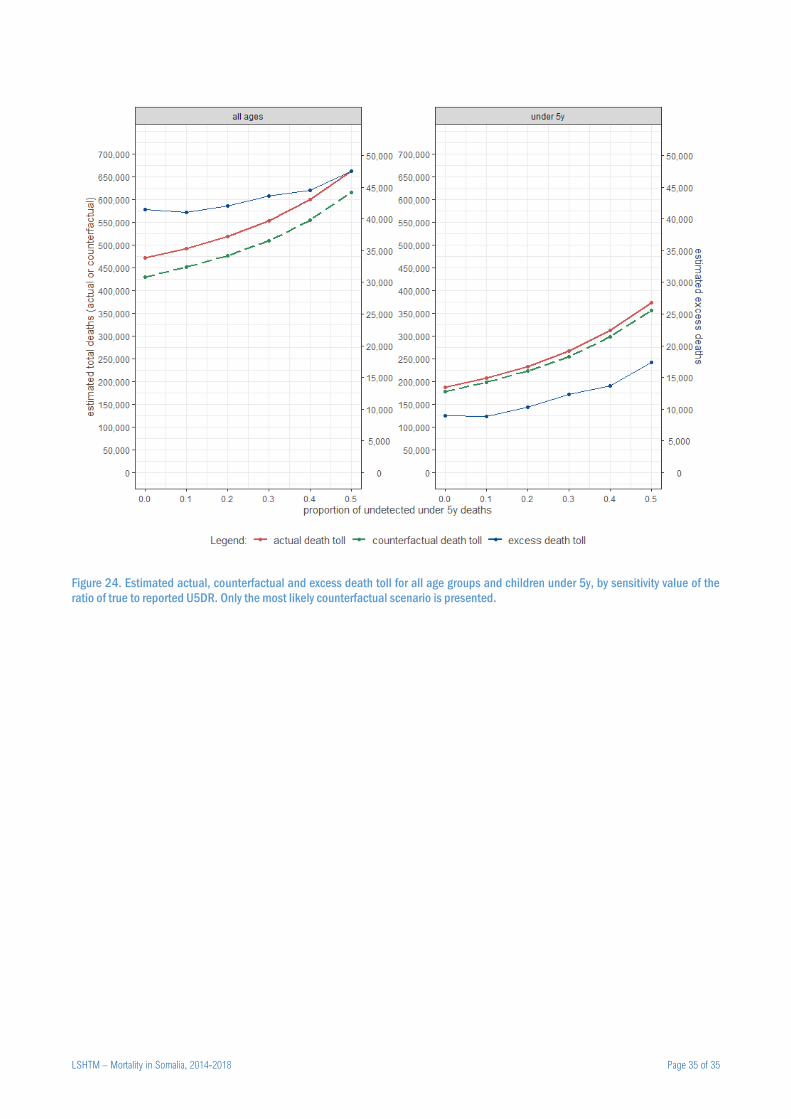
To explore sensitivity of our estimates to key potential sources of error, we (i) assumed different levels of bias in source
demographic estimates and reported displacement movements, and (ii) varying proportions of under-reporting among
deaths under 5y (see methods paper for detail). Generally, excess mortality estimates appeared relatively insensitive to
bias in displacement figures, but decreased substantially as bias in demographic estimates (either over- or
underestimation) increased (Annex, Figure 23). As assumed under-estimation in U5DR rose from 0% to 50%, a doubling
in the excess death toll under 5y was projected, but all-age death tolls increased only moderately (Annex, Figure 24).
Conclusions
This study finds evidence of elevated mortality during a drought-triggered crisis in Somalia over 2017-2018, despite a
lesser effect on food security than in previous similar events, and a more proactive and far-reaching humanitarian
response.28 Our findings indicate that even at moderate levels of population stress (for example, IPC phase 3), excess
mortality accrues. Therefore, even if the sole aim of humanitarian actors is to support survival, a response needs to be
implemented to scale very early in the curve of deterioration in food security and other upstream crisis indicators. While
our analysis does not have granularity below district level, we speculate that mortality risk is likely to be clustered within
particularly vulnerable communities and households: more specific targeting of limited resources to support these
communities and individuals would probably increase the cost-effectiveness and efficiency of humanitarian responses.
Somalia and other fragile regions of the world appear to face an increased threat of drought. Understanding the mortality
impact of these events can support rational resource allocation and benchmark the adequacy of humanitarian responses.
As such, mortality analyses such as ours should arguably become a systematic component of monitoring and evaluation
in drought-triggered crises. It is also critical that the narrative of Somalia’s crisis not lose sight of human security as a key
driver of mortality, as shown in our model. Armed conflict and the securitisation of much of Somalia exacerbate the severity
of drought and underlie the chronic vulnerability of Somali people to unfavourable climate: the restoration of peace and
governance to all of Somalia holds perhaps the greatest potential for attenuating the impact of droughts and other natural
disasters on its population.
References
1. Food and Agriculture Organisation, Famine Early Warning Systems Network. Mortality among populations of southern and central
Somalia affected by severe food insecurity and famine during 2010-2012. Rome and Washington, DC: FAO and FEWS NET, 2013.
http://www.fsnau.org/downloads/Somalia_Mortality_Estimates_Final_Report_8May2013_upload.pdf, accessed 28 May 2018
2. Food Security and Nutrition Analysis Unit - Somalia, Famine Early Warning Systems Network. Technical release: Over one million
people in Somalia face acute food insecurity as food crisis worsens. Nairobi: FSNAU,
2014.http://www.fsnau.org/downloads/FSNAU-FEWSNET-Technical-Release-August-2014.pdf (accessed 25 January 2020).
3. Food Security and Nutrition Analysis Unit - Somalia. Somalia Food Security & Nutrition Analysis Post Deyr 2015/16 Technical
Series Report No VII. 64. Nairobi: FSNAU, 2016.http://www.fsnau.org/downloads/FSNAU-Post-Deyr-2015-16-Food-Security-
and-Nutrition-Analysis-Technical-Report.pdf (accessed 25 January 2020).
4. United Nations Office for the Coordination of Humanitarian Affairs. Somalia: Humanitarian Response Plan Revision - May 2017.
Mogadishu: UN OCHA, 2017.https://www.humanitarianresponse.info/en/operations/somalia/document/somalia-humanitarian-
response-plan-revision-may-2017 (accessed 25 January 2020).
5. Seal A, Checchi F, Balfour N, Nur AH, Jelle M. A weak health response is increasing the risk of excess mortality as food crisis
worsens in Somalia. Confl Health 2017; 11: 12.
6. Salama P, Spiegel P, Talley L, Waldman R. Lessons learned from complex emergencies over past decade. Lancet 2004; 364(9447):
1801-13.
7. Checchi F, Roberts L. Documenting mortality in crises: what keeps us from doing better. PLoS Med 2008; 5(7): e146.
8. Rao JNK, Molina I. Small area estimation. 2nd ed. Hoboken, NJ: John Wiley & Sons, Inc.; 2015.
LSHTM – Mortality in Somalia, 2014-2018 Page 19 of 35
9. Standardised Monitoring and Assessment of Relief and Transitions (SMART). Measuring Mortality, Nutritional Status, and Food
Security in Crisis Situations: SMART Methodology. SMART Manual Version 2, 2017.https://smartmethodology.org/survey-
planning-tools/smart-methodology/ (accessed 4 May 2019).
10. Cairns KL, Woodruff BA, Myatt M, Bartlett L, Goldberg H, Roberts L. Cross-sectional survey methods to assess retrospectively
mortality in humanitarian emergencies. Disasters 2009; 33(4): 503-21.
11. Checchi F. Estimation of population mortality in crisis-affected populations: Guidance for humanitarian coordination mechanisms.
Geneva: World Health Organization, 2018.https://www.who.int/health-cluster/resources/publications/LSHTM-Mortality-
Estimation-Options-oct2018.pdf (accessed 19 February 2019).
12. Population Division of the Department of Economic and Social Affairs of the United Nations Secretariat. World Population
Prospects: The 2019 Revision. New York: UN; 2019.https://population.un.org/wpp/DataQuery/
13. United Nations Population Fund. Composition and Demographic Characteristics of the Somali People. Nairobi: UNFPA,
2016.http://www.dns.org.so/docs/Analytical_Report_Volume_2.pdf (accessed 20 Jan 2020).
14. Linard C, Alegana VA, Noor AM, Snow RW, Tatem AJ. A high resolution spatial population database of Somalia for disease risk
mapping. Int J Health Geogr 2010; 9: 45.
15. United Nations High Commissioner for Refugees. UNHCR Somalia Protection & Return Monitoring Network (PRMN): Notes on
methodology. Nairobi: UNHCR, 2017.https://reliefweb.int/sites/reliefweb.int/files/resources/PRMN-MethodologyNotesv1.0.pdf
(accessed 20 Jan 2020).
16. Checchi F, Warsame A, Treacy-Wong V, Polonsky J, van Ommeren M, Prudhon C. Public health information in crisis-affected
populations: a review of methods and their use for advocacy and action. Lancet 2017; 390(10109): 2297-313.
17. Checchi F, Testa A, Warsame A, Quach L, Burns R. Estimates of crisis-attributable mortality in South Sudan, December 2013-
April 2018: A statistical analysis. London: London School of Hygiene and Tropical Medicine,,
2018.https://crises.lshtm.ac.uk/2018/09/25/south-sudan/ (accessed 22 October 2018).
18. Desert Research Institute and University of Idaho. Climate Engine. 2019.http://climateengine.org
19. Huntington JL, Hegewisch KC, Daudert B, et al. Climate Engine: Cloud Computing and Visualization of Climate and Remote
Sensing Data for Advanced Natural Resource Monitoring and Process Understanding. Bulletin of the American Meteorological
Society 2017; 98(11): 2397-410.
20. Food Security and Nutrition Analysis Unit - Somalia. Early Warning - Early Action Dashboard. Nairobi;
2019.https://dashboard.fsnau.org/
21. Raleigh C, Linke A, Hegre H, Karlsen J. Introducing ACLED-Armed Conflict Location and Event Data. Journal of Peace Research
2010; 47(5): 1-10.
22. Humanitarian Outcomes. Aid Worker Security Database. 2019.https://aidworkersecurity.org/
23. Food Security and Nutrition Analysis Unit - Somalia. Somalia: Livelihood Zones. Nairobi: FSNAU; 2015.
24. Maxwell D, Fitzpatrick M. The 2011 Somalia famine: Context, causes, and complications. Global Food Security 2012; 1(1): 5-12.
25. Jaspars S, Adan GM, Majid N. Food and power in Somalia: business as usual? A scoping study on the political economy of food
following shifts in food assistance and in governance. London: London School of Economics and Political Science Conflict
Research Programme,
2020.http://eprints.lse.ac.uk/103138/4/Food_and_Power_in_Somalia_business_as_usual_FINAL21Jan2020.pdf (accessed 25
January 2020).
26. Guha-Sapir D, Panhuis WG. Conflict-related mortality: an analysis of 37 datasets. Disasters 2004; 28(4): 418-28.
27. Guha-Sapir D, van Panhuis WG, Degomme O, Teran V. Civil conflicts in four african countries: a five-year review of trends in
nutrition and mortality. Epidemiol Rev 2005; 27: 67-77.
28. DuBois M, Harvey P, Taylor G. Rapid Real-Time Review: DFID Somalia Drought Response. London: Humanitarian Outcomes,
2018.https://assets.publishing.service.gov.uk/media/5a8566e4e5274a2e87dc3e43/DFID_Somalia_2017_IRF_Real_Time_Revie
w_FINAL.pdf (accessed 25 January 2020).
LSHTM – Mortality in Somalia, 2014-2018 Page 20 of 35
Annex
Computation of terms of trade indicators
FSNAU field researchers collect monthly data from 50 rural and 50 urban markets located throughout Somalia. We
extracted price data for the following items: 1 Kg white sorghum; 1 Kg red sorghum; 1 Kg yellow maize; 1 Kg white maize;
1 Kg imported red rice; 1 Kg wheat flour; 1 goat of local quality (i.e. not for export); daily wage in the local currency.
Sorghum and maize are locally produced while wheat and rice are mostly imported.
We combined the above variables to compute two terms of trade food security indicators for each district-month: (i) the
Kcal equivalent of staple cereal that can be purchased by a typical daily wage, and (ii) the Kcal staple cereal equivalent of
the selling price of a local quality goat. For any given market, only price items with ≥ 75% data completeness over the
period 2013 to 2018 were retained in the analysis.
The equation for the terms of trade (ToT) of a typical daily wage, for a given district-month, is as follows:
𝑇𝑜𝑇𝑊,𝑘,𝑡 =
∑∑ (
𝑊𝑚,𝑡
𝐼𝑐,𝑚,𝑡𝑟𝑐𝐸𝑐)
2𝐶𝑚𝑐
∑𝑊𝑚,𝑡
𝐼𝑐,𝑚,𝑡𝑟𝑐𝐸𝑐
𝐶𝑚𝑐
𝑀𝑘𝑚 𝑈𝑚
∑ 𝑈𝑚𝑀𝑘𝑚
where 𝑘 is a district, 𝑡 a month, 𝑚 one of the 𝑀𝑘 markets within the district, 𝑐 one of the 𝐶𝑚 cereals with sufficient data
completeness in market 𝑚, 𝐼𝑐 is the price of 1 Kg of cereal 𝑐, 𝑊𝑚,𝑡 is the average daily labour wage in market 𝑚 and
month 𝑡, 𝑟𝑐 is the proportion of cereal 𝑐 that is recovered after milling, 𝐸𝑐 is the Kcal value of 1 Kg of milled cereal 𝑐 and
𝑈𝑚 is a weight equal to 3 for urban markets and 1 for rural markets.
We first computed the monthly terms of trade for each cereal-market time series by working out the Kcal equivalent of the
amount of that cereal that a daily wage could purchase, based the price of 1 Kg of the cereal, the proportion lost after
milling and an assumed Kcal per Kg.
Whenever more than one cereal-market time series was sufficiently complete for analysis (e.g. white sorghum, red rice),
we took a weighted mean of these. In the absence of data on relative purchase quantities of different cereals, we assumed
based on simple elasticity principles that, in the context of a poor harvest and high poverty levels, people would have had
a strong preference for purchasing the cheapest cereal, and would have shifted their preference according to cereal prices,
with a greater tendency to shift to cheaper staples, the lower the daily wage. We represented this assumed elasticity by
using the ToT for each cereal itself as a weight when averaging all cereals (mathematically this is equivalent to averaging
the squares of each cereal’s ToT).
Lastly, if more than one market was located within the district, we calculated a weighted mean of ToT from each market,
weighting urban markets three times more than rural ones.
We replicated the above calculation for the ToT of a local-quality goat, by substituting 𝑊𝑚,𝑡 with 𝐺𝑚,𝑡, the price of a local-
quality goat.
LSHTM – Mortality in Somalia, 2014-2018 Page 21 of 35
Additional tables and figures
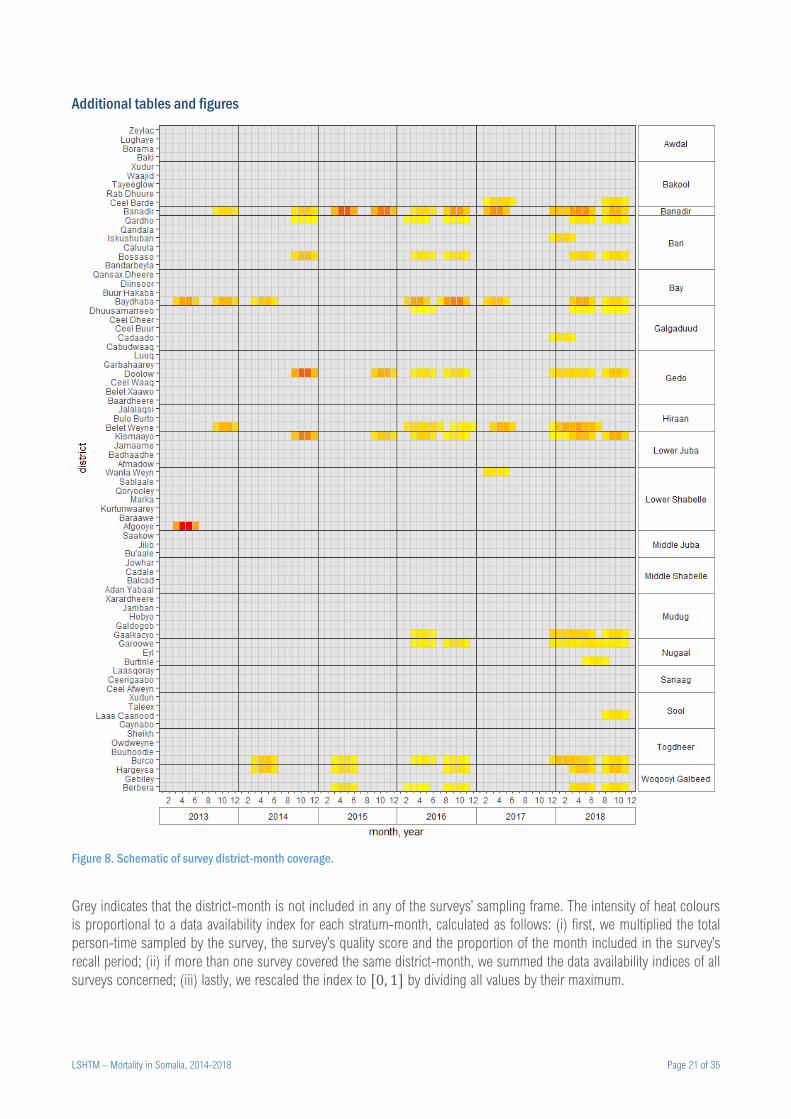
Figure 8. Schematic of survey district-month coverage.
Grey indicates that the district-month is not included in any of the surveys’ sampling frame. The intensity of heat colours
is proportional to a data availability index for each stratum-month, calculated as follows: (i) first, we multiplied the total
person-time sampled by the survey, the survey’s quality score and the proportion of the month included in the survey’s
recall period; (ii) if more than one survey covered the same district-month, we summed the data availability indices of all
surveys concerned; (iii) lastly, we rescaled the index to [0, 1] by dividing all values by their maximum.
LSHTM – Mortality in Somalia, 2014-2018 Page 22 of 35
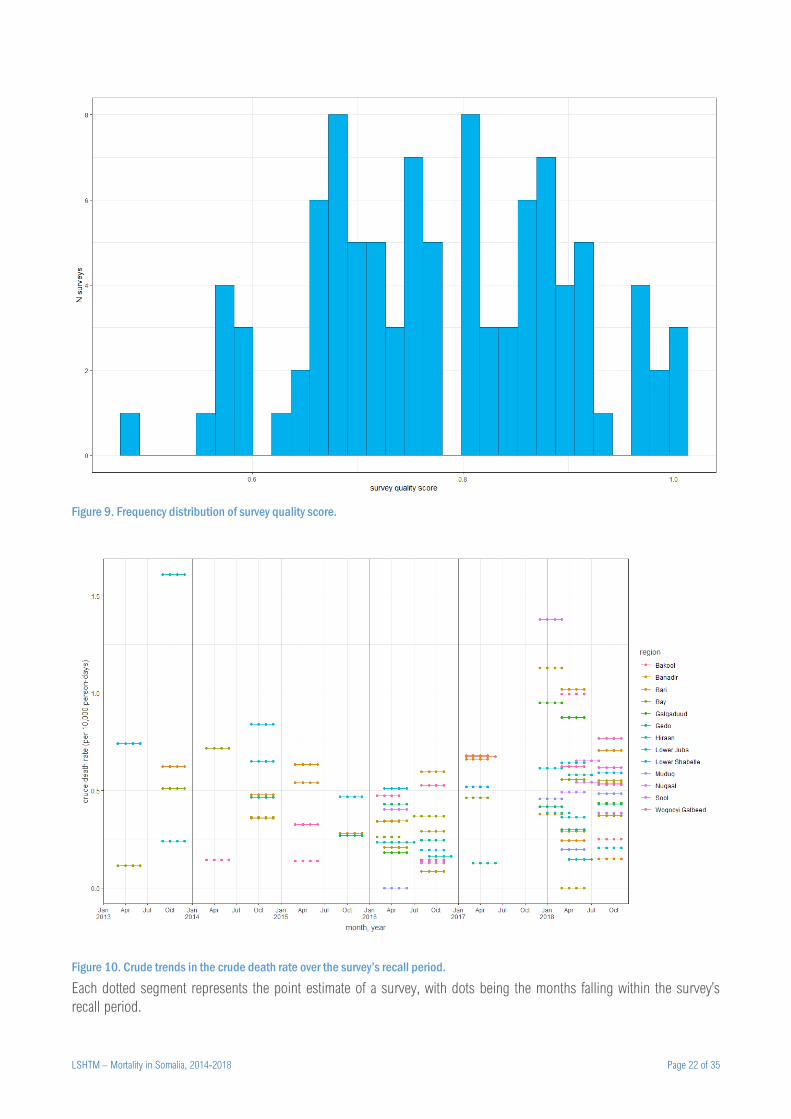
Figure 9. Frequency distribution of survey quality score.
Figure 10. Crude trends in the crude death rate over the survey’s recall period.
Each dotted segment represents the point estimate of a survey, with dots being the months falling within the survey’s
recall period.
LSHTM – Mortality in Somalia, 2014-2018 Page 23 of 35
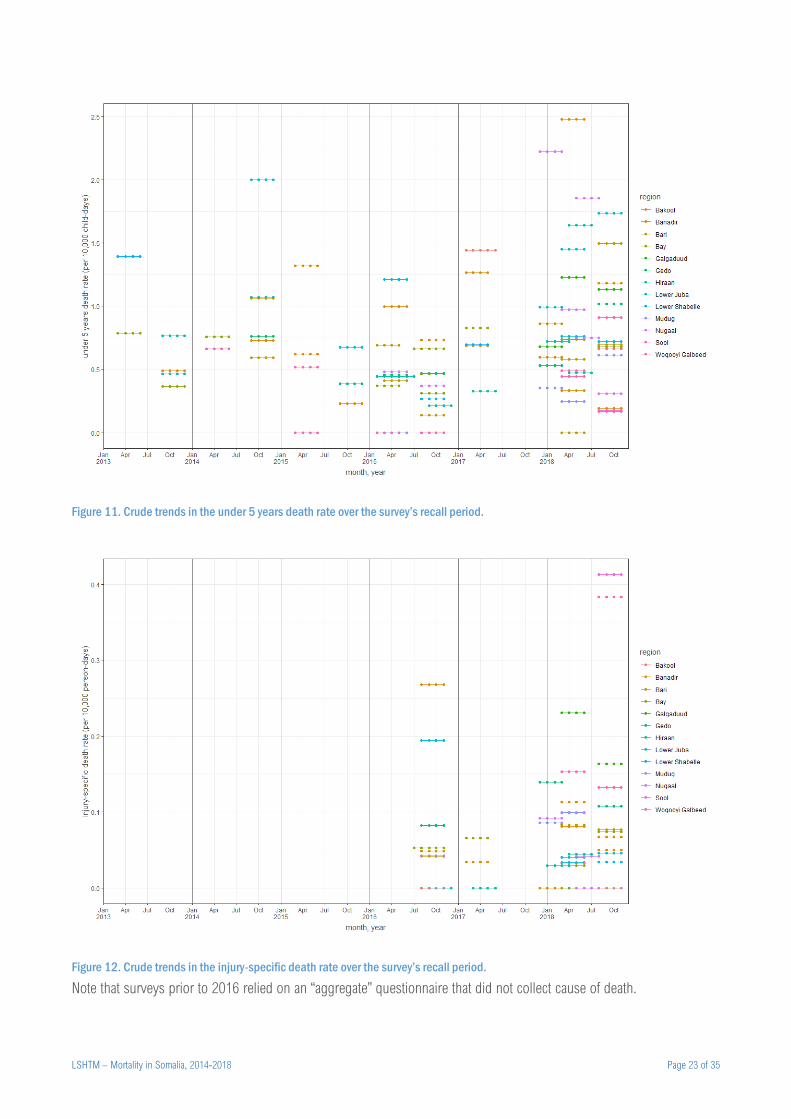
Figure 11. Crude trends in the under 5 years death rate over the survey’s recall period.
Figure 12. Crude trends in the injury-specific death rate over the survey’s recall period.
Note that surveys prior to 2016 relied on an “aggregate” questionnaire that did not collect cause of death.
LSHTM – Mortality in Somalia, 2014-2018 Page 24 of 35
Figure 13. Crude trends in the relative risk of dying (males versus females) over the survey’s recall period. The red horizontal line indicates
a relative risk of 1.
Note that surveys prior to 2016 relied on an “aggregate” questionnaire that did not collect gender of household members.
Figure 14. Crude trends in the net migration rate among household members over the survey’s recall period.
LSHTM – Mortality in Somalia, 2014-2018 Page 25 of 35
Figure 15. Best estimate of excess crude death rate (CDR), by district.
LSHTM – Mortality in Somalia, 2014-2018 Page 26 of 35
Figure 16. Best estimate of excess death toll, by district.
LSHTM – Mortality in Somalia, 2014-2018 Page 27 of 35
Figure 17. Evolution of population denominators, by region and source.
LSHTM – Mortality in Somalia, 2014-2018 Page 28 of 35
Figure 18. Evolution of the proportion of IDPs and returnees across Somalia.
Figure 19. Evolution of the proportion of IDPs and returnees, by region.
LSHTM – Mortality in Somalia, 2014-2018 Page 29 of 35
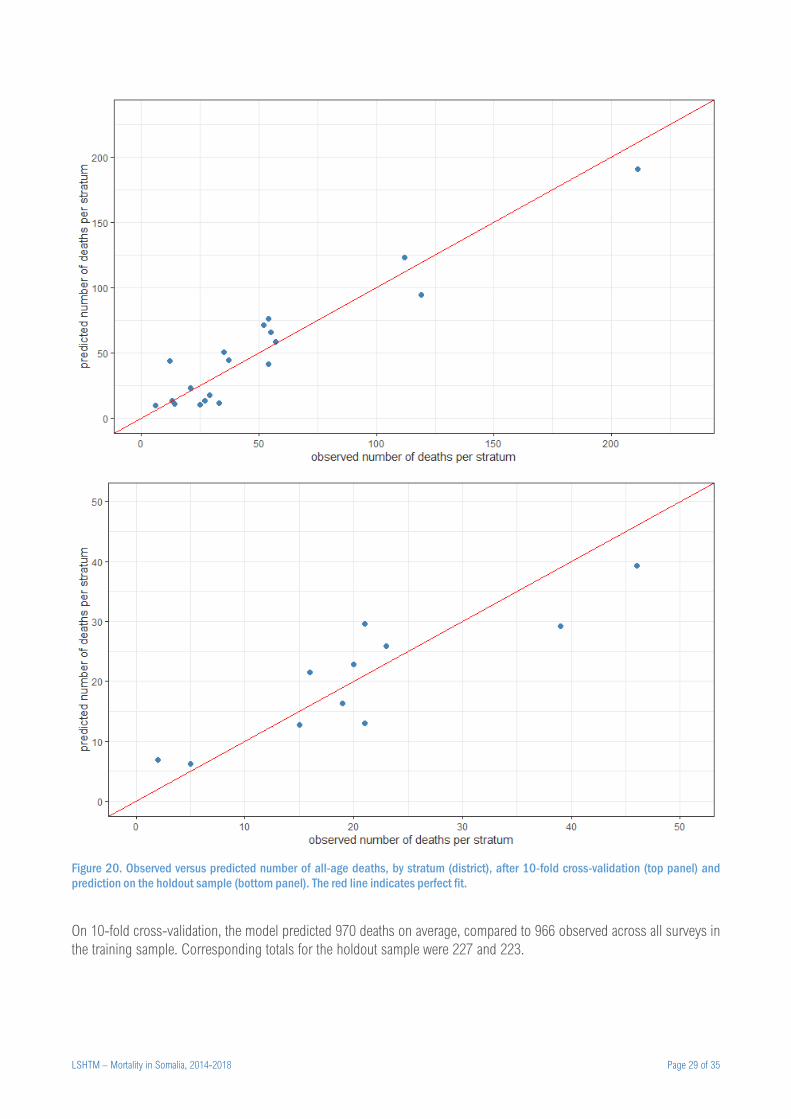
Figure 20. Observed versus predicted number of all-age deaths, by stratum (district), after 10-fold cross-validation (top panel) and
prediction on the holdout sample (bottom panel). The red line indicates perfect fit.
On 10-fold cross-validation, the model predicted 970 deaths on average, compared to 966 observed across all surveys in
the training sample. Corresponding totals for the holdout sample were 227 and 223.
LSHTM – Mortality in Somalia, 2014-2018 Page 30 of 35
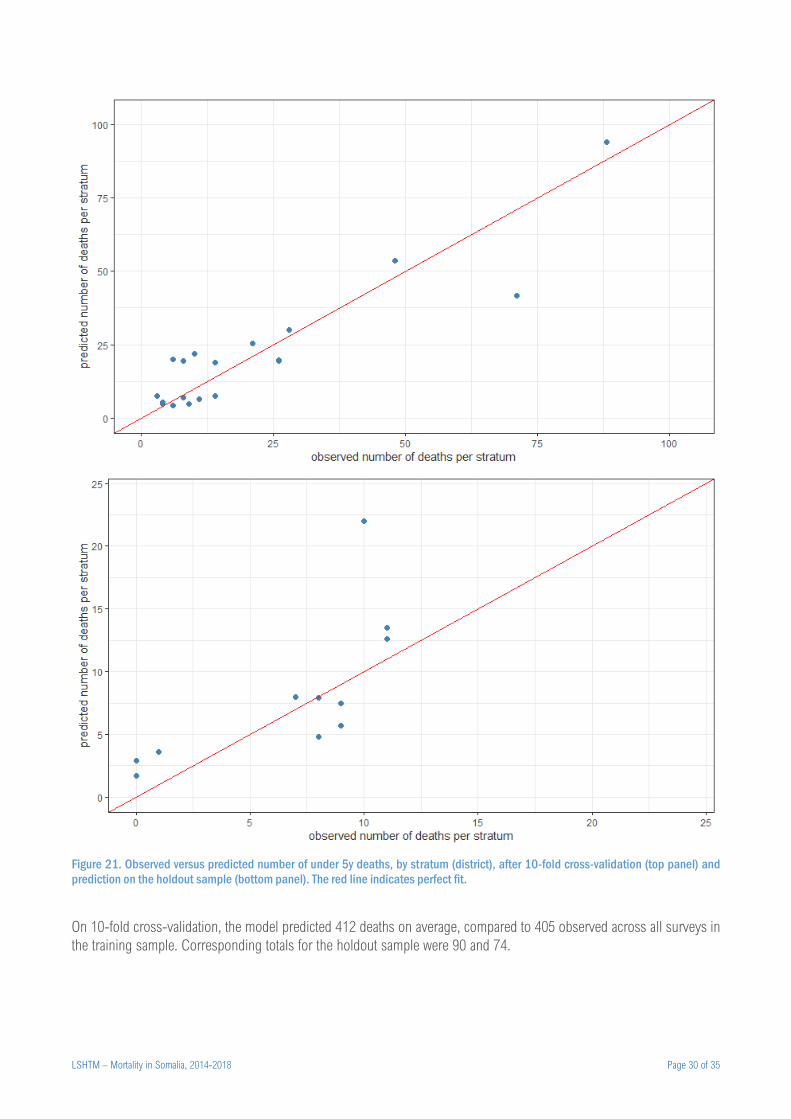
Figure 21. Observed versus predicted number of under 5y deaths, by stratum (district), after 10-fold cross-validation (top panel) and
prediction on the holdout sample (bottom panel). The red line indicates perfect fit.
On 10-fold cross-validation, the model predicted 412 deaths on average, compared to 405 observed across all surveys in
the training sample. Corresponding totals for the holdout sample were 90 and 74.
LSHTM – Mortality in Somalia, 2014-2018 Page 31 of 35
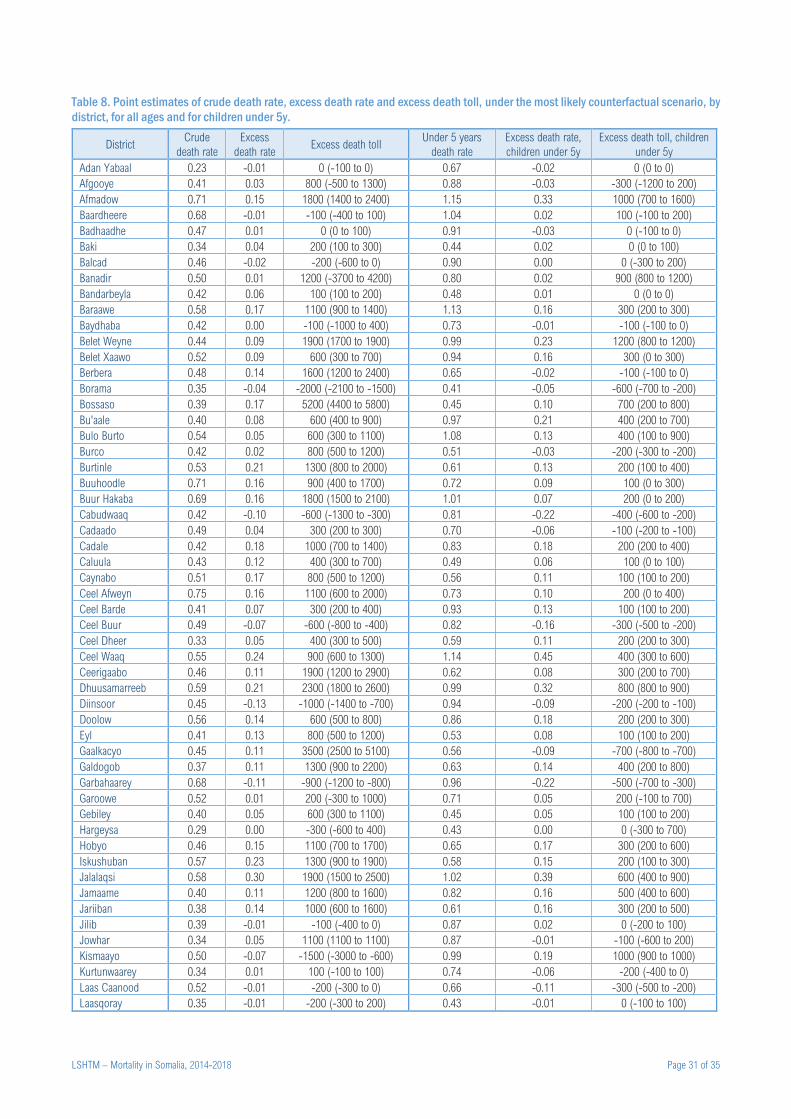
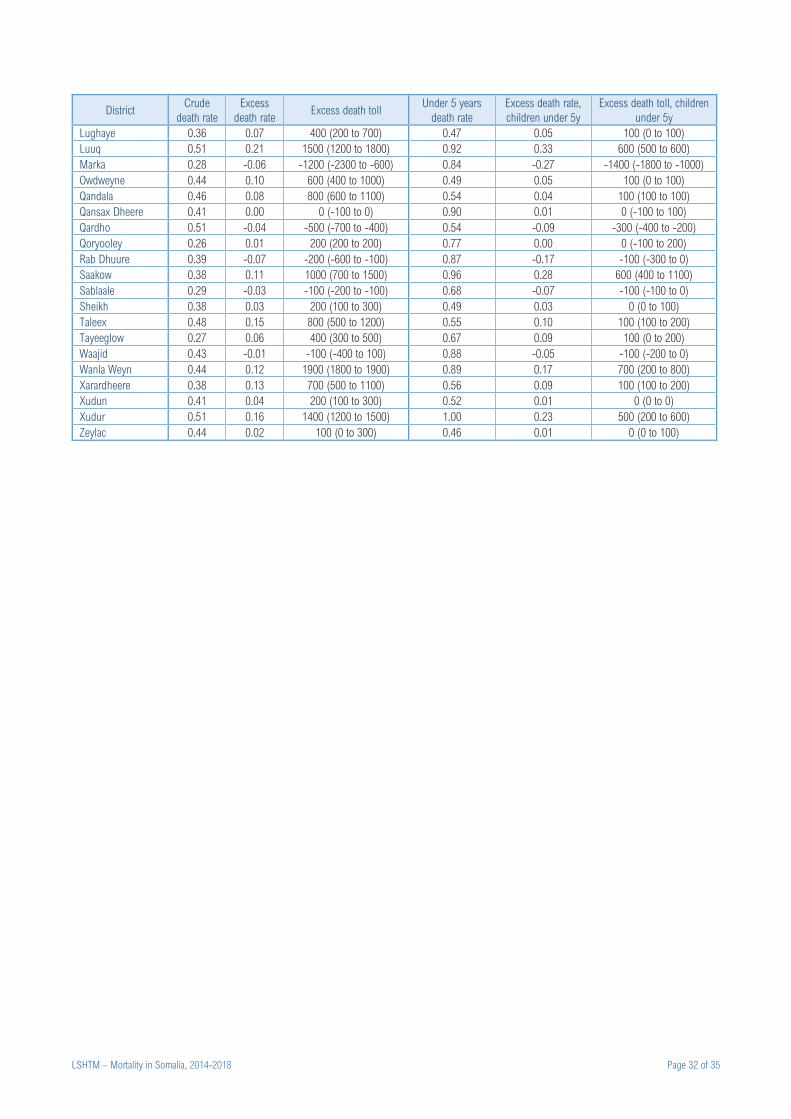
Table 8. Point estimates of crude death rate, excess death rate and excess death toll, under the most likely counterfactual scenario, by
district, for all ages and for children under 5y.
District Crude
death rate
Excess
death rate Excess death toll
Under 5 years
death rate
Excess death rate,
children under 5y
Excess death toll, children
under 5y
Adan Yabaal 0.23 -0.01 0 (-100 to 0) 0.67 -0.02 0 (0 to 0)
Afgooye 0.41 0.03 800 (-500 to 1300) 0.88 -0.03 -300 (-1200 to 200)
Afmadow 0.71 0.15 1800 (1400 to 2400) 1.15 0.33 1000 (700 to 1600)
Baardheere 0.68 -0.01 -100 (-400 to 100) 1.04 0.02 100 (-100 to 200)
Badhaadhe 0.47 0.01 0 (0 to 100) 0.91 -0.03 0 (-100 to 0)
Baki 0.34 0.04 200 (100 to 300) 0.44 0.02 0 (0 to 100)
Balcad 0.46 -0.02 -200 (-600 to 0) 0.90 0.00 0 (-300 to 200)
Banadir 0.50 0.01 1200 (-3700 to 4200) 0.80 0.02 900 (800 to 1200)
Bandarbeyla 0.42 0.06 100 (100 to 200) 0.48 0.01 0 (0 to 0)
Baraawe 0.58 0.17 1100 (900 to 1400) 1.13 0.16 300 (200 to 300)
Baydhaba 0.42 0.00 -100 (-1000 to 400) 0.73 -0.01 -100 (-100 to 0)
Belet Weyne 0.44 0.09 1900 (1700 to 1900) 0.99 0.23 1200 (800 to 1200)
Belet Xaawo 0.52 0.09 600 (300 to 700) 0.94 0.16 300 (0 to 300)
Berbera 0.48 0.14 1600 (1200 to 2400) 0.65 -0.02 -100 (-100 to 0)
Borama 0.35 -0.04 -2000 (-2100 to -1500) 0.41 -0.05 -600 (-700 to -200)
Bossaso 0.39 0.17 5200 (4400 to 5800) 0.45 0.10 700 (200 to 800)
Bu'aale 0.40 0.08 600 (400 to 900) 0.97 0.21 400 (200 to 700)
Bulo Burto 0.54 0.05 600 (300 to 1100) 1.08 0.13 400 (100 to 900)
Burco 0.42 0.02 800 (500 to 1200) 0.51 -0.03 -200 (-300 to -200)
Burtinle 0.53 0.21 1300 (800 to 2000) 0.61 0.13 200 (100 to 400)
Buuhoodle 0.71 0.16 900 (400 to 1700) 0.72 0.09 100 (0 to 300)
Buur Hakaba 0.69 0.16 1800 (1500 to 2100) 1.01 0.07 200 (0 to 200)
Cabudwaaq 0.42 -0.10 -600 (-1300 to -300) 0.81 -0.22 -400 (-600 to -200)
Cadaado 0.49 0.04 300 (200 to 300) 0.70 -0.06 -100 (-200 to -100)
Cadale 0.42 0.18 1000 (700 to 1400) 0.83 0.18 200 (200 to 400)
Caluula 0.43 0.12 400 (300 to 700) 0.49 0.06 100 (0 to 100)
Caynabo 0.51 0.17 800 (500 to 1200) 0.56 0.11 100 (100 to 200)
Ceel Afweyn 0.75 0.16 1100 (600 to 2000) 0.73 0.10 200 (0 to 400)
Ceel Barde 0.41 0.07 300 (200 to 400) 0.93 0.13 100 (100 to 200)
Ceel Buur 0.49 -0.07 -600 (-800 to -400) 0.82 -0.16 -300 (-500 to -200)
Ceel Dheer 0.33 0.05 400 (300 to 500) 0.59 0.11 200 (200 to 300)
Ceel Waaq 0.55 0.24 900 (600 to 1300) 1.14 0.45 400 (300 to 600)
Ceerigaabo 0.46 0.11 1900 (1200 to 2900) 0.62 0.08 300 (200 to 700)
Dhuusamarreeb 0.59 0.21 2300 (1800 to 2600) 0.99 0.32 800 (800 to 900)
Diinsoor 0.45 -0.13 -1000 (-1400 to -700) 0.94 -0.09 -200 (-200 to -100)
Doolow 0.56 0.14 600 (500 to 800) 0.86 0.18 200 (200 to 300)
Eyl 0.41 0.13 800 (500 to 1200) 0.53 0.08 100 (100 to 200)
Gaalkacyo 0.45 0.11 3500 (2500 to 5100) 0.56 -0.09 -700 (-800 to -700)
Galdogob 0.37 0.11 1300 (900 to 2200) 0.63 0.14 400 (200 to 800)
Garbahaarey 0.68 -0.11 -900 (-1200 to -800) 0.96 -0.22 -500 (-700 to -300)
Garoowe 0.52 0.01 200 (-300 to 1000) 0.71 0.05 200 (-100 to 700)
Gebiley 0.40 0.05 600 (300 to 1100) 0.45 0.05 100 (100 to 200)
Hargeysa 0.29 0.00 -300 (-600 to 400) 0.43 0.00 0 (-300 to 700)
Hobyo 0.46 0.15 1100 (700 to 1700) 0.65 0.17 300 (200 to 600)
Iskushuban 0.57 0.23 1300 (900 to 1900) 0.58 0.15 200 (100 to 300)
Jalalaqsi 0.58 0.30 1900 (1500 to 2500) 1.02 0.39 600 (400 to 900)
Jamaame 0.40 0.11 1200 (800 to 1600) 0.82 0.16 500 (400 to 600)
Jariiban 0.38 0.14 1000 (600 to 1600) 0.61 0.16 300 (200 to 500)
Jilib 0.39 -0.01 -100 (-400 to 0) 0.87 0.02 0 (-200 to 100)
Jowhar 0.34 0.05 1100 (1100 to 1100) 0.87 -0.01 -100 (-600 to 200)
Kismaayo 0.50 -0.07 -1500 (-3000 to -600) 0.99 0.19 1000 (900 to 1000)
Kurtunwaarey 0.34 0.01 100 (-100 to 100) 0.74 -0.06 -200 (-400 to 0)
Laas Caanood 0.52 -0.01 -200 (-300 to 0) 0.66 -0.11 -300 (-500 to -200)
Laasqoray 0.35 -0.01 -200 (-300 to 200) 0.43 -0.01 0 (-100 to 100)
LSHTM – Mortality in Somalia, 2014-2018 Page 32 of 35
District Crude
death rate
Excess
death rate Excess death toll
Under 5 years
death rate
Excess death rate,
children under 5y
Excess death toll, children
under 5y
Lughaye 0.36 0.07 400 (200 to 700) 0.47 0.05 100 (0 to 100)
Luuq 0.51 0.21 1500 (1200 to 1800) 0.92 0.33 600 (500 to 600)
Marka 0.28 -0.06 -1200 (-2300 to -600) 0.84 -0.27 -1400 (-1800 to -1000)
Owdweyne 0.44 0.10 600 (400 to 1000) 0.49 0.05 100 (0 to 100)
Qandala 0.46 0.08 800 (600 to 1100) 0.54 0.04 100 (100 to 100)
Qansax Dheere 0.41 0.00 0 (-100 to 0) 0.90 0.01 0 (-100 to 100)
Qardho 0.51 -0.04 -500 (-700 to -400) 0.54 -0.09 -300 (-400 to -200)
Qoryooley 0.26 0.01 200 (200 to 200) 0.77 0.00 0 (-100 to 200)
Rab Dhuure 0.39 -0.07 -200 (-600 to -100) 0.87 -0.17 -100 (-300 to 0)
Saakow 0.38 0.11 1000 (700 to 1500) 0.96 0.28 600 (400 to 1100)
Sablaale 0.29 -0.03 -100 (-200 to -100) 0.68 -0.07 -100 (-100 to 0)
Sheikh 0.38 0.03 200 (100 to 300) 0.49 0.03 0 (0 to 100)
Taleex 0.48 0.15 800 (500 to 1200) 0.55 0.10 100 (100 to 200)
Tayeeglow 0.27 0.06 400 (300 to 500) 0.67 0.09 100 (0 to 200)
Waajid 0.43 -0.01 -100 (-400 to 100) 0.88 -0.05 -100 (-200 to 0)
Wanla Weyn 0.44 0.12 1900 (1800 to 1900) 0.89 0.17 700 (200 to 800)
Xarardheere 0.38 0.13 700 (500 to 1100) 0.56 0.09 100 (100 to 200)
Xudun 0.41 0.04 200 (100 to 300) 0.52 0.01 0 (0 to 0)
Xudur 0.51 0.16 1400 (1200 to 1500) 1.00 0.23 500 (200 to 600)
Zeylac 0.44 0.02 100 (0 to 300) 0.46 0.01 0 (0 to 100)
LSHTM – Mortality in Somalia, 2014-2018 Page 33 of 35
Figure 22. Trends in terms of trade (daily wage vs. cereal, medium-quality goat vs. cereal), by region.
LSHTM – Mortality in Somalia, 2014-2018 Page 34 of 35
Figure 23. Estimated actual, counterfactual and excess death toll for all age groups, by sensitivity value of the ratio of true to reported
population estimates. Each panel presents results for different sensitivity values of the true number of internal displacements (as a ratio
to the observed/reported value). Only the most likely counterfactual scenario is presented.
LSHTM – Mortality in Somalia, 2014-2018 Page 35 of 35
Figure 24. Estimated actual, counterfactual and excess death toll for all age groups and children under 5y, by sensitivity value of the
ratio of true to reported U5DR. Only the most likely counterfactual scenario is presented.