Embed Size (px)
Citation preview
NBER WORKING PAPER SERIES
RETROSPECTIVE AND PROSPECTIVE BENEFIT-COST ANALYSIS OF US ANTI-SMOKINGPOLICIES
Lawrence JinDonald S. Kenkel
Feng LiuHua Wang
Working Paper 20998http://www.nber.org/papers/w20998
NATIONAL BUREAU OF ECONOMIC RESEARCH1050 Massachusetts Avenue
Cambridge, MA 02138March 2015
We thank Glenn Blomquist and an anonymous referee for very useful comments. We also thank thefollowing people for their insights and stimulating discussions of issues in this analysis: Frank Chaloupka,James Choi, David Cutler, Sherry Glied, James K. Hammitt, Amber Jessup, Joseph Newhouse, LisaA. Robinson, Martha Starr, and Kenneth Warner. The findings and conclusions of this paper are solelythose of the authors. The views expressed herein are those of the authors and do not necessarily reflectthe views of the National Bureau of Economic Research.
NBER working papers are circulated for discussion and comment purposes. They have not been peer-reviewed or been subject to the review by the NBER Board of Directors that accompanies officialNBER publications.
© 2015 by Lawrence Jin, Donald S. Kenkel, Feng Liu, and Hua Wang. All rights reserved. Short sectionsof text, not to exceed two paragraphs, may be quoted without explicit permission provided that fullcredit, including © notice, is given to the source.

Retrospective and Prospective Benefit-Cost Analysis of US Anti-Smoking PoliciesLawrence Jin, Donald S. Kenkel, Feng Liu, and Hua WangNBER Working Paper No. 20998March 2015JEL No. I12,I18
ABSTRACT
Regulatory policies designed to improve societal welfare by “nudging” consumers to make better choicesare increasingly popular. The application of benefit-cost analysis (BCA) to this sort of regulation confrontsdifficult theoretical and applied issues. In this analysis we contribute a worked example of behavioralBCA of US anti-smoking policies. Our conceptual framework extends the standard market-based approachto BCA to allow for individual failures to make lifetime utility-maximizing choices of cigarette consumption.We discuss how our market-based approach compares to the health benefits approach and the “consumersurplus offset” controversy in recent BCAs of several health-related regulations. We use a dynamicpopulation model to make counterfactual simulations of smoking prevalence rates and cigarette demandover time. In our retrospective BCA the simulation results imply that the overall impact of antismokingpolicies from 1964 – 2010 is to reduce total cigarette consumption by 28 percent. At a discount rateof 3 percent the 1964-present value of the consumer benefits from anti-smoking policies through 2010is estimated to be $573 billion ($2010). Although we are unable to develop a hard estimate of the policies’costs, we discuss evidence that suggests the consumer benefits substantially outweigh the costs. Wethen turn to a prospective BCA of future anti-smoking FDA regulations. At a discount rate of 3 percentthe 2010-present value of the consumer benefits 30 years into the future from a simulated FDA tobaccoregulation is estimated to be $100 billion. However, the nature of potential FDA tobacco regulationssuggests that they might impose additional costs on consumers that make it less clear that the net benefitsof the regulations will be positive.
Lawrence JinDepartment of Economics, Uris HallCornell UniversityIthaca NY 14853 [email protected]
Donald S. KenkelDepartment of Policy Analysis and ManagementCollege of Human EcologyCornell UniversityMartha Van Rensselaer HallIthaca, NY 14853-4401and [email protected]
Feng LiuSchool of EconomicsShanghai University of Finance and EconomicsShanghai 200433, [email protected]
Hua WangDepartment of Policy Analysis & ManagementMVR HallCornell UniversityIthaca NY [email protected]

1
1. Introduction
Regulatory policies designed to improve societal welfare by “nudging” consumers to make
better choices are increasingly popular. Energy-efficiency labels or standards for light bulbs,
appliances and motor vehicles encourage or require consumers to choose more energy-efficient
products to lower their energy costs. The 2010 Patient Protection and Affordable Care Act
requires restaurants to post calorie information to encourage healthier food choices. The 2009
Family Smoking Prevention and Tobacco Control Act requires graphic warning labels on
cigarette packages to discourage youth from starting to smoke and to encourage current smokers
to cut down or quit. As part of the Regulatory Impact Analysis (RIA) process required by
Executive Orders 12866 and 13563, federal agencies have completed benefit-cost analyses
(BCAs) of each of these regulations.1 The BCAs estimate that these regulations create
substantial benefits for consumers by helping them make better choices.
The idea that consumers can be nudged into choices that make them better off is an important
insight from behavioral economics (Thaler and Sunstein 2009). However, the application of
BCA to this sort of regulation confronts difficult theoretical and applied issues. The doctrine of
revealed preference is fundamental to BCA, yet the case for nudge regulations rests on evidence
that in some situations people’s observed consumption choices are not reliable indicators of their
underlying preferences. Bernheim and Rangel (2007, 2009) extend the standard choice-theoretic
approach to provide a theoretical foundation for behavioral welfare economics. Robinson and
Hammitt (2011) discuss principles and standards for incorporating behavioral economics insights
into applied BCA. Behavioral BCA promises to be controversial: for example Gayer and Viscusi
1 See Gayer and Viscusi (2013) for discussion and references to a set of RIAs of energy-efficiency standards, the FDA (2014a) for the RIA of menu calorie labeling, and the FDA (2010, 2011) for RIAs of cigarette graphic warning labels.

2
(2013) criticize recent BCAs of energy-efficient standards; and as will be discussed in more
detail below a number of comments criticize recent BCAs of FDA tobacco regulations. Although
the controversies will probably not be easily resolved, we believe that worked examples for
important policies will help further develop the methods of behavioral BCA.
In this analysis we contribute to the behavioral BCA of US anti-smoking policies. Warner
(2007, p. S314) calls the drop in smoking since the 1950s “the developed world’s greatest public
health achievement in the past half-century.” Our retrospective BCA of anti-smoking policies
estimates the dollar value of the benefits to consumers that flow from this achievement. Yet
Warner (2007, p. S314) is also quick to point out that the “the glass remains half empty.” Almost
20 percent of United States adults are current smokers (King et al. 2012). Smoking is estimated
to cause more than 400,000 deaths each year and remains the leading preventable cause of death
(Mokdad et al. 2004). The 2009 Family Smoking Prevention and Tobacco Control Act gives the
FDA broad authority to regulate the tobacco industry to promote public health. Our prospective
BCA estimates potential benefits from future FDA tobacco regulations.
As described in more detail in Section 2, our conceptual framework extends the standard
market-based approach to BCA to allow for individual failures to make lifetime utility-
maximizing choices of cigarette consumption. The conceptual framework uses Ashley et al.’s
(2014) extension of the approach developed in the Australian Productivity Commission (2010)
BCA of legalized gambling and the smoking study by Weimer et al. (2009). In contrast to Ashley
et al. and other previous studies, our empirical work takes a reduced-form approach that relies on
high-level parameters: the price-elasticity of cigarette demand; and estimates of the impact of

3
individual failures on the market demand for cigarettes.2 In section 2 we also discuss how our
market-based approach compares to the health benefits approach and the “consumer surplus
offset” controversy in several recent BCAs of health-related regulations.
In the remaining sections of the paper we conduct a retrospective BCA of US anti-smoking
policies from 1964 – 2010 and a prospective BCA of future anti-smoking FDA regulations.
Section 3 describes the dynamic population model and data sources we use to make
counterfactual simulations of smoking prevalence rates and cigarette demand over time. Section
3 also reports our estimates of the impact of anti-smoking policies. Based on the simulation
results we estimate that the overall impact of anti-smoking policies from 1964 – 2010 is to
reduce total cigarette consumption by 28 percent.
Section 4 reports our retrospective BCA of past anti-smoking policies. To preview a key
result: at a discount rate of 3 percent the 1964-present value of the consumer benefits from US
anti-smoking policies through 2010 is estimated to be $573 billion (all reported benefits and
costs are adjusted for inflation and expressed in real $2010). To provide some context: the 1964-
present value of the benefits from anti-smoking policies of $573 billion is about 12 percent of the
1964 gross domestic product, and is somewhat larger than federal defense spending in 1964
($460 billion) and much larger than federal spending on health care in 1964 ($12 billion).3 We
are unable to develop a hard estimate of the costs of anti-smoking policies from 1964 – 2010.
However, we discuss evidence that suggests the consumer benefits substantially outweigh the
costs.
2 Chetty (2009) and Mullainathan, et al. (2012) review the theory and practice of reduced-form versus structural approaches to standard and behavioral welfare economics. 3 Authors’ calculations from Bureau of Economic Analysis (2015, Table of “Current-dollar and "real" GDP”) and U.S. Government Publishing Office (2015, Table 3.2).
4
Section 5 reports our prospective BCA of future anti-smoking FDA regulations. To preview
another key result: at a discount rate of 3 percent the 2010-present value of the consumer benefits
30 years into the future from a simulated FDA tobacco regulation is estimated to be $100 billion.
However, the nature of potential FDA tobacco regulations suggests that they might impose
additional costs on consumers that make it less clear that the net benefits of the regulations will
be positive. Section 6 is a concluding discussion.
2. Conceptual Approach to BCA of Anti-Smoking Policies
Market-Based Approach to BCA
Our BCA focuses on anti-smoking policies that help correct individual failures in making
utility-maximizing choices about cigarette consumption. The benefits to the consumer are
measured by the compensating variation (CV) in income for the anti-smoking policy under
consideration. Assume the consumer’s lifetime utility is given by U = U (A, G, H, Y), where A
is the quantity of cigarettes consumed, G is the quality of cigarettes consumed, H is health, and Y
is a composite commodity with its price normalized to one. Letting the subscript 0 indicate
consumption choices made in the absence of the policy and ∆ indicate the policy-induced
changes, the CV for the policy is defined to satisfy the equation:
(1) U (A0, G0, H0, Y0) = U (A0 + ∆A, G0 + ∆G, H0 + ∆H, Y0 + ∆Y + CV)
In equation (1) the utility function that defines the CV is in terms of experienced utility,
which may differ from decision utility (Kahneman et al. 1997). In particular, the consumer’s
experienced lifetime utility depends on the true health consequences of smoking even if these
consequences are not fully incorporated into her decisions. The typical anti-smoking policy
reduces the quantity (∆A < 0) or quality (∆G < 0) of cigarettes consumed over the lifetime. As a
5
result, the consumer’s lifetime health improves (∆H > 0). Because she spends less money on
cigarettes her consumption of the composite commodity increases (∆Y >0).4 If experienced and
decision utility are the same so the consumer’s choices A0 and G0 maximize her experienced
lifetime utility, the changes induced by the policy make her worse off. The utility losses from ∆A
and ∆G outweigh the utility gains from ∆H and ∆Y. The policy can make the consumer better off
when experienced utility and decision utility are different so the consumer’s original choices fail
to maximize lifetime utility. In this case the utility gains from ∆H and ∆Y outweigh the utility
losses from ∆A and ∆G. Lifetime cigarette consumption might fail to maximize lifetime utility
due to the consumer’s poor information about the health consequences of smoking, other
decision-making errors that lead to imperfect optimization, or bounded self-control.
The CV places a dollar value on the net utility gain (or loss) from the anti-smoking policy.
The definition of the CV in equation (1) does not require any assumptions about the consumer’s
ability to make lifetime utility-maximizing choices of A, G, H and Y. Adding the standard
assumptions about rationality implies that the CV can be measured as an area of consumer
surplus under the consumer demand curve (Deaton and Muellbauer 1980, pp. 184-189).
Following the Australian Productivity Commission (2010), Weimer et al. (2009), and Ashley et
al. (2014) we assume that the observed market demand curve for cigarettes might not reflect
fully optimizing decisions. Instead, we measure the area of consumer surplus that corresponds to
the CV with respect to a hypothetical demand curve “which summarizes utility-maximizing
decisions by consumers who are aware of all health costs and have fully incorporated them into
4 The policy could also affect income available to spend on the composite commodity by changing the consumer’s lifetime spending on health care. A health-improving policy can either decrease or increase lifetime health care spending depending on its impact on per-period spending relative to its impact to lengthen the lifetime. The empirical evidence on the impact of cigarette smoking on lifetime health care spending is mixed.

6
consumption decisions” (Ashley et al. 2014 p. 2). We tailor the Ashley et al. conceptual
framework to our retrospective and prospective BCA as follows.
For the retrospective BCA our framework needs to allow for a situation where initially
poorly informed consumers become much better informed over time. Our retrospective study
period starts in 1964. This is only about a decade after the scientific research establishing the link
between smoking and lung cancer began to receive major media attention and the new
information was still diffusing to the public (Viscusi 1992). In a Gallup Poll conducted in 1960
only about half of the respondents agreed that smoking was one of the causes of lung cancer
(Gallup 1960). As will be discussed in more detail below in section 3, the 1964 Surgeon
General’s Report is widely seen as a landmark publication that directly provided information and
indirectly helped launch other initiatives to provide information about the health consequences of
smoking. By the late 1990s general population surveys find that virtually all United States
consumers were aware of the links between cigarette smoking and the risks of lung cancer, heart
disease and emphysema (Kenkel and Chen 2000). A series of studies in the 1990s and 2000s
provide evidence that most people in the US, including most smokers, overestimate the health
risks of cigarette smoking.5 While this evidence has attracted some controversy, it is not
controversial to conclude that by the end of our study period in 2010 consumer information
about the major health risks of smoking is very widespread.6
For both our retrospective and our prospective analysis it is also important that our
framework allows for the possibility that consumers might make other decision-making errors
5 See for example Viscusi (1990, 1991, 1992), Khwaja et al (2009) and Sloan and Platt (2012). 6 In a recent survey Sloan and Yang (2008) conclude that: “The economic literature lends no empirical support to the view that mature adults smoke because they underestimate the probability of harm to health from smoking.”
7
that lead to imperfect optimization, or have bounded self-control. Psychological and behavioral
economics research document decision-making errors across a range of domains (DellaVigna
2009). However, Robinson and Hammitt (2011, p. 2) point out that: “Much of the research
involves small-scale laboratory experiments and needs to be supplemented by additional
fieldwork to explore the real-world importance of the findings.” The real-world importance for
the cigarette market is controversial. Survey evidence shows that many more smokers state that
they intend to quit in the future than actually do so. This has been interpreted as evidence of the
time-inconsistency predicted by behavioral economic models with hyperbolic discounting.
However, statements about quit intentions can also be viewed with the same general skepticism
economists view simple statements about preferences.7 Econometric research into the market for
cigarettes has not been able to distinguish rational addiction from a forward-looking model with
quasi-hyperbolic discounting and time-inconsistency.8 Studies of self-commitment devices
provide another source of evidence that some smokers recognize that they face time-
inconsistency problems (Khwaja, et al. 2007, Gine, et al. 2010). The available research provides
evidence that the observed demand for cigarettes reflects individual failures to make lifetime-
7 Viscusi (1992, p. 120) provides other examples of inconsistencies between simple statements about preferences and actual behavior: “Almost half of the residents of Los Angeles indicate a desire to move out of the city, but do not do so. Almost one-third of all blue-collar workers would like to leave their jobs but do not.” He suggests that this type of survey evidence should be interpreted as showing some dissatisfaction with the situation in question. But it does not necessarily follow from the survey evidence that choices to smoke, live in Los Angeles or work in a blue-collar job fail to maximize lifetime utility. The simple statements in these surveys are different than the modern methods of preference elicitation used in contingent valuation surveys. Contingent valuation surveys are carefully designed to yield responses that will match real-world behavior, but even so the method remains controversial (Kling et al. 2012, Carson 2012, Hausman 2012). There are a few contingent valuation surveys about smoking including: Busch et al. (2004), Hammar and Johansson-Stenman (2004), and Weimer et al. (2009). 8Gruber and Koszegi (2001) compare an empirical rational addiction model to an alternative model with time-inconsistent addiction and conclude that “we are unable to empirically distinguish the two with our data.” (p. 1263).

8
utility maximizing decisions, but there is less evidence on the extent and precise nature of the
individual failures.
To capture the issues discussed above, our conceptual framework assumes that initially
consumers fail to make lifetime utility-maximizing choices about cigarette consumption, but
these failures are corrected over time with the help of anti-smoking policies. We take a reduced-
form approach and do not specify the precise nature of the individual failures. Instead we assume
the individual failures stem from some combination of poor information about the health
consequences of smoking, other decision-making errors that lead to imperfect optimization, and
bounded self-control.
Figure 1 is a graphical illustration of the framework. The cigarette consumption observed in
year t is AOt at the intersection of the market price Pt and the observed demand curve DOt. The
counterfactual cigarette consumption that would have been observed in year t in the absence of
any anti-smoking policies is ACFt at the intersection of Pt and the counterfactual demand curve
DCFt. ACFt is also the starting point of the retrospective BCA, so the horizontal distance ACFt - AOt
shows the impact of anti-smoking policies as of year t. The rational utility-maximizing
consumption is ARt at the intersection of Pt and the rational demand curve DRt|At-1. The notation
DRt |At-1 reflects that because cigarettes are addictive the rational level of demand at time t
depends on the addictive stock determined by past consumption at time t-1.9
The vertical distances between DCFt and DOt or DRt |At-1 show the dollar values of the
individual failures to maximize utility. Individuals make errors and only internalize a fraction of
9This assumes the addictive stock completely depreciates in one period. More generally the addictive stock is a weighted average of consumption in all past periods.
9
the value of the health consequences of their cigarette consumption. 10 Following what is
becoming conventional usage we will call the un-internalized portion of the health consequences
the “marginal internality” (Mullainathan, et al. 2012).
Because Figure 1 can be used to show the welfare consequences of anti-smoking policies that
partly or completely correct individual failures it provides the framework for our retrospective
and prospective BCAs. The framework can be viewed as a modification of Harberger’s (1971)
first basic postulate for BCA, where the value of the marginal unit to demanders is given by the
height of the rational demand curve DRt|At. In our retrospective BCA, anti-smoking policies as of
year t reduce cigarette consumption from ACFt to AOt. Consumer spending on cigarettes falls by
an amount given by the area J + K + L. The rational valuation of the foregone consumption is
given by area L under DRt|At, yielding net consumer benefits given by area J + K. In our
prospective BCA we consider a hypothetical FDA regulation that further reduces cigarette
consumption from AOt to ARt. By the same reasoning this reduction in consumption yields
benefits given by the triangular area G.
Another way to view the framework is in terms of the rule: the CV for a policy that changes
cigarette consumption by ∆A is given by ∆A multiplied by the average value of the marginal
internality. This rule is consistent with the general expression for the marginal welfare gain with
behavioral agents in Mullainathan et al. (2012, equation 6, p. 521). In our retrospective BCA,
because ACFt - AOt shows the impact of anti-smoking policies as of year t, the year t value of
those policies is ACFt - AOt times the average of the vertical distance between DCFt and DRt|At (the
10 The fraction could be greater than 1 if consumers think an unhealthy good is even riskier than it actually is. The studies cited above in footnote 5 suggest some consumers make this type of mistake about cigarettes. The fraction could be less than zero if consumers think an unhealthy good is actually healthy, but this seems very unlikely for cigarettes.

10
marginal internality at ACFt ) and the vertical distance between DOt and DRt|At (the marginal
internality at AOt ). This again corresponds to the sum of the area J + K. In the case drawn in
Figure 1 the policy benefits (area J + K) are necessarily smaller than the reduction in consumer
spending on cigarettes (area J + K + L). However, this need not hold because depending on the
size of the marginal internality the rational demand curve DRt|At can be below the horizontal
axis. This occurs if at AOt given rational demand the value of the marginal cigarette is negative
because of the health consequences.
A policy that completely corrects the individual failures would change cigarette consumption
by ACFt - ARt. The value of such a policy is ACFt - ARt times the average of the vertical distance
between DCFt and DRt|At MI (the marginal internality at ACFt) and 0 (the marginal internality at
ARt ), corresponding to the familiar triangular area G + J + K.
Viewed from a static perspective, Figure 1 shows that the welfare gains from future anti-
smoking policies diminish when past policies have already partly corrected the individual
failures to maximize. For example, the area J + K of consumer benefits from reducing ACFt to
AOt is much larger than the area G of consumer benefits from reducing AOt to ARt. This pattern is
because the size of the welfare gain depends on the size of the marginal internality, which is
much larger at ACFt than at AOt.
However, BCA of anti-smoking policies involves important dynamics because addiction
creates linkages between the demand curves across time. Consider a policy at time t that helps
consumers internalize more of the health consequences of smoking and thus causes the demand
curve to shift from DCFt to DOt. While the area J + K measures the policy benefits at time t, the
reduced consumption level AOt means that consumers at time t+1 have a lower addictive stock.

11
In the time t+1 version of Figure 1 both the observed demand curve DOt+1 and the rational
demand curve DRt+1|At shift inwards towards the origin reflecting the lower addictive stock. In a
way, the rational utility-maximizing level of consumption ARt+1 is a moving target: the reduced
consumption at time t reduces how much rational consumers would choose to smoke at time t+1.
Importantly, the dynamics of cigarette demand reflect the utility costs of withdrawing from
cigarette addiction. For a given addictive stock, much of the rational demand for cigarettes might
simply be to avoid withdrawal costs. Hughes (2007) reviews research on the effects of
abstinence from tobacco and concludes (page 315) that: “Anger, anxiety, depression, difficulty
concentrating, impatience, insomnia, and restlessness are valid withdrawal symptoms that peak
within the first week and last 2–4 weeks.” Hughes also mentions that other research reviews
provide evidence for additional withdrawal symptoms that include craving, decreased heart rate,
electroencephalographic changes, hunger and weight gain, impaired cognitive performance,
increased monoamine oxidase levels, and changes in medication levels. Even with the aid of
pharmaceutical smoking cessation products most quit attempts are unsuccessful, which provides
more evidence that the withdrawal costs from cigarette addiction are high and also suggests that
withdrawal is difficult to treat. Most smokers require multiple quit attempts before they succeed:
in a typical example it might take a smoker roughly three years to quit, during which time they
attempt to quit 6 to 11 times with the average episode lasting 1.5 weeks (Hughes et al. 2004).
This implies that successful quitters spend on average 12 weeks of withdrawal symptoms during
their serious attempts to quit. Rational cigarette demand might be mainly driven by the value of
cigarettes as a means to reduce the utility losses from withdrawal.
When considering the rational demand for cigarettes at time t, the rationality of smokers’ past
decisions is irrelevant. Many smokers’ past decisions might have been irrational. Nevertheless,

12
even these smokers’ current and forward-looking decisions about how much to smoke and
whether to quit can be rational. A typical example might be someone who made a time-
inconsistent decision to initiate smoking as an adolescent and became addicted. The past mistake
to become addicted is a sunk cost. Given their current addictive stock, the question of rationality
depends on whether they are making fully informed time-consistent decisions about continuing
to smoke. Put differently, currently rational smokers are not necessarily “happy addicts” – they
may very much regret their earlier time-inconsistent decision to start smoking. They can be
currently rational in the sense that their current decisions to continue smoking are time consistent
and do not impose internalities on their future selves.
Our retrospective and prospective BCAs of anti-smoking policies implement the framework
summarized in Figure 1. We use a dynamic population model to compare observed cigarette
consumption over time to consumption under simulated counterfactuals. To simulate rational
consumption over time, we use the smoking rates of a group of consumers whose behavior tends
to approximate fully informed rational decision-making. The dynamic population model
simulations build in the linkages between the demand curves across time. By combining the
simulation results with a consensus price-elasticity estimate we construct a series of demand
curves DCF, DO and DR|At-1 over time and use them to calculate the areas J + K and G.
The Health Benefits Approach and Consumer Surplus Offset
In contrast to the market-based approach summarized in Figure 1, several recent BCAs of
health-related regulations use what we term the health benefits approach. Although the
approaches are not necessarily inconsistent and indeed Figure 1 can illustrate both, the
approaches implicitly frame the policy problem quite differently. The market-based approach

13
frames the problem as: We use BCA to determine if the policy leads to a market outcome that is
closer to the socially optimal quantity. In a general version of Figure 1 the socially optimal
quantity maximizes the sum of consumer and producer surplus, after taking into account market
failures like externalities and, in a behavioral BCA, individual failures like internalities.11 The
public health missions of federal agencies like the FDA make this framing of the problem seem
foreign. From a public health perspective, the optimal level of cigarette consumption is
obviously zero. Consistent with the agencies’ public health missions, the health benefits
approach frames the problem as: We use BCA to measure the value of the policy-induced health
gains and to see if the health benefits justify the costs. As reflected in Harberger’s (1971) first
basic postulate, consumer surplus is at the heart of the market-based approach to BCA. In
contrast, in the health benefits approach consumer surplus is framed as a possible cost that
offsets some of the health benefits. This frame is not necessarily inconsistent with OMB’s
guidance for RIAs. After discussing approaches for valuing policy benefits, OMB (2011, p. 10)
advises but does not require that agencies should include gains or losses in consumer or producer
surplus “where relevant.”12
As we just mentioned, Figure 1 can be used to illustrate the health benefits approach to
BCA. Consider an anti-smoking policy that corrects all individual failures and reduces cigarette
consumption by ACFt - ARt. The health benefits approach focuses on the health gains, as
measured for example by quality-adjusted life years (QALYs), predicted to flow from the
reduction in smoking. Using standard estimates of the dollar value of a QALY yields an estimate
11 Figure 1 assumes a perfectly elastic supply curve so there is no producer surplus. 12 We would like to thank, without implicating, Amber Jessup and Martha Starr for their valuable insights about the relationship between agencies’ public health missions and what we are terming the health benefits approach to BCA.

14
of the dollar value of the policy-induced health gains. Ashley et al. (2014) refer to this as the
gross health benefits of the anti-smoking policy. Because the vertical distance between DCFt and
DR|At-1 is by definition the dollar value of the health consequences of smoking, the gross health
benefits of a policy that decreases cigarette consumption by ACFt - ARt is given by the area E + F
+ I + G + J + K.
The health benefits approach to BCA calculates the anti-smoking policy’s gross health
benefits and then calculates how much of the benefits are offset by lost consumer surplus from
the reduction in cigarette consumption. Recall that the CV for the change in cigarette
consumption ACFt - ARt is given by the area G + J + K. Ashley et al. (2014) refer to this as the net
health benefits. As Cutler (2008) points out, with linear demand curves like in Figure 1, the area
of the triangle G + J + K of net health benefits from this policy-induced change is exactly one-
half the area of the parallelogram E + F + I + G + J + K of gross health benefits. In other words,
half of the gross health benefits are offset by lost consumer surplus. Ashley et al. (2014)
emphasize that for other policy-induced changes and other assumptions the net-to-gross benefits
or offset ratio can range from zero to 100 percent. Several recent RIAs of health-related
regulations use offset ratios ranging from 10 to 99 percent.13 The use of anything but a very
13 The offset ratio equals 1 minus the ratio of net-to-gross benefits discussed by Ashley et al (2014). The evidence base of offset-ratio estimates is thin. Based on evidence from a contingent valuation study Weimer et al. (2009, p. 182) conclude that “between about 60 and 70% of the consumer surplus in the cigarette market should be counted as actual value for consumers.” This implies a non-zero offset ratio, but they cannot calculate an offset ratio because they do not compare consumer surplus to the gross health benefits. Ashley et al (2014) use parameters from Gruber and Koszegi (2001) to develop estimates of the offset ratio ranging from about 67 to 99 percent. The RIA of cigarette graphic warning labels suggests an even wider range from 10 to 99 percent (FDA 2011). For its primary calculations the FDA uses the midpoint of that range. The RIA of the tobacco product deeming regulation discusses offset ratios ranging from 67 to 84 percent (FDA 2014). The RIA of menu calorie labels uses the midpoint of 50 percent uniformly distributed between 10 and 90 percent (FDA 2014a, p. 92).

15
small offset ratio near zero has been criticized in public comments on the RIAs, commentaries in
public health journals and even in the popular press.14
Our market-based approach to the BCA of anti-smoking policies complements recent
RIAs that use the health benefits approach. Our approach does not use estimates of the gross
health benefits of anti-smoking policies, so it does not require an assumption about the
appropriate offset ratio. Instead, as in the standard revealed preference approach to applied
welfare economics, our approach analyzes market behavior to infer the value of the policy-
induced changes in cigarette consumption. Although it is not the main focus of our study, in
section 6 we return to a discussion of what our results imply for the health benefits approach to
BCA and the consumer surplus offset controversy.
3. Retrospective Analysis of the Impact of US Anti-Smoking Policies 1964 - 2010
Background
The first step of our retrospective BCA is to define the set of anti-smoking policies and
their impact on cigarette consumption. We consider the broad set of US policies implemented
over the period 1964 – 2010 that were designed to improve consumer information about the
health consequences of cigarette smoking. As we mentioned above, the 1964 Surgeon General’s
Report (SGR) is widely viewed as a landmark publication that launched modern anti-smoking
policies in the US. In its wake followed: additional SGRs further documenting the health
consequences (almost annually); mandatory warning labels on cigarette packages and 14 FDA (2011) summarizes the public comments received about the consumer surplus offset. Commentaries in public health journals criticizing the use offset include Song, et al. (2014), Chaloupka, et al. (2014) and Chaloupka et al. (2015). Popular press discussions include Tavernise (2014), New York Times Editorial Board (2014) and a Sunday Doonesbury comic strip by Garry Trudeau (September 14, 2014).

16
advertisements (enacted in 1965, strengthened in 1969, 1984, and pending); a ban on television
and radio cigarette advertisements (1971); school-based health education about smoking
(continuing); and mass media anti-smoking campaigns (continuing). School health education and
mass media anti-smoking campaigns include new campaigns launched by state tobacco control
programs in the 1990s and 2000s and the American Legacy Foundation’s ‘truth’ campaign
funded by the 1998 Master Settlement Agreement between the tobacco industry and state
attorneys general.
We do not attempt to isolate the impact of specific anti-smoking policies but instead
consider their combined impact. Our approach is to attribute shifts in the observed cigarette
demand curve DOt over time to the combined impact of anti-smoking information policies.
Because we focus on shifts in demand that reflect improved consumer information, as explained
below we control for movements along the demand curve caused by tax-induced changes in
cigarette prices over time.
Conceptually, we view cigarette excise taxes as a policy tool to correct for negative
externalities. Externalities in the cigarette market include the health and utility costs of non-
smokers’ exposure to second hand smoke and the financial costs smoking-related illnesses
impose on non-smokers in collectively financed health insurance and retirement plans.
Empirically, Sloan et al. (2004, Table 11.3 p. 255) estimate that circa 2000 cigarette taxes were
not high enough to fully correct for externalities: the estimated externality per pack of cigarettes
is $2.20 while the combined federal and average state cigarette tax per pack is $0.76.15 However,
by the end of our study period in 2010 subsequent federal and state tax hikes raise the combined
15 This updates the seminal study of the external costs of smoking by Manning et al. (1989) and the later study by Viscusi (1995).

17
tax to $2.18 per pack (Orzechowski and Walker 2010). The externalities from second hand
smoke are further corrected by the expansion of state and local bans on smoking in public places.
From 2000 – 2009 the fraction of the US population covered by smoke free worksite laws
increased from 3 percent to 54 percent and the fraction covered by smoke free restaurant laws
increased from 13 percent to 63 percent (Gonzalez et al. 2013). Some of the financial
externalities of smoking are further addressed by the 50 percent health insurance premium
surcharges for smokers allowed under the 2010 Patient Protection and Affordable Care Act. The
policy trends suggest that over the period we study: one set of anti-smoking policies helped
correct individual failures; while another set of policies helped correct externalities. To focus on
the benefits of correcting individual failures, our approach abstracts from the net benefits of tax
and other policies that correct externalities.16
Dynamic Population Simulation Model and Data Sources
We use a dynamic population model to compare observed cigarette consumption over
time to cigarette consumption under a simulated “no-policy” counterfactual. Our simulation
model is based on the model developed by Mendez, et al. (1998), which they use to accurately
predict smoking prevalence through 2010 (Warner and Mendez 2012). Our model begins with
estimates of the adult population by smoking status in 1960. The model uses estimates of birth
rates, smoking status-specific mortality rates, and age-specific smoking initiation and cessation
rates to simulate the number of adults smoking over time. The smoking population evolves as
new cohorts initiate smoking while current smokers either continue to smoke, quit smoking and
16 This would be an interesting and worthwhile extension. Because the policies interact, the total of consumer benefits from the combination of informational and externality-correcting policies is not the simple sum of the benefits of the informational policies we consider and the externality-correcting policies we do not consider.

18
become former smokers, or die. Aggregate cigarette consumption in year t is given by the size of
the smoking population in year t multiplied by an estimate of the average number of cigarettes
consumed per smoker in year t.
We use standard data on birth rates and estimates of mortality rates by smoking status
from Jha et al. (2013). We follow Mendez et al. (1998) and assume that everyone aged 0 to 17 is
a never-smoker, and some initiate smoking at age 18. We estimate sex-specific birth cohort
smoking initiation rates from the Tobacco Use Supplements to the Current Population Survey
(TUS-CPS). We also use these data to estimate sex- and age-specific smoking cessation rates.
We use data on observed cigarette consumption from the Tax Burden on Tobacco (Orzechowski
and Walker 2010). An online Appendix provides more details about our simulation model and
data sources.
It is useful to provide a brief overview of the trends in the input variables used in our
dynamic population model. From 1964 to 2010 the adult population age 18 and older grew from
120 million to 205 million. The observed rate at which new cohorts initiate smoking falls fairly
steadily from 52 percent in 1964 to 17 percent in 2010. The observed average cessation rate
increases from about 1.5 percent per year in 1964 to 3 percent in 1990 to almost 6 percent by
2010. The observed average number of cigarettes per smoker increases from 26.5 cigarettes per
day in 1964 to a high of over 30 cigarettes per day in 1983. It then drops to 23 cigarettes per day
by 2010. Using the observed initiation and cessation rates, the model’s simulated smoking
19
prevalence and cigarettes per day compare well to the observed (and incomplete) National
Health Interview Survey and TUS-CPS data over this period.17
We create a no-policy counterfactual simulation to predict what cigarette consumption
would have been in the absence of the 1964 SGR and subsequent anti-smoking policies. For the
counterfactual we assume that smoking initiation and cessation rates are fixed at their 1964
levels. We assume that the counterfactual number of cigarettes per smoker increases as observed
through 1983, and then remains constant at the 1983 level of over 30 cigarettes per day through
2010. To control for movements along the observed demand curve DCFt due to price changes, we
use price-elasticity to adjust for the differences in consumption due to the differences between
P1964 and Pt.
The assumptions in the counterfactual simulations probably tend to over-state the impact
of anti-smoking policies, for two reasons. First, even without the 1964 SGR and public
informational campaigns, it is likely that consumers would naturally learn on their own about the
medical research on the health risks of smoking.18 If so, even without the policies smoking
initiation rates would naturally fall and cessation rates would naturally rise. Second, the observed
increase in the number of cigarettes per smoker from 1964 to 1983, which we assume would
hold in the counterfactual, might not have occurred without the informational policies. Several
econometric studies find that during this period smokers reacted to the new information about the
17 Detailed results are included in the online Appendix. We calculate the observed average number of cigarettes per smoker by dividing total US consumption (from the Tax Burden on Tobacco) by the simulated number of smokers. As is well-known, smokers under-report their daily consumption in surveys, but our estimates and estimates from self-reported data show the same pattern over time. 18 Viscusi (1992, p. 35 and Table 2-6) points out that there was substantial coverage of smoking risks in Reader’s Digest during the 1950s, pre-dating the 1964 SGR and subsequent policies.

20
health risks of smoking by switching to filter cigarettes and lower-tar and lower-nicotine
cigarettes (Schneider et al. 1981, Ippolito and Ippolito 1984). If smokers compensated for these
changes by smoking more, improved information paradoxically might explain the observed
increase in the number of cigarettes per smoker.19 The no-policy counterfactual should not
include any policy-induced increase in cigarettes per smoker, but we are unaware of data on this.
Because these assumptions mean simulated counterfactual consumption is probably too high, our
retrospective BCA can be seen as providing an upper bound estimate of the benefits of anti-
smoking policies from 1964 – 2010.
Trends in Actual and Simulated Counterfactual Cigarette Consumption
Figures 2 and 3 compare the observed trends in smoking prevalence and cigarette
consumption from 1960 – 2010 to the results of the no policy counterfactual simulation.
Counterfactual smoking prevalence slightly declines from about 40 percent in 1960 to 37 percent
in 2010. In the counterfactual the rates of smoking initiation and cessation are constant at their
1964 levels so this slight drop in prevalence is due to changes in the age composition of the
population. In contrast, observed smoking prevalence drops steadily and falls about in half to 17
percent in 2010. Due to population growth, from 1964 to about 1980 both counterfactual and
observed cigarette consumption increase. Counterfactual consumption continues to grow through
2010, but after 1980 the drop in observed smoking prevalence (and after 1983 the drop in
observed cigarettes per day) outweigh population growth so observed consumption begins to fall.
19 Another possible explanation is that the observed increase in cigarettes per smoker reflects changes in the composition of the smoking population, if the consumers who would have been lighter smokers either never start smoking or are more likely to quit smoking.

21
Observed consumption in 2010 is only 39 percent of the level predicted in the counterfactual
simulation.
Observed cigarette consumption from 1964 – 2010 totals 1.13 trillion packs; under the
no-policy counterfactual cigarette consumption totals 1.58 trillion packs over the same period.
We use these simulation results to estimate that the overall impact of anti-smoking informational
policies from 1964 – 2010 is to reduce cigarette consumption by 28 percent. This does not
include reductions in cigarette consumption due to price increases over the period.
The policy-induced reductions grow over time, both in levels and in percentage terms.
Observed consumption in 1974 is about 10 percent lower than counterfactual consumption. The
reduction in observed consumption compared to counterfactual consumption grows to 21 percent
in 1984 to 38 percent in 1994 to 48 percent in 2004 to 61 percent in 2010. The time pattern
reflects wider dissemination of health information and the dynamics of the smoking population.
Changes in the flows into and out of the smoking population due to changes in initiation and
cessation are small relative to the stock of smokers. Their impact accumulates over time.
4. Retrospective BCA of Anti-Smoking Policies 1964 – 2010
Constructing Cigarette Demand Curves
To calculate the areas in Figure 1 that measure the consumer benefits of anti-smoking
policies we construct a series of demand curves DCF, DO and DR|At-1 for 1964 – 2010. The
observed cigarette consumption levels and counterfactual simulation results provide points on
the observed demand curves DO and the counterfactual demand curves DCF.
22
To find points on DR|At-1 we use our dynamic population model to simulate consumption
over time based on the smoking rates of a group of consumers whose smoking behavior tends to
approximate fully informed rational decision-making. We use data from the 2011-2012 TUS-
CPS on the distribution of various groups of consumers across smoking statuses. We restrict the
sample to those aged 30 – 45 to focus on adult consumers who made the decision to start
smoking well after the health consequences were widely publicized through the 1964 SGR and
the anti-smoking campaigns that followed. We further restrict the sample to highly educated
consumers to focus on consumers most able to align their behavior with their well-informed
preferences. Based on the smoking behaviors by consumers in this group, in our simulations of
the rational demand for cigarette consumption we assume: an initiation rate of 5 percent; the age-
and sex-specific cessation rates of smokers in this highly educated group; and average
consumption of 16 cigarettes per smoker per day.20
Figure 4 compares simulated rational cigarette consumption to observed consumption
from 1964 – 2010. In 1964 rational consumption is estimated to be 18 billion packs, which is 79
percent of observed consumption in that year. Rational consumption is relatively constant over
time. As noted above, observed consumption rises to a peak in the early 1980s and then steadily
declines. In 2010 rational consumption is 11 billion packs, which is 72 percent of observed
consumption.
A key feature of our approach is that the rational demand curve captures the linkages
across time created by addiction. To find points on the rational demand curves DRt|At-1 our
20 Our estimate of the number of cigarettes per day for rational smokers is based on 2010 TUS-CPS data on the number of cigarettes smoked per day self-reported by highly educated smokers, adjusted for under-reporting based on data on total cigarette consumption.

23
simulation of rational consumption at time t reflects the addictive stock determined by observed
consumption at time t-1. As can be seen in Figure 4, persistence in the addictive stock means that
the level of rational demand does not change quickly over time. The differences in the flows into
and out of the smoking population due to differences in rational and observed initiation and
cessation rates are small relative to the addictive stock. The large differences between rational
and observed consumption that start in 1964 and persist over time are mainly driven by the
differences in the rational and observed number of cigarettes smoked per day. Although our
approach assumes that the size of the smoking population does not change quickly, we make the
simplifying assumption that rational smokers would immediately cut their daily cigarette
consumption. This assumption is driven in part by data limitations: research on nicotine
withdrawal symptoms typically focuses on quit attempts, not on what happens when smokers cut
down. Because our assumption over-states the difference between observed and rational demand,
our approach tends to over-state the consumer benefits of anti-smoking policies.
To conduct our retrospective BCA we construct a series of demand curves DO, DCF, and
DR|At-1 over time. The observed market price and observed, simulated counterfactual, and
simulated rational consumption at time t provide points on the respective demand curves at time
t. Based on a consensus estimate that the price-elasticity of cigarette demand is -0.3 (Gallet and
List 2004), we estimate a common slope for the demand curves.21 We then use the point-slope
formula to construct a set of linear and parallel demand curves for the years 1964 – 2010.
21 Based on the data used in most of the studies behind the consensus price-elasticity estimate we assume that -0.3 is approximately the point-elasticity of the observed demand curve for cigarettes in 1984. This allows us to solve for the slope of DO,1984. We then assume this slope is the same across the other demand curves.
24
Before turning to BCA results, we note an intermediate result from the constructed
demand curves: a set of estimates of the vertical distances between the observed, counterfactual,
and rational demand curves. These estimates are interesting in their own right because the
vertical distances between DOt and DRt|At-1 or DCFt and DRt|At-1 measure the marginal internality,
i.e. the health consequences of cigarette consumption that are uninternalized due to individual
failures to optimize (see Figure 1). Based on the constructed demand curves, at the start of our
study period in 1964 the marginal internality is $1.07 per pack. By 2010 the marginal internality
increases to $3.61 per pack.22 In terms of the graphed curves, at first the vertical distance
between the other demand curves and DRt|At-1 increases over time because DRt|At -1 shifts inwards
towards the origin more quickly. In terms of the economic forces at work, this pattern reflects the
moving target nature of rational demand: as cigarette consumption falls over time, the reductions
in the addictive stock reduce the level of rational consumption.
Our estimates of the marginal internality are much smaller than previous estimates of the
average value of the health consequences per pack of cigarettes. Gruber and Koszegi (2001),
Cutler (2002) and Sloan et al. (2004) estimate that the average value of the health consequences
of smoking is in the range of $20 to $30 per pack; Viscusi and Hersch (2008) estimate that the
average value is even higher at $94 per pack for women and $222 per pack for men. Analogous
to the health benefits approach to BCA, these estimates are based on estimates of the lifetime
health consequences of smoking combined with estimates of the dollar-value of health. The
lifetime value of the health consequences is then averaged over the lifetime number of packs.
The lifetime average value is greater than the marginal internality in part because of the sunk
22 Complete results are available in the online Appendix. $3.61 is the average of the marginal internality at ACF, 2010 ($ 6.25) and the marginal internality at AO,2010 ($0.96). Put differently, $3.61 is the average height of the area J + K in Figure 1.

25
cost nature of the addictive stock. In addition, the marginal internality reflects the impact of the
anti-smoking policies that help correct for individual failures to internalize the health
consequences of their cigarette consumption.23
BCA of Anti-Smoking Policies from 1964 - 2010
For each year 1964 – 2010 we use the constructed demand curves DCF, DO and DR to
calculate the CV measured by the area J + K in Figure 1. The sum of the CVs is our measure of
the consumer benefits of the anti-smoking policies from 1964 - 2010.
At a discount rate of 3 percent, from the perspective of 1964 the present value of benefits of
the anti-smoking policies is about $573 billion (in 2010$). At a discount rate of 7 percent the
1964-present value is $191 billion. To provide some context for these large numbers: at a
discount rate of 3 percent our estimate of the 1964-present value of benefits is actually larger
than the 1964-present value of cigarette sales from 1964 – 2010. Another way to provide context
is to calculate the benefits per smoker-year. Based on the present value of the number of smoker-
years in the simulated no policy counterfactual, at a discount rate of 3 percent we estimate that
the anti-smoking policies yield consumer benefits of $369 per smoker-year.
We are unable to develop a hard estimate of the costs of anti-smoking policies from 1964 –
2010. The estimated consumer benefits flow from a broad set of federal, state, local and private-
sector anti-smoking policies including: publication of SGRs and other government reports;
mandatory warning labels; a ban of television and radio cigarette advertisements; school-based
23 This can be seen in the trend in the marginal internality at AOt over time: the marginal internality declines from its peak of over $2 per pack to $0.96 per pack in 2010.

26
health education about smoking; and mass media anti-smoking campaigns. We were unable to
find systematic data on the costs of these policies. Many of the informational policies involve
fairly minor resource costs. The costs of school-based health education and mass media
campaigns could be more substantial.
We use data on the costs of anti-smoking policies from 1985 – 2010 to make illustrative
calculations of the costs over the full period 1964 – 2010. Starting in the late 1980s, states began
to centralize their anti-smoking efforts in state tobacco control programs (Farrelly et al. 2003).
The 1998 Master Settlement Agreement between the tobacco industry and state attorneys general
provided an additional stream of revenues for these programs and also funded the Legacy
Foundation’s national ‘truth’ mass media anti-smoking campaign. In our illustrative calculation
we assume that from 1964 – 1998 the annual cost of anti-smoking policies equals the average
program costs over the period 1985 – 1998. The admittedly loose justification is that prior to
1985 the costs of public sector anti-smoking policies might have been roughly comparable but
were not centralized in specific state programs. This assumption probably overestimates the
costs. For the years 1999 – 2010 we assume the annual cost of anti-smoking policies is given by
the sum of state tobacco control program expenditures and the expenditures of the Legacy
Foundation.24
Based on those assumptions, our illustrative calculation is that at 3 percent discount rate the
1964-present value of costs is $6.5 billion. At 7 percent the 1964-present value of costs is $2.9
billion. Putting these cost estimates together with our estimates of the consumer benefits implies
24 We do not use the 1999 – 2010 costs in the average cost we calculation because we assume expenditures during this period were higher than historically due to the special circumstances created by the 1998 Master Settlement Agreement.

27
that anti-smoking policies from 1964 – 2010 yield net benefits of $566 billion (at 3 percent) or
$188 billion (at 7 percent). Although the illustrative calculation is far from a hard estimate of the
policy costs, the illustrative calculations suggest that the consumer benefits of the anti-smoking
policies are likely to substantially outweigh the policy costs.
5. Prospective BCA of an Anti-Smoking Policy 2010 - 2040
Our prospective BCA estimates potential benefits from future FDA tobacco regulations. We
use our dynamic population model to simulate a policy that: cuts the 2010 smoking initiation rate
in half; increases the 2010 smoking cessation rates by a third; and decreases the 2010 number of
cigarettes smoked per day by a third. The policy scenario and the rational scenario make the
simplifying but unrealistic assumption that smokers immediately cut the number of cigarettes
smoked per day, so both scenarios will overstate the reduction in consumption. The simulated
levels of cigarette consumption under this policy scenario are approximately equal to the levels
predicted under the rational scenario, so our prospective analysis corresponds to moving from
AOt to ARt in Figure 1.
Given past reductions in cigarette consumption, the policy scenario we simulate is ambitious
but perhaps attainable. The simulated changes in initiation, cessation, and cigarettes smoked per
day are comparable in percentage terms to changes observed over the past 15 years or so. While
those reductions were achieved more gradually through policies such as mass media anti-
smoking campaigns, future FDA tobacco regulations might change smoking behavior more
quickly. Under the 2009 Tobacco Control Act, the FDA is required to enact new graphic warning
labels and is allowed to make product changes such as banning menthol or reducing nicotine
28
content. By changing important aspects of the smoking experience, these regulations could lead
to abrupt changes in initiation, cessation and cigarettes smoked per day.
Figures 5 and 6 show the predicted changes in smoking prevalence and aggregate cigarette
consumption from the simulation model. As already noted, the policy scenario and the rational
scenario simulations are approximately the same, so we only show the policy scenario. The
status quo simulations predict trends in smoking prevalence and cigarette consumption if the
rates of smoking initiation, cessation, and cigarettes smoked per day remain constant at their
2010 levels. The demographics of the smoking population imply that even at current rates of
initiation and cessation smoking prevalence is predicted to drop from 20 percent in 2010 to 14
percent in 2020, 11 percent in 2030, and 9 percent in 2040.25 Under the policy scenario, smoking
prevalence drops more: to 12 percent in 2020, 7 percent in 2030, and 5 percent in 2040. Due to
our assumption about the drop in cigarettes smoked per day, from 2010 to 2011 cigarette
consumption falls immediately by one-third. After 2011, cigarette consumption continues to
decline slowly at first and then more rapidly due to the predicted drop in smoking prevalence.
By 2040 under the simulated policy scenario cigarette consumption is about one-third the level
predicted for 2040 under the status quo simulation.
Figures 5 and 6 provide another illustration of the importance of the addictive stock and the
moving target nature of rational demand. Given the addictive stock smokers in 2010 inherit due
25 This updates earlier predictions from the Mendez, et al. (1988) simulation model that: “the demographics of smoking imply that prevalence will inexorably continue to decline over the next several decades, even without any intensified efforts aimed at tobacco control.” The simulations accurately track observed smoking prevalence through 2010 (Warner and Mendez 2012). The reductions in future smoking prevalence and cigarette consumption in our simulation flow from past reductions in smoking initiation and increases in smoking cessation. Because these reductions, in turn, flow from past anti-smoking policies, our status quo simulation implies that past anti-smoking policies will provide a stream of additional benefits through 2040.
29
to their past consumption decisions, for the first few years simulated rational smoking prevalence
is very close to status quo smoking prevalence.
To estimate the benefits of the simulated policy we use the status quo simulation to construct
a series of observed demand curves DOt and the policy simulations to construct a series of
rational demand curves DRt||At-1 . We then calculate the area G of consumer benefits from
reducing QOt to QRt (see Figure 1). At a discount rate of 3 percent the 2010-present value of the
consumer benefits from the simulated FDA tobacco regulation through 2040 is estimated to be
$100 billion. At a discount rate of 7 percent the present value of the simulated regulation is $65
billion.
Compared to the consumer benefits, the direct resource costs of future FDA tobacco
regulation are likely to be low. For example, the FDA (2011) estimates that the discounted
present value of the costs of implementing and enforcing the proposed graphic warning labels is
$434 million (3 percent discount rate) and $392 million (7 percent discount rate). These
estimates of implementation and enforcement costs are less than 1 percent of our estimates of the
consumer benefits from the simulated FDA tobacco regulation. However, future FDA
regulations that require product changes such as very low nicotine content might be more costly
to implement and enforce than graphic warning labels, especially in the short-run.26
26 The 22nd Century Group produces very low-nicotine Spectrum brand cigarettes from genetically modified tobacco plants and provides them to researchers. To meet the demand created by an FDA regulation that substantially lowers nicotine levels, tobacco growers would need to shift from conventional tobacco plants to the new genetically modified plants. Cigarette manufacturers might also try to re-formulate cigarettes to offset possible changes in the perceived taste of the very low-nicotine cigarettes. The re-formulations would also be subject to FDA regulations, further increasing enforcement costs.
30
The nature of future FDA regulations implies that it might also be important to consider
additional costs related to consumer losses in utility. In the conceptual framework above these
losses correspond to the utility losses from changes in cigarette quality (∆G).27 Changes in
cigarette quality should be thought of broadly and includes changes in flavor, changes in nicotine
levels, and changes in other aspects of the smoking experience. For example, the experimental
study used to develop and test the proposed graphic warning labels finds that exposure to the
images on most of the labels elicited strong emotional responses including feeling “disgusted or
grossed out” and that “the pack is difficult to look at.”28 A complete estimate of the costs of
graphic warning labels needs to include the dollar value of the corresponding utility losses from
the changed smoking experience. To illustrate the potential magnitude of the utility losses: if
product changes or graphic labels reduce the value of cigarettes to consumers by $1 per pack, the
discounted present value of the utility losses through 2040 is $163 billion at a discount rate of 3
percent and $118 billion at a discount rate of 7 percent.29 Utility losses of this magnitude would
mean that the simulated FDA regulation would fail to meet the benefit-cost test.
27 In terms of Figure 1, the decrease in quality shifts the rational demand curve inwards. If Figure 1 is extended this way, the area between DR| initial quality and DR| lower quality captures the consumer welfare loss from the quality decrease (∆G). 28 See Nonemaker et al 2010. They note (page 4-2) evidence from other studies that “images that evoke the strongest graphic or emotional responses are likely to be the most effective….” However, their experimental results provides relatively weak evidence that the studied labels increase risk awareness or were effective in encouraging cessation or discouraging initiation. 29 Although $1 per pack is only used for an illustrative estimate, it might be in the right ball park. The cigarette market includes several quality tiers that vary substantially in price. By revealed preference, smokers of premium brands are willing to pay more for the combination of better taste and other perceived attributes of premium brands over lower-price alternatives. In data from the New York Adult Tobacco Survey from 2003 – 2007, the average price of premium cigarettes was $4.70 per pack, compared to $3.50 per pack for discount brands and $2.60 per pack for generic brands (DeCicca, Kenkel and Liu, forthcoming). That is, on average smokers of premium brands are willing to pay at least $1.20 more than for discounts and at least $2.10 more

31
6. Discussion
We implement a market-based behavioral economics approach to conduct retrospective and
prospective BCAs of US anti-smoking policies. Our retrospective BCA finds that the reduction
in cigarette consumption from anti-smoking policies from 1964 – 2010 yields substantial
consumer benefits that are likely to far exceed the policies’ costs. Our prospective BCA shows
that future FDA regulations can yield additional consumer benefits, but the estimated consumer
benefits from future regulations are smaller than the benefits from past anti-smoking policies.
The nature of some potential future FDA regulations also makes it less clear that their net
benefits will be positive.
Like any BCA, our analysis involves a number of simplifying assumptions and faces data
limitations. For reasons we explain above, some key simplifying assumptions mean that the
counterfactual simulations probably over-state the impact of the anti-smoking policies in both the
retrospective and prospective analyses. Our estimates might be seen as upper bounds of the
consumer benefits from the policies. However, the net impact of assumptions about the cigarette
demand functions (slopes and functional forms) is harder to judge.30 The potential sensitivity of
the results to these assumptions reflects the difficulty of using observed consumption to
extrapolate counterfactual consumption. Despite these limitations, we believe our analysis
provides a useful worked example of behavioral BCA of a major area of public health policy.
than for generics. In this context, it seems reasonable to suggest that major regulation-induced changes in cigarette attributes might be valued at -$1 per pack. 30To begin to explore this, instead of assuming that the price-elasticity of demand is -0.3 we have varied it from -0.15 to -0.45. In our retrospective BCA, at a discount rate of 3 percent the 1964-present value of benefits ranges from $382 billion (if the price-elasticity is -0.45) to $1.1 trillion (if the price-elasticity is -0.15). In our prospective BCA, at a discount rate of 3 percent the present value of benefits ranges from $66 billion (if the price-elasticity is -0.45) to $199 billion (if the price-elasticity is -0.15).

32
A useful direction for future work is to extend our aggregate analysis to incorporate
individual-level heterogeneity in the demand for cigarettes. If peer effects and the perceived
value of the health risks of smoking vary over the life cycle, age will be an important source of
heterogeneity in cigarette demand. Income is another important source of heterogeneity in the
value of health risks (Kniesner et al. 2010). Because higher-income consumers place a higher
value on health risks their cigarette demand will be lower.31 In a BCA heterogeneity in cigarette
demand will translate into heterogeneity in consumer benefits from anti-smoking policies. Our
estimates of the aggregate benefits of retrospective and prospective anti-smoking policies might
mask important differences in the benefits across sub-groups. For example, estimating the
benefits and costs of FDA tobacco regulations for low-income consumers parallels the question
of the regressivity of cigarette excise taxes (Colman and Remler 2008).
Our market-based approach complements the health benefits approach used in recent BCAs/
RIAs of health-related FDA regulations. To measure consumer net benefits from anti-smoking
policies we analyze observed choices in the market for cigarettes and make adjustments to reflect
individual failures to make utility-maximizing decisions. The health benefits approach instead
focuses on the gross value of the health benefits and then adjusts for consumer surplus losses.
Although it is not our main focus or approach in this analysis, an illustrative extension of our
simulation model yields estimates of the number of lives saved by anti-smoking policies in our
retrospective and prospective analyses. Using a value of statistical life of $7 million, we estimate
that at a discount rate of 3 percent the 1964-present value of the gross life-saving benefits of anti-
smoking policies from 1964 - 2010 is about $8.8 trillion. At the same discount rate, our market-
31 This might be part of the reason highly educated consumers smoke less. If so, this provides another caveat to our assumption that other groups’ rational demand can be approximated by the demand by highly educated.

33
based approach provides an estimate that the net consumer benefits of the policies is $573
billion. Putting together these estimates, which we re-emphasize are from quite different
approaches, implies that net benefits are only about 6 percent of the gross health benefits. About
94 percent of the gross health benefits from past anti-smoking policies are offset by losses of
consumer surplus in the cigarette market. In the prospective analysis, the calculations imply that
about 33 percent of the gross health benefits from hypothetical FDA regulations are offset by
losses of consumer surplus from the reduced consumption of cigarettes.
Our illustrative calculations are consistent with the higher end of the range of consumer
surplus offset ratios discussed in recent RIAs that use the health benefits approach to conduct
BCAs of health-related regulations. In contrast, some critics of these RIAs argue that the offset
ratio should be very small or zero. An offset ratio of zero is inconsistent with the compensation
variation (CV) measure of consumer welfare in both standard and behavioral welfare economics.
From the definition of the CV in equation (1) above, the gross value of the health improvements
(the dollar value of ∆H) is an incomplete benefits measure that neglects the value of other
important determinants of consumer welfare (∆A, ∆G, and ∆Y). The consumer surplus offset is a
standard measure of the value of the policy-induced changes in cigarette consumption (∆A) net
of the value of changes in consumption of other goods (∆Y). FDA regulations that affect
cigarette attributes such as menthol flavoring or nicotine content might result in additional losses
in utility (∆G); methods to measure these losses deserve more attention.32 At least some of the
critics of the consumer offset implicitly or explicitly reject the usefulness of the economic
approach and BCA. Many of these critics neither offer an alternative approach to BCA nor seem
32 The FDA (2011, 2014) RIAs do not include these losses when calculating their suggested offset ratios.

34
to think that an alternative approach is needed. Instead, they see the public health gains as
sufficient justification for new anti-smoking regulations.33
Other critics argue that the offset ratio should be very close to zero based on what they refer
to as “the principle of reason” (Chaloupka et al. 2015). They suggest that legal purchase age
laws mean that “society has clearly decided that the decision to initiate smoking is an irrational
decision and any changes in their conventionally calculated consumer surplus … should not be
counted….” (p. 5). They conclude that “the vast majority of any consumer surplus loss should
be ignored given that most tobacco users become addicted regular users before reaching the legal
purchase age” (p. 6). Our approach is partly consistent with their principle of reason. Our
simulations of the rational demand for cigarettes modify conventional calculations to incorporate
the assumption that most smoking initiation decisions are irrational.34 However, in our
simulations rational demand at time t reflects the addictive stock from past consumption
decisions regardless of whether the past decisions were rational. We suggest that the value of
avoiding the symptoms of cigarette withdrawal might be the major determinant of demand by
currently rational cigarette addicts. In contrast to the approach suggested by Chaloupka et al.
(2015), our approach gives full standing in the BCA to the cigarette withdrawal costs and other
utility losses by cigarette consumers.
33 For example, Song et al. (2014) argue that: “Continued application of a consumer surplus discount will undermine sensible policies to reduce tobacco use and other policies to promote public health.” This argument begs the question, in the logician’s sense of assuming the conclusion, of the BCA: Are the proposed policies indeed “sensible”? 34 In our rational demand simulations we assume that the rational initiation rate is 5 percent. Based on a 2002 survey finding that 91.2 percent of smokers state they never would have started smoking if they had to do it all over again, Chaloupka et al. (p. 5) suggest that perhaps the remaining 8.8 percent of smokers made rational initiation decisions. In 2002 smoking prevalence is about 23 percent, so their suggestion implies the rational initiation rate is around 2 percent.
35
We hope that worked examples including this study will help further develop the methods for
behavioral BCA that retain the strong conceptual framework and rigor of BCA. Although the
idea that addiction is a special case has an intuitive appeal, Bernheim and Rangel (2005, p. 3)
stress the need for a unified framework for behavioral welfare economics: “If we can classify,
say, the consumption of an addictive substance as contrary to an individual’s interests, what
about choices involving literature, religion, or sexual orientation?” Our behavioral BCA applies
an approach based on a unified framework to anti-smoking policies.
The net benefits criterion is not, and in our view should not be, the sole criterion used to
evaluate public policies. The BCAs required by the RIA process inform and improve but do not
always dictate federal regulations. It is natural and appropriate that federal agencies with public
health missions are informed by public health ethics. For example, Jones and Bayer (2007) argue
that many public health policies are “justified paternalism” and urge public health officials to
recognize (page 216) that “paternalistic protective legislation is part of the warp and woof of
public health practice in America.” Policies justified by paternalism might not meet the net
benefits criterion, and vice versa. There is no need to modify the BCA framework to guarantee
that it reaches the same conclusions as other normative criteria.

36
Conceptual Framework
Figure 1
Pricet
A
B
E
Pt C F I
G J
D H K DCFt
DOt
L DRt|At-1
ARt AOt ACFt Quantityt(At)
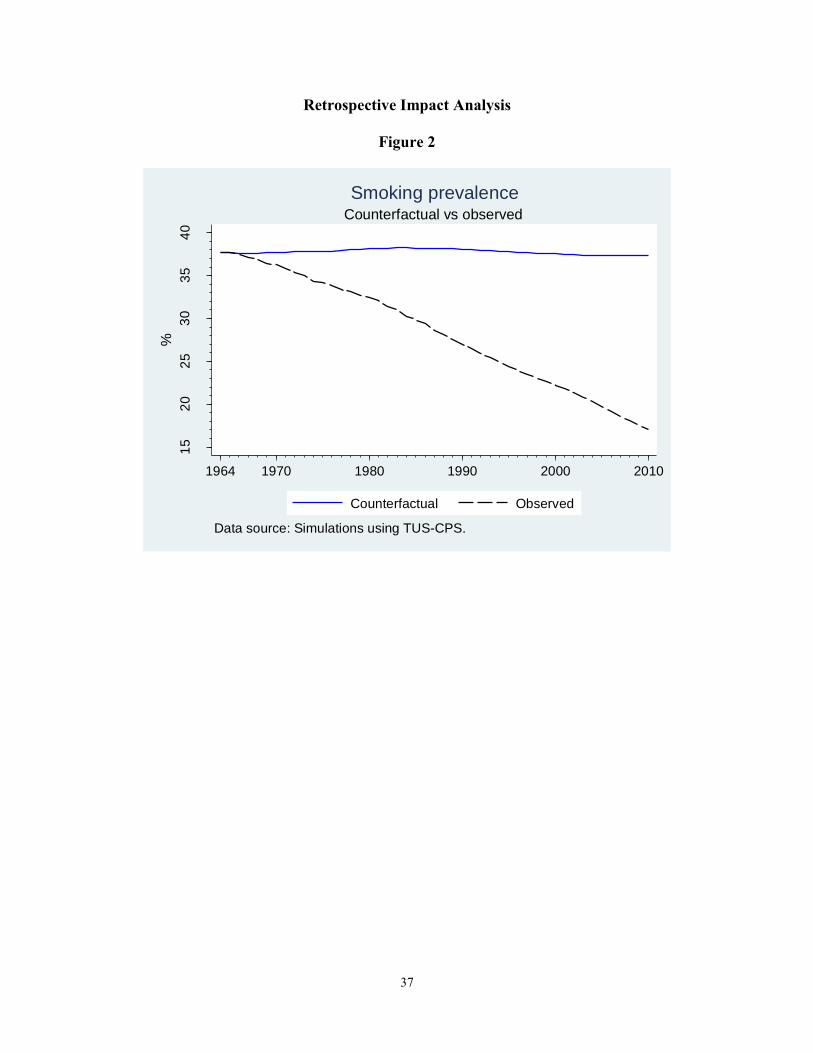
37
Retrospective Impact Analysis
Figure 2
15
20
25
30
35
40
%
1964 1970 1980 1990 2000 2010
Counterfactual Observed
Data source: Simulations using TUS-CPS.
Counterfactual vs observed
Smoking prevalence

38
Figure 3
10,0
00
20,0
00
30,0
00
40,0
00
Packs (
mill
ions)
1964 1970 1980 1990 2000 2010
Counterfactual Observed
Data source: Simulations using TUS-CPS.
Counterfactual vs observed
Cigarette consumption per year
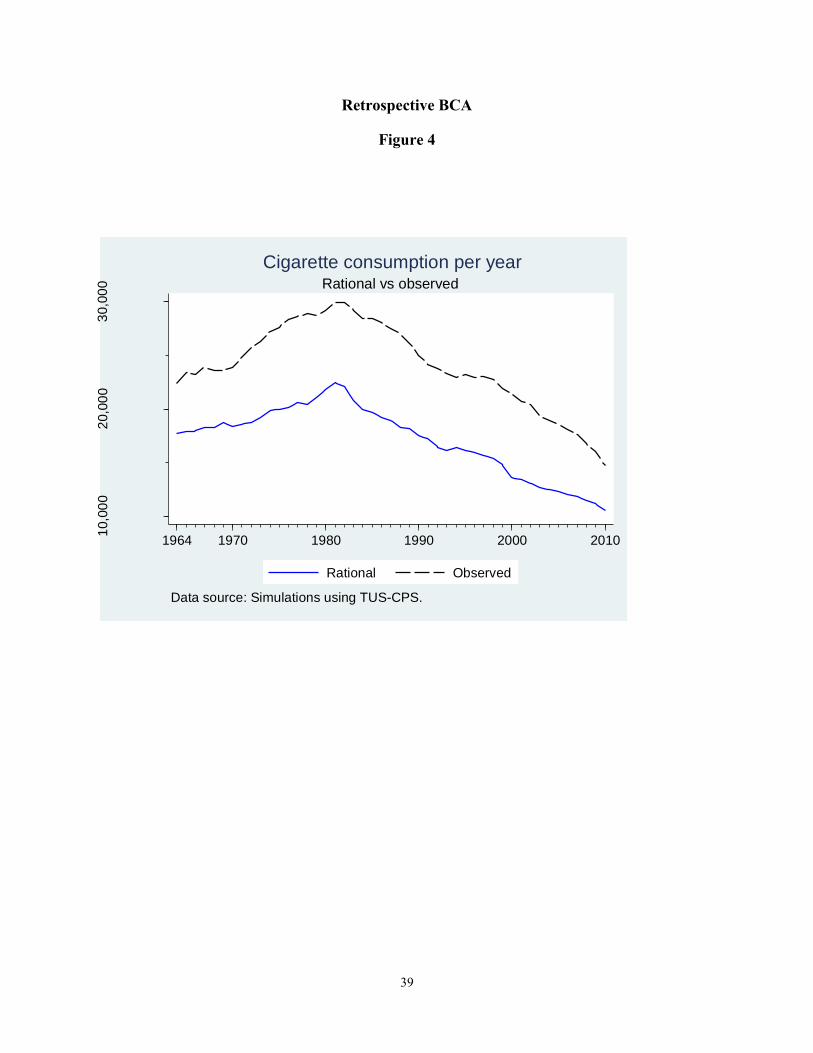
39
Retrospective BCA
Figure 4
10,0
00
20,0
00
30,0
00
Packs (
mill
ions)
1964 1970 1980 1990 2000 2010
Rational Observed
Data source: Simulations using TUS-CPS.
Rational vs observed
Cigarette consumption per year

40
Prospective BCA
Figure 5
Figure 6
05
10
15
20
%
2010 2015 2020 2025 2030 2035 2040
Policy Status Quo
Data source: simulations.
Prospective
Smoking prevalence rates5
,000
10,0
00
15,0
00
20,0
00
Pa
cks (
mill
ions)
2010 2015 2020 2025 2030 2035 2040
Policy StatusQuo
Data source: simulations.
Prospective
Cigarette consumption

41
References
Ashley, E. M., Nardinelli, C., & Lavaty, R. A. (2014). Estimating the Benefits of Public Health
Policies That Reduce Harmful Consumption. Health Economics, 25(10).
Australian Productivity Commission (2010). Gambling, Report no. 50, Canberra.
Bernheim, B. Douglas and Rangel, Antonio. (2005). Behavioral Public Economics: Welfare and
Policy Analysis with Non-Standard Decision Makers. National Bureau of Economic
Research. Working Paper 11518.
Bernheim, B. Douglas, & Rangel, Antonio. (2007). Toward Choice-Theoretic Foundations for
Behavioral Welfare Economics. American Economic Review, 97(2), 464-470. doi:
10.1257/aer.97.2.464
Bernheim, B. Douglas, & Rangel, Antonio. (2009). Beyond Revealed Preference: Choice-
Theoretic Foundations for Behavioral Welfare Economics. Quarterly Journal of
Economics, 124(1), 51-104.
Bureau of Economic Analysis (2015). Table of “Current-dollar and "Real" GDP.” Statistical
Tables Relating to Income, Employment, and Production. Table B - 1 Appendix B.
http://www.whitehouse.gov/sites/default/files/docs/erp2013/ERP2013_Appendix_B.pdf
Busch, S. H., Falba, T. A., Duchovny, N., Jofre-Bonet, M., O'Malley, S. S., & Sindelar, J. L.
(2004). Value to Smokers of Improved Cessation Products: Evidence from a Willingness-
to-Pay Survey. Nicotine & Tobacco Research, 6(4), 631-639. doi:
10.1080/14622200410001727885
Carson, Richard T. (2012). Contingent Valuation: A Practical Alternative when Prices Aren't
Available. Journal of Economic Perspectives, 26(4), 27-42. doi: 10.1257/jep.26.4.27

42
Chaloupka, F J and K E. Warner (2000). The Economics of Smoking. In Anthony Culyer and
Joseph P. Newhouse, editors, Handbook of Health Economics (Volume 1B, pp. 1539 -
1627). Amsterdam: North Holland.
Chaloupka, Frank J. , Gruber, Jonathan, & Warner, Kenneth E. (2015). Accounting for “Lost
Pleasure” in a Cost–Benefit Analysis of Government Regulation: The Case of the FDA's
Proposed Cigarette Labeling Regulation. Annals of Intern Medicine, 162 (1): 64.
Chaloupka, F. J., Warner, K. E., Acemoglu, D., Gruber, J., Laux, F., Max, W., Newhouse, J.,
Schelling, T. & Sindelar, J. (2014). An Evaluation of the FDA's Analysis of the Costs and
Benefits of the Graphic Warning Label Regulation. Tobacco Control, 30(052022), 2014-
052022.
Chetty, Raj. (2009). Sufficient Statistics for Welfare Analysis: A Bridge Between Structural and
Reduced-Form Methods Annual Review of Economics (Vol. 1, pp. 451-487).
Colman, Gregory J & Remler, Dahlia K. (2008). Vertical Equity Consequences of Very High
Cigarette Tax Increases: If the Poor are the Ones Smoking, How Could Cigarette Tax
Increases be Progressive? Journal of Policy Analysis and Management, 27 (2): 376-400.
Cutler, David M (2002). Health Care and the Public Sector. In Auerbach, Alan J and Martin
Feldstein, editors. Handbook of Public Economics. Elsevier Science, North Holland, pp.
2145 - 2243.
Cutler, David M. (2008). Are We Finally Winning the War on Cancer? Journal of Economic
Perspectives, 22(4), 3-26. doi: 10.1257/jep.22.4.3
Deaton, Angus and Muellbauer, John. (1980). Economics and Consumer Behavior. Cambridge:
Cambridge University Press.

43
DeCicca, Philip, Kenkel, Donald, & Liu, Feng (forthcoming). Reservation Prices: An Economic
Analysis of Cigarette Purchases on Indian Reservations. National Tax Journal.
DellaVigna, Stefano. (2009). Psychology and Economics: Evidence from the Field. Journal of
Economic Literature, 47(2), 315-372. doi: 10.1257/jel.47.2.315
Farrelly, Matthew. C., Pechacek, Terry F., & Chaloupka, Frank J. (2003). The Impact of
Tobacco Control Program Expenditures on Aggregate Cigarette Sales: 1981-2000.
Journal of Health Economics, 22(5), 843-859. doi: 10.1016/s0167-6296(03)00057-2
Food and Drug Administration. (2010). Required Warnings for Cigarette Packages and
Advertisements, Proposed Rule. Federal Register 75: 69524-65.
Food and Drug Administration (2011). Required Warnings for Cigarette Packages and
Advertisements, Final Rule. Federal Register 76: 36628-777.
Food and Drug Administration (2014a). Food Labeling: Nutrition Labeling of Standard Menu
Items in Restaurants and Similar Retail Food Establishments. Final Regulatory Impact
Analysis. FDA–2011–F–0172. Office of Regulations, Policy, and Social Sciences.
Center for Food Safety and Applied Nutrition.
Food and Drug Administration (2014b). Deeming Tobacco Products to be Subject to the
Federal Food, Drug and Cosmetic Act, as Amended by the Family Smoking Prevention
and Tobacco Control Act; Regulations on the Sale and Distribution of Tobacco Products
and Required Warning Statements for Tobacco Products, Proposed Rule. Federal
Register 79: 23142-207.
Gallup (1960). Gallup Poll, May 1960, #628.
Gallet, Craig A., & List, John A. (2003). Cigarette Demand: A Meta-Analysis of Elasticities.
Health Economics, 12(10), 821-835. doi: 10.1002/hec.765

44
Gayer, Ted, & Viscusi, W. Kip. (2013). Overriding Consumer Preferences with Energy
Regulations. Journal of Regulatory Economics, 43(3), 248-264. doi: 10.1007/s11149-
013-9210-2
Gine, Xavier, Karlan, Dean, & Zinman, Jonathan. (2010). Put Your Money Where Your Butt Is:
A Commitment Contract for Smoking Cessation. American Economic Journal-Applied
Economics, 2(4), 213-235. doi: 10.1257/app.2.4.213
Gonzalez, Mariaelena, Sanders-Jackson, Ashley, Song, Anna V., Cheng, Kaiwen, & Glantz,
Stanton A. (2013). Strong Smoke-Free Law Coverage in the United States by
Race/Ethnicity: 2000 - 2009. American Journal of Public Health 103 (5): e62 - e66.
Gruber, Jonathan, & Koszegi, B. (2001). Is Addiction Rational? Theory and Evidence. Quarterly
Journal of Economics, 116(4), 1261-1303. doi: 10.1162/003355301753265570
Hammar, H., & Johansson-Stenman, O. (2004). The Value of Risk-free Cigarettes - Do Smokers
Underestimate the Risk? Health Economics, 13(1), 59-71. doi: 10.1002/hec.794
Harberger, Arnold C. (1971). Three Basic Postulates for Applied Welfare Economics: An
Interpretive Essay. Journal of Economic Literature, 9(3), 785-797. doi: 10.2307/2720975
Hausman, Jerry. (2012). Contingent Valuation: From Dubious to Hopeless. Journal of Economic
Perspectives, 26(4), 43-56. doi: 10.1257/jep.26.4.43
Hughes, J. R. (2007). Effects of Abstinence from Tobacco: Valid Symptoms and Time Course.
Nicotine Tob Res, 9(3), 315-327.
Hughes, J. R., Keely, J., & Naud, S. (2004). Shape of the Relapse Curve and Long-term
Abstinence among Untreated Smokers. Addiction, 99(1), 29-38. doi: 10.1111/j.1360-
0443.2004.00540.x

45
Ippolito, Pauline M. & Ippolito, Richard A. (1984). Measuring the Value of Life Saving from
Consumer Reactions to New Information. Journal of Public Economics 31: 53 - 81.
Jha, Prabhat, Landsman, Victoria, Rostron, Brian, Thun, Michael, Anderson, Robert N., McAfee,
Tim, & Peto, Richard. (2013). 21st-Century Hazards of Smoking and Benefits of
Cessation in the United States. New England Journal of Medicine, 368(4), 341-350. doi:
10.1056/NEJMsa1211128
Jones, Marian Moser, & Bayer, Ronald. (2007). Paternalism and Its Discontents - Motorcycle
Helmet Laws, Libertarian Values, and Public Health. American Journal of Public Health,
97(2), 208-217. doi: 10.2105/ajph.2005.083204
Kahneman, D., Wakker, P. P., & Sarin, R. (1997). Back to Bentham? - Explorations of
Experienced Utility. Quarterly Journal of Economics, 112(2), 375-405. doi:
10.1162/003355397555235
Kenkel, Donald S., and Chen, Likwang. (2000). Consumer Information and Tobacco Use. In Jha
P and FJ Chaloupka, Editors. Tobacco Control in Developing Countries. Oxford
University Press, pp. 177-214.
Khwaja, Ahmed, Silverman, Dan, & Sloan, Frank. (2007). Time Preference, Time Discounting,
and Smoking Decisions. Journal of Health Economics, 26(5), 927-949. doi:
10.1016/j.jhealeco.2007.02.004
Khwaja, Ahmed, Silverman, Dan, Sloan, Frank, & Wang, Yang. (2009). Are Mature Smokers
Misinformed? Journal of Health Economics, 28(2), 385-397. doi:
10.1016/j.jhealeco.2008.12.004

46
King, Brian A., Dube, Shanta R., & Tynan, Michael A. (2012). Current Tobacco Use Among
Adults in the United States: Findings from the National Adult Tobacco Survey. American
Journal of Public Health, 102(11), e93-e100. doi: 10.2105/ajph.2012.301002
Kling, Catherine L., Phaneuf, Daniel J., & Zhao, Jinhua. (2012). From Exxon to BP: Has Some
Number Become Better than No Number? Journal of Economic Perspectives, 26(4), 3-
26. doi: 10.1257/jep.26.4.3
Kniesner, Thomas J, Viscusi, W. Kip, & Ziliak, James P. (2010). Policy Relevant Heterogeneity
in the Value of Statistical Life: New Evidence from Panel Data Quantile Regressions.
Journal of Risk and Uncertainty, 40: 15 - 31.
Manning, Willard G., Keeler, Emmett B., Newhouse, Joseph P., Sloss, Elizabeth M., &
Wasserman, Jeffrey. (1991) The Costs of Poor HealthHabits. Cambridge, Massachusetts:
Harvard University Press.
Mendez, David., Warner, Kenneth. E., & Courant, Paul. N. (1998). Has Smoking Cessation
Ceased? Expected Trends in the Prevalence of Smoking in the United States. American
Journal of Epidemiology, 148(3), 249-258.
Mokdad, A. H., Marks, J. S., Stroup, D. F., & Gerberding, J. L. (2004). Actual Causes of Death
in the United States, 2000. JAMA -Journal of the American Medical Association,
291(10), 1238-1245. doi: 10.1001/jama.291.10.1238
Mullainathan, Sendhil, Schwartzstein, Joshua, & Congdon, William J. (2012). A Reduced-Form
Approach to Behavioral Public Finance. Annual Review of Economics, Vol 4, 4, 511-540.
doi: 10.1146/annurev-economics-111809-125033
New York Times Editorial Board (2014). A Misguided Tobacco Proposal. New York Times,
August 8, 2014.

47
Nonnemaker, James, Matthew Farrelly, Kian Kamyab, Andrew Busey, and Nathan Mann (2010).
Experimental Study of Graphic Cigarette Warning Labels. RTI International. Final
Report prepared for Center for Tobacco Products, FDA.
Office of Management and the Budget (2011). Regulatory Impact Analysis: A Primer.
Orzechowski and Walker. The Tax Burden on Tobacco: Historical Compilation, Volume 47,
2012. Retrieved November 1, 2014, from
http://www.taxadmin.org/fta/tobacco/papers/tax_burden_2012.pdf.
Robinson, Lisa A. and Hammitt, James K. (2011). Behavioral Economics and the Conduct of
Benefit-Cost Analysis: Towards Principles and Standards. Journal of Benefit-Cost
Analysis 2 (2) Article 5.
Schneider, Lynne, Klein, Benjamin & Murphy, Kevin M. (1981). Government Regulation of
Cigarette Health Information. Journal of Law and Economics 24: 575 - 612.
Sloan, Frank A., Jan Ostermann, Gabriel Picone, Christopher Conover, and Donald H. Taylor, Jr.
(2004). The Price of Smoking. Cambridge, Massachusetts: The MIT Press.
Sloan, Frank A., & Wang, Yang. (2008). Economic Theory and Evidence on Smoking Behavior
of Adults. Addiction, 103(11), 1777-1785. doi: 10.1111/j.1360-0443.2008.02329.x
Sloan, Frank, & Platt, Alyssa. (2011). Information, Risk Perceptions, and Smoking Choices of
Youth. Journal of Risk and Uncertainty, 42(2), 161-193. doi: 10.1007/s11166-010-9111-
z
Song, Anna V., Brown, Paul, & Glantz, Stanton A. (2014). When Health Policy and Empirical
Evidence Collide: The Case of Cigarette Package Warning Labels and Economic
Consumer Surplus. American Journal of Public Health, 104(2), E42-E51. doi:
10.2105/ajph.2013.301737
48
Tavernise, Sabrina (2014). In New Calculus on Smoking, It’s Health Gained vs. Pleasure Lost.
New York Times, August 6, 2014.
Thaler, Richard H. and Cass R. Sunstein (2009). Nudge: Improving Decisions about Health,
Wealth, and Happiness. London: Penguin Books.
U.S. Government Publishing Office (2015). Budget of the United States Government. Table 3.2
- Outlays by Function and Subfunction: 1962–2019.
Viscusi, W. K. (1990). Do Smokers Understimate Risks. Journal of Political Economy, 98(6),
1253-1269. doi: 10.1086/261733
Viscusi, W. K. (1991). Age Variations in Risk Perceptions and Smoking Decisions. Review of
Economics and Statistics, 73(4), 577-588. doi: 10.2307/2109396
Viscusi, W. Kip (1992). Smoking: Making the Risky Decision (New York: Oxford University
Press).
Viscusi, W. Kip. (1995). Cigarette Taxation and the Social Consequences of Smoking. In James
Poterba, ed., Tax Policy and the Economy, MIT Press, pp. 51-102.
Viscusi, W. Kip, & Hersch, Joni. (2008). The Mortality Cost to Smokers. Journal of Health
Economics, 27(4), 943-958. doi: 10.1016/j.jhealeco.2008.01.001
Warner, Kenneth E. (2007). Charting the Science of the Future Where Tobacco-Control
Research Must Go. American Journal of Preventive Medicine, 33(6), S314-S317. doi:
10.1016/j.amepre.2007.09.010
Warner, Kenneth E., & Mendez, David. (2012). Accuracy and Importance of Projections From a
Dynamic Simulation Model of Smoking Prevalence in the United States. American
Journal of Public Health, 102(11), 2045-2048. doi: 10.2105/ajph.2012.300771

49
Weimer, David L., Vining, Aidan R., & Thomas, Randall K. (2009). Cost-Benefit Analysis
Involving Addictive Goods: Contingent Valuation to Estimate Willingness-to-Pay for
Smoking Cessation. Health Economics, 18(2), 181-202. doi: 10.1002/hec.1365


![MV SUN SEA – A BCAS Perspective.pptx [Read-Only]](https://img.pdfslide.us/doc/110x75/61f20f8645796677152fae54/mv-sun-sea-a-bcas-read-only.jpg)


