Embed Size (px)
Citation preview
Journal of Memory and Language 76 (2014) 158–173
Contents lists available at ScienceDirect
Journal of Memory and Language
journal homepage: www.elsevier .com/locate / jml
Retrieval dynamics of the strength based mirror effectin recognition memory
http://dx.doi.org/10.1016/j.jml.2014.06.0090749-596X/� 2014 Elsevier Inc. All rights reserved.
⇑ Corresponding author. Address: Department of Psychology, KoçUniversity, Rumeli Feneri Yolu, Sariyer 34450, Istanbul, Turkey.
E-mail address: [email protected] (A. Kılıç).
Aslı Kılıç ⇑, Ilke ÖztekinDepartment of Psychology, Koç University, Turkey
a r t i c l e i n f o a b s t r a c t
Article history:Received 9 December 2013revision received 10 June 2014
Keywords:Item recognitionThe strength based mirror effectThe response-deadline speed-accuracytrade-off procedureMemory modelsResponse bias
The strength based mirror effect (SBME) refers to an increase in hit rates (HR) and adecrease in false alarm rates (FAR) for the test lists that follow a strongly encoded studylist. Earlier investigation of accuracy and reaction time distributions by fitting the diffusionmodel indicated a mirror effect in the drift rate parameter, which was interpreted as anindication of more conservative responses due to a shift in the drift criterion. Additionally,the starting point for the evidence accumulation was found to be more liberal for thestrong test lists. In order to further investigate this paradoxical effect of list strength onthese two kinds of bias estimated from the diffusion model, we employed the response-deadline procedure which provided a direct assessment of response bias early in retrieval,prior to evidence accumulation. Results from the retrieval functions indicated more liberalresponse bias in the list strength paradigm with both pure- and mixed-strength study lists.On the contrary, the SBME was observed at the asymptotic accuracy, suggesting that theconservative response bias might be observed later in retrieval when memory evidencehas fully accumulated. In addition, comparison of the SBME across pure and mixed listsrevealed that the SBME was most prominent in the pure-list paradigm, suggesting thatboth the differentiation and criterion shift accounts jointly explain the SBME in recognitionmemory.
� 2014 Elsevier Inc. All rights reserved.
Introduction
Episodic memory is often tested in the laboratory bypresenting participants a list of items to study. In an itemrecognition task, participants are asked to endorse theitems they have recently studied (targets) and reject thenew items (foils). In recognition memory, when a list ofitems is strengthened via increasing the number of repeti-tions or manipulations during encoding, the probability tocorrectly endorse targets (hit rate) increase and the proba-bility to incorrectly endorse foils (false alarm rate)decrease, producing a strength based mirror effect (SBME,
Glanzer & Adams, 1985; Ratcliff, Clark, & Shiffrin, 1990;Stretch & Wixted, 1998). This subjective memory strengthcan be defined as a global match between the test item andtraces in memory or alternatively as familiarity, based onthe signal detection framework.
Previous research employed reaction time distributionsto study the SBME. For instance, Criss (2010) and Starns,Ratcliff, and White (2012) applied the diffusion model(Ratcliff, 1978), a dynamic version of the signal detectionframework, in a list-strength paradigm. In the diffusionmodel, memory evidence is assumed to accumulate overtime and a response is given when enough evidence is accu-mulated towards one of the two responses (‘‘yes’’ and ‘‘no’’)in an item-recognition task. The two responses are repre-sented as two boundaries and the separation between thetwo boundaries can measure the speed-accuracy
A. Kılıç, I. Öztekin / Journal of Memory and Language 76 (2014) 158–173 159
trade-off. The placement of the boundaries depends on theparticipant and can be manipulated by experimental condi-tions. For example, if the participants are instructed to giveaccurate responses rather than fast responses, they placetheir response boundaries far apart from each other andthus, giving a response requires more time and evidenceis more likely to accumulate towards the correct response(Ratcliff, 1985). The starting point parameter measures thetendency towards one of the responses by indicating thepoint at which the evidence begins to accumulate towardsone of the boundaries. For example, if the starting point iscloser to the ‘‘no’’ boundary, the frequency of the ‘‘no’’responses will be higher and the mean reaction time ofthe ‘‘no’’ responses will be shorter while the mean reactiontime of the ‘‘yes’’ responses will be longer. The parameterthat indicates the rate of evidence accumulation is the driftrate parameter (t). At each time point, the sampled evi-dence is compared to a criterion (drift criterion) and if thesampled evidence exceeds the criterion, evidence accumu-lates towards the ‘‘yes’’ boundary; if it fails to exceed thecriterion, evidence accumulates towards the ‘‘no’’ bound-ary. In summary, there are three different types of criterionthat determines the decisions made in the diffusion model:Boundary separation, starting point and the drift criterion.
Criss (2010) manipulated list-strength in item recogni-tion and the parameters of the diffusion model showedthat when speed-accuracy trade-off (boundary separationparameter) was taken into account, a mirror effect wasobserved in the drift rate parameters for the items testedin strong lists. The responses were more accurate and theaverage reaction time of the correct responses was fasterfor the foils tested along with strong targets (strong foils)compared with the responses of the foils tested along withweak targets (weak foils). Thus, faster and more accuratecorrect responses (‘‘no’’) to the strong foils have producedlower drift rate (higher in absolute value) and the decreasein the drift rate has been interpreted as a decrease in theoverall memory strength for the strong foils. This explana-tion depends on the differentiation mechanisms, whichcauses the foils to become less similar to the targets whenitems are strengthened during encoding. Accordingly, thedifferentiation models propose that foils that are comparedto strong targets become less confusable at retrieval (Criss,2006, 2009, 2010; Criss & McClelland, 2006; Criss et al.,2013).
The decrease in the drift rate of the strong foils could bealternatively interpreted as a shift in the drift criterion inthe diffusion model (see Starns, Ratcliff, et al., 2012). Thatis because the drift rate is defined in relation to the driftcriterion, as the distance from the drift criterion deter-mines the drift rate. The exact placement of the drift crite-rion cannot be estimated in the diffusion model and it isarbitrarily set to the zero point of the drift rate. Starns,Ratcliff, et al. (2012) suggested that when items werestrengthened during encoding, participants required moreevidence to endorse the probe, thus the drift criterionshifts hypothetically to some positive value. In the diffu-sion model, this shift is manifested as faster accrual of evi-dence towards the ‘‘no’’ boundary, as the sampled evidencefor the strong foils at each time step will more likely fail toexceed the drift criterion. In addition to the mirror effect
observed in the drift rates, both studies reported that thestarting point parameter was more liberal, meaning thatparticipants were more biased towards the ‘‘yes’’ responseboundary when tested with the strong targets.
Critical evidence for a shift in the drift criterion comesfrom the SBME observed when list strength is manipulatedonly during test (Starns, Ratcliff, et al., 2012; Starns, White,& Ratcliff, 2010; 2012). Different from previous studies inwhich strength was manipulated in pure lists (i.e. strengthwas manipulated across lists), Starns et al. presented par-ticipants with mixed lists of items (i.e. strength wasmanipulated within lists). However, in the subsequent testlists, either weak or strong targets were tested along withfoils. The SBME observed in the drift rates after studying amixed-list could only be explained by a shift in the driftcriterion. That is because the memory evidence for foilsafter a mixed study list would be comparable across teststrength conditions, and as a result, a decrease in the driftrates for strong foils would not be expected due to adifferentiation mechanism. Similar to the findings fromthe pure-list paradigm, the starting point for evidenceaccumulation was closer to the ‘‘yes’’ boundary for strongtargets.
In the current study, we tested whether list-strengthhas opposite effects on these two kinds of criterion, namelystarting point and drift criterion. To do so, we employedthe response-deadline speed-accuracy trade-off (SAT) pro-cedure, which provides an in-depth investigation of differ-ent types of response bias by controlling for the speed-accuracy tradeoffs over the course of retrieval.
The response-deadline SAT procedure
The SAT procedure provides conjoint and unbiasedmeasures of retrieval speed and retrieval success(Benjamin & Bjork, 2000; Hintzman & Curran, 1994;McElree & Dosher, 1989; Öztekin, Gungor, & Badre, 2012;Öztekin & McElree, 2007, 2010). In contrast to traditionalreaction time measures, which are subject to speed-accu-racy trade-offs and hence cannot provide pure measuresof processing speed, by providing the full time-course ofretrieval, SAT procedure yields independent assessmentof accuracy and speed of processing (see McElree, 2006for an overview). In SAT, participants are cued to respondwith a response signal (a tone) presented at one of severaltime points, typically ranging from 60 to 3000 ms after theprobe onset. The lag between the probe onset and theresponse signal is assigned randomly to test trials andparticipants are trained to give a response within 300 msafter the response cue. Although the diffusion model canalso quantitatively account for the speed-accuracy trade-off by measuring the criterion to terminate the evidenceaccumulation (boundary separation), experimental manip-ulation of response deadline has the further advantage ofproviding the full time course of retrieval for each experi-mental condition, in addition to eliminating the biasrelated to speed-accuracy trade-off.
SAT retrieval functions can describe changes in accu-racy as a function of total processing time, the total timethat passes from probe onset to the response after the
160 A. Kılıç, I. Öztekin / Journal of Memory and Language 76 (2014) 158–173
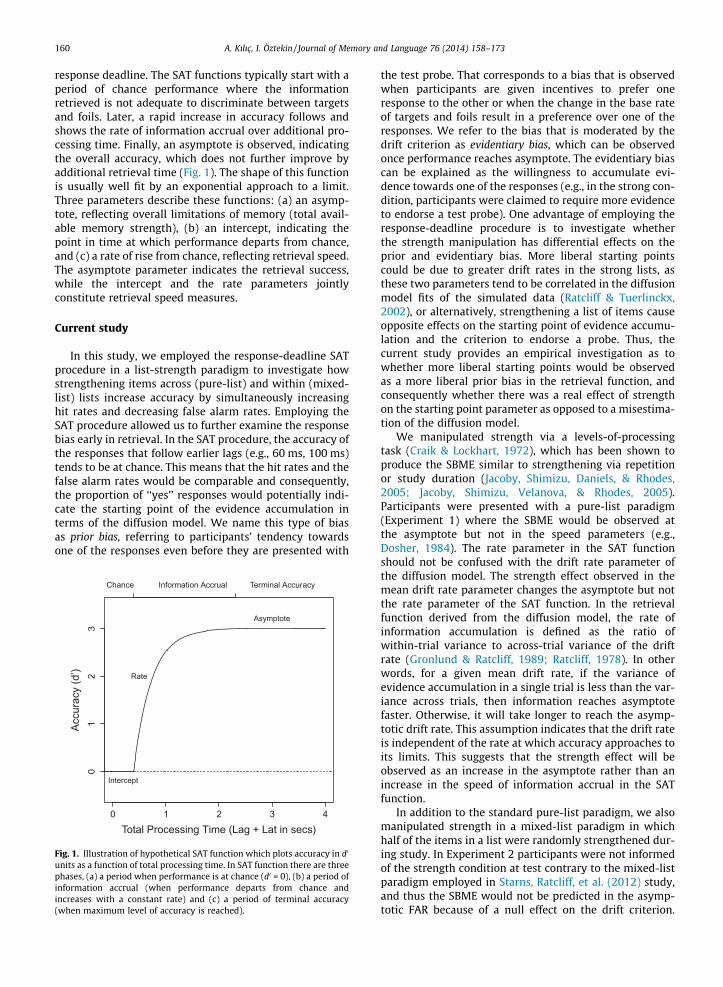
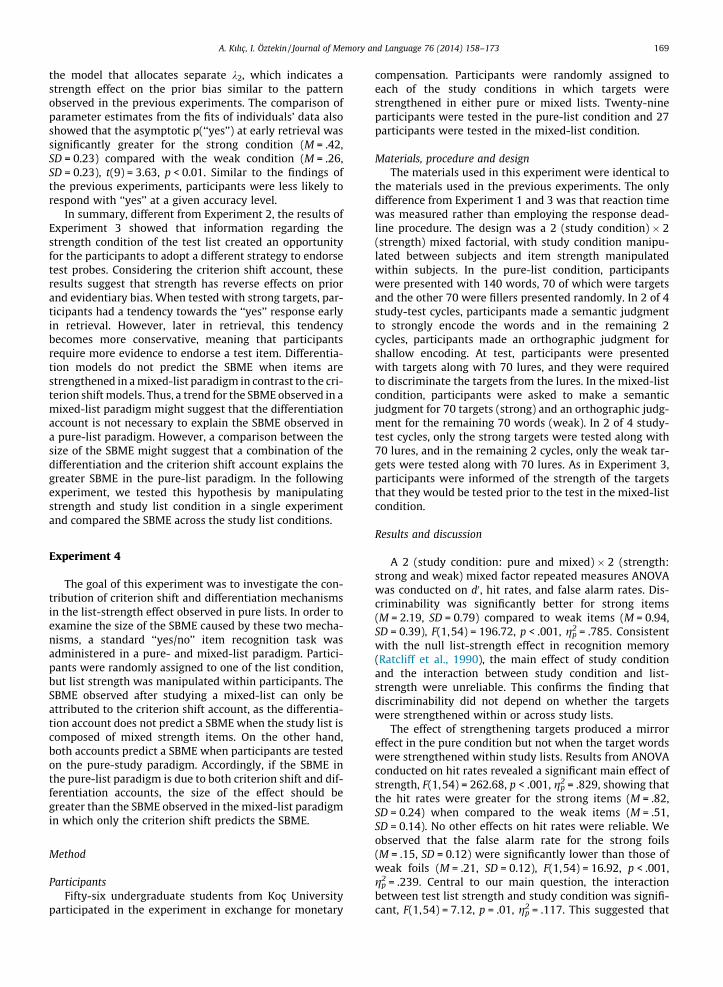
response deadline. The SAT functions typically start with aperiod of chance performance where the informationretrieved is not adequate to discriminate between targetsand foils. Later, a rapid increase in accuracy follows andshows the rate of information accrual over additional pro-cessing time. Finally, an asymptote is observed, indicatingthe overall accuracy, which does not further improve byadditional retrieval time (Fig. 1). The shape of this functionis usually well fit by an exponential approach to a limit.Three parameters describe these functions: (a) an asymp-tote, reflecting overall limitations of memory (total avail-able memory strength), (b) an intercept, indicating thepoint in time at which performance departs from chance,and (c) a rate of rise from chance, reflecting retrieval speed.The asymptote parameter indicates the retrieval success,while the intercept and the rate parameters jointlyconstitute retrieval speed measures.
Current study
In this study, we employed the response-deadline SATprocedure in a list-strength paradigm to investigate howstrengthening items across (pure-list) and within (mixed-list) lists increase accuracy by simultaneously increasinghit rates and decreasing false alarm rates. Employing theSAT procedure allowed us to further examine the responsebias early in retrieval. In the SAT procedure, the accuracy ofthe responses that follow earlier lags (e.g., 60 ms, 100 ms)tends to be at chance. This means that the hit rates and thefalse alarm rates would be comparable and consequently,the proportion of ‘‘yes’’ responses would potentially indi-cate the starting point of the evidence accumulation interms of the diffusion model. We name this type of biasas prior bias, referring to participants’ tendency towardsone of the responses even before they are presented with
01
23
Total Processing Time (Lag + Lat in secs)
Accu
racy
(d’)
Intercept
Asymptote
Rate
0 1 2 3 4
Chance Information Accrual Terminal Accuracy
Fig. 1. Illustration of hypothetical SAT function which plots accuracy in d0
units as a function of total processing time. In SAT function there are threephases, (a) a period when performance is at chance (d0 = 0), (b) a period ofinformation accrual (when performance departs from chance andincreases with a constant rate) and (c) a period of terminal accuracy(when maximum level of accuracy is reached).
the test probe. That corresponds to a bias that is observedwhen participants are given incentives to prefer oneresponse to the other or when the change in the base rateof targets and foils result in a preference over one of theresponses. We refer to the bias that is moderated by thedrift criterion as evidentiary bias, which can be observedonce performance reaches asymptote. The evidentiary biascan be explained as the willingness to accumulate evi-dence towards one of the responses (e.g., in the strong con-dition, participants were claimed to require more evidenceto endorse a test probe). One advantage of employing theresponse-deadline procedure is to investigate whetherthe strength manipulation has differential effects on theprior and evidentiary bias. More liberal starting pointscould be due to greater drift rates in the strong lists, asthese two parameters tend to be correlated in the diffusionmodel fits of the simulated data (Ratcliff & Tuerlinckx,2002), or alternatively, strengthening a list of items causeopposite effects on the starting point of evidence accumu-lation and the criterion to endorse a probe. Thus, thecurrent study provides an empirical investigation as towhether more liberal starting points would be observedas a more liberal prior bias in the retrieval function, andconsequently whether there was a real effect of strengthon the starting point parameter as opposed to a misestima-tion of the diffusion model.
We manipulated strength via a levels-of-processingtask (Craik & Lockhart, 1972), which has been shown toproduce the SBME similar to strengthening via repetitionor study duration (Jacoby, Shimizu, Daniels, & Rhodes,2005; Jacoby, Shimizu, Velanova, & Rhodes, 2005).Participants were presented with a pure-list paradigm(Experiment 1) where the SBME would be observed atthe asymptote but not in the speed parameters (e.g.,Dosher, 1984). The rate parameter in the SAT functionshould not be confused with the drift rate parameter ofthe diffusion model. The strength effect observed in themean drift rate parameter changes the asymptote but notthe rate parameter of the SAT function. In the retrievalfunction derived from the diffusion model, the rate ofinformation accumulation is defined as the ratio ofwithin-trial variance to across-trial variance of the driftrate (Gronlund & Ratcliff, 1989; Ratcliff, 1978). In otherwords, for a given mean drift rate, if the variance ofevidence accumulation in a single trial is less than the var-iance across trials, then information reaches asymptotefaster. Otherwise, it will take longer to reach the asymp-totic drift rate. This assumption indicates that the drift rateis independent of the rate at which accuracy approaches toits limits. This suggests that the strength effect will beobserved as an increase in the asymptote rather than anincrease in the speed of information accrual in the SATfunction.
In addition to the standard pure-list paradigm, we alsomanipulated strength in a mixed-list paradigm in whichhalf of the items in a list were randomly strengthened dur-ing study. In Experiment 2 participants were not informedof the strength condition at test contrary to the mixed-listparadigm employed in Starns, Ratcliff, et al. (2012) study,and thus the SBME would not be predicted in the asymp-totic FAR because of a null effect on the drift criterion.
A. Kılıç, I. Öztekin / Journal of Memory and Language 76 (2014) 158–173 161
The aim of Experiment 2 was to test whether strengthwould have an effect on prior bias while no effect wasexpected on the evidentiary bias. In Experiment 3, wesought to test the drift criterion shift account by presentingparticipants the strength condition of the targets beforeproceeding with the recognition task, so that participantscould shift their criterion accordingly. Finally, Experiment4 investigated whether the size of the strength effect differsignificantly across pure- and mixed-list paradigms, whichaimed to investigate the contribution of criterion shifts andthe differentiation mechanism in the list-strengthparadigm.
Experiment 1
In order to investigate the retrieval dynamics of theSBME, the SAT procedure was first applied to the tradi-tional pure-study paradigm where the items werestrengthened across lists in Experiment 1. Increasing thestudy time of items has been shown to increase the asymp-totic accuracy but no significant effect on the retrievalspeed (Dosher, 1984). Application of the diffusion modelto the list-strength paradigm showed that evidence accu-mulation starts from a point closer to the ‘‘yes’’ boundary,suggesting an adoption of a more liberal prior bias in theretrieval function of the strong items.
Method
ParticipantsTwelve undergraduate students from Koç University
took part in the experiment and received monetary com-pensation for their participation. One participant whodropped out of the experiment after the first session andtwo participants who had low overall accuracy (d0 < 0.35)were excluded from the subsequent analysis. Five of theremaining 9 participants were female and 2 of them wereleft-handed.
MaterialsThe word pool consisted of 902 words. Six hundred of
the words were from Turkish Word Norms (Tekcan &Göz, 2005). The remaining 302 words were randomlyselected from the association sets of the Turkish WordNorms1.
Procedure and designParticipants completed two 50-min sessions with an
additional 10-min practice session for the SAT procedureat the beginning of the first session. Each session consistedof four study-test blocks. In the study block, participantswere presented with 140 words2 and were administered alevels-of-processing task as the strength manipulation
1 Association sets include the words that were generated from the wordsin Turkish Word Norms by a free association task (see Tekcan & Göz, 2005for the association sets).
2 In the following experiments, participants study strong and weaktargets in the same list but later tested on either strong or weak targetsonly. In order to eliminate the length of the study list as confound, wepresented participants with targets (70) and filler items (70).
(Craik & Lockhart, 1972). For the strong condition, they wererequired to make a semantic judgment (‘‘Does the wordhave a pleasant meaning?’’) and for the weak condition, theymade an orthographic judgment (‘‘Does the word containthe letter ‘e’?’’). The study block was self-paced, as the wordwas displayed on the screen until the participant respondedwith the ‘z’ (‘‘yes’’) or the ‘?/’ (‘‘no’’) keys, and a 100-ms ISIfollowed each response. In each session, half of the study-test blocks (2) were strong and the other half (2) were weak,which were presented in random order. The test list consist-ing of 70 targets and 70 foils immediately followed the studylist. Each test item was presented for the duration of theresponse-deadline after a 500-ms presentation of a visualmask consisting of non-word symbols (see Fig. 2). The visualmask was presented right before the test item in order toprepare the participant to the new test trial. The response-deadline was cued with a 50-ms tone at the 60, 200, 300,500, 800, 1500, 3000 ms after the stimulus onset. Partici-pants were trained to respond within 300-ms of the toneand received a feedback of their response time. If they failto respond within the allotted time or respond earlier thenthe tone, they received a feedback (‘‘your response is tooslow’’ or ‘‘you responded before the tone’’, respectively).Early responses and the responses that were longer than600-ms, were excluded from the subsequent analysis.
The experiment was a 2 (Strength) � 7 (Response Lag)within-subjects design. There were 40 responses for tar-gets and 40 responses for foils at each strength and lagcondition. Lag condition was assigned randomly withineach strength and test item type condition over thecourse of testing. After the removed trials, the numberof responses for each strength and item condition was33.56 (SD = 5.29), 36.76 (SD = 3.07), 37.78 (SD = 2.86),38.05 (SD = 2.13), 37.86 (SD = 2.07), 36.80 (SD = 2.73)and 35.77 (SD = 3.90) on average, for 60, 200, 300, 500,800, 1500 and 3000 ms response lag conditionsrespectively.
Results and discussion
AccuracyAs the accuracy measure, d0s were obtained for each
strength and lag condition for each participant. The perfectperformances of hit rates (HR) and false alarm rates (FAR)were adjusted as follows: HR greater than .99 wereadjusted to .98 and FR lower than .01 were adjusted to.02, as an approximation to the Snodgrass & Corwin(1988) adjustment which was previously used in previousstudies employing the response deadline SAT procedure(e.g., Öztekin & McElree, 2007, 2010; Öztekin et al.,2012). The full time-course of the strength effect on accu-racy was examined by fitting data at the group and individ-ual level as an exponential approach to a limit (Dosher,1981; McElree & Dosher, 1993; Nobel & Shiffrin, 2001;Wickelgren, 1977; Öztekin & McElree, 2007, 2010;Öztekin et al., 2012):
d0ðtÞ ¼ kð1� e�bðt�dÞÞ; t < d; else 0 ð1Þ
where d0(t) is the predicted d0 at time t, k is the asymptoticaccuracy reflecting the overall performance of recognition
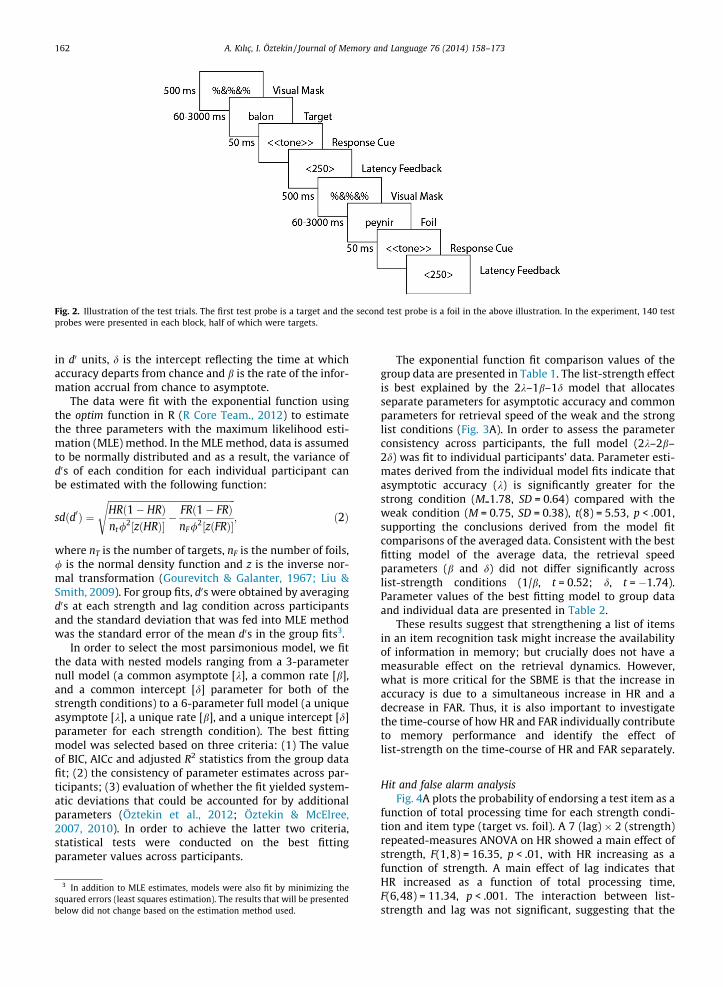
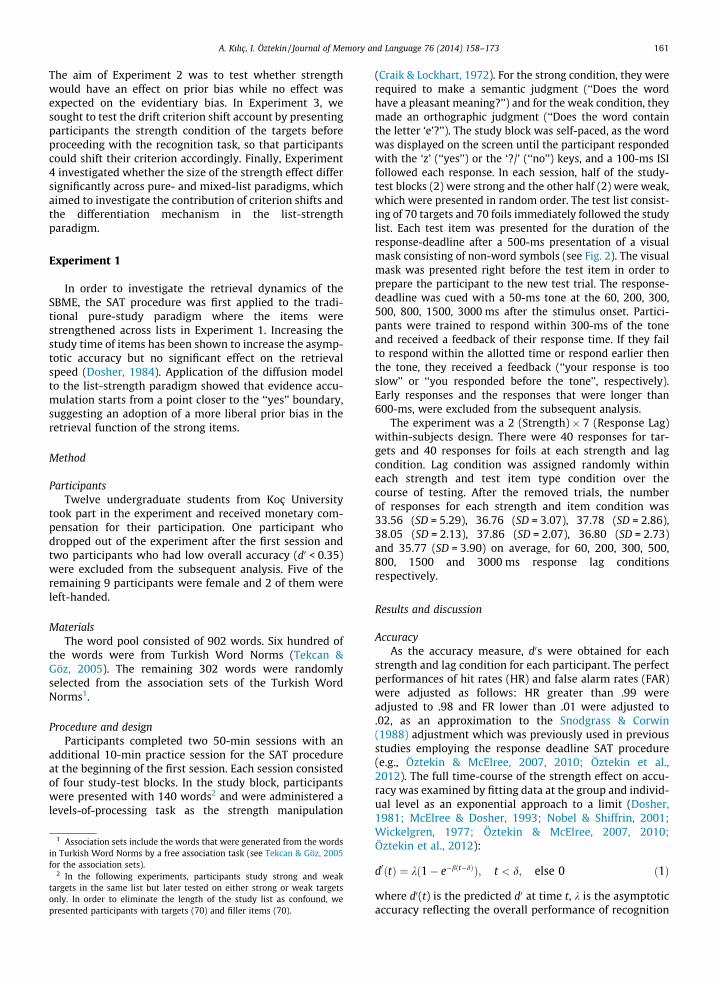
Fig. 2. Illustration of the test trials. The first test probe is a target and the second test probe is a foil in the above illustration. In the experiment, 140 testprobes were presented in each block, half of which were targets.
162 A. Kılıç, I. Öztekin / Journal of Memory and Language 76 (2014) 158–173
in d0 units, d is the intercept reflecting the time at whichaccuracy departs from chance and b is the rate of the infor-mation accrual from chance to asymptote.
The data were fit with the exponential function usingthe optim function in R (R Core Team., 2012) to estimatethe three parameters with the maximum likelihood esti-mation (MLE) method. In the MLE method, data is assumedto be normally distributed and as a result, the variance ofd0s of each condition for each individual participant canbe estimated with the following function:
sdðd0Þ ¼ffiffiffiffiffiffiffiffiffiffiffiffiffiffiffiffiffiffiffiffiffiffiffiffiffiffiffiffiffiffiffiffiffiffiffiffiffiffiffiffiffiffiffiffiffiffiffiffiffiffiffiffiffiffiffiHRð1� HRÞnt/
2½zðHRÞ�� FRð1� FRÞ
nF/2½zðFRÞ�
s; ð2Þ
where nT is the number of targets, nF is the number of foils,/ is the normal density function and z is the inverse nor-mal transformation (Gourevitch & Galanter, 1967; Liu &Smith, 2009). For group fits, d0s were obtained by averagingd0s at each strength and lag condition across participantsand the standard deviation that was fed into MLE methodwas the standard error of the mean d0s in the group fits3.
In order to select the most parsimonious model, we fitthe data with nested models ranging from a 3-parameternull model (a common asymptote [k], a common rate [b],and a common intercept [d] parameter for both of thestrength conditions) to a 6-parameter full model (a uniqueasymptote [k], a unique rate [b], and a unique intercept [d]parameter for each strength condition). The best fittingmodel was selected based on three criteria: (1) The valueof BIC, AICc and adjusted R2 statistics from the group datafit; (2) the consistency of parameter estimates across par-ticipants; (3) evaluation of whether the fit yielded system-atic deviations that could be accounted for by additionalparameters (Öztekin et al., 2012; Öztekin & McElree,2007, 2010). In order to achieve the latter two criteria,statistical tests were conducted on the best fittingparameter values across participants.
3 In addition to MLE estimates, models were also fit by minimizing thesquared errors (least squares estimation). The results that will be presentedbelow did not change based on the estimation method used.
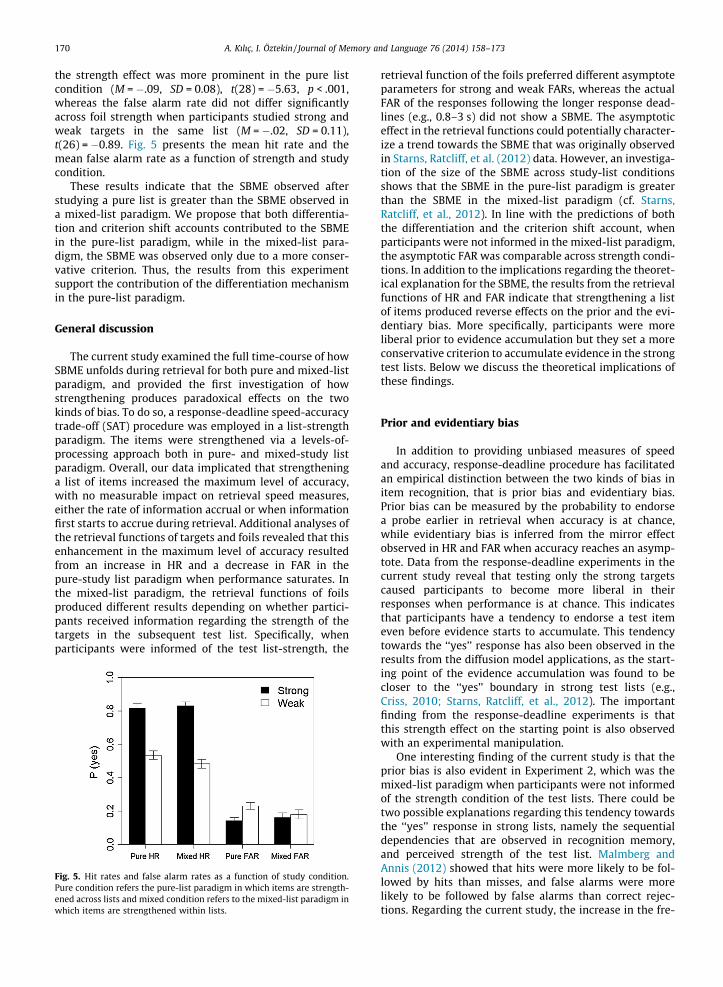
The exponential function fit comparison values of thegroup data are presented in Table 1. The list-strength effectis best explained by the 2k–1b–1d model that allocatesseparate parameters for asymptotic accuracy and commonparameters for retrieval speed of the weak and the stronglist conditions (Fig. 3A). In order to assess the parameterconsistency across participants, the full model (2k–2b–2d) was fit to individual participants’ data. Parameter esti-mates derived from the individual model fits indicate thatasymptotic accuracy (k) is significantly greater for thestrong condition (M=1.78, SD = 0.64) compared with theweak condition (M = 0.75, SD = 0.38), t(8) = 5.53, p < .001,supporting the conclusions derived from the model fitcomparisons of the averaged data. Consistent with the bestfitting model of the average data, the retrieval speedparameters (b and d) did not differ significantly acrosslist-strength conditions (1/b, t = 0.52; d, t = �1.74).Parameter values of the best fitting model to group dataand individual data are presented in Table 2.
These results suggest that strengthening a list of itemsin an item recognition task might increase the availabilityof information in memory; but crucially does not have ameasurable effect on the retrieval dynamics. However,what is more critical for the SBME is that the increase inaccuracy is due to a simultaneous increase in HR and adecrease in FAR. Thus, it is also important to investigatethe time-course of how HR and FAR individually contributeto memory performance and identify the effect oflist-strength on the time-course of HR and FAR separately.
Hit and false alarm analysisFig. 4A plots the probability of endorsing a test item as a
function of total processing time for each strength condi-tion and item type (target vs. foil). A 7 (lag) � 2 (strength)repeated-measures ANOVA on HR showed a main effect ofstrength, F(1,8) = 16.35, p < .01, with HR increasing as afunction of strength. A main effect of lag indicates thatHR increased as a function of total processing time,F(6,48) = 11.34, p < .001. The interaction between list-strength and lag was not significant, suggesting that the
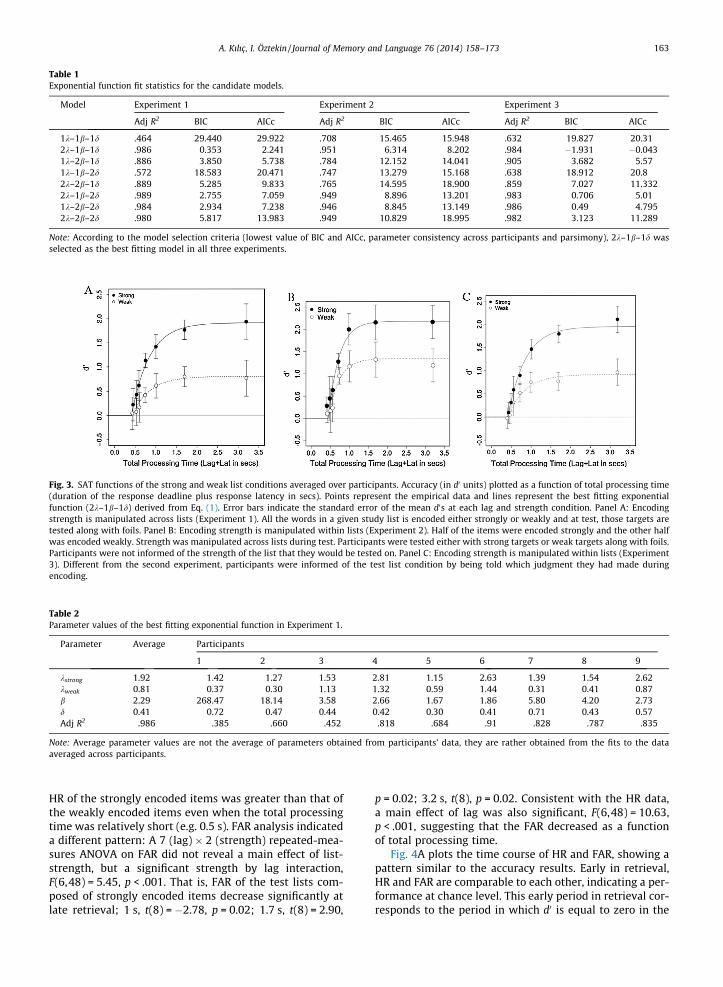
Table 1Exponential function fit statistics for the candidate models.
Model Experiment 1 Experiment 2 Experiment 3
Adj R2 BIC AICc Adj R2 BIC AICc Adj R2 BIC AICc
1k–1b–1d .464 29.440 29.922 .708 15.465 15.948 .632 19.827 20.312k–1b–1d .986 0.353 2.241 .951 6.314 8.202 .984 �1.931 �0.0431k–2b–1d .886 3.850 5.738 .784 12.152 14.041 .905 3.682 5.571k–1b–2d .572 18.583 20.471 .747 13.279 15.168 .638 18.912 20.82k–2b–1d .889 5.285 9.833 .765 14.595 18.900 .859 7.027 11.3322k–1b–2d .989 2.755 7.059 .949 8.896 13.201 .983 0.706 5.011k–2b–2d .984 2.934 7.238 .946 8.845 13.149 .986 0.49 4.7952k–2b–2d .980 5.817 13.983 .949 10.829 18.995 .982 3.123 11.289
Note: According to the model selection criteria (lowest value of BIC and AICc, parameter consistency across participants and parsimony), 2k–1b–1d wasselected as the best fitting model in all three experiments.
Fig. 3. SAT functions of the strong and weak list conditions averaged over participants. Accuracy (in d0 units) plotted as a function of total processing time(duration of the response deadline plus response latency in secs). Points represent the empirical data and lines represent the best fitting exponentialfunction (2k–1b–1d) derived from Eq. (1). Error bars indicate the standard error of the mean d0s at each lag and strength condition. Panel A: Encodingstrength is manipulated across lists (Experiment 1). All the words in a given study list is encoded either strongly or weakly and at test, those targets aretested along with foils. Panel B: Encoding strength is manipulated within lists (Experiment 2). Half of the items were encoded strongly and the other halfwas encoded weakly. Strength was manipulated across lists during test. Participants were tested either with strong targets or weak targets along with foils.Participants were not informed of the strength of the list that they would be tested on. Panel C: Encoding strength is manipulated within lists (Experiment3). Different from the second experiment, participants were informed of the test list condition by being told which judgment they had made duringencoding.
Table 2Parameter values of the best fitting exponential function in Experiment 1.
Parameter Average Participants
1 2 3 4 5 6 7 8 9
kstrong 1.92 1.42 1.27 1.53 2.81 1.15 2.63 1.39 1.54 2.62kweak 0.81 0.37 0.30 1.13 1.32 0.59 1.44 0.31 0.41 0.87b 2.29 268.47 18.14 3.58 2.66 1.67 1.86 5.80 4.20 2.73d 0.41 0.72 0.47 0.44 0.42 0.30 0.41 0.71 0.43 0.57Adj R2 .986 .385 .660 .452 .818 .684 .91 .828 .787 .835
Note: Average parameter values are not the average of parameters obtained from participants’ data, they are rather obtained from the fits to the dataaveraged across participants.
A. Kılıç, I. Öztekin / Journal of Memory and Language 76 (2014) 158–173 163
HR of the strongly encoded items was greater than that ofthe weakly encoded items even when the total processingtime was relatively short (e.g. 0.5 s). FAR analysis indicateda different pattern: A 7 (lag) � 2 (strength) repeated-mea-sures ANOVA on FAR did not reveal a main effect of list-strength, but a significant strength by lag interaction,F(6,48) = 5.45, p < .001. That is, FAR of the test lists com-posed of strongly encoded items decrease significantly atlate retrieval; 1 s, t(8) = �2.78, p = 0.02; 1.7 s, t(8) = 2.90,
p = 0.02; 3.2 s, t(8), p = 0.02. Consistent with the HR data,a main effect of lag was also significant, F(6,48) = 10.63,p < .001, suggesting that the FAR decreased as a functionof total processing time.
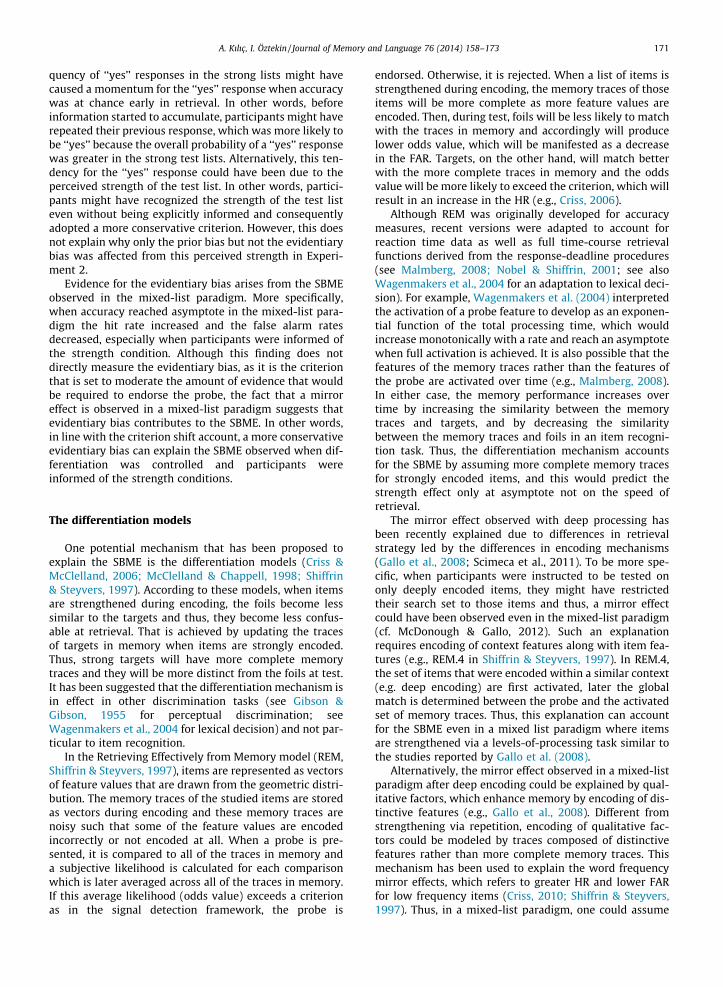
Fig. 4A plots the time course of HR and FAR, showing apattern similar to the accuracy results. Early in retrieval,HR and FAR are comparable to each other, indicating a per-formance at chance level. This early period in retrieval cor-responds to the period in which d0 is equal to zero in the
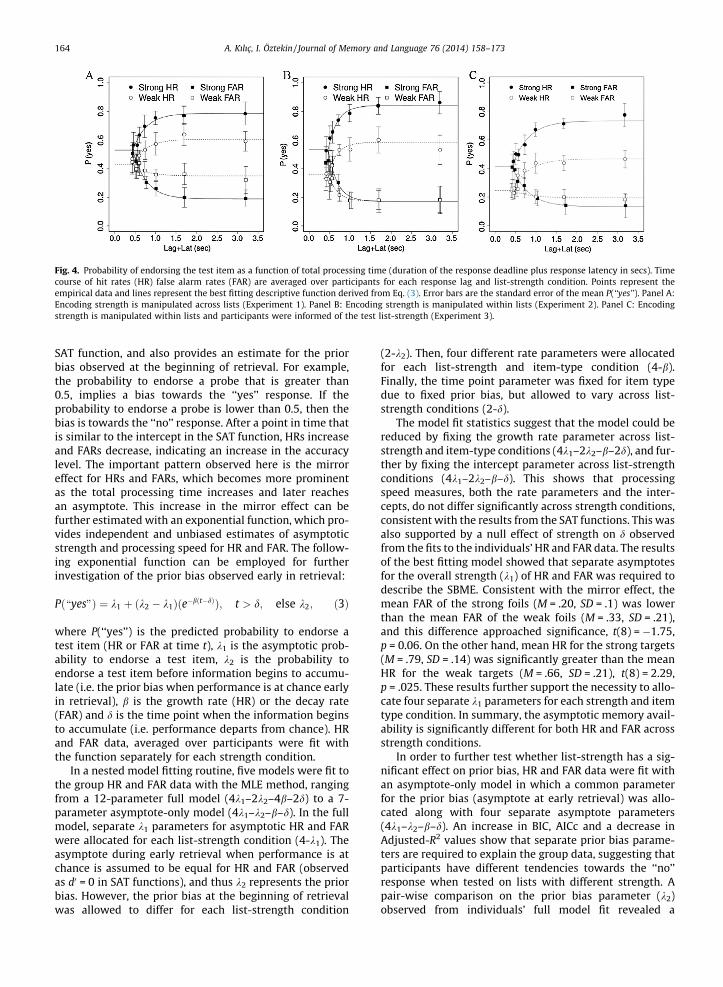
Fig. 4. Probability of endorsing the test item as a function of total processing time (duration of the response deadline plus response latency in secs). Timecourse of hit rates (HR) false alarm rates (FAR) are averaged over participants for each response lag and list-strength condition. Points represent theempirical data and lines represent the best fitting descriptive function derived from Eq. (3). Error bars are the standard error of the mean P(‘‘yes’’). Panel A:Encoding strength is manipulated across lists (Experiment 1). Panel B: Encoding strength is manipulated within lists (Experiment 2). Panel C: Encodingstrength is manipulated within lists and participants were informed of the test list-strength (Experiment 3).
164 A. Kılıç, I. Öztekin / Journal of Memory and Language 76 (2014) 158–173
SAT function, and also provides an estimate for the priorbias observed at the beginning of retrieval. For example,the probability to endorse a probe that is greater than0.5, implies a bias towards the ‘‘yes’’ response. If theprobability to endorse a probe is lower than 0.5, then thebias is towards the ‘‘no’’ response. After a point in time thatis similar to the intercept in the SAT function, HRs increaseand FARs decrease, indicating an increase in the accuracylevel. The important pattern observed here is the mirroreffect for HRs and FARs, which becomes more prominentas the total processing time increases and later reachesan asymptote. This increase in the mirror effect can befurther estimated with an exponential function, which pro-vides independent and unbiased estimates of asymptoticstrength and processing speed for HR and FAR. The follow-ing exponential function can be employed for furtherinvestigation of the prior bias observed early in retrieval:
Pð\yes"Þ ¼ k1 þ ðk2 � k1Þðe�bðt�dÞÞ; t > d; else k2; ð3Þ
where P(‘‘yes’’) is the predicted probability to endorse atest item (HR or FAR at time t), k1 is the asymptotic prob-ability to endorse a test item, k2 is the probability toendorse a test item before information begins to accumu-late (i.e. the prior bias when performance is at chance earlyin retrieval), b is the growth rate (HR) or the decay rate(FAR) and d is the time point when the information beginsto accumulate (i.e. performance departs from chance). HRand FAR data, averaged over participants were fit withthe function separately for each strength condition.
In a nested model fitting routine, five models were fit tothe group HR and FAR data with the MLE method, rangingfrom a 12-parameter full model (4k1–2k2–4b–2d) to a 7-parameter asymptote-only model (4k1–k2–b–d). In the fullmodel, separate k1 parameters for asymptotic HR and FARwere allocated for each list-strength condition (4-k1). Theasymptote during early retrieval when performance is atchance is assumed to be equal for HR and FAR (observedas d0 = 0 in SAT functions), and thus k2 represents the priorbias. However, the prior bias at the beginning of retrievalwas allowed to differ for each list-strength condition
(2-k2). Then, four different rate parameters were allocatedfor each list-strength and item-type condition (4-b).Finally, the time point parameter was fixed for item typedue to fixed prior bias, but allowed to vary across list-strength conditions (2-d).
The model fit statistics suggest that the model could bereduced by fixing the growth rate parameter across list-strength and item-type conditions (4k1–2k2–b–2d), and fur-ther by fixing the intercept parameter across list-strengthconditions (4k1–2k2–b–d). This shows that processingspeed measures, both the rate parameters and the inter-cepts, do not differ significantly across strength conditions,consistent with the results from the SAT functions. This wasalso supported by a null effect of strength on d observedfrom the fits to the individuals’ HR and FAR data. The resultsof the best fitting model showed that separate asymptotesfor the overall strength (k1) of HR and FAR was required todescribe the SBME. Consistent with the mirror effect, themean FAR of the strong foils (M = .20, SD = .1) was lowerthan the mean FAR of the weak foils (M = .33, SD = .21),and this difference approached significance, t(8) = �1.75,p = 0.06. On the other hand, mean HR for the strong targets(M = .79, SD = .14) was significantly greater than the meanHR for the weak targets (M = .66, SD = .21), t(8) = 2.29,p = .025. These results further support the necessity to allo-cate four separate k1 parameters for each strength and itemtype condition. In summary, the asymptotic memory avail-ability is significantly different for both HR and FAR acrossstrength conditions.
In order to further test whether list-strength has a sig-nificant effect on prior bias, HR and FAR data were fit withan asymptote-only model in which a common parameterfor the prior bias (asymptote at early retrieval) was allo-cated along with four separate asymptote parameters(4k1–k2–b–d). An increase in BIC, AICc and a decrease inAdjusted-R2 values show that separate prior bias parame-ters are required to explain the group data, suggesting thatparticipants have different tendencies towards the ‘‘no’’response when tested on lists with different strength. Apair-wise comparison on the prior bias parameter (k2)observed from individuals’ full model fit revealed a
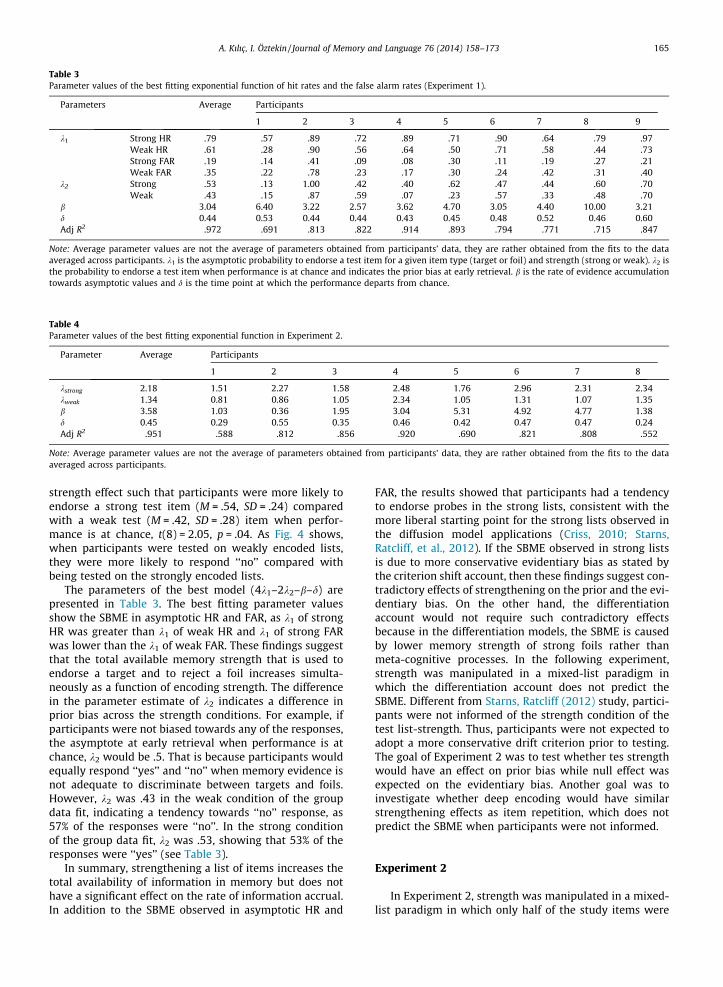
Table 3Parameter values of the best fitting exponential function of hit rates and the false alarm rates (Experiment 1).
Parameters Average Participants
1 2 3 4 5 6 7 8 9
k1 Strong HR .79 .57 .89 .72 .89 .71 .90 .64 .79 .97Weak HR .61 .28 .90 .56 .64 .50 .71 .58 .44 .73Strong FAR .19 .14 .41 .09 .08 .30 .11 .19 .27 .21Weak FAR .35 .22 .78 .23 .17 .30 .24 .42 .31 .40
k2 Strong .53 .13 1.00 .42 .40 .62 .47 .44 .60 .70Weak .43 .15 .87 .59 .07 .23 .57 .33 .48 .70
b 3.04 6.40 3.22 2.57 3.62 4.70 3.05 4.40 10.00 3.21d 0.44 0.53 0.44 0.44 0.43 0.45 0.48 0.52 0.46 0.60Adj R2 .972 .691 .813 .822 .914 .893 .794 .771 .715 .847
Note: Average parameter values are not the average of parameters obtained from participants’ data, they are rather obtained from the fits to the dataaveraged across participants. k1 is the asymptotic probability to endorse a test item for a given item type (target or foil) and strength (strong or weak). k2 isthe probability to endorse a test item when performance is at chance and indicates the prior bias at early retrieval. b is the rate of evidence accumulationtowards asymptotic values and d is the time point at which the performance departs from chance.
Table 4Parameter values of the best fitting exponential function in Experiment 2.
Parameter Average Participants
1 2 3 4 5 6 7 8
kstrong 2.18 1.51 2.27 1.58 2.48 1.76 2.96 2.31 2.34kweak 1.34 0.81 0.86 1.05 2.34 1.05 1.31 1.07 1.35b 3.58 1.03 0.36 1.95 3.04 5.31 4.92 4.77 1.38d 0.45 0.29 0.55 0.35 0.46 0.42 0.47 0.47 0.24Adj R2 .951 .588 .812 .856 .920 .690 .821 .808 .552
Note: Average parameter values are not the average of parameters obtained from participants’ data, they are rather obtained from the fits to the dataaveraged across participants.
A. Kılıç, I. Öztekin / Journal of Memory and Language 76 (2014) 158–173 165
strength effect such that participants were more likely toendorse a strong test item (M = .54, SD = .24) comparedwith a weak test (M = .42, SD = .28) item when perfor-mance is at chance, t(8) = 2.05, p = .04. As Fig. 4 shows,when participants were tested on weakly encoded lists,they were more likely to respond ‘‘no’’ compared withbeing tested on the strongly encoded lists.
The parameters of the best model (4k1–2k2–b–d) arepresented in Table 3. The best fitting parameter valuesshow the SBME in asymptotic HR and FAR, as k1 of strongHR was greater than k1 of weak HR and k1 of strong FARwas lower than the k1 of weak FAR. These findings suggestthat the total available memory strength that is used toendorse a target and to reject a foil increases simulta-neously as a function of encoding strength. The differencein the parameter estimate of k2 indicates a difference inprior bias across the strength conditions. For example, ifparticipants were not biased towards any of the responses,the asymptote at early retrieval when performance is atchance, k2 would be .5. That is because participants wouldequally respond ‘‘yes’’ and ‘‘no’’ when memory evidence isnot adequate to discriminate between targets and foils.However, k2 was .43 in the weak condition of the groupdata fit, indicating a tendency towards ‘‘no’’ response, as57% of the responses were ‘‘no’’. In the strong conditionof the group data fit, k2 was .53, showing that 53% of theresponses were ‘‘yes’’ (see Table 3).
In summary, strengthening a list of items increases thetotal availability of information in memory but does nothave a significant effect on the rate of information accrual.In addition to the SBME observed in asymptotic HR and
FAR, the results showed that participants had a tendencyto endorse probes in the strong lists, consistent with themore liberal starting point for the strong lists observed inthe diffusion model applications (Criss, 2010; Starns,Ratcliff, et al., 2012). If the SBME observed in strong listsis due to more conservative evidentiary bias as stated bythe criterion shift account, then these findings suggest con-tradictory effects of strengthening on the prior and the evi-dentiary bias. On the other hand, the differentiationaccount would not require such contradictory effectsbecause in the differentiation models, the SBME is causedby lower memory strength of strong foils rather thanmeta-cognitive processes. In the following experiment,strength was manipulated in a mixed-list paradigm inwhich the differentiation account does not predict theSBME. Different from Starns, Ratcliff (2012) study, partici-pants were not informed of the strength condition of thetest list-strength. Thus, participants were not expected toadopt a more conservative drift criterion prior to testing.The goal of Experiment 2 was to test whether tes strengthwould have an effect on prior bias while null effect wasexpected on the evidentiary bias. Another goal was toinvestigate whether deep encoding would have similarstrengthening effects as item repetition, which does notpredict the SBME when participants were not informed.
Experiment 2
In Experiment 2, strength was manipulated in a mixed-list paradigm in which only half of the study items were
166 A. Kılıç, I. Öztekin / Journal of Memory and Language 76 (2014) 158–173
strengthened via deep encoding. In half of the study-testcycles, only the strong targets were tested along with foils,and in the other half, only the weak targets were testedalong with foils. Different from the Starns, Ratcliff, et al.(2012) study, participants were not informed of thestrength condition at the beginning of the recognition task.In other words, participants were not given an explicitopportunity to change their strategy based on the strengthcondition of the test list before beginning the test phase.Thus, the drift criterion would not be expected to be differ-ent across strength conditions, as participants would notadopt different drift criterion. As mentioned earlier, differ-entiation of the foils in the strong condition would be sim-ilar to that of in the weak test lists, thus the SBME wouldnot be predicted if deep encoding strengthens memorysimilar to item repetition. One other important goal of thisexperiment was to investigate whether prior bias would beaffected even when the evidentiary bias was not expectedto be different across strength conditions.
Method
ParticipantsThirteen undergraduate students from Koç University
took part in experiment in exchange for monetarycompensation. Three participants dropped out of theexperiment after the first session and two participantsdid not comply with the instructions, thus their data werenot included in the subsequent analysis. Seven of theremaining 8 participants were female and only one of themwas left-handed.
Materials, procedure and designThe materials and the procedure of this experiment were
identical to those of Experiment 1. The only difference wasthat list-strength was manipulated only during test. Duringstudy, participants completed a pleasantness task for half ofthe items (70 words) as the strong condition and an ortho-graphic judgment task for the other half (70 words) as theweak condition. Later, in two of the study-test cycles, onlythe strong targets were tested along with foils (strong foils)and in the remaining two cycles, only the weak targets weretested along with foils (weak foils). As in Experiment 1,participants completed two sessions.
The experiment was a 2 (Strength) � 7 (Response Lag)within-subjects design. There were 40 responses for tar-gets and 40 responses for foils at each strength and lagcondition. Lag condition was assigned randomly withineach strength and test item type condition over the courseof testing. After the removed trials, the number ofresponses for each strength and item condition was35.93 (SD = 4.81), 38.00 (SD = 2.39), 38.90 (SD = 1.40),38.94 (SD = 1.58), 38.75 (SD = 1.07), 38.25 (SD = 1.13) and3753 (SD = 2.05) on average, for 60, 200, 300, 500, 800,1500 and 3000 ms response lag conditions respectively.
Results and discussion
AccuracyThe exponential function fit comparison values of the
group data are presented in Table 1. The list-strength effect
is best explained by the 2k–1b–1d model that allocatesseparate parameters for asymptotic accuracy and commonparameters for retrieval speed of the weak and the stronglist conditions (Fig. 3B). In order to assess the parameterconsistency across participants, the full model (2k–2b–2d) was fit to individual participants’ data. Parameter esti-mates derived from the individual model fits indicate thatasymptotic accuracy (k) is significantly greater for thestrong condition (M = 2.23, SD = 0.48) compared with theweak condition (M = 1.26, SD = 0.69), t(7) = 3.89, p < .01,supporting the conclusions derived from the model fitcomparisons of the averaged data. Consistent with the bestfitting model of the average data, the retrieval speedparameters (b and d) did not differ significantly acrosslist-strength conditions (1/b, t = 1.40; d, t = �1.22).Parameter values of the best fitting model to group dataand individual data are presented in Table 4.
Hit and false alarm analysisFig. 4B plots probability of endorsing a test item as a
function of total processing time for each strength condi-tion and item type (target vs. foil). A 7 (lag) � 2 (strength)repeated-measures ANOVA on HR showed a main effect ofstrength, F(1,7) = 25.25, p < .01, with HR increasing as afunction of strength. A main effect of lag indicates thatHR increased as a function of total processing time,F(6,42) = 14.04, p < .001. The interaction between list-strength and lag was not significant, suggesting that theHR of the strongly encoded items was greater than thatof the weakly encoded items even when the total process-ing time was relatively short (e.g. 0.5 s). FAR analysisindicated a different pattern: A 7 (lag) � 2 (strength)repeated-measures ANOVA on FAR did not reveal a maineffect of list-strength or a strength by lag interaction, buta significant main effect of lag, F(6,42) = 11.93, p < .001.That is, the FAR decreased as a function of total processingtime but the SBME was not observed, as the asymptotic FARwas comparable over the course of retrieval (see Table 5).
To further investigate the retrieval dynamics of HR andFAR, the exponential function defined in Eq. (3) was fittedin a nested-models routine with models ranging from12-parameter full model (4k1–2k2–4b–2d) model to 6parameter null model (3k1–k2–b–d). The model fit statisticssuggested that a 7-parameter asymptote-only model(3k1–2k2–b–d) explained the strength effect in a mixed-listparadigm. Similar to the results from Experiment 1, sepa-rate k1 parameters were required for asymptotic HR acrossthe two strength conditions. Statistical comparisons of theindividual parameter estimates supported the asymptoticHR in the strong condition (M = .86, SD = 0.13) was signifi-cantly greater than the asymptotic HR in the weak condi-tion (M = .58, SD = 0.15), t(7) = 5.52, p < .001. However,the strength effect on the asymptotic FAR failed to reachstatistical significance, t(7) = 0.90.
The model fit statistics favored the model that allocatesseparate asymptotes early in retrieval (k2), which indicatesa strength effect on the prior bias similar to the patternobserved in Experiment 1. The comparison of parameterestimates from the fits of individuals’ data also showedthat the asymptotic P(‘‘yes’’) at early retrieval was signifi-cantly greater for the strong condition (M = .53, SD = 0.19)
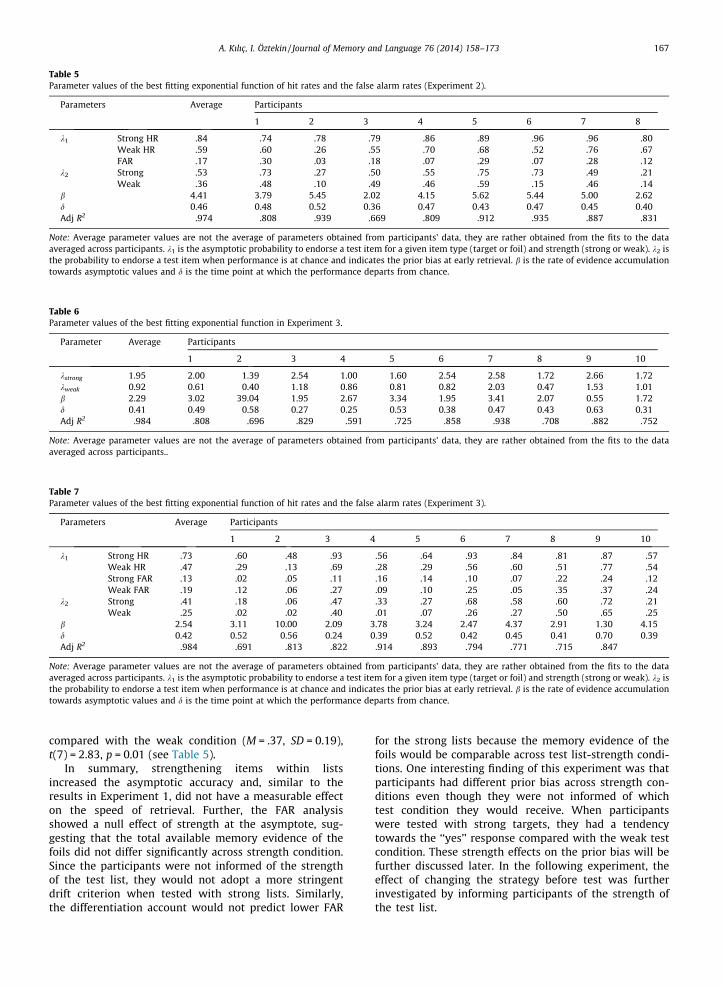
Table 5Parameter values of the best fitting exponential function of hit rates and the false alarm rates (Experiment 2).
Parameters Average Participants
1 2 3 4 5 6 7 8
k1 Strong HR .84 .74 .78 .79 .86 .89 .96 .96 .80Weak HR .59 .60 .26 .55 .70 .68 .52 .76 .67FAR .17 .30 .03 .18 .07 .29 .07 .28 .12
k2 Strong .53 .73 .27 .50 .55 .75 .73 .49 .21Weak .36 .48 .10 .49 .46 .59 .15 .46 .14
b 4.41 3.79 5.45 2.02 4.15 5.62 5.44 5.00 2.62d 0.46 0.48 0.52 0.36 0.47 0.43 0.47 0.45 0.40Adj R2 .974 .808 .939 .669 .809 .912 .935 .887 .831
Note: Average parameter values are not the average of parameters obtained from participants’ data, they are rather obtained from the fits to the dataaveraged across participants. k1 is the asymptotic probability to endorse a test item for a given item type (target or foil) and strength (strong or weak). k2 isthe probability to endorse a test item when performance is at chance and indicates the prior bias at early retrieval. b is the rate of evidence accumulationtowards asymptotic values and d is the time point at which the performance departs from chance.
Table 6Parameter values of the best fitting exponential function in Experiment 3.
Parameter Average Participants
1 2 3 4 5 6 7 8 9 10
kstrong 1.95 2.00 1.39 2.54 1.00 1.60 2.54 2.58 1.72 2.66 1.72kweak 0.92 0.61 0.40 1.18 0.86 0.81 0.82 2.03 0.47 1.53 1.01b 2.29 3.02 39.04 1.95 2.67 3.34 1.95 3.41 2.07 0.55 1.72d 0.41 0.49 0.58 0.27 0.25 0.53 0.38 0.47 0.43 0.63 0.31Adj R2 .984 .808 .696 .829 .591 .725 .858 .938 .708 .882 .752
Note: Average parameter values are not the average of parameters obtained from participants’ data, they are rather obtained from the fits to the dataaveraged across participants..
Table 7Parameter values of the best fitting exponential function of hit rates and the false alarm rates (Experiment 3).
Parameters Average Participants
1 2 3 4 5 6 7 8 9 10
k1 Strong HR .73 .60 .48 .93 .56 .64 .93 .84 .81 .87 .57Weak HR .47 .29 .13 .69 .28 .29 .56 .60 .51 .77 .54Strong FAR .13 .02 .05 .11 .16 .14 .10 .07 .22 .24 .12Weak FAR .19 .12 .06 .27 .09 .10 .25 .05 .35 .37 .24
k2 Strong .41 .18 .06 .47 .33 .27 .68 .58 .60 .72 .21Weak .25 .02 .02 .40 .01 .07 .26 .27 .50 .65 .25
b 2.54 3.11 10.00 2.09 3.78 3.24 2.47 4.37 2.91 1.30 4.15d 0.42 0.52 0.56 0.24 0.39 0.52 0.42 0.45 0.41 0.70 0.39Adj R2 .984 .691 .813 .822 .914 .893 .794 .771 .715 .847
Note: Average parameter values are not the average of parameters obtained from participants’ data, they are rather obtained from the fits to the dataaveraged across participants. k1 is the asymptotic probability to endorse a test item for a given item type (target or foil) and strength (strong or weak). k2 isthe probability to endorse a test item when performance is at chance and indicates the prior bias at early retrieval. b is the rate of evidence accumulationtowards asymptotic values and d is the time point at which the performance departs from chance.
A. Kılıç, I. Öztekin / Journal of Memory and Language 76 (2014) 158–173 167
compared with the weak condition (M = .37, SD = 0.19),t(7) = 2.83, p = 0.01 (see Table 5).
In summary, strengthening items within listsincreased the asymptotic accuracy and, similar to theresults in Experiment 1, did not have a measurable effecton the speed of retrieval. Further, the FAR analysisshowed a null effect of strength at the asymptote, sug-gesting that the total available memory evidence of thefoils did not differ significantly across strength condition.Since the participants were not informed of the strengthof the test list, they would not adopt a more stringentdrift criterion when tested with strong lists. Similarly,the differentiation account would not predict lower FAR
for the strong lists because the memory evidence of thefoils would be comparable across test list-strength condi-tions. One interesting finding of this experiment was thatparticipants had different prior bias across strength con-ditions even though they were not informed of whichtest condition they would receive. When participantswere tested with strong targets, they had a tendencytowards the ‘‘yes’’ response compared with the weak testcondition. These strength effects on the prior bias will befurther discussed later. In the following experiment, theeffect of changing the strategy before test was furtherinvestigated by informing participants of the strength ofthe test list.
168 A. Kılıç, I. Öztekin / Journal of Memory and Language 76 (2014) 158–173
Experiment 3
The aim of Experiment 3 was to test the effect ofinforming participants about the strength of the targetson the SBME in a mixed-list paradigm. If changing theresponse strategy causes the SBME, then informing partic-ipants would result in a decrease in the asymptotic FARcontrary to the findings in Experiment 2.
Method
ParticipantsFourteen undergraduate students from Koç University
took part in experiment in exchange for monetary com-pensation. Two participants dropped out of the experimentafter the first session and two participants did not complywith the instructions, thus their data were not included inthe subsequent analysis. Six of the remaining 10participants were male and all of the participants wereright-handed.
Materials, procedure and designThe materials and the procedure of this experiment
were identical to those of Experiment 2. The only differ-ence was that participants were informed of the strengthof the targets that they would be tested on before proceed-ing with the test list. For the weak test lists, participantswere instructed that they would only be tested on wordsfor which they had decided whether they contain the letter‘e’. For the strong test list, they were instructed that theywould be tested only on the words for which they hadmade a pleasantness judgment.
The experiment was a 2 (Strength) � 7 (Response Lag)within-subjects design. There were 40 responses for tar-gets and 40 responses for foils at each strength and lagcondition. Lag condition was assigned randomly withineach strength and test item type condition over the courseof testing. After the removed trials, the number ofresponses for each strength and item condition was37.55 (SD = 2.05), 38.80 (SD = 1.04), 39.32 (SD = 0.99),39.05 (SD = 1.17), 38.75 (SD = 1.67), 37.75 (SD = 2.00) and36.17 (SD = 2.66), on average, for 60, 200, 300, 500, 800,1500 and 3000 ms response lag conditions respectively.
Results and discussion
AccuracyGoodness of fit measures of the group data are pre-
sented in Table 1. The list-strength effect is best explainedby the 2k–1b–1d model that allocates separate parametersfor asymptotic accuracy and common parameters forretrieval speed of the weak and the strong list conditions(Fig. 3C). In order to assess the parameter consistencyacross participants, the full model (2k–2b–2d) was fit toindividual participants’ data. Parameter estimates derivedfrom the individual model fits indicate that asymptoticaccuracy (k) is significantly greater for the strong condition(M = 1.84, SD = 0.50) compared with the weak condition(M = 0.96, SD = 0.42), t(9) = 4.34, p < .01, consistent withthe model fit comparisons of the average data. Retrieval
speed parameters (b and d) also did not differ significantlyacross list-strength conditions (1/b, t = �0.04; d, t = �1.23).Parameter values of the best fitting model to group dataand individual data are presented in Table 6.
Hit and false alarm analysisFig. 4C plots the probability of endorsing a test item as a
function of total processing time for each strength condi-tion and item type (target vs. foil). A 7 (lag) � 2 (strength)repeated-measures ANOVA on HR showed a main effect ofstrength, F(1,9) = 46.87, p < .001, with HR increasing as afunction of strength. A main effect of lag indicates thatHR increased as a function of total processing time,F(6,54) = 22.47, p < .001. The list-strength by lag interac-tion was also significant, F(6,54) = 2.61, p = 0.03, indicatingan increase in the strength effect later at retrieval. A 7(lag) � 2 (strength) repeated-measures ANOVA on FARrevealed a main effect of lag F(6,54) = 7.72, p < .001, alongwith a strength by lag interaction, F(6,54) = 10.67, p < .001,but no main effect of list-strength. These results suggestthat FAR was lower for the weak condition early in retrie-val (e.g., until 600 ms), but later, this effect reversed suchthat the FAR became lower for the strong foils. However,this mirror effect was less effective (Lag 5, t = �0.42; Lag6, t = �1.95; Lag 7, t = �1.18). This strength by lag interac-tion on FAR might suggest that strengthening targets haveopposite effects over the course of retrieval. More specifi-cally, when participants were tested on strong targets, theytended to be more liberal prior to retrieval and later theyadopt a more stringent criterion when accumulatingevidence.
To further investigate the retrieval dynamics of HR andFAR, the exponential function defined in Eq. (3) was fittedin a nested-models routine with models ranging from12-parameter full model (4k1–2k2–4b–2d) model to 6parameter null model (3k1–k2–b–d). The model fit statisticssuggested that an 8-parameter asymptote-only model(4k1–2k2–b–d) explained the strength effect best in amixed-list paradigm where the participants were informedof the test list-strength. Similar to the results from previ-ous experiments, separate k1 parameters were requiredfor asymptotic HR across the two strength conditions. Sta-tistical comparisons of the individual parameter estimatessupported that the asymptotic HR in the strong condition(M = .75, SD = 0.18) was significantly greater than theasymptotic HR in the weak condition (M = .49, SD = 0.26),t(9) = 4.19, p < .01. Crucially, in contrast to results of Exper-iment 2, separate k1 parameters were also required forstrong and weak asymptotic FAR. The comparisons of k1
from the fits of the individuals’ data further supportedthe strength effect on the asymptotic FAR. The FAR of weakfoils (M = .19, SD = 0.13) was significantly greater than theFAR of strong foils (M = .12, SD = 0.07), t(9) = �2.22, p = .03.This finding indicates a SBME at asymptotic FAR in contrastto the null strength effect observed from the analysis onthe FAR. The k1 parameters of the FAR might represent atrend towards a SBME (see Table 7).
In order to investigate the prior bias, we next examinedhow strengthening affect asymptote at early retrieval (k2)that is the probability of endorsing the test item whenperformance is at chance. The model fit statistics favored
A. Kılıç, I. Öztekin / Journal of Memory and Language 76 (2014) 158–173 169
the model that allocates separate k2, which indicates astrength effect on the prior bias similar to the patternobserved in the previous experiments. The comparison ofparameter estimates from the fits of individuals’ data alsoshowed that the asymptotic p(‘‘yes’’) at early retrieval wassignificantly greater for the strong condition (M = .42,SD = 0.23) compared with the weak condition (M = .26,SD = 0.23), t(9) = 3.63, p < 0.01. Similar to the findings ofthe previous experiments, participants were less likely torespond with ‘‘yes’’ at a given accuracy level.
In summary, different from Experiment 2, the results ofExperiment 3 showed that information regarding thestrength condition of the test list created an opportunityfor the participants to adopt a different strategy to endorsetest probes. Considering the criterion shift account, theseresults suggest that strength has reverse effects on priorand evidentiary bias. When tested with strong targets, par-ticipants had a tendency towards the ‘‘yes’’ response earlyin retrieval. However, later in retrieval, this tendencybecomes more conservative, meaning that participantsrequire more evidence to endorse a test item. Differentia-tion models do not predict the SBME when items arestrengthened in a mixed-list paradigm in contrast to the cri-terion shift models. Thus, a trend for the SBME observed in amixed-list paradigm might suggest that the differentiationaccount is not necessary to explain the SBME observed ina pure-list paradigm. However, a comparison between thesize of the SBME might suggest that a combination of thedifferentiation and the criterion shift account explains thegreater SBME in the pure-list paradigm. In the followingexperiment, we tested this hypothesis by manipulatingstrength and study list condition in a single experimentand compared the SBME across the study list conditions.
Experiment 4
The goal of this experiment was to investigate the con-tribution of criterion shift and differentiation mechanismsin the list-strength effect observed in pure lists. In order toexamine the size of the SBME caused by these two mecha-nisms, a standard ‘‘yes/no’’ item recognition task wasadministered in a pure- and mixed-list paradigm. Partici-pants were randomly assigned to one of the list condition,but list strength was manipulated within participants. TheSBME observed after studying a mixed-list can only beattributed to the criterion shift account, as the differentia-tion account does not predict a SBME when the study list iscomposed of mixed strength items. On the other hand,both accounts predict a SBME when participants are testedon the pure-study paradigm. Accordingly, if the SBME inthe pure-list paradigm is due to both criterion shift and dif-ferentiation accounts, the size of the effect should begreater than the SBME observed in the mixed-list paradigmin which only the criterion shift predicts the SBME.
Method
ParticipantsFifty-six undergraduate students from Koç University
participated in the experiment in exchange for monetary
compensation. Participants were randomly assigned toeach of the study conditions in which targets werestrengthened in either pure or mixed lists. Twenty-nineparticipants were tested in the pure-list condition and 27participants were tested in the mixed-list condition.
Materials, procedure and designThe materials used in this experiment were identical to
the materials used in the previous experiments. The onlydifference from Experiment 1 and 3 was that reaction timewas measured rather than employing the response dead-line procedure. The design was a 2 (study condition) � 2(strength) mixed factorial, with study condition manipu-lated between subjects and item strength manipulatedwithin subjects. In the pure-list condition, participantswere presented with 140 words, 70 of which were targetsand the other 70 were fillers presented randomly. In 2 of 4study-test cycles, participants made a semantic judgmentto strongly encode the words and in the remaining 2cycles, participants made an orthographic judgment forshallow encoding. At test, participants were presentedwith targets along with 70 lures, and they were requiredto discriminate the targets from the lures. In the mixed-listcondition, participants were asked to make a semanticjudgment for 70 targets (strong) and an orthographic judg-ment for the remaining 70 words (weak). In 2 of 4 study-test cycles, only the strong targets were tested along with70 lures, and in the remaining 2 cycles, only the weak tar-gets were tested along with 70 lures. As in Experiment 3,participants were informed of the strength of the targetsthat they would be tested prior to the test in the mixed-listcondition.
Results and discussion
A 2 (study condition: pure and mixed) � 2 (strength:strong and weak) mixed factor repeated measures ANOVAwas conducted on d0, hit rates, and false alarm rates. Dis-criminability was significantly better for strong items(M = 2.19, SD = 0.79) compared to weak items (M = 0.94,SD = 0.39), F(1,54) = 196.72, p < .001, gp
2 = .785. Consistentwith the null list-strength effect in recognition memory(Ratcliff et al., 1990), the main effect of study conditionand the interaction between study condition and list-strength were unreliable. This confirms the finding thatdiscriminability did not depend on whether the targetswere strengthened within or across study lists.
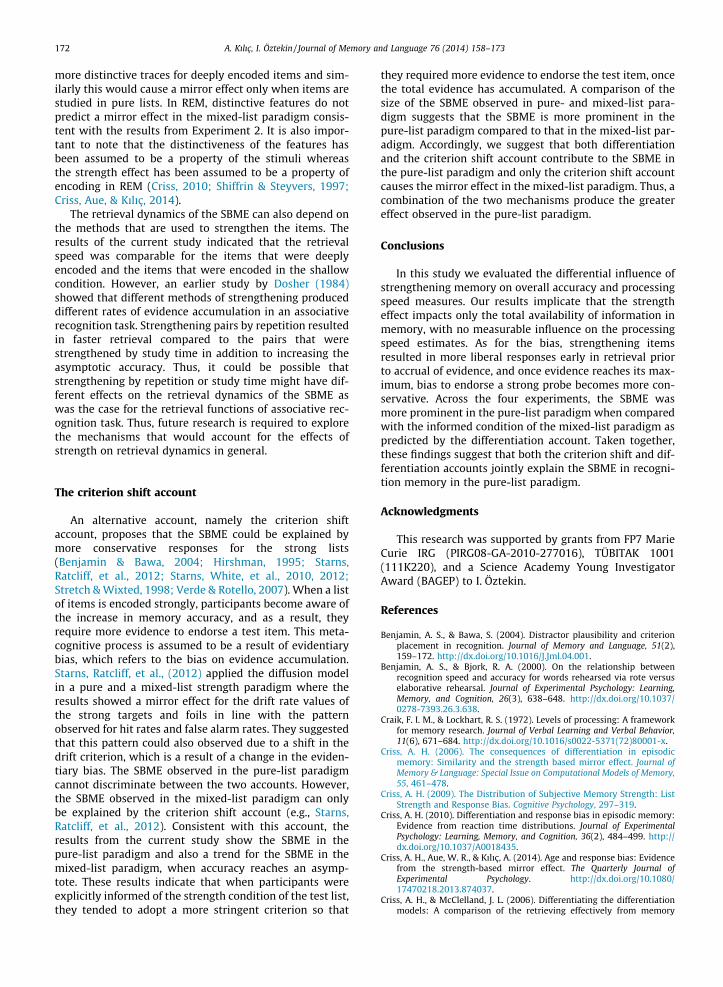
The effect of strengthening targets produced a mirroreffect in the pure condition but not when the target wordswere strengthened within study lists. Results from ANOVAconducted on hit rates revealed a significant main effect ofstrength, F(1,54) = 262.68, p < .001, gp
2 = .829, showing thatthe hit rates were greater for the strong items (M = .82,SD = 0.24) when compared to the weak items (M = .51,SD = 0.14). No other effects on hit rates were reliable. Weobserved that the false alarm rate for the strong foils(M = .15, SD = 0.12) were significantly lower than those ofweak foils (M = .21, SD = 0.12), F(1,54) = 16.92, p < .001,gp
2 = .239. Central to our main question, the interactionbetween test list strength and study condition was signifi-cant, F(1,54) = 7.12, p = .01, gp
2 = .117. This suggested that
170 A. Kılıç, I. Öztekin / Journal of Memory and Language 76 (2014) 158–173
the strength effect was more prominent in the pure listcondition (M = �.09, SD = 0.08), t(28) = �5.63, p < .001,whereas the false alarm rate did not differ significantlyacross foil strength when participants studied strong andweak targets in the same list (M = �.02, SD = 0.11),t(26) = �0.89. Fig. 5 presents the mean hit rate and themean false alarm rate as a function of strength and studycondition.
These results indicate that the SBME observed afterstudying a pure list is greater than the SBME observed ina mixed-list paradigm. We propose that both differentia-tion and criterion shift accounts contributed to the SBMEin the pure-list paradigm, while in the mixed-list para-digm, the SBME was observed only due to a more conser-vative criterion. Thus, the results from this experimentsupport the contribution of the differentiation mechanismin the pure-list paradigm.
General discussion
The current study examined the full time-course of howSBME unfolds during retrieval for both pure and mixed-listparadigm, and provided the first investigation of howstrengthening produces paradoxical effects on the twokinds of bias. To do so, a response-deadline speed-accuracytrade-off (SAT) procedure was employed in a list-strengthparadigm. The items were strengthened via a levels-of-processing approach both in pure- and mixed-study listparadigm. Overall, our data implicated that strengtheninga list of items increased the maximum level of accuracy,with no measurable impact on retrieval speed measures,either the rate of information accrual or when informationfirst starts to accrue during retrieval. Additional analyses ofthe retrieval functions of targets and foils revealed that thisenhancement in the maximum level of accuracy resultedfrom an increase in HR and a decrease in FAR in thepure-study list paradigm when performance saturates. Inthe mixed-list paradigm, the retrieval functions of foilsproduced different results depending on whether partici-pants received information regarding the strength of thetargets in the subsequent test list. Specifically, whenparticipants were informed of the test list-strength, the
Fig. 5. Hit rates and false alarm rates as a function of study condition.Pure condition refers the pure-list paradigm in which items are strength-ened across lists and mixed condition refers to the mixed-list paradigm inwhich items are strengthened within lists.
retrieval function of the foils preferred different asymptoteparameters for strong and weak FARs, whereas the actualFAR of the responses following the longer response dead-lines (e.g., 0.8–3 s) did not show a SBME. The asymptoticeffect in the retrieval functions could potentially character-ize a trend towards the SBME that was originally observedin Starns, Ratcliff, et al. (2012) data. However, an investiga-tion of the size of the SBME across study-list conditionsshows that the SBME in the pure-list paradigm is greaterthan the SBME in the mixed-list paradigm (cf. Starns,Ratcliff, et al., 2012). In line with the predictions of boththe differentiation and the criterion shift account, whenparticipants were not informed in the mixed-list paradigm,the asymptotic FAR was comparable across strength condi-tions. In addition to the implications regarding the theoret-ical explanation for the SBME, the results from the retrievalfunctions of HR and FAR indicate that strengthening a listof items produced reverse effects on the prior and the evi-dentiary bias. More specifically, participants were moreliberal prior to evidence accumulation but they set a moreconservative criterion to accumulate evidence in the strongtest lists. Below we discuss the theoretical implications ofthese findings.
Prior and evidentiary bias
In addition to providing unbiased measures of speedand accuracy, response-deadline procedure has facilitatedan empirical distinction between the two kinds of bias initem recognition, that is prior bias and evidentiary bias.Prior bias can be measured by the probability to endorsea probe earlier in retrieval when accuracy is at chance,while evidentiary bias is inferred from the mirror effectobserved in HR and FAR when accuracy reaches an asymp-tote. Data from the response-deadline experiments in thecurrent study reveal that testing only the strong targetscaused participants to become more liberal in theirresponses when performance is at chance. This indicatesthat participants have a tendency to endorse a test itemeven before evidence starts to accumulate. This tendencytowards the ‘‘yes’’ response has also been observed in theresults from the diffusion model applications, as the start-ing point of the evidence accumulation was found to becloser to the ‘‘yes’’ boundary in strong test lists (e.g.,Criss, 2010; Starns, Ratcliff, et al., 2012). The importantfinding from the response-deadline experiments is thatthis strength effect on the starting point is also observedwith an experimental manipulation.
One interesting finding of the current study is that theprior bias is also evident in Experiment 2, which was themixed-list paradigm when participants were not informedof the strength condition of the test lists. There could betwo possible explanations regarding this tendency towardsthe ‘‘yes’’ response in strong lists, namely the sequentialdependencies that are observed in recognition memory,and perceived strength of the test list. Malmberg andAnnis (2012) showed that hits were more likely to be fol-lowed by hits than misses, and false alarms were morelikely to be followed by false alarms than correct rejec-tions. Regarding the current study, the increase in the fre-
A. Kılıç, I. Öztekin / Journal of Memory and Language 76 (2014) 158–173 171
quency of ‘‘yes’’ responses in the strong lists might havecaused a momentum for the ‘‘yes’’ response when accuracywas at chance early in retrieval. In other words, beforeinformation started to accumulate, participants might haverepeated their previous response, which was more likely tobe ‘‘yes’’ because the overall probability of a ‘‘yes’’ responsewas greater in the strong test lists. Alternatively, this ten-dency for the ‘‘yes’’ response could have been due to theperceived strength of the test list. In other words, partici-pants might have recognized the strength of the test listeven without being explicitly informed and consequentlyadopted a more conservative criterion. However, this doesnot explain why only the prior bias but not the evidentiarybias was affected from this perceived strength in Experi-ment 2.
Evidence for the evidentiary bias arises from the SBMEobserved in the mixed-list paradigm. More specifically,when accuracy reached asymptote in the mixed-list para-digm the hit rate increased and the false alarm ratesdecreased, especially when participants were informed ofthe strength condition. Although this finding does notdirectly measure the evidentiary bias, as it is the criterionthat is set to moderate the amount of evidence that wouldbe required to endorse the probe, the fact that a mirroreffect is observed in a mixed-list paradigm suggests thatevidentiary bias contributes to the SBME. In other words,in line with the criterion shift account, a more conservativeevidentiary bias can explain the SBME observed when dif-ferentiation was controlled and participants wereinformed of the strength conditions.
The differentiation models
One potential mechanism that has been proposed toexplain the SBME is the differentiation models (Criss &McClelland, 2006; McClelland & Chappell, 1998; Shiffrin& Steyvers, 1997). According to these models, when itemsare strengthened during encoding, the foils become lesssimilar to the targets and thus, they become less confus-able at retrieval. That is achieved by updating the tracesof targets in memory when items are strongly encoded.Thus, strong targets will have more complete memorytraces and they will be more distinct from the foils at test.It has been suggested that the differentiation mechanism isin effect in other discrimination tasks (see Gibson &Gibson, 1955 for perceptual discrimination; seeWagenmakers et al., 2004 for lexical decision) and not par-ticular to item recognition.
In the Retrieving Effectively from Memory model (REM,Shiffrin & Steyvers, 1997), items are represented as vectorsof feature values that are drawn from the geometric distri-bution. The memory traces of the studied items are storedas vectors during encoding and these memory traces arenoisy such that some of the feature values are encodedincorrectly or not encoded at all. When a probe is pre-sented, it is compared to all of the traces in memory anda subjective likelihood is calculated for each comparisonwhich is later averaged across all of the traces in memory.If this average likelihood (odds value) exceeds a criterionas in the signal detection framework, the probe is
endorsed. Otherwise, it is rejected. When a list of items isstrengthened during encoding, the memory traces of thoseitems will be more complete as more feature values areencoded. Then, during test, foils will be less likely to matchwith the traces in memory and accordingly will producelower odds value, which will be manifested as a decreasein the FAR. Targets, on the other hand, will match betterwith the more complete traces in memory and the oddsvalue will be more likely to exceed the criterion, which willresult in an increase in the HR (e.g., Criss, 2006).
Although REM was originally developed for accuracymeasures, recent versions were adapted to account forreaction time data as well as full time-course retrievalfunctions derived from the response-deadline procedures(see Malmberg, 2008; Nobel & Shiffrin, 2001; see alsoWagenmakers et al., 2004 for an adaptation to lexical deci-sion). For example, Wagenmakers et al. (2004) interpretedthe activation of a probe feature to develop as an exponen-tial function of the total processing time, which wouldincrease monotonically with a rate and reach an asymptotewhen full activation is achieved. It is also possible that thefeatures of the memory traces rather than the features ofthe probe are activated over time (e.g., Malmberg, 2008).In either case, the memory performance increases overtime by increasing the similarity between the memorytraces and targets, and by decreasing the similaritybetween the memory traces and foils in an item recogni-tion task. Thus, the differentiation mechanism accountsfor the SBME by assuming more complete memory tracesfor strongly encoded items, and this would predict thestrength effect only at asymptote not on the speed ofretrieval.
The mirror effect observed with deep processing hasbeen recently explained due to differences in retrievalstrategy led by the differences in encoding mechanisms(Gallo et al., 2008; Scimeca et al., 2011). To be more spe-cific, when participants were instructed to be tested ononly deeply encoded items, they might have restrictedtheir search set to those items and thus, a mirror effectcould have been observed even in the mixed-list paradigm(cf. McDonough & Gallo, 2012). Such an explanationrequires encoding of context features along with item fea-tures (e.g., REM.4 in Shiffrin & Steyvers, 1997). In REM.4,the set of items that were encoded within a similar context(e.g. deep encoding) are first activated, later the globalmatch is determined between the probe and the activatedset of memory traces. Thus, this explanation can accountfor the SBME even in a mixed list paradigm where itemsare strengthened via a levels-of-processing task similar tothe studies reported by Gallo et al. (2008).
Alternatively, the mirror effect observed in a mixed-listparadigm after deep encoding could be explained by qual-itative factors, which enhance memory by encoding of dis-tinctive features (e.g., Gallo et al., 2008). Different fromstrengthening via repetition, encoding of qualitative fac-tors could be modeled by traces composed of distinctivefeatures rather than more complete memory traces. Thismechanism has been used to explain the word frequencymirror effects, which refers to greater HR and lower FARfor low frequency items (Criss, 2010; Shiffrin & Steyvers,1997). Thus, in a mixed-list paradigm, one could assume
172 A. Kılıç, I. Öztekin / Journal of Memory and Language 76 (2014) 158–173
more distinctive traces for deeply encoded items and sim-ilarly this would cause a mirror effect only when items arestudied in pure lists. In REM, distinctive features do notpredict a mirror effect in the mixed-list paradigm consis-tent with the results from Experiment 2. It is also impor-tant to note that the distinctiveness of the features hasbeen assumed to be a property of the stimuli whereasthe strength effect has been assumed to be a property ofencoding in REM (Criss, 2010; Shiffrin & Steyvers, 1997;Criss, Aue, & Kılıç, 2014).
The retrieval dynamics of the SBME can also depend onthe methods that are used to strengthen the items. Theresults of the current study indicated that the retrievalspeed was comparable for the items that were deeplyencoded and the items that were encoded in the shallowcondition. However, an earlier study by Dosher (1984)showed that different methods of strengthening produceddifferent rates of evidence accumulation in an associativerecognition task. Strengthening pairs by repetition resultedin faster retrieval compared to the pairs that werestrengthened by study time in addition to increasing theasymptotic accuracy. Thus, it could be possible thatstrengthening by repetition or study time might have dif-ferent effects on the retrieval dynamics of the SBME aswas the case for the retrieval functions of associative rec-ognition task. Thus, future research is required to explorethe mechanisms that would account for the effects ofstrength on retrieval dynamics in general.
The criterion shift account
An alternative account, namely the criterion shiftaccount, proposes that the SBME could be explained bymore conservative responses for the strong lists(Benjamin & Bawa, 2004; Hirshman, 1995; Starns,Ratcliff, et al., 2012; Starns, White, et al., 2010, 2012;Stretch & Wixted, 1998; Verde & Rotello, 2007). When a listof items is encoded strongly, participants become aware ofthe increase in memory accuracy, and as a result, theyrequire more evidence to endorse a test item. This meta-cognitive process is assumed to be a result of evidentiarybias, which refers to the bias on evidence accumulation.Starns, Ratcliff, et al., (2012) applied the diffusion modelin a pure and a mixed-list strength paradigm where theresults showed a mirror effect for the drift rate values ofthe strong targets and foils in line with the patternobserved for hit rates and false alarm rates. They suggestedthat this pattern could also observed due to a shift in thedrift criterion, which is a result of a change in the eviden-tiary bias. The SBME observed in the pure-list paradigmcannot discriminate between the two accounts. However,the SBME observed in the mixed-list paradigm can onlybe explained by the criterion shift account (e.g., Starns,Ratcliff, et al., 2012). Consistent with this account, theresults from the current study show the SBME in thepure-list paradigm and also a trend for the SBME in themixed-list paradigm, when accuracy reaches an asymp-tote. These results indicate that when participants wereexplicitly informed of the strength condition of the test list,they tended to adopt a more stringent criterion so that
they required more evidence to endorse the test item, oncethe total evidence has accumulated. A comparison of thesize of the SBME observed in pure- and mixed-list para-digm suggests that the SBME is more prominent in thepure-list paradigm compared to that in the mixed-list par-adigm. Accordingly, we suggest that both differentiationand the criterion shift account contribute to the SBME inthe pure-list paradigm and only the criterion shift accountcauses the mirror effect in the mixed-list paradigm. Thus, acombination of the two mechanisms produce the greatereffect observed in the pure-list paradigm.
Conclusions
In this study we evaluated the differential influence ofstrengthening memory on overall accuracy and processingspeed measures. Our results implicate that the strengtheffect impacts only the total availability of information inmemory, with no measurable influence on the processingspeed estimates. As for the bias, strengthening itemsresulted in more liberal responses early in retrieval priorto accrual of evidence, and once evidence reaches its max-imum, bias to endorse a strong probe becomes more con-servative. Across the four experiments, the SBME wasmore prominent in the pure-list paradigm when comparedwith the informed condition of the mixed-list paradigm aspredicted by the differentiation account. Taken together,these findings suggest that both the criterion shift and dif-ferentiation accounts jointly explain the SBME in recogni-tion memory in the pure-list paradigm.
Acknowledgments
This research was supported by grants from FP7 MarieCurie IRG (PIRG08-GA-2010-277016), TÜBITAK 1001(111K220), and a Science Academy Young InvestigatorAward (BAGEP) to I. Öztekin.
References
Benjamin, A. S., & Bawa, S. (2004). Distractor plausibility and criterionplacement in recognition. Journal of Memory and Language, 51(2),159–172. http://dx.doi.org/10.1016/J.Jml.04.001.
Benjamin, A. S., & Bjork, R. A. (2000). On the relationship betweenrecognition speed and accuracy for words rehearsed via rote versuselaborative rehearsal. Journal of Experimental Psychology: Learning,Memory, and Cognition, 26(3), 638–648. http://dx.doi.org/10.1037/0278-7393.26.3.638.
Craik, F. I. M., & Lockhart, R. S. (1972). Levels of processing: A frameworkfor memory research. Journal of Verbal Learning and Verbal Behavior,11(6), 671–684. http://dx.doi.org/10.1016/s0022-5371(72)80001-x.
Criss, A. H. (2006). The consequences of differentiation in episodicmemory: Similarity and the strength based mirror effect. Journal ofMemory & Language: Special Issue on Computational Models of Memory,55, 461–478.
Criss, A. H. (2009). The Distribution of Subjective Memory Strength: ListStrength and Response Bias. Cognitive Psychology, 297–319.
Criss, A. H. (2010). Differentiation and response bias in episodic memory:Evidence from reaction time distributions. Journal of ExperimentalPsychology: Learning, Memory, and Cognition, 36(2), 484–499. http://dx.doi.org/10.1037/A0018435.
Criss, A. H., Aue, W. R., & Kılıç, A. (2014). Age and response bias: Evidencefrom the strength-based mirror effect. The Quarterly Journal ofExperimental Psychology. http://dx.doi.org/10.1080/17470218.2013.874037.
Criss, A. H., & McClelland, J. L. (2006). Differentiating the differentiationmodels: A comparison of the retrieving effectively from memory
A. Kılıç, I. Öztekin / Journal of Memory and Language 76 (2014) 158–173 173
model (REM) and the subjective likelihood model (SLiM). Journal ofMemory and Language, 55(4), 447–460. http://dx.doi.org/10.1016/j.jml.2006.06.003.
Criss, A. H., Wheeler, M. E., & McClelland, J. L. (2013). A differentiationaccount of recognition memory: Evidence from fMRI. Journal ofCognitive Neuroscience, 25, 421–435. http://dx.doi.org/10.1162/jocn_a_00292.
Dosher, B. A. (1981). The effects of delay and interference: A speed-accuracy study. Cognitive Psychology, 13(4), 551–582. http://dx.doi.org/10.1016/0010-0285(81)90020-7.
Dosher, B. A. (1984). Degree of learning and retrieval speed: Study timeand multiple exposures. Journal of Experimental Psychology: Learning,Memory and Cognition, 10, 541–574.
Gallo, D. A., Meadow, N. G., Johnson, E. L., & Foster, K. T. (2008). Deeplevels of processing elicit a distinctiveness heuristic: Evidence fromthe criterial recollection task. Journal of Memory and Language, 58,1095–1111.
Gibson, J. J., & Gibson, E. J. (1955). Perceptual learning; differentiation orenrichment? Psychol Rev, 62(1), 32–41.
Glanzer, M., & Adams, J. K. (1985). The mirror effect in recognitionmemory. Memory & Cognition, 13(1), 8–20. http://dx.doi.org/10.3758/Bf03198438.
Gourevitch, V., & Galanter, E. (1967). A significance test for one parameterisosensitivity functions. Psychometrika, 32, 25–33.
Gronlund, S. D., & Ratcliff, R. (1989). Time course of item and associativeinformation: Implications for global memory models. Journal ofExperimental Psychology: Learning, Memory, and Cognition, 15(5),846–858. http://dx.doi.org/10.1037/0278-7393.15.5.846.
Hintzman, D. L., & Curran, T. (1994). Retrieval dynamics of recognitionand frequency judgments – evidence for separate processes offamiliarity and recall. Journal of Memory and Language, 33(1), 1–18.http://dx.doi.org/10.1006/Jmla.1994.1001.
Hirshman, E. (1995). Decision-processes in recognition memory: Criterionshifts and the lists-strength paradigm. Journal of ExperimentalPsychology: Learning, Memory, and Cognition, 21(2), 302–313. http://dx.doi.org/10.1037/0278-7393.21.2.302.
Jacoby, L. L., Shimizu, Y., Daniels, K. A., & Rhodes, M. G. (2005). Modes ofcognitive control in recognition and source memory: Depth ofretrieval. Psychonomic Bulletin & Review, 12(5), 852–857. http://dx.doi.org/10.3758/Bf03196776.
Jacoby, L. L., Shimizu, Y., Velanova, K., & Rhodes, M. G. (2005). Agedifferences in depth of retrieval: Memory for foils. Journal of Memoryand Language, 52(4), 493–504. http://dx.doi.org/10.1016/J.Jml.01.007.
Liu, C. C., & Smith, P. L. (2009). Comparing time-accuracy curves: Beyondgoodness-of-fit measures. Psychonomic Bulletin & Review, 16(1),190–203. http://dx.doi.org/10.3758/PBR.16.1.190.
Malmberg, K. J. (2008). Recognition memory: A review of the criticalfindings and an integrated theory for relating them. CognitivePsychology, 57(4), 335–384. http://dx.doi.org/10.1016/J.Cogpsych.02.004.
Malmberg, K. J., & Annis, J. (2012). On the Relationship between Memoryand Perception: Sequential dependencies in recognition testing.Journal of Experimental Psychology: General, 141(2), 233–259.
McClelland, J. L., & Chappell, M. (1998). Familiarity breeds differentiation:A subjective-likelihood approach to the effects of experience inrecognition memory. Psychological Review, 105(4), 724–760. http://dx.doi.org/10.1037/0033-295x.105.4.734-760.
McElree, B. (2006). Accessing recent events. Psychology of Learning andMotivation: Advances in Research and Theory, 46, 155–200. http://dx.doi.org/10.1016/S0079-7421(06)46005-9.
McElree, B., & Dosher, B. A. (1989). Serial position and set size in short-term-memory: The time course of recognition. Journal of ExperimentalPsychology: General, 118(4), 346–373. http://dx.doi.org/10.1037//0096-3445.118.4.346.
McElree, B., & Dosher, B. A. (1993). Serial retrieval-processes in the recoveryof order information. Journal of Experimental Psychology: General,122(3), 291–315. http://dx.doi.org/10.1037/0096-3445.122.3. 291.
Nobel, P. A., & Shiffrin, R. M. (2001). Retrieval processes in recognition andcued recall. Journal of Experimental Psychology: Learning, Memory, andCognition, 27(2), 384–413. http://dx.doi.org/10.1037//0278-7393.27.2.384.
Öztekin, I., Gungor, N. Z., & Badre, D. (2012). Impact of aging on thedynamics of memory retrieval: A time-course analysis. Journal ofMemory and Language, 67(2), 285–294. http://dx.doi.org/10.1016/j.jml.2012.05.003.
Öztekin, I., & McElree, B. (2007). Proactive interference slows recognitionby eliminating fast assessments of familiarity. Journal of Memory andLanguage, 57(1), 126–149. http://dx.doi.org/10.1016/j.jml.2006.08.011.
Öztekin, I., & McElree, B. (2010). Relationship between measures ofworking memory capacity and the time course of short-term memoryretrieval and interference resolution. Journal of ExperimentalPsychology: Learning Memory and Cognition, 36(2), 383–397. http://dx.doi.org/10.1037/A0018029.
R Core Team. (2012). R: A language and environment for statisticalcomputing. Vienna, Austria: R foundation for statistical computing.<http://www.R-project.org>.
Ratcliff, R. (1978). A theory of memory retrieval. Psychological Review,85(2), 59–108.
Ratcliff, R. (1985). Theoretical interpretations of speed and accuracyof positive and negative responses. Psychological Review, 92,212–225.
Ratcliff, R., Clark, S. E., & Shiffrin, R. M. (1990). List-strength effect: I. Dataand discussion. Journal of Experimental Psychology: Learning, Memory,and Cognition, 16(2), 163–178. http://dx.doi.org/10.1037//0278-7393.16.2.163.
Ratcliff, R., & Tuerlinckx, F. (2002). Estimating parameters of the diffusionmodel: Approaches to dealing with contaminant reaction times andparameter variability. Psychonomic Bulletin and Review, 9, 438–481.
Shiffrin, R. M., & Steyvers, M. (1997). Model for recognition memory: REM– Retrieving effectively from memory. Psychonomic Bulletin & Review,4(2), 145–166. http://dx.doi.org/10.3758/Bf03209391.
Snodgrass, J. G., & Corwin, J. (1988). Pragmatics of measuring recognitionmemory: Applications to dementia and amnesia. Journal ofExperimental Psychology: General, 117, 34–50.
Starns, J. J., Ratcliff, R., & White, C. N. (2012). Diffusion model drift ratescan be influenced by decision processes: An analysis of the strength-based mirror effect. Journal of Experimental Psychology: Learning,Memory, and Cognition, 38(5), 1137–1151. http://dx.doi.org/10.1037/A0028151.
Starns, J. J., White, C. N., & Ratcliff, R. (2010). A direct test of thedifferentiation mechanism: REM, BCDMEM, and the strength-basedmirror effect in recognition memory. Journal of Memory and Language,63(1), 18–34. http://dx.doi.org/10.1016/j.jml.2010.03.004.
Starns, J. J., White, C. N., & Ratcliff, R. (2012). The strength-based mirroreffect in subjective strength ratings: The evidence for differentiationcan be produced without differentiation. Memory & Cognition, 40(8),1189–1199. http://dx.doi.org/10.3758/s13421-012-0225-1.
Stretch, V., & Wixted, J. T. (1998). On the difference between strength-based and frequency-based mirror effects in recognition memory.Journal of Experimental Psychology: Learning, Memory, and Cognition,24(6), 1379–1396. http://dx.doi.org/10.1037//0278-7393.24.6.1379.
Tekcan, A. I., & Göz, I. (2005). Türkçe Kelime Normları (Turkish word norms).Istanbul: Bogazici Universitesi Yayinevi.
Verde, M. F., & Rotello, C. M. (2007). Memory strength and the decisionprocess in recognition memory. Memory & Cognition, 35(2), 254–262.http://dx.doi.org/10.3758/Bf03193446.
Wagenmakers, E. J., Steyvers, M., Raaijmakers, J. G. W., Shiffrin, R. M., vanRijn, H., & Zeelenberg, R. (2004). A model for evidence accumulationin the lexical decision task. Cognitive Psychology, 48(3), 332–367.http://dx.doi.org/10.1016/J.Cogpsych.08.001.
Wickelgren, W. A. (1977). Speed-accuracy tradeoff and informationprocessing dynamics. Acta Psychologica, 41(1), 67–85. http://dx.doi.org/10.1016/0001-6918(77)90012-9.