Embed Size (px)
Citation preview

© Transamerica Institute®, 2019
Retirement Security Amid COVID-19: The Outlook of Three Generations
20th Annual Transamerica Retirement Survey of Workers
May 2020
© 2020 Transamerica Institute®

Table of Contents
Introduction
About the Authors Page 3
About Transamerica Center for Retirement Studies® Page 4
About the Survey Page 5
Methodology: 20th Annual Transamerica Retirement Survey of Workers Page 6
Methodology: April 2020 Supplemental Survey Page 7
Terminology Page 8
Acknowledgements Page 9
Retirement Security Amid COVID-19: The Outlook of Three Generations
Key Highlights Page 10
Recommendations Page 32
Detailed Findings Page 35
― A Portrait of Three Generations Page 36
― COVID-19: Impact on Work, Finances, and Retirement Page 39
― Workers’ Fragile Financial Well-Being Page 50
― Visions and Expectations of Retirement Page 62
― Retirement Savings, Planning, and Preparations Page 79
― The Vital Role of Employers in Helping Workers Save and Prepare for Older Age Page 100
― Happiness and Healthy Aging Page 121
Appendix Page 131
― In Their Own Words Page 132
― Demographics by Generation Page 138
2

Catherine Collinson serves as CEO and president of Transamerica Institute®, a nonprofit private foundation which includes
Transamerica Center for Retirement Studies®. She is a champion for Americans who are at risk of not achieving a financially
secure retirement. Catherine oversees all research, publications, and outreach initiatives, including the Annual Transamerica
Retirement Survey. In 2015, Catherine was also named executive director of the Aegon Center for Longevity and Retirement.
With two decades of retirement services experience, Catherine has become a nationally recognized voice on retirement trends for
the industry. She has testified before Congress on matters related to employer-sponsored retirement plans among small
business, which featured the need to raise awareness of the Saver’s Credit among those who would benefit most from the
important tax credit.
In 2018, Catherine was named an Influencer in Aging by PBS’ Next Avenue. In 2016, she was honored with a Hero Award from the
Women’s Institute for a Secure Retirement (WISER) for her tireless efforts in helping improve retirement security among women.
Catherine serves on the Advisory Board of the Milken Institute’s Center for the Future of Aging. She co-hosts the ClearPath: Your
Roadmap to Health & Wealth radio show on Baltimore’s WYPR, an NPR news station.
Catherine is employed by Transamerica Corporation. Since joining the organization in 1995, she has held a number of positions
with responsibilities including the incorporation of Transamerica Center for Retirement Studies as a nonprofit private foundation
in 2007 and its expansion into Transamerica Institute in 2013, as well as the creation of the Aegon Center for Longevity and
Retirement in 2015.
Patti Rowey serves as vice president of Transamerica Institute. She is retirement and market trends expert and helps manage
and execute all research initiatives, including the Annual Transamerica Retirement Survey. Patti has more than 20 years of
retirement services experience, specializing in market research covering a broad range of stakeholders, including retirement plan
participants and sponsors, financial advisors, and retirees. She is employed by Transamerica Corporation.
Heidi Cho is a senior research content analyst for Transamerica Institute. She began her career as an intern at Transamerica
Center for Retirement Studies in 2012. She joined the organization full time in 2014 upon graduating from the University of
Southern California. She is employed by Transamerica Corporation.
About the Authors
3

• Transamerica Center for Retirement Studies® (TCRS) is a division of Transamerica Institute® (The
Institute), a nonprofit, private foundation. TCRS is dedicated to educating the public on emerging trends
surrounding retirement security in the United States. Its research emphasizes employer-sponsored
retirement plans, including companies and their employees, retirees, and the implications of legislative
and regulatory changes. For more information about TCRS, please refer to www.transamericacenter.org.
• The Institute is funded by contributions from Transamerica Life Insurance Company and its affiliates, and
may receive funds from unaffiliated third parties.
• TCRS and its representatives cannot give ERISA, tax, investment, or legal advice. This material is
provided for informational purposes only and should not be construed as ERISA, tax, investment, or legal
advice. Interested parties must consult and rely solely upon their own independent advisors regarding
their particular situation and the concepts presented here.
• Although care has been taken in preparing this material and presenting it accurately, TCRS disclaims any
express or implied warranty as to the accuracy of any material contained herein and any liability with
respect to it.
About Transamerica Center for Retirement Studies®
4

About the Survey
• Since 1998, Transamerica Center for Retirement Studies® (TCRS) has conducted a national survey of
U.S. business employers and workers regarding their attitudes toward retirement. The overall goals for
the study are to illuminate emerging trends, promote awareness, and help educate the public. It has
grown to be one of the longest running and largest national surveys of its kind.
5

Methodology: 20th Annual Transamerica Retirement Survey of Workers
• The analysis contained in this report was prepared internally by the research team at Transamerica Center for Retirement Studies® (TCRS).
• A 29-minute, online survey was conducted from November 6 to December 27, 2019 among a nationally representative sample of 5,277 workers by The Harris Poll on behalf of TCRS. Respondents met the following criteria:
- U.S. residents, age 18 or older
- Full- or part-time workers in a for-profit company employing one (1) or more employees
• The base includes:
- 2,418 Millennial workers
- 1,424 Generation X workers
- 1,287 Baby Boomer workers
- 64 Generation Z workers (born 2001 or later), and 84 Mature workers (born prior to 1946). Due to the small base sizes of these groups, they are not included in the generation comparisons in this report.
• Data were weighted as follows:
- Census data were referenced for education, age by gender, race/ethnicity, region, household income, and number of employees by company size. Results were weighted where necessary to bring them into line with the population of U.S. residents age 18+, employed full- or part-time in a for-profit company with one (1) or more employees.
- The weighting also adjusts for attitudinal and behavioral differences between those who are online versus those who are not, those who join online panels versus those who do not, and those who respond to surveys versus those who do not.
• Percentages are rounded to the nearest whole percent. This report focuses on full- and part-time workers combined.
6
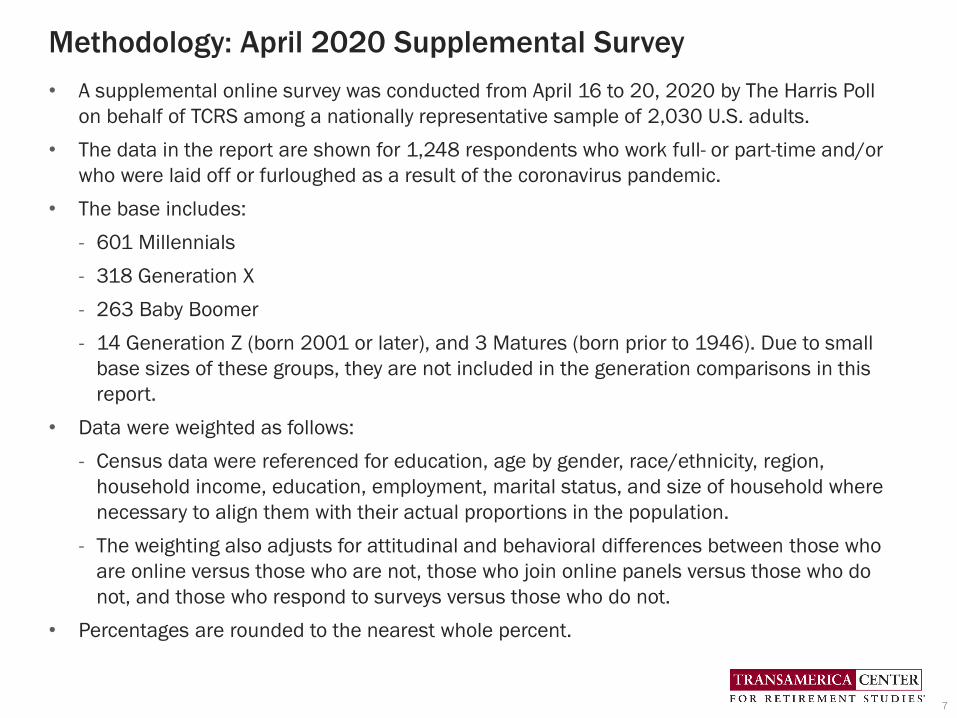
Methodology: April 2020 Supplemental Survey
• A supplemental online survey was conducted from April 16 to 20, 2020 by The Harris Poll
on behalf of TCRS among a nationally representative sample of 2,030 U.S. adults.
• The data in the report are shown for 1,248 respondents who work full- or part-time and/or
who were laid off or furloughed as a result of the coronavirus pandemic.
• The base includes:
- 601 Millennials
- 318 Generation X
- 263 Baby Boomer
- 14 Generation Z (born 2001 or later), and 3 Matures (born prior to 1946). Due to small
base sizes of these groups, they are not included in the generation comparisons in this
report.
• Data were weighted as follows:
- Census data were referenced for education, age by gender, race/ethnicity, region,
household income, education, employment, marital status, and size of household where
necessary to align them with their actual proportions in the population.
- The weighting also adjusts for attitudinal and behavioral differences between those who
are online versus those who are not, those who join online panels versus those who do
not, and those who respond to surveys versus those who do not.
• Percentages are rounded to the nearest whole percent.
7

Terminology
This report uses the following terminology:
Generation
Millennial: Born 1979 - 2000
Generation X: Born 1965 - 1978
Baby Boomer: Born 1946 - 1964
All Workers
For both surveys this refers to all workers age 18 and older, including Generation Z (born 2001
or later) and Matures (born prior to 1946).
8
Acknowledgements
9
Kelly Allsup
Kent Callahan
Sean Cassidy
Heidi Cho
Wonjoon Cho
Catherine Collinson
Phil Eckman
Steve Eichmann
Kristin Elia
Lard Friese
Michelle Gosney
David Hopewell
Anthony Huguet
Elizabeth Jackson
Frank Sottosanti
Ashlee Vogt
Patti Vogt Rowey
Mihaela Vincze
Holly Waters
Steven Weinberg
Christopher Wells
Hank Williams
Alex Wynaendts
David Krane
Emily Lauder
Bryan Mayaen
Jaclyn Mora
Mark Mullin
Jay Orlandi
Kerry Paredes
Aaron Parker
Maurice Perkins
Jamie Poston
Julie Quinlan
David Schulz
Laura Scully
Brittany Sell

Key Highlights
Retirement Security Amid COVID-19: The Outlook of Three
Generations examines the retirement outlook of Millennials,
Generation X, and Baby Boomers. It is based on findings from
the 20th Annual Transamerica Retirement Survey, one of the
largest and longest running surveys of its kind, which comprises
a survey conducted in late 2019 and comparisons from a
supplemental survey in April 2020, after several states issued
stay-at-home orders and large segments of the U.S. economy
had temporarily closed due to the pandemic.
Workers across generations are at risk of not achieving a
financially secure retirement — an issue of major concern long
before the coronavirus pandemic. Now, the negative economic
effects of the pandemic are further threatening retirement
savings and security. The long-term implications of the
coronavirus pandemic and recession on retirement security have
yet to be fully realized. However, the financial vulnerabilities
among workers across all generations are becoming clear.
10

Key Highlights
A Portrait of Three Generations
The retirement landscape has been evolving as a result of increases in longevity, the dynamic nature of the workforce and
employment trends, the transformation of employer-sponsored retirement benefits, and potential reforms to Social Security
benefits. The pace of change is such that the many underlying retirement planning-related expectations and assumptions differ
among generations currently in the workforce.
• Millennials (born 1979 - 2000) are a generation of digital natives and do-it-yourself retirement savers. Millennials were
entering the workforce around the time of the Great Recession — with higher levels of student debt than previous
generations. As retirement investors, they began saving in a depressed market and have enjoyed one of the longest-running
bull markets in history. The coronavirus pandemic and 2020 recession marks the first major market downturn they have
experienced. Unlike their parents’ generation, many Millennials expect their primary source of retirement income to be self-
funded through retirement accounts (e.g., 401(k)s, 403(b)s, IRAs), or other savings and investments. Most are concerned
that Social Security will not be there for them when they are ready to retire.
• Generation X (born 1964 to 1978) entered the workforce in the late 1980s just as 401(k) plans were making their first
appearance and defined benefit plans were beginning to disappear. Generation X workers are the first generation to have
access to 401(k) plans for the majority of their working careers. Most are saving for retirement, but many are behind on
their savings. The oldest Generation Xers are now in their mid-50s and the youngest are in their early 40s. Although they are
in their sandwich years, during which they may be juggling their careers with raising children and caring for aging parents,
there is no time like the present for them to fully engage in building long-term financial plans.
• Baby Boomers (born 1946 to 1964) are the generation that has re-written societal rules at every stage of their lives. Now,
they are redefining “retirement” for themselves and generations to follow. Many were already mid-career when the
retirement landscape shifted from defined benefit plans to 401(k) or similar plans. They have not had a time horizon of 40-
plus years to save in 401(k)s. Many were hit hard during the Great Recession and now the pandemic. Unlike younger
generations, they have less time to financially recover before they retire. Baby Boomer workers are planning to work to older
ages than previous generations, yet few have a backup plan if forced into retirement unexpectedly. Amid the pandemic, they
face greater health and employment-related risks than younger generations.
One thing workers of all generations share is that many are at risk of not achieving a financially secure retirement, an area of
concern long before the onset of the pandemic. With an unprecedented public health crisis, a major economic downturn, steep
declines in the financial markets, and widespread unemployment, the retirement risks faced by workers are now greater than
ever before.
11

Key Highlights
COVID-19: Impact on Work, Finances, and Retirement
The long-term implications of the COVID-19 pandemic and recession on retirement security have yet to be fully realized.
The supplemental survey in April 2020 illustrates widespread vulnerabilities among workers across all generations.
• Retirement Confidence Is Changing. Almost one in four workers (23 percent) say their confidence in their ability to
retire comfortably has declined in light of the pandemic. Across generations, the decline in retirement confidence
increases with age: Millennials (20 percent), Generation X (25 percent), and Baby Boomers (32 percent). Fifty-three
percent of workers say their retirement confidence remains unchanged, while 13 percent said it has improved and 11
percent answered “don’t know/not sure.”
• Workers’ Employment Has Been Impacted. As a result of the coronavirus pandemic, almost six in 10 workers (58
percent) say that they have experienced an impact(s) to their employment situation, including three in 10 who cite
reduced work hours (29 percent). Other impacts include: reduced salary (17 percent), laid off (16 percent), furloughed
(11 percent), and retired early (5 percent).
• Employment Impact Varies Somewhat by Generation. Workers across generations are experiencing impacts to their
employment situation as a result of the coronavirus pandemic, including: Millennials (59 percent), Generation X (53
percent), and Baby Boomers (58 percent). Millennials (18 percent) are somewhat more likely than Generation X and
Baby Boomers (both 13 percent) to have been laid off. However, Baby Boomers (16 percent) are somewhat more
likely to have been furloughed than Generation X (8 percent) and Millennials (11 percent). Of the three generations,
Generation X (39 percent) are somewhat more likely to say that their work has not been impacted by the pandemic,
compared with Millennials (29 percent) and Baby Boomers (32 percent).
• Sources of Funds If Finances Are Negatively Impacted. When asked what sources of funds they have used or would
use if their finances have been or would be negatively impacted by the coronavirus pandemic, the most frequently
cited source is savings (56 percent). Other sources include: credit cards (29 percent), unemployment benefits (26
percent), and CARES Act stimulus money (24 percent). One in six workers cite reliance on a significant other’s or
spouse’s income (16 percent), withdrawal from a retirement account (14 percent), and loan from a friend or family
member (10 percent).
12

Key Highlights
COVID-19: Impact on Work, Finances, and Retirement (cont.)
• Sources of Funds by Generation. When asked what sources of funds they have used or would use if their finances have
been or would be negatively impacted by the coronavirus pandemic, workers across generations cite reliance on similar
sources of funds. Savings is the most frequently cited source across generations, including Generation X (60 percent),
Millennials (53 percent), and Baby Boomers (52 percent). Approximately three in 10 expect to rely on credit cards
(Millennials -- 31 percent, Generation X -- 29 percent, Baby Boomers -- 27 percent). Just over one in four expect to rely on
unemployment benefits (Millennials and Generation X – both 26 percent, Baby Boomers – 30 percent). With regard to
CARES Act stimulus money, Baby Boomers (31 percent) are somewhat more likely than Millennials and Generation X (24
percent, 23 percent respectively) to rely on it.
• Seven in 10 Are Saving for Retirement. Seven in 10 workers are currently saving for retirement through their current/former
employer’s retirement plan and/or outside the workplace. Millennials (72 percent) and Generation X (74 percent) are
somewhat more likely than Baby Boomers (70 percent) to be saving for retirement. Retirement savings in their current
employer’s 401(k), 403(b), or similar plan is more frequently cited by Generation X (57 percent) than by Millennials (49
percent) and Baby Boomers (43 percent). Retirement savings outside the workplace tend to increase with age: Millennials
(22 percent), Generation X (31 percent), and Baby Boomers (44 percent). Across generations, approximately one in 10 are
also currently saving in a former employer’s 401(k), 403(b), or similar plan.
• Dipping Into Retirement Savings. Workers are feeling the financial squeeze as a result of the pandemic, and some are
dipping or planning to dip into their retirement savings. One in five workers (22 percent) have already and/or plan to take a
loan and/or withdrawal from their 401(k), 403(b), or similar plan, including 15 percent who have already done so and 13
percent who plan to do so.
• Millennials Are Dipping Into Retirement Accounts. Millennials are more likely than older generations to be dipping into their
retirement savings. One in three Millennial workers (33 percent) have already and/or plan to take a loan and/or withdrawal
from their 401(k), 403(b), or similar plan, including 22 percent who have already done so and 20 percent who plan to do so.
By comparison, only 15 percent of Generation X and 10 percent of Baby Boomer workers have already done so and/or plan
to do so. A noteworthy 17 percent of Baby Boomers are “not sure.”
• Familiarity With CARES Act Retirement Provisions. Signed into law on March 27, 2020, the Coronavirus Aid, Relief, and
Economic Security Act (CARES Act) is the largest stimulus package in U.S. history with provisions spanning healthcare, small
businesses, student loans, and retirement plans. Workers’ level of familiarity with the Act’s provisions related to qualified
retirement accounts is relatively low. Only 17 percent of workers are “very familiar” with these provisions, including 18
percent of Millennials, 20 percent of Generation X, and 10 percent of Baby Boomers.
13

Key Highlights
COVID-19: Impact on Work, Finances, and Retirement (cont.)
The pandemic has already proven to be a major financial setback for workers who are facing unemployment, furloughs, reductions
in work hours, and pay cuts. In order to stay afloat, many workers will likely begin to draw down savings, increase credit card debt,
and/or dip into retirement accounts. Whether the COVID-19 recession is prolonged or short, the recovery among those effected
will depend on their ability to maintain meaningful employment, and rebuild short-term savings and long-term retirement
investments.
Workers’ Fragile Financial Well-Being
Prior to the pandemic, healthcare, education, and housing costs had been soaring for years, but real wages had not caught up.
Millions of Americans were already facing strong financial headwinds. Many had not yet recovered from the Great Recession and
its aftereffects. Before and even more so during the pandemic, many are confronted with short-term needs and paying off debt,
which may take precedence over saving for retirement.
• Many Have Not yet Fully Recovered From the Great Recession. In late 2019, before the onset of the pandemic, many workers
said they are still financially recovering from the Great Recession. Fewer than half (47 percent) indicate that they either had
fully recovered (26 percent) or were not impacted (21 percent). Thirty-two percent say they had somewhat recovered, 14
percent had not yet begun to recover, and seven percent feel they may never recover. The status of financial recovery from
the Great Recession varies by generation. Baby Boomer workers (50 percent) are most likely to indicate they have fully
recovered or were not impacted, followed by 48 percent of Millennials and 44 percent of Generation X.
• Most Say They Will Have a Much Harder Time Than Their Parents. Three in four workers (76 percent) agree with the
statement, “Compared to my parents’ generation, people in my generation will have a much harder time in achieving financial
security,” including 36 percent who “strongly agree” and 40 percent who “somewhat agree.” Millennials (77 percent) and
Generation X (80 percent) are more likely to agree with this statement than Baby Boomers (73 percent).
• Workers Face Competing Financial Priorities. Workers face competing financial priorities that make it challenging to save for
retirement in the best of times. Amid the COVID-19 recession, the percentage of workers who cite “saving for retirement” as a
financial priority declined from 54 percent before the pandemic to 45 percent, while those citing “building emergency
savings” slightly increased from 37 percent to 39 percent. To a greater or lesser extent, these shifts occurred among workers
across generations. Before and during the pandemic, the majority of workers across generations cite “paying off some form of
debt” as a financial priority. Approximately three in 10 are “just getting by to cover basic living expenses.”
14

Key Highlights
Workers’ Fragile Financial Well-Being (cont.)
• Workers’ Greatest Financial Priority Varies by Generation. Before the pandemic, workers most often cited saving for
retirement (22 percent) as their “greatest financial priority right now,” with Baby Boomers (40 percent) and Generation X
(23 percent) being more likely to do so than Millennials (11 percent). Amid the pandemic, it continues to be most often cited
by Baby Boomers (32 percent) and Generation X (20 percent). Before and during the pandemic, Millennials’ most often
cited top priority is “just getting by to cover basic living expenses” (18 percent, 16 percent respectively). Amid the pandemic,
more workers across generations cite building emergency savings as their top priority.
• Household Debt Is Pervasive Across Generations. Four in five workers (82 percent) carry some form of debt including Baby
Boomers (75 percent), Millennials and Generation X (both 85 percent). The most often cited forms of debt include: credit
cards that are carrying a balance (45 percent), mortgages (37 percent), and car loans (36 percent). Across generations,
Generation X is significantly more likely to be carrying credit card debt (52 percent), while Millennials are more likely to have
student loans (26 percent). Baby Boomers are more likely to indicate that they are debt-free (25 percent).
• Emergency Savings Are Alarmingly Low. Having emergency savings to cover unexpected major financial setbacks, such as
unemployment, medical bills, home repairs, auto repairs, and other, could help workers avoid dipping into their retirement
savings. However, workers have only $5,000 (median) in emergency savings, with 29 percent reporting less than $5,000.
Emergency savings increase with age: Millennial workers have saved $3,000, Generation X has saved $5,000 and Baby
Boomers have saved $15,000 (medians).
• Leakage From Retirement Accounts Is Not Uncommon. A concerning percentage of workers are dipping into their retirement
savings before they retire. This “leakage” from retirement accounts in the form of loans and withdrawals can severely inhibit
the growth of participants’ long-term retirement savings. Before the pandemic, almost one in three workers (32 percent)
said they have taken some form of loan, early withdrawal, and/or hardship withdrawal from a 401(k) or similar plan, or IRA.
Millennials (36 percent) are somewhat more likely to have taken a loan and/or withdrawal. Generation X (33 percent) are
slightly less likely. Baby Boomers (23 percent) are significantly less likely. Workers’ frequency of taking loans (21 percent) is
similar to that of taking an early and/or hardship withdrawal (22 percent).
• Paying off Debt Tops the List of Reasons for Taking 401(k) Loans. Among those who have taken a loan from their 401(k) or
similar plan, the most frequently cited reason for doing so is to pay off debt (38 percent), including credit card debt (26
percent) and/or other debt (21 percent). Other reasons include a financial emergency (29 percent), medical bills (22
percent), and home improvements (21 percent). Millennials (42 percent) and Generation X (38 percent) are somewhat
more likely to cite paying off debt than Baby Boomers (27 percent). Compared with older generations, Millennials are
significantly more likely to cite taking a loan to purchase a vehicle (25 percent) and to avoid eviction (17 percent).
15

Key Highlights
Workers’ Fragile Financial Well-Being (cont.)
• Reasons for Hardship Withdrawals from 401(k)s. Among those who have taken a hardship withdrawal from a 401(k) or
similar plan, almost one in five workers (19 percent) say their primary reason is payment for certain medical expenses.
Baby Boomers (46 percent) are much more likely to indicate this than Generation X (17 percent) and Millennials (16
percent). Other primary reasons for taking hardship withdrawals include payment of tuition and related educational fees
(18 percent), expenses and losses incurred due to a disaster (18 percent), and payments to prevent eviction (15 percent).
Note: The findings for the generations reflect small sample bases and should be considered directional.
• One-Third of Workers Are and/or Have Been Caregivers. Caregiving for a family member or loved one can put the
caregiver’s own health, employment, and financial situation at risk. Thirty-five percent of workers have served as a
caregiver during the course of their working careers, including 19 percent who have been a caregiver in the past and 18
percent who are currently caregivers. Millennials (38 percent) and Generation X (36 percent) are more likely than Baby
Boomers (30 percent) to be and/or have been caregivers.
• Nearly Nine in 10 Caregivers Made Work Adjustments. Among workers who are serving and/or have served as caregivers,
87 percent have made some sort of adjustment to their work situation as a result of becoming a caregiver (e.g., used
vacation days, missed days of work, reduced hours, began working an alternative schedule, etc.). Millennials (90 percent)
and Generation X (89 percent) are significantly more likely to have made adjustments compared with Baby Boomers (76
percent).
In addition to facing formidable competing financial priorities before and during the pandemic, many workers will be called
upon to be unpaid caregivers for an aging parent(s) or loved one. Moreover, many workers are now taking on more intense
parenting responsibilities with respect to child care and home schooling. Whether caring for an aging parent or attending to a
child, doing so can put workers’ financial position at risk if they encounter any negative impacts to their employment situation,
earning power, or ability to save for retirement. (Transamerica Institute’s 2017 survey of caregivers outlines the risky situation
faced by family caregivers.)
16

Key Highlights
Visions and Expectations of Retirement
As the retirement landscape has evolved in recent decades, workers’ visions and expectations of retirement differ from those
of earlier generations that viewed retirement as an abrupt transition from working full-time one day and never again the next
day. Workers now view it as a time of freedom and enjoyment. They envision fully retiring after age 65 and pursuing a
retirement in which work and leisure are not a mutually exclusive proposition. Many share retirement dreams, such as travel,
spending more time with family and friends, and pursuing hobbies. Many also share expectations of continued work for both
financial and healthy-aging related reasons.
• Seven in 10 Are Looking Forward to Retirement. Seventy-four percent of workers are looking forward to retirement,
including 33 percent who are “very much” and 41 percent who are “somewhat” looking forward to it. Baby Boomers (39
percent) are more likely than Generation X (31 percent) and Millennials (33 percent) to be “very much” looking forward to
retirement.
• Most Cite Positive Word Associations With “Retirement.” Eighty-seven percent of workers cite positive word associations
with “retirement” compared with only 39 percent who cite negative words. Workers’ top three positive word associations
are “freedom” (56 percent), “enjoyment” (53 percent), and “stress-free” (43 percent), while the top three negative word
associations are “financial insecurity” (17 percent), “health decline” (17 percent), and “boredom” (14 percent).
• All Three Generations Cite Positive Word Associations. Across generations, more than eight in 10 workers cite one or more
positive word associations with “retirement,” while far fewer cite negative word associations. Millennials, Generation X,
and Baby Boomers share the most frequently cited positive words: “freedom,” “enjoyment,” and “stress-free.” They also
share the three most often cited negative word associations: “financial insecurity,” “health decline,” and “boredom.”
Millennials are more likely to associate “retirement” with “personal growth” than Baby Boomers and Generation X.
• Many Expect Enjoyment of Life to Improve in Retirement. More than half of workers (55 percent) expect their enjoyment of
life to improve when they retire, while 32 percent expect it to stay the same, eight percent expect it to decline, and five
percent are “not sure.” However, these expectations vary by generation. Millennials (61 percent) are significantly more
likely than Generation X (51 percent) and Baby Boomers (48 percent) to expect their enjoyment of life to improve.
• Workers Are Dreaming of an Active Retirement. Traveling (65 percent) is workers’ most frequently cited retirement dream,
followed by spending more time with family and friends (57 percent), and pursuing hobbies (46 percent). A noteworthy
one-third of workers dream of doing some form of paid work in retirement, such as starting a business (17 percent),
pursuing an encore career (12 percent), and/or continuing to work in the same field (11 percent). One in four workers (24
percent) dreams of spending their retirement doing volunteer work.
17

Key Highlights
Visions and Expectations of Retirement (cont.)
• Workers Across Generations Share Similar Retirement Dreams. Workers’ top three retirement dreams — traveling,
spending more time with family and friends, and pursuing hobbies — are common across the generations. However, some
retirement dreams differ across generations. Baby Boomers (29 percent) are more likely to dream of doing volunteer work,
compared with Generation X (24 percent) and Millennials (21 percent). In contrast, Millennials (38 percent) are more likely
to dream of working in retirement (e.g., starting a business, pursuing an encore career, continue working in the same field),
compared with Generation X (33 percent) and Baby Boomers (23 percent).
• Retirement Fears Range From Financial to Health-Related. The most frequently cited retirement fears are outliving savings
and investments (40 percent), a reduction in or elimination of Social Security (39 percent), declining health that requires
long-term care (34 percent), and not being able to meet the family’s basic financial needs (32 percent). Approximately
three in 10 workers fear possible long-term care costs (29 percent), cognitive decline/dementia/Alzheimer’s Disease (28
percent), and a lack of access to adequate and affordable healthcare (28 percent). One in four (25 percent) fear losing
independence. Other fears include: affordable housing (21 percent), feeling isolated and alone (20 percent), finding
meaningful ways to spend time and stay involved (18 percent), and being laid off — not being able to retire on their own
terms (16 percent).
• Retirement Fears Are Shared Across Generations. Across generations, workers share the same top retirement fear:
outliving savings and investments. Other fears vary by generation, such as the fear of a reduction in or elimination of Social
Security, which is more frequently cited by Baby Boomers (46 percent) than by Generation X (39 percent) and Millennials
(36 percent). Baby Boomers are more likely to cite a fear of declining health that requires long-term care (41 percent) than
Generation X (33 percent) and Millennials (31 percent). Not being able to meet the family’s basic financial needs is a
retirement fear more likely cited by Millennials (36 percent) and Generation X (33 percent) compared with Baby Boomers
(25 percent). Millennials are also more likely to fear feeling isolated and alone (25 percent), and being laid off — not being
able to retire on their own terms (21 percent).
• Top Criteria for Deciding Where to Live in Retirement Is Affordability. Where people live in retirement can influence their
ability to achieve their dreams and possibly mitigate fears. When thinking about very important criteria in deciding where to
live in retirement, workers most often cite affordable cost of living (65 percent), followed by proximity to family and friends
(48 percent), good weather (42 percent), low crime rate (40 percent), access to excellent healthcare and hospitals (35
percent), and leisure and recreational activities (35 percent). Ironically, although more than half of workers plan to
continue working after they retire, only 23 percent identify employment opportunities as being a very important criterion.
18

Key Highlights
Visions and Expectations of Retirement (cont.)
• More Than Half of Workers Expect to Work Past Age 65. Fifty-two percent of workers expect to work past age 65 or do not
plan to retire. Expectations of doing so increase with age. Almost seven in 10 Baby Boomers (68 percent) either expect to
or are already working past age 65 or do not plan to retire, compared with 53 percent of Generation X and only 43
percent of Millennials. In contrast, the majority of Millennials (57 percent) plan to retire at age 65 or sooner.
• More Than Half of Workers Plan to Work in Retirement. Fifty-seven percent of workers plan to work after they retire,
including 40 percent who plan to work part-time and 17 percent full-time. Just 26 percent do not plan to work after they
retire and 17 percent are not sure. Baby Boomers, Generation X, and Millennials share similar expectations of working in
retirement; however, Millennials and Generation X (both 19 percent) are significantly more likely than Baby Boomers (12
percent) to plan to work full time after they retire.
• Two in Five Envision a Phased Transition Into Retirement. Forty-five percent of workers envision a phased transition into
retirement during which they will reduce work hours with more leisure time to enjoy life (28 percent), or work in a different
capacity that is less demanding and/or brings greater personal satisfaction (17 percent). Twenty-four percent plan to
continue working as long as possible until they cannot work anymore. Only 21 percent expect to immediately stop working
either when they reach a specific age or savings goal, and 10 percent are not sure. Across generations, these views are
generally similar. However, Generation X (26 percent) are somewhat more likely to envision continuing to work as long as
possible, compared with Millennials (23 percent) and Baby Boomers (22 percent).
• Most Are Realistic About Compensation in Phased Retirement. Among workers who envision a phased transition into
retirement, most have realistic expectations regarding how changes in their work arrangements may affect their
compensation, job title, and benefits. Most agree that if they were to reduce their hours, they would expect to be paid the
same hourly rate (78 percent). If they were to take on a new role with fewer responsibilities, the majority would expect
their job title to change (76 percent) and would expect to be paid the market rate for duties involved, even if it means a
reduction in their level of pay (74 percent). Notably, three in five workers (61 percent) say that if they were to shift from
full- to part-time work, they would expect the same level of employee benefits — an expectation that may not be realistic
because many employers do not offer benefits to part-time workers.
19

Key Highlights
Visions and Expectations of Retirement (cont.)
• Reasons for Working in Retirement Include Financial and Health. Among workers who are or plan to work in retirement
and/or past age 65, an equal proportion cite financial and healthy-aging reasons (both 78 percent). The most often cited
financial reason is workers want the income (51 percent), while the top healthy-aging reason is to be active (50 percent).
Other frequently cited healthy-aging reasons cluster around “keep my brain alert” (40 percent), “enjoy what I do” (38
percent), and “have a sense of purpose” (34 percent). Other frequently cited financial reasons cluster around “can’t afford
to retire” (31 percent), “concerned that Social Security will be less than expected” (31 percent), and “need health benefits”
(26 percent).
• Generations Share Common Reasons for Working in Retirement. Overall, workers across generations similarly share
financial and healthy aging-related reasons for working past age 65 and/or in retirement with some noteworthy
differences. Baby Boomers are significantly more likely than the other generations to indicate they want the income (59
percent). Generation X is somewhat more likely to indicate that they can’t afford to retire because they haven’t saved
enough (37 percent). Millennials are significantly more likely to cite “personal development” (23 percent).
• Workers Can Take More Steps to Continue Working Past 65. Workers must be healthy enough and have access to
employment opportunities in order to fulfill their aspirations and expectations of working past age 65. However, when
asked what steps they are taking to ensure they can continue working, relatively few are taking adequate action. Before
and during the pandemic, approximately half said they are staying healthy so they can continue working, while
approximately four in 10 are focused on performing well at their current job and keeping their job skills up to date. One in
five are networking and meeting new people. Around one in four workers have not taken any steps.
Before the pandemic, many workers envisioned extending their working lives beyond age 65 with a flexible transition to
retirement — and many cited both financial and healthy aging-related reasons for doing so. As a result of the COVID-19
recession, many workers are encountering major setbacks which will require them to work longer in order to rebuild and grow
their savings. An important opportunity for workers to improve their long-term outlook is be more proactive about taking steps
that can help protect their employability, such as keeping their job skills up to date, staying abreast of the employment market,
and networking and meeting new people.
20

Key Highlights
Retirement Savings, Planning, and Preparations
Many workers are not adequately saving for retirement. They are expecting diverse sources of retirement income and many
are concerned about the future of Social Security. While some factors may be beyond their control, there are planning-related
action steps that workers can engage in to improve their long-term prospects.
• Retirement Savings May Not Be Adequate. Total household retirement savings among all workers is $50,000 (estimated
median). Baby Boomer workers have the highest retirement savings at $144,000, compared with Generation X ($64,000)
and Millennials ($23,000) (estimated medians). The proportion of workers having saved $250,000 or more increases
with age: 13 percent of Millennials, 25 percent of Generation X, and 40 percent of Baby Boomers. In contrast, the
proportion of workers who have saved $1 to less than $50,000 directionally decreases with age: 38 percent of
Millennials, 27 percent of Generation X, and 18 percent of Baby Boomers. Of concern, one in 10 workers (10 percent)
report having no retirement savings, including 12 percent of Millennials, nine percent of Generation X, and seven percent
of Baby Boomers.
• Three in Five Think They Are Building a Large Enough Nest Egg. Sixty percent of workers agree that they are currently
building a large enough retirement nest egg, including 24 percent who “strongly agree” and 36 percent who “somewhat
agree.” Millennials (61 percent), Generation X (59 percent), and Baby Boomers (60 percent) share similar levels of
agreement.
• Two-Thirds of Workers Are Confident About Retirement. Approximately seven in 10 workers are either “somewhat” or
“very” confident that they will be able to fully retire with a comfortable lifestyle, a survey finding that is relatively
unchanged before and during the onset of the pandemic (68 percent, 70 percent respectively). Fewer than one in four
workers are “very” confident (21 percent, 24 percent respectively). Baby Boomers are slightly less likely than younger
generations to be “very” confident.
• Workers Are Expecting Diverse Sources of Retirement Income. Self-funded savings, including retirement accounts (e.g.,
401(k)s, 403(b)s, IRAs) and/or other savings and investments, are the most frequently cited source of expected
retirement income by workers across generations (77 percent). Sixty-eight percent of workers expect income from Social
Security; however, there is a wide disparity across generations: Baby Boomers (86 percent), Generation X (71 percent),
and Millennials (56 percent). Thirty-seven percent of workers expect retirement income from “working.” Millennials and
Generation X (both 37 percent) are somewhat more likely than Baby Boomers (34 percent) to expect it.
21

Key Highlights
Retirement Savings, Planning, and Preparations (cont.)
• Many Baby Boomers Expect to Rely on Social Security. Baby Boomers (37 percent) are significantly more likely to expect
Social Security to be their primary source of income in retirement, compared with Generation X (26 percent) and
Millennials (17 percent). Millennials (55 percent) and Generation X (49 percent) are more likely than Baby Boomers (42
percent) to cite self-funded savings, including 401k(s), 403(b)s, IRAs and/or other savings and investments as their
expected primary source of income. Fifteen percent of all workers expect their primary source of retirement income to
come from “working,” a finding that it is more often cited by Millennials (17 percent) and Generation X (15 percent),
compared with Baby Boomers (11 percent). Note: 401(k)s did not become readily available until the 1990s, a time at
which Baby Boomers were already well into their careers and, therefore, they have not had as much time to save in
them.
• Three in Four Workers Are Concerned About Social Security. Seventy-three percent of workers agree with the statement,
“I am concerned that when I am ready to retire, Social Security will not be there for me,” including 34 percent who
“strongly agree” and 39 percent who “somewhat agree.” Generation X (81 percent) and Millennials (76 percent) are
more likely to agree than Baby Boomers (61 percent). Generation X (41 percent) and Millennials (36 percent) are also
more likely than Baby Boomers (26 percent) to “strongly agree.”
• Three in Four Workers Are Saving for Retirement. Seventy-six percent of workers are saving for retirement through
employer-sponsored plans, such as a 401(k) or similar plan, and/or outside the workplace. Baby Boomers (84 percent)
and Generation X (78 percent) are more likely than Millennials (72 percent) to be saving for retirement. Among those
saving for retirement, Millennials started saving at age 24 (median), Generation X started at age 30 (median), and Baby
Boomer started at age 35 (median).
• Six in 10 Are Saving for Retirement Outside of Work. Sixty-one percent of workers are saving for retirement outside of
work, such as in an IRA, mutual funds, bank account, etc. Baby Boomers (70 percent) are more likely to be saving for
retirement outside of work, compared with Generation X and Millennials (61 percent and 56 percent, respectively).
• Workers’ Estimated Retirement Savings Needs. Workers estimate they will need $500,000 (median) by the time they
retire in order to feel financially secure. This estimate is shared by Generation X and Baby Boomers, but Millennials
estimate they will need only $300,000 (median). Generation X (39 percent) and Baby Boomers (34 percent) are more
likely than Millennials (29 percent) to say they will need $1 million or more by the time they retire in order to feel
financially secure.
22

Key Highlights
Retirement Savings, Planning, and Preparations (cont.)
• Many Workers Are Guessing Their Retirement Savings Needs. Forty-four percent of workers who provided an estimate of
their retirement savings needs indicate they guessed those needs. Twenty-three percent estimated this goal based on
their current living expenses. Just 13 percent used a retirement calculator or completed a worksheet, with Millennials (15
percent) being somewhat more likely than Generation X (13 percent) and significantly more likely than Baby Boomers (10
Percent) to have done so. Baby Boomers (27 percent) are more likely to have estimated their needs based on current
living expenses than Millennials (21 percent) or Generation X (22 percent).
• Workers Most Often Invest in a Mix of Stocks, Bonds, and Cash. Workers most frequently invest their retirement savings
in a relatively equal mix of stocks and investments, such as bonds, money market funds, and cash (38 percent), which
tends to increase with age: Millennials (33 percent), Generation X (39 percent), and Baby Boomers (45 percent). Nineteen
percent of workers say they are “not sure” how their retirement savings are invested, including Baby Boomers (19
percent), Generation X and Millennials (both 17 percent).
• Relatively Few Are Very Familiar with Spouse’s/Partner’s Savings. Among workers who are married or living with a partner,
60 percent say their spouse or partner is saving in a retirement plan, and 67 percent are familiar with their spouse’s or
partner’s savings, yet only 33 percent are “very familiar.” Level of familiarity of their spouse’s or partner’s plan is similar
across generations. Baby Boomers and Millennials (both 68 percent) are slightly more likely to be familiar than
Generation X (66 percent).
• One in Four Has a Written Financial Strategy for Retirement. Achieving retirement readiness goes beyond simply saving
enough. It requires having a well-defined financial strategy. The majority of workers (69 percent) have some form of
retirement strategy, but only 24 percent have a written plan. The other 45 percent have a plan, but it is not written down.
Of the three generations, Millennial workers (71 percent) are slightly more likely to have some form of written or unwritten
financial strategy for retirement, compared with Generation X and Baby Boomers (both 68 percent).
• Retirement Strategies Should Consider a Variety of Factors. There are multiple variables could have an impact on
retirement savings, ability to generate income in retirement, and protection of savings. Many workers with a retirement
strategy have considered basic living expenses (51 percent), a budget (45 percent), and Social Security and Medicare
benefits (44 percent). However, few have factored in long-term care needs (24 percent), tax planning (18 percent), and
estate planning (16 percent). Even fewer have factored contingency plans (13 percent). Only 23 percent have factored in
pursuing their retirement dreams. Of the three generations, Baby Boomers are more likely to have factored in several of
the components into their strategies, but their plans are still lacking.
23

Key Highlights
Retirement Savings, Planning, and Preparations (cont.)
• Few Have a Backup Plan if Retirement Comes Unexpectedly. Delaying retirement and/or continuing to work in retirement
is an effective way to continue generating income, bridge savings shortfalls, and stay active and involved. However, only
32 percent of workers have a backup plan for retirement income if forced into retirement sooner than expected.
Millennials (34 percent) and Baby Boomer workers (32 percent) are only somewhat more likely to have a backup plan
compared with Generation X (30 percent).
• Many May Be Procrastinating Retirement Investing. Forty-four percent of workers agree with the statement, “I prefer not to
think about or concern myself with retirement investing until I get closer to my retirement date,” including 14 percent who
“strongly agree” and 30 percent who “somewhat agree.” Younger workers are more likely to procrastinate retirement
investing than older workers. Millennials (51 percent) and Generation X workers (42 percent) are more likely to agree
compared with Baby Boomers (32 percent).
• More Than Half Would Prefer to Rely on Outside Experts. Fifty-six percent of workers agree with the statement, “I would
prefer to rely on outside experts to monitor and manage my retirement savings plan,” including 16 percent who “strongly
agree” and 40 percent who “somewhat agree.” Generation X (59 percent) and Millennial workers (58 percent) are more
likely to agree than Baby Boomers (49 percent).
• Four in 10 Workers Use a Professional Financial Advisor. Forty-one percent of workers who are saving and investing for
retirement use a professional financial advisor to help them manage their savings and investments. Baby Boomers are
most likely to use an advisor (45 percent), followed by Millennials (42 percent) and Generation X (37 percent). In the April
2020 survey, a slightly higher percentage of workers report using a financial advisor (45 percent).
• Services Performed by Financial Advisors Vary by Generation. Among those who use a financial advisor, workers most
frequently use them to make retirement investment recommendations (55 percent), followed by calculating a retirement
savings goal (42 percent) and general financial planning (35 percent). Across generations, the use of financial advisor
services varies. A significant majority of Baby Boomers (66 percent) use their financial advisors for retirement investment
recommendations compared with Generation X (56 percent) and Millennials (45 percent). While approximately four in 10
workers say their advisors calculate a retirement savings goal, Generation X (47 percent) and Baby Boomers (45 percent)
are somewhat more likely to receive this service than Millennials (37 percent).
24

Key Highlights
Retirement Savings, Planning, and Preparations (cont.)
• Frequency (or Infrequency) of Conversations About Retirement. Retirement is a family matter that calls for important
conversations, particularly during difficult times. Before the pandemic, just 20 percent of workers said they frequently
discuss saving, investing, and planning for retirement with family and close friends, while 55 percent occasionally discuss it,
and 25 percent never discuss it. Millennials (25 percent) are significantly more likely to frequently discuss it than Baby
Boomers (15 percent) and Generation X (17 percent). Amid the pandemic, in April 2020, these survey findings are relatively
unchanged.
Many workers are not saving enough to retire comfortably, while others are at risk of poverty. The pandemic has further
exacerbated this situation. Working as long as possible before retirement is a practical solution. However, amid widespread
unemployment, it is unclear whether and how soon employment opportunities will be available, especially for older workers.
Before the pandemic, according to the Bureau of Labor Statistics, only approximately one in five Americans age 65 and older
was employed in 2019. (https://www.bls.gov/cps/cpsaat03.htm)
The Vital Role of Employers in Helping Workers Save and Prepare for Older Age
Employers play a vital role in helping workers save and invest for retirement. Employer-sponsored retirement benefits, such as
401(k) or similar plans, have proven to be highly effective at encouraging savings through the convenience of payroll deductions,
access to institutional investments and advice, educational offerings, and matching contributions. Employer sponsorship rates
of 401(k) or similar plans are already high — yet with room for further growth. Many plan sponsors have the opportunity to
enhance their plans with the addition of “automatic” features such as automatic enrollment and automatic escalation.
Expanding coverage to part-time workers can also help improve workers’ retirement outcomes.
In addition to offering retirement benefits, employers can profoundly influence their workers’ financial security and preparations
for older age in a number of other ways. These include offering health and non-retirement benefits, workplace wellness
programs, flexible work arrangements to promote work-life balance, retirement planning and counseling services, and phased
retirement alternatives — along with fostering an age-friendly work environment in which workers of all ages are valued and can
be successful.
25

Key Highlights
The Vital Role of Employers in Helping Workers Save and Prepare for Older Age (cont.)
• Most Workers Highly Value Retirement Benefits. Employers take note: Workers highly value retirement benefits. Eighty-five
percent of workers value a 401(k) or similar retirement plan as an important benefit. Four in five workers (80 percent) say
that retirement benefits offered by a prospective employer will be a major factor in their decision whether to accept an
offer. Six in 10 workers (62 percent) say they would be likely to switch employers for a nearly identical job with a similar
employer that offered “a retirement plan/a better retirement plan.” Flight risk is greatest among the 71 percent of
Millennials who share this sentiment. The majority of Generation X (65 percent) would be likely to switch also. Baby
Boomers (45 percent) are less likely to switch employers for “a retirement plan/a better retirement plan.”
• Two-Thirds Are Offered a 401(k) or Similar Plan. Sixty-eight percent of workers have access to a 401(k) or similar
employee-funded retirement plan in the workplace. Generation X (72 percent), Millennials (69 percent), and Baby Boomers
(66 percent) are similarly likely to have access to a plan. Of great concern is that almost one in four workers (23 percent)
are not offered any retirement benefits.
• Full-Time Workers Are More Likely to Be Offered a 401(k). Full-time workers (74 percent) are far more likely to have access
to a 401(k) or similar employee-funded plan compared with part-time workers (45 percent). Among part-time workers, Baby
Boomers (41 percent) are somewhat less likely to have benefits compared with Millennials (49 percent) and Generation X
(48 percent).
• Having Access to a 401(k) Inspires Workers to Save. Workers who are offered a 401(k) or similar retirement plan by their
employer are more likely to save and invest for retirement in the plan and/or outside of work (88 percent) compared with
those who do not have access to such plans (51 percent). Among workers who are not offered a plan, Baby Boomers are
much more likely to be saving for retirement (68 percent) than Generation X (49 percent) and Millennials (41 percent).
• When Offered a Plan, Three in Four Participate. Seventy-six percent of workers who are offered a 401(k) or similar plan
participate in that plan. Participation rates are higher among Generation X (79 percent) and Baby Boomers (80 percent)
than Millennials (73 percent). Across all three generations, participants are contributing 10 percent (median) of their
annual salary into their plans.
• Two in Five Contribute 10 Percent or More to Retirement Plans. While the majority of workers participating in a 401(k) or
similar retirement plan are contributing 10 percent of their salaries or less, 42 percent are saving more than 10 percent.
These “super savers” include 44 percent of Millennials, and 40 percent of both Generation X and Baby Boomers. Almost
one in three plan participants (29 percent) are contributing more than 15 percent of their annual pay into the plan.
26

Key Highlights
The Vital Role of Employers in Helping Workers Save and Prepare for Older Age (cont.)
• Millennials Are More Likely to Be Contributing to a Roth 401(k). Seventy-five percent of workers who are offered a 401(k)
or similar plan are aware of the Roth 401(k) option, which enables them to pay income taxes now and take withdrawals at
retirement age tax-free. Among those who are aware, 68 percent say they are offered it by their employer, including 49
percent who contribute to it. Millennials (57 percent) and Generation X (52 percent) are more likely to be offered a Roth
401(k) feature and contribute to it compared with Baby Boomers (32 percent).
• Majority of Participants Use Professionally Managed Offerings. “Professionally managed” accounts refer to a managed
account service, strategic allocation funds, and/or target date funds. The majority of qualified plan participants (58
percent) are using some form of professionally managed offering in their 401(k) or similar plans. Millennials (64 percent)
are more likely to be using these types of accounts than Generation X (57 percent) and Baby Boomers (47 percent).
• Four in Five Workers Find Automatic Enrollment Appealing. Automatic enrollment is a retirement plan feature that
eliminates the decision-making and action steps required of employees to enroll and start contributing to their workplace
retirement plan. It simply automatically enrolls them into their plan so they only need to take action if they desire to opt
out and not contribute to the plan. Across the generations, eight in 10 workers (82 percent) find automatic enrollment
appealing. Generation X (82 percent) and Millennials (84 percent) are somewhat more likely to find it appealing than Baby
Boomers (78 percent). All three generations consider an appropriate default contribution rate to be 10 percent (median).
If an employer has not yet adopted automatic enrollment as part of its 401(k) plan, it is a feature worthy of consideration.
• Three in Four Workers Would Be Likely to Use Automatic Escalation. The majority of workers (78 percent) say they would
be likely to use an automatic feature that would increase their retirement plan contribution by 1 percent each year.
Millennials (82 percent) and Generation X (79 percent) are somewhat more likely than Baby Boomers (73 percent) to say
they would be likely to use this feature. If an employer has not yet adopted automatic escalation as part of its 401(k) plan,
it is also a feature worthy of consideration.
• Two-Thirds Want More Retirement Education and Advice. Two in three workers (66 percent) would like more education
and advice from their employers on how to reach their retirement goals. This desire is highest among Millennials (73
percent), while also strong among Generation X (69 percent) and Baby Boomers (47 percent).
27

Key Highlights
The Vital Role of Employers in Helping Workers Save and Prepare for Older Age (cont.)
• Motivators to Inspire Learning: Make It Easier to Understand. Employers, with their retirement plan providers, play an
invaluable role in offering retirement and financial-related education to their employees. They may be able to fine-tune
their offerings even more. When workers were asked what would motivate them to learn more about saving and investing
for retirement, the most frequently cited motivators relate to making it easier to understand (54 percent), with Millennials
(61 percent) being more likely to cite this than Generation X (54 percent) and Baby Boomers (41 percent). “Larger tax
breaks and incentives for saving in a retirement plan” and “a financial advisor” are also frequently cited motivators across
generations.
• Incentives to Save: Saver’s Credit and Catch-Up Contributions. One in three workers indicate that greater tax breaks and
incentives would be a motivator for them to learn more about saving and investing for retirement. Two meaningful
incentives include: the Saver’s Credit, a tax credit for eligible taxpayers who save for retirement in a qualified retirement
plan or IRA; and catch-up contributions, which allow workers age 50 and older to contribute to a qualified plan an
additional amount over and above the plan- or IRA-contribution limit. Yet only 43 percent of workers are aware of the
Saver’s Credit. All Baby Boomers are now over age 50 and Generation X began turning 50 in 2015. Catch-up contributions
are now a noteworthy and relevant incentive for them; however, only 46 percent of Generation X and 62 percent of Baby
Boomers are aware it.
• Workers Need to Know More About Social Security Benefits. A strong knowledge of government benefits is important for all
future retirees and especially important for workers nearing retirement. Yet only 21 percent of age 50-plus workers know
“a great deal” about Social Security benefits. Moreover, among age 50-plus workers who expect Social Security to be their
primary source of income when they retire, only 24 percent know a “great deal” about Social Security benefits.
• Are Today’s Employers Age Friendly? Seven in 10 workers (70 percent) consider their employers to be “age friendly” by
offering opportunities, work arrangements, and training and tools needed for employees of all ages to be successful in
their current role or contribution to the company. Fifteen percent of workers say their employers are not age friendly and
15 percent are “not sure.” Millennial workers are somewhat more likely to characterize their employers as age friendly (73
percent) than Baby Boomers (69 percent) and Generation X (65 percent).
• Most Are Offered Some Type of Alternative Work Arrangements. Eighty percent of workers indicate their employers offer
one or more types of alternative work arrangements. The most often cited types of alternative arrangements are: flexible
work schedules (48 percent), the ability to adjust work hours as needed (41 percent), and the ability to take unpaid leave
of absence (39 percent). Millennials (86 percent) are more likely to be offered alternative work arrangements compared
with Generation X and Baby Boomers (both 75 percent).
28

Key Highlights
The Vital Role of Employers in Helping Workers Save and Prepare for Older Age (cont.)
• Three in Four Say Their Employers Support Working Past Age 65. Seventy-eight percent of workers agree with the
statement, “My current employer is supportive of its employees working past age 65,” including 34 percent who
“strongly agree” and 44 percent who “somewhat agree.” Baby Boomers workers (39 percent) are more likely to “strongly
agree” compared with Millennials and Generation X (both 32 percent).
• Employers Do Little to Facilitate Transitioning Into Retirement. Workers may find it difficult to have a phased transition
into retirement at their current employers. Only 36 percent indicate their employers offer opportunities such as
accommodating flexible work schedules and arrangements (22 percent), enabling employees to reduce work hours and
shift from full-time to part-time (19 percent), and/or enabling employees to take positions that are less stressful or
demanding (14 percent).
• Closing the Employee Benefits Gap. In addition to retirement benefits, health and welfare benefits can enhance workers’
financial security. These benefits can bring insurance protections, mitigate out-of-pocket healthcare expenses, provide
the possibility of additional resources in a time of need, and offer wellness help. Most workers believe these benefits are
important; however, a significant gap exists between the percentage of workers who believe they are important and the
percentage who are offered them by their employers. This represents an opportunity for employers to increase the
competitiveness of their compensation and benefits packages, while helping their employees achieve greater long-term
financial security.
• The Employee Benefits Gap Spans All Three Generations. The importance of various types of health and welfare benefits
varies by generation. While more than 90 percent of workers across all three generations consider health insurance to
be important, Millennials are generally more likely than Generation X and Baby Boomers to find the other types of health
and welfare benefits listed to be important. Across generations, a significant gap exists between the percentages of
workers who believe they are important compared with the percentage who are offered them by their employers.
Amid the pandemic, employers are encountering intense profitability challenges and many are making difficult decisions,
which may involve reductions in staffing, compensation, and benefits. Employers that are able to offer employment and
maintain benefits are playing an all-critical role in supporting the livelihoods and lives of their employees. Every bit helps.
29

Key Highlights
Happiness and Healthy Aging
People have the potential of living longer than any other time in history. However, the pandemic illustrates this gift of longevity is
not an entitlement. Achieving longevity requires taking good care of body and mind. Most workers indicate they are in good or
excellent health, and they are concerned about their health in older age. Unfortunately, most are not yet taking adequate steps to
safeguard their health.
• Workers Are Happy but Some Are Facing Challenges. Before the coronavirus pandemic, eight in 10 workers reported having
close relationships with family and/or friends (88 percent), being generally happy (86 percent), enjoying life (84 percent), and
having a strong sense of purpose in life (81 percent). A noteworthy four in 10 indicate they have trouble making ends meet
(43 percent) and often feel anxious or depressed (41 percent). These survey findings were relatively unchanged in April 2020
amid the pandemic.
• Most Are Enjoying Life yet Many Millennials Are Struggling. Across generations, before the pandemic, more than four in five
workers reported having close relationships with family and/or friends, being generally happy, and enjoying life. However,
Millennials are more likely to be struggling compared with Generation X and Baby Boomers. Millennials are more likely to have
trouble making ends meet (51 percent), often feel anxious and depressed (49 percent), and feel isolated and lonely (37
percent). These findings were for the most part unchanged in April 2020 amid the pandemic.
• Many Expect Their Happiness to Improve in Retirement. More than half of workers (55 percent) expect their happiness to
improve when they retire, while 34 percent expect it to stay the same, seven percent expect it to decline, and four percent are
“not sure.” However, these expectations vary by generation. Millennials (62 percent) are significantly more likely than
Generation X (51 percent) and Baby Boomers (47 percent) to expect their happiness to improve.
• Many Plan on Both Long Lives and Long Retirements. Workers are planning to live to age 90 (median). One in six Millennials
(16 percent) are planning to live to age 100 or older, compared with Generation X (12 percent) and Baby Boomers (9 percent).
An implication for increased longevity is potentially more time spent in retirement. The survey compared workers’ planned life
expectancy with their expected retirement age and found that Millennial workers plan to spend 25 years in retirement
(median), a finding that is somewhat higher than Generation X (21 years median) and Baby Boomers (20 years median).
• How Old Is “Old”? It Depends on the Person. When asked the age at which they consider a person to be “old,” almost half of
workers say that it depends on the person (47 percent). Baby Boomers (61 percent) are more likely to indicate this than
Generation X (48 percent) and Millennials (39 percent). Among those who provided a specific age, workers consider a person
to be “old” at age 65 (median), a finding that increases with workers’ age. Millennials consider a person to be “old” at age 60
(median), Generation X consider it to be at age 70 (median), and Baby Boomers consider it to be at age 75 (median).
30

Key Highlights
Happiness and Healthy Aging (cont.)
• At What Age Is a Person “Too Old” to Work? When asked the age at which they consider a person to be “too old” to work,
more than half of workers (53 percent) say it depends on the person. Across generations, Baby Boomers are most likely to
say it depends on the person (69 percent), followed by Generation X (56 percent) and Millennials (43 percent). Among those
who provided a specific age, workers say age 70 (median) is “too old” to work. Millennials and Generation X consider a
person to be “too old” to work at age 70 (median), while Baby Boomers say age 75 (median).
• Seven in 10 Are Concerned About Their Health in Older Age. Seventy-two percent of workers are either “very” (24 percent) or
“somewhat” (48 percent) concerned about their health in older age. Millennials (27 percent) are somewhat more likely to
be “very concerned” about their health compared with Generation X (24 percent) and Baby Boomers (18 percent).
• Eight in 10 Describe Their General Health as “Excellent” or “Good,” with 23 percent describing it as “excellent” and 57
percent as “good.” Eighteen percent describe their health as being “fair” and two percent as “poor.” Self-described general
health is relatively consistent across generations; however, Millennial workers (27 percent) are more likely to cite being in
“excellent” health, compared with Generation X (22 percent) and Baby Boomers (16 percent).
• Workers Can Do More to Safeguard Their Long-Term Health. Given the potential implications on long-term health, workers
can be doing more health-related activities on a consistent basis. Prior the pandemic, exercising regularly (57 percent) and
eating healthfully (53 percent) are the only activities that more than half of all workers were doing. Amid the pandemic,
more workers indicate they are maintaining a positive attitude and getting plenty of rest. Before and during the pandemic,
Baby Boomers are generally more likely to be engaging in healthy activities compared with younger generations.
The retirement landscape has been shifting for decades and the current pandemic is the equivalent of a major earthquake. Prior
to the pandemic, the retirement system showed signs of weakness, including the imminent depletion of Social Security’s Trust
Fund and the need for reform, the financial fragility and inadequate savings among workers, the need for older workers to
remain in the workforce longer amid headwinds of ageism and age discrimination, and the proliferation of unpaid family
caregivers in the absence of affordable long-term care services and support.
Workers’ ability to achieve a secure retirement highly depends on a robust employment market, employers offering retirement
benefits along with other health and welfare benefits, and the preservation of safety nets such as Social Security and Medicare.
From a societal perspective, amid the pandemic, we are presented with an opportunity to come together to reimagine our world
— including how we live, work, retire, and age with dignity.
Catherine Collinson
CEO and President, Transamerica Institute and Transamerica Center for Retirement Studies
31

Recommendations for Workers
32
Workers have been hard hit by the coronavirus and recession. Many are experiencing negative employment impacts, including
layoffs, furloughs, and reductions in pay and benefits. While confronting short-term priorities, it is important to keep the future
and retirement in mind. Millennials, Generation X, and Baby Boomers are facing different challenges that are unique to their
generations. However, the proactive tactics to help prepare are fundamentally common to all. Eleven action steps include:
1. Assess your current financial situation and create a budget that includes income, living expenses, paying off debt, and
financial goals such as building emergency savings and long-term retirement savings. If you are short on cash and risk
missing any debt-related payments, contact the lender or credit card company to learn of any alternative options.
2. If possible, save or continue saving for retirement. By starting as early as possible and consistently saving over time,
even small amounts can add up over a decades-long working life.
3. Participate in employer-sponsored retirement plans, if available. Take full advantage of matching employer
contributions and defer as much as possible. If not offered a plan, consider contributing to an IRA consistently.
4. Avoid taking loans and early withdrawals from retirement accounts, which can severely inhibit their long-term growth.
Before tapping into retirement savings, learn about the retirement account-related provisions of the CARES Act and
explore all possible alternatives to determine the best option.
5. Review your retirement savings portfolio to ensure investments are consistent with your risk profile and years to
retirement. Learn about professionally managed accounts, target date funds, and strategic allocation funds. Seek
assistance from your retirement plan provider or a professional financial advisor, if needed.
6. Calculate retirement savings needs, develop a retirement strategy, and write it down. Factor in living expenses, health
care, long-term care needs, and government benefits, as well as funds for pursuing retirement dreams.
7. Take advantage of the Saver’s Credit. Check if you qualify for the Saver’s Credit, a tax credit available to eligible tax
payers who contribute to a 401(k) or similar plan, or IRA.
8. Be proactive to help ensure continued employment now and in retirement. Take proactive steps to stay employed and
maximize opportunities by keeping your job skills up to date, staying current on employment trends and marketplace
needs, and learning new skills.
9. Create a backup plan in the event of job loss or in case retirement comes early due to an unforeseen circumstance.
10. Take good care of yourself and safeguard your health. Consider health implications when making lifestyle decisions.
11. Beware of scams. Be hypervigilant about suspicious text messages, email, or calls.

Recommendations for Employers
33
Amid the pandemic, many employers are facing difficult decisions that may involve potential reductions in staffing,
compensation, and benefits. Nevertheless, it is important for them to recognize the vital role they play in helping their employees
save for retirement. Everything they do matters. Working with HR professionals and employee benefits advisors, employers may
consider these opportunities that can help improve their employees’ retirement outlook.
1. Offer a retirement plan or achieve efficiencies by joining a multiple employer plan (MEP). If a plan is not already in place, take
advantage of the tax credit available for starting a retirement plan or joining a MEP.
2. Extend retirement plan eligibility to part-time workers or, if not practical, provide workers the ability to contribute to an IRA
through payroll deduction.
3. If a 401(k) or similar plan is already in place, work with your retirement plan provider to implement CARES Act provisions that
offer financial relief to employees through access to loans and early withdrawals. Plan amendments are not required until
the end of the 2022 plan year, provided that the plan is operated in accordance with the terms.
4. Promote planning, guidance, and educational resources available through your retirement plan provider to ensure that
employees are aware and taking advantage of them.
5. Offer flexible work arrangements that support work-life balance as employees are experiencing increased personal
responsibilities such as home schooling children and caring for aging parents.
6. Offer pre-retirees greater levels of assistance in planning their transition into retirement, including education about
retirement income strategies for managing savings to last their lifetime; retirement plan distribution options; and the need
for a backup plan if forced into retirement sooner than expected (e.g., health issues, job loss, family obligations). Provide
information about Social Security and Medicare.
7. Create opportunities for workers to phase into retirement by allowing for a transition from full-time to part-time, working in
different capacities or different locations, and/or having a more flexible schedule.
8. Foster an age-friendly work environment and adopt diversity and inclusion business practices that include age among other
demographic factors (e.g., gender, race, religion, sexual orientation).
9. Offer other health and welfare benefits that can enhance and protect workers’ long-term financial security and health.
Benefits such as health, disability, life, and long-term care insurance; workplace wellness and financial wellness programs;
and employee assistance programs can help protect employees’ long-term health and financial security.

Recommendations for Policymakers
34
Before the pandemic, many Americans were already at risk of not achieving a financially secure retirement. Now, the risk is
greater than ever before. Policymakers should be commended for their recent efforts in enacting legislation and implementing
reforms that promote retirement security.
Policymakers have an opportunity to pursue additional reforms to further enhance retirement security, as well as pave the way
for public/private collaborations. By working together, policymakers, industry, nonprofits, academics, and employers can
transform and fully modernize the U.S. retirement system to ensure that current and future generations of retirees have the
ability to retire with dignity.
With Aegon Center for Longevity and Retirement (Netherlands) and nonprofit Instituto de Longevidade Mongeral Aegon (Brazil),
TCRS has called for a new social contract for retirement that includes these nine essential design features:
1. Sustainable social security benefits. Preserve this fundamental source of guaranteed retirement income for today’s and
tomorrow’s retirees.
2. Universal access to retirement savings arrangements. Ensure coverage for employed workers, the self-employed, the
unemployed, and those with parenting, caregiving, or other responsibilities.
3. Automatic savings and other applications of behavioral economics. Leverage automatic savings features and matching
contributions to make it easier and more convenient for people to save and invest for retirement.
4. Guaranteed lifetime income solutions. Educate people on how to strategically manage their savings to avoid running out of
money and raise awareness about ways to annuitize all or part of their retirement savings.
5. Financial education and literacy. Improve people’s basic understanding of financial matters, starting in early childhood
through adulthood, to help people make informed decisions.
6. Lifelong learning, longer working lives, flexible retirement. Provide tools and resources for reskilling and keeping skills up to
date, and options for phased retirement so that people can remain economically active for longer and transition into
retirement on their own terms.
7. Accessible and affordable health care. Reinforce healthy aging through quality health care. Provide access to healthy work
environments and workplace wellness programs at the employer level.
8. A positive view of aging. Celebrate the value of older individuals and take full advantage of the gift of longevity.
9. An age-friendly world. Enable people to “age in place” in their own homes and live in vibrant communities to promote vitality
and economic growth designed for people of all ages.

Retirement Security Amid COVID-19:
The Outlook of Three Generations
Detailed Findings
35

Millennials (Born 1979 to 2000)
Millennials are a generation of digital natives and do-it-yourself retirement savers. Millennials were entering the workforce
around the time of the Great Recession — with higher levels of student debt than previous generations. As retirement
investors, they began saving in a depressed market and have enjoyed one of the longest-running bull markets in history. The
coronavirus pandemic and 2020 recession marks the first major market downturn they have experienced. Unlike their
parents’ generation, many Millennials expect their primary source of retirement income to be self-funded through retirement
accounts (e.g., 401(k)s, 403(b)s, IRAs), or other savings and investments. Most are concerned that Social Security will not
be there for them when they are ready to retire.
36
Age 24is the age (median) that
Millennial investors started saving for
retirement.
Pg. 86
72%are already saving for
retirement in a company-sponsored 401(k) or similar plan, and/or
outside the workplace.
Pg. 86
26%have student loan debt.
Pg. 55
$23,000is the amount saved in all
household retirement accounts (median).
Pg. 80
is the percentage of their annual salaries (median)
that Millennial participants are
contributing to 401(k) or similar plans.
10
Pg. 105
$3,000is the amount of
emergency savings to cover unexpected major
financial setbacks (median).
Pg. 56
72%would like to receive
more information and advice from their
employers on how to achieve their retirement
goals.Pg. 111
20%say their confidence in
their ability to retire comfortably has declined
in light of COVID-19.
Pg. 41

Generation X (Born 1964 to 1978)
Generation X entered the workforce in the late 1980s just as 401(k) plans were making their first appearance and
defined benefit plans were beginning to disappear. Generation X workers are the first generation to have access to
401(k) plans for the majority of their working careers. Most are saving for retirement, but many are behind on their
savings. The oldest Generation Xers are now in their mid-50s and the youngest are in their early 40s. Although they are
in their sandwich years, during which they may be juggling their careers with raising children and caring for aging
parents, there is no time like the present for them to fully engage in building long-term financial plans.
37
52%have credit card debt.
Pg. 55
10is the percentage of their annual salaries (median)
that Generation X participants are
contributing to 401(k) or similar plans.
Pg. 105
Age 30is the age (median) that
Generation X started saving for retirement.
Pg. 86
$64,000is the amount saved in all
household retirement accounts (median).
Pg. 80
69%would like to receive
more information and advice from their
employers on how to achieve their retirement
goals.Pg. 111
$5,000is the amount of
emergency savings to cover unexpected major
financial setbacks (median).
Pg. 56
78%are saving for retirement in a company-sponsored
401(k) or similar plan and/or outside the
workplace.
Pg. 86
25%Say their confidence in
their ability to retire comfortably has declined
in light of COVID-19.
Pg. 41

Baby Boomers (Born 1946 to 1964)
Baby Boomers are the generation that has re-written societal rules at every stage of their lives. Now, they are redefining
“retirement” for themselves and generations to follow. Many were already mid-career when the retirement landscape
shifted from defined benefit plans to 401(k) or similar plans. They have not had a time horizon of 40-plus years to save
in 401(k)s. Many were hit hard during the Great Recession and now the pandemic. Unlike younger generations, they
have less time to financially recover before they retire. Baby Boomer workers are planning to work to older ages than
previous generations, yet few have a backup plan if forced into retirement unexpectedly. Amid the pandemic, they face
greater health and employment-related risks than younger generations.
38
32%say their confidence in
their ability to retire comfortably has declined
in light of COVID-19.
Pg. 41
37%expect Social Security to
be their primary source of income in retirement.
Pg. 84
7 in 1068 percent either expect to or already are working
past age 65 or do not plan to retire.
Pg. 72
$15,000is the amount saved for
emergencies to cover unexpected major financial setbacks
(median).
Pg.56
Age 35is the age (median) that Baby Boomer investors
started saving for retirement.
Pg. 86
$144,000is the amount saved in all
household retirement accounts (median).
Pg. 80
are saving for retirement in a company-sponsored
401(k) or similar plan and/or outside the
workplace.
84%
Pg. 86
10is the percentage of their annual salaries (median)
that Baby Boomer participants are
contributing to 401(k) or similar plans.
Pg. 105

COVID-19: Impact on Work, Finances, and Retirement
39

My Retirement Confidence During COVID-19 Has Changed Because…
I have a solid plan
plus real estate so I will
have money, unless we face
a major depression.
Age 55 Gen X Male
Very confident – Stayed the same
It made me realize that all
the planning in the world won't
prepare you for these kinds of events
and it is scary.
Age 28 Millennial Female
Not too confident - Declined
I am confused
about how the funds will last
should I live a long life.
Age 64 Boomer Female
Somewhat confident - Declined
40
The value of my IRA,
403(b), and Roth accounts
have plummeted significantly.
Age 58 Boomer Male
Not too confident - Declined
While my income
is reduced, I am maintaining a
dollar cost averaging strategy to
take advantage of gains when they come.
Age 40 Millennial Male
Somewhat confident – Stayed the same
I am graduating
from university at the end of
May 2020 into a recession.
My chances of getting an entry level
position in my field of interest has decreased
significantly due to companies rescinding
their offers due to COVID-19.
Age 23 Millennial Female
Somewhat confident – Declined
I draw a pension
that supports my lifestyle.
Age 70 Boomer Male
Very Confident – Stayed the same
More self-peace.
Age 45 Gen X Male
Very confident - Improved
I may lose my job soon
and retirement benefits
will stop.
Age 49 Gen X Female
Not too confident - Declined
BASE: APRIL 2020 SUPPLEMENTAL SURVEY - ALL QUALIFIED RESPONDENTSQ8810. How has your confidence in your ability to retire comfortably changed in light of the coronavirus pandemic?Q8805. Why are you [Q8810] that you will be able to fully retire with a lifestyle you consider comfortable?

Retirement Confidence Is Changing
Almost one in four workers (23 percent) say their confidence in their ability to retire comfortably has declined
in light of the pandemic. Across generations, the decline in retirement confidence increases with age:
Millennials (20 percent), Generation X (25 percent), and Baby Boomers (32 percent). Fifty-three percent of
workers say their retirement confidence remains unchanged, while 13 percent said it has improved and 11
percent answered “don’t know/not sure.”
23
53
13
11
All Workers
BASE: APRIL 2020 SUPPLEMENTAL SURVEY - ALL QUALIFIED RESPONDENTSQ8810. How has your confidence in your ability to retire comfortably changed in light of the coronavirus pandemic?
20
25
32
51
56
53
18
9
5
11
10
10
Millennials
GenerationX
BabyBoomers
Declined Stayed the same Improved Don’t know/Not sure
How has your confidence in your ability to retire comfortably changed in light of the coronavirus pandemic? (%)
41

Workers’ Employment Has Been Impacted
As a result of the coronavirus pandemic, almost six in 10 workers (58 percent) say that they have
experienced an impact(s) to their employment situation, including three in 10 who cite reduced work hours
(29 percent). Other impacts include: reduced salary (17 percent), laid off (16 percent), furloughed (11
percent), and retired early (5 percent).
42
29
17 16
11
5
12
7 6 5 3 3
32
Reducedwork hours
Reducedsalary
Laid off Furloughed Retired early Spouse/Partner/
Significantother
reduced workhours
Spouse/Partner/
Signficantother
reducedsalary
Spouse/Partner/
Significantother
laid off
Spouse/Partner/
Significantother
furloughed
Spouse/Partner/
Significantother
retired early
Otheremployment
impacts
None - Notbeen
impacted
Have you or your spouse/partner/significant other experienced any of the following employment impacts as a result of the coronavirus pandemic? Select all. (%)
NET – Self Impacted58%
BASE: APRIL 2020 SUPPLEMENTAL SURVEY - ALL QUALIFIED RESPONDENTSQ8825. Have you or your spouse/partner/significant other experienced any of the following employment impacts as a result of the coronavirus pandemic? Select all.
NET – Spouse/Partner/Significant Other Impacted23%

Employment Impact Varies Somewhat by Generation
43
BASE: APRIL 2020 SUPPLEMENTAL SURVEY - ALL QUALIFIED RESPONDENTSQ8825. Have you or your spouse/partner/significant other experienced any of the following employment impacts as a result of the coronavirus pandemic? Select all.
30
17 18
11
4
15
8 8 75
2
2929
18
13
8
3
11
75 4
1 2
39
24
1613
16
6 7 8
3 41
5
32
Reducedwork hours
Reducedsalary
Laid off Furloughed Retired early Spouse/Partner/
Significantother
reduced workhours
Spouse/Partner/
Signficantother
reduced salary
Spouse/Partner/
Significantother
laid off
Spouse/Partner/
Significantother
furloughed
Spouse/Partner/
Significantother
retired early
Otheremployment
impacts
None - Notbeen
impacted
Have you or your spouse/partner/significant other experienced any of the following employment impacts as a result of the coronavirus pandemic? Select all. (%)
Workers across generations are experiencing impacts to their employment situation as a result of the
coronavirus pandemic, including: Millennials (59 percent), Generation X (53 percent), and Baby Boomers
(58 percent). Millennials (18 percent) are somewhat more likely than Generation X and Baby Boomers (both
13 percent) to have been laid off. However, Baby Boomers (16 percent) are somewhat more likely to have
been furloughed than Generation X (8 percent) and Millennials (11 percent). Of the three generations,
Generation X (39 percent) are somewhat more likely to say that their work has not been impacted by the
pandemic, compared with Millennials (29 percent) and Baby Boomers (32 percent).
NET – Self Impacted
Millennials: 59%Generation X: 53%Baby Boomers: 58%
NET – Spouse/Partner/Significant Other Impacted
Millennials: 28%Generation X: 20%Baby Boomers: 18%

Sources of Funds If Finances Are Negatively Impacted
When asked what sources of funds they have used or would use if their finances have been or would be
negatively impacted by the coronavirus pandemic, the most frequently cited source is savings (56 percent).
Other sources include: credit cards (29 percent), unemployment benefits (26 percent), and CARES Act stimulus
money (24 percent). One in six workers cite reliance on a significant other’s or spouse’s income (16 percent),
withdrawal from a retirement account (14 percent), and loan from a friend or family member (10 percent).
44
56
29 26 24
16 14 10
7 5 5
Savings Credit cards Unemploymentbenefits
CARES Actstimulus money
Significantother orspouse'sincome
Withdrawalfrom a
retirementaccount
such as a 401(k),403(b), or IRA
Loan froma friend or
familymember
Severance pay Loan froma bank including
home equityloan
Other
Which of the following sources of funds have you used/do you think you’ll rely on during time/would you rely on if your finances are negatively impacted by the coronavirus pandemic? Select all. (%)
BASE: APRIL 2020 SUPPLEMENTAL SURVEY - ALL QUALIFIED RESPONDENTSQ8830. Which of the following sources of funds have you used/do you think you’ll rely on during time/would you rely on if your finances are negatively impacted by the coronavirus pandemic? Select all.

Sources of Funds by Generation
45
53
3126 24
17 1512
8 63
60
2926
2318
1410
6 5 4
52
2730 31
14 15
5 5 7 8
Savings Credit cards Unemploymentbenefits
CARES Actstimulus money
Significantother orspouse'sincome
Withdrawalfrom a
retirementaccount
such as a 401(k),403(b), or IRA
Loan froma friend or
familymember
Severance pay Loan froma bank including
home equityloan
Other
Which of the following sources of funds have you used/do you think you’ll rely on during time/would you rely on if your finances are negatively impacted by the coronavirus pandemic? Select all. (%)
When asked what sources of funds they have used or would use if their finances have been or would be
negatively impacted by the coronavirus pandemic, workers across generations cite reliance on similar sources of
funds. Savings is the most frequently cited source across generations, including Generation X (60 percent),
Millennials (53 percent), and Baby Boomers (52 percent). Approximately three in 10 expect to rely on credit cards
(Millennials-- 31 percent, Generation X-- 29 percent, Baby Boomers-- 27 percent). Just over one in four expect to
rely on unemployment benefits (Millennials and Generation X– both 26 percent, Baby Boomers– 30 percent).
With regard to CARES Act stimulus money, Baby Boomers (31 percent) are somewhat more likely than Millennials
and Generation X (24 percent, 23 percent respectively) to rely on it.
BASE: APRIL 2020 SUPPLEMENTAL SURVEY - ALL QUALIFIED RESPONDENTSQ8830. Which of the following sources of funds have you used/do you think you’ll rely on during time/would you rely on if your finances are negatively impacted by the coronavirus pandemic? Select all.
Millennials Generation X Baby Boomers

Seven in 10 Are Saving for Retirement
Seven in 10 workers are currently saving for retirement through their current/former employer’s retirement
plan and/or outside the workplace. Millennials (72 percent) and Generation X (74 percent) are somewhat
more likely than Baby Boomers (70 percent) to be saving for retirement. Retirement savings in their current
employer’s 401(k), 403(b), or similar plan is more frequently cited by Generation X (57 percent) than by
Millennials (49 percent) and Baby Boomers (43 percent). Retirement savings outside the workplace tend to
increase with age: Millennials (22 percent), Generation X (31 percent), and Baby Boomers (44 percent).
Across generations, approximately one in 10 are also currently saving in a former employer’s 401(k), 403(b),
or similar plan.
46BASE: APRIL 2020 SUPPLEMENTAL SURVEY - ALL QUALIFIED RESPONDENTSQ8835. Are you currently saving for retirement? Select all.
All Workers Millennials Generation X Baby Boomers
NET – Saving for Retirement
Yes, I am saving in my current employer’s 401(k), 403(b) or similar plan.
Yes, I am saving outside of work, such as in an IRA, mutual fund, bank account, etc.
Yes, I am saving in a former employer’s401(k), 403(b) or similar plan.
No
70
47
29
12
30
72
49
22
12
28
74
57
31
13
26
70
43
44
10
30
Are you currently saving for retirement? Select all. (%)

Dipping Into Retirement Savings
Workers are feeling the financial squeeze as a result of the pandemic, and some are dipping or planning to
dip into their retirement savings. One in five workers (22 percent) have already and/or plan to take a loan
and/or withdrawal from their 401(k), 403(b), or similar plan, including 15 percent who have already done
so and 13 percent who plan to do so.
47
6 6 6 6 6 6
53
18
7
I have taken a loanfrom a 401(k),
403(b), or similarplan
I have taken anearly withdrawal
from an IRA
I have taken anearly withdrawal
from a 401(k),403(b), or similar
plan
I plan to take aloan from a 401(k),403(b), or similar
plan
I plan to take anearly withdrawal
from an IRA
I plan to take anearly withdrawal
from a 401(k),403(b), or similar
plan
I have not/do notplan to take a loan
or earlywithdrawal frommy retirement
accounts
I don't havesavings in a
qualifiedretirement
account
Not sure
As a result of the coronavirus pandemic, have you or do you plan to take out a loan or early withdrawal from a qualified retirement account such as a 401(k), 403(b) or similar plan, or IRA? Select all. (%)
NET – Have Done So15%
BASE: APRIL 2020 SUPPLEMENTAL SURVEY - ALL QUALIFIED RESPONDENTSQ8840. As a result of the coronavirus pandemic, have you or do you plan to take out a loan or early withdrawal from a qualified retirement account such as a 401(k), 403(b) or similar plan, or IRA? Select all.
NET – Plan To Do So13%
NET – Have Done So And/Or Plan To Do So
22%

Millennials Are Dipping Into Retirement Accounts
48
10 9 10 10 9 7
43
16
86 4 4 4 3 4
61
18
62 3 3 1 3 1
68
5
17
I have taken aloan from a
401(k), 403(b), orsimilar plan
I have taken anearly withdrawal
from an IRA
I have taken anearly withdrawal
from a 401(k),403(b), or similar
plan
I plan to take aloan from a
401(k), 403(b), orsimilar plan
I plan to take anearly withdrawal
from an IRA
I plan to take anearly withdrawal
from a 401(k),403(b), or similar
plan
I have not/donot plan to takea loan or early
withdrawal frommy retirement
accounts
I don't havesavings in a
qualifiedretirement
account
Not sure
As a result of the coronavirus pandemic, have you or do you plan to take out a loan or early withdrawal from a qualified retirement account such as a 401(k), 403(b) or similar plan, or IRA? Select all. (%)
Millennials are more likely than older generations to be dipping into their retirement savings. One in three
Millennials workers (33 percent) have already and/or plan to take a loan and/or withdrawal from their 401(k),
403(b), or similar plan, including 22 percent who have already done so and 20 percent who plan to do so. By
comparison, only 15 percent of Generation X and 10 percent of Baby Boomer workers have already done so
and/or plan to do so. A noteworthy 17 percent of Baby Boomers are “not sure.”
BASE: APRIL 2020 SUPPLEMENTAL SURVEY - ALL QUALIFIED RESPONDENTSQ8840. As a result of the coronavirus pandemic, have you or do you plan to take out a loan or early withdrawal from a qualified retirement account such as a 401(k), 403(b) or similar plan, or IRA? Select all.
NET – Have Done SoMillennials – 22%
Generation X – 12%Baby Boomers – 6%
NET – Plan To Do SoMillennials – 20%Generation X – 9%
Baby Boomers – 5%
NET – Have Done So And/OrPlan To Do So
Millennials – 33%Generation X – 15%
Baby Boomers – 10% Millennials
Generation X
Baby Boomers

Familiarity With CARES Act Retirement Provisions
Signed into law on March 27, 2020, the Coronavirus Aid, Relief, and Economic Security Act (CARES Act) is
the largest stimulus package in U.S. history with provisions spanning healthcare, small businesses, student
loans, and retirement plans. Workers’ level of familiarity with the Act’s provisions related to qualified
retirement accounts is relatively low. Only 17 percent of workers are “very familiar” with these provisions,
including 18 percent of Millennials, 20 percent of Generation X, and 10 percent of Baby Boomers.
49BASE: APRIL 2020 SUPPLEMENTAL SURVEY - ALL QUALIFIED RESPONDENTSQ8815. To what extent are you familiar with the retirement-savings provisions in the CARES Act (also known as the coronavirus stimulus package?
Level of familiarity with the retirement provisions in the CARES Act (coronavirus stimulus package) (%)
Very familiar Somewhat familiar
Not too familiar Not at all familiar
17
32
22
29
All Workers
18
33 25
24
Millennials
20
28
18
34
Generation X
10
31
22
37
Baby BoomersNET – Familiar= 49%
NET – Familiar= 51%
NET – Familiar= 48%
NET – Familiar= 41%

Workers’ Fragile Financial Well-Being
50
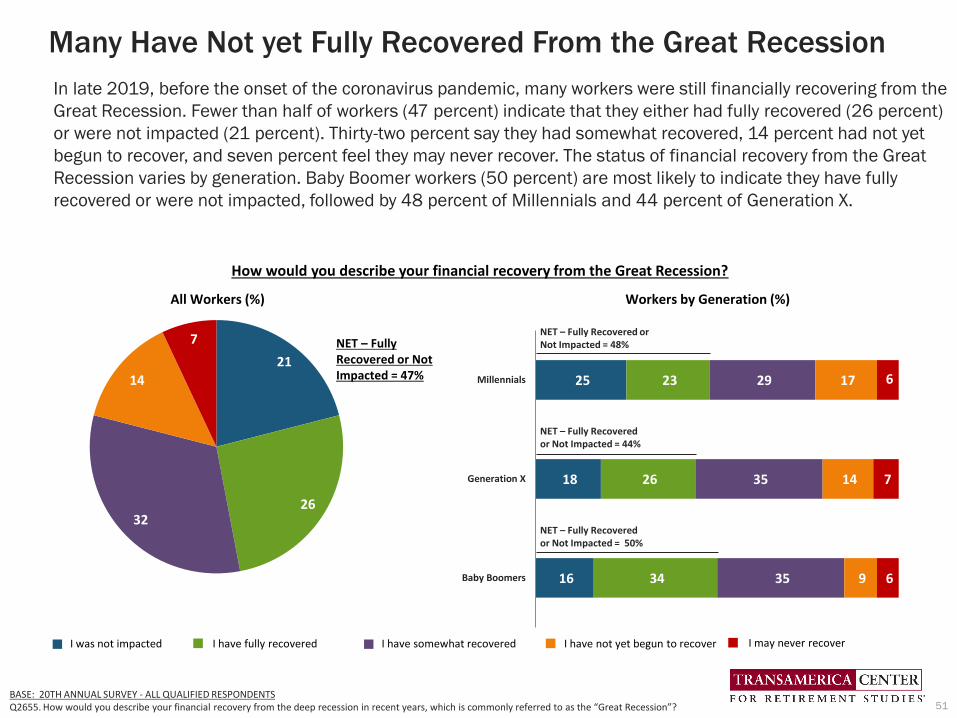
25
18
16
23
26
34
29
35
35
17
14
9
6
7
6
Millennials
Generation X
Baby Boomers
Many Have Not yet Fully Recovered From the Great Recession
In late 2019, before the onset of the coronavirus pandemic, many workers were still financially recovering from the
Great Recession. Fewer than half of workers (47 percent) indicate that they either had fully recovered (26 percent)
or were not impacted (21 percent). Thirty-two percent say they had somewhat recovered, 14 percent had not yet
begun to recover, and seven percent feel they may never recover. The status of financial recovery from the Great
Recession varies by generation. Baby Boomer workers (50 percent) are most likely to indicate they have fully
recovered or were not impacted, followed by 48 percent of Millennials and 44 percent of Generation X.
51BASE: 20TH ANNUAL SURVEY - ALL QUALIFIED RESPONDENTSQ2655. How would you describe your financial recovery from the deep recession in recent years, which is commonly referred to as the “Great Recession”?
21
26 32
14
7
How would you describe your financial recovery from the Great Recession?
All Workers (%) Workers by Generation (%)
I was not impacted I have fully recovered I have somewhat recovered I have not yet begun to recover I may never recover
NET – Fully Recovered or Not Impacted = 47%
NET – Fully Recovered or Not Impacted = 48%
NET – Fully Recovered or Not Impacted = 44%
NET – Fully Recovered or Not Impacted = 50%
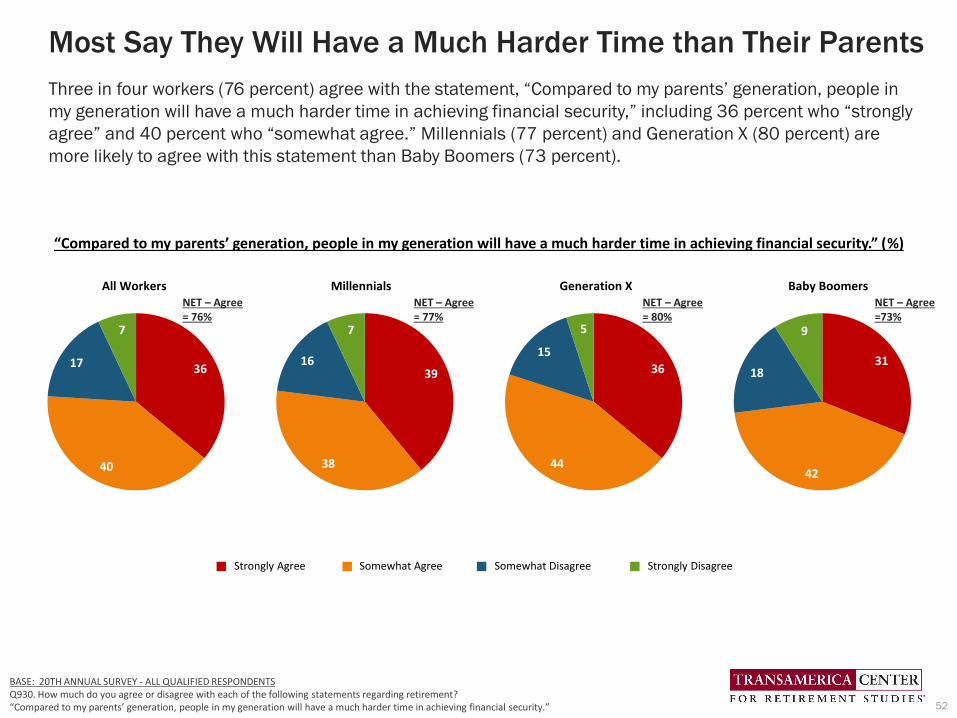
Most Say They Will Have a Much Harder Time than Their Parents
Three in four workers (76 percent) agree with the statement, “Compared to my parents’ generation, people in
my generation will have a much harder time in achieving financial security,” including 36 percent who “strongly
agree” and 40 percent who “somewhat agree.” Millennials (77 percent) and Generation X (80 percent) are
more likely to agree with this statement than Baby Boomers (73 percent).
52
BASE: 20TH ANNUAL SURVEY - ALL QUALIFIED RESPONDENTSQ930. How much do you agree or disagree with each of the following statements regarding retirement? “Compared to my parents’ generation, people in my generation will have a much harder time in achieving financial security.”
“Compared to my parents’ generation, people in my generation will have a much harder time in achieving financial security.” (%)
Strongly Agree Somewhat Agree Somewhat Disagree Strongly Disagree
36
40
17
7
All Workers
39
38
16
7
Millennials
36
44
15
5
Generation X
31
42
18
9
Baby BoomersNET – Agree= 76%
NET – Agree= 77%
NET – Agree= 80%
NET – Agree=73%

Workers Face Competing Financial Priorities
Workers face competing financial priorities that make it challenging to save for retirement in the best of times.
Amid the COVID-19 recession, the percentage of workers who cite “saving for retirement” as a financial priority
declined from 54 percent before the pandemic to 45 percent, while those citing “building emergency savings”
slightly increased from 37 percent to 39 percent. To a greater or lesser extent, these shifts occurred among
workers across generations. Before and during the pandemic, the majority of workers across generations cite
“paying off some form of debt” as a financial priority. Approximately three in 10 are “just getting by to cover basic
living expenses.”
53
All Workers Millennials Generation X Baby Boomers
Saving for retirement
Building emergency savings
Just getting by to cover basic living expenses
NET – Paying off debt
Paying off credit card
Paying off mortgage
Paying off other consumer debt
Paying off student loans
Supporting children
Paying healthcare expenses
Contributing to an education fund
Creating an inheritance or financial legacy
Supporting parents
Paying long-term care expenses
Supporting grandchildren
Other
BASE: 20TH ANNUAL SURVEY and APRIL 2020 SUPPLEMENTAL SURVEY - ALL QUALIFIED RESPONDENTS
Q2639. Which of the following are your financial priorities right now? Select all.
Financial Priorities Right Now (%)
54
37
32
61
39
28
16
14
27
23
15
13
10
7
5
6
45
39
31
56
31
26
16
13
26
22
14
12
14
9
7
6
45
39
39
63
39
26
17
22
34
24
17
14
15
10
3
6
37
40
30
57
30
23
16
19
27
23
17
11
17
8
6
7
59
36
29
66
42
34
16
10
34
21
18
12
8
6
6
4
53
39
30
57
34
31
20
6
37
21
14
14
12
10
7
3
69
34
22
53
35
29
14
5
10
23
7
13
3
4
6
6
61
39
32
57
33
34
15
5
12
23
11
16
3
8
10
6
20th AnnualApril 2020
20th AnnualApril 2020
20th AnnualApril 2020
20th AnnualApril 2020
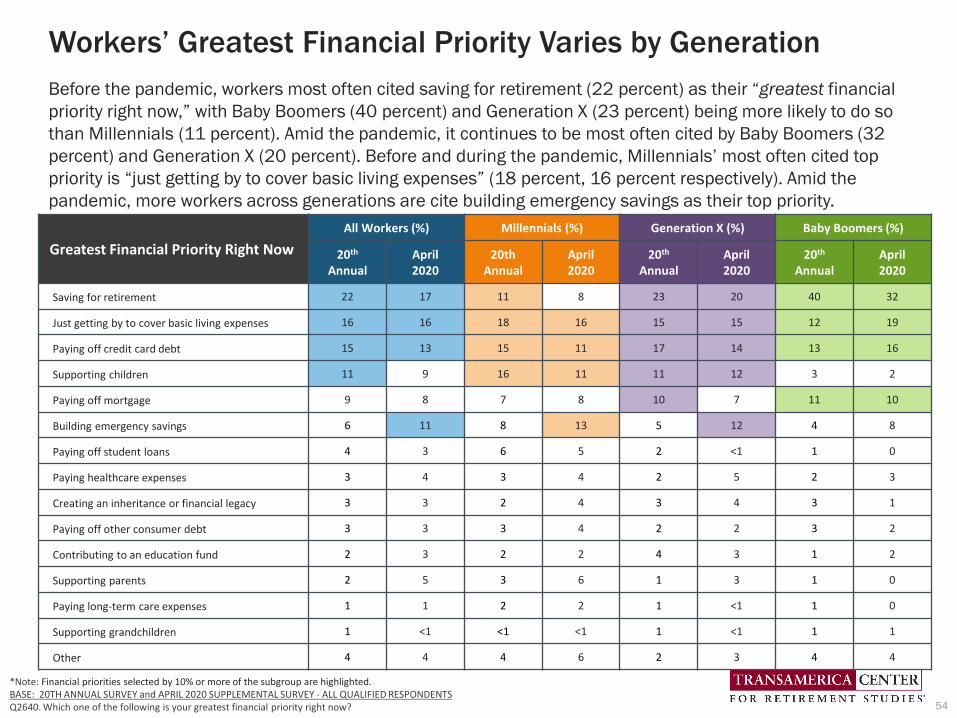
Workers’ Greatest Financial Priority Varies by Generation
Before the pandemic, workers most often cited saving for retirement (22 percent) as their “greatest financial
priority right now,” with Baby Boomers (40 percent) and Generation X (23 percent) being more likely to do so
than Millennials (11 percent). Amid the pandemic, it continues to be most often cited by Baby Boomers (32
percent) and Generation X (20 percent). Before and during the pandemic, Millennials’ most often cited top
priority is “just getting by to cover basic living expenses” (18 percent, 16 percent respectively). Amid the
pandemic, more workers across generations are cite building emergency savings as their top priority.
54
*Note: Financial priorities selected by 10% or more of the subgroup are highlighted.BASE: 20TH ANNUAL SURVEY and APRIL 2020 SUPPLEMENTAL SURVEY - ALL QUALIFIED RESPONDENTSQ2640. Which one of the following is your greatest financial priority right now?
Greatest Financial Priority Right Now
All Workers (%) Millennials (%) Generation X (%) Baby Boomers (%)
20th
AnnualApril 2020
20th Annual
April 2020
20th
AnnualApril 2020
20th
AnnualApril 2020
Saving for retirement 22 17 11 8 23 20 40 32
Just getting by to cover basic living expenses 16 16 18 16 15 15 12 19
Paying off credit card debt 15 13 15 11 17 14 13 16
Supporting children 11 9 16 11 11 12 3 2
Paying off mortgage 9 8 7 8 10 7 11 10
Building emergency savings 6 11 8 13 5 12 4 8
Paying off student loans 4 3 6 5 2 <1 1 0
Paying healthcare expenses 3 4 3 4 2 5 2 3
Creating an inheritance or financial legacy 3 3 2 4 3 4 3 1
Paying off other consumer debt 3 3 3 4 2 2 3 2
Contributing to an education fund 2 3 2 2 4 3 1 2
Supporting parents 2 5 3 6 1 3 1 0
Paying long-term care expenses 1 1 2 2 1 <1 1 0
Supporting grandchildren 1 <1 <1 <1 1 <1 1 1
Other 4 4 4 6 2 3 4 4
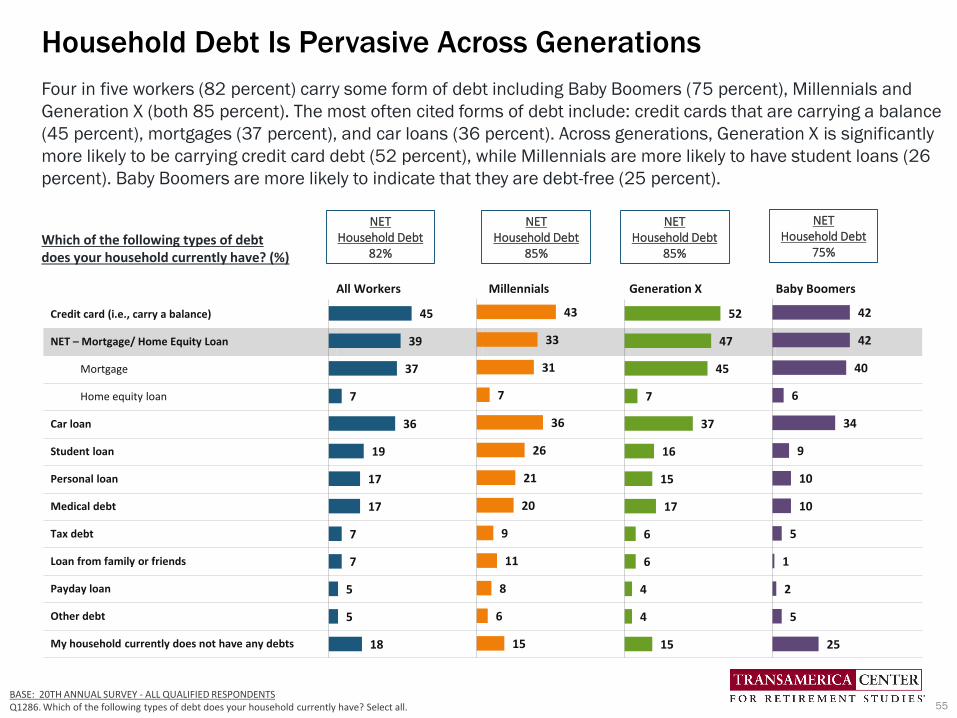
Four in five workers (82 percent) carry some form of debt including Baby Boomers (75 percent), Millennials and
Generation X (both 85 percent). The most often cited forms of debt include: credit cards that are carrying a balance
(45 percent), mortgages (37 percent), and car loans (36 percent). Across generations, Generation X is significantly
more likely to be carrying credit card debt (52 percent), while Millennials are more likely to have student loans (26
percent). Baby Boomers are more likely to indicate that they are debt-free (25 percent).
Household Debt Is Pervasive Across Generations
All Workers Millennials Generation X Baby Boomers
Credit card (i.e., carry a balance)
NET – Mortgage/ Home Equity Loan
Mortgage
Home equity loan
Car loan
Student loan
Personal loan
Medical debt
Tax debt
Loan from family or friends
Payday loan
Other debt
My household currently does not have any debts
45
39
37
7
36
19
17
17
7
7
5
5
18
43
33
31
7
36
26
21
20
9
11
8
6
15
52
47
45
7
37
16
15
17
6
6
4
4
15
42
42
40
6
34
9
10
10
5
1
2
5
25
BASE: 20TH ANNUAL SURVEY - ALL QUALIFIED RESPONDENTS Q1286. Which of the following types of debt does your household currently have? Select all.
Which of the following types of debt does your household currently have? (%)
NETHousehold Debt
82%
NETHousehold Debt
85%
NETHousehold Debt
85%
NETHousehold Debt
75%
55

Emergency Savings Are Alarmingly Low
Having emergency savings to cover unexpected major financial setbacks, such as unemployment, medical
bills, home repairs, auto repairs, and other, could help workers avoid dipping into their retirement savings.
However, workers have only $5,000 (median) in emergency savings, with 29 percent reporting having less
than $5,000. Emergency savings increase with age: Millennial workers have saved $3,000, Generation X
has saved $5,000 and Baby Boomers have saved $15,000 (medians).
BASE: 20TH ANNUAL SURVEY - ALL QUALIFIED RESPONDENTSQ2825. How much do you have in emergency savings specifically to cover the cost of unexpected major financial setbacks (e.g., unemployment, medical bills, home repairs, auto repairs, other)?
3 4 3 1
1115
84
15
18
16
9
9
9
9
9
6
5
5
9
2
1
2
3
2
2
3
2
128
12
18
7 57 12
All Workers Millennials Generation X Baby Boomers
$100k or more
$25k to less than $100k
$20k to less than $25k
$15k to less than $20k
$10k to less than $15k
$5k to less than $10k
$1k to less than $5k
$1 to than $1k
None ($0)
Not sure 33 33 35 33
Total Household Emergency Savings (%)
Median $5,000 $3,000 $5,000 $15,000
56

Leakage From Retirement Accounts Is Not Uncommon
A concerning percentage of workers are dipping into
their retirement savings before they retire. This
“leakage” from retirement accounts in the form of
loans and withdrawals can severely inhibit the
growth of participants’ long-term retirement savings.
Before the pandemic, almost one in three workers
(32 percent) said they have taken some form of
loan, early withdrawal, and/or hardship withdrawal
from a 401(k) or similar plan, or IRA.
Millennials (36 percent) are somewhat more likely to
have taken a loan and/or withdrawal. Generation X
(33 percent) are slightly less likely. Baby Boomers
(23 percent) are significantly less likely.
Workers’ frequency of taking loans (21 percent) is
similar to that of taking an early and/or hardship
withdrawal (22 percent).
57BASE: 20TH ANNUAL SURVEY - ALL QUALIFIED RESPONDENTSQ754. Have you ever taken any form of loan or early withdrawal from a qualified retirement account such as a 401(k) or similar plan or IRA? Select all.
3236
3323
All Workers Millennials Generation X Baby Boomers
Have Taken a Loan, Early Withdrawal, and/or Hardship Withdrawal from 401(k) or Similar Plan or IRA
NET - Yes (%)
2226 24
14
All Workers Millennials Generation X Baby Boomers
Have Taken an Early and/or Hardship Withdrawalfrom 401(k) or Similar Plan or IRA
Yes (%)
2125
2016
All Workers Millennials Generation X Baby Boomers
Have Taken a Loan from 401(k) or Similar Plan or IRA
Yes (%)

Paying off Debt Tops the List of Reasons for Taking 401(k) Loans
Among those who have taken a loan from their 401(k) or similar plan, the most frequently cited reason for
doing so is to pay off debt (38 percent), including credit card debt (26 percent) and/or other debt (21 percent).
Other reasons include a financial emergency (29 percent), medical bills (22 percent), and home improvements
(21 percent). Millennials (42 percent) and Generation X (38 percent) are somewhat more likely to cite paying
off debt than Baby Boomers (27 percent). Compared with older generations, Millennials are significantly more
likely to cite taking a loan to purchase a vehicle (25 percent) and to avoid eviction (17 percent).
BASE: 20TH ANNUAL SURVEY - THOSE WHO HAVE TAKEN A LOAN (Total N=1130, Millennials N=616; Gen X N=337; Baby Boomers N=161)Q659. For what purpose(s) did you take out a loan(s)? Select all.
Reasons for Taking Loan From Retirement Plan (%) All Workers Millennials Generation X Baby Boomers
NET – Pay Off Debt
Pay off credit card debt
Pay off other debt
A financial emergency
Medical bills
Home improvements
Purchase of a vehicle
Everyday expenses
Unplanned major expenses (e.g., home or car repair, etc.)
Purchase of primary residence
Avoid eviction
College tuition
Burial or funeral expense
Some other purpose
38
26
21
29
22
21
20
20
18
15
13
13
9
3
42
28
25
28
21
21
25
23
19
18
17
16
10
1
38
28
17
32
28
24
16
16
18
12
10
10
8
4
27
16
14
27
8
16
9
13
14
13
8
4
3
8
58

Reasons for Hardship Withdrawals from 401(k)s
Among those who have taken a hardship withdrawal from a 401(k) or similar plan, almost one in five workers
(19 percent) say their primary reason is payment for certain medical expenses. Baby Boomers (46 percent) are
much more likely to indicate this than Generation X (17 percent) and Millennials (16 percent). Other primary
reasons for taking hardship withdrawals include payment of tuition and related educational fees (18 percent),
expenses and losses incurred due to a disaster (18 percent), and payments to prevent eviction (15 percent).
Note: The findings for the generations reflect small sample bases and should be considered directional.
BASE: 20TH ANNUAL SURVEY - THOSE WHO HAVE TAKEN A HARDSHIP WITHDRAWAL (Total N=529, Millennials N=321; Gen X N=136; Baby Boomers N=65)Q1465. What is the primary reason you have taken a hardship withdrawal from your employee-funded retirement savings plan?
Primary Reason for Hardship Withdrawal (%) All Workers Millennials Generation X* Baby Boomers*
Pay for certain medical expenses for you, your spouse, children, dependents, or primary beneficiaries under the plan
Payment of tuition and related educational fees for the next 12 months of post-secondary education for you, your spouse, children, dependents, or primary beneficiaries under the plan
Expenses and losses (including loss of income) incurred due to a disaster located in a federally declared disaster area that included your principal residence or principal place of employment
Payments to prevent your eviction from your principal residence
Cover the costs related to the purchase of a principal residence
Expenses for repairs of damage to your principal residence that would qualify for the casualty deduction under the Internal Revenue Code
Burial or funeral expenses for your spouse, children, dependents, or primary beneficiaries under the plan
Other
19
18
18
15
10
10
7
3
*Note: Base sizes are small with fewer than 140 respondents; exercise caution when interpreting results.
16
20
20
12
11
13
8
0
17
18
12
24
10
7
7
5
46
5
16
10
10
4
1
8
59

One-Third of Workers Are and/or Have Been Caregivers
Caregiving for a family member or loved one can put the caregiver’s own health, employment, and financial
situation at risk. Thirty-five percent of workers have served as a caregiver during the course of their working
careers, including 19 percent who have been a caregiver in the past and 18 percent who are currently
caregivers. Millennials (38 percent) and Generation X (36 percent) are more likely than Baby Boomers (30
percent) to be and/or have been caregivers.
60
BASE: 20TH ANNUAL SURVEY - ALL QUALIFIED RESPONDENTSQ2500x1. Are you currently serving or have you served as a caregiver for a relative or friend during the course of your working career (excluding parenting responsibilities)? Select all.
All Workers Millennials Generation X Baby Boomers
NET – Served as Caregiver During Course of Working Career
Yes, I have been a caregiver in the past
Yes, I am currently a caregiver
No
Not sure
35
19
18
64
1
38
20
20
61
1
36
19
20
63
1
30
20
11
70
<1
Are you currently serving or have you served as a caregiver for a relative or friend during the course of your working career (excluding parenting responsibilities)? (%)

Nearly Nine in 10 Caregivers Made Work Adjustments
Among workers who are serving and/or have served as caregivers, 87 percent have made some sort of
adjustment to their work situation as a result of becoming a caregiver (e.g., used vacation days, missed days of
work, reduced hours, began working an alternative schedule, etc.). Millennials (90 percent) and Generation X (89
percent) are significantly more likely to have made adjustments compared with Baby Boomers (76 percent).
61
Work-related adjustments as a result of becoming a caregiver* (%) All Workers Millennials Generation XBaby
Boomers
NET- Made one or more adjustments 87 90 89 76
Missed days of work 34 33 36 32
Used vacation, sick days, and/or personal days off to be caregiver 33 30 36 37
Reduced my hours 22 23 24 20
Began working an alternative schedule 21 22 22 17
Took on additional hours to pay for cost of caregiving 16 17 19 9
Began to work remotely 15 19 15 8
Taken an unpaid leave of absence from my employer not covered by the Family and Medical Leave Act (FMLA)
15 19 13 11
Taken an unpaid leave of absence from my employer covered by the Family and Medical Leave Act (FMLA)
14 16 12 11
Reduced job responsibilities 14 15 13 12
Switched to a less demanding job 12 14 12 8
Taken a paid leave of absence from my employer 12 16 10 5
Quit a job 9 12 8 7
Transferred to a different location within my company 8 12 6 2
Started or transitioned to working as a contractor, freelancer, or in the sharing economy 7 10 7 3
BASE: 20TH ANNUAL SURVEY - SERVED AS A CAREGIVERQ2505x1. Which of the following have you done as a result of becoming a caregiver? Select all.
* Excludes “none,” “I was not working when I started caregiving,” and responses of less than 10 percent across all three generations (i.e., forgone a promotion, retired early, other)

Visions and Expectations of Retirement
62

Seven in 10 Are Looking Forward to Retirement
Seventy-four percent of workers are looking forward to retirement, including 33 percent who are “very much”
and 41 percent who are “somewhat” looking forward to it. Baby Boomers (39 percent) are more likely than
Generation X (31 percent) and Millennials (33 percent) to be “very much” looking forward to retirement.
63BASE: 20TH ANNUAL SURVEY - ALL QUALIFIED RESPONDENTSQ5005. How much are you looking forward to retirement?
How much are you looking forward to retirement? (%)
Very much Somewhat Not too much Not at all
33
41
19
7
All Workers
33
40
20
7
Millennials
31
44
17
8
Generation X
39
38
17
6
Baby Boomers
NET –Looking
forward = 74%
NET –Looking
forward = 73%
NET –Looking
forward = 75%
NET –Looking
forward = 77%

Most Cite Positive Word Associations With “Retirement”
Eighty-seven percent of workers cite positive word associations with “retirement” compared with only 39 percent
who cite negative words. Workers’ top three positive word associations include “freedom” (56 percent),
“enjoyment” (53 percent), and “stress-free” (43 percent), while the top three negative word associations include
“financial insecurity” (17 percent), “health decline” (17 percent), and “boredom” (14 percent).
64
56 53
43
32
25 20
17 17 14
9 8 4
Freedom Enjoyment Stress-free Fulfillment Opportunity Personalgrowth
Financialinsecurity
Health decline Boredom Dependent onothers
Isolation Unimportant
BASE: 20TH ANNUAL SURVEY - ALL QUALIFIED RESPONDENTSQ5000. Which of the following do you personally associate with the word “retirement”? Select all.
Which of the following do you personally associate with the word “retirement”?All Workers (%)
Positive (NET = 87%)
Negative (NET = 39%)
* Excludes “other” with response of 1 percent

All Three Generations Cite Positive Word Associations
Across generations, more than eight in 10 workers cite one or more positive word associations with “retirement,”
while far fewer cite negative word associations. Millennials, Generation X, and Baby Boomers share the most
frequently cited positive words: “freedom,” “enjoyment,” and “stress-free.” They also share the three most often-
cited negative word associations: “financial insecurity,” “health decline,” and “boredom.” Millennials are more
likely to associate “retirement” with “personal growth” than Baby Boomers and Generation X.
65
NETPositive
(%)
NETNegative
(%)
Freedom
(%)
Enjoyment
(%)
Stress-free
(%)
Fulfillment
(%)
Opportunity
(%)
Personal growth
(%)
Financial Insecurity
(%)
Health decline
(%)
Boredom
(%)
Dependenton others
(%)
Isolation
(%)
Unimportant
(%)
89
41 55 50 45
35 26 24 16 18 15 9 9 4
Bab
y B
oo
me
rsG
en
era
tio
n X
Mill
en
nia
ls
BASE: 20TH ANNUAL SURVEY - ALL QUALIFIED RESPONDENTSQ5000. Which of the following do you personally associate with the word “retirement”? Select all.
* Excludes “other” with response of 1 percent
86
37 57 52
42 28 23 18 18 17 13 9 8 3
86
33
59 60 41
32 25 16 17 13 11 7 6 3

Many Expect Enjoyment of Life to Improve in Retirement
More than half of workers (55 percent) expect their enjoyment of life to improve when they retire, while 32
percent expect it to stay the same, eight percent expect it to decline, and five percent are “not sure.”
However, these expectations vary by generation. Millennials (61 percent) are significantly more likely than
Generation X (51 percent) and Baby Boomers (48 percent) to expect their enjoyment of life to improve.
66BASE: 20TH ANNUAL SURVEY - ALL QUALIFIED RESPONDENTSQ2510X. Do you expect the following aspects of your life to improve, decline, or stay the same when you retire? Enjoyment of life.
Do you expect your enjoyment of life to improve, stay the same, or decline in retirement? (%)
Improve Stay the same Decline Not sure
55 32
8 5
All Workers
61
27
7 5
Millennials
51
33
9
7
Generation X
48
41
8 3
Baby Boomers

Workers Are Dreaming of an Active Retirement
Traveling (65 percent) is workers’ most frequently cited retirement dream, followed by spending more time with
family and friends (57 percent), and pursuing hobbies (46 percent). A noteworthy one-third of workers dream of
doing some form of paid work in retirement, such as starting a business (17 percent), pursuing an encore
career (12 percent), and/or continuing to work in the same field (11 percent). One in four workers (24 percent)
dreams of spending their retirement doing volunteer work.
67
65
57
46
24
17
12 11
4 3
Traveling Spending moretime with
family & friends
Pursuinghobbies
Doingvolunteer work
Starting abusiness
Pursuing anencore career
(new role, work,activity, or career)
Continueworking in
the same field
Other None ofthe above
How do you dream of spending your retirement?All Workers (%)
BASE: 20TH ANNUAL SURVEY - ALL QUALIFIED RESPONDENTSQ1418. How do you dream of spending your retirement? Select all.
NET – Working= 33%

Workers Across Generations Share Similar Retirement Dreams
68BASE: 20TH ANNUAL SURVEY - ALL QUALIFIED RESPONDENTSQ1418. How do you dream of spending your retirement? Select all.
Note: Responses not shown for the less than 6 percent who said “none of the above.”
67
58
48
2124
1410
2
64
57
43
24
14 13 13
3
64
55
45
29
79
117
Traveling Spending moretime with
family & friends
Pursuinghobbies
Doingvolunteer work
Starting abusiness
Pursuing anencore career
(new role, work,activity, or career)
Continueworking in
the same field
Other
How do you dream of spending your retirement?By Generation (%)
NET – Working
Millennials: 38%Generation X: 33%Baby Boomers: 23%
Workers’ top three retirement dreams — traveling, spending more time with family and friends, and pursuing
hobbies — are common across the generations. However, some retirement dreams differ across generations.
Baby Boomers (29 percent) are more likely to dream of doing volunteer work, compared with Generation X (24
percent) and Millennials (21 percent). In contrast, Millennials (38 percent) are more likely to dream of working in
retirement (e.g., starting a business, pursuing an encore career, continue working in the same field), compared
with Generation X (33 percent) and Baby Boomers (23 percent).

Retirement Fears Range from Financial to Health-Related
The most frequently cited retirement fears are outliving savings and investments (40 percent), a reduction in or
elimination of Social Security (39 percent), declining health that requires long-term care (34 percent), and not
being able to meet the family’s basic financial needs (32 percent).
Approximately three in 10 workers fear possible long-term care costs (29 percent), cognitive decline/dementia/
Alzheimer’s Disease (28 percent), and a lack of access to adequate and affordable healthcare (28 percent).
One in four (25 percent) fear losing independence. Other fears include: affordable housing (21 percent),
feeling isolated and alone (20 percent), finding meaningful ways to spend time and stay involved (18 percent),
and being laid off — not being able to retire on their own terms (16 percent).
69
40 39
34 32
29 28 28 25
21 20 18
16
7
Outliving mysavings andinvestments
SocialSecuritywill be
reduced orcease to existin the future
Declininghealth that
requireslong-term
care
Not beingable to
meet thebasic financial
needs ofmy family
Possiblelong-termcare costs
Cognitivedecline,
dementia,Alzheimer's
Disease
Lack of accessto adequate
and affordablehealthcare
Losing myindependence
Affordablehousing
Feeling isolatedand alone
Findingmeaningful
ways to spendtime & stay
involved
Being laid off -not being
able to retireon my own
terms
None ofthe above
What are your greatest fears about retirement?All Workers (%)
BASE: 20TH ANNUAL SURVEY - ALL QUALIFIED RESPONDENTSQ1422. What are your greatest fears about retirement? Select all.
* Excludes “other”

Retirement Fears Are Shared Across Generations
70
37 36
31
36
27 2826 26
24 25
1921
5
4139
33 33
2927 28
2421
16 17
13
8
45 46
41
25
34
2831
24
1715 16
11 10
Outliving mysavings andinvestments
SocialSecuritywill be
reduced orcease to existin the future
Declininghealth that
requireslong-term
care
Not beingable to
meet thebasic financial
needs ofmy family
Possiblelong-termcare costs
Cognitivedecline,
dementia,Alzheimer's
Disease
Lack of accessto adequate
and affordablehealthcare
Losing myindependence
Affordablehousing
Feelingisolated
and alone
Findingmeaningful
ways to spendtime & stay
involved
Being laid off -not being
able to retireon my own
terms
None ofthe above
What are your greatest fears about retirement?By Generation (%)
Millennials
Generation X
Baby Boomers
Across generations, workers share the same top retirement fear: outliving savings and investments. Other fears
vary by generation, such as the fear of a reduction in or elimination of Social Security, which is more frequently
cited by Baby Boomers (46 percent) than by Generation X (39 percent) and Millennials (36 percent). Baby
Boomers are more likely to cite a fear of declining health that requires long-term care (41 percent) than
Generation X (33 percent) and Millennials (31 percent). Not being able to meet the family’s basic financial
needs is a retirement fear more likely cited by Millennials (36 percent) and Generation X (33 percent) compared
with Baby Boomers (25 percent). Millennials are also more likely to fear feeling isolated and alone (25 percent),
and being laid off — not being able to retire on their own terms (21 percent).
BASE: 20TH ANNUAL SURVEY - ALL QUALIFIED RESPONDENTSQ1422. What are your greatest fears about retirement? Select all.
* Excludes “other”

Top Criteria for Deciding Where to Live in Retirement Is Affordability
Where people live in retirement can influence their ability to achieve their dreams and possibly mitigate fears.
When thinking about very important criteria in deciding where to live in retirement, workers most often cite
affordable cost of living (65 percent), followed by proximity to family and friends (48 percent), good weather (42
percent), low crime rate (40 percent), access to excellent healthcare and hospitals (35 percent), and leisure and
recreational activities (35 percent). Ironically, although more than half of workers plan to continue working after
they retire, only 23 percent identify employment opportunities as being a very important criterion.
All Workers Millennials Generation X Baby Boomers
Affordable cost of living
Nearby family and friends
Good weather
Low crime rate
Access to excellent healthcare and hospitals
Leisure and recreational activities
A walkable community with easy access to retailers and amenities
Convenient transportation
Employment opportunities
Cultural activities and events
Community engagement or volunteer opportunities including churches and charitable organizations
Access to continuing education at nearby schools, universities, and educational resources
Other
BASE: 20TH ANNUAL SURVEY - ALL QUALIFIED RESPONDENTS
Q2725. When thinking about where you want to live in retirement, which of the following criteria will be very important in your decision-making? Select all.
Very Important Criteria for Choosing Where to Live in Retirement (%)
65
48
42
40
35
35
28
28
23
22
16
10
4
59
45
39
38
29
34
28
26
24
23
17
12
4
69
45
45
39
35
34
27
29
25
21
15
10
5
72
55
44
46
47
36
30
29
21
21
16
7
4
71

33
21
14
24
26
18
28
36
52
15
17
16
Millennials
Generation X
Baby Boomers
More Than Half of Workers Expect to Work Past Age 65
Fifty-two percent of workers expect to work past age 65 or do not plan to retire. Expectations of doing so increase
with age. Almost seven in 10 Baby Boomers (68 percent) either expect to or are already working past age 65 or
do not plan to retire, compared with 53 percent of Generation X and only 43 percent of Millennials. In contrast,
the majority of Millennials (57 percent) plan to retire at age 65 or sooner.
72BASE: 20TH ANNUAL SURVEY - ALL QUALIFIED RESPONDENTSQ910. At what age do you expect to retire?
25
23 36
16
At what age do you expect to retire?
All Workers (%)
Before Age 65 At Age 65 After Age 65 Do Not Plan to Retire
Workers by Generation (%)NET – After Age 65
or Do Not Plan to Retire = 43%
NET – After Age 65 or Do Not Plan to Retire = 52%
NET – After Age 65 or Do Not Plan to Retire = 53%
NET – After Age 65 or Do Not Plan to Retire = 68%

19
19
12
38
39
42
27
22
29
16
20
17
Millennials
Generation X
Baby Boomers
More Than Half of Workers Plan to Work in Retirement
Fifty-seven percent of workers plan to work after they retire, including 40 percent who plan to work part-time
and 17 percent full-time. Just 26 percent do not plan to work after they retire and 17 percent are not sure.
Baby Boomers, Generation X, and Millennials share similar expectations of working in retirement; however,
Millennials and Generation X (both 19 percent) are significantly more likely than Baby Boomers (12 percent)
to plan to work full time after they retire.
73BASE: 20TH ANNUAL SURVEY - ALL QUALIFIED RESPONDENTSQ1525. Do you plan to work after you retire?
17
40
26
17
Do you plan to work after you retire?
All Workers (%)
NET – Plan to Work = 57%
Yes, I plan to work full time
Yes, I plan to work part time
No, I do not plan to work
Not sure
Workers by Generation (%)
NET Plan to Work = 57%
NET Plan to Work = 58%
NET Plan to Work = 54%
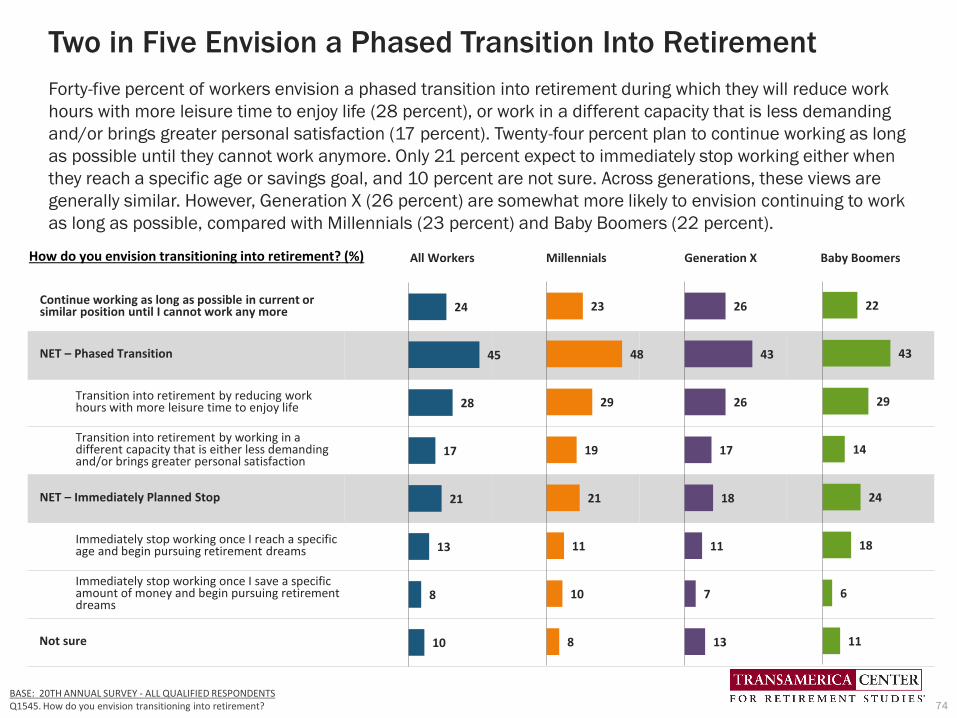
Two in Five Envision a Phased Transition Into Retirement
Forty-five percent of workers envision a phased transition into retirement during which they will reduce work
hours with more leisure time to enjoy life (28 percent), or work in a different capacity that is less demanding
and/or brings greater personal satisfaction (17 percent). Twenty-four percent plan to continue working as long
as possible until they cannot work anymore. Only 21 percent expect to immediately stop working either when
they reach a specific age or savings goal, and 10 percent are not sure. Across generations, these views are
generally similar. However, Generation X (26 percent) are somewhat more likely to envision continuing to work
as long as possible, compared with Millennials (23 percent) and Baby Boomers (22 percent).
74
BASE: 20TH ANNUAL SURVEY - ALL QUALIFIED RESPONDENTSQ1545. How do you envision transitioning into retirement?
How do you envision transitioning into retirement? (%) All Workers Millennials Generation X Baby Boomers
Continue working as long as possible in current or similar position until I cannot work any more
NET – Phased Transition
Transition into retirement by reducing work hours with more leisure time to enjoy life
Transition into retirement by working in a different capacity that is either less demanding and/or brings greater personal satisfaction
NET – Immediately Planned Stop
Immediately stop working once I reach a specific age and begin pursuing retirement dreams
Immediately stop working once I save a specific amount of money and begin pursuing retirement dreams
Not sure
24
45
28
17
21
13
8
10
23
48
29
19
21
11
10
8
26
43
26
17
18
11
7
13
22
43
29
14
24
18
6
11

All Workers Millennials Generation X Baby Boomers
If I reduce my work hours, I would expect to be paid the same hourly rate for hours worked.
If I were to take on a new role with fewer responsibilitiesat my employer, I would expect my job title to change.
If I were to take on a new role with fewer responsibilities, I would expect to be paid the market rate for the duties involved, even if it means a reduction in my level of pay.
If I were to shift from full-time to part-time, I would expect to receive the same employee benefits.
78
76
74
61
Most Are Realistic About Compensation in Phased Retirement
Among workers who envision a phased transition into retirement, most have realistic expectations regarding how
changes in their work arrangements may affect their compensation, job title, and benefits. Most agree that if they
were to reduce their hours, they would expect to be paid the same hourly rate (78 percent). If they were to take on
a new role with fewer responsibilities, the majority would expect their job title to change (76 percent) and would
expect to be paid the market rate for duties involved, even if it means a reduction in their level of pay (74 percent).
Notably, three in five workers (61 percent) say that if they were to shift from full- to part-time work, they would
expect the same level of employee benefits — an expectation that may not be realistic because many employers do
not offer benefits to part-time workers.
75BASE: 20TH ANNUAL SURVEY - RESPONDENTS WHO ENVISION A PHASED TRANSITION INTO RETIREMENTQ1546. In thinking about your vision of transitioning into retirement, to what extent do you agree or disagree with the following statements?
In thinking about your vision of transitioning into retirement, to what extent do you agree or disagree with the following statements? (NET - Agree %)
83
76
76
55
75
76
71
62
80
79
77
62

Reasons for Working in Retirement Include Financial and Health
Among workers who are or plan to work in retirement and/or past age 65, an equal proportion cite financial
and healthy-aging reasons (both 78 percent). The most often cited financial reason is workers want the
income (51 percent), while the top healthy-aging reason is to be active (50 percent). Other frequently cited
healthy-aging reasons cluster around “keep my brain alert” (40 percent), “enjoy what I do” (38 percent), and
“have a sense of purpose” (34 percent). Other frequently cited financial reasons cluster around “can’t afford
to retire” (31 percent), “concerned that Social Security will be less than expected” (31 percent), and “need
health benefits” (26 percent).
76
51 50
40 38 34 31 31
26 23 19 16
10 2
Want theincome
Be active Keep mybrain alert
Enjoy what Ido
Have a senseof purpose
Can't affordto retire
because Ihaven't saved
enough
Concernedthat Social
Security willbe less than
expected
Need healthbenefits
Maintainsocial
connections
Personaldevelopment
Concernedthat
employerretirement
benefits willbe less than
expected
Anxiousabout
volatility infinancial
markets andinvestment
performance
None of theabove
BASE: 20TH ANNUAL SURVEY - PLAN ON RETIRING AFTER 65 AND/OR WORKING AFTER RETIREMENTQ1530x1. What are your reason(s) for working in retirement or past age 65? Select all.
What are your reason(s) for working in retirement or past age 65?All Workers (%)
Financial reasons (NET = 78%)
Healthy-aging reasons (NET = 78%)

Generations Share Common Reasons for Working in Retirement
Overall, workers across generations similarly share financial and healthy aging-related reasons for working past
age 65 and/or in retirement with some noteworthy differences. Baby Boomers are significantly more likely than
the other generations to indicate they want the income (59 percent). Generation X is somewhat more likely to
indicate that they can’t afford to retire because they haven’t saved enough (37 percent). Millennials are
significantly more likely to cite “personal development” (23 percent).
77
Note: Responses not shown for the less than 4 percent who said “none of the above.”
BASE: 20TH ANNUAL SURVEY - PLAN ON RETIRING AFTER 65 AND/OR WORKING AFTER RETIREMENTQ1530x1. What are your reason(s) for working in retirement or past age 65? Select all.
NET
Financial Reasons
(%)
NET
Healthy-aging
Reasons (%)
Want the income
(%)
Be active
(%)
Keep my brain alert
(%)
Enjoy what
I do
(%)
Have a sense of purpose
(%)
Can’t afford to retire because I haven’t
saved enough
(%)
Concerned that Social
Security will be less than
expected
(%)
Need health benefits
(%)
Maintain social
connections
(%)
Personal development
(%)
Concernedemployer
retirement benefits will be less than expected (%)
Anxious re: volatility in
financial markets and investment
performance (%)
77 78
46 46 36 36 32 28 27 25 22 23 18 12
Bab
y B
oo
me
rsG
en
era
tio
n X
Mill
en
nia
ls
77 77
52 51 41 36 33 37 36 30 23 16 16 9
79 78 59 57
45 42 36 32 32 25 22 14 12 9

All Workers Millennials Generation X Baby Boomers
Staying healthy so I can continue working
Performing well at my current job
Keeping my job skills up to date
Networking and meeting new people
Scoping out the employment market and opportunities available
Going back to school and learning new skills
Other
I have not taken any steps to ensure I’ll be able to continue working past age 65 or in retirement, if needed
48
44
40
20
16
12
3
24
50
40
38
21
15
12
4
23
Workers Can Take More Steps to Continue Working Past 65
Workers must be healthy enough and have access to employment opportunities in order to fulfill their
aspirations and expectations of working past age 65. However, when asked what steps they are taking to
ensure they can continue working, relatively few are taking adequate action. Before and during the pandemic,
approximately half said they are staying healthy so they can continue working, while approximately four in 10
are focused on performing well at their current job and keeping their job skills up to date. One in five are
networking and meeting new people. Around one in four workers have not taken any steps.
78BASE: 20TH ANNUAL SURVEY and APRIL 2020 SUPPLEMENTAL SURVEY - ALL QUALIFIED RESPONDENTSQ1531. Have you taken any steps to help ensure that you’ll be able to continue working past 65 or in retirement, if needed? Select all.
Have you taken any steps to ensure that you’ll be able to continue working past 65 or in retirement, if needed? (%)
45
46
37
19
14
11
2
27
56
43
40
20
12
9
3
24
56
48
40
15
11
5
2
25
53
48
37
13
15
10
7
26
45
41
42
24
19
16
3
20
45
38
36
27
19
16
2
21
20th AnnualApril 2020
20th AnnualApril 2020
20th AnnualApril 2020
20th AnnualApril 2020

Retirement Savings, Planning, and Preparations
79

Retirement Savings May Not Be Adequate
Total household retirement savings among all workers is $50,000 (estimated median). Baby Boomer workers
have the highest retirement savings at $144,000, compared with Generation X ($64,000) and Millennials
($23,000) (estimated medians). The proportion of workers having saved $250,000 or more increases with
age: 13 percent of Millennials, 25 percent of Generation X, and 40 percent of Baby Boomers. In contrast, the
proportion of workers who have saved $1 to less than $50,000 directionally decreases with age: 38 percent
of Millennials, 27 percent of Generation X, and 18 percent of Baby Boomers. Of concern, one in 10 workers
(10 percent) report having no retirement savings, including 12 percent of Millennials, nine percent of
Generation X, and seven percent of Baby Boomers.
80BASE: 20TH ANNUAL SURVEY - ALL QUALIFIED RESPONDENTS. Q1300. Approximately how much money does your household have saved in all of your retirement accounts?
Not sure 9 9 9 6Decline to answer 4 3 4 8
Note: The median is estimated based on the approximate midpoint of the range of each response category. Non-responses are excluded from the estimate.
10 12 9 7
912
85
68
6
3
7
9
5
4
8
9
8
6
11
13
11
9
13
12
15
12
2313
25
40
All Workers Millennial GenX Baby Boomer
$250k or more
$100k to less than $250k
$50k to less than $100k
$25k to less than $50k
$10k to less than $25k
$5k to less than $10k
$1 to less than $5k
None ($0)
2019 Total Household Retirement Savings (%)
Estimated Median $50,000 $23,000 $64,000 $144,000

Three in Five Think They Are Building a Large Enough Nest Egg
Sixty percent of workers agree that they are currently building a large enough retirement nest egg, including
24 percent who “strongly agree” and 36 percent who “somewhat agree.” Millennials (61 percent),
Generation X (59 percent), and Baby Boomers (60 percent) share similar levels of agreement.
26
22
24
35
37
36
17
19
18
14
16
16
8
6
6
Millennials
Generation X
Baby Boomers
Workers by Generation (%)
24
36
18
15
7
All Workers (%)
BASE: 20TH ANNUAL SURVEY - ALL QUALIFIED RESPONDENTSQ800. How much do you agree or disagree that you are currently building a large enough retirement nest egg?
Strongly Agree Somewhat Agree Somewhat Disagree Strongly Disagree Not Sure
NET – Agree = 60%
NET Agree = 61%
NET Agree = 59%
NET Agree = 60%
Building a Large Enough Retirement Nest Egg
81

Two-Thirds of Workers Are Confident About Retirement
Approximately seven in 10 workers are either “somewhat” or “very” confident that they will be able to fully retire
with a comfortable lifestyle, a survey finding that is relatively unchanged before and during the onset of the
pandemic (68 percent, 70 percent respectively). Fewer than one in four workers are “very” confident (21 percent,
24 percent respectively). Baby Boomers are slightly less likely than younger generations to be “very” confident.
82BASE: 20TH ANNUAL SURVEY and APRIL 2020 SUPPLEMENTAL SURVEY - ALL QUALIFIED RESPONDENTSQ880. How confident are you that you will be able to fully retire with a lifestyle you consider comfortable?
How confident are you that you will be able to fully retire with a lifestyle you consider comfortable? (%)
24
23
25
21
46
48
42
45
20
20
22
20
10
9
11
14
All Workers
Millennials
GenerationX
BabyBoomers
April 2020 Survey
21
23
21
19
47
47
43
48
22
22
24
20
10
8
12
13
All Workers
Millennials
GenerationX
BabyBoomers
20th Annual Survey
NET Confident = 70%
NET Confident = 64%
NET Confident = 67%
NET Confident = 71%
NET Confident = 67%
NET Confident = 66%
Very Confident Somewhat Confident Not Too Confident Not At All Confident
NET Confident = 68% NET Confident = 70%

Workers Are Expecting Diverse Sources of Retirement Income
Self-funded savings, including retirement accounts (e.g., 401(k)s, 403(b)s, IRAs) and/or other savings and
investments, are the most frequently cited source of expected retirement income by workers across
generations (77 percent). Sixty-eight percent of workers expect income from Social Security; however, there is
a wide disparity across generations: Baby Boomers (86 percent), Generation X (71 percent), and Millennials
(56 percent). Thirty-seven percent of workers expect retirement income from “working.” Millennials and
Generation X (both 37 percent) are somewhat more likely than Baby Boomers (34 percent) to expect it.
83BASE: 20TH ANNUAL SURVEY - ALL QUALIFIED RESPONDENTSQ1145. Which of the following do you expect to be sources of income to cover your living expenses after you retire? Select all.
77 75 77 78
All Millennials GenX Baby Boomers
NET – Self-Funded Savings (401(k), 403(b), IRAs) and Other Savings and Investments (%)
65 64 69 65
All Millennials GenX Baby Boomers
401(k)s, 403(b)s, IRAs (%)
45 42 41 54
All Millennials GenX Baby Boomers
Other Savings and Investments (%)
68 56
71 86
All Millennials GenX Baby Boomers
Social Security (%)
37 37 37 34
All Millennials GenX Baby Boomers
Working (%)
19 17 19 24
All Millennials GenX Baby Boomers
Company-Funded Pension Plan (%)
13 13 15 13
All Millennials GenX Baby Boomers
Home equity (%)
10 11 10 10
All Millennials GenX Baby Boomers
Inheritance (%)
3 2 3 4
All Millennials GenX Baby Boomers
Other (%)

Baby Boomers (37 percent) are significantly more likely to expect Social Security to be their primary source of
income in retirement, compared with Generation X (26 percent) and Millennials (17 percent). Millennials (55
percent) and Generation X (49 percent) are more likely than Baby Boomers (42 percent) to cite self-funded
savings, including 401k(s), 403(b)s, IRAs and/or other savings and investments as their expected primary
source of income. Fifteen percent of all workers expect their primary source of retirement income to come from
“working,” a finding that it is more often cited by Millennials (17 percent) and Generation X (15 percent),
compared with Baby Boomers (11 percent). Note: 401(k)s did not become readily available until the 1990s, a
time at which Baby Boomers were already well into their careers and, therefore, they have not had as much
time to save in them.
84
Many Baby Boomers Expect to Rely on Social Security
37
41
38
29
13
14
11
13
24
17
26
37
15
17
15
11
5
5
5
7
2
2
2
1
1
2
2
1
3
2
1
1
All Workers
Millennials
Generation X
Baby Boomers
Primary Source of Retirement Income (%)
401(k), 403(b), andIRAs
Other savings andinvestments
Social Security
Working
Company-fundedpension plan
Inheritance
Home equity
Other
BASE: 20TH ANNUAL SURVEY - ALL QUALIFIED RESPONDENTSQ1150. Which one of the following do you expect to be your primary source of income to cover your living expenses after you retire?
NET – Self-Funded Savings = 50%
NET – Self-Funded Savings = 55%
NET – Self-Funded Savings = 49%
NET – Self-Funded Savings = 42%

Three in Four Workers Are Concerned About Social Security
Seventy-three percent of workers agree with the statement, “I am concerned that when I am ready to
retire, Social Security will not be there for me,” including 34 percent who “strongly agree” and 39 percent
who “somewhat agree.” Generation X (81 percent) and Millennials (76 percent) are more likely to agree
than Baby Boomers (61 percent). Generation X (41 percent) and Millennials (36 percent) are also more
likely than Baby Boomers (26 percent) to “strongly agree.”
85
BASE: 20TH ANNUAL SURVEY - ALL QUALIFIED RESPONDENTSQ930. How much do you agree or disagree with each of the following statements regarding retirement? “I am concerned that when I am ready to retire, Social Security will not be there for me.”
“I am concerned that when I am ready to retire, Social Security will not be there for me.” (%)
Strongly Agree Somewhat Agree Somewhat Disagree Strongly Disagree
34
39
18
9
All Workers
36
40
17
7
Millennials
41
40
13
6
Generation X
26
35
24
15
Baby BoomersNET – Agree= 73%
NET – Agree= 76%
NET – Agree= 81%
NET – Agree= 61%
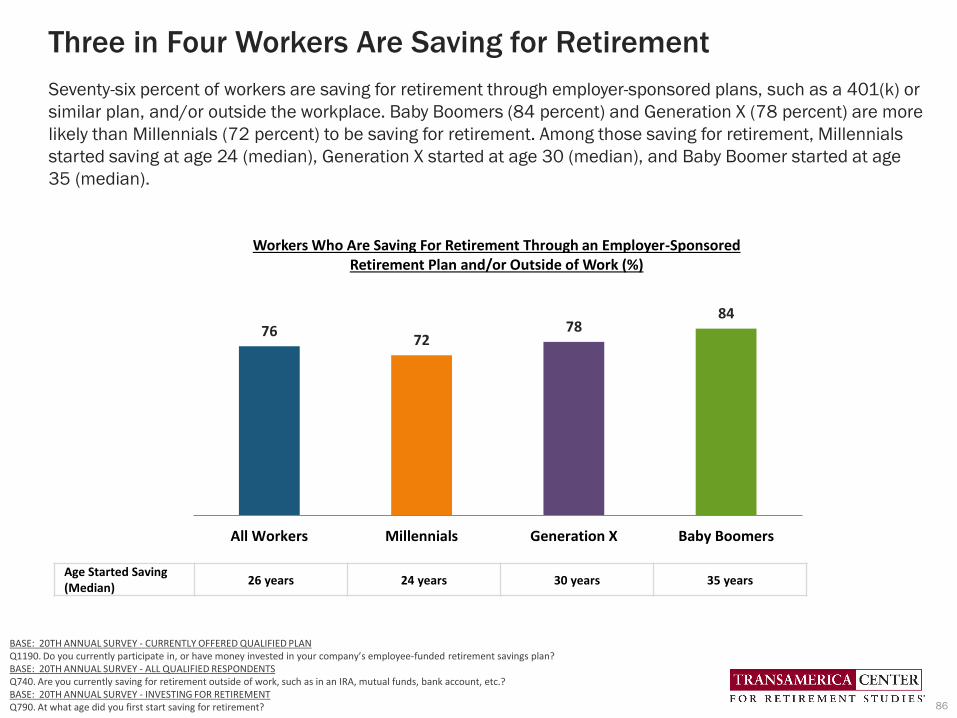
Three in Four Workers Are Saving for Retirement
Seventy-six percent of workers are saving for retirement through employer-sponsored plans, such as a 401(k) or
similar plan, and/or outside the workplace. Baby Boomers (84 percent) and Generation X (78 percent) are more
likely than Millennials (72 percent) to be saving for retirement. Among those saving for retirement, Millennials
started saving at age 24 (median), Generation X started at age 30 (median), and Baby Boomer started at age
35 (median).
86
7672
7884
All Workers Millennials Generation X Baby Boomers
Workers Who Are Saving For Retirement Through an Employer-Sponsored Retirement Plan and/or Outside of Work (%)
Age Started Saving(Median)
26 years 24 years 30 years 35 years
BASE: 20TH ANNUAL SURVEY - CURRENTLY OFFERED QUALIFIED PLANQ1190. Do you currently participate in, or have money invested in your company’s employee-funded retirement savings plan?BASE: 20TH ANNUAL SURVEY - ALL QUALIFIED RESPONDENTSQ740. Are you currently saving for retirement outside of work, such as in an IRA, mutual funds, bank account, etc.?BASE: 20TH ANNUAL SURVEY - INVESTING FOR RETIREMENTQ790. At what age did you first start saving for retirement?

Yes61
No39
Saving for Retirement Outside of Work
All Workers (%)
Six in 10 Are Saving for Retirement Outside of Work
Sixty-one percent of workers are saving for retirement outside of work, such as in an IRA, mutual funds,
bank account, etc. Baby Boomers (70 percent) are more likely to be saving for retirement outside of work,
compared with Generation X and Millennials (61 percent and 56 percent, respectively).
87BASE: 20TH ANNUAL SURVEY - ALL QUALIFIED RESPONDENTSQ740. Are you currently saving for retirement outside of work, such as in an IRA, mutual funds, bank account, etc. ?
Saving Outsideof Work(Yes %)Generation
Millennials 56
Generation X 61
Baby Boomers 70

Workers’ Estimated Retirement Savings Needs
Workers estimate they will need $500,000 (median) by the time they retire in order to feel financially
secure. This estimate is shared by Generation X and Baby Boomers, but Millennials estimate they will need
only $300,000 (median). Generation X (39 percent) and Baby Boomers (34 percent) are more likely than
Millennials (29 percent) to say they will need $1 million or more by the time they retire in order to feel
financially secure.
88
BASE: 20TH ANNUAL SURVEY - ALL QUALIFIED RESPONDENTSQ890. Thinking in terms of what money can buy today, how much money do you believe you will need to have saved by the time you retire in order to feel financially secure?
Estimated RetirementSavings Needs
All Workers Millennials Generation X Baby Boomers
$0 to less than $500k 49% 55% 43% 43%
$500k to less than $1m 19% 16% 18% 23%
$1m to less than $2m 17% 15% 20% 20%
$2m or more 15% 14% 19% 14%
Median $500,000 $300,000 $500,000 $500,000

Many Workers Are Guessing Their Retirement Savings Needs
Forty-four percent of workers who provided an estimate of their retirement savings needs indicate they
guessed those needs. Twenty-three percent estimated this goal based on their current living expenses. Just 13
percent used a retirement calculator or completed a worksheet, with Millennials (15 percent) being somewhat
more likely than Generation X (13 percent) and significantly more likely than Baby Boomers (10 Percent) to
have done so. Baby Boomers (27 percent) are more likely to have estimated their needs based on current
living expenses than Millennials (21 percent) or Generation X (22 percent).
89
44
23
13
9
4
7
5
5
3
Basis of Estimating Retirement Savings GoalAll Workers (%)
43 45 43
Millennial Generation X Baby Boomer
Guessed Retirement Savings Needs (%)
15 13 10
Millennial Generation X Baby Boomer
NET – Used a Retirement Calculator or Completed Worksheet (%)
BASE: 20TH ANNUAL SURVEY - PROVIDED ESTIMATE OF MONEY NEEDED FOR RETIREMENTQ900. How did you arrive at that number?
21 22 27
Millennial Generation X Baby Boomer
Estimated Based on Current Living Expenses (%)
Guessed
Estimated based on current living expenses
NET – Used a calculator or completed worksheet
Used a retirement calculator
Completed a worksheet
Expected earnings on investments
Read/heard that is how much is needed
Amount given to me by financial advisor
Other

All Workers Millennials Generation X Baby Boomers
Relatively equal mix of stocks and investments such as bonds, money market funds, and cash
Mostly in stocks with little or no money in investments such as bonds, money market funds, and cash
Mostly in bonds, money market funds, cash and other stable investments
Not sure
38
23
20
19
Workers Most Often Invest in a Mix of Stocks, Bonds, and CashWorkers most frequently invest their retirement savings in a relatively equal mix of stocks and investments,
such as bonds, money market funds, and cash (38 percent), which tends to increase with age: Millennials
(33 percent), Generation X (39 percent), and Baby Boomers (45 percent). Nineteen percent of workers say
they are “not sure” how their retirement savings are invested, including Baby Boomers (19 percent),
Generation X and Millennials (both 17 percent).
90BASE: 20TH ANNUAL SURVEY - INVESTING FOR RETIREMENTQ770. How are your retirement savings invested?
How are your retirement savings currently invested? (%)
45
19
17
19
33
28
22
17
39
22
22
17

Relatively Few Are Very Familiar with Spouse’s/Partner’s Savings
Among workers who are married or living with a partner, 60 percent say their spouse or partner is saving
in a retirement plan, and 67 percent are familiar with their spouse’s or partner’s savings, yet only 33
percent are “very familiar.” Level of familiarity of their spouse’s or partner’s plan is similar across
generations. Baby Boomers and Millennials (both 68 percent) are slightly more likely to be familiar than
Generation X (66 percent).
91
60 59 63 60
All Workers Millennials Generation X Baby Boomers
Is spouse/partner saving in a retirement plan?Yes (%)
BASE: 20TH ANNUAL SURVEY - MARRIED OR LIVING WITH PARTNERQ850. Is your spouse or partner currently putting money into a retirement plan of his or her own?Q1520. How familiar are you with your spouse’s or partner’s retirement plan and savings?
33
31
31
38
34
37
35
30
19
21
19
17
14
11
15
15
All Workers
Millennials
Generation X
Baby Boomers
Level of Familiarity with Spouse's/Partner's Retirement Savings (%)
Very Familiar Somewhat Familiar Not too Familiar Not at all Familiar
NET – Familiar = 67%
NET – Familiar = 68%
NET – Familiar = 66%
NET – Familiar = 68%
Unfamiliar (Net) = 32%
Unfamiliar (Net) = 32%
Unfamiliar (Net) = 34%
Unfamiliar (Net) = 33%

One in Four Has a Written Financial Strategy for Retirement
Achieving retirement readiness goes beyond simply saving enough. It requires having a well-defined financial
strategy. The majority of workers (69 percent) have some form of retirement strategy, but only 24 percent have
a written plan. The other 45 percent have a plan, but it is not written down. Of the three generations, Millennial
workers (71 percent) are slightly more likely to have some form of written or unwritten financial strategy for
retirement, compared with Generation X and Baby Boomers (both 68 percent).
92
27
23
22
44
45
46
29
32
32
Millennials
Generation X
Baby Boomers
Workers by Generation (%)
24
45
31
How would you describe your financial strategy for retirement?
All Workers (%)
BASE: 20TH ANNUAL SURVEY - ALL QUALIFIED RESPONDENTSQ1155. Which of the following best describes your financial strategy for retirement?
Have a Written Plan Have a Plan but Not Written Down Do Not Have a Plan
NET – Have a Plan = 69%
NET – Have a Plan = 68%
NET – Have a Plan = 68%
NET – Have a Plan = 71%

Retirement Strategies Should Consider a Variety of Factors
There are multiple variables that
could have an impact on retirement
savings, ability to generate income
in retirement, and protection of
savings.
Many workers with a retirement
strategy have considered basic
living expenses (51 percent), a
budget (45 percent), and Social
Security and Medicare benefits (44
percent).
However, few have factored in long-
term care needs (24 percent), tax
planning (18 percent), and estate
planning (16 percent). Even fewer
have factored contingency plans
(13 percent). Only 23 percent have
factored in pursuing their
retirement dreams.
Of the three generations, Baby
Boomers are more likely to have
factored in several of the
components into their strategies,
but their plans are still lacking.
93
Note: Components of retirement strategy selected by 40% or more of the subgroup are highlighted
Components of Retirement StrategyAll
WorkersMillennials Gen X Baby
Boomers
Basic living expenses 51% 44% 53% 64%
A budget 45% 46% 46% 42%
Social Security and Medicare benefits 44% 36% 41% 64%
Total retirement savings and income needs 39% 33% 37% 55%
A plan to help ensure my savings lastthroughout my retirement
33% 30% 31% 42%
Investment returns 33% 29% 31% 42%
Housing 32% 33% 34% 29%
Paying off mortgage 29% 30% 32% 27%
Ongoing healthcare costs 27% 23% 26% 35%
Long-term care needs 24% 25% 22% 24%
Pursuing retirement dreams 23% 21% 23% 27%
Inflation 21% 19% 24% 25%
Tax planning 19% 20% 16% 21%
Paying off non-mortgage debt 18% 18% 17% 20%
Estate planning 16% 16% 15% 19%
Supporting others – excluding my spouse/partner 13% 16% 11% 8%
Contingency plans for retiring sooner than expected and/or savings shortfalls
13% 15% 13% 12%
Home modifications 11% 13% 11% 8%
Other 2% 2% 3% 2%
Not sure 4% 4% 3% 4%
BASE: 20TH ANNUAL SURVEY - HAS RETIREMENT STRATEGYQ1510. Which of the following have you factored into your retirement strategy? Select all.

Few Have a Backup Plan if Retirement Comes Unexpectedly
Delaying retirement and/or continuing to work in retirement is an effective way to continue generating
income, bridge savings shortfalls, and stay active and involved. However, only 32 percent of workers have a
backup plan for retirement income if forced into retirement sooner than expected. Millennials (34 percent)
and Baby Boomer workers (32 percent) are only somewhat more likely to have a backup plan compared with
Generation X (30 percent).
94BASE: 20TH ANNUAL SURVEY - ALL QUALIFIED RESPONDENTSQ1535. In the event you are unable to work before your planned retirement, do you have a backup plan for retirement income?
34
52
14
Millennials
30
56
14
Generation X
32
55
13
Baby Boomers
Have a Backup Plan if Retire Sooner Than Expected (%)
32
54
14
All Workers
Yes No Not Sure
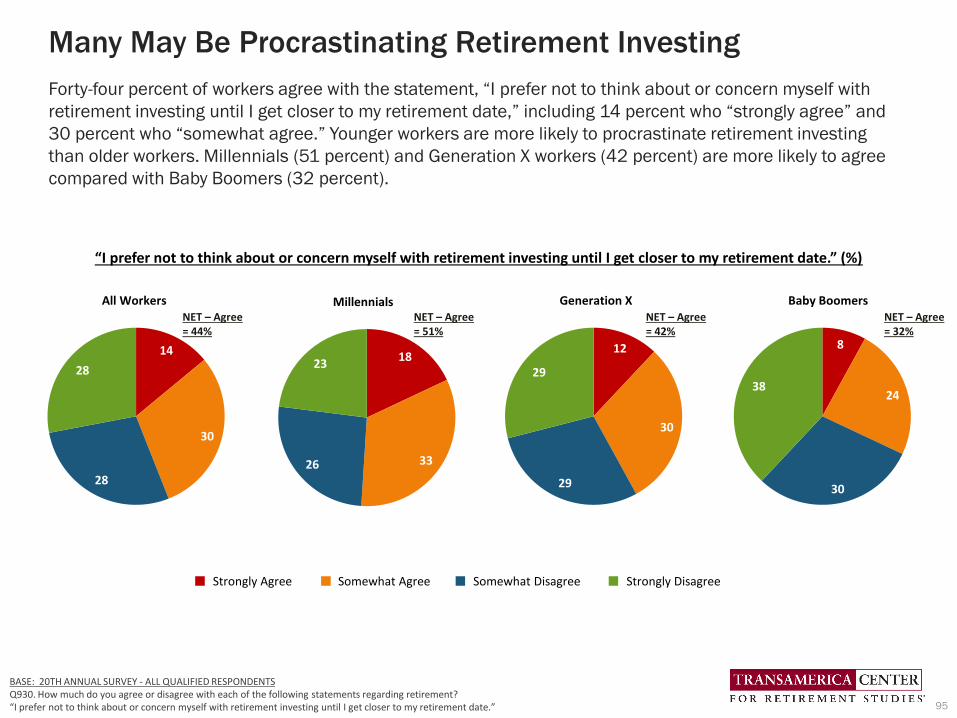
Many May Be Procrastinating Retirement Investing
Forty-four percent of workers agree with the statement, “I prefer not to think about or concern myself with
retirement investing until I get closer to my retirement date,” including 14 percent who “strongly agree” and
30 percent who “somewhat agree.” Younger workers are more likely to procrastinate retirement investing
than older workers. Millennials (51 percent) and Generation X workers (42 percent) are more likely to agree
compared with Baby Boomers (32 percent).
95
BASE: 20TH ANNUAL SURVEY - ALL QUALIFIED RESPONDENTSQ930. How much do you agree or disagree with each of the following statements regarding retirement? “I prefer not to think about or concern myself with retirement investing until I get closer to my retirement date.”
“I prefer not to think about or concern myself with retirement investing until I get closer to my retirement date.” (%)
Strongly Agree Somewhat Agree Somewhat Disagree Strongly Disagree
14
30
28
28
All Workers
18
33 26
23
Millennials
12
30
29
29
Generation X
8
24
30
38
Baby BoomersNET – Agree= 44%
NET – Agree= 51%
NET – Agree= 42%
NET – Agree= 32%

More Than Half Would Prefer to Rely on Outside Experts
Fifty-six percent of workers agree with the statement, “I would prefer to rely on outside experts to monitor and
manage my retirement savings plan,” including 16 percent who “strongly agree” and 40 percent who
“somewhat agree.” Generation X (59 percent) and Millennial workers (58 percent) are more likely to agree
than Baby Boomers (49 percent).
96
BASE: 20TH ANNUAL SURVEY - ALL QUALIFIED RESPONDENTSQ930. How much do you agree or disagree with each of the following statements regarding retirement? “I would prefer to rely on outside experts to monitor and manage my retirement savings plan.”
“I would prefer to rely on outside experts to monitor and manage my retirement savings plan.” (%)
Strongly Agree Somewhat Agree Somewhat Disagree Strongly Disagree
16
40
28
16
All Workers
19
39
28
14
Millennials
16
43
28
13
Generation X
14
35
28
23
Baby BoomersNET – Agree= 56%
NET – Agree= 58%
NET – Agree= 59%
NET – Agree= 49%

Four in 10 Workers Use a Professional Financial Advisor
Forty-one percent of workers who are saving and investing for retirement use a professional financial
advisor to help them manage their savings and investments. Baby Boomers are most likely to use an advisor
(45 percent), followed by Millennials (42 percent) and Generation X (37 percent). In the April 2020 survey, a
slightly higher percentage of workers report using a financial advisor.
97BASE: 20TH ANNUAL SURVEY and April 2020 SUPPLEMENTAL SURVEY - ALL QUALIFIED RESPONDENTSQ860. Do you use a professional financial advisor to help manage your retirement savings or investments?
41 4237
45
All Workers Millennials Generation X Baby Boomers
Do you use a professional financial advisor to help manage your retirement savings or investments? Yes (%)
20th Annual Survey
45 4441
48
All Workers Millennials Generation X Baby Boomers
April 2020 Survey

All Workers Millennials Generation X Baby Boomers
Make retirement investment recommendationssuch as mutual funds, annuities, stocks, bonds, etc.
Calculate retirement savings goal
General financial planning(e.g., college funding, cash flow analysis, budgeting, etc.)
Tax planning and preparation
Recommend retirement-related product needsincluding health, life, and long-term care insurance
Develop strategies for spending down savings to ensure they last my lifetime
Plan for healthcare expenses
Inheritance and estate planning
Plan for possible assisted living and long-term care needs
Handle day-to-day finances (e.g., pay bills)
Some other services
55
42
35
32
31
29
22
22
22
15
4
Services Performed by Financial Advisors Vary by Generation
Among those who use a financial advisor, workers most frequently use them to make retirement investment
recommendations (55 percent), followed by calculating a retirement savings goal (42 percent) and general
financial planning (35 percent). Across generations, the use of financial advisor services varies. A significant
majority of Baby Boomers (66 percent) use their financial advisors for retirement investment recommendations
compared with Generation X (56 percent) and Millennials (45 percent). While approximately four in 10 workers
say their advisors calculate a retirement savings goal, Generation X (47 percent) and Baby Boomers (45 percent)
are somewhat more likely to receive this service than Millennials (37 percent).
98BASE: 20TH ANNUAL SURVEY - USE A FINANCIAL ADVISORQ870. What types of services do you use your professional financial advisor to perform? Select all.
What types of services do you use your professional financial advisor to perform? (%)
66
45
32
30
25
27
14
16
9
5
6
45
37
33
32
33
31
27
22
28
20
3
56
47
42
33
34
27
24
27
24
19
4

Frequency (or Infrequency) of Conversations About Retirement
Retirement is a family matter that calls for important conversations, particularly during difficult times.
Before the pandemic, just 20 percent of workers said they frequently discuss saving, investing, and
planning for retirement with family and close friends, while 55 percent occasionally discuss it, and 25
percent never discuss it. Millennials (25 percent) are significantly more likely to frequently discuss it than
Baby Boomers (15 percent) and Generation X (17 percent). Amid the pandemic, in April 2020, these survey
findings are relatively unchanged.
99
How frequently do you discuss saving, investing, and planning for retirement with family and close friends? (%)
20
25
17
15
55
54
58
53
25
21
25
32
All Workers
Millennials
GenerationX
BabyBoomers
20th Annual Survey
NET Discuss = 79%
NET Discuss = 75%
NET Discuss = 68%
21
24
21
16
56
59
55
52
23
17
24
32
All Workers
Millennials
GenerationX
BabyBoomers
April 2020 Survey
NET Discuss = 83%
NET Discuss = 76%
NET Discuss = 68%
Frequently Occasionally Never
BASE: 20TH ANNUAL SURVEY and April 2020 SUPPLEMENTAL SURVEY - ALL QUALIFIED RESPONDENTSQ1515. How frequently do you discuss saving, investing and planning for retirement with family and close friends?
NET Discuss = 75% NET Discuss = 77%

The Vital Role of Employers in Helping Workers
Save and Prepare for Older Age
100
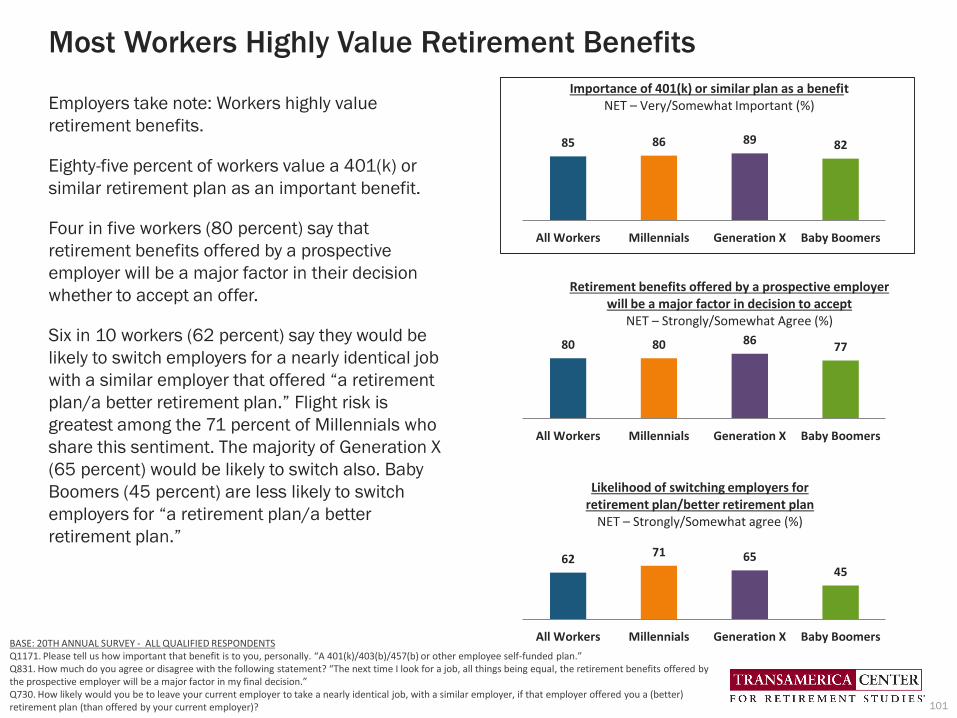
Most Workers Highly Value Retirement Benefits
Employers take note: Workers highly value
retirement benefits.
Eighty-five percent of workers value a 401(k) or
similar retirement plan as an important benefit.
Four in five workers (80 percent) say that
retirement benefits offered by a prospective
employer will be a major factor in their decision
whether to accept an offer.
Six in 10 workers (62 percent) say they would be
likely to switch employers for a nearly identical job
with a similar employer that offered “a retirement
plan/a better retirement plan.” Flight risk is
greatest among the 71 percent of Millennials who
share this sentiment. The majority of Generation X
(65 percent) would be likely to switch also. Baby
Boomers (45 percent) are less likely to switch
employers for “a retirement plan/a better
retirement plan.”
101
BASE: 20TH ANNUAL SURVEY - ALL QUALIFIED RESPONDENTSQ1171. Please tell us how important that benefit is to you, personally. “A 401(k)/403(b)/457(b) or other employee self-funded plan.”Q831. How much do you agree or disagree with the following statement? “The next time I look for a job, all things being equal, the retirement benefits offered by the prospective employer will be a major factor in my final decision.”Q730. How likely would you be to leave your current employer to take a nearly identical job, with a similar employer, if that employer offered you a (better) retirement plan (than offered by your current employer)?
80 80 8677
All Workers Millennials Generation X Baby Boomers
Retirement benefits offered by a prospective employer will be a major factor in decision to accept
NET – Strongly/Somewhat Agree (%)
6271 65
45
All Workers Millennials Generation X Baby Boomers
Likelihood of switching employers forretirement plan/better retirement plan
NET – Strongly/Somewhat agree (%)
85 86 89 82
All Workers Millennials Generation X Baby Boomers
Importance of 401(k) or similar plan as a benefitNET – Very/Somewhat Important (%)
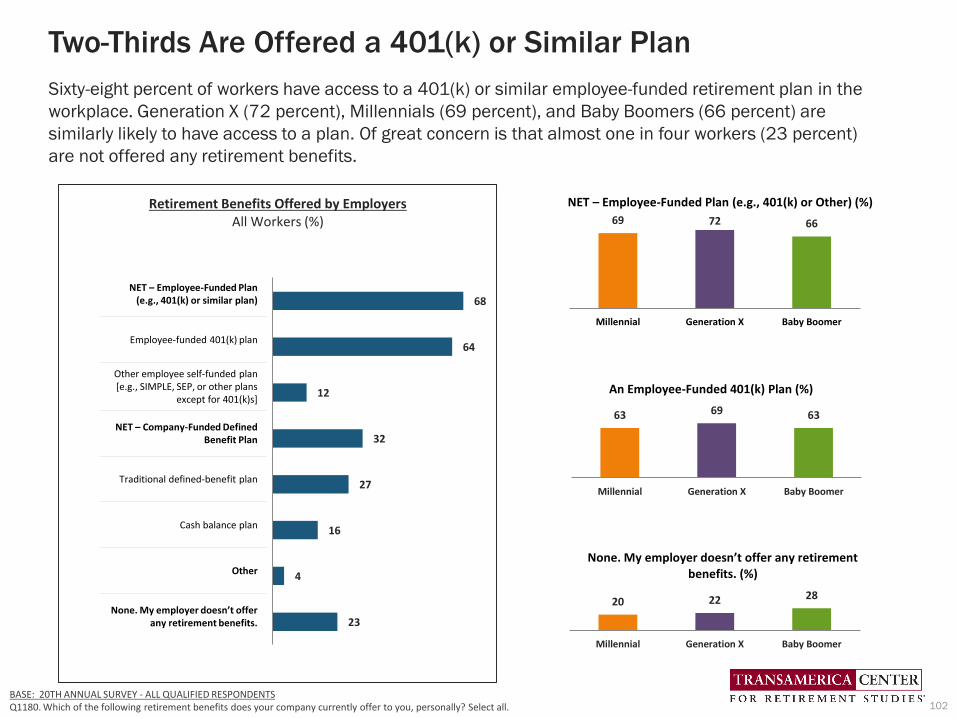
Two-Thirds Are Offered a 401(k) or Similar Plan
Sixty-eight percent of workers have access to a 401(k) or similar employee-funded retirement plan in the
workplace. Generation X (72 percent), Millennials (69 percent), and Baby Boomers (66 percent) are
similarly likely to have access to a plan. Of great concern is that almost one in four workers (23 percent)
are not offered any retirement benefits.
102
68
64
12
32
27
16
4
23
Retirement Benefits Offered by EmployersAll Workers (%) 69 72 66
Millennial Generation X Baby Boomer
NET – Employee-Funded Plan (e.g., 401(k) or Other) (%)
63 69 63
Millennial Generation X Baby Boomer
An Employee-Funded 401(k) Plan (%)
20 22 28
Millennial Generation X Baby Boomer
None. My employer doesn’t offer any retirement benefits. (%)
BASE: 20TH ANNUAL SURVEY - ALL QUALIFIED RESPONDENTSQ1180. Which of the following retirement benefits does your company currently offer to you, personally? Select all.
NET – Employee-Funded Plan(e.g., 401(k) or similar plan)
Employee-funded 401(k) plan
Other employee self-funded plan [e.g., SIMPLE, SEP, or other plans
except for 401(k)s]
NET – Company-Funded Defined Benefit Plan
Traditional defined-benefit plan
Cash balance plan
Other
None. My employer doesn’t offer any retirement benefits.

Full-Time Workers Are More Likely to Be Offered a 401(k)
Full-time workers (74 percent) are far more likely to have access to a 401(k) or similar employee-funded plan
compared with part-time workers (45 percent). Among part-time workers, Baby Boomers (41 percent) are
somewhat less likely to have benefits compared with Millennials (49 percent) and Generation X (48 percent).
103BASE: 20TH ANNUAL SURVEY - ALL QUALIFIED RESPONDENTSQ1180. Which of the following retirement benefits does your company currently offer to you, personally? Select all.
74 74 76 73
All Workers Millennials Generation X Baby Boomers
NET – Employee-Funded 401(k) or Similar Plan (%)
69 68 73 70
All Workers Millennials Generation X Baby Boomers
An Employee-Funded 401(k) Plan (%)
Full-Time Workers
45 49 4841
All Workers Millennials Generation X Baby Boomers
NET – Employee-Funded 401(k) or Similar Plan (%)
41 42 46 40
All Workers Millennials Generation X Baby Boomers
An Employee-Funded 401(k) Plan (%)
Part-Time Workers

Having Access to a 401(k) Inspires Workers to Save
Workers who are offered a 401(k) or similar retirement plan by their employer are more likely to save and
invest for retirement in the plan and/or outside of work (88 percent) compared with those who do not have
access to such plans (51 percent). Among workers who are not offered a plan, Baby Boomers are much more
likely to be saving for retirement (68 percent) than Generation X (49 percent) and Millennials (41 percent).
BASE: 20TH ANNUAL SURVEY - CURRENTLY OFFERED QUALIFIED PLAN / NOT CURRENTLY OFFERED QUALIFIED PLANQ1190. Do you currently participate in, or have money invested in your company’s employee-funded retirement savings plan?Q740. Are you currently saving for retirement outside of work, such as in an IRA, mutual funds, bank account, etc.?
88 86 89 92
All Workers Millennials Generation X Baby Boomers
Among Those Offered a 401(k) or Similar Plan (%)
Saving for Retirement (in an Employer-Sponsored Plan and/or Outside of Work)
51 41
49
68
All Workers Millennials Generation X Baby Boomers
Among Those Not Offered a 401(k) or Similar Plan (%)
104

When Offered a Plan, Three in Four Participate
Seventy-six percent of workers who are offered a 401(k) or similar plan participate in that plan. Participation
rates are higher among Generation X (79 percent) and Baby Boomers (80 percent) than Millennials (73 percent).
Across all three generations, participants are contributing 10 percent (median) of their annual salary into their
plans.
105
BASE: 20TH ANNUAL SURVEY - CURRENTLY OFFERED QUALIFIED PLANQ1190. Do you currently participate in, or have money invested in your company’s employee-funded retirement savings plan?BASE: 20TH ANNUAL SURVEY - CURRENTLY PARTICIPATES IN QUALIFIED PLANQ601. What percentage of your salary are you saving for retirement through your company-sponsored plan this year?
76 7379 80
All Workers Millennials Generation X Baby Boomers
Participates in 401(k) or Similar PlanYes (%)
10 10 10 10
All Workers Millennials Generation X Baby Boomers
Percentage of Annual Salary Saved in PlanMedian

Two in Five Contribute 10 Percent or More to Retirement Plans
While the majority of workers participating in a 401(k) or similar retirement plan are contributing 10 percent
of their salaries or less, 42 percent are saving more than 10 percent. These “super savers” include 44
percent of Millennials, and 40 percent of both Generation X and Baby Boomers. Almost one in three plan
participants (29 percent) are contributing more than 15 percent of their annual pay into the plan.
106
What percentage of your salary are you contributing to your company-sponsored plan this year? (%)
BASE: 20TH ANNUAL SURVEY - CURRENTLY PARTICIPATES IN QUALIFIED PLANQ601. What percentage of your salary are you saving for retirement through your company-sponsored plan this year?
24
34
13
29
0 to 5% 6 to 10% 11 to 15% >15%
All Workers
26 29
12
33
0 to 5% 6 to 10% 11 to 15% >15%
Millennials
23
37
14
26
0 to 5% 6 to 10% 11 to 15% >15%
Generation X
24
36
15
25
0 to 5% 6 to 10% 11 to 15% >15%
Baby Boomers
Save >10 Percent = 42%
Save >10 Percent = 44%
Save >10 Percent = 40%
Save >10 Percent = 40%
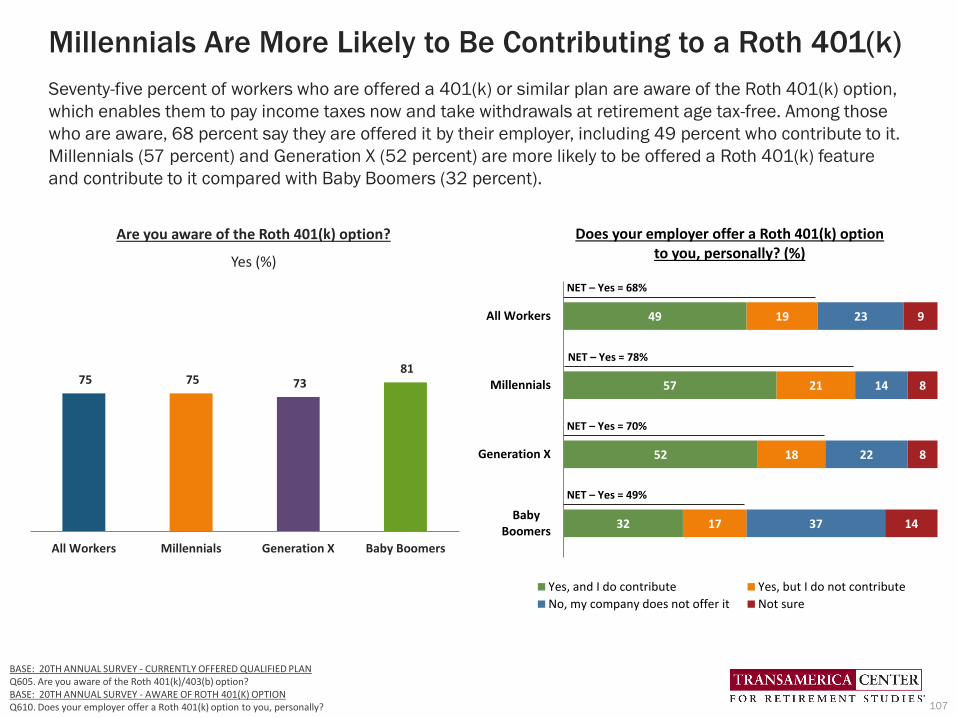
Millennials Are More Likely to Be Contributing to a Roth 401(k)
Seventy-five percent of workers who are offered a 401(k) or similar plan are aware of the Roth 401(k) option,
which enables them to pay income taxes now and take withdrawals at retirement age tax-free. Among those
who are aware, 68 percent say they are offered it by their employer, including 49 percent who contribute to it.
Millennials (57 percent) and Generation X (52 percent) are more likely to be offered a Roth 401(k) feature
and contribute to it compared with Baby Boomers (32 percent).
107
75 75 73 81
All Workers Millennials Generation X Baby Boomers
Are you aware of the Roth 401(k) option?
Yes (%)
BASE: 20TH ANNUAL SURVEY - CURRENTLY OFFERED QUALIFIED PLANQ605. Are you aware of the Roth 401(k)/403(b) option?BASE: 20TH ANNUAL SURVEY - AWARE OF ROTH 401(K) OPTIONQ610. Does your employer offer a Roth 401(k) option to you, personally?
49
57
52
32
19
21
18
17
23
14
22
37
9
8
8
14
All Workers
Millennials
Generation X
BabyBoomers
Does your employer offer a Roth 401(k) option to you, personally? (%)
Yes, and I do contribute Yes, but I do not contribute
No, my company does not offer it Not sure
NET – Yes = 68%
NET – Yes = 78%
NET – Yes = 70%
NET – Yes = 49%

All Workers Millennials Generation X Baby Boomers
NET – PROFESSIONALLY MANAGED
I invest in a target date fund that is designed to change allocation percentages as I approach my target retirement year.
I invest in a strategic allocation fund that is designed to address my specific risk tolerance profile.
I use a managed account service where I do not make investment or allocation decisions.
I set my own asset allocation percentages among the available funds.
Not sure
58
24
24
23
42
12
Majority of Participants Use Professionally Managed Offerings“Professionally managed” accounts refer to a managed account service, strategic allocation funds, and/or
target date funds. The majority of qualified plan participants (58 percent) are using some form of
professionally managed offering in their 401(k) or similar plans. Millennials (64 percent) are more likely to
be using these types of accounts than Generation X (57 percent) and Baby Boomers (47 percent).
108BASE: 20TH ANNUAL SURVEY - THOSE PARTICIPATING IN A QUALIFIED PLANQ1466. What is your current approach to investing in your employer-sponsored retirement plan? Select all.
64
29
28
23
39
11
57
23
21
24
41
13
47
17
18
19
47
13
What is your current approach to investing in your employer-sponsored retirement plan? (%)

Appeal of Automatic Enrollment (%)
Automatic enrollment is a retirement plan feature that eliminates the decision-making and action steps required
of employees to enroll and start contributing to their workplace retirement plan. It simply automatically enrolls
them into their plan so they only need to take action if they desire to opt out and not contribute to the plan.
Across the generations, eight in 10 workers (82 percent) find automatic enrollment appealing. Generation X (82
percent) and Millennials (84 percent) are somewhat more likely to find it appealing than Baby Boomers (78
percent). All three generations consider an appropriate default contribution rate to be 10 percent (median). If an
employer has not yet adopted automatic enrollment as part of its 401(k) plan, it is a feature worthy of
consideration.
Four in Five Workers Find Automatic Enrollment Appealing
45 44 46 42
37 38 3836
82 82 8478
All Workers Millennials Generation X Baby Boomers
BASE: 20TH ANNUAL SURVEY - ALL QUALIFIED RESPONDENTS Q635. Imagine that your current employer automatically enrolled you into a 401(k), 403(b) or similar retirement plan, deducting a percentage of each paycheck, and investing it for your future retirement. How appealing would this seem to you?Q636. Imagine that your current employer automatically enrolled you into a 401(k), 403(b) or similar retirement plan, what would you consider to be an appropriate percentage to deduct from your paycheck to be invested for your future retirement?
Appropriate Default Contribution Rate
(median):10%
Appropriate Default Contribution Rate
(median):10%
Appropriate Default Contribution Rate
(median):10%
Appropriate Default Contribution Rate
(median):10%
Very appealing
Somewhat appealing
NET - Appealing
Very appealing
Somewhat appealing
NET - Appealing
109

Three in Four Workers Would Be Likely to Use Automatic Escalation
The majority of workers (78 percent) say they would be likely to use an automatic feature that would increase
their retirement plan contribution by one percent each year. Millennials (82 percent) and Generation X (79
percent) are somewhat more likely than Baby Boomers (73 percent) to say they would be likely to use this
feature. If an employer has not yet adopted automatic escalation as part of its 401(k) plan, it is also a feature
worthy of consideration.
110
BASE: 20TH ANNUAL SURVEY - ALL QUALIFIED RESPONDENTS Q702. How likely would you be to use a feature in a 401(k) or similar plan where your employer would automatically increase your contribution rate (as a percentage of your salary) to the plan by 1% each year, until you choose to discontinue this increase?
All Workers Millennials Generation X Baby Boomers
32
46
13
9
33
49
13
5
34
45
12
9
30
43
13
14
NET – Likely:82%
NET – Likely:79%
NET – Likely:73%
NET – Likely:78%
Very likely Somewhat likely Not too likely Not at all likely
Likelihood of Using a Feature That Automatically Increases Contribution by 1% Each Year, Until You Choose to Discontinue (%)
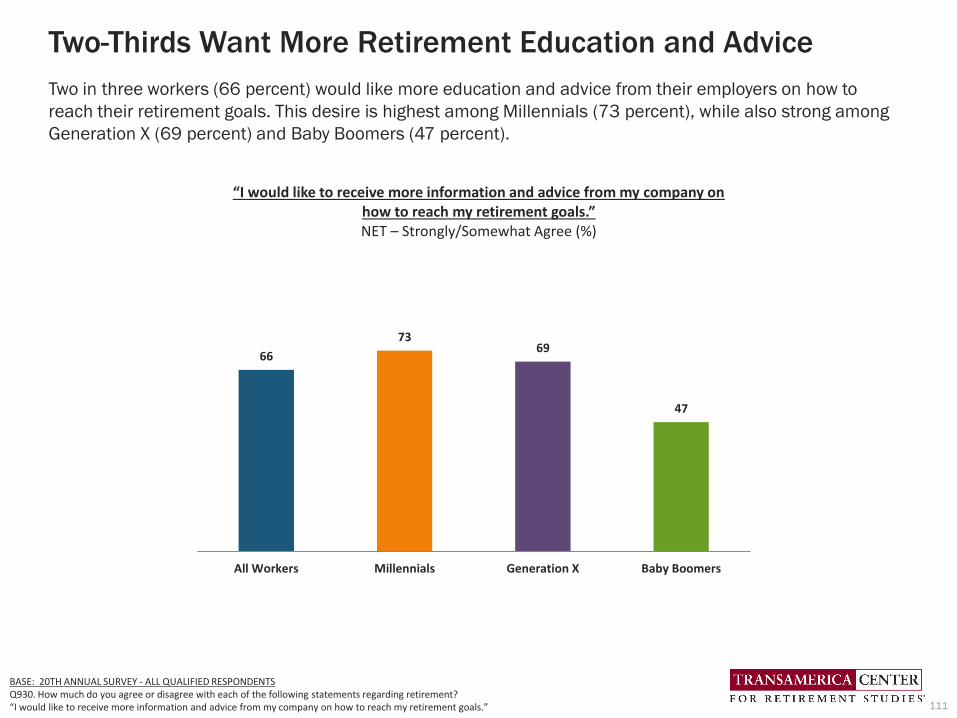
Two-Thirds Want More Retirement Education and Advice
Two in three workers (66 percent) would like more education and advice from their employers on how to
reach their retirement goals. This desire is highest among Millennials (73 percent), while also strong among
Generation X (69 percent) and Baby Boomers (47 percent).
111
BASE: 20TH ANNUAL SURVEY - ALL QUALIFIED RESPONDENTSQ930. How much do you agree or disagree with each of the following statements regarding retirement?“I would like to receive more information and advice from my company on how to reach my retirement goals.”
66
7369
47
All Workers Millennials Generation X Baby Boomers
“I would like to receive more information and advice from my company on how to reach my retirement goals.”NET – Strongly/Somewhat Agree (%)

All Workers Millennials Generation X Baby Boomers
NET – Easy to Understand
A good starting point that is easy to understand
Educational materials that are easier to understand
Larger tax breaks/incentives for saving in a retirement plan
A financial advisor
A greater sense of urgency (or fear) that I should save
Other
Nothing – I am already educated enough
Nothing – I’m just not interested
54
40
33
33
31
26
5
10
8
Motivators to Inspire Learning: Make It Easier to Understand
Employers, with their retirement plan providers, play an invaluable role in offering retirement and financial-
related education to their employees. They may be able to fine-tune their offerings even more. When workers
were asked what would motivate them to learn more about saving and investing for retirement, the most
frequently cited motivators relate to making it easier to understand (54 percent), with Millennials (61 percent)
being more likely to cite this than Generation X (54 percent) and Baby Boomers (41 percent). “Larger tax breaks
and incentives for saving in a retirement plan” and “a financial advisor” are also frequently cited motivators
across generations. Several specific opportunities for employers to raise awareness are highlighted on the
following two pages.
112BASE: 20TH ANNUAL SURVEY - ALL QUALIFIED RESPONDENTSQ2040. What would motivate you to learn more about saving and investing for retirement? Select all.
61
47
36
32
35
30
5
7
7
54
39
33
35
30
24
4
11
8
41
26
28
33
25
19
4
17
10
What would motivate you to learn more about saving and investing for retirement? (%)

Incentives to Save: Saver’s Credit and Catch-Up Contributions
One in three workers indicate that greater tax breaks and incentives would be a motivator for them to learn
more about saving and investing for retirement. Two meaningful incentives include: the Saver’s Credit, a tax
credit for eligible taxpayers who save for retirement in a qualified retirement plan or IRA; and catch-up
contributions, which allow workers age 50 and older to contribute to a qualified plan an additional amount
over and above the plan- or IRA-contribution limit. Yet only 43 percent of workers are aware of the Saver’s
Credit. All Baby Boomers are now over age 50 and Generation X began turning 50 in 2015. Catch-up
contributions are now a noteworthy and relevant incentive for them; however, only 46 percent of Generation
X and 62 percent of Baby Boomers are aware it.
113
43
49
40
34
51 48 46
62
All Workers Millennials Generation X Baby Boomers
Awareness of Tax Incentives
Saver's Credit Catch-up contributions
Yes (%)
BASE: 20TH ANNUAL SURVEY - ALL QUALIFIED RESPONDENTSQ1120. Are you aware of a tax credit called the ’’Saver’s Credit,’’ which is available to individuals and households, who meet certain income requirements, for making contributions to an IRA or a company-sponsored retirement plan such as a 401(k) plan or 403(b) plan?Q1000. Are you aware that people age 50 and older may be allowed to make catch-up contributions to their 401(k)/403(b)/457(b) plan or IRA?
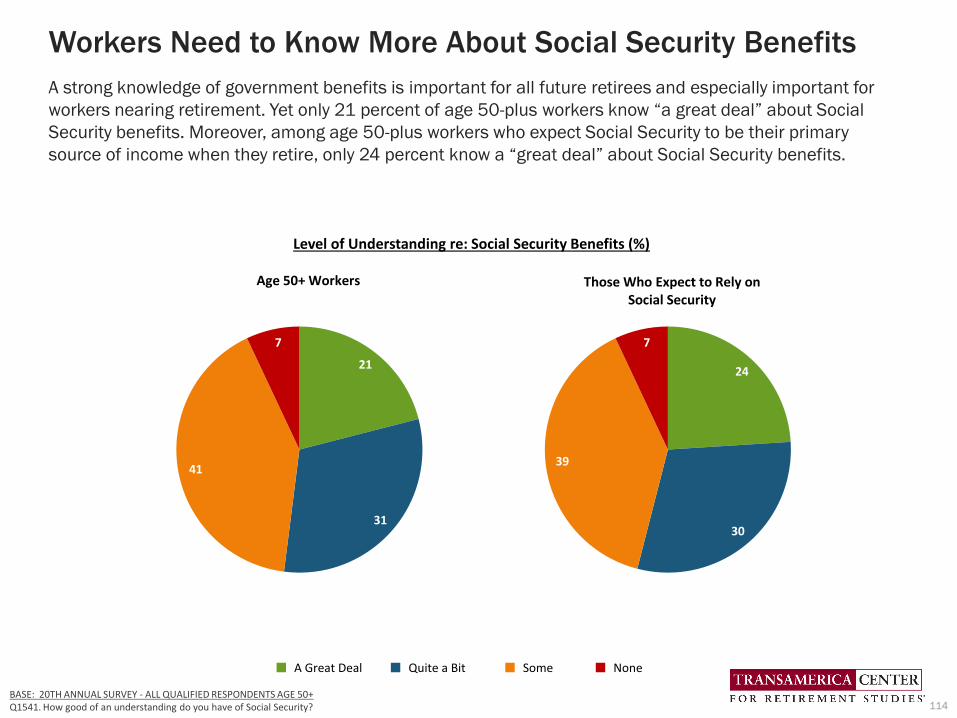
Workers Need to Know More About Social Security Benefits
A strong knowledge of government benefits is important for all future retirees and especially important for
workers nearing retirement. Yet only 21 percent of age 50-plus workers know “a great deal” about Social
Security benefits. Moreover, among age 50-plus workers who expect Social Security to be their primary
source of income when they retire, only 24 percent know a “great deal” about Social Security benefits.
114BASE: 20TH ANNUAL SURVEY - ALL QUALIFIED RESPONDENTS AGE 50+Q1541. How good of an understanding do you have of Social Security?
Level of Understanding re: Social Security Benefits (%)
A Great Deal Quite a Bit Some None
21
31
41
7
Age 50+ Workers
24
30
39
7
Those Who Expect to Rely on Social Security

Are Today’s Employers Age Friendly?
Seven in 10 workers (70 percent) consider their employers to be “age friendly” by offering opportunities,
work arrangements, and training and tools needed for employees of all ages to be successful in their current
role or contribution to the company. Fifteen percent of workers say their employers are not age friendly and
15 percent are “not sure.” Millennial workers are somewhat more likely to characterize their employers as
age friendly (73 percent) than Baby Boomers (69 percent) and Generation X (65 percent).
115
BASE: 20TH ANNUAL SURVEY - ALL QUALIFIED RESPONDENTSQ2745. Do you consider your employer to be “age friendly” (for example offering opportunities, work arrangements, and training and tools needed for employees of all ages to be successful in their current role or contribution to the company)?
Do you consider your employer to be “age friendly”? (%)
Yes No Not Sure
70
15
15
All Workers
73
15
12
Millennials
65
16
19
Generation X
69
15
16
Baby Boomers

Most Are Offered Some Type of Alternative Work Arrangements
Eighty percent of workers indicate their employers offer one or more types of alternative work arrangements.
The most often-cited types of alternative arrangements are: flexible work schedules (48 percent), the ability to
adjust work hours as needed (41 percent), and the ability to take unpaid leave of absence (39 percent).
Millennials (86 percent) are more likely to be offered alternative work arrangements compared with
Generation X and Baby Boomers (both 75 percent).
116BASE: 20TH ANNUAL SURVEY - ALL QUALIFIED RESPONDENTSQ5020. Which of these working arrangements does your employer currently offer? Select all.
All Workers Millennials Generation X Baby Boomers
NET – Employer Offers Alternative Working Arrangements
Flexible work schedules
Ability to adjust work hours as needed
Ability to take unpaid leave of absence
Ability to work remotely
Ability to switch from full-time to part-time and vice versa
Ability to take on work that is less demanding
Opportunity to take a sabbatical
Compressed work weeks
Job sharing
Other
My employer doesn’t offer any alternative working arrangements
80
48
41
39
28
24
15
12
12
9
<1
20
86
51
42
38
29
28
19
14
15
14
<1
14
75
47
39
37
28
22
13
11
11
7
<1
25
75
43
41
43
26
20
10
10
9
4
1
25
Which of these working arrangements does your employer offer? (%)

Three in Four Say Their Employers Support Working Past Age 65
Seventy-eight percent of workers agree with the statement, “My current employer is supportive of its
employees working past age 65,” including 34 percent who “strongly agree” and 44 percent who “somewhat
agree.” Baby Boomers workers (39 percent) are more likely to “strongly agree” compared with Millennials and
Generation X (both 32 percent).
117
BASE: 20TH ANNUAL SURVEY - ALL QUALIFIED RESPONDENTSQ930. How much do you agree or disagree with each of the following statements regarding retirement? “My current employer is supportive of its employees working past 65.”
“My current employer is supportive of its employees working past age 65.” (%)
Strongly Agree Somewhat Agree Somewhat Disagree Strongly Disagree
34
44
15
7
All Workers
32
44
16
8
Millennials
32
47
15
6
Generation X
39
43
12
6
Baby BoomersNET – Agree= 78%
NET – Agree= 76%
NET – Agree= 79%
NET – Agree= 82%

Which of the following ways, if any, does your current employer help its employees who are transitioning into retirement? (%)
All Workers Millennials Generation X Baby Boomers
NET – Flexible Transition Arrangements
Accommodates flexible work schedules and arrangements
Enables employees to reduce work hours and shift from full-time to part-time
Enables employees to take positions which are less stressful or demanding
Provides information about Social Security
Offers financial counseling about retirement
Provides Information about Medicare
Encourages employees to participate in succession planning, training, and mentoring
Offers retirement-oriented lifestyle and transition planning resources
Provides seminars and education about transitioning into retirement
Provides information about encore career opportunities
None of these
Not Sure
36
22
19
14
16
15
15
15
12
11
11
23
22
Employers Do Little to Facilitate Transitioning Into Retirement
118BASE: 20TH ANNUAL SURVEY - ALL QUALIFIED RESPONDENTSQ1533. In which of the following ways, if any, does your current employer help its employees who are transitioning into retirement? Select all.
35
22
19
16
17
15
15
14
11
10
9
25
24
40
24
20
15
19
18
18
17
15
14
15
16
21
28
18
17
11
12
11
11
10
6
8
6
35
23
Workers may find it difficult to have a phased transition into retirement at their current employers. Only 36 percent
indicate their employers offer opportunities such as accommodating flexible work schedules and arrangements
(22 percent), enabling employees to reduce work hours and shift from full-time to part-time (19 percent), and/or
enabling employees to take positions that are less stressful or demanding (14 percent).
Note: Chart excludes “other” responses of two percent or less

Closing the Employee Benefits Gap
In addition to retirement benefits, health and welfare benefits can enhance workers’ financial security. These
benefits can bring insurance protections, mitigate out-of-pocket healthcare expenses, provide the possibility of
additional resources in a time of need, and offer wellness help. Most workers believe these benefits are
important; however, a significant gap exists between the percentage of workers who believe they are important
and the percentage who are offered them by their employers. This represents an opportunity for employers to
increase the competitiveness of their compensation and benefits packages, while helping their employees
achieve greater long-term financial security.
119
Type of Employee Benefit
All Workers
Important (NET) –Very/Somewhat
Important (%)Offered by
Employer (%)The Gap: Importance
vs. Offered (%)
Health Insurance 92 75 -17
Life Insurance 79 53 -26
Disability Insurance 76 42 -34
Long-Term Care Insurance 73 24 -49
Critical Illness Insurance 67 17 -50
Financial Wellness Program 65 18 -47
Employee Assistance Program 65 28 -37
Workplace Wellness Program 63 26 -37
Cancer Insurance 61 12 -49
BASE: 20TH ANNUAL SURVEY - ALL QUALIFIED RESPONDENTSQ1171. For each of the following, please tell us how important that benefit is to you, personally.Q1175. Which of the following does your company offer to you, personally? Select all.

The Employee Benefits Gap Spans All Three Generations
The importance of various types of health and welfare benefits varies by generation. While more than 90
percent of workers across all three generations consider health insurance to be important, Millennials are
generally more likely than Generation X and Baby Boomers to find the other types of health and welfare
benefits listed to be important. Across generations, a significant gap exists between the percentages of workers
who believe they are important compared with the percentage who are offered them by their employers.
120
BASE: 20TH ANNUAL SURVEY - ALL QUALIFIED RESPONDENTSQ1171. For each of the following, please tell us how important that benefit is to you, personally.Q1175. Which of the following does your company offer to you, personally?
Type of Employee Benefit
Millennials (%) Generation X (%) Baby Boomers (%)
NETImportant
Offered by Employer
The Gap: Importance vs. Offered
NET Important
Offered by Employer
The Gap: Importance vs. Offered
NET Important
Offered by Employer
The Gap: Importance vs. Offered
Health Insurance 91 76 -15 95 78 -17 93 72 -21
Life Insurance 83 53 -30 82 58 -24 67 52 -15
Disability Insurance 78 39 -39 81 45 -36 71 45 -26
Long-Term Care Insurance
74 25 -49 76 27 -49 68 20 -48
Critical Illness Insurance
72 20 -52 69 18 -51 58 13 -45
Financial Wellness Program
71 22 -49 66 16 -50 52 13 -39
Employee Assistance Program
71 28 -43 67 30 -37 51 28 -23
Workplace Wellness Program
69 27 -42 64 27 -37 48 25 -23
Cancer Insurance 68 14 -53 63 13 -50 48 9 -39

Happiness and Healthy Aging
121

Workers Are Happy but Some Are Facing Challenges
Before the coronavirus pandemic, eight in 10 workers reported having close relationships with family
and/or friends (88 percent), being generally happy (86 percent), are enjoying life (84 percent), and having a
strong sense of purpose in life (81 percent). A noteworthy four in 10 indicate they have trouble making ends
meet (43 percent) and often feel anxious or depressed (41 percent). These survey findings were relatively
unchanged in April 2020 amid the pandemic.
122BASE: 20TH ANNUAL SURVEY and April 2020 SUPPLEMENTAL SURVEY - ALL QUALIFIED RESPONDENTSQ5025. How much do you agree or disagree with the following statements…?
How much do you agree or disagree with the following statements? (NET – Strongly/Somewhat Agree)All Workers (%)
88 86 84 81 80 77 68
43 41 30
87 87 82 82 8675
58
40 4234
I have closerelationshipswith family
and/orfriends
I am agenerally
happyperson
I amenjoyingmy life
I have astrong senseof purposein my life
I amconfident inmy ability tomanage my
finances
I have apositiveview ofaging
I have anactive
social life
I am havingtroublemaking
ends meet
I often feelanxious anddepressed
I am isolatedand lonely
20th Annual Survey April 2020 Survey

Most Are Enjoying Life yet Many Millennials Are Struggling
Across generations, before the pandemic, more than four in five workers reported having close relationships
with family and/or friends, being generally happy, and enjoying life. However, Millennials are more likely to be
struggling compared with Generation X and Baby Boomers. Millennials are more likely to have trouble making
ends meet (51 percent), often feel anxious and depressed (49 percent), and feel isolated and lonely (37
percent). These findings were for the most part unchanged in April 2020 amid the pandemic.
123
I have close relationships with family
and/or friends
I am a generally
happyperson
I amenjoyingmy life
I have astrong senseof purposein my life
I amconfident inmy ability to manage my
finances
I have a positive view ofaging
I have anactive
social life
I am havingtroublemaking
ends meet
I often feel anxious and depressed
I am isolated and lonely
87 83 82 78 76 74 71 51 49
37
86 84 81 81 82 7362
45 47 40
Bab
y B
oo
mer
sG
ener
atio
n X
Mill
en
nia
ls
88 89 87 84 81 79 69
43 40 27
89 89 80 85 87 77 87
37 41 34
88 88 87 85 88 81 61
26 25 17
89 91 81 82 91 7553
31 29 23
BASE: 20TH ANNUAL SURVEY and April 2020 SUPPLEMENTAL SURVEY - ALL QUALIFIED RESPONDENTSQ5025. How much do you agree or disagree with the following statements…?
20th Annual
April 2020
20th Annual
April 2020
20th Annual
April 2020

Many Expect Their Happiness to Improve in Retirement
More than half of workers (55 percent) expect their happiness to improve when they retire, while 34 percent
expect it to stay the same, seven percent expect it to decline, and four percent are “not sure.” However, these
expectations vary by generation. Millennials (62 percent) are significantly more likely than Generation X (51
percent) and Baby Boomers (47 percent) to expect their happiness to improve.
124BASE: 20TH ANNUAL SURVEY - ALL QUALIFIED RESPONDENTSQ2510X. Do you expect the following aspects of your life to improve, decline, or stay the same when you retire? Happiness.
Do you expect your happiness to improve, stay the same, or decline in retirement? (%)
Improve Stay the same Decline Not sure
55 34
7 4
All Workers
62
27
6 5
Millennials
51
36
8 5
Generation X
47
43
7 3
Baby Boomers

Many Plan on Both Long Lives and Long Retirements
Workers are planning to live to age 90 (median). One in six Millennials (16 percent) are planning to live to age
100 or older, compared with Generation X (12 percent) and Baby Boomers (9 percent). An implication for
increased longevity is potentially more time spent in retirement. The survey compared workers’ planned life
expectancy with their expected retirement age and found that Millennial workers plan to spend 25 years in
retirement (median), a finding that is somewhat higher than Generation X (21 years median) and Baby Boomers
(20 years median).
125
*Note: Median years in retirement calculation includes those who said “don’t plan to retire.”BASE: 20TH ANNUAL SURVEY - ALL QUALIFIED RESPONDENTSQ2850. What age are you planning to live to?Q910. At what age do you expect to retire?
What age are you planning to live to?
62
6
16 16 16
38
>60 60-64 65-79 80-89 90-99 100+ Not Sure
Millennials (%)Median Age: 90
Median Years in Retirement: 25
3 3 614 13 12
49
>60 60-64 65-79 80-89 90-99 100+ Not Sure
Generation X (%)
Median Age: 90Median Years in Retirement: 21
<1 3 514 16
9
53
<60 60-64 65-79 80-89 90-99 100+ Not Sure
Baby Boomers (%)
Median Age: 90Median Years in Retirement: 20
4 3 615 15 13
44
<60 60-69 70-79 80-89 90-99 100+ Not Sure
All Workers (%)Median Age: 90
Median Years in Retirement: 23

How Old Is “Old”? It Depends on the Person
When asked the age at which they consider a person to be “old,” almost half of workers say that it depends
on the person (47 percent). Baby Boomers (61 percent) are more likely to indicate this than Generation X
(48 percent) and Millennials (39 percent).
Among those who provided a specific age, workers consider a person to be “old” at age 65 (median), a
finding that increases with workers’ age. Millennials consider a person to be “old” at age 60 (median),
Generation X consider it to be at age 70 (median), and Baby Boomers consider it to be at age 75 (median).
126
11 13 12 7 2 1
47
7
<60 60-69 70-79 80-89 90-99 100+ Itdependson theperson
Not Sure
All Workers (%)Median Age: 65
Age When a Person Is Considered “Old” (%)
BASE: 20TH ANNUAL SURVEY - ALL QUALIFIED RESPONDENTS Q1526. At what age do you consider a person to be “old”?
3 5 10 113 2
61
5
<60 60-69 70-79 80-89 90-99 100+ Itdependson theperson
Not Sure
Baby Boomers (%)Median Age: 75
19 17 124 1 <1
39
8
<60 60-69 70-79 80-89 90-99 100+ Itdependson theperson
Not Sure
Millennials (%)Median Age: 60
7 12 157 2 1
48
8
<60 60-69 70-79 80-89 90-99 100+ Itdependson theperson
Not Sure
Generation X (%)Median Age: 70

At What Age Is a Person “Too Old” to Work?
When asked the age at which they consider a person to be “too old” to work, more than half of workers
(53 percent) say it depends on the person. Across generations, Baby Boomers are most likely to say it
depends on the person (69 percent), followed by Generation X (56 percent) and Millennials (43 percent).
Among those who provided a specific age, workers say age 70 (median) is “too old” to work. Millennials
and Generation X consider a person to be “too old” to work at age 70 (median), while Baby Boomers say
age 75 (median).
127
Age When Person Is Considered “Too Old” to Work
513
208
2 1
43
8
<60 60-69 70-79 80-89 90-99 100+ It dependson theperson
Not Sure
Millennials (%)
3 716
7 3 1
56
7
<60 60-69 70-79 80-89 90-99 100+ It dependson theperson
Not Sure
Generation X (%)
Median Age: 70
Median Age: 70
<1 5 11 7 2 2
69
4
<60 60-69 70-79 80-89 90-99 100+ It dependson theperson
Not Sure
Baby Boomers (%)Median Age: 75
BASE: 20TH ANNUAL SURVEY - ALL QUALIFIED RESPONDENTS Q1527. At what age do you consider a person to be “too old” to work?
410
178
2 1
53
5
<60 60-69 70-79 80-89 90-99 100+ It dependson theperson
Not Sure
All Workers (%)Median Age: 70

Seven in 10 Are Concerned About Their Health in Older Age
Seventy-two percent of workers are either “very” (24 percent) or “somewhat” (48 percent) concerned
about their health in older age. Millennials (27 percent) are somewhat more likely to be “very
concerned” about their health in older age compared with Generation X (24 percent) and Baby Boomers
(18 percent).
128BASE: 20TH ANNUAL SURVEY - ALL QUALIFIED RESPONDENTSQ1445x1. How concerned are you about your health in older age?
Concerned About Health in Older Age (%)
Very Concerned Somewhat Concerned Not Too Concerned Not At All Concerned
24
48
22
6
All Workers
27
45
20
8
Millennials
24
49
21
6
Generation X
18
54
24
4
Baby BoomersNET – Concerned= 72%
NET – Concerned= 72%
NET – Concerned= 73%
NET – Concerned= 72%

Majority of Workers Describe Themselves as Healthy
The majority of workers describe their
general health as “excellent” or “good”
(80 percent), with 23 percent describing it
as “excellent” and 57 percent as “good.”
Eighteen percent describe their health as
being “fair” and two percent as “poor.”
Self-described general health is relatively
consistent across generations; however,
Millennial workers (27 percent) are more
likely to cite being in “excellent” health,
compared with Generation X (22 percent)
and Baby Boomers (16 percent).
129
BASE: 20TH ANNUAL SURVEY - ALL QUALIFIED RESPONDENTSQ2770. Overall, how would you describe your general health?
Self-Described General Health (%)
Excellent Good Fair Poor
23
27
22
16
57
52
60
66
18
18
17
17
2
3
1
1
All Workers
Millennials
Generation X
Baby Boomers
NET Healthy = 80%
NET Healthy = 79%
NET Healthy = 81%
NET Healthy = 82%

Workers Can Do More to Safeguard Their Long-Term Health
Given the potential implications on long-term health, workers across generations can be doing more health-
related activities on a consistent basis. Prior to the onset of the coronavirus pandemic, exercising regularly (57
percent), and eating healthfully (53 percent) are the only activities that more than half of all workers were
doing. Amid the pandemic, more workers indicate they are maintaining a positive attitude and are getting plenty
of rest. Before and during the pandemic, Baby Boomers are generally more likely to be engaging in healthy
activities compared with younger generations.
All Workers Millennials Generation X Baby Boomers
Exercising regularly
Eating healthfully
Maintaining a positive outlook
Getting plenty of rest
Seeking medical attention when needed
Managing stress
Avoiding harmful substances (e.g., cigarettes, alcohol, illicit drugs, etc.)
Getting routine physicals and recommended health screenings
Considering long-term health when making lifestyle decisions
Practicing mindfulness and meditation
Other
Nothing/None
BASE: 20TH ANNUAL SURVEY and April 2020 SUPPLEMENTAL SURVEY - ALL QUALIFIED RESPONDENTS
Q1446. Which of the following health-related activities are you doing on a consistent basis? Select all.
Engaging in Health-Related Activities on a Consistent Basis (%)
57
53
48
47
45
44
42
41
25
22
1
5
55
56
53
55
38
42
44
35
28
25
<1
4
53
47
44
45
36
43
36
31
26
23
<1
5
53
54
47
50
33
40
42
26
30
27
0
4
60
55
48
47
44
46
45
41
22
22
<1
4
56
55
55
61
39
45
38
37
24
23
1
4
61
61
56
52
61
45
49
61
24
20
2
3
57
59
60
63
51
46
54
51
26
22
<1
4
130
20th AnnualApril 2020
20th AnnualApril 2020
20th AnnualApril 2020
20th AnnualApril 2020

Appendix
131

In Their Own Words
132
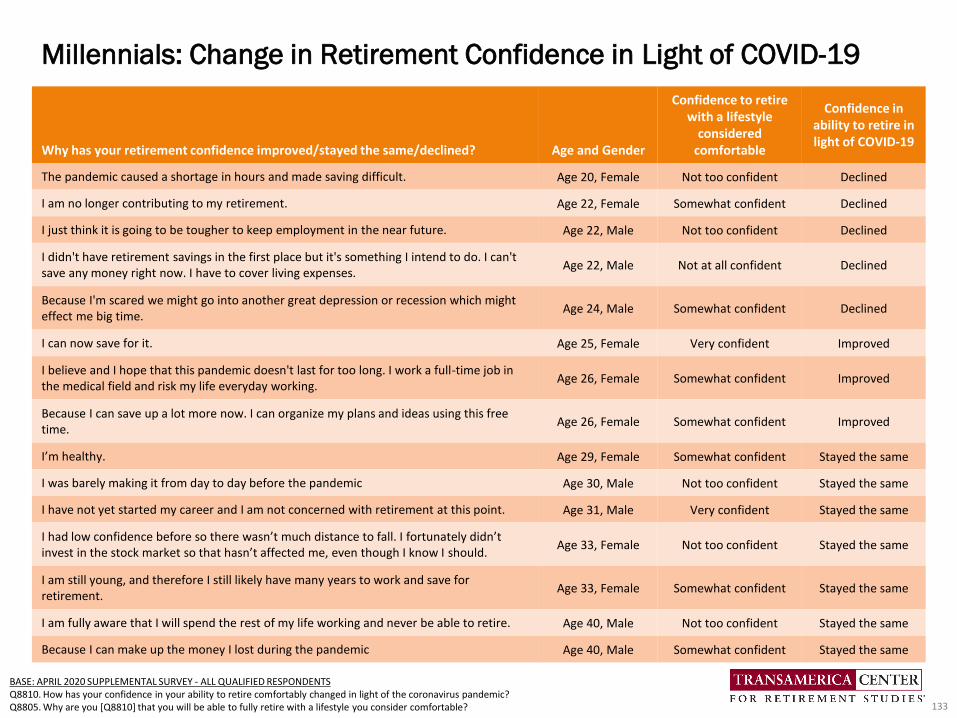
Millennials: Change in Retirement Confidence in Light of COVID-19
Why has your retirement confidence improved/stayed the same/declined? Age and Gender
Confidence to retire with a lifestyle
considered comfortable
Confidence inability to retire in light of COVID-19
The pandemic caused a shortage in hours and made saving difficult. Age 20, Female Not too confident Declined
I am no longer contributing to my retirement. Age 22, Female Somewhat confident Declined
I just think it is going to be tougher to keep employment in the near future. Age 22, Male Not too confident Declined
I didn't have retirement savings in the first place but it's something I intend to do. I can't save any money right now. I have to cover living expenses.
Age 22, Male Not at all confident Declined
Because I'm scared we might go into another great depression or recession which might effect me big time.
Age 24, Male Somewhat confident Declined
I can now save for it. Age 25, Female Very confident Improved
I believe and I hope that this pandemic doesn't last for too long. I work a full-time job in the medical field and risk my life everyday working.
Age 26, Female Somewhat confident Improved
Because I can save up a lot more now. I can organize my plans and ideas using this free time.
Age 26, Female Somewhat confident Improved
I’m healthy. Age 29, Female Somewhat confident Stayed the same
I was barely making it from day to day before the pandemic Age 30, Male Not too confident Stayed the same
I have not yet started my career and I am not concerned with retirement at this point. Age 31, Male Very confident Stayed the same
I had low confidence before so there wasn’t much distance to fall. I fortunately didn’t invest in the stock market so that hasn’t affected me, even though I know I should.
Age 33, Female Not too confident Stayed the same
I am still young, and therefore I still likely have many years to work and save for retirement.
Age 33, Female Somewhat confident Stayed the same
I am fully aware that I will spend the rest of my life working and never be able to retire. Age 40, Male Not too confident Stayed the same
Because I can make up the money I lost during the pandemic Age 40, Male Somewhat confident Stayed the same
133
BASE: APRIL 2020 SUPPLEMENTAL SURVEY - ALL QUALIFIED RESPONDENTSQ8810. How has your confidence in your ability to retire comfortably changed in light of the coronavirus pandemic?Q8805. Why are you [Q8810] that you will be able to fully retire with a lifestyle you consider comfortable?
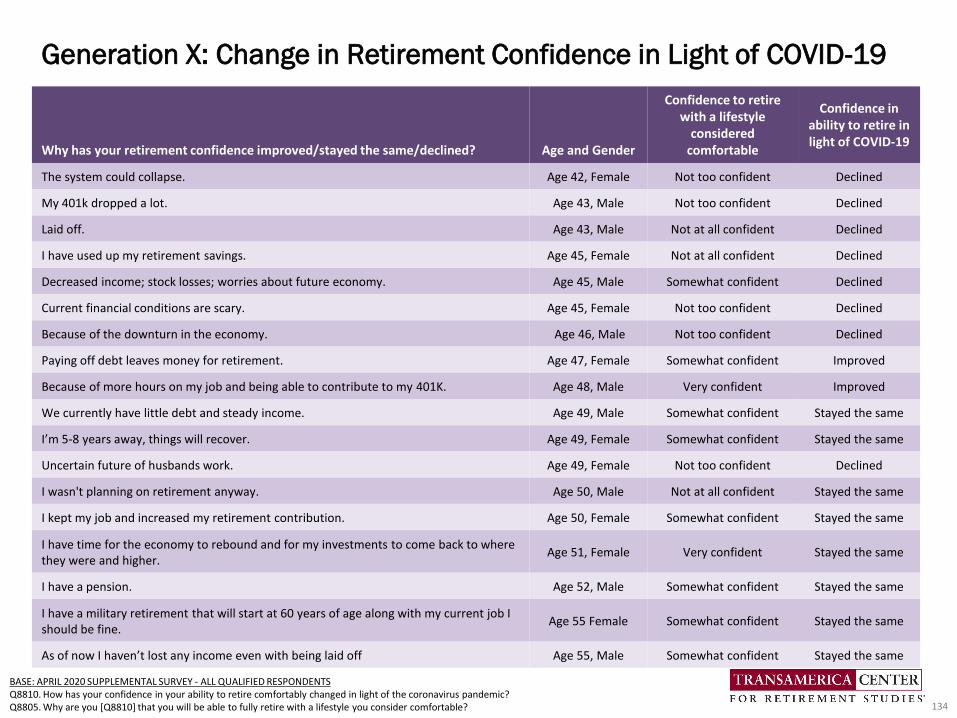
Generation X: Change in Retirement Confidence in Light of COVID-19
Why has your retirement confidence improved/stayed the same/declined? Age and Gender
Confidence to retire with a lifestyle
considered comfortable
Confidence inability to retire in light of COVID-19
The system could collapse. Age 42, Female Not too confident Declined
My 401k dropped a lot. Age 43, Male Not too confident Declined
Laid off. Age 43, Male Not at all confident Declined
I have used up my retirement savings. Age 45, Female Not at all confident Declined
Decreased income; stock losses; worries about future economy. Age 45, Male Somewhat confident Declined
Current financial conditions are scary. Age 45, Female Not too confident Declined
Because of the downturn in the economy. Age 46, Male Not too confident Declined
Paying off debt leaves money for retirement. Age 47, Female Somewhat confident Improved
Because of more hours on my job and being able to contribute to my 401K. Age 48, Male Very confident Improved
We currently have little debt and steady income. Age 49, Male Somewhat confident Stayed the same
I’m 5-8 years away, things will recover. Age 49, Female Somewhat confident Stayed the same
Uncertain future of husbands work. Age 49, Female Not too confident Declined
I wasn't planning on retirement anyway. Age 50, Male Not at all confident Stayed the same
I kept my job and increased my retirement contribution. Age 50, Female Somewhat confident Stayed the same
I have time for the economy to rebound and for my investments to come back to where they were and higher.
Age 51, Female Very confident Stayed the same
I have a pension. Age 52, Male Somewhat confident Stayed the same
I have a military retirement that will start at 60 years of age along with my current job I should be fine.
Age 55 Female Somewhat confident Stayed the same
As of now I haven’t lost any income even with being laid off Age 55, Male Somewhat confident Stayed the same
134
BASE: APRIL 2020 SUPPLEMENTAL SURVEY - ALL QUALIFIED RESPONDENTSQ8810. How has your confidence in your ability to retire comfortably changed in light of the coronavirus pandemic?Q8805. Why are you [Q8810] that you will be able to fully retire with a lifestyle you consider comfortable?

Baby Boomers: Change in Retirement Confidence in Light of COVID-19
Why has your retirement confidence improved/stayed the same/declined? Age and Gender
Confidence to retire with a lifestyle
considered comfortable
Confidence inability to retire in light of COVID-19
Because I'm looking forward to retirement. Age 56, Male Somewhat confident Stayed the same
Loss of several streams of income. Age 57, Male Not too confident Declined
Just taking more precautions. Age 58, Male Very confident Improved
My work is under critical need. Hours have changed, but work is constant. Age 58, Male Somewhat confident Stayed the same
I know my financial plan for retirement is solid and on course for the long term. Age 58, Male Very confident Stayed the same
I am not retiring. Age 58, Female Not at all confident Stayed the same
Because they will find a vaccine and the pandemic will be over. Age 58, Male Somewhat confident Stayed the same
My husband and I are still working and saving regularly every paycheck. Age 59, Female Very confident Stayed the same
Worry about health. Age 60, Female Not too confident Declined
With the help of professional I am being managed greatly. Age 60, Male Very confident Improved
I think the markets will rebound by the time I retire. Age 61, Male Somewhat confident Stayed the same
Trying not to spend money so remaining confident that all things will work out. Age 62, Female Somewhat confident Stayed the same
My tenants might not be able to pay. Age 64, Female Somewhat confident Declined
I’m on Social Security. Age 64, Female Very confident Stayed the same
The impact of the current situation on the financial market. Age 65, Male Somewhat confident Declined
I'm still working. I'm actually getting more money right now. Age 66, Female Somewhat confident Stayed the same
Job hours and income reduced. Age 68, Female Somewhat confident Declined
135
BASE: APRIL 2020 SUPPLEMENTAL SURVEY - ALL QUALIFIED RESPONDENTSQ8810. How has your confidence in your ability to retire comfortably changed in light of the coronavirus pandemic?Q8805. Why are you [Q8810] that you will be able to fully retire with a lifestyle you consider comfortable?

Millennials: “Retirement” means to me…
BASE: 20TH ANNUAL SURVEY - ALL QUALIFIED RESPONDENTSQ9000. What does “retirement” mean to you?
Age and Gender
I think it means you’ve done your job in life and it’s finally time to relax enjoy the things you couldn’t do when you werebusy working or going to school consistently. I love to do crafts, painting, and anything like that and I’ve never reallygotten around to much of it. I would definitely love to eventually have that as my way of living.
Age 19, Female
Being able to spend more time doing things I enjoy and being able to work when and if I want. Age 20, Male
It’s the point in life where you should have money saved up because little to no employers would hire you. Age 21, Male
Kids are moved out, my wife and I can travel, and run the farm and our woodworking business with ease. Age 22, Male
It means not having to work full-time and having more time for myself, while knowing that life is almost over. Age 23, Male
Becoming a burden on my family. Age 23, Male
The end of your life... time to do the last things you want before you die... freedom. Age 23, Female
Being able to enjoy the rest of my life using a set monthly income that's been saved through my retirement plan over years. Age 24, Male
It means happiness. Age 25, Male
It means success in life. I wish people could retire sooner because 65 is so old. I am looking forward to retirement. Age 25, Female
It’s tricky since you will finally have time to rest, but you will be too old to enjoy the things you want now. Age 26, Male
Knowing you have enough money to be financially secure to live off of for another 30 years. Age 27, Female
Opportunity to leave a lasting impact. Age 28, Male
Having done your duty as a working citizen and having younger generations work to help out. Age 29, Male
Loneliness, forgotten, sadness, depression, and mental health problems. Age 31, Female
Return to my homeland and family in the Philippines. Age 33, Female
Scary and angry that I probably will not receive the Social Security I am paying in to. Age 34, Female
Not working and getting senior discounts on everything. Age 39, Male
136

Generation X: “Retirement” means to me…
BASE: 20TH ANNUAL SURVEY - ALL QUALIFIED RESPONDENTS Q9000. What does “retirement” mean to you?
Age and Gender
Worry that I won’t have a support system in place and my finances will be shaky. Age 40, Male
Travel within U.S. and Canada. Take gourmet cooking classes and write my own cookbook. Organic gardening and becomemore environmentally conscious. Volunteer for animal rescue groups and foster until adopted. I would like to learn yoga and attend classes with my husband.
Age 40, Female
Retirement is becoming nonexistent because people can’t afford to retire anymore!! Age 42, Female
Retirement means that you get to look back on your work life, see how successful you were, and get to enjoy the rest of your life. Age 42, Female
Being free of a boss! Age 42, Female
I have no idea. I'll probably never be able to retire. Age 43, Male
Retirement is supposed to be the time for you to retire and enjoy what's left of your life and your grandchildren. But to me,personally, it means financial fear.
Age 43, Female
Retirement, to me, is exploring alternative ways of living that don't involve the nine to five grind. Age 45, Male
I do not plan to ever really retire. I would get bored. I plan to continue to work and hopefully take on some volunteer work. Age 45, Female
It means being financially independent! You can retire at any age. I think the younger the better, so you can enjoy it with no health issues or anything like that. I am tired of working M-F; in the U.S. it's all work, work, work. We need more time off like in other countries and a universal healthcare system, so we don't have to worry so much about losing our health coverage if we lose our jobs!
Age 45, Female
To be able to watch Netflix, enjoy the dogs, and watch the sunset. Age 46, Female
Living under my means. This is a very stressful subject. Age 47, Female
Freedom and hopefully financial security. Fearful about health and medical wellness. Age 51, Male
To start a new life, and maybe start a new business. Age 53, Female
Not getting up to an alarm. Sleeping late. Enjoying freedom. Age 53, Female
Retirement is a time for me to do what I want for the first time in my life. Whether that means traveling the world, continuing to work or spending time with my family and friends, at the end of the day it is my choice and my happiness that drives my decisions.
Age 53, Female
137

Baby Boomers: “Retirement” means to me…
BASE: 20TH ANNUAL SURVEY - ALL QUALIFIED RESPONDENTS Q9000. What does “retirement” mean to you?
Age and Gender
Retirement means freedom from the timeclock and getting a chance to do the things I haven't been able to do because I am always working.
Age 54, Female
It means nothing to me because I will never be able to afford to retire. Age 54, Female
Being unemployed, bored, and broke. Age 55, Female
Freedom to foster kittens. Age 56, Female
Downsizing my home and possessions; moving to a coastal area so I can be near the beach; cutting back on the number of hours I'm working - just having a part-time job that is fun and provides me with a little extra spending money to do the fun things in life such as travel and dining out.
Age 56, Female
Being able to go to work for a non-profit so I can enjoy my work; volunteering for an organization that I care about. Freedom; less stress and spending my time on my own terms.
Age 61, Female
Gradually backing off hours at work, allowing me the opportunity to test the waters. Retirement means freedom from the workforce, more time to do things around the house, more freedom to go see grandchildren before they are all grown up.
Age 62, Female
A phase in life when your body slows down and you focus on working/helping others with your accumulated experience. Age 63, Male
A time to take a break from stress and competitiveness of life and a time to reconnect and enjoy your family. Age 66, Male
Puerto Vallarta. Age 66, Male
I have been trying to figure that out. I am happy doing what I am currently doing so maybe I am retired. Age 67, Male
Inactivity and depleted usefulness. Age 68, Male
Traveling the U.S. in our RV. Age 69, Female
I would like to travel some but I still would like to work 2-3 days a week. Age 69, Female
The opportunity to find fulfillment in something other than my career. Age 71, Male
At 71, I feel too young to retire, an enjoyable life style is pleasure enough working or retired. I enjoy life, I enjoy my work, and I enjoy the area I live in.
Age 71, Male
Sleeping in. Going to work at the winery to help people learn about appreciating wine and the wine industry. Age 72, Male
138

20th Annual Survey: A Portrait of Workers
BASE: 20TH ANNUAL SURVEY - ALL QUALIFIED RESPONDENTS
CharacteristicsAll Workers (%)
n=5,277Millennials (%)
n=2,418Generation X (%)
n=1,424Baby Boomers (%)
n=1,287
Gender* Male 54 54 56 53 Female 45 45 43 47 Transgender 1 1 1 <1
Marital Status Married/ Living with partner 61 54 71 69 Divorced/Separated/Widowed 11 5 11 19 Never married 28 41 18 12
Work Status Full Time 79 79 86 77 Part Time 21 21 14 23
Underemployment Yes, I consider myself underemployed 23 28 20 16 No 71 66 73 79 Not sure 6 6 7 5
Number of Jobs Currently Held
One 83 75 85 91 Two or more 17 25 15 9
Level of Education Less Than High School Diploma 8 11 3 3High School Diploma 30 32 28 33 Some College or Trade School 31 28 32 37College Graduate or More 31 29 37 27
Annual Household Income
Less than $50,000 25 30 20 19 $50,000 to $99,999 35 37 33 35 $100,000+ 38 32 44 43Decline to Answer 2 1 3 3Estimated Median $71,000 $62,000 $80,000 $79,000
General Health (Self-Described)
Excellent 23 27 22 16 Good 57 52 60 66 Fair 18 18 17 17 Poor 2 3 1 1
Sexuality LGBT 8 10 8 5 Did not identify as LGBT 90 88 91 95 Decline to Answer 2 2 1 -
Race** White 60 53 60 74Black/African American 11 13 11 9 Asian/Pacific Islander 7 8 8 5 Hispanic 19 23 19 11
* Gender: Responses less than 1% for "Other" and "Prefer not to answer" are not shown.
** Race: Responses less than 2% for “Some other race” and “Prefer not to answer” are not shown.
139

April 2020 Supplemental Survey: A Portrait of Workers
BASE: APRIL 2020 SUPPLEMENTAL SURVEY - ALL QUALIFIED RESPONDENTS
CharacteristicsAll Workers (%)
n=1,248Millennials (%)
n=601Generation X (%)
n=318Baby Boomers (%)
n=263
Gender Male 52 52 54 51Female 48 48 46 49Transgender 3 3 2 2
Marital Status Married/ Living with partner 51 47 67 60Divorced/Separated/Widowed 15 7 15 29Never married 34 46 18 11
Work Status Full Time 63 69 72 55Part Time 18 15 13 19
Underemployment Yes, I consider myself underemployed N/A N/A N/A N/ANo N/A N/A N/A N/ANot sure N/A N/A N/A N/A
Number of Jobs Currently Held
One N/A N/A N/A N/ATwo or more N/A N/A N/A N/A
Level of Education Less Than High School Diploma 8 7 5 5High School Diploma 15 14 17 12Some College or Trade School 37 38 32 46College Graduate or More 40 41 46 37
Annual Household Income
Less than $50,000 27 29 19 26$50,000 to $99,999 32 36 31 28$100,000+ 40 35 49 45Decline to Answer 1 <1 1 1Estimated Median 73,700 $67,200 $88,100 $79,600
General Health (Self-Described)
Excellent 24 28 19 18Good 61 57 66 67Fair 13 14 12 11Poor 2 1 3 4
Sexuality LGBT 10 12 8 6Did not identify as LGBT 87 84 89 89Decline to Answer 3 4 3 5
Race White 67 61 75 75Black/African American 13 14 12 10Asian/Pacific Islander 6 8 6 5Native American or Alaskan Native 2 3 1 3Hispanic 19 28 6 11Other race 9 11 5 4Decline to answer 2 3 1 3
140