Embed Size (px)
Citation preview
Retirement and cognitive reserve :
A stochastic frontier approach applied to survey data
Stéphane Adam, Eric Bonsang, Sophie Germain and Sergio Perelman
April 2007 / N° 200704/02
CAHIER DE RECHERCHE / WORKING PAPER
Retirement and cognitive reserve:
A stochastic frontier approach applied to survey data1
Stéphane Adam1, Eric Bonsang
2, Sophie Germain
1 and Sergio Perelman
2
CREPP
Working Paper 2007/04
1 Neuropsychology Unit, University of Liège, Belgium
2CREPP, HEC-Management School, University of Liège, Belgium
Abstract
This paper proposes the use of the stochastic frontier approach to analyse the relationship
between cognitive performance, retirement and non-professional activities of the 50+
individuals using data from three surveys conducted in Europe (the Survey on Health,
Ageing and Retirement in Europe and the English Longitudinal Survey on Ageing) and
United States (the Health and Retirement Study). Next to the strong relationship between
cognitive performance, age and education, this study highlights the negative effect of
retirement and the positive impact of non-professional activities and social contacts.
Keywords: Cognitive reserve; Retirement; Stochastic Frontier
JEL classification: I12; J14; J26
1 This paper uses data from release 2.0.1 of SHARE 2004. The SHARE data collection has been primarily
funded by the European Commission through the 5th framework programme (project QLK6-CT-2001- 00360
in the thematic programme Quality of Life). Additional funding came from the US National Institute on
Ageing (U01 AG09740-13S2, P01 AG005842, P01 AG08291, P30 AG12815, Y1-AG-4553-01 and OGHA
04-064). Data collection for wave 1 was nationally funded in Austria (through the Austrian Science
Foundation, FWF), Belgium (through the Belgian Science Policy Office), France (through CNAM, CNAV,
COR, Drees, Dares, Caisse des Dépôts et Consignations et le Commissariat Général du Plan) and Switzerland
(through BBW/OFES/UFES. The SHARE data collection in Israel was funded by the US National Institute
on Aging (R21 AG025169), by the German-Israeli Foundation for Scientific Research and Development
(G.I.F.), and by the National Insurance Institute of Israel. Further support by the European Commission
through the 6th framework program (projects SHARE-I3, RII-CT- 2006-062193, and COMPARE, CIT5-CT-
2005-028857) is gratefully acknowledged. This paper enters in the frame of ARC (Actions de Recherches
Concertées) between the CREPP (Centre de Recherche en Economie Publique et de la Population) and the
Faculty of Psychology of the University of Liège.
CCRREEPPPP
WWoorrkkiinngg PPaappeerrss

2007 04
1
CCRREEPPPP WWoorrkkiinngg PPaappeerrss
1. Introduction
Over the last decades, the age of retirement became a key variable in industrialized
countries, especially in several European countries where early retirement is often
considered by decision-makers, but also by most people, as the “natural” way to adjust
labour market excess supply. The popularity of pre-retirement schemes, broadly defined to
include disability, sickness and unemployment paths to retirement, is proved by the low
employment rates reached among the 55-64 years old in most of these countries.
Nevertheless, up to now no clear evidence was given that the massive withdraw of aged
workers from the labour market favored the employment of other categories of the
population. On the contrary, as shown by Blöndal and Scarpetta (1998) the reverse
situation seems to occur as some of them, mainly Scandinavian countries, afford to keep
most aged workers in activity at the same time they reached the higher employment rates
in Europe for all the other categories of the population.
In this paper our concern is the population of retirees and a particular aspect of their
well-being: the evolution of individual cognitive performances at retirement. For this
purpose, we rely on the broad neuroscience literature that shows how occupational
activities play a positive role on cognitive performances and in particular on the
constitution of the so-called “cognitive reserve” described recently by Stern (2002, 2003).
The cognitive reserve concept emerges from the repeated observations that there is not a
direct relationship between the severity of the factor that disrupts performance (such as
degree of brain pathology or brain damage) and the degree of disruption in performance. It
suggests that some individuals are able to use more efficiently their cognitive resources
and thus are less susceptible to disruption. Individual heterogeneity can stem from innate
or genetic differences, or different life experience such as occupational attainement or
leisure activities (Stern, 2003). Retirement implies many changes in the lifestyle of the
elderly, which may in turn affect cognitive reserve and thus cognitive performances at
older age.
The potential role of the age of retirement in the economy was originally underlined in
the life-cycle model proposed by Ando and Modigliani (1963), but it was the extension of
this model developed by Feldstein (1974) that for the first time introduced the notion of
endogenous retirement decisions and the potential effect on them created by Social
Security regulations. Nowadays, mainly thanks to the NBER International Social Security

2007 04
2
CCRREEPPPP WWoorrkkiinngg PPaappeerrss
project (Gruber and Wise, 1999, 2004), we know that this is the case. Public, as well as in
some cases private, pension schemes regulations create incentives that influence individual
decisions to withdraw anticipatively from the labour market. Other than the potential
drawbacks of early retirement on labour markets efficiency and for the long-term
sustainability of pay-as-you-go schemes, there is another drawback that cannot be
neglected, its potential impact on individuals’cognitive performances.
This research is today possible thanks to the data collected on the “50 and +”
population by three interdisciplinary survey projects: the Health and Retirement Study
(HRS), started in the United States in 1992; the English Longitudinal Study on Ageing
(ELSA), started in United Kingdom in 2002; and the Survey on Health, Ageing and
Retirement in Europe (SHARE), whose first wave took place in 2004 in several other
European countries. These surveys include information on many aspects of life, including
work, financial situation, family, housing, physical and mental health. They allow to
analyse many dimensions of the ageing process and constitute a powerful tool to identify
the factors driving cognitive performance and more particularly the effect of labour force
participation on their individual cognitive reserve.
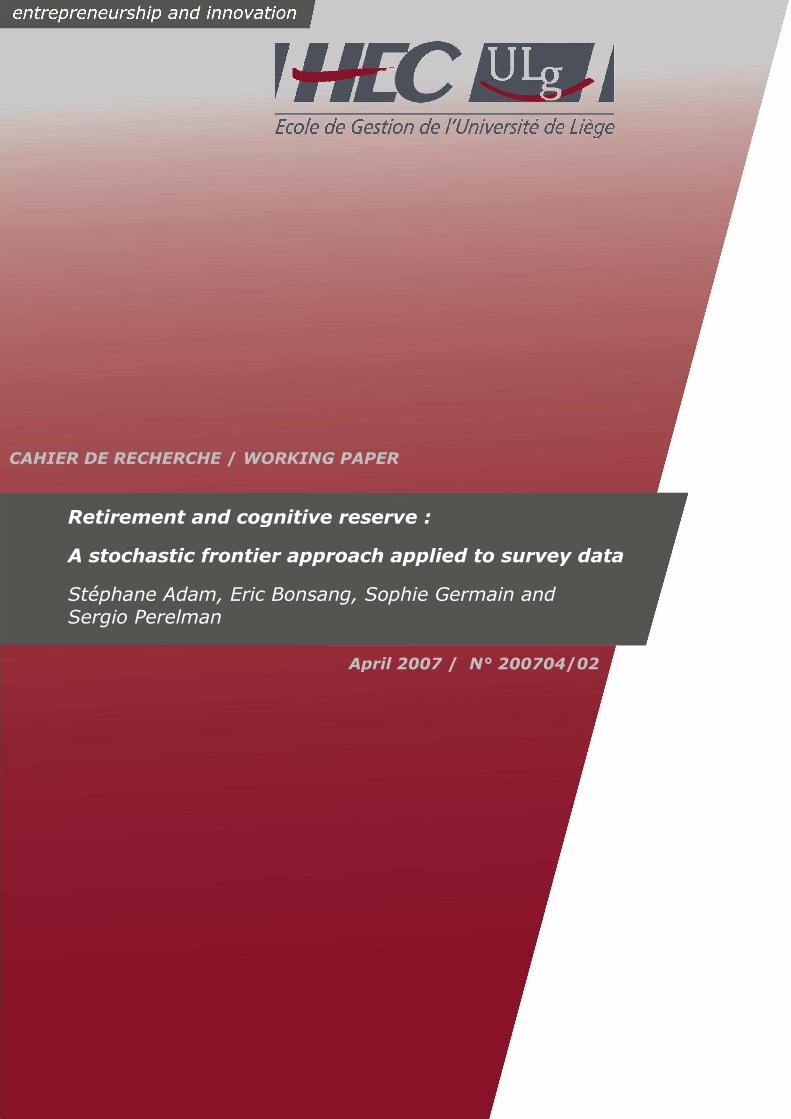
Figure 1 illustrates what must be considered as the starting point of our research. On
the horizontal axis we report the percentage points slowdown in employment rates when
we compare the 50-54 to the 60-64 years old groups in HRS, ELSA and SHARE countries
and, on the vertical axis, the slowdown in cognitive performances, measured by a ten-
words two-recall memory test, between the same age groups within the same countries.
Even if this rough crossing-age groups comparison suffers of several potential bias, mainly
due to an underlying steady-state assumption, it highlights what we consider as the main
evidence of a potential unexpected consequence of early retirement programs. Without
anticipating the results of a detailed statistical study, as that presented here, it appears that
countries that performed better in terms of labour market participation among the elderly,
also seem to have better prevented cognitive capacity decline.

2007 04
3
CCRREEPPPP WWoorrkkiinngg PPaappeerrss
Figure 1. Employment rate and cognitive performances. Relative difference between 60-64
and 50-54 years old men
United States
DenmarkGreece
SwedenSwitzerland
United KingdomSpain
Germany
ItalyThe NetherlandsBelgium
Austria
France
-25%
-20%
-15%
-10%
-5%
0%
-100% -90% -80% -70% -60% -50% -40% -30% -20% -10% 0%
Employment rate (relative difference)
Co
gn
itiv
e p
erfo
rman
ce (
rela
tiv
e d
iffe
ren
ce)
Source: ELSA for United Kingdom, HRS, for United States, and SHARE for the other countries. 2004.
For estimation purposes, we use a parametric stochastic frontier approach (SFA). This
approach, which was originally developed to measure firms’ performances in an output-
input setting, has been applied to measure individual performances in other fields of human
behavior in which measurable outcomes, e.g. well-being and education, are driven by
observable factors.2 In this study, we use the SFA to estimate the individual efficiency of
cognitive functioning, measured by memory tests scores.3 For this purpose, a composed
error term model is estimated using econometric tools. On the one hand, we assume that a
normally and symmetrically distributed error term catch random noise, and, on the other
hand, that an asymmetrically (truncated) normally distributed error term represents
individuals’ distance to the frontier, also known as technical inefficiency in the frontier
analysis literature. Within this framework, the frontier corresponds to the best cognitive
functioning that individuals are expected to reach if they were fully efficient. This
benchmark is assumed to mainly depend on biological factors, such as age and memory-
related diseases, education, and other control variables. Technical efficiency can then be
interpreted as a measure of cognitive reserve: the higher the cognitive efficiency, the
2 See, for instance, applications to households’ well-being in Lovell et al. (1994) and to students’
performances in Perelman and Santin (2005). 3 Stochastic frontier analysis was introduced contemporaneously by Aigner et al. (1977) and Meusen and Van
den Broeck (1978). For a complete survey, see Kumbhakar and Lovell (2002) or Coelli et al. (2005).
2007 04
4
CCRREEPPPP WWoorrkkiinngg PPaappeerrss
higher the cognitive reserve. The stochastic frontier model specification proposed by
Battese and Coelli (1995) allows to test the effects of factors such as retirement, social and
non-professional activities on individual cognitive efficiency.
Results confirm the hypothesis that social interactions and occupational activities,
including paid-work and not paid-work as well as sport practice and other physical
activities contribute to the constitution of the cognitive reserve.
The next sections of the paper are organized as follows. In Section 1 the cognitive
reserve concept is presented, as well as a condensed survey of studies in the field. Section
2 is devoted to the presentation of the SFA approach and Section 3 to the samples and
variable definitions. In Section 4 the main results of the study are reported and, finally,
Section 5 summarizes the conclusions.
2. The “cognitive reserve” concept
Over the past 25 years, a great deal of evidences have been accumulated indicating that
advancing age is accompanied by systematic decline in performance on a wide variety of
cognitive tasks. However, although this cognitive decline with age has been defined, this
process is not unavoidable. There exist many examples of elderly people who keep high
cognitive functions, even at extreme age. Fillit et al. (2002) suggested that individuals have
varying degrees of « functional reserve » in their brains. Persons with high functional
reserve may have increased capacity to keep learning and adapting despite age-related
changes (Baltes and Baltes, 1990). This view has been developed in more functional terms
by Stern (2002 and 2003) and Scarmeas and Stern (2003) with the concept of “cognitive
reserve”. For Scarmeas and Stern (2003), cognitive reserve related back to the fact that
innate intelligence or aspects of life experience like educational or occupational
attainments provide a reserve, in the form of a set of skills or repertoires that allows some
people to prevent cognitive decline associated with normal aging or Alzheimer’s disease.
A related idea is that there may be differences in how individuals compensate once the
pathology disrupts the brain network that underlie performance. Cognitive reserve could
take the form of using brain networks or cognitive paradigms that are more efficient or
flexible, and thus less susceptible to disruption. In essence, an individual who uses a brain
network more efficiently, or is more capable of calling up alternate brain networks or

2007 04
5
CCRREEPPPP WWoorrkkiinngg PPaappeerrss
cognitive strategies in response to increased demand may have more cognitive reserve and
might maintain effective performance longer in the face of brain pathology (Stern, 2003).
Recent researches tried to identify parameters contributing to the development of
cognitive reserve. For example, education is largely recognized as having an impact on
cognitive functioning, and is thought to support the cognitive reserve capacity (e.g. Le
Carret et al., 2003). Some studies confirming this idea have suggested that people with a
high educational level have lower risk of developing dementia compared to people with a
low educational level (Letenneur et al., 1999; Stern et al., 1994). Similarly, lower linguistic
ability in early life (Snowdon et al., 1996) and lower mental ability scores in childhood
(Whalley et al., 2000) appeared to be strong predictors of poor cognitive function and
dementia at older age.
Factors other than IQ and education might also provide reserve and influence the
cognitive functioning of elderly people. So, several studies have suggested that differential
susceptibility to age-related cognitive decline or to Alzheimer’s disease is related to
variables, such as: occupation (Evans et al., 1993; Letenneur et al., 1994; Schooler et al.,
1999; Stern et al., 1994), professional or leisure activities (Carpuso et al., 2000; Scarmeas
et al., 2001; Wilson et al., 2002), and life style (see for a review: Fillit et al., 2002; and
Fratiglioni et al., 2004); variables which have been therefore considered as associated with
cognitive reserve.
All these findings on cognitive reserve may have important implications for the
structure of retirement. Keeping occupational activities as far as possible may contribute to
maintain cognitive functioning in old age.
3. The stochastic frontier approach
According to the cognitive reserve concept, individuals with high cognitive reserve reach a
higher level of cognitive functioning for a given level of cognitive resources. Such a
reserve allows to delay or decrease the loss of cognitive functioning due to the biological
ageing process or illnesses. It suggests that high cognitive reserve allows to use more
efficiently cognitive resources. The aim of the empirical model is to analyse the effects of
retirement, and other non-professional activities, on the constitution of the cognitive
reserve. The stochastic frontier approach provides a useful tool to measure cognitive

2007 04
6
CCRREEPPPP WWoorrkkiinngg PPaappeerrss
reserve. Indeed, this approach allows to measure cognitive functioning (measured by a
score based on cognitive test) that individuals would reach if they were fully efficient for a
given level of resources. This method allows to calculate a efficiency ratio, which may be
interpreted as a measure of cognitive reserve. Ideally, the frontier would include factors
influencing biological resources of the individuals. However, we choose to include
education, which is usually associated with cognitive reserve, as determinants of the
cognitive frontier to take into account the interdependent relationship between cognitive
ageing and education. As a result, cognitive resources are assumed to depend mainly on
biological factors such as age and other memory-related diseases, education, and other
control variables such as, gender, ethnicity, country dummies… The model can be
described as follows: [ iiii D,Xfrln ] (1); where ir is the cognitive test score of
individual i, iX is a vector containing the two main determinants of cognitive functions
(i.e., age and education), aside with a vector of control variables, iD , and i is a
composed error term of the form: [iiiuv ] (2); where
iv is assumed to be a two-sided
random (stochastic) disturbance term to account for statistical noise, distributed iid
2,0v
N and independent of iX , and
iu a random term assumed to be independently
distributed as truncations at zero of the 2,ui
N distribution.4
Theiu term has a key interpretation in the frontier analysis literature; it corresponds to
the distance to the best practice- represented by the stochastic frontieriiivDXf , . In
the case analysed here, the best practice would correspond to the maximum cognitive
functions each individual is expected to reach given his age and years of education. Note
thatiu appears additively in the equation after the logarithmic transformation of the
dependent variable, which means that )uexp( i corresponds to the individual efficiency
ratio and is equal to 1 when the individual cognitive performance lies on the frontier.
We opt for a translogarithmic specification for the relation between the cognitive
performances, and the age and education in equation (1). The proposed function
corresponds to a second order approximation on these two variables aside with
i,md (m=1,2,…,M) control variables such as gender and country dummies. The function to
be estimated is the following:
4 Both terms are independently distributed ( )0uv = .

2007 04
7
CCRREEPPPP WWoorrkkiinngg PPaappeerrss
i,i,i,i,i,i,i xlnxlnxlnxlnxlnxlnrln 215
2
24
2
1322110
ii
M
m
i,mm uvD1
(3),
wherek(k=0,1,…,5) and
m(m=1,2,…,M) are parameters to be estimated. The main
advantage of the translog specification is its great flexibility. Other than the logarithmic
transformation of variables, second order terms allow for non-linear relations and
interactions among age and education. The derivative of this function at each point
corresponds to the rate of substitution between age and education. In other words, it
estimates how many years of cognitive ageing are compensated by an additional year of
education, measured at different ages and levels of education.
Moreover, the SFA model specification proposed by Battese and Coelli (1995) allows
to test simultaneously the influence of other individual characteristics, denoted by J
variablesij
z,, on cognitive performances
iu , through the truncation parameter:
[J
j
i,jji z1
0 ] (4). The z-variables include individual characteristics such as
employment status, non-professional activities and social interactions. The 0 and
j are
parameters to be estimated jointly with the k and
m parameters in equation (4) using a
maximum likelihood optimization algorithm.5 In addition, two other parameters are
simultaneously estimated: 222
uv and 22
u, the last term corresponding to
the share of inefficiency on total error term variance. The expected efficiency ratio for the
ith
observation is obtained as follows:
**
*****exp)e)u(exp(E
i
iiii 2
22
2
2
1 , (5)
22
22
uv
iuivi
ez* ,
22
222
uv
vu* .
5 For estimations we use FRONTIER Version 4.1, a program developed by Coelli (1994).

2007 04
8
CCRREEPPPP WWoorrkkiinngg PPaappeerrss
4. Data
4.1. The surveys: ELSA, HRS and SHARE
Our analysis uses three surveys on older individuals in Europe and United-States: the
English Longitudinal Survey of Ageing (ELSA), the Health and Retirement Study (HRS),
and the Survey of Health, Ageing and Retirement in Europe (SHARE). These surveys
include a wide range of information about health, employment, financial situation, the
family and activity of the 50+ populations.
ELSA is a survey based on a representative sample of individuals born in or before
1952 living in private households in England. The sample is drawn from households that
had previously participated to the Health Survey for England (HSE) during 1998, 1999 and
2001. In this paper, we use the second wave of ELSA that has been conducted during
2004/2005.6
HRS is a survey conducted by the Institute for Social Research at the University of
Michigan and includes a nationally representative panel of older Americans every two
years since 1992. The HRS has followed a sample of individuals born between 1931 and
1941 and their partner since 1992. From 1998 onwards, this survey also included
respondents from the Asset and Health Dynamics Among the Oldest Old (AHEAD) study
(born between 1890 and 1923), a representative sample of individuals born between 1924
and 1930 (the Children of the Depression Age) and between 1942 and 1947 (the War Baby
Cohort). An additional sample of individuals born between 1948 and 1953 (the Early Baby
Boomers) has been added in 2004. As a result, the seventh wave (2004) of HRS includes
individuals born on 1953 or before. The RAND Corporation provides a user-friendly
version of the HRS data that was partly used in this analysis. This study uses the seventh
wave of HRS conducted during 2004.7
SHARE is a European multi-disciplinary survey including more than 30,000 persons
born in 1954 or before, and coming from 11 European countries ranging from Scandinavia
6 More information about the survey is available in the ELSA website: http://www.ifs.org.uk/elsa/ 7 More information on the data and the methodology can be found in the HRS website:
http://hrsonline.isr.umich.edu/

2007 04
9
CCRREEPPPP WWoorrkkiinngg PPaappeerrss
to the Mediterranean, and Israel.8 We use in this paper the release 2 of the first wave of the
survey, which was conducted in 2004.The data were collected using a computer assisted
personal interviewing (CAPI) program, supplemented by a self-completion paper and
pencil questionnaire. For more details on the sampling procedure, questionnaire contents
and fieldwork methodology, readers should refer to Börsch-Supan et al. (2005).9
The good coordination between these three surveys allows comparing the results
across them. A high proportion of the questions asked to the respondents are the same for
each survey.
4.2. The dependent variable: the memory test score
The three surveys contain measures of cognitive functioning based on simple tests. This
study focuses on one key cognitive domain: episodic memory. This type of memory allows
to stock and recover events that we have experienced (it can be what we had for dinner two
days ago or a list of words to learn and remember in a psychological test) or information
learnt in a specific spatial or temporal context (for example, the last holidays, the movie
watched a few days ago, or the discussion with friends at the last dinner). The rationale
underlying this choice was twofold: from a psychometric point of view, we selected a
sensitive cognitive score that is not affected by ceiling or floor effects (excess of maximum
or minimum values). From a more theoretical point of view, it is widely recognized that
episodic memory is a cognitive domains that is particularly sensitive to cognitive ageing.
In fact, some authors consider that episodic memory is among the first cognitive functions
to decline with age (Anderson and Craik, 2000; Prull et al.,2000). The related task
integrated in the three surveys consisted in a test of verbal learning and recall, where the
participant is required to learn a list of ten common words: The interviewer first reads a list
of ten common nouns to the respondent, and asked the respondent to recall as many words
as possible from the list in any order. After approximatively 5 minutes of asking other
survey questions, the respondent was asked to recall again the list of words previously read
to him/her. Memory score for this task was calculated by adding the number of target
words recalled at the immediate recall phase with the number of target words recalled at
8 The first wave of SHARE data includes twelve countries: Austria (AU), Belgium (BE), Germany (DE),
Denmark (DK), France (FR), Greece (GR), Italy (IT), Netherlands (NL), Spain (ES), Sweden (SE),
Switzerland (CH) and Israel (IL). 9 More information on the SHARE website: http://www.share-project.org/

2007 04
10
CCRREEPPPP WWoorrkkiinngg PPaappeerrss
the delayed recall phase (score ranging from 1 to 20). Observations reporting a memory
score of zero are excluded from the analysis because we suspect that this result is partly
due to survey mistakes, outliers, or individuals with particularly severe cognitive
impairements. HRS and ELSA contain four lists of ten words (that are the same across the
two surveys) and respondents are randomly assigned a list of words to learn. For SHARE,
there is only one list of words for all individuals and the list of words is different from
ELSA and HRS. This difference makes cognitive performances comparison across surveys
difficult if different lists of words are more or less easy to learn.10
However, we are not
directly interested in comparing cognitive score across surveys but in analysing the relative
effects of different factors on the cognitive performances. Figure 2 presents the distribution
of memory score by survey. The distribution of the memory score seems to follow a
normal distribution around 10 for ELSA and HRS while it is around 8 and 9 for SHARE.
Figure 2. The distribution of memory score.
ELSA
0.0%
2.0%
4.0%
6.0%
8.0%
10.0%
12.0%
14.0%
1 2 3 4 5 6 7 8 9 10 1112131415 16171819 2
M e mo ry s c o re
HRS
0.0%
2.0%
4.0%
6.0%
8.0%
10.0%
12.0%
14.0%
1 2 3 4 5 6 7 8 9 101112 13141516 171819 2
M e mo ry s c o re
SHARE
0.0%
2.0%
4.0%
6.0%
8.0%
10.0%
12.0%
14.0%
1 2 3 4 5 6 7 8 9 10 111213 14151617 1819 2
M e mo ry s c o re
4.3. The explanatory variables
As mentioned in the Section 1, the two main variables assumed to determine cognitive
performances are age ( 1x ) and years of education ( 2x ). Minimum age is 50 year-old in
SHARE and HRS but 51 for ELSA 2004 as it follows a representative sample of
individuals born on or before 1952. Note also that age is censored at 90 year-old for ELSA
observations. As we don’t have the information about their true age, we drop these
individuals from the ELSA sample. The computation of the years of education variable is
slightly different across surveys. Years of education are constructed for the different
SHARE-participating countries according to the 1997 International Standard Classification
10 Note that we found significant differences in the cognitive score obtained from the different lists of words
randomly assigned to individuals from HRS and ELSA.

2007 04
11
CCRREEPPPP WWoorrkkiinngg PPaappeerrss
of Education (ISCED-97) (OECD, 1999). In ELSA, the variable is constructed on the basis
of the question that asks the respondent when he stopped full-time education. The answer
to this question is categorical and can only take the following categories: 1. Not yet
finished11
; 2. Never went to school; 3. 14 or under; 4. At 15; 5. At 16; 6. At 17; 7. At 18
and 8. 19 or over. The years of education variable is computed assuming that education
starts at 6 year-old, that those having left school at 14 or before have completed 6 years of
education and that those having stopped at 19 or over have 15 years of education. Finally,
HRS uses the following question “What is the highest grade of school or year of college
you completed?” to compute the years of education variable. Note that those having more
than 17 years of education are recorded as having 17 years of education. For the analysis,
we drop individuals reporting no education in the ELSA sample. These individuals account
only for 24 observations in the sample. A more careful analysis of these observations
revealed that these individuals are quite different from the other low-educated individuals.
They have a significantly higher memory score and are wealthier. Moreover, a high
proportion of these individuals are born outside the country. We prefer to drop these
individuals from the analysis as they account for a very small proportion of individuals in
the sample. Note that we performed the same analysis on individuals with no education in
HRS and SHARE but their characteristics better matched to the other low-educated
individuals although they seems to perform slightly better than individuals with very low
education.12
Note also that, as we use the translog specification for the stochastic frontier,
we have to add one unit to the variable years of education to avoid the “problem of the
logarithm of zero” for individuals with no education.
Next to age and years of education, several dummy variables are integrated into the
model as controls ( iD ). First, we include country dummies in SHARE model. They are
expected to catch differences across countries that may be the result of language and
cultural differences. Other controls are dummy variables corresponding to women and to
individuals born outside the country. Ethnicity is also included as control variable in the
HRS sample. We also include a series of dummy variables, corresponding to the
individual’s position in his country’s wealth distribution: second, third and fourth quartiles,
respectively (first quartile as reference group). Differences in cognitive test scores due to
11 Individuals with the answer “not yet finished” are drop from the analysis. 12 Note that individuals with no education are concentrated in France, Spain and Greece in the SHARE
sample.

2007 04
12
CCRREEPPPP WWoorrkkiinngg PPaappeerrss
gender, origin or wealth position cannot be considered to be representative of cognitive
reserve differences but are the consequence of particular life circumstances. We also take
into account several health-related variables that are likely to affect the cognitive ability.
For SHARE, we include dummies that indicate whether the respondent has had a stroke,
whether he has the Parkinson’s disease, whether he takes drugs for anxiety or depression,
whether he has a brain cancer or whether he has ever been institutionalised in a psychiatric
institution. For ELSA, we control for stroke, Parkinson’s disease and dementia. HRS
includes variables related to stroke and to the fact that the individual has or has had
psychiatric problems. A dummy variable indicates that the respondent suffers from at least
two chronic diseases among a list of diseases including high blood pressure, cholesterol,
diabetes, asthma, osteoporosis, arthritis, etc. The list of chronic diseases slightly differs
across surveys. The Appendix describes them in details. Mental health is measured by a
binary variable indicating whether the individual suffers from depression symptoms. For
SHARE, this indicator is built on the basis of the EURO-D scale of depression, which
takes into account depression symptoms such as pessimism, suicidal tendencies, guilt,
sleeping disorders, interest, irritability, and so on (Prince et al., 1999a, 1999b). ELSA and
HRS uses the Center for Epidemiologic Studies Depression Scale (CES-D).13
The binary
variable is equal to 1 if the corresponding depression scale is higher than 3.
Next, we selected several indicators that may potentially explain individual cognitive
efficiency (these indicators correspond to jz variables). These variables encompass several
characteristics related to activities, professional or not, and social interactions. First, work
and retirement status are represented by five dummy variables, where “being employed or
self-employed” is the reference category: “being retired within 5 years”, “being retired
within 5 to 10 years”, “being retired within 10 to 15 years”, “being retired for more than 15
years”, and “having never worked”. These variables are constructed using the question
about the employment status of the respondent and the question that asks to the non-
working individuals when they left their last job, if any. Second, several variables highlight
the involvement of the respondents in other non-professional activities. These
characteristics are represented by a dummy variable indicating whether the individual is
engaged in non-professional activities. The list of the non-professional activities is
different across the three surveys. The Appendix defines the complete list of them for each
13 See Irwin et al (1999) for more information about the CES-D and its validity.

2007 04
13
CCRREEPPPP WWoorrkkiinngg PPaappeerrss
Table 1. Summary statistics.
ELSA HRS SHARE
Memory score 10.0 9.8 8.3
Age 66.1 66.9 64.4
Years of education 9.7 12.5 10.1
Country:
AT - - 6.9%
BE - - 13.5%
DK - - 6.0%
FR - - 10.4%
DE - - 10.9%
GR - - 9.8%
IT - - 9.3%
NL - - 10.3%
ES - - 8.3%
SE - - 11.0%
CH - - 3.5%
Woman 55.2% 59.2% 54.3%
Born out of the country 6.0% 10.0% 7.7%
Born out of the country missing 0.7% - -
Black - 14.0% -
Other - 4.7% -
Chronic disease 44.4% 56.5% 40.2%
Health:
Depression symptoms 15.2% 19.6% 24.1%
Depression symptoms missing 0.8% - -
Stroke 4.7% 6.5% 3.4%
Parkinson 0.6% - 0.5%
Drugs for anxiety or depression - - 5.4%
Brain cancer - - 0.1%
Has been in psychiatric institution - - 2.3%
Psychiatric problem - 15.5% -
Dementia 0.5% - -
Nonprofessional activity 74.3% 34.6% 51.6%
Nonprofessional activity missing 15.7% - -
Mobility limitation 58.6% 68.6% 47.8%
Physical activity:
Vigorous activity 38.6% 38.7% 59.4%
Moderate activity 83.0% 79.1% 89.6%
Single household 25.5% 23.9% 20.8%
Isolate - 25.7% -
Isolate missing - 1.0% -
Work and retirement:
Working 35.1% 38.4% 32.7%
Retired within 5 years 12.5% 15.1% 9.7%
Retired within 5 and 10 years 13.0% 13.4% 12.1%
Retired within 10 and 15 years 12.8% 9.5% 11.0%
Retired since more than 15 years 22.9% 17.0% 22.1%
Never worked 1.5% 3.5% 8.7%
Retirement duration missing 2.2% 3.2% 3.7%
Number of observations 8,431 17,097 25,916

2007 04
14
CCRREEPPPP WWoorrkkiinngg PPaappeerrss
of them. Moreover, we include dummies related to the practice of vigourous physical
activities and the practice of physical activities that require a low or moderate level of
energy such as gardening, cleaning the car, or going for a walk. Finally, a dummy variable
indicates whether the individual suffers from at least one mobility limitation in doing
everyday activities such as walking 100 meters, sitting for about two hours, climbing
several flights of stairs without resting, etc. The Appendix describes the complete list of
mobility limitations. Third, we include a binary variable for single-person households. For
the HRS, we also include a dummy (isolate) equal to one if the respondent reports that he
almost never gets together with people in or near the facility\any of his neighbours just to
chat or for a social visit. These indicators are expected to capture the effect of social
isolation on cognitive reserve.
For explanatory variables having a non-negligible proportion of missing value, we
computed an additional modality that control for it in the model, softening the potential
selectivity bias that may arise in such cases. This additional category has been created for
the following variables: born out of the country, depression symptoms, non-professional
activity, social isolation, work and retirement.
Table 1 presents the means of the variables used in the model for each survey. The
final ELSA sample contains 8,431 observations; the HRS sample includes 17,097
individuals and the SHARE sample size is 25,916.
5. Results
Table 2 presents the results of the stochastic frontier estimations corresponding to the three
surveys: ELSA, HRS and SHARE. Results are strongly consistent across surveys. Almost
all parameter estimates have the same sign across samples. As expected, the parameters
related to education and age are significant, with the only exceptions being the age and
education cross-effect in the model using ELSA. The parameters of this cross-effect are
positive and significant for HRS and SHARE indicating that the relative decline in
cognitive performances due to ageing is faster for individuals with a lower level of
education. For example, it can be calculated from these results that the cognitive
performances are expected to decrease by 5.8% from 60 to 70 year-old for an individual
with the highest level of education in the HRS while this decline reaches 9.8% for those

2007 04
15
CCRREEPPPP WWoorrkkiinngg PPaappeerrss
having the lowest level of education. Figure 3 illustrates the stochastic frontiers according
to age and education for the three surveys. The shape of the frontiers according to age and
education highlights the strong relationship between cognitive reserve, age and education.
As expected, the cognitive frontiers decrease with respect to age at an increasing rate for
the three models. Moreover, the higher the education level, the higher the cognitive
frontier. Finally, the translog specification allows computing the marginal rate of
substitution between age and years of education. One additional year of education for an
individual being 60 year-old and having 10 years of education prevents the cognitive
ageing by 3.0, 3.3 and 5.3 years for SHARE, ELSA and HRS respectively.
In most cases, the parameters on control variables are significant indicating that, as
expected, they are important. Some results are worth noting: for example, results for the
three surveys indicate that women perform better in terms of cognitive score than men.
Moreover, wealthier individuals have a significantly higher score. For the SHARE data, it
is worth noting that Spain and Italy are countries where the cognitive score is the lowest
while Sweden and Switzerland obtain the highest one. To summarise, these estimated
frontiers can be considered as a good benchmark with respect to which individual
cognitive efficiency can be assessed.
Therefore, most of our attention will focus on the parameters presented at Table 3.
They correspond to the jz variables considered as potential factors related to activities and
social isolation affecting individuals’ cognitive efficiency or, in other words, distances to
the estimated frontier. Note that negative amounts indicate less distance to the frontier or
better cognitive functions, while positive signs indicate worse cognitive performances.
All the j parameters are statistically significant and their signs correspond to our
expectations. Clearly, all types of occupational activities, professional or otherwise, have a
positive effect on the constitution of a cognitive reserve. In addition, vigourous or
moderate physical activity appears to favor cognitive performances according to the three
surveys while social isolation has a negative effect.
Results of the stochastic frontier clearly indicate that retirement decreases significantly
cognitive reserve. The longer the individual is retired, the lower the efficiency. These
results hold for the three surveys used in this paper. It is worth noting that respondents
having never worked have the lowest cognitive efficiency.
The parameter estimates allow us to calculate the individual cognitive efficiency ratio

2007 04
16
CCRREEPPPP WWoorrkkiinngg PPaappeerrss
Table 2. The stochastic frontier parameters.
ELSA HRS SHARE
Coef (t-ratio) Coef (t-ratio) Coef (t-ratio)
Intercept 0 -5.419 (-1.9) -23.616* (-15.6) -10.742* (-6.7)
ln(age) 1 4.675* (3.6) 13.082* (18.8) 7.147* (9.5)
ln(years of education) 2 -0.945* (-2.0) -0.567* (-3.3) -0.782* (-7.5)
ln²(age) 3 -0.649* (-4.4) -1.648* (-20.2) -0.970* (-10.8)
ln²(years of education) 4 0.129* (3.5) 0.095* (13.7) 0.065* (17.8)
ln(years of education)*ln(age) 5 0.129 (1.4) 0.097* (2.4) 0.171* (7.2)
Country:
AT - - Ref
BE 1 - - -0.046* (-4.8)
DK 2 - - 0.018 (1.6)
FR 3 - - -0.053* (-5.1)
DE 4 - - -0.015 (-1.5)
GR 5 - - -0.034* (-3.2)
IT 6 - - -0.122* (-11.3)
NL 7 - - 0.017 (1.7)
ES 8 - - -0.171* (-15.2)
SE 9 - - 0.046* (4.7)
CH 10 - - 0.029* (2.2)
Woman 11 0.081* (14.0) 0.116* (26.6) 0.099* (23.3)
Born out of the country 12 -0.080* (-6.4) -0.025* (-3.3) -0.050* (-6.6)
Born out of the country missing 13 -0.094* (-2.8) - -
Black 14 - -0.102* (-16.1) -
Other 15 - -0.060* (-5.8) -
Chronic disease 16 0.000 (0.0) -0.004 (-0.9) 0.006 (1.4)
Wealth quartile:
1st wealth quartile Ref Ref Ref
2nd wealth quartile 17 0.034* (4.1) 0.025* (4.1) 0.021* (3.7)
3rd wealth quartile 18 0.046* (5.4) 0.042* (6.5) 0.037* (6.3)
4th wealth quartile 19 0.065* (7.4) 0.059* (8.8) 0.037* (6.2)
Health:
Depression symptoms 20 -0.019* (-2.1) -0.020* (-3.3) -0.046* (-8.9)
Depression symptoms missing 21 -0.016 (-0.5) - -
Stroke 22 -0.025 (-1.7) -0.041* (-4.5) -0.039* (-3.4)
Parkinson 23 -0.073 (-1.8) - -0.042 (-1.5)
Drugs for anxiety or depression 24 - - -0.016 (-1.7)
Brain cancer 25 - - -0.038 (-0.5)
Has been in psychiatric institution 26 - - -0.016 (-1.2)
Psychiatric problem 27 - -0.016* (-2.5) -
Dementia 23 -0.104* (-2.4) - -
Sigma 4.249* (5.9) 2.468* (11.1) 2.412* (8.4)
Gamma 0.995* (1,145.7) 0.988* (933.2) 0.985* (572.1)
Note:* means that parameter estimates are significant at the 5-percent level.

2007 04
17
CCRREEPPPP WWoorrkkiinngg PPaappeerrss
Figure 3: The stochastic frontiers according to age and years of education.
5060
708015 10 5
02468
101214161820
mem
ory
sco
re
Age
Education
ELSA
5060
7080
9017 12 7 2
02468
101214161820
mem
ory
sco
re
AgeEducation
HRS
5060
7080
9022 17 12 7 2
0
2
4
6
8
10
12
14
16
18
20
mem
ory
sco
re
AgeEducation
SHARE
Table 3. The effects of activities on cognitive efficiency.
ELSA HRS SHARE
Coef (t-ratio) Coef (t-ratio) Coef (t-ratio)
Intercept 0 -11.56* (-5.2) -8.91* (-10.0) -4.97* (-6.9)
Nonprofessional activity 1 -2.053* (-5.3) -2.122* (-11.5) -1.193* (-8.5)
Nonprofessional activity missing 2 1.731* (5.4) - -
Mobility limitation 3 0.166* (3.3) 0.058* (2.8) 0.354* (8.5)
Physical activity:
Vigorous activity 4 -1.246* (-4.2) -0.979* (-9.8) -0.918* (-7.8)
Moderate activity 5 -2.037* (-6.8) -0.830* (-11.2) -0.903* (-8.6)
Single household 6 0.404* (9.1) 0.377* (12.9) 0.579* (8.6)
Isolate 7 - 0.401* (10.5) -
Isolate missing 8 - 0.104 (0.9) -
Work and retirement:
Working Ref Ref Ref
Retired within 5 years 9 2.552* (5.2) 2.709* (10.8) 0.735* (6.8)
Retired within 5 and 10 years 10 3.139* (5.0) 3.606* (11.1) 1.281* (8.0)
Retired within 10 and 15 years 11 3.758* (4.9) 4.449* (11.6) 1.503* (8.4)
Retired since more than 15 years 12 5.781* (5.6) 4.759* (12.0) 2.191* (9.6)
Never worked 13 6.917* (6.0) 5.066* (11.7) 2.474* (9.7)
Retirement duration missing 14 5.247* (5.4) 4.499* (11.3) 2.956* (9.6)
Note:* means that parameter estimates are significant at the 5-percent level.

2007 04
18
CCRREEPPPP WWoorrkkiinngg PPaappeerrss
Figure 4: Average efficiency ratio by age category across surveys.
0%
10%
20%
30%
40%
50%
60%
70%
80%
90%
100%
50-54 55-59 60-64 65-69 70-74 75-79 80-84 85-89
Age class
Eff
icie
ncy
ra
tio
ELSA
HRS
SHARE
using equation (5) for the three surveys. The average individual efficiency ratio is equal to
73.9% for ELSA, 76.5% for HRS, and 71% for SHARE. As shown in Figure 4, the average
efficiency ratio decreases with age for the three surveys, this decline being stronger among
ELSA respondents. The average efficiency ratio for 50-54 year old individuals is equal to
80%, 81%, and 76% for ELSA, HRS and SHARE respectively while it is equal to 57%,
67%, and 57% for 85-89 year old respondents. These results suggest that observed
cognitive performances declines with age for two reasons: one is the normal cognitive
ageing process represented by the frontier while the other is due to decreasing cognitive
efficiency with age. Among others, retirement, non-professional activities, and social
isolation partly explain this efficiency loss.
In order to quantify the effect of the zi variables on cognitive capacity, we present in
Table 4 the results of a simulation performed on the base of the 60-year-old individuals
interviewed in ELSA, HRS and SHARE respectively. The outcome of this simulation is
estimated in terms of cognitive aging, in other words, in years of cognitive decline. These
estimates were calculated in two steps using the parameters presented in Tables 2 and 3.
Figure 5 illustrates the computation of the cognitive ageing relative to the zi variables
assuming that its effect on cognitive efficiency is negative. Point A represents the cognitive
performance of a 60 year-old individual assuming that the zi variable is equal to 0 (the
single household dummy for example) and point A’ is the cognitive performance of the
same individual assuming the zi variable is equal to 1. For each individual, we calculated
his/her cognitive performance change, corresponding to a change in a specific z
characteristic, all other characteristics being equal. It is represented by the difference

2007 04
19
CCRREEPPPP WWoorrkkiinngg PPaappeerrss
Figure 5. The computation of the cognitive ageing due to the effect of the z-variables
between A and A’ in Figure 5. The cognitive ageing due to the change of the z-variable is
defined as the number of years of “normal” ageing corresponding to the cognitive decline
due to the z-variable. For example, a 60-years-old individual retired for less than five years
has the same cognitive performance as a 61.01 year-old working individual according to
SHARE, 61.46 year-old according to ELSA and 63.90 year-old according to HRS.
Similarly, an individual performing a non-professional activity delays his/her cognitive
ageing by 1.6 years for SHARE, 1.18 for ELSA, and 3.18 for HRS. These results suggest
that taking part in non-professional activities at retirement might compensate the cognitive
loss due to retirement.
Note that the heterogeneity of these results across surveys depends on both the effect of
retirement on “cognitive efficiency” and the shape of the cognitive frontier with respect to
age around the age of 60. These results are thus not directly comparable across surveys.
For example, the higher effect of retirement in term of cognitive ageing for HRS is
explained by two factors: First, the estimated cognitive decline due to “normal” ageing is
slower for HRS respondents compared to ELSA and SHARE individuals around the age of
60. The cognitive frontier for the average individual only decreases by 2.3% from 60 to 65
year-old while it declines by 3.0% for ELSA and by 3.6% in SHARE. As a result, even if
the effect of retirement on cognitive performances was the same across surveys, it would
give different results in term of cognitive ageing. Second, it can be calculated that the
A
A’
Age
Cognitive
test
Cognitive ageing
0
Frontier f (X i,D i)
f (X i, D i)-E(ui|z i = 1)
60
f (X i, D i)-E(ui|zi =0)

2007 04
20
CCRREEPPPP WWoorrkkiinngg PPaappeerrss
efficiency loss due to retirement is higher among HRS respondents. For a representative 60
year-old individual, the relative efficiency loss due to retirement is estimated at 1.5% for
HRS, 0.7% for ELSA and 0.6% for SHARE.
Table 4. The effect of activities in terms of cognitive ageing.
Cognitive ageing (in years)
ELSA HRS SHARE
Activities:
Non-professional activity -1.18 -3.18 -1.60
Moderate physical activity -1.17 -1.54 -1.23
Vigorous physical activity: -0.72 -1.75 -1.25
Mobility limitations 0.10 0.14 0.49
Work and retirement:
Working - - -
Retired within 5 years 1.46 3.90 1.01
Retired within 5 and 10 years 1.78 4.84 1.72
Retired within 10 and 15 years 2.13 5.67 2.01
Retired since more than 15 years 3.22 5.96 2.86
Never worked 3.83 6.25 3.21
Social isolation:
Single household 0.24 0.78 0.80
Isolate - 0.82 -
Note however that these results hold only if the identifying assumptions are valid, which
include no correlation between the explanatory variables and the unobserved
heterogeneity. It might not be the case if retirement and cognitive ability are endogenous:
cognitive ability may affect the retirement decision. If it is true, the estimated effect of
retirement on cognitive performances is likely to be overestimated. In addition, unobserved
individual heterogeneity may be correlated to both retirement and cognitive performances:
unskilled workers are likely to retire at an early age and obtain a lower cognitive score. In
this case, the model would overestimate the effect of retirement on cognitive ability.
6. Conclusion
In this paper, we propose the use of a parametric stochastic frontier approach (Aigner et al.,
1977; Meeusen & Van den Broeck, 1977) to study the impact of potential factors,
including retirement and retirement duration, on cognitive functions among the population
aged 50 and over in Europe and United States. More specifically, we focus on one key

2007 04
21
CCRREEPPPP WWoorrkkiinngg PPaappeerrss
aspect of cognitive ability: episodic memory assessed by a test of words learning and
recall. This cognitive function is particularly relevant for this study as episodic memory is
among the first to decline with ageing. For this purpose, we used individual data collected
in 2004 during the second wave of ELSA for United Kingdom, the seventh wave of HRS
for United States and the first wave of SHARE (Börsch-Supan et al., 2005) for continental
European countries. The multidisciplinary nature of these surveys allows us to
simultaneously analyze several dimensions of participants’ lives: physical and mental
health, mobility, occupational activities, and socioeconomic status, in addition to cognitive
performances.
As expected, our results show that cognitive performances is mainly driven by age
(negatively, which refers to cognitive aging; for a review, see Buckner, 2004) and by years
of education (positively). This second result is clearly in accordance with studies
suggesting that education is one of the major factors contributing to the development of the
cognitive reserve (Le Carret et al., 2003, 2005; Liao et al., 2005). In addition, except for
the ELSA sample, the relative cognitive decline due to “normal” ageing seems to be faster
for individuals with low education. Taking into account these effects of age and education,
we use the SFA (Kumbhakar & Knox Lovell, 2002) to create a “frontier” corresponding to
the optimum cognitive functioning that each individual is expected to achieve given his/her
age and education level. This model then allows us to test simultaneously the effect of
different factors (associated directly or indirectly with the notion of “general activity”) that
potentially drive cognitive efficiency and therefore contribute to the formation of
individuals’ cognitive reserve. Our results show that, after controlling the side effects of
some factors not associated with the notion of “activity” (such as gender, being born inside
or outside the country, and suffering from a chronic disease), all types of occupational
activities clearly have a positive effect on cognitive reserve constitution. More specifically,
individuals being retired for a longer period have a lower cognitive efficiency. In addition,
non-professional activity preserves individuals from the cognitive ageing.
The policy implication of such results is straightforward: increasing the age of
retirement is not only desirable to insure the viability of the retirement schemes but it could
also delay the cognitive decline preventing the occurrence of the associated impairments at
older age.

2007 04
22
CCRREEPPPP WWoorrkkiinngg PPaappeerrss
Acknowledgments
This paper uses data from release 2.0.1 of SHARE 2004. The SHARE data collection has
been primarily funded by the European Commission through the 5th framework
programme (project QLK6-CT-2001- 00360 in the thematic programme Quality of Life).
Additional funding came from the US National Institute on Ageing (U01 AG09740-13S2,
P01 AG005842, P01 AG08291, P30 AG12815, Y1-AG-4553-01 and OGHA 04-064). Data
collection for wave 1 was nationally funded in Austria (through the Austrian Science
Foundation, FWF), Belgium (through the Belgian Science Policy Office), France (through
CNAM, CNAV, COR, Drees, Dares, Caisse des Dépôts et Consignations et le
Commissariat Général du Plan) and Switzerland (through BBW/OFES/UFES. The SHARE
data collection in Israel was funded by the US National Institute on Aging (R21
AG025169), by the German-Israeli Foundation for Scientific Research and Development
(G.I.F.), and by the National Insurance Institute of Israel. Further support by the European
Commission through the 6th framework program (projects SHARE-I3, RII-CT- 2006-
062193, and COMPARE, CIT5-CT-2005-028857) is gratefully acknowledged.
This paper enters in the frame of ARC (Actions de Recherches Concertées) between the
CREPP (Centre de Recherche en Economie Publique et de la Population) and the Faculty
of Psychology of the University of Liège.

2007 04
23
CCRREEPPPP WWoorrkkiinngg PPaappeerrss
Appendix
This appendix describes in more details some variables that differ across the three surveys.
Chronic diseases:
The dummy variable is equal to one when the individual report having at least two of the
following conditions.
SHARE:
- A heart attack including myocardial infarction or coronary thrombosis or any other heart
problem including congestive heart failure
- High blood pressure or hypertension
- High blood cholesterol
- Diabetes or high blood sugar
- Chronic lung disease such as chronic bronchitis or emphysema
- Asthma
- Arthritis, including osteoarthritis, or rheumatism
- Osteoporosis
-Cancer or malignant tumour, including leukaemia or lympho ma, but excluding minor
skin cancers
-Stomach or duodenal ulcer, peptic ulcer
-Cataracts
-Hip fracture or femoral fracture
ELSA:
- High blood pressure or hypertension
- Heart problem (angina, heart attack (including myocardial infarction or coronary
Thrombosis), congestive heart failure, a heart murmur, an abnormal heart rhythm)
- Diabetes or high blood sugar
- Chronic lung disease such as chronic bronchitis or emphysema
- Asthma
- Arthritis
- Osteoporosis
- Cancer
- Cataract
- Hip fracture
HRS:
- High blood pressure
- Diabetes
- Cancer, excluding skin
- Lung disease
- Heart condition
- Arthritis

2007 04
24
CCRREEPPPP WWoorrkkiinngg PPaappeerrss
Non-professional activity:
SHARE:
This variable is equal to 1 if the individual reports having done at least one of the following
activities during last month:
- Done voluntary or charity work.
- Cared for a sick or disabled adult.
- Provided help to family. friends or neighbors.
- Attended an educational or training course.
- Gone to a sport. social or other kind of club.
- Taken part in a religious organization (church. synagogue. mosque. etc.).
- Taken part in a political or community-related organization.
ELSA:
This variable is equal to 1 if the individual reports having done at least one of the following
activities during last month:
- Voluntary work
- Cared for a sick or disabled adult
- Looked after home or family
- Attended a formal educational or training course
- Political party, trade union or environmental groups
- Tenants groups, resident groups, Neighbourhood watch
- Church or other religious groups
- Charitable associations
- Education, arts or music groups or evening classes
- Social Clubs
- Sports clubs, gyms, exercise classes
- Any other organisations, clubs or societies
HRS:
This variable is based on the following question:
Have you spent any time in the past 12 months doing volunteer work for religious,
educational, health-related or other charitable organizations?
2007 04
25
CCRREEPPPP WWoorrkkiinngg PPaappeerrss
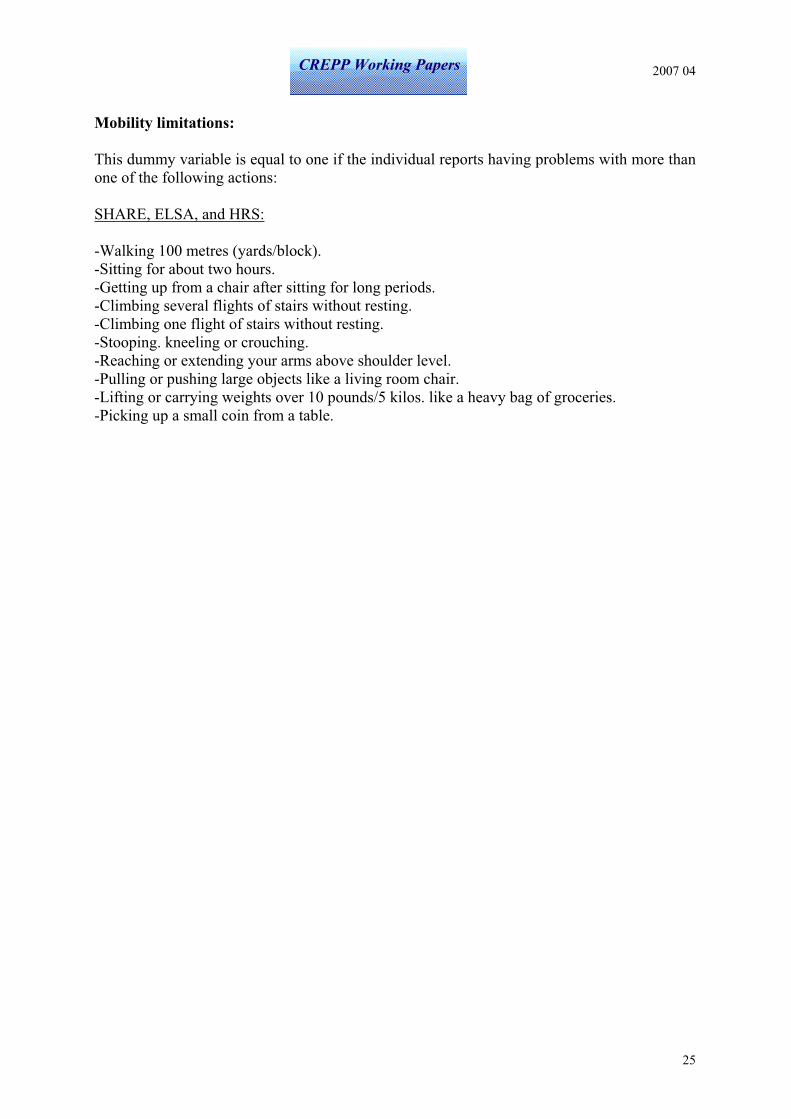
Mobility limitations:
This dummy variable is equal to one if the individual reports having problems with more than
one of the following actions:
SHARE, ELSA, and HRS:
-Walking 100 metres (yards/block).
-Sitting for about two hours.
-Getting up from a chair after sitting for long periods.
-Climbing several flights of stairs without resting.
-Climbing one flight of stairs without resting.
-Stooping. kneeling or crouching.
-Reaching or extending your arms above shoulder level.
-Pulling or pushing large objects like a living room chair.
-Lifting or carrying weights over 10 pounds/5 kilos. like a heavy bag of groceries.
-Picking up a small coin from a table.


![[Part 3] 1/49 Stochastic FrontierModels Stochastic Frontier Model Stochastic Frontier Models William Greene Stern School of Business New York University](https://img.pdfslide.us/doc/110x75/56649d0c5503460f949e0e8b/part-3-149-stochastic-frontiermodels-stochastic-frontier-model-stochastic.jpg)