Embed Size (px)
Citation preview
Graduate Theses and Dissertations Iowa State University Capstones, Theses andDissertations
2009
Retinoid- and diabetes-induced aberrations ofmethyl group and homocysteine metabolismincluding alterations of epigenetic regulationKelly T. WilliamsIowa State University
Follow this and additional works at: https://lib.dr.iastate.edu/etd
Part of the Nutrition Commons
This Dissertation is brought to you for free and open access by the Iowa State University Capstones, Theses and Dissertations at Iowa State UniversityDigital Repository. It has been accepted for inclusion in Graduate Theses and Dissertations by an authorized administrator of Iowa State UniversityDigital Repository. For more information, please contact [email protected].
Recommended CitationWilliams, Kelly T., "Retinoid- and diabetes-induced aberrations of methyl group and homocysteine metabolism including alterationsof epigenetic regulation" (2009). Graduate Theses and Dissertations. 11094.https://lib.dr.iastate.edu/etd/11094

Retinoid- and diabetes-induced aberrations of methy l group and
homocysteine metabolism including alterations of ep igenetic regulation
by
Kelly T. Williams
A dissertation submitted to the graduate faculty
in partial fulfillment of the requirements for the degree of
DOCTOR OF PHILOSOPHY
Major: Nutritional Sciences
Program of Study Committee:
Kevin L. Schalinske, Major Professor
Diane Birt
Ruth MacDonald
Michael Spurlock
Steven Whitham
Iowa State University
Ames, Iowa
2009
Copyright © Kelly T. Williams, 2009. All rights reserved.
ii
TABLE OF CONTENTS
CHAPTER 1: Introduction 1
Research problem 1
Significance 1
Dissertation organization 2
CHAPTER 2: Literature review 3
Methyl group and homocysteine metabolism 3
Epigenetic regulation of gene expression 16
Altered methyl group and homocysteine metabolism including epigenetic
regulation 19
Literature Cited 26
CHAPTER 3: Long-term, thrice-weekly supplementation with retinoic acid
alters methyl group metabolism, but does not induce changes in DNA
methylation status in rat liver 41
Abstract 41
Introduction 42
Materials and Methods 44
Results 47
Discussion 53
Literature Cited 57
iii
CHAPTER 4: Type I diabetes leads to tissue-specific DNA
hypomethylation in male rats 61
Abstract 61
Introduction 62
Materials and Methods 63
Results 67
Discussion 72
Literature Cited 77
CHAPTER 5: Tissue-specific alterations of methyl g roup metabolism and
DNA hypermethylation in the Zucker (type 2) diabeti c fatty (ZDF) rat 81
Abstract 81
Introduction 82
Materials and Methods 84
Results 88
Discussion 96
Literature Cited 101
CHAPTER 6: Summary and conclusions 105
General discussion of study results 105
Methyl group and homocysteine metabolism in diabetes 106
Epigenetic regulation in the diabetic state 108
iv
Possible factors regulating metabolic and epigenetic aberrations in diabetes 110
Future research 112
Overall conclusions 116
Literature Cited 117
APPENDIX A: Chapter 4 Supplemental data 123
APPENDIX B: Chapter 5 Supplemental data 125
v
LIST OF TABLES AND FIGURES
CHAPTER 1: Introduction 1
CHAPTER 2: Literature review 3
Figure 1. Methyl group and homocysteine metabolism 4
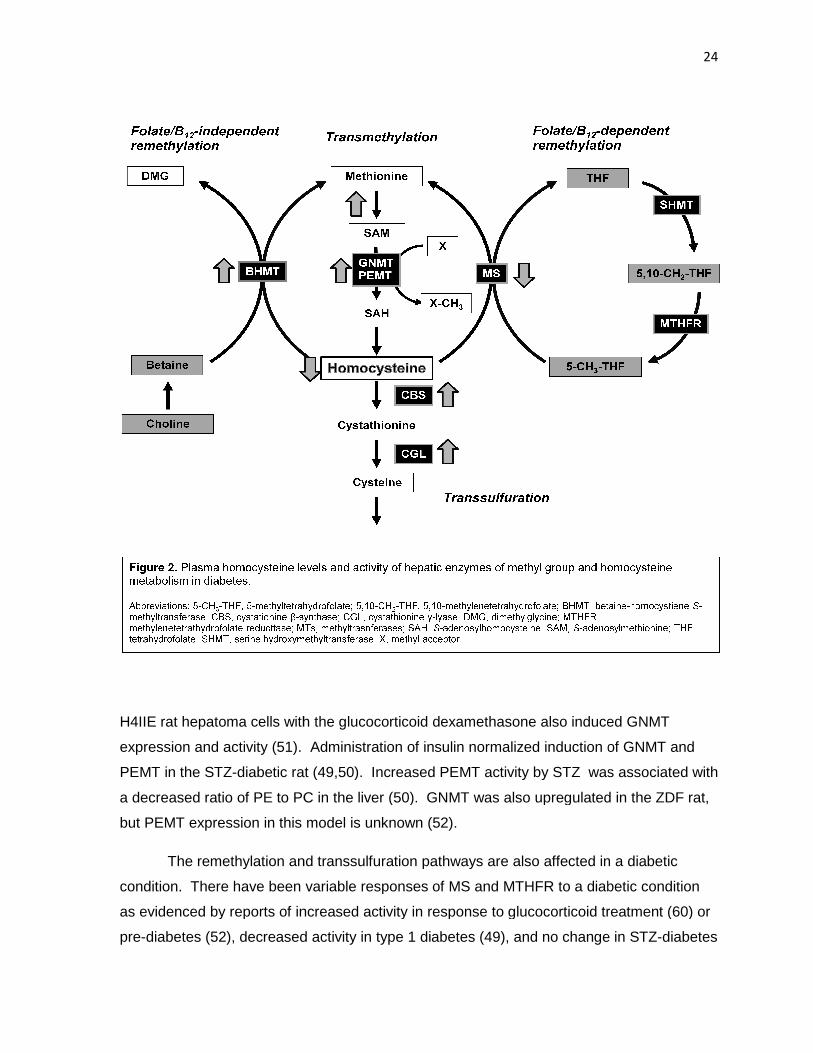
Figure 2. Plasma homocysteine levels and activity of hepatic enzymes of
methyl group metabolism in diabetes 24
CHAPTER 3: Long-term, thrice-weekly supplementatio n with retinoic acid
alters methyl group metabolism, but does not induce changes in DNA
methylation status 41
Figure 1. Regulation of folate, methyl group, and homocysteine metabolism 43
Figure 2. RA treatment of rats at 5 or 30 µmol/kg body weight
increases GNMT activity and/or abundance in a dose-dependent manner. 48
Table 1. Global and CpG island DNA methylation status were unaffected by
long-term intermittent RA treatment. 49
Table 2. Body weight, weight gain, and relative liver weight were unaffected
by RA treatment 50
Table 3. Plasma homocysteine concentrations, as well as ALT and AST
activity levels were unchanged, whereas glutathione concentrations were
decreased by 24 wk of intermittent RA treatment. 52
Figure 3. Hematocrit levels are decreased by RA treatment. 53
vi
CHAPTER 4: Type I diabetes leads to tissue-specific DNA
hypomethylation in male rats 61
Table 1. Circulating concentrations of glucose and homocysteine in control
and diabetic rats. 67
Table 2. Hepatic and renal remethylation enzyme activity levels in control
and diabetic rats at 8 wk after induction of diabetes. 68
Figure 1. Hepatic and renal cystathionine β-synthase (CBS) abundance in
control and diabetic rats at 8 wk after induction of diabetes. 69
Figure 2. Hepatic GNMT activity and abundance in the liver (A) and kidney (B)
of control and diabetic rats at 2, 4, and 8 wk after induction of diabetes. 71
Table 3. SAM and SAH concentrations and DNMT1 abundance in the liver of
type 1 diabetic male rats at 8 wk. 72
Figure 3. Genomic DNA methylation in the liver of control and diabetic rats at
2, 4, and 8 wk after induction of diabetes. 73
CHAPTER 5: Tissue-specific alterations of methyl g roup metabolism
and DNA hypermethylation in the Zucker (type 2) dia betic fatty (ZDF) rat 81
Figure 1. Methyl group and homocysteine metabolism 83
Table 1. Real-time RT-PCR primers 87
Table 2. Characteristics of ZDF (fa/fa) and lean (+/?) rats at 12 and 21 wks 89
Figure 2. Increased hepatic and renal activity of GNMT in ZDF rat 90
Figure 3. Tissue-specific alterations of GNMT and CBS protein abundance. 91
Table 3. Hepatic mRNA abundance of enzymes of methyl group and
homocysteine metabolism in lean and ZDF rats at 12 and 21 wk of age. 92
vii
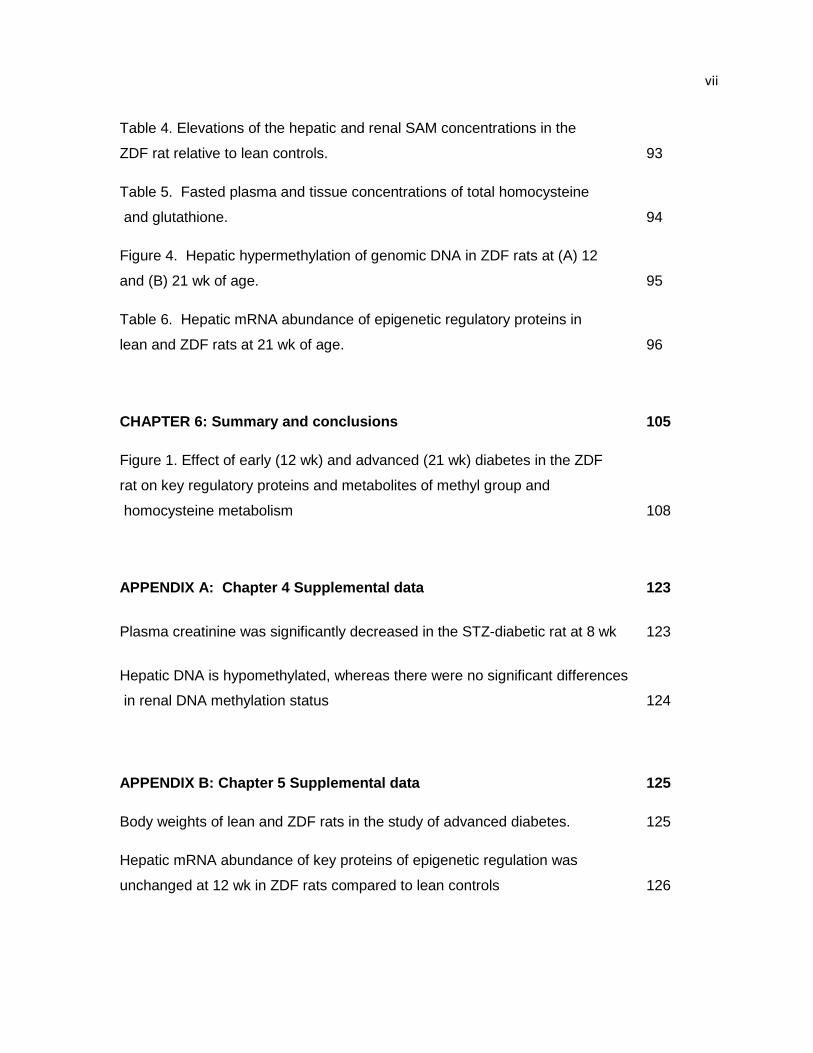
Table 4. Elevations of the hepatic and renal SAM concentrations in the
ZDF rat relative to lean controls. 93
Table 5. Fasted plasma and tissue concentrations of total homocysteine
and glutathione. 94
Figure 4. Hepatic hypermethylation of genomic DNA in ZDF rats at (A) 12
and (B) 21 wk of age. 95
Table 6. Hepatic mRNA abundance of epigenetic regulatory proteins in
lean and ZDF rats at 21 wk of age. 96
CHAPTER 6: Summary and conclusions 105
Figure 1. Effect of early (12 wk) and advanced (21 wk) diabetes in the ZDF
rat on key regulatory proteins and metabolites of methyl group and
homocysteine metabolism 108
APPENDIX A: Chapter 4 Supplemental data 123
Plasma creatinine was significantly decreased in the STZ-diabetic rat at 8 wk 123
Hepatic DNA is hypomethylated, whereas there were no significant differences
in renal DNA methylation status 124
APPENDIX B: Chapter 5 Supplemental data 125
Body weights of lean and ZDF rats in the study of advanced diabetes. 125
Hepatic mRNA abundance of key proteins of epigenetic regulation was
unchanged at 12 wk in ZDF rats compared to lean controls 126
viii
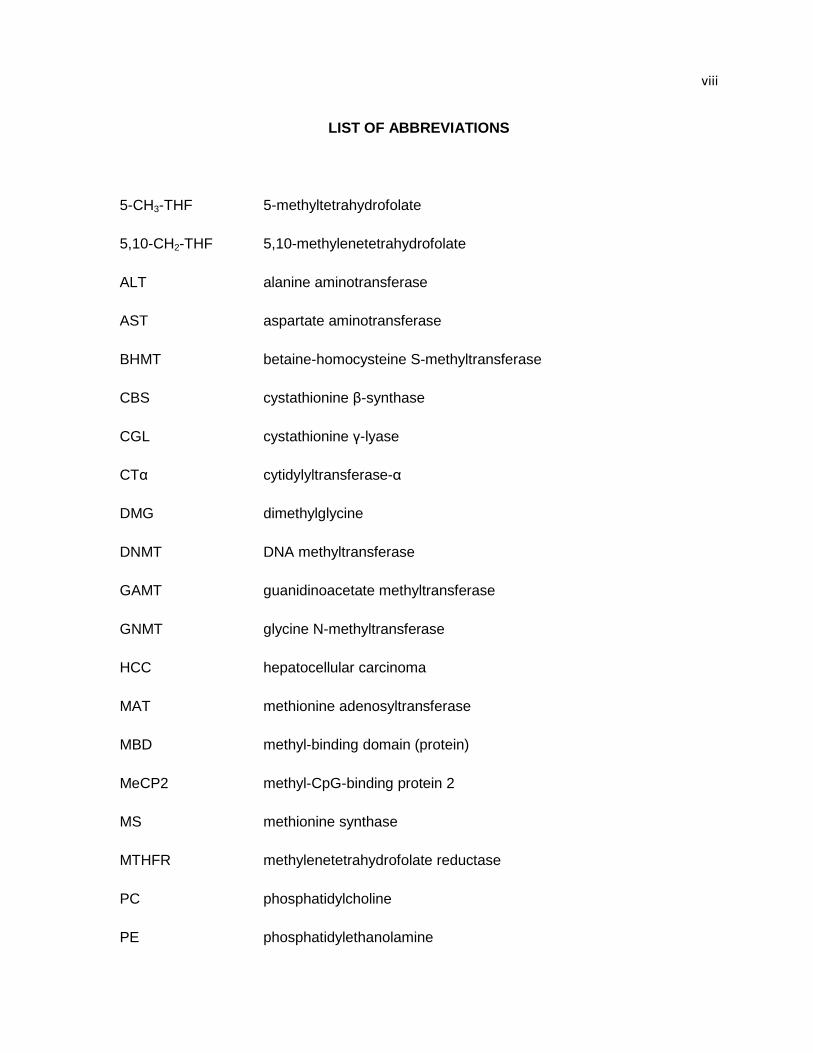
LIST OF ABBREVIATIONS
5-CH3-THF 5-methyltetrahydrofolate
5,10-CH2-THF 5,10-methylenetetrahydrofolate
ALT alanine aminotransferase
AST aspartate aminotransferase
BHMT betaine-homocysteine S-methyltransferase
CBS cystathionine β-synthase
CGL cystathionine γ-lyase
CTα cytidylyltransferase-α
DMG dimethylglycine
DNMT DNA methyltransferase
GAMT guanidinoacetate methyltransferase
GNMT glycine N-methyltransferase
HCC hepatocellular carcinoma
MAT methionine adenosyltransferase
MBD methyl-binding domain (protein)
MeCP2 methyl-CpG-binding protein 2
MS methionine synthase
MTHFR methylenetetrahydrofolate reductase
PC phosphatidylcholine
PE phosphatidylethanolamine
ix
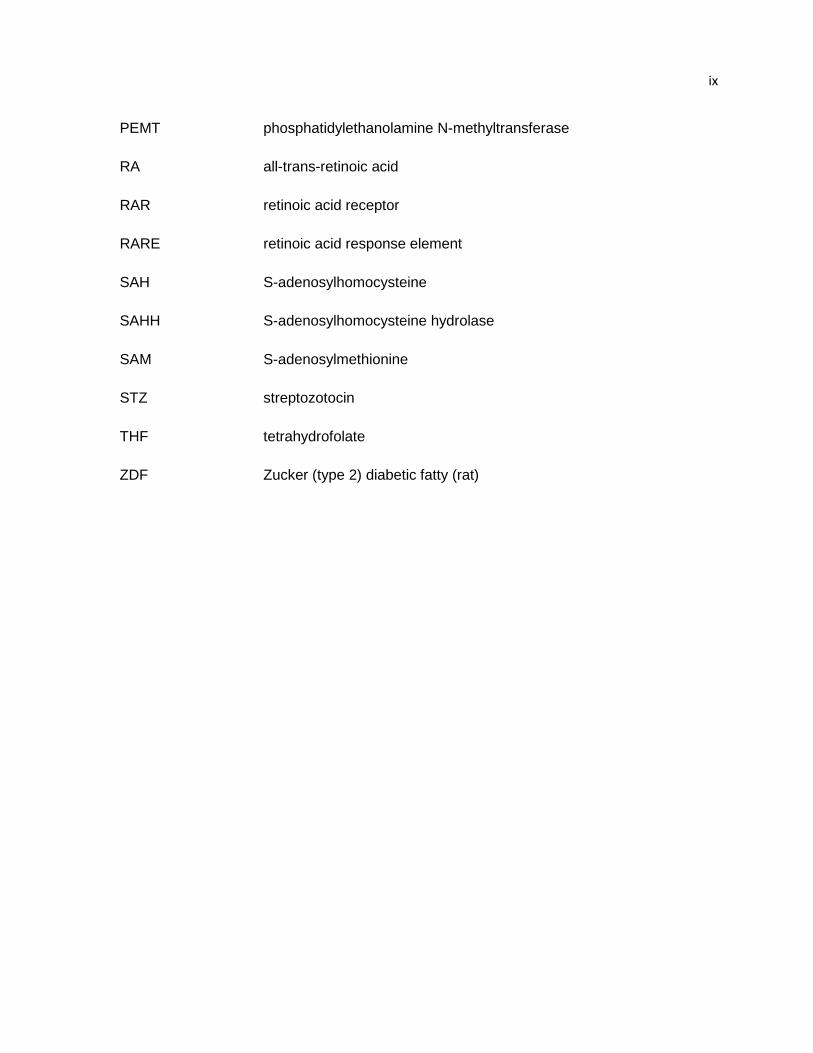
PEMT phosphatidylethanolamine N-methyltransferase
RA all-trans-retinoic acid
RAR retinoic acid receptor
RARE retinoic acid response element
SAH S-adenosylhomocysteine
SAHH S-adenosylhomocysteine hydrolase
SAM S-adenosylmethionine
STZ streptozotocin
THF tetrahydrofolate
ZDF Zucker (type 2) diabetic fatty (rat)
1
CHAPTER 1: Introduction
Research problem
It is our goal to further the understanding of methyl group and homocysteine metabolism
as it relates to health and disease. This necessitates investigation into the factors that alter
methyl group metabolism and identification of potential adverse effects of these metabolic
aberrations. Previous research within our lab group and by others has demonstrated that
both administration of retinoids or a diabetic condition acutely perturbs hepatic methyl group
and homocysteine metabolism. Specifically, both conditions upregulate glycine N-
methyltransferase (GNMT), an enzyme proposed to be a key regulator of methyl group
supply and utilization. It was our hypothesis that sustained induction of GNMT, by
either retinoids or a diabetic condition, would lead to a functional methyl deficiency,
whereby methyl groups would be unavailable for other methyltransferase reactions,
such as DNA methylation. The methylation of DNA is an important component of
epigenetic regulation of the genome. Epigenetic events, such as altered DNA methylation
status, cause heritable changes in gene expression without changing the DNA sequence.
Epigenetic marks are also associated with the maintenance of genome stability. We
expected that changes in epigenetic regulation, i.e. DNA methylation would be associated
with adverse effects, such as hepatotoxicity. Aberrant epigenetic regulation also represents
a possible mechanistic link to the development of the secondary complications of diabetes,
which will be addressed in future studies. The aim of the studies presented here was to
characterize methyl group and homocysteine metabolism by assessing key regulatory
enzymes and metabolites, as well as epigenetic regulation by DNA methylation, in rats
treated with all-trans-retinoic acid (RA) for up to six months, as well as in the streptozotocin
(STZ)-induced (type 1) diabetic and Zucker (type 2) diabetic fatty (ZDF) rats.
Significance
The results of these studies offer insight into the safety of RA treatments and the
pathogenesis of type 1 and type 2 diabetes. This knowledge could impact the course of
treatment for many patients. Retinoids are widely used for treatment of dermatological
2
conditions and in cancer chemotherapy, but these treatments have many side effects and
safety of the retinoid compounds is still a matter of debate. Diabetes has been established
as a serious public health concern with estimates that 12% of the U.S. population has the
disease and the prevalence of diabetes is rising, both in the U.S. and worldwide. Diabetes
is associated with increased morbidity and mortality due to metabolic perturbations of the
disease and the development of secondary complications including cardiovascular disease,
nephropathy, neuropathy, and retinopathy. By furthering the understanding of methyl group
and homocysteine metabolism in these conditions, it is our hope that this information might
be used for the formulation of appropriate dietary therapies to minimize adverse effects and
development of secondary complications.
Dissertation organization
Following a review of the literature, this dissertation will include three chapters
consisting of manuscripts that have been prepared for publication in peer-reviewed journals.
The first article will be submitted to Hepatology and presents an investigation of the effects
of chronic retinoid treatment on hepatic methyl group metabolism, DNA methylation status,
and general markers of toxicity in rats. The second manuscript details a time course study
of aberrant methyl group metabolism and DNA methylation in the STZ-induced rat model of
type 1 diabetes. This article was published in the Journal of Nutrition in November 2008.
The third, and final, paper describes the characterization of methyl group and homocysteine
metabolism, as well as epigenetic regulation in the liver, kidney, and heart of the ZDF rat
during early and advanced diabetic conditions. This article has been prepared for
publication in the American Journal of Physiology – Endocrinology and Metabolism.
Following this third manuscript will be an overall summary and conclusions statement which
presents a thorough discussion of the results, proposes potential regulatory factors, and
suggests potential future research directions.
3
CHAPTER 2: Literature review
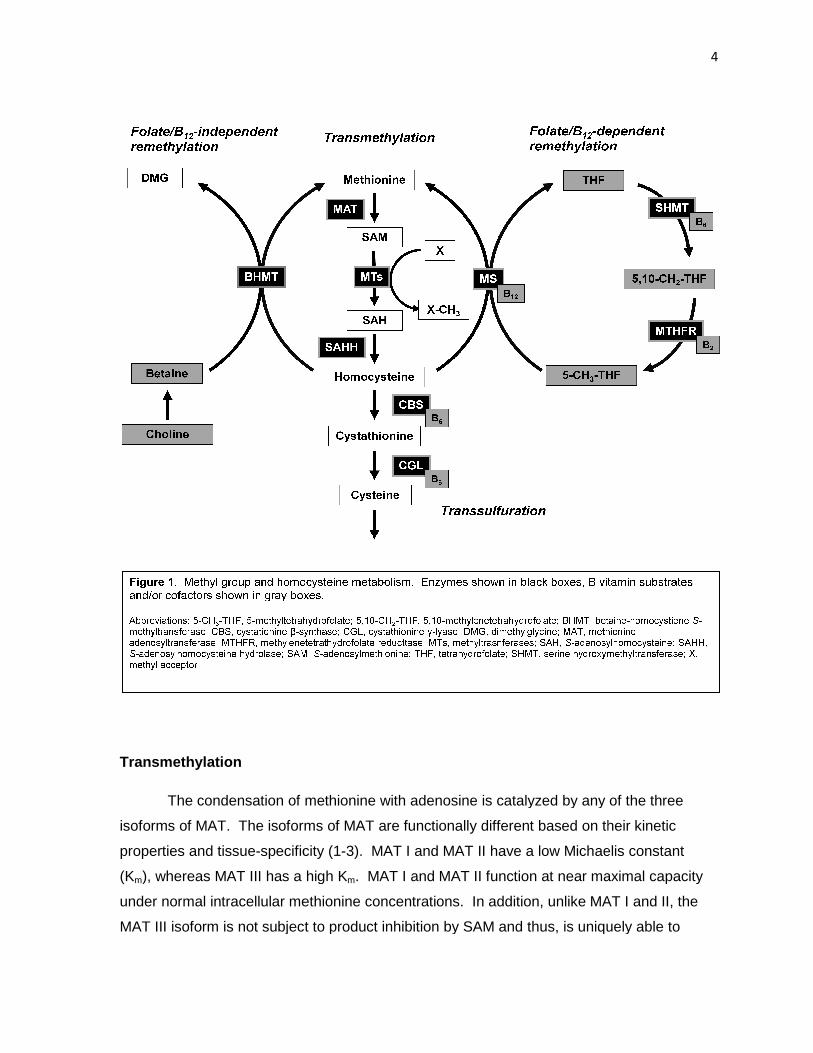
Methyl group and homocysteine metabolism
The metabolism of homocysteine and regulation of methyl balance are fundamental
processes in the maintenance of health. Dietary methyl donors include methionine, folate,
betaine, and choline. Utilization of methyl groups from these sources and the metabolism of
homocysteine rely on transmethylation, remethylation, and transsulfuration pathways
(Figure 1 ). Transmethylation begins with the activation of methionine to S-
adenosylmethionine (SAM) via addition of an adenosyl group by methionine
adenosyltransferase (MAT). SAM can then donate a methyl group to a variety of methyl
acceptor molecules, resulting in a methylated product and S-adenosylhomocysteine (SAH).
Homocysteine is produced by the hydrolysis of SAH by S-adenosylhomocysteine hydrolase
(SAHH). Homocysteine can be recycled to methionine by folate/B12-dependent or –
independent pathways. The folate/B12-dependent pathway utilizes a methyl group provided
by 5-methyltetrahydrofolate (5-CH3-THF) via the methylcobalamin cofactor of methionine
synthase (MS). Methylenetetrahydrofolate reductase (MTHFR) synthesizes the 5-CH3-THF
substrate from 5,10-methylenetetrahydrofolate (5,10-CH2-THF), which is a branch point in
folate metabolism and is also used for thymidylate synthesis. Remethylation by folate/B12-
independent means is catalyzed by betaine-homocysteine S-methyltransferase (BHMT) and
utilizes betaine as a methyl donor. In addition to dietary sources, betaine can be derived
from choline by the action of choline oxidase; thereby choline is also indirectly a methyl
donor for the BHMT reaction. As an alternative to remethylation, homocysteine may also be
catabolized to cysteine by the transsulfuration pathway enzymes cystathionine β-synthase
(CBS) and cystathionine γ-lyase (CGL), both of which are B6-dependent enzymes.
Understanding the regulation and physiological significance of each pathway, as well as the
interrelationships between pathways, is an important and active area of research.
Transmethylation
The condensation of methionine with adenosine is catalyzed by any of the three
isoforms of MAT. The isoforms of MAT are functionally different based on their kinetic
properties and tissue-specificity (1
(Km), whereas MAT III has a high K
under normal intracellular methionine concentrations.
MAT III isoform is not subject to product inhibition by SAM
The condensation of methionine with adenosine is catalyzed by any of the three
isoforms of MAT. The isoforms of MAT are functionally different based on their kinetic
specificity (1-3). MAT I and MAT II have a low Michaelis constant
), whereas MAT III has a high Km. MAT I and MAT II function at near maximal capacity
intracellular methionine concentrations. In addition, unlike MAT I and II, the
MAT III isoform is not subject to product inhibition by SAM and thus, is uniquely able to
4
The condensation of methionine with adenosine is catalyzed by any of the three
isoforms of MAT. The isoforms of MAT are functionally different based on their kinetic
3). MAT I and MAT II have a low Michaelis constant
. MAT I and MAT II function at near maximal capacity
nlike MAT I and II, the
and thus, is uniquely able to
5
continue to use more substrate as methionine load increases. MAT II is specific to
extrahepatic tissues, whereas MAT I and III are expressed in the liver. The presence of
MAT III in the liver is just one of many pieces of evidence that suggests a key role for the
liver in regulating methyl supply and utilization.
Following the activation of methionine to SAM by MAT, SAM can be used in a variety
of transmethylation reactions. There are purported to be >100 SAM-dependent
methyltransferases, over 30 of which have been characterized (4). Transmethylation
reactions take place in all cells and involve the transfer of a methyl group from SAM to a
methyl acceptor, resulting in the generation of the methylated product and SAH. Methyl
acceptors include lipids, proteins, nucleic acids, and other small molecules. Lipids produced
by transmethylation reactions include phosphatidylcholine, which is a vital component of
membranes, bile acids, and lipoproteins, and involved in cell signaling (5). Methylated
proteins include cellular receptors, histones, and transcription factors (6). SAM-dependent
transmethylation reactions are also responsible for the methylation of non-coding and
coding RNAs, as well as the establishment and maintenance of DNA methylation patterns
(7,8). Other small molecules that are methylated include the neurotransmitters of the
serotonin and catecholamine pathways (9) and ubiquinone in the mitochondria (10). This
list highlights just a few of the biologically important molecules derived from or modified by
SAM-dependent transmethylation reactions.
In addition to these varied methylated products, all transmethylation reactions
produce SAH. This product can be hydrolyzed to homocysteine and adenosine by SAHH.
This reaction is bidirectional and favors the formation of SAH, but proceed towards
homocysteine with the removal of the products (11). Elevated levels of both SAH and
homocysteine have been associated with the development of disease, including
neurological disorders, vascular diseases, and renal dysfunction (12-16). Therefore,
regulation of the production of these metabolites is critical.
There are three methyltransferases that have been proposed to be major
contributors to the regulation of methyl group and homocysteine metabolism:
guanidinoacetate methyltransferase (GAMT), phosphatidylethanolamine N-
methyltransferase (PEMT), and glycine N-methyltransferase (GNMT). It has long been
known that GAMT and PEMT catalyze the most quantitatively significant SAM-dependent
6
transmethylation reactions under normal physiological conditions (17). GAMT facilitates the
transfer of one methyl group from SAM to guanidinoacetate to form creatine, a ready source
of energy for cells. Traditionally, GAMT was thought to be the largest single consumer of
methyl groups from SAM (17), but Stead et al. (18) have recently summarized evidence
which suggests that PEMT may be a larger consumer of methyl groups and more important
contributor to elevations of homocysteine than GAMT. In addition to methodological
questions regarding earlier studies, it is noted that creatine can also be supplied in the diet.
Their study of creatine supplementation in rats demonstrated decreased guanidinoacetate
synthesis, a 90% decrease in GAMT activity, and 25% decrease in plasma homocysteine
levels (19). Subsequent studies in rats have also shown decreases in plasma homocysteine
(20; Nonnecke & Schalinske, unpublished observations). However, studies in humans have
provided conflicting results. Unexpectedly, two recent studies have shown creatine
supplementation to be associated with increases in plasma homocysteine levels in two very
different subject populations: healthy young men (21) and patients with coronary artery
disease (22). Of the remainder of human studies of creatine supplementation, one found a
small, but significant decrease in plasma homocysteine (23), whereas others found no effect
(24) or were inconclusive due to confounding factors such as renal disease and use of
dietary supplements (25).
The reaction catalyzed by PEMT – the other proposed regulator of homocysteine
levels - consists of the sequential addition of three methyl groups to
phosphatidylethanolamine (PE), thereby consuming three molecules of SAM and generating
three molecules of SAH, as well as the product phosphatidylcholine (PC). Under normal
physiological conditions, PEMT is estimated to generate one-third of PC produced and the
remainder is produced via the CDP-choline pathway (26). Cytidylyltransferase-α (CTα) and
PEMT knockout models have been used to determine the physiological significance of
altered PEMT activity (27-30). The rate-limiting step of the CDP-choline pathway of PC
synthesis is catalyzed by CTα. Therefore, knocking out CTα would be expected to increase
PEMT activity for adequate PC synthesis. Accordingly, in CTα-deficient mice, PEMT activity
increased 100% and methylation of PE, as measured using radiolabeled methionine, also
increased 100% (27). Furthermore, plasma homocysteine levels were elevated 20-40% in
CTα-deficient mice compared to controls, despite compensatory increases in BHMT activity.
Likewise, transfection of PEMT into rat hepatoma cells resulted in ~1.5-fold increase in
homocysteine secretion (28). Conversely, primary hepatocytes from PEMT -/- mice secreted
7
~50% less homocysteine than cells from wild-type mice and plasma homocysteine levels
were ~50% lower in both male and female mice deficient in PEMT. Deficiency of PEMT also
decreased hepatic levels of choline, choline-containing phospholipids, triglycerides, and
lipoproteins, as well as altered lipoprotein production and metabolism (29,30).
Whereas GAMT and PEMT have been most closely linked to homocysteine levels,
GNMT is a proposed regulator of methyl group supply and utilization (31). GNMT is
expressed in kidney, pancreas, and small intestine and is highly abundant in the liver,
comprising up 1-3% of total hepatic protein (32). The GNMT tetramer catalyzes the addition
of a methyl group to glycine, thereby forming sarcosine. Sarcosine has no clear
physiological function and can be metabolized by sarcosine dehydrogenase, making it an
ideal product for disposal of excess methyl groups. GNMT is also notable in that it is not
subject to feedback inhibition by SAH unlike most, if not all, other known SAM-dependent
methyltransferases (31). Based on these characteristics, accumulating evidence from
GNMT knockout models, and a unique regulatory relationship with folate metabolism, GNMT
is proposed to be a primary regulator of the SAM:SAH ratio which governs transmethylation
potential.
Two GNMT knockout mouse models have recently been developed, and although
there is some debate regarding completeness of the knockout and differences in the course
of pathogenesis in the two models (33), animals from both models exhibit dramatic
increases in the SAM:SAH ratio and development of hepatocellular carcinoma (HCC; 34-
37). The Wagner group produced the first published report of a GNMT knockout mouse
which was characterized by elevated hepatic methionine and SAM concentrations
concurrent with decreased SAH concentrations, resulting in a 100-fold increase in the
hepatic SAM:SAH ratio (34). In the GNMT knockout model developed by Chen’s group, the
SAM:SAH ratio was elevated 42- and 82-fold in male and female GNMT -/- mice, respectively
(35). There was no elevation of the SAM:SAH ratio in heterozygotes in either model,
despite a 50% reduction in GNMT activity in heterozygotes as reported by Luka et al (34).
The development of HCC in GNMT knockout mice is postulated to be due to dysregulation
of DNMTs, DNA and histone methylation, as well as perturbation of canonical signaling
pathways involved in carcinogenesis including the Wnt, JAK/STAT, and MAPK pathways
(36,37). Human HCC and prostate cancer have also been characterized by downregulation
or lack of GNMT (38-40).
8
Upregulation of GNMT has been postulated to be protective against toxins and
carcinogenesis. In addition to its regulatory role in methyl group metabolism, GNMT is also
a purported 4S polycyclic hydrocarbon-binding protein (41). Benzo[α]pyrene and aflatoxin
or their metabolites are aryl hydrocarbons and causal agents of HCC. Upregulation of
GNMT in transfected cell lines or a transgenic mouse model decreased toxin-associated
DNA adduct formation and reduced cytotoxicity or prevented the development of HCC
(42,43). In response to the toxins, GNMT was translocated to the nucleus and molecular
modeling suggested interactions at the SAM-binding site of the dimeric form of GNMT.
Earlier reports have also shown translocation of GNMT to the nucleus and measured
significant GNMT activity in nucleic extracts (32), though the role of GNMT in the nucleus
remains somewhat ambiguous.
Whereas GAMT does not appear to catalyze the rate-liming reaction of creatine
synthesis and is proposed to respond largely to guanidinoacetate concentrations (44,45),
PEMT and GNMT are subject to regulation by a wide variety of hormonal factors.
Expression and/or activity of PEMT and GNMT are gender-specific or responsive to sex
hormones (46,47). GNMT and PEMT are induced by a diabetic condition or treatment with
glucocorticoids (32,48-52), whereas insulin treatment attenuates this effect (48,50). As
another potential function for GNMT, this diabetes-induced upregulation has been proposed
as a mechanism for the generation of pyruvate from methionine for gluconeogenesis,
especially as GNMT expression is limited to gluconeogenic tissues (32). However,
upregulation of GNMT is not specific to a diabetic state. GNMT activity and expression are
also altered by growth hormone: activity and mRNA abundance are increased in the Ames
dwarf mouse which lacks growth hormone, prolactin, and thyroid-stimulating hormone; this
increase was attenuated by treatment with growth hormone (53,54). Likewise,
triiodothyronine normalized elevations in GNMT activity by retinoids, although GNMT
abundance was unaffected, suggesting posttranslational regulation; neither hypo- nor
hyperthyroidism had an independent effect on GNMT activity or protein abundance (55).
There is also a unique regulatory relationship between GNMT and folate metabolism.
GNMT can be bound by 5-CH3-THF, which inhibits GNMT activity (56), specifically by
inhibition of phosphorylation which enhances GNMT activity (57). However, with GNMT
activity decreased, this would be expected to increase intracellular SAM levels and MTHFR
is allosterically inhibited by SAM (58). When methyl group supply is high, SAM levels are
9
elevated and MTHFR is inhibited, thereby decreasing the available methyl groups incoming
via folate/B12-dependent remethylation. Furthermore, GNMT activity is freed from inhibition
by 5-CH3-THF, resulting in lowering of SAM levels and restoration of the SAM:SAH ratio.
When methyl group supply is low, SAM levels are decreased, relieving the inhibition of
MTHFR and increasing 5-CH3-THF concentrations, which inhibits GNMT activity and
provides more substrate for remethylation via MS, thereby increasing the methyl pool. This
reciprocal regulation of GNMT and MTHFR is thought to play a key role in transmethylation
potential homeostasis.
Remethylation
Homocysteine can be remethylated by folate/B12-dependent or –independent
pathways. In addition to the remethylation of homocysteine to methionine, folate
metabolism is also involved in the transfer of one-carbon units for the synthesis of purines
and thymidylate (59). The C2 and C8 carbons of purines are donated from the formyl group
of 10-formyltetrahydrofolate in reactions catalyzed by 5-amino-4-imidazole carboxamide
transformylase and glycinamide ribotide transformylase, respectively. For thymidylate
synthesis, formaldehyde is transferred from 5,10-CH2-THF to deoxyuridylate by thymidylate
synthetase. Alternatively, MTHFR converts 5,10-CH2-THF to 5-CH3-THF, which is the
methyl donor for the remethylation of homocysteine to methionine by the folate/B12-
dependent pathway. The folate/B12-dependent pathway of remethylation appears to be
active in all tissues and is essential for survival (60,61). In the attempt at developing a MS
knockout in two strains of mice, Swanson et al. (61) reported that MS activity was decreased
40% in heterozygotes relative to controls, but there were minimal effects on plasma
methionine or homocysteine levels. There were no viable homozygotes, with loss of the
embryo occurring shortly after implantation. It is likely that the failure to survive was due, at
least in part, to the effects of the “methyl trap” hypothesis, in which folate accumulates as 5-
CH3-THF due to the irreversibility of the MTHFR reaction and lack of other 5-CH3-THF-
metabolizing enzymes and thus, is unavailable for the other critical reactions requiring folate
coenzymes (59). This “methyl trapping” phenomenon was first proposed after aberrations of
folate metabolism were noted in patients and rats lacking adequate vitamin B12, an essential
cofactor for MS activity. Unlike the MS knockout model, both hetero- and homozygous
10
MTHFR knockout mice were viable and exhibited elevated plasma homocysteine levels and
decreased SAM:SAH ratios in liver, brain, ovaries, and testes (62). The phenotypic effects
were significantly greater in MTHFR-/- mice, which were developmentally delayed and had
neural and vascular abnormalities in addition to the 10-fold increase in plasma
homocysteine. Taking into consideration the effects on metabolites observed in the MS and
MTHFR knockout models and the unique relationship between the MTHFR and GNMT, it
appears that MTHFR has a more significant regulatory role than MS.
Homocysteine may also be remethylated to homocysteine by the action of BHMT in
the folate/B12-independent remethylation pathway. Choline can be converted to betaine by
choline oxidase and betaine aldehyde dehydrogenase in the mitochondria. Thereby, both
dietary choline and betaine may serve as methyl donors for this reaction. BHMT is
suggested to contribute significantly to the regulation of homocysteine levels. BHMT is
primarily a liver-specific enzyme, but can also be found in the kidney in primates and pigs,
with small amounts expressed in the rat kidney (61). Although there are no genetic
knockout models for BHMT, S-(δ-carboxybutyl)-DL-homocysteine is a potent inhibitor of
BHMT activity and has been used experimentally to determine the effect of BHMT on
homocysteine levels (64). A single injection of S-(δ-carboxybutyl)-DL-homocysteine (1 mg)
in mice was sufficient to decrease BHMT activity 90% and increase homocysteine levels by
greater than 100% for 1-8 hrs. There was no effect on MS and CBS activities, suggesting
that changes in homocysteine could be attributed specifically to the decrease in BHMT
activity.
MS and BHMT are regulated by many of the same factors that influence the SAM-
dependent methyltransferases. The effects of a diabetic condition on MS, MTHFR, and
BHMT are varied and will be discussed in depth in subsequent sections. In the growth
hormone-deficient Ames dwarf mouse, the mRNA expression of BHMT was upregulated,
whereas MS expression was suppressed (54). MTHFR activity in the liver and/or kidney is
affected by sex steroids, thyroid, and growth hormone (60). BHMT activity has also been
shown to be suppressed by triiodothyronine (55) and is likely affected by testosterone and
estrogens, but much remains to be learned about the hormonal regulation of BHMT (65).
11
Transsulfuration
Transsulfuration is the irreversible catabolic pathway for homocysteine to cysteine
and is specific to the liver, kidney, pancreas, intestine, and brain (1). As the only reaction
resulting in the catabolism of homocysteine, CBS has also been implicated in the regulation
of plasma homocysteine concentrations. The effect of CBS upregulation on serum
homocysteine levels was investigated by Wang et al. (66) using a transgenic mouse model.
By giving mice supplemental zinc, transcription of the CBS transgene under the regulation of
the metallothionein promoter was stimulated, which resulted in increased CBS activity and
expression in the liver and kidney with concurrently decreased serum homocysteine
concentrations. The homocysteine-lowering effect of CBS upregulation was also observed
when mice were fed a high methionine-low folate diet, which successfully induced
hyperhomocysteinemia in wild-type mice. Conversely, mice that are completely deficient in
CBS had plasma homocysteine concentrations 40-fold greater than their wild-type
counterparts, whereas CBS activity decreased 50% and plasma homocysteine
concentrations increased 2-fold in the heterozygotes (67).
CBS and CGL are also subject to regulation, by diabetes as well as other hormones
and cellular conditions. CBS and CGL activities were elevated in the Ames dwarf mouse
liver (53). The effect of increased activities of these enzymes in the Ames dwarf mouse
were studied further, which revealed increased flux through the transsulfuration pathway in
the liver, kidney and brain, as well as lower plasma homocysteine concentrations (54). CBS
activity and transsulfuration flux are also enhanced in response to increased SAM
concentrations (68) and under oxidative conditions (12). This is likely due to the need for
disposal of excess methionine and/or generation of cysteine, which can be used for the
production of a variety of important intracellular metabolites, including the antioxidants
glutathione and taurine. Glutathione and taurine are involved in redox homeostasis and are
considered a key defense against intracellular oxidation. Cysteine is also a precursor to
hydrogen sulfide, which is a transmitter with neurological, intestinal, and cardiovascular
effects (69).
12
Methyl balance, homocysteine, and the SAM:SAH ratio
Dietary methyl donors include methionine, folate, betaine, and choline. Methionine is
an essential, sulfur-containing amino acid found in dietary proteins. Folate and betaine are
utilized by the remethylation pathways for donation of methyl groups to homocysteine for
regeneration of methionine. Choline does not serve as a methyl donor directly, but it can be
converted to betaine by the enzyme choline oxidase, also commonly referred to as choline
dehydrogenase. Varying dietary composition with respect to dietary methyl donors can
perturb folate one-carbon, methyl group, and homocysteine metabolism.
Methionine is metabolized to SAM, the primary methyl donor for transmethylation
reactions and a positive regulator of transmethylation and transsulfuration reactions (1).
Feeding rats high-methionine diets increased activities of MAT, GNMT, and SAHH (70,71).
Transsulfuration enzymes were also upregulated, whereas MS was decreased (72). BHMT
was upregulated in response to low methionine diets and this effect was enhanced by
betaine or choline supplementation (72,73).
Diets deficient in one methyl donor illustrate the balance required between the
pathways. Low folate may disrupt the balance that normally results from the reciprocal
regulation of GNMT and MTHFR. In rats fed a folate-deficient diet, GNMT activity increased
and the intracellular SAM:SAH ratio decreased in the liver and pancreas within just 2 weeks
(74,75). Folate or choline deficient diets are associated with hyperhomocysteinemia and
decreased concentrations of the provided methyl donor (i.e. choline deficiency results in
lower hepatic folate concentrations), likely due to compensatory upregulation of the
remethylation of homocysteine by the pathway utilizing the available methyl donor (76). In
humans, an acute dose of betaine (3 or 6 g) was sufficient to decrease plasma
homocysteine concentration up to 10% in healthy middle-aged adults (77).
Normal plasma homocysteine levels in humans range from 5-15 µmol/L (78). Mild
to moderate hyperhomocysteinemia is classified as plasma homocysteine levels between 15
and 30 µmol/L, intermediate and severe hyperhomocysteinemia refers to plasma
concentrations above 30 µmol/L and 100 µmol/L respectively. Disruption of homocysteine
metabolism, specifically hyperhomocysteinemia, has been associated with increased risk of
cancer, cerebro- and cardiovascular disease, neurological disease, osteoporosis, pregnancy
complications, and birth defects (78-82). In the Hordaland Homocysteine Study of over
13
18,000 patients in Western Norway, lifestyle and dietary factors such as smoking, increased
coffee consumption, and low folate intake were associated with hyperhomocysteinemia,
whereas there was an inverse relationship between physical activity and plasma
homocysteine concentrations (82). Age, gender, renal function, and the MTHFR 677C>T
polymorphism were also found to be key determinants of homocysteine levels. Plasma
homocysteine concentrations were increased in men and patients that were older, had
elevated creatinine levels (an indicator of renal dysfunction), and/or the T/T genotype for
MTHFR 677. The MTHFR677C>T point mutation is particularly common, with prevalence of
up to 20% in some populations, but polymorphic forms of GNMT, MS, SHMT, and CBS have
also been identified (83,84). This raises the possibility for nutrient-gene or gene-gene
interaction effects and indeed, the response of homocysteine and folate one-carbon
metabolism to folate has been shown to be affected by polymorphisms (83-85) and
relationships with other methyl donors are likely to exist. Inborn defects of methyl group and
homocysteine metabolism have also been documented for all enzymes with the exception of
BHMT and are associated with the accumulation of intermediate metabolites of their
respective pathways (86).
Dietary supplementation of B vitamins with the goal of lowering plasma
homocysteine levels has been studied extensively and has been shown to be effective, but
whether the lowering of homocysteine levels had protective effect against morbidity and
mortality is still controversial (Williams and Schalinske, BioFactors, in press). Early studies
showed improved B-vitamin status lowered plasma homocysteine levels, and decreased
incidence of adverse events or improvements in indicators of vascular endothelial
dysfunction in patients treated with folic acid, B12, and/or B6 vs. those treated with a placebo
(87-91). However, these results have largely been refuted by the predominantly negative
results of subsequent trials, including the NORVIT, WENBIT, HOPE-2, VISP, VITATOPS,
and VITRO studies (92-102). These studies generally had a mean follow-up time of several
years and assessed a wide variety of vascular indicators and endpoints including carotid
intima-media thickness and flow-mediated dilation (96), markers of arterial inflammation (93-
102), need for revascularization procedures (98), occurrence of thromboembolism (97,99),
occurrence of stroke and myocardial infarction (92,94,98,100,101,103), as well as overall or
coronary/vascular-related mortality (92,94,95,98,100,103).
14
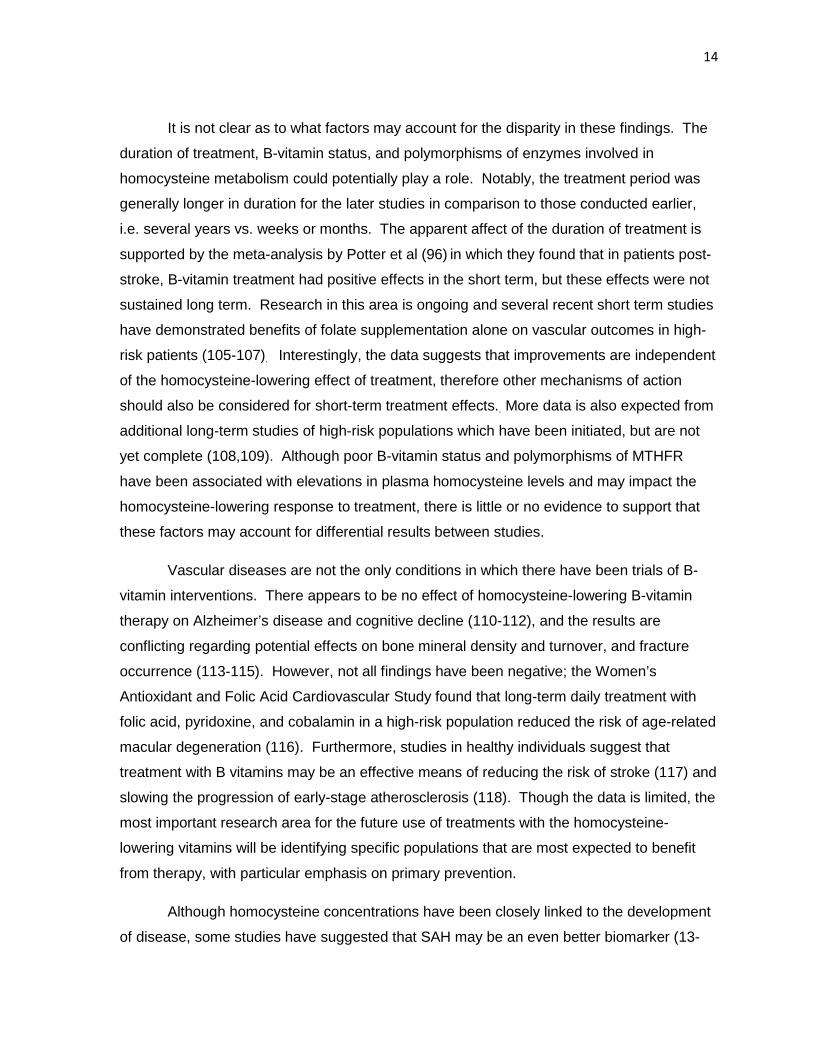
It is not clear as to what factors may account for the disparity in these findings. The
duration of treatment, B-vitamin status, and polymorphisms of enzymes involved in
homocysteine metabolism could potentially play a role. Notably, the treatment period was
generally longer in duration for the later studies in comparison to those conducted earlier,
i.e. several years vs. weeks or months. The apparent affect of the duration of treatment is
supported by the meta-analysis by Potter et al (96) in which they found that in patients post-
stroke, B-vitamin treatment had positive effects in the short term, but these effects were not
sustained long term. Research in this area is ongoing and several recent short term studies
have demonstrated benefits of folate supplementation alone on vascular outcomes in high-
risk patients (105-107). Interestingly, the data suggests that improvements are independent
of the homocysteine-lowering effect of treatment, therefore other mechanisms of action
should also be considered for short-term treatment effects.. More data is also expected from
additional long-term studies of high-risk populations which have been initiated, but are not
yet complete (108,109). Although poor B-vitamin status and polymorphisms of MTHFR
have been associated with elevations in plasma homocysteine levels and may impact the
homocysteine-lowering response to treatment, there is little or no evidence to support that
these factors may account for differential results between studies.
Vascular diseases are not the only conditions in which there have been trials of B-
vitamin interventions. There appears to be no effect of homocysteine-lowering B-vitamin
therapy on Alzheimer’s disease and cognitive decline (110-112), and the results are
conflicting regarding potential effects on bone mineral density and turnover, and fracture
occurrence (113-115). However, not all findings have been negative; the Women’s
Antioxidant and Folic Acid Cardiovascular Study found that long-term daily treatment with
folic acid, pyridoxine, and cobalamin in a high-risk population reduced the risk of age-related
macular degeneration (116). Furthermore, studies in healthy individuals suggest that
treatment with B vitamins may be an effective means of reducing the risk of stroke (117) and
slowing the progression of early-stage atherosclerosis (118). Though the data is limited, the
most important research area for the future use of treatments with the homocysteine-
lowering vitamins will be identifying specific populations that are most expected to benefit
from therapy, with particular emphasis on primary prevention.
Although homocysteine concentrations have been closely linked to the development
of disease, some studies have suggested that SAH may be an even better biomarker (13-
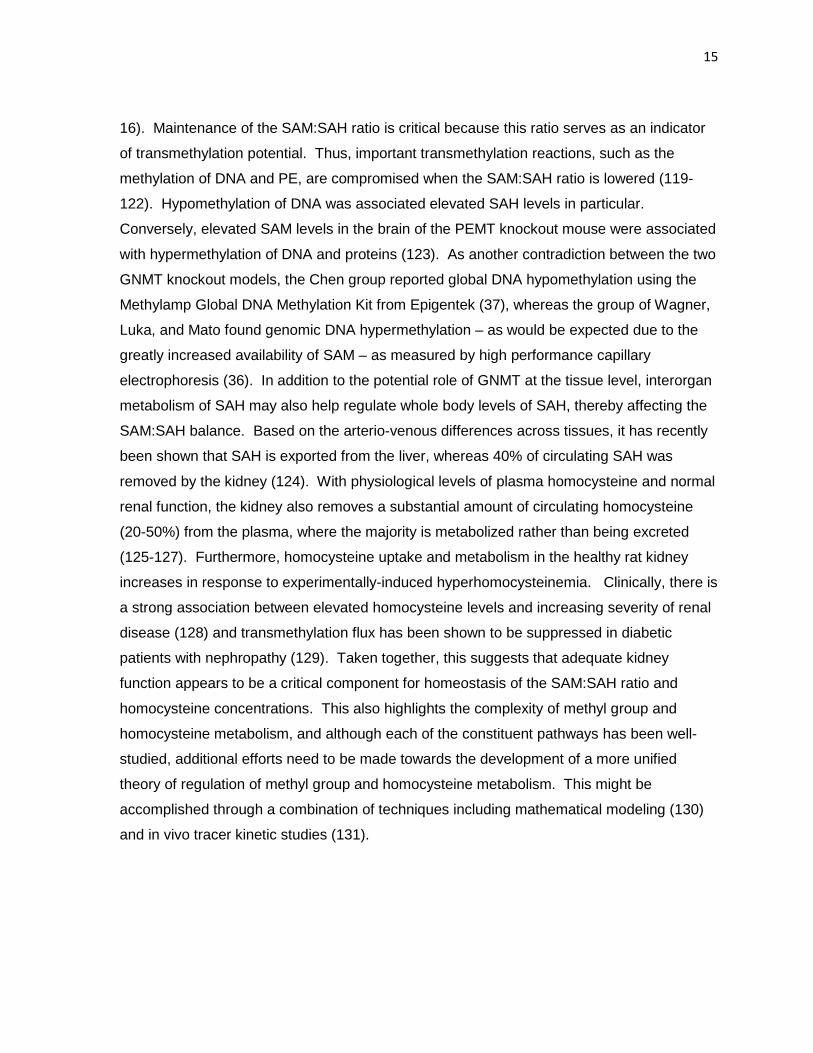
15
16). Maintenance of the SAM:SAH ratio is critical because this ratio serves as an indicator
of transmethylation potential. Thus, important transmethylation reactions, such as the
methylation of DNA and PE, are compromised when the SAM:SAH ratio is lowered (119-
122). Hypomethylation of DNA was associated elevated SAH levels in particular.
Conversely, elevated SAM levels in the brain of the PEMT knockout mouse were associated
with hypermethylation of DNA and proteins (123). As another contradiction between the two
GNMT knockout models, the Chen group reported global DNA hypomethylation using the
Methylamp Global DNA Methylation Kit from Epigentek (37), whereas the group of Wagner,
Luka, and Mato found genomic DNA hypermethylation – as would be expected due to the
greatly increased availability of SAM – as measured by high performance capillary
electrophoresis (36). In addition to the potential role of GNMT at the tissue level, interorgan
metabolism of SAH may also help regulate whole body levels of SAH, thereby affecting the
SAM:SAH balance. Based on the arterio-venous differences across tissues, it has recently
been shown that SAH is exported from the liver, whereas 40% of circulating SAH was
removed by the kidney (124). With physiological levels of plasma homocysteine and normal
renal function, the kidney also removes a substantial amount of circulating homocysteine
(20-50%) from the plasma, where the majority is metabolized rather than being excreted
(125-127). Furthermore, homocysteine uptake and metabolism in the healthy rat kidney
increases in response to experimentally-induced hyperhomocysteinemia. Clinically, there is
a strong association between elevated homocysteine levels and increasing severity of renal
disease (128) and transmethylation flux has been shown to be suppressed in diabetic
patients with nephropathy (129). Taken together, this suggests that adequate kidney
function appears to be a critical component for homeostasis of the SAM:SAH ratio and
homocysteine concentrations. This also highlights the complexity of methyl group and
homocysteine metabolism, and although each of the constituent pathways has been well-
studied, additional efforts need to be made towards the development of a more unified
theory of regulation of methyl group and homocysteine metabolism. This might be
accomplished through a combination of techniques including mathematical modeling (130)
and in vivo tracer kinetic studies (131).
16
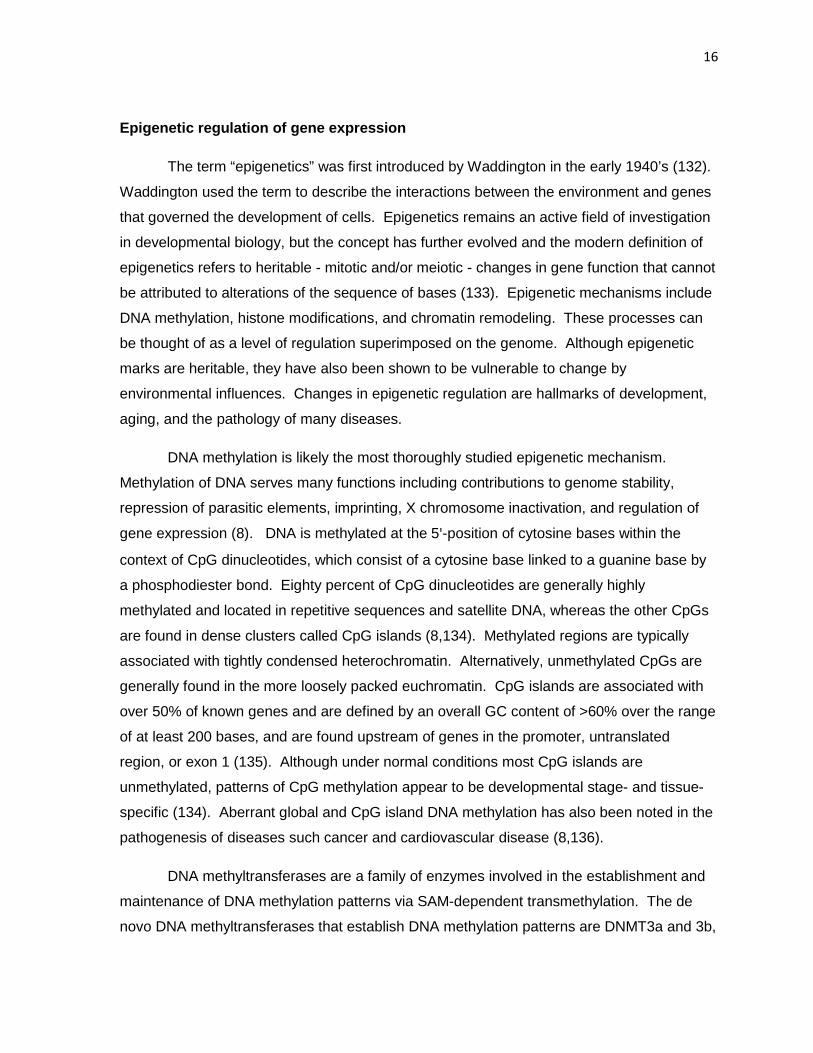
Epigenetic regulation of gene expression
The term “epigenetics” was first introduced by Waddington in the early 1940’s (132).
Waddington used the term to describe the interactions between the environment and genes
that governed the development of cells. Epigenetics remains an active field of investigation
in developmental biology, but the concept has further evolved and the modern definition of
epigenetics refers to heritable - mitotic and/or meiotic - changes in gene function that cannot
be attributed to alterations of the sequence of bases (133). Epigenetic mechanisms include
DNA methylation, histone modifications, and chromatin remodeling. These processes can
be thought of as a level of regulation superimposed on the genome. Although epigenetic
marks are heritable, they have also been shown to be vulnerable to change by
environmental influences. Changes in epigenetic regulation are hallmarks of development,
aging, and the pathology of many diseases.
DNA methylation is likely the most thoroughly studied epigenetic mechanism.
Methylation of DNA serves many functions including contributions to genome stability,
repression of parasitic elements, imprinting, X chromosome inactivation, and regulation of
gene expression (8). DNA is methylated at the 5'-position of cytosine bases within the
context of CpG dinucleotides, which consist of a cytosine base linked to a guanine base by
a phosphodiester bond. Eighty percent of CpG dinucleotides are generally highly
methylated and located in repetitive sequences and satellite DNA, whereas the other CpGs
are found in dense clusters called CpG islands (8,134). Methylated regions are typically
associated with tightly condensed heterochromatin. Alternatively, unmethylated CpGs are
generally found in the more loosely packed euchromatin. CpG islands are associated with
over 50% of known genes and are defined by an overall GC content of >60% over the range
of at least 200 bases, and are found upstream of genes in the promoter, untranslated
region, or exon 1 (135). Although under normal conditions most CpG islands are
unmethylated, patterns of CpG methylation appear to be developmental stage- and tissue-
specific (134). Aberrant global and CpG island DNA methylation has also been noted in the
pathogenesis of diseases such cancer and cardiovascular disease (8,136).
DNA methyltransferases are a family of enzymes involved in the establishment and
maintenance of DNA methylation patterns via SAM-dependent transmethylation. The de
novo DNA methyltransferases that establish DNA methylation patterns are DNMT3a and 3b,
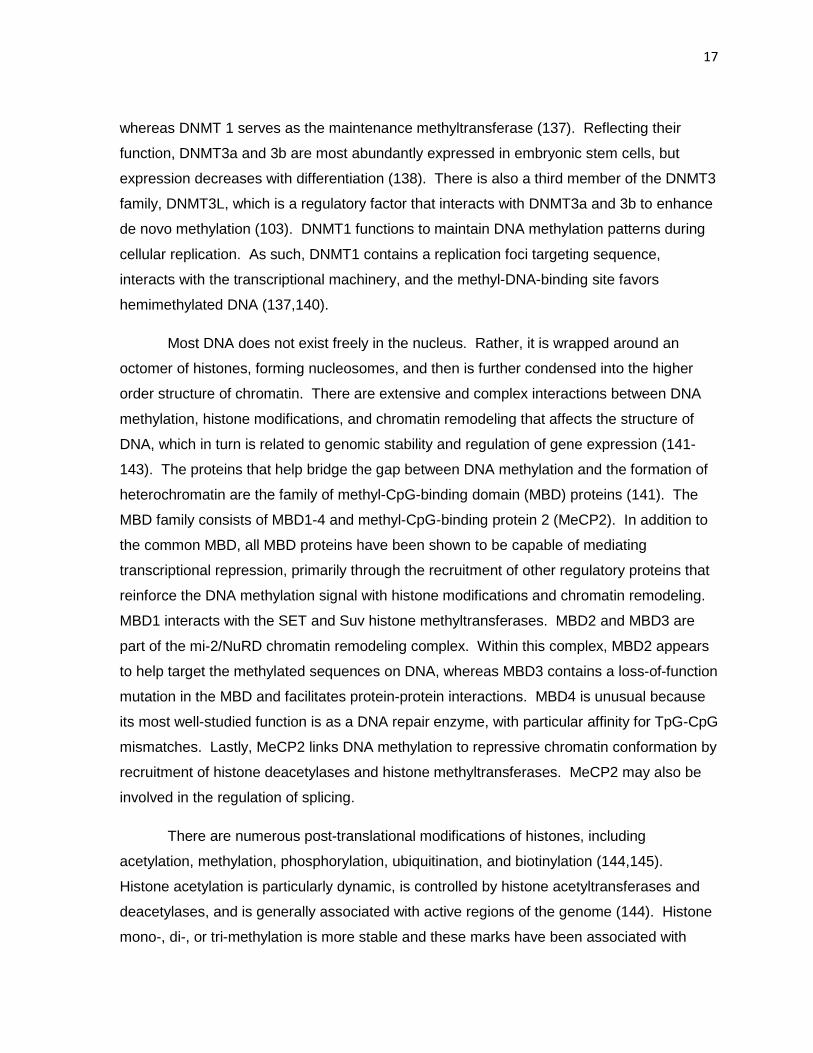
17
whereas DNMT 1 serves as the maintenance methyltransferase (137). Reflecting their
function, DNMT3a and 3b are most abundantly expressed in embryonic stem cells, but
expression decreases with differentiation (138). There is also a third member of the DNMT3
family, DNMT3L, which is a regulatory factor that interacts with DNMT3a and 3b to enhance
de novo methylation (103). DNMT1 functions to maintain DNA methylation patterns during
cellular replication. As such, DNMT1 contains a replication foci targeting sequence,
interacts with the transcriptional machinery, and the methyl-DNA-binding site favors
hemimethylated DNA (137,140).
Most DNA does not exist freely in the nucleus. Rather, it is wrapped around an
octomer of histones, forming nucleosomes, and then is further condensed into the higher
order structure of chromatin. There are extensive and complex interactions between DNA
methylation, histone modifications, and chromatin remodeling that affects the structure of
DNA, which in turn is related to genomic stability and regulation of gene expression (141-
143). The proteins that help bridge the gap between DNA methylation and the formation of
heterochromatin are the family of methyl-CpG-binding domain (MBD) proteins (141). The
MBD family consists of MBD1-4 and methyl-CpG-binding protein 2 (MeCP2). In addition to
the common MBD, all MBD proteins have been shown to be capable of mediating
transcriptional repression, primarily through the recruitment of other regulatory proteins that
reinforce the DNA methylation signal with histone modifications and chromatin remodeling.
MBD1 interacts with the SET and Suv histone methyltransferases. MBD2 and MBD3 are
part of the mi-2/NuRD chromatin remodeling complex. Within this complex, MBD2 appears
to help target the methylated sequences on DNA, whereas MBD3 contains a loss-of-function
mutation in the MBD and facilitates protein-protein interactions. MBD4 is unusual because
its most well-studied function is as a DNA repair enzyme, with particular affinity for TpG-CpG
mismatches. Lastly, MeCP2 links DNA methylation to repressive chromatin conformation by
recruitment of histone deacetylases and histone methyltransferases. MeCP2 may also be
involved in the regulation of splicing.
There are numerous post-translational modifications of histones, including
acetylation, methylation, phosphorylation, ubiquitination, and biotinylation (144,145).
Histone acetylation is particularly dynamic, is controlled by histone acetyltransferases and
deacetylases, and is generally associated with active regions of the genome (144). Histone
mono-, di-, or tri-methylation is more stable and these marks have been associated with
18
either transcriptional activation or repression. Histone modification by phosphorylation,
ubiquitination or biotinylation has not been studied as extensively as the acetylation and
methylation marks. Phosphorylation appears to play a role in transcriptional activation and
chromosome condensation/segregation during mitosis. Ubiquitination and biotinylation are
involved in X chromosome inactivation and repression of transposable elements
respectively (145). There is a great deal of interplay between the histone modifications, the
observation of which led to the development of the “histone code” hypothesis (146) which
postulates that combinations of histone modifications could be used to predict the regulatory
effect on the gene. However, the concept of epigenetics is continuously evolving and
gaining in complexity. More recently discovered epigenetic mechanisms such as the
involvement of noncoding RNAs are active areas of research (147).
Evidence from studies of monozygotic twins shows that during early childhood, twins
have similar patterns of DNA methylation and histone acetylation, but these similarities are
lost in older twins (148). These differences that accumulate over a lifetime might be
attributed to environmental factors, including diet, which have been shown to impact
epigenetic mechanisms. The effects of methyl-deficient diets have been particularly well-
studied in the context of HCC (149). Feeding of methyl-deficient diets to rats resulted in
perturbations of folate metabolism, thereby compromising thymidylate and purine synthesis
and increasing uracil misincorporation, abasic sites and DNA strand breaks. These
phenomena are thought to precede increased DNMT activity, altered expression patterns of
DNMTs and MBDs, and abnormal histone modification patterns (150-154). The effects of
methyl deficiency on DNA methylation were specific to the liver (153) and were reversible for
at least 9 weeks, but not 18 weeks after initiation of the diet by treating with a methyl-replete
diet (154), suggesting a possible window for dietary interventions. In a similar fashion,
folate deficiency decreases the SAM:SAH ratio and is associated with global and gene-
specific DNA hypomethylation in both rodent models and human subjects (74,75,155,156).
This effect is reversible with folate supplementation, at least in the short term (155). Folate
treatment has also been shown to restore DNA methylation levels to normal in lymphocytes
of hemodialysis patients with hyperhomocysteinemia and in livers of aging rats (156,157).
Genes of methyl group and homocysteine metabolism have also been implicated in nutrient-
gene interactions affecting epigenetic mechanisms (83). In addition to methyl donors,
bioactive food components, zinc, selenium, and retinoic acid are all potential modulators of
19
epigenetic regulation via effects on methyl group and homocysteine metabolism or
epigenetic regulatory proteins (158).
For the studies presented herein, genomic and CpG island DNA methylation, as well
as expression of DNMTs and MBDs were used as indicators of epigenetic regulatory
processes. DNA methylation status was measured by digestion of DNA with methylation-
specific restriction enzymes followed by cytosine extension assay and expression of
epigenetic regulatory proteins was determined primarily by real time reverse-transcriptase
PCR for relative quantification of mRNA abundance. These methods are well-accepted and
have been used previously for the assessment of epigenetic dysregulation (151,153,154),
though our laboratory has made minor modifications (detailed in Materials and Methods
section within each appropriate chapter). These analyses will detect overall changes in the
degree of genomic and CpG island DNA methylation, as well as relative expression of the
DNMTs and MBDs. DNA methylation patterns may also be assessed at specific genes and
we expect that this will be the goal of future studies.
Altered methyl group and homocysteine metabolism in cluding epigenetic regulation
There are numerous factors that can disrupt normal methyl group and homocysteine
metabolism. As has been previously discussed herein, these factors include dietary intake
and nutritional status, genetic contributions, environmental or pharmacological exposures,
and hormonal balance. The majority of the research presented in the remainder of this
document is focused on the effects of retinoids and a diabetic condition on methyl group and
homocysteine metabolism, including epigenetic regulation of DNA via methylation.
Therefore, it is important to review basic concepts related to the function of retinoids and the
pathology of diabetes, as well as to examine the current literature describing interactions
between retinoids or a diabetic condition and metabolic and epigenetic aberrations.
Retinoids
Retinoids comprise the vitamin A family of compounds including retinyl esters,
retinal, retinol, and retinoic acid. Retinal is used in the visual cycle, but for all other
20
purposes, retinoic acid is the biologically active form. Retinoic acid is a ligand for the
retinoic acid receptor (RAR). The retinoic acid-RAR complex then dimerizes with the
retinoid x receptor. This heterodimer recognizes the canonical retinoic acid response
elements (RAREs) in the promoter regions of genes, thereby stimulating transcription. The
pleiotropic effect of vitamin A may be attributed to the presence of RAREs in the promoter
region of genes for several transcription factors which can explain the diverse necessity of
vitamin A for cellular differentiation, and optimal reproductive and immune function (159).
Retinoids are widely used in cancer prevention and treatment (159,160), as well as
for dermatological disorders such as acne, rosacea, and psoriasis (160). Despite
widespread use, there still remain concerns regarding the toxicity of retinoids, thus
necessitating further investigation. Retinoic acid is absorbed, transported, and metabolized
differently than other forms of vitamin A, such as retinol or carotenoids (161,162). Retinoic
acid is rapidly absorbed and is bound by albumin during transport to the liver by the portal
vein, rather than via the traditional absorption and transport of fat-soluble vitamins by
chylomicrons and entrance to the lymphatic circulation prior to entering the bloodstream.
Furthermore, the half-life of all-trans-retinoic acid in plasma is <1 hr in both rodents and
humans, and retinoic acid is not stored in the liver or extrahepatic tissues (161,163), though
it does alter vitamin A metabolism by increasing expression of lecithin:retinol acytransferase,
which esterifies retinol to retinyl esters for storage (164,165). Intracellular retinoic acid may
be bound to its associated receptors for biological activity, bound by cellular retinoic acid-
binding protein, or catabolized (166). The catabolism of retinoic acid to 4-oxoretinoic acid or
retinoyl β-glucuronide is catalyzed by cytochrome P450 enzymes, which can be upregulated
in response to retinoic acid (164,167). Although this regulatory effect suggests maintenance
of vitamin A homeostasis, all-trans-retinoic acid is more biologically active and appears to be
more toxic than other retinoids (163,166). Hypervitaminosis A presents with nausea,
vomiting, fatigue, headache, dermal irritation, skeletal pain, and hepatotoxicity, including
elevated serum AST and ALT activity, lipid accumulation, fibrosis, and cirrhosis if left
untreated (163,168). Vitamin A toxicity is generally treated simply by halting excess vitamin
A intake and addressing conditions which may predispose individuals to toxic effects such
as excessive intake of ethanol or of other fat-soluble vitamins, protein malnutrition, and pre-
existing liver or renal disease (161,168).
21
We have shown that treatment of rats with excess vitamin A at pharmacological
doses results in abnormal methyl group and homocysteine metabolism, perturbation of SAM
and SAH levels, and DNA hypomethylation (169-171). Rats treated with vitamin A in the
form of retinyl palmitate, cis-retinoic acid, or all-trans-retinoic acid (RA) had elevated hepatic
GNMT activity and abundance (47,48,169-171). This effect appears to be specific to the
liver, with no changes in GNMT activity and/or abundance observed in the pancreas or
kidney (47). The hepatic induction of GNMT was most dramatic in the RA-treated rats,
which also exhibited DNA hypomethylation as measured by the SssI methyl-acceptance
assay (170). The results of this study have also been replicated in a cell culture model of
somatic bovine cells, in which treatment with RA resulted in relative demethylation of DNA
(172). The induction of GNMT and DNA hypomethylation were accompanied by increased
expression of Oct4, a marker of pluripotency, compared to control cells, thereby indicating
deregulation of differentiation. It is also of importance to note that RA treatment in the rat at
therapeutic doses was also sufficient for induction of hepatic GNMT, though DNA
methylation status was not assessed in that particular study (171).
Mechanistically, the increase in GNMT activity is likely mediated by the effect of
retinoids on hepatic folate metabolism. MTHFR activity was suppressed in rats fed a diet
high in retinyl acetate or retinyl palmitate, thereby decreasing 5-CH3-THF levels, presumably
relieving the allosteric inhibition of GNMT by 5-CH3-THF (173). RA treatment has also been
shown to increase hepatic MS activity (55,171). However, RA treatment was without effect
on PEMT, BHMT, and CBS (48,50,55). The impact of these perturbations on plasma
homocysteine and glutathione levels was varied, generally lowering or leaving plasma
homocysteine concentrations unchanged. Plasma homocysteine and glutathione levels
were unaffected by retinoid treatment alone (169,170), with one report of homocysteine
levels markedly decreased by 10 d of high-dose retinoid treatment (171). RA treatment has
also been shown to interact with other factors perturbing methyl group metabolism, such as
hypo- or hyperthyroidism and diabetes (48,51,55).
There are few reports of the effects of retinoid treatment on DNA methylation status.
Retinoic acid is also known to be teratogenic with central nervous system, ear, eye, and
craniofacial abnormalities being the most common developmental effects (160,166). In
mice, the treatment of dams with RA during pregnancy resulted in DNA hypomethylation of
both genomic and CpG island DNA within the palate of the affected offspring (174). In the
22
treatment of cancer, retinoids are used as differentiation therapy. This effect has been
studied in cancerous and embryonic stem cells models and is proposed to be due in part to
epigenetic regulation of imprinted genes and genes for telomerase and cellular regulatory
factors (175-177). Interestingly, evidence from acute promyelocytic leukemia cell lines and
blasts from patients, it appears that effects on epigenetic regulation may be mediated in part
by direct downregulation of the expression of DNMTs by RA (178). The effect of RA therapy
on DNA methylation has not been explored in the normal liver in rodents or humans.
Diabetes
Diabetes mellitus affects approximately 12% of the U.S. population and data
suggests that the incidence rate will continue to rise in the U.S. and worldwide over the next
several years (179). It is estimated that ninety-five percent of cases are type 2, while the
remaining 5% are type 1. Though both types of diabetes are characterized by altered
glucose metabolism and hyperglycemia, the pathologies of the diseases are different. Type
1 diabetes, often called insulin dependent diabetes mellitus, results from the loss of insulin-
producing pancreatic β-cells and consequently, a lack of insulin. Although the mechanisms
responsible for β-cell destruction are not entirely clear, in most cases it is proposed to be the
result of an autoimmune response that has been associated with exposures to particular
viruses and a genetic predisposition (180). Type 1 diabetic patients tend to develop the
disease early in life, which is why it has also been called childhood-onset diabetes. Type 2
diabetes had traditionally been thought of as adult-onset diabetes, but is becoming more
prevalent in children and adolescents (179). Type 2 diabetes, which is also known as non-
insulin dependent diabetes mellitus, is characterized by insulin resistance in which the cells
do not respond appropriately to insulin despite hyperinsulinemia (181,182). Insulin
resistance is proposed to develop from lipid overload, abnormal lipid metabolism, and
chronic inflammation (183). Over time, many type 2 diabetics also develop beta cell
dysfunction and impaired insulin secretion. The pathogenesis of type 2 diabetes is believed
to originate from a combination of genetic and lifestyle factors. Type 2 diabetes is often
clustered with the characteristics of metabolic syndrome, which includes abdominal obesity,
elevated serum triglycerides and/or depressed HDL-C, hypertension, and hyperglycemia or
insulin resistance (184). Notably, both types of diabetes are also associated with the
23
development of secondary complications including macrovascular (i.e. cardiovascular
disease, coronary heart disease, stroke) and microvascular (i.e. nephropathy, neuropathy,
retinopathy) diseases (179,182). Physiologically, both type 1 and 2 diabetic conditions are
also characterized by hyperglycemia and a relative excess of glucocorticoids compared to
insulin, whether based on actual concentrations or due to tissue insensitivity.
The rat models of both type 1 and type 2 diabetes used in our studies are well-
characterized and closely resemble the condition of human patients. Streptozotocin (STZ)
is used to induce a type 1 diabetic state, in part by producing an autoimmune response
against the pancreatic beta cells, similar to that observed in human type 1 diabetes (185).
Following STZ injection, symptoms of diabetes such as hyperglycemia, hyperphagia,
polyuria, and failure to gain or maintain weight manifest within days (186). For our type 2
model, we utilized the Zucker diabetic fatty (ZDF) rat which contains a mutation in the Lepr
gene, which encodes for the leptin receptor (187). This mutation results in an inability for
proper interaction between leptin and leptin receptor, thereby abrogating the suppressive
effect of leptin on appetite and insulin secretion. In this way, the pathogenesis of the ZDF
rat closely resembles the human type 2 diabetic condition with hyperinsulinemia,
progressing to hyperglycemia and eventual beta cell failure. Hyperinsulinemia is observed
very early in life, the initial rise in blood glucose occurs between 7 and 8 weeks of age, with
a frank diabetic condition presenting by 12 weeks, and beta cell failure occurring between
22 and 42 weeks in male ZDF rats (188). Both animal models are well-established and
have been used extensively for the study of diabetes-associated dyslipidemia (189,190),
atherosclerosis (191), abnormal vascular response (188,192), nephropathy (186,193,194),
retinopathy (195,196), and neuropathy (197,198). However, it may be noted that the STZ-
induced model of diabetes exhibits more moderate renal dysfunction than some other
models of type 1 diabetes (186), such as the nonobese diabetic mouse, which we have
used in subsequent studies.
Perturbations of hepatic methyl group and homocysteine metabolism, as well as the
net effect on plasma homocysteine levels, in an early diabetic condition has been well
characterized in rodents (Figure 2 ). Upregulation of transmethylation has been observed in
both rodent models and human patients. GNMT and PEMT are upregulated by
glucocorticoids, STZ- and alloxan-induced type 1 diabetes (32,48-50). Treatment of rats or
H4IIE rat hepatoma cells with the glucocorticoid dexamethasone
expression and activity (51). Admi
PEMT in the STZ-diabetic rat (49,50). Increased PEMT activity by STZ was associated with
a decreased ratio of PE to PC in the liver (50). GNMT wa
but PEMT expression in this model is unknown (52).
The remethylation and transsulfuration pathways are also affected in a diabetic
condition. There have been
as evidenced by reports of increased activity in respon
pre-diabetes (52), decreased activity in type 1 diabetes (49), and
H4IIE rat hepatoma cells with the glucocorticoid dexamethasone also induced
expression and activity (51). Administration of insulin normalized induction of GNMT and
diabetic rat (49,50). Increased PEMT activity by STZ was associated with
to PC in the liver (50). GNMT was also upregulated in the ZDF rat,
n in this model is unknown (52).
The remethylation and transsulfuration pathways are also affected in a diabetic
variable responses of MS and MTHFR to a diabetic condition
as evidenced by reports of increased activity in response to glucocorticoid treatment (60)
diabetes (52), decreased activity in type 1 diabetes (49), and no change in STZ
24
also induced GNMT
induction of GNMT and
diabetic rat (49,50). Increased PEMT activity by STZ was associated with
s also upregulated in the ZDF rat,
The remethylation and transsulfuration pathways are also affected in a diabetic
variable responses of MS and MTHFR to a diabetic condition
se to glucocorticoid treatment (60) or
no change in STZ-diabetes
25
(199) and early type 2 diabetes (52). In contrast, the effect of a diabetic condition on BHMT
is consistent and well-characterized. BHMT mRNA expression and/or activity were
increased in diabetic rats and in hepatoma cells treated with glucocorticoids (48-50,52,200);
this effect was reversed or attenuated with treatment by insulin in the STZ-induced diabetic
model (200). Hepatic CBS and CGL activities were increased in both glucagon-treated, as
well as STZ-diabetic and ZDF rats (48,52,126,201). CBS mRNA abundance was also
increased in glucocorticoid-treated hepatoma cells (201). Insulin abrogated the increases in
CBS activity (201,126). The effects of STZ-diabetes and insulin treatment were also
observed at the transcriptional level as evidenced by similar changes in CBS mRNA (201).
There have been very few studies of methyl group and homocysteine metabolism in
the diabetic kidney. House et al (126) reported a lack of effect of either glucagon treatment
or STZ-diabetes, whereas Jacobs et al (199) reported that renal MS and MTHFR activities
were suppressed by a type 1 diabetic condition. Methyl group and homocysteine
metabolism have not be investigated in the kidney of the ZDF rat. Thus, all changes
discussed thus far were observed in the liver and in an early diabetic condition (i.e. within 10
d of onset). The net effect of these perturbations results in lowered plasma homocysteine
levels (48-52). Early in the course of type 1 diabetes, diabetic patients also have been
found to have lower fasting and post-methionine load plasma homocysteine concentrations
relative to healthy controls (202). However, in advanced diabetes it has been shown that
MTHFR activity was suppressed in lymphocytes of diabetic patients (128) and both hepatic
transmethylation and transsulfuration flux were decreased in diabetic nephropathy (129).
This occurrence of metabolic disturbance in advanced diabetes, concurrent with the
development of hyperhomocysteinemia in diabetic nephropathy (128,203) suggests the
need to study the chronic diabetic condition, with particular attention to the influence of both
the liver and the kidney.
Recently, diabetes has also been associated with alterations of epigenetic
mechanisms, specifically histone modifications. These studies of both cell culture and
mouse models of hyperglycemia or diabetes have identified pathways or categories of
genes with altered patterns of histone methylation. The targets of this regulation include
proteins involved in signal transduction, oxidative stress, immune function, and inflammatory
pathways (204-208). These effects were maintained even after the restoration of
normoglycemia, suggesting a “metabolic memory” (204-206) which should be characteristic
26
of true epigenetic regulation. The alterations of histone modifications were also cell-type
specific (207,208). This highlights the need for study of epigenetic regulation in the tissue of
interest whenever possible. Efforts should also be made to profile DNA methylation status
of genome to complement this knowledge of histone modifications.
Our long-range goal is to understand how diabetes-mediated alterations in metabolic
processes may serve as a link to the numerous complications associated with diabetes, and
how dietary intervention can prevent these adverse effects. The focus of the studies
presented here was on perturbations of key enzymes and metabolites of methyl group and
homocysteine metabolism that occur in both type 1 and type 2 diabetes, and how these
changes may be linked to alterations of epigenetic regulation. To date, most studies have
assessed only hepatic metabolism in the early diabetic condition and epigenetic regulation
in diabetes has not been fully addressed within tissues of interest. This includes the liver,
kidney, and heart as tissues which contain the full complement of methyl group and
homocysteine metabolic pathways and/or are affected by the secondary pathologies of
diabetes. Lack of such knowledge is an important problem, because understanding the
metabolic link between these processes is essential for establishing dietary
recommendations for preventing metabolic and epigenetic aberrations which may be related
to secondary complications of diabetes, a major focal point for future research.
Literature Cited
1. Finkelstein JD. Pathways and regulation of homocysteine metabolism in mammals. Semin Thromb Memost. 2000;26:219-25.
2. Cabrero C, Puerta J, Alemany S. Purification and comparison of two forms of S-adenosyl-L-methionine synthetase from rat liver. Eur J Biochem. 1987;170:299-304.
3. Sullivan DM, Hoffman JL. Fractionation and kinetic properties of rat liver and kidney methionine adenosyltransferase isozymes. Biochemistry. 1983;22:1636-41.
4. Katz JE, Dlakić M, Clarke S. Automated identification of putative methyltransferases from genomic open reading frames. Mol Cell Proteomics. 2003;2:525-40.
5. Vance DE, Li Z, Jacobs RL. Hepatic phosphatidylethanolamine N-methyltransferase, unexpected roles in animal biochemistry and physiology. J Biol Chem. 2007;282:33237-41.
6. Walsh C. Posttranslational modification of proteins: expanding nature's inventory. New York: Roberts and Co. Publishers, 2006, pp 121-149.
27
7. Helm M. Post-transcriptional nucleotide modification and alternative folding of RNA. Nucleic Acids Res. 2006;34:721-33.
8. Dunn BK. Hypomethylation: one side of a larger picture. Ann N Y Acad Sci. 2003;983:28-42.
9. Miller AL. The methylation, neurotransmitter, and antioxidant connections between folate and depression. Altern Med Rev. 2008;13:216-26.
10. Meganathan R. Biosynthesis of menaquinone (vitamin K2) and ubiquinone (coenzyme Q): a perspective on enzymatic mechanisms. Vitam Horm. 2001;61:173-218.
11. de la Haba G, Cantoni JL. The enzymatic synthesis of S-adenosyl-l-homocysteine from adenosine and homocysteine. J Biol Chem. 1959;234:603-8.
12. Zou CG, Banerjee R. Homocysteine and redox signaling. Antioxid Redox Signal. 2005;7:547-59.
13. Kerins DM, Koury MJ, Capdevila A, Rana S, Wagner C. Plasma S-adenosylhomocysteine is a more sensitive indicator of cardiovascular disease than plasma homocysteine. Am J Clin Nutr. 2001;74:723-9.
14. Wagner C, Stone WJ, Koury MJ, Dupont WD, Kerins DM. S-adenosylhomocysteine is a more sensitive indicator of renal insufficiency than homocysteine. Nutr Res. 2004;24:487-94.
15. Wagner C, Koury MJ. S-Adenosylhomocysteine: a better indicator of vascular disease than homocysteine? Am J Clin Nutr. 2007;86:1581-5.
16. Liu C, Wang Q, Guo H, Xia M, Yuan Q, Hu Y, Zhu H, Hou M, Ma J, Tang Z, Lin W. Plasma S-adenosylhomocysteine is a better biomarker of atherosclerosis than homocysteine in apolipoprotein E-deficient mice fed high dietary methionine. J Nutr. 2008;138:311-5.
17. Mudd SH, Ebert MH, Scriver CR. Labile methyl group balances in the human: the role of sarcosine. Metabolism. 1980;29:707-20.
18. Stead LM, Brosnan JT, Brosnan ME, Vance DE, Jacobs RL. Is it time to reevaluate methyl balance in humans? Am J Clin Nutr. 2006;83:5-10.
19. Stead LM, Au KP, Jacobs RL, Brosnan ME, Brosnan JT. Methylation demand and homocysteine metabolism: effects of dietary provision of creatine and guanidinoacetate. Am J Physiol Endocrinol Metab. 2001;281:E1095-100.
20. Deminice R, Portari GV, Vannucchi H, Jordao AA. Effects of creatine supplementation on homocysteine levels and lipid peroxidation in rats. Br J Nutr. 2009;102:110-6.
21. Navrátil T, Kohlíková E, Petr M, Pelclová D, Heyrovský M, Přistoupil TI, Přistoupilová K. Supplemented creatine induces chanes in human metabolism of thiocompounds and one-and two carbon units. Physiol Res. 2009 [Epub Feb 27 2009]
22. Jahangir E, Vita JA, Handy D, Holbrook M, Palmisano J. Beal R. Loscalzo J. Eberhardt RT. The effect of L-arginine and creatine on vascular function and homocysteine metabolism. Vasc Med. 2009;14:239-48.
23. Korzun WJ. Oral creatine supplements lower plasma homocysteine concentrations in humans. Clin Lab Sci. 2004;17:102-6.
28
24. Steenge GR, Verhoef P, Greenhaff PL. The effect of creatine and resistance training on plasma homocysteine concentration in healthy volunteers. Arch Intern Med. 2001;161:1455-6.
25. Taes YE, Delanghe JR, De Bacquer D, Langlois M, Stevens L, Geerolf I, Lameire NH, De Vriese AS. Creatine supplementation does not decrease total plasma homocysteine in chronic hemodialysis patients. Kidney Int. 2004;66:2422-8.
26. DeLong CJ, Shen YJ, Thomas MJ, Cui Z. Molecular distinction of phosphatidylcholine synthesis between the CDP-choline pathway and phosphatidylethanolamine methylation pathway. J Biol Chem. 1999;274:29683-8.
27. Jacobs RL, Stead LM, Devlin C, Tabas I, Brosnan ME, Brosnan JT, Vance DE. Physiological regulation of phospholipid methylation alters plasma homocysteine in mice. J Biol Chem. 2005;280:28299-305.
28. Noga AA, Stead LM, Zhao Y, Brosnan ME, Brosnan JT, Vance DE. Plasma homocysteine is regulated by phospholipid methylation. J Biol Chem. 2003;278:5952-5.
29. Zhu X, Song J, Mar MH, Edwards LJ, Zeisel SH. Phosphatidylethanolamine N-methyltransferase (PEMT) knockout mice have hepatic steatosis and abnormal hepatic choline metabolite concentrations despite ingesting a recommended dietary intake of choline. Biochem J. 2003;15;370:987-93.
30. Zhao Y, Su B, Jacobs RL, Kennedy B, Francis GA, Waddington E, Brosnan JT, Vance JE, Vance DE. Lack of phosphatidylethanolamine N-methyltransferase alters plasma VLDL phospholipids and attenuates atherosclerosis in mice. Arterioscler Thromb Vasc Biol. 2009;29:1349-55.
31. Kerr SJ. Competing methyltransferase systems. J Biol Chem. 1972;247:4248-52. 32. Yeo EJ, Wagner C. Tissue distribution of glycine N-methyltransferase, a major folate-
binding protein of liver. Proc Natl Acad Sci U S A. 1994;91:210-4. 33. Chen YM, Liao YJ, Liu SP, Tsai TF. Phenotypic differences between two Gnmt-/-
mouse models for hepatocellular carcinoma. Hepatology. 2009;49:2130-1; author reply 2131.
34. Luka Z, Capdevila A, Mato JM, Wagner C. A glycine N-methyltransferase knockout mouse model for humans with deficiency of this enzyme. Transgenic Res. 2006;15:393-7.
35. Liu SP, Li YS, Chen YJ, Chiang EP, Li AF, Lee YH, Tsai TF, Hsiao M, Huang SF, Chen YM. Glycine N-methyltransferase-/- mice develop chronic hepatitis and glycogen storage disease in the liver. Hepatology. 2007;46:1413-25.
36. Martínez-Chantar ML, Vázquez-Chantada M, Ariz U, Martínez N, Varela M, Luka Z, Capdevila A, Rodríguez J, Aransay AM, Matthiesen R, Yang H, Calvisi DF, Esteller M, Fraga M, Lu SC, Wagner C, Mato JM. Loss of the glycine N-methyltransferase gene leads to steatosis and hepatocellular carcinoma in mice. Hepatology. 2008;47:1191-9.
37. Liao YJ, Liu SP, Lee CM, Yen CH, Chuang PC, Chen CY, Tsai TF, Huang SF, Lee YH, Chen YM. Characterization of a glycine N-methyltransferase gene knockout
29
mouse model for hepatocellular carcinoma: Implications of the gender disparity in liver cancer susceptibility. Int J Cancer. 2009;124:816-26.
38. Chen YM, Shiu JY, Tzeng SJ, Shih LS, Chen YJ, Lui WY, Chen PH. Characterization of glycine N-methyltransferase-gene expression in human hepatocellular carcinoma. Int J Cancer. 1998;75:787-93.
39. Liu HH, Chen KH, Shih YP, Lui WY, Wong FH, Chen YM. Characterization of reduced expression of glycine N-methyltransferase in cancerous hepatic tissues using two newly developed monoclonal antibodies. J Biomed Sci. 2003;10:87-97.
40. Huang YC, Lee CM, Chen M, Chung MY, Chang YH, Huang WJ, Ho DM, Pan CC, Wu TT, Yang S, Lin MW, Hsieh JT, Chen YM. Haplotypes, loss of heterozygosity, and expression levels of glycine N-methyltransferase in prostate cancer. Clin Cancer Res. 2007;13:1412-20.
41. Bhat R, Wagner C, Bresnick E. The homodimeric form of glycine N-methyltransferase acts as a polycyclic aromatic hydrocarbon-binding receptor. Biochemistry. 1997;36:9906-10.
42. Chen SY, Lin JR, Darbha R, Lin P, Liu TY, Chen YM. Glycine N-methyltransferase tumor susceptibility gene in the benzo(a)pyrene-detoxification pathway. Cancer Res. 2004;64:3617-23.
43. Yen CH, Hung JH, Ueng YF, Liu SP, Chen SY, Liu HH, Chou TY, Tsai TF, Darbha R, Hsieh LL, Chen YM. Glycine N-methyltransferase affects the metabolism of aflatoxin B1 and blocks its carcinogenic effect. Toxicol Appl Pharmacol. 2009;235:296-304.
44. da Silva RP, Nissim I, Brosnan ME, Brosnan JT. Creatine synthesis: hepatic metabolism of guanidinoacetate and creatine in the rat in vitro and in vivo. Am J Physiol Endocrinol Metab. 2009;296:E256-61.
45. Brosnan ME, Edison EE, da Silva R, Brosnan JT. New insights into creatine function and synthesis. Adv Enzyme Regul. 2007;47:252-60.
46. Drouva SV, Rerat E, Leblanc P, Laplante E, Kordon C. Variations of phospholipid methyltransferase(s) activity in the rat pituitary: estrous cycle and sex differences. Endocrinology. 1987;121:569-74.
47. McMullen MH, Rowling MJ, Ozias MK, Schalinske KL. Activation and induction of glycine N-methyltransferase by retinoids are tissue- and gender-specific. Arch Biochem Biophys. 2002;401:73-80.
48. Nieman KM, Rowling MJ, Garrow TA, Schalinske KL. Modulation of methyl group metabolism by streptozotocin-induced diabetes and all-trans-retinoic acid. J Biol Chem. 2004;279:45708-12.
49. Nieman KM, Hartz CS, Szegedi SS, Garrow TA, Sparks JD, Schalinske KL. Folate status modulates the induction of hepatic glycine N-methyltransferase and homocysteine metabolism in rats. Am J Physiol Endocrinol Metab. 2006;291:E1235-42.
50. Hartz CS, Nieman KM, Jacobs RL, Vance DE, Schalinske KS. Hepatic phosphatidylethanolamine N-methyltransferase expression is increased in diabetic rats. J Nutr. 2006;136:3005-9.
30
51. Rowling MJ, Schalinske KL. Retinoic acid and glucocorticoid treatment induce hepatic glycine N-methyltransferase and lower plasma homocysteine concentrations in rats and rat hepatoma cells. J Nutr. 2003;133:3392-8.
52. Wijekoon EP, Hall B, Ratnam S, Brosnan ME, Zeisel SH, Brosnan JT. Homocysteine metabolism in ZDF (type 2) diabetic rats. Diabetes. 2005;54:3245-51.
53. Uthus EO, Brown-Borg HM. Altered methionine metabolism in long living Ames dwarf mice. Exp Gerontol. 2003;38:491-8.
54. Uthus EO, Brown-Borg HM. Methionine flux to transsulfuration is enhanced in the long living Ames dwarf mouse. Mech Ageing Dev. 2006;127:444-50.
55. Tanghe KA, Garrow TA, Schalinske KL. Triiodothyronine treatment attenuates the induction of hepatic glycine N-methyltransferase by retinoic acid and elevates plasma homocysteine concentrations in rats. J Nutr. 2004;134:2913-8.
56. Wagner C, Briggs WT, Cook RJ. Inhibition of glycine N-methyltransferase activity by folate derivatives: implications for regulation of methyl group metabolism. Biochem Biophys Res Commun. 1985;127:746-52.
57. Wagner C, Decha-Umphai W, Corbin J. Phosphorylation modulates the activity of glycine N-methyltransferase, a folate binding protein. In vitro phosphorylation is inhibited by the natural folate ligand. J Biol Chem. 1989;264:9638-42.
58. Kutzbach C, Stokstad EL. Mammalian methylenetetrahydrofolate reductase. Partial purification, properties, and inhibition by S-adenosylmethionine. Biochim Biophys Acta. 1971;250:459-77.
59. Shane B, Stokstad EL. Vitamin B12-folate interrelationships. Annu Rev Nutr. 1985;5:115-41.
60. Finkelstein JD, Martin JJ, Kyle WE, Harris BJ. Methionine metabolism in mammals: regulation of methylenetetrahydrofolate reductase content of rat tissues. Arch Biochem Biophys. 1978;191:153-60.
61. Swanson DA, Liu ML, Baker PJ, Garrett L, Stitzel M, Wu J, Harris M, Banerjee R, Shane B, Brody LC. Targeted disruption of the methionine synthase gene in mice. Mol Cell Biol. 2001;21:1058-65.
62. Chen Z, Karaplis AC, Ackerman SL, Pogribny IP, Melnyk S, Lussier-Cacan S, Chen MF, Pai A, John SW, Smith RS, Bottiglieri T, Bagley P, Selhub J, Rudnicki MA, James SJ, Rozen R. Mice deficient in methylenetetrahydrofolate reductase exhibit hyperhomocysteinemia and decreased methylation capacity, with neuropathology and aortic lipid deposition. Hum Mol Genet. 2001;10:433-43.
63. Delgado-Reyes CV, Wallig MA, Garrow TA. Immunohistochemical detection of betaine-homocysteine S-methyltransferase in human, pig, and rat liver and kidney. Arch Biochem Biophys. 2001;393:184-6.
64. Collinsova M, Strakova J, Jiracek J, Garrow TA. Inhibition of betaine-homocysteine S-methyltransferase causes hyperhomocysteinemia in mice. J Nutr. 2006;136:1493-7.
65. Pajares MA, Pérez-Sala D. Betaine homocysteine S-methyltransferase: just a regulator of homocysteine metabolism? Cell Mol Life Sci. 2006;63:2792-803.
31
66. Wang L, Jhee KH, Hua X, DiBello PM, Jacobsen DW, Kruger WD. Modulation of cystathionine β-synthase level regulates total serum homocysteine in mice. Circ Res. 2004;94:1318-24.
67. Watanabe M, Osada J, Aratani Y, Kluckman K, Reddick R, Malinow MR, Maeda N. Mice deficient in cystathionine beta-synthase: animal models for mild and severe homocyst(e)inemia. Proc Natl Acad Sci U S A. 1995;92:1585-9.
68. Finkelstein JD, Kyle WE, Martin JJ. Pick A. Activation of cystathionine synthase by adenosylmethionine and adenosylethionine. Biochem Biophys Res Commun. 1975;66:81-7.
69. Tang C, Li X, Du J. Hydrogen sulfide as a new endogenous gaseous transmitter in the cardiovascular system. Curr Vasc Pharmacol. 2006;4:17-22.
70. Ogawa H, Fujioka M. Induction of rat liver glycine methyltransferase by high methionine diet. Biochem Biophys Res Commun. 1982;108:227-32.
71. Rowling MJ, McMullen MH, Chipman DC, Schalinske KL. Hepatic glycine N-methyltransferase is up-regulated by excess dietary methionine in rats. J Nutr. 2002;132:2545-50.
72. Finkelstein JD. Methionine metabolism in mammals. J Nutr Biochem. 1990;1:228-37. 73. Park EI, Garrow TA. Interaction between dietary methionine and methyl donor intake
on rat liver betaine-homocysteine methyltransferase gene expression and organization of the human gene. J Biol Chem. 1999;274:7816-24.
74. Balaghi M, Horne DW, Wagner C. Hepatic one-carbon metabolism in early folate deficiency in rats. Biochem J. 1993;291:145-9.
75. Balaghi M, Horne DW, Woodward SC, Wagner C. Pancreatic one-carbon metabolism in early folate deficiency in rats. Am J Clin Nutr. 1993;58:198-203.
76. Niculescu MD, Zeisel SH. Diet, methyl donors and DNA methylation: interactions between dietary folate, methionine and choline. J Nutr. 2002;132:2333S-2335S.
77. Schwab U, Törrönen A, Meririnne E, Saarinen M, Alfthan G, Aro A, Uusitupa M. Orally administered betaine has an acute and dose-dependent effect on serum betaine and plasma homocysteine concentrations in healthy humans. J Nutr. 2006;136:34-8.
78. Kang SS, Wong PWK, Malinow MR. Hyperhomocyst(e)inemia as a risk factor for occlusive vascular disease. Annu Rev Nutr. 1992;12:279-98.
79. McCully KS. Chemical pathology of homocysteine. II. Carcinogenesis and homocysteine thiolactone metabolism. Ann Clin Lab Sci. 1994;24:27-59.
80. Mattson MP, Shea TB. Folate and homocysteine metabolism in neural plasticity and neurodegenerative disorders. Trends Neurosci. 2003;26:137-46.
81. Campbell RK. Type 2 diabetes: where we are today: an overview of disease burden, current treatments, and treatment strategies. J Am Pharm Assoc. 2009;49:S3-9.
82. Refsum H, Nurk E, Smith AD, Ueland PM, Gjesdal CG, Bjelland I, Tverdal A, Tell GS, Nygård O, Vollset SE. The Hordaland Homocysteine Study: a community-based study of homocysteine, its determinants, and associations with disease. J Nutr. 2006;136:1731S-1740S.
32
83. Friso S, Choi SW. Gene-nutrient interactions in one-carbon metabolism. Curr Drug Metab. 2005;6:37-46.
84. Silaste ML, Rantala M, Sämpi M, Alfthan G, Aro A, Kesäniemi YA. Polymorphisms of key enzymes in homocysteine metabolism affect diet responsiveness of plasma homocysteine in healthy women. J Nutr. 2001;131:2643-7.
85. Beagle B, Yang TL, Hung J, Cogger EA, Moriarty DJ, Caudill MA. The glycine N-methyltransferase (GNMT) 1289 C->T variant influences plasma total homocysteine concentrations in young women after restricting folate intake. J Nutr. 2005;135:2780-5.
86. Finkelstein JD. Inborn errors of sulfur-containing amino acid metabolism. J Nutr. 2006;136:1750S-1754S.
87. Chambers JC, Ueland PM, Obeid OA, Wrigley J, Refsum H, Kooner JS. Improved vascular endothelial function after oral B vitamins: an effect mediated through reduced concentrations of free plasma homocysteine. Circulation. 2000;102:2479-83.
88. Schnyder G, Roffi M, Flammer Y, Pin R, Hess OM. Effect of homocysteine-lowering therapy with folic acid, vitamin B12, and vitamin B6 on clinical outcome after percutaneous coronary intervention: the Swiss Heart study: a randomized controlled trial. JAMA. 2002;288:973-9.
89. Schnyder G, Roffi M, Pin R, Flammer Y, Lange H, Eberli FR, Meier B, Turi ZG, Hess OM. Decreased rate of coronary restenosis after lowering of plasma homocysteine levels. N Engl J Med. 2001;345:1593-600.
90. Title LM, Cummings PM, Giddens K, Genest JJ Jr, Nassar BA. Effect of folic acid and antioxidant vitamins on endothelial dysfunction in patients with coronary artery disease. J Am Coll Cardiol. 2000;26:758-65.
91. Woo KS, Chook P, Lolin YI, Sanderson JE, Metreweli C, Celermajer DS. Folic acid improves arterial endothelial function in adults with hyperhomocystinemia. J Am Coll Cardiol. 1999;34:2002-6.
92. Bønaa KH, Njølstad I, Ueland PM, Schirmer H, Tverdal A, Steigen T, Wang H, Nordrehaug JE, Arnesen E, Rasmussen K; NORVIT Trial Investigators. Homocysteine lowering and cardiovascular events after acute myocardial infarction. N Engl J Med. 2006;354:1578-88.
93. Bleie Ø, Semb AG, Grundt H, Nordrehaug JE, Vollset SE, Ueland PM, Nilsen DW, Bakken AM, Refsum H, Nygård OK. Homocysteine-lowering therapy does not affect inflammatory markers of atherosclerosis in patients with stable coronary artery disease. J Intern Med. 2007;262:244-53.
94. Ebbing M, Bleie Ø, Ueland PM, Nordrehaug JE, Nilsen DW, Vollset SE, Refsum H, Pedersen EK, Nygård O. Mortality and cardiovascular events in patients treated with homocysteine-lowering B vitamins after coronary angiography: a randomized controlled trial. JAMA. 2008;300:795-804.
95. Lonn E, Yusuf S, Arnold MJ, Sheridan P, Pogue J, Micks M, McQueen MJ, Probstfield J, Fodor G, Held C, Genest J Jr; Heart Outcomes Prevention Evaluation
33
(HOPE) 2 Investigators. Homocysteine lowering with folic acid and B vitamins in vascular disease. N Engl J Med. 2006;354:1567-77.
96. Potter K, Hankey GJ, Green DJ, Eikelboom J, Jamrozik K, Arnolda LF. The effect of long-term homocysteine-lowering on carotid intima-media thickness and flow-mediated vasodilation in stroke patients: a randomized controlled trial and meta-analysis. BMC Cardiovasc Disord. 2008;8:24.
97. Ray JG, Kearon C, Yi Q, Sheridan P, Lonn E; Heart Outcomes Prevention Evaluation 2 (HOPE-2) Investigators. Homocysteine-lowering therapy and risk for venous thromboembolism: a randomized trial. Ann Intern Med. 2007;146:761-7.
98. Albert CM, Cook NR, Gaziano JM, Zaharris E, MacFadyen J, Danielson E, Buring JE, Manson JE. Effect of folic acid and B vitamins on risk of cardiovascular events and total mortality among women at high risk for cardiovascular disease: a randomized trial. JAMA. 2008;299:2027-36.
99. den Heijer M, Willems HP, Blom HJ, Gerrits WB, Cattaneo M, Eichinger S, Rosendaal FR, Bos GM. Homocysteine lowering by B vitamins and the secondary prevention of deep vein thrombosis and pulmonary embolism: A randomized, placebo-controlled, double-blind trial. Blood. 2007;109:139-44.
100. Jamison RL, Hartigan P, Kaufman JS, Goldfarb DS, Warren SR, Guarino PD, Gaziano JM; Veterans Affairs Site Investigators. Effect of homocysteine lowering on mortality and vascular disease in advanced chronic kidney disease and end-stage renal disease: a randomized controlled trial. JAMA. 2007;298:1163-70.
101. Toole JF, Malinow MR, Chambless LE, Spence JD, Pettigrew LC, Howard VJ, Sides EG, Wang CH, Stampfer M. Lowering homocysteine in patients with ischemic stroke to prevent recurrent stroke, myocardial infarction, and death: the Vitamin Intervention for Stroke Prevention (VISP) randomized controlled trial. JAMA 2004;291:565-575.
102. Potter K, Lenzo N, Eikelboom JW, Arnolda LF, Beer C, Hankey GJ. Effect of long-term homocysteine reduction with B vitamins on arterial wall inflammation assessed by fluorodeoxyglucose positron emission tomography: a randomised double-blind, placebo-controlled trial. Cerebrovasc Dis. 2009;27:259-65.
103. Mann JF, Sheridan P, McQueen MJ, Held C, Arnold JM, Fodor G, Yusuf S, Lonn EM; HOPE-2 investigators. Homocysteine lowering with folic acid and B vitamins in people with chronic kidney disease--results of the renal Hope-2 study. Nephrol Dial Transplant. 2008;23:645-53.
104. Dusitanond P, Eikelboom JW, Hankey GJ, Thom J, Gilmore G, Loh K, Yi Q, Klijn CJ, Langton P, van Bockxmeer FM, Baker R, Jamrozik K. Homocysteine-lowering treatment with folic acid, cobalamin, and pyridoxine does not reduce blood markers of inflammation, endothelial dysfunction, or hypercoagulability in patients with previous transient ischemic attack or stroke: a randomized substudy of the VITATOPS trial. Stroke. 2005;36:144-6.
105. Nafar M, Khatami F, Kardavani B, Farjad R, Pour-Reza-Gholi F, Firouzan A, Kalantar A, Farhangi S, Einollahi B. Role of folic acid in atherosclerosis after kidney transplant: a double-blind, randomized, placebo-controlled clinical trial. Exp Clin Transplant. 2009;7:33-9.
34
106. Moens AL, Claeys MJ, Wuyts FL, Goovaerts I, Van Hertbruggen E, Wendelen LC, Van Hoof VO, Vrints CJ. Effect of folic acid on endothelial function following acute myocardial infarction. Am J Cardiol. 2007;99:476-81.
107. Title LM, Ur E, Giddens K, McQueen MJ, Nassar BA. Folic acid improves endothelial dysfunction in type 2 diabetes – an effect independent of homocysteine-lowering. Vasc Med. 2006;11:101-9.
108. Held C, Sumner G, Sheridan P, McQueen M, Smith S, Dagenais G, Yusuf S, Lonn E. Correlations between plasma homocysteine and folate concentrations and carotid atherosclerosis in high-risk individuals: baseline data from the Homocysteine and Atherosclerosis Reduction Trial (HART). Vasc Med. 2008;13:245-53.
109. Bostom AG, Carpenter MA, Hunsicker L, Jacques PF, Kusek JW, Levey AS, McKenney JL, Mercier RY, Pfeffer MA, Selhub J; FAVORIT Study Investigators. Baseline characteristics of participants in the Folic Acid for Vascular Outcome Reduction in Transplantation (FAVORIT) Trial. Am J Kidney Dis. 2009;53:121-8.
110. Kang JH, Cook N, Manson J, Buring JE, Albert CM, Grodstein F. A trial of B vitamins and cognitive function among women at high risk of cardiovascular disease. Am J Clin Nutr. 2008;88:1602-10.
111. Aisen PS, Schneider LS, Sano M, Diaz-Arrastia R, van Dyck CH, Weiner MF, Bottiglieri T, Jin S, Stokes KT, Thomas RG, Thal LJ; Alzheimer Disease Cooperative Study. High-dose B vitamin supplementation and cognitive decline in Alzheimer disease: a randomized controlled trial. JAMA. 2008;300:1774-83.
112. Sun Y, Lu CJ, Chien KL, Chen ST, Chen RC. Efficacy of multivitamin supplementation containing vitamins B6 and B12 and folic acid as adjunctive treatment with a cholinesterase inhibitor in Alzheimer's disease: a 26-week, randomized, double-blind, placebo-controlled study in Taiwanese patients. Clin Ther. 2007;29:2204-14.
113. Herrmann M, Umanskaya N, Traber L, Schmidt-Gayk H, Menke W, Lanzer G, Lenhart M, Peter Schmidt J, Herrmann W. The effect of B-vitamins on biochemical bone turnover markers and bone mineral density in osteoporotic patients: a 1-year double blind placebo controlled trial. Clin Chem Lab Med.;45:1785-92.
114. Herrmann M, Stanger O, Paulweber B, Hufnagl C, Herrmann W. Folate supplementation does not affect biochemical markers of bone turnover. Clin Lab. 2006;52:131-6.
115. Sato Y, Honda Y, Iwamoto J, Kanoko T, Satoh K. Effect of folate and mecobalamin on hip fractures in patients with stroke: a randomized controlled trial. JAMA. 2005;293:1082-8.
116. Christen WG, Glynn RJ, Chew EY, Albert CM, Manson JE. Folic acid, pyridoxine, and cyanocobalamin combination treatment and age-related macular degeneration in women: the Women's Antioxidant and Folic Acid Cardiovascular Study. Arch Intern Med. 2009;169:335-41.
117. Saposnik G, Ray JG, Sheridan P, McQueen M, Lonn E; Heart Outcomes Prevention Evaluation 2 Investigators. Homocysteine-lowering therapy and stroke risk, severity, and disability: additional findings from the HOPE 2 trial. Stroke. 2009;40:1365-72.
35
118. Hodis HN, Mack WJ, Dustin L, Mahrer PR, Azen SP, Detrano R, Selhub J, Alaupovic P, Liu CR, Liu CH, Hwang J, Wilcox AG, Selzer RH; BVAIT Research Group. High-dose B vitamin supplementation and progression of subclinical atherosclerosis: a randomized controlled trial. Stroke. 2009;40:730-6.
119. Caudill MA, Wang JC, Melnyk S, Pogribny IP, Jernigan S, Collins MD, Santos-Guzman J, Swendseid ME, Cogger EA, James SJ. Intracellular S-adenosylhomocysteine concentrations predict global DNA hypomethylation in tissues of methyl-deficient cystathionine beta-synthase heterozygous mice. J Nutr. 2001;131:2811-8.
120. Stam F, van Guldener C, ter Wee PM, Kulik W, Smith DE, Jakobs C, Stehouwer CD, de Meer K. Homocysteine clearance and methylation flux rates in health and end-stage renal disease: association with S-adenosylhomocysteine. Am J Physiol Renal Physiol. 2004;287:F215-23.
121. Chagoya de Sánchez V, Hernández-Muñoz R, Sánchez L, Vidrio S, Yáñez L, Suárez J. Twenty-four-hour changes of S-adenosylmethionine, S-adenosylhomocysteine adenosine and their metabolizing enzymes in rat liver; possible physiological significance in phospholipid methylation. Int J Biochem. 1991;23:1439-43.
122. Castro R, Rivera I, Martins C, Struys EA, Jansen EE, Clode N, Graça LM, Blom HJ, Jakobs C, de Almeida IT. Intracellular S-adenosylhomocysteine increased levels are associated with DNA hypomethylation in HUVEC. J Mol Med. 2005;83:831-6.
123. Zhu X, Mar MH, Song J, Zeisel SH. Deletion of the Pemt gene increases progenitor cell mitosis, DNA and protein methylation and decreases calretinin expression in embryonic day 17 mouse hippocampus. Brain Res Dev Brain Res. 2004;149:121-9.
124. Garibotto G, Valli A, Anderstam B, Eriksson M, Suliman ME, Balbi M, Rollando D, Vigo E, Lindholm B. The kidney is the major site of S-adenosylhomocysteine disposal in humans. Kidney Int. 2009;76:293-6.
125. Bostom A, Brosnan JT, Hall B, Nadeau MR, Selhub J. Net uptake of plasma homocysteine by the rat kidney in vivo. Atherosclerosis. 1995;116:59-62.
126. House JD, Brosnan ME, Brosnan JT. Characterization of homocysteine metabolism in the rat kidney. Biochem J. 1997;328:287-92.
127. House JD, Brosnan ME, Brosnan JT. Renal uptake and excretion of homocysteine in rats with acute hyperhomocysteinemia. Kidney Int. 1998;54:1601-7.
128. Poirier LA, Brown AT, Fink LM, Wise CK, Randolph CJ, Delongchamp RR, Fonseca VA. S-adenosylmethionine concentrations and lymphocyte methylenetetrahydrofolate reductase activity in diabetes mellitus and diabetic nephropathy. Metabolism. 2001;50:1014-8.
129. Tessari P, Coracina A, Kiwanuka E, Vedovato M, Vettore M, Valerio A, Zaramella M, Garibotto G. Effects of insulin on methionine and homocysteine kinetics in type 2 diabetes with nephropathy. Diabetes. 2005;54:2968-76.
130. Reed MC, Nijhout HF, Sparks R, Ulrich CM. A mathematical model of the methionine cycle. J Theor Biol. 2004;226:33-43.
131. Wilson FA, van den Borne JJ, Calder AG, O'Kennedy N, Holtrop G, Rees WD, Lobley GE. Tissue methionine cycle activity and homocysteine metabolism in female
36
rats: impact of dietary methionine and folate plus choline. Am J Physiol Endocrinol Metab. 2009;296:E702-13.
132. Waddington CH. The epigenotype. Endeavour. 1942;1:18-20. 133. Haig D. The (dual) origin of epigenetics. Cold Spring Harb Symp Quant Biol.
2004;69:67-70. 134. Illingworth RS, Bird AP. CpG islands--'a rough guide'. FEBS Lett. 2009;583:1713-20. 135. Ioshikhes IP, Zhang MQ. Large-scale human promoter mapping using CpG islands.
Nat Genet. 2000;26:61-3. 136. Zaina S, Lindholm MW, Lund G. Nutrition and aberrant DNA methylation patterns in
atherosclerosis: more than just hyperhomocysteinemia? J Nutr. 2005;135:5-8. 137. Chen T, Li E. Establishment and maintenance of DNA methylation patterns in
mammals. Curr Top Microbiol Immunol. 2006;301:179-201. 138. Okano M, Xie S, Li E. Cloning and characterization of a family of novel mammalian
DNA (cytosine-5) methyltransferases. Nat Genet. 1998;19:219-20. 139. Suetake I, Shinozaki F, Miyagawa J, Takeshima H, Tajima S. DNMT3L stimulates
the DNA methylation activity of Dnmt3a and Dnmt3b through a direct interaction. J Biol Chem. 2004;279:27816-23.
140. Schermelleh L, Haemmer A, Spada F, Rösing N, Meilinger D, Rothbauer U, Cardoso MC, Leonhardt H. Dynamics of Dnmt1 interaction with the replication machinery and its role in postreplicative maintenance of DNA methylation. Nucleic Acids Res. 2007;35:4301-12.
141. Klose RJ, Bird AP. Genomic DNA methylation: the mark and its mediators. Trends Biochem Sci. 2006;31:89-97.
142. Fuks F. DNA methylation and histone modifications: teaming up to silence genes. Curr Opin Genet Dev. 2005;15:490-5.
143. Fischle W. Talk is cheap--cross-talk in establishment, maintenance, and readout of chromatin modifications. Genes Dev. 2008;22:3375-82.
144. Schnitzler GR. Chromatin remodeling and histone modifications. In: Nutrients and Epigenetics, ed. Choi SW, Friso S. Boca Raton, FL: CRC Press, 2009.
145. Zempleni J, Chew YC, Bao B, Pestinger V, Wijeratne SS. Repression of transposable elements by histone biotinylation. J Nutr. 2009;139:2389-92.
146. Strahl BD, Allis CD. The language of covalent histone modifications. Nature. 2000;403:41-5.
147. Costa FF. Non-coding RNAs, epigenetics and complexity. Gene. 2008;410:9-17. 148. Fraga MF, Ballestar E, Paz MF, Ropero S, Setien F, Ballestar ML, Heine-Suñer D,
Cigudosa JC, Urioste M, Benitez J, Boix-Chornet M, Sanchez-Aguilera A, Ling C, Carlsson E, Poulsen P, Vaag A, Stephan Z, Spector TD, Wu YZ, Plass C, Esteller M. Epigenetic differences arise during the lifetime of monozygotic twins. Proc Natl Acad Sci U S A. 2005;102:10604-9.
149. James SJ, Pogribny IP, Pogribna M, Miller BJ, Jernigan S, Melnyk S. Mechanisms of DNA damage, DNA hypomethylation, and tumor progression in the folate/methyl-deficient rat model of hepatocarcinogenesis. J Nutr. 2003;133:3740S-3747S.
37
150. Lopatina NG, Vanyushin BF, Cronin GM, Poirier LA. Elevated expression and altered pattern of activity of DNA methyltransferase in liver tumors of rats fed methyl-deficient diets. Carcinogenesis. 1998;19:1777-81.
151. Ghoshal K, Li X, Datta J, Bai S, Pogribny I, Pogribny M, Huang Y, Young D, Jacob ST. A folate- and methyl-deficient diet alters the expression of DNA methyltransferases and methyl CpG binding proteins involved in epigenetic gene silencing in livers of F344 rats. J Nutr. 2006;136:1522-7.
152. Pogribny IP, Tryndyak VP, Muskhelishvili L, Rusyn I, Ross SA. Methyl deficiency, alterations in global histone modifications, and carcinogenesis. J Nutr. 2007;137:S216-22.
153. Pogribny IP, James SJ, Jernigan S, Pogribna M. Genomic hypomethylation is specific for preneoplastic liver in folate/methyl deficient rats and does not occur in non-target tissues. Mutat Res. 2004;133:S3740-7.
154. Pogribny IP, Ross SA, Wise C, Pogribna M, Jones EA, Tryndyak VP, James SJ, Dragan YP, Poirier LA. Irreversible global DNA hypomethylation as a key step in hepatocarcinogenesis induced by dietary methyl deficiency. Mutat Res. 2006;593:80-7.
155. Jacob RA, Gretz DM, Taylor PC, James SJ, Pogribny IP, Miller BJ, Henning SM, Swendseid ME. Moderate folate depletion increases plasma homocysteine and decreases lymphocyte DNA methylation in postmenopausal women. J Nutr. 1998;128:1204-12.
156. Ingrosso D, Cimmino A, Perna AF, Masella L, De Santo NG, De Bonis ML, Vacca M, D'Esposito M, D'Urso M, Galletti P, Zappia V. Folate treatment and unbalanced methylation and changes of allelic expression induced by hyperhomocysteinaemia in patients with uraemia. Lancet. 2003;361:1693-9.
157. Choi SW, Friso S, Keyes MK, Mason JB. Folate supplementation increases genomic DNA methylation in the liver of elder rats. Br J Nutr. 2005;93:31-5.
158. Choi SW, Corrocher R, Friso S. Nutrients and DNA methylation. In: Nutrients and Epigenetics, ed. Choi SW, Friso S. Boca Raton, FL: CRC Press, 2009.
159. Freemantle SJ, Spinella MJ, Dmitrovsky E. Retinoids in cancer therapy and chemoprevention: promise meets resistance. Oncogene. 2003;22:7305-15.
160. Sekula-Gibbs S, Uptmore D, Otillar L. Retinoids. J Am Acad Dermatol. 2004;50:405-15.
161. Hathcock JN, Hattan DG, Jenkins MY, McDonald JT, Sudaresan PR, Wilkening VL. Evaluation of vitamin A toxicity. Am J Clin Nutr. 1990;52:182-202.
162. Penniston KL, Tanumihardjo SA. The acute and chronic toxic effects of vitamin A. Am J Clin Nutr. 2006;83:191-201.
163. Roenigk HH. Liver toxicity of retinoid therapy. J Am Acad Dermatol. 1988;19:199-208.
164. Wolf G. Retinoic acid homeostasis: retinoic acid regulates liver retinol esterification as well as its own catabolic oxidation in liver. Nutr Rev. 2001;59:391-4.
165. Ross AC, Zolfaghari R. Regulation of hepatic retinol metabolism: perspectives from studies on vitamin A status. J Nutr. 2004;134:269S-275S.
38
166. Nau H. Teratogenicity of isotretinoin revisited: species variation and the role of all-trans-retinoic acid. J Am Acad Dermatol. 2001;45:S183-7.
167. Lansink M, Van Bennekum AM, Blaner WS. Kooistra T. Differences in metabolism and isomerization of all-trans-retinoic acid and 9-cis-retinoic acid between human endothelial cells and hepatocytes
168. Bendich A, Langseth L. Safety of vitamin A. Am J Clin Nutr. 1989;49:358-71. 169. Rowling MJ, Schalinske KL. Retinoid compounds activate and induce hepatic glycine
N-methyltransferase in rats. J Nutr. 2001;131:1914-7. 170. Rowling MJ, McMullen MH, Schalinske KL. Vitamin A and its derivatives induce
hepatic glycine N-methyltransferase and hypomethylation of DNA in rats. J Nutr. 2002;132:365-9.
171. Ozias MK, Schalinske KL. All-trans-retinoic acid rapidly induces glycine N-methyltransferase in a dose-dependent manner and reduces circulating methionine and homocysteine levels in rats. J Nutr. 2003;133:4090-4.
172. Eilertsen KJ, Power RA, Harkins LL, Misica P. Targeting cellular memory to reprogram the epigenome, restore potential, and improve somatic cell nuclear transfer, Anim Reprod Sci. 2007;98:129–46.
173. Fell D, Steele RD. Modification of hepatic folate metabolism in rats fed excess retinol. Life Sci. 1986;38:1959-65.
174. Kuriyama M, Udagawa A, Yoshimoto S, Ichinose M, Sato K, Yamazaki K, Matsuno Y, Shiota K, Mori C. DNA methylation changes during cleft palate formation induced by retinoic acid in mice. Cleft Palate Craniofac J. 2008;45:545-51.
175. Love WK, Berletch JB, Andrews LG, Tollefsbol TO. Epigenetic regulation of telomerase in retinoid-induced differentiation of human leukemia cells. Int J Oncol. 2008;32:625-31.
176. Andollo N, Boyano MD, Andrade R, Arechaga JM. Epigenetic regulation of the imprinted U2af1-rs1 gene during retinoic acid-induced differentiation of stem cells. Dev Growth Differ. 2006;48:349-60.
177. Park SE, Huq MD, Loh HH, Wei LN. Retionic acid-induced chromatin remodeling of mouse kappa opiod receptor gene. J Neurosci. 2005;25:3350-7.
178. Fazi F, Travaglini L, Carotti D, Palitti F, Diverio D, Alcalay M, McNamara S, Miller WH Jr, Lo Coco F, Pelicci PG, Nervi C. Retinoic acid targets DNA-methyltransferases and histone deacetylases during APL blast differentiation in vitro and in vivo. Oncogene. 2005;24:1820-30.
179. Campbell RK. Type 2 diabetes: where we are today: an overview of disease burden, current treatments, and treatment strategies. J Am Pharm Assoc. 2009;49:S3-9.
180. Richer MJ, Horwitz MS. Preventing viral-induced type 1 diabetes. Ann N Y Acad Sci. 2009;1173:487-92.
181. Savage DB, Petersen KF, Shulman GI. Disordered lipid metabolism and the pathogenesis of insulin resistance. Physiol Rev. 2007;87:507-20.
182. Nandi A, Kitamura Y, Kahn CR, Accili D. Mouse models of insulin resistance. Physiol Rev. 2004;84:623-47.
39
183. Kennedy A, Martinez K, Chuang CC, LaPoint K, McIntosh M. Saturated fatty acid-mediated inflammation and insulin resistance in adipose tissue: mechanisms of action and implications. J Nutr. 2009;139:1-4.
184. Huang PL. A comprehensive definition for metabolic syndrome. Dis Model Mech. 2009;2:231-7.
185. Rees DA, Alcolado JC. Animal models of diabetes mellitus. Diabet Med. 2005;22:359-70.
186. Tesch GH, Allen TJ. Rodent models of streptozotocin-induced diabetic nephropathy. Nephrology. 2007;12:261-6.
187. Srinivasan K, Ramarao P. Animal models in type 2 diabetes research: an overview. Indian J Med Res. 2007;125:451-72.
188. Oltman CL, Richou LL, Davidson EP, Coppey LJ, Lund DD, Yorek MA. Progression of coronary and mesenteric vascular dysfunction in Zucker obese and Zucker diabetic fatty rats. Am J Physiol Heart Circ Physiol. 2006;291:H1780-7.
189. Mathe D. Dyslipidemia and diabetes: animal models. Diabetes Metab. 1995;21:106-11.
190. Corsetti JP, Sparks JD, Peterson RG, Smith RL, Sparks CE. Effect of dietary fat on the development of non-insulin dependent diabetes mellitus in obese Zucker diabetic fatty male and female rats. Atherosclerosis. 2000;148:231-41.
191. Gonzalez-Navarro H, Burks DJ, Andres V. Murine models to investigate the influence of diabetic metabolism on the development of atherosclerosis and restenosis. Front Biosci. 2007;12:4439-55.
192. Brondum E, Nilsson H, Aalkjaer C. Functional abnormalities in isolated arteries from Goto-Kakizaki and streptozotocin-treated diabetic rat models. Horm Metab Res. 2005;37:56S-60S.
193. Leehey DH, Singh AK, Bast JP, Sethupathi P, Singh R. Glomerular renin angiotensin system in streptozotocin diabetic and Zucker diabetic fatty rats. Transl Res. 2008;151:208-16.
194. Li Y, Qi Y, Kim MS, Huang TH, ROng X, Murray M, Yamahara J. Increased renal collagen cross-linking and lipid accumulation in nephropathy of Zucker diabetic fatty rats. Diaetes Metabl Res Rev. 2008;24:498-506.
195. Alder VA, Su EN, Yu DY Cringle SJ, Yu PK. Diabetic retinopathy: early functional changes. Clin Exp Pharmacol Physiol. 1997;24:785-8.
196. Danis RP, Yang Y. Microvascular retinopathy in the Zucker diabetic fatty ra. Invest ophthalmol Vis Sci. 1993;34:2367-71.
197. Sima AAF. New insights into the metabolic and molecular basis for diabetic neuropathy. Cell Mol Life Sci. 2003;60:2445-64.
198. Oltman CL, Coppey LJ, Gellett JS, Davidson EP, Lund DD, Yorek MA. Progression of vascular and neural dysfunction in sciatic nerves of Zucker diabetic fatty and Zucker rats. Am J Physiol Endocrinol Metab. 2005;289:E113-22.
199. Jacobs RL, House JD, Brosnan ME, Brosnan JT. Effects of streptozotocin-induced diabetes and of insulin treatment on homocysteine metabolism in the rat. Diabetes. 1998;47:1967-70.
40
200. Ratnam S, Wijekoon EP, Hall B, Garrow TA, Brosnan ME, Brosnan JT. Effects of diabetes and insulin on betaine-homocysteine S-methyltransferase expression in rat liver. Am J Physiol Endocrinol Metab. 2006;290:E933-9.
201. Ratnam S, Maclean KN, Jacobs RL, Brosnan ME, Kraus JP, Brosnan JT. Hormonal regulation of cystathionine beta-synthase expression in liver. J Biol Chem. 2002;277:42912-8.
202. Giannattasio A, Calevo MG, Minniti G, Gianotti D, Cotellessa M, Napoli F, Lorini R, d'Annunzio G. Folic acid, vitamin B12 and homocysteine levels during fasting and after methionine load in patients with type 1 diabetes mellitus. J Endocrinol Invest. Epub 2009 Oct 15.
203. Masuda Y, Kubo A, Kokaze A, Yoshida M, Fukuhara N, Takashima Y. Factors associated with serum total homocysteine level in type 2 diabetes. Environ Health Prev Med. 2008;13:148-55.
204. Brasacchio D, Okabe J, Tikellis C, Balcerczyk A, George P, Baker EK, Calkin AC, Brownlee M, Cooper ME, El-Osta A. Hyperglycemia induces a dynamic cooperativity of histone methylase and demethylase enzymes associated with gene-activating epigenetic marks that co-exist on the lysine tail. Diabetes. 2009;58:1229-36.
205. El-Osta A, Brasacchio D, Yao D, Pocai A, Jones PL, Roeder RG, Cooper ME, Brownlee M. Transient high glucose causes persistent epigenetic changes and altered gene expression during subsequent normoglycemia. J Exp Med. 2008;205:2409-17.
206. Villeneuve LM, Reddy MA, Lanting LL, Wang M, Meng L, Natarajan R. Epigenetic histone H3 lysine 9 methylation in metabolic memory and inflammatory phenotype of vascular smooth muscle cells in diabetes. Proc Natl Acad Sci U S A. 2008;105:9047-52.
207. Miao F, Smith DD, Zhang L, Min A, Feng W, Natarajan R. Lymphocytes from patients with type 1 diabetes display a distinct profile of chromatin histone H3 lysine 9 dimethylation: an epigenetic study in diabetes. Diabetes. 2008;57:3189-98.
208. Miao F, Wu X, Zhang L, Yuan YC, Riggs AD, Natarajan R. Genome-wide analysis of histone lysine methylation variations caused by diabetic conditions in human monocytes. J Biol Chem. 2007;282:13854-63.
41
CHAPTER 3: Long-term, thrice-weekly supplementation with retinoic acid alters
methyl group metabolism, but does not induce change s in DNA methylation status in
rat liver
A manuscript to be submitted to Hepatology.
Kelly T. Williams and Kevin L. Schalinske
Abstract
S-adenosyl methionine-dependent transmethylation reactions are important in many
biosynthetic and regulatory processes such that compromised methyl group availability
results in a number of pathologies. For example, global DNA hypomethylation is associated
with genomic instability and overexpression of genes. Glycine N-methyltransferase is a key
protein in the regulation of methyl group supply and utilization; thus, it is important to
understand how nutritional and/or hormonal factors influence GNMT. Previously it has been
demonstrated that administration of all-trans-retinoic acid (RA) rapidly induces glycine N-
methyltransferase and global DNA hypomethylation during short-term (7-d) studies. The
aim of this study was to investigate the long-term effects of RA administration on GNMT
expression, DNA methylation, and hepatotoxicity. Rats were treated orally with either 0, 5,
or 30 µmol RA/kg body weight three times per week for a total of 2, 4, 8, 16, or 24 wk.
Treatment with either dose of RA induced GNMT activity and abundance at 2 wk, and this
increase was observed at all timepoints in the study. Serum activities of alanine
aminotransferase and aspartate aminotransferase were not affected by RA treatment.
Interestingly, RA treatment resulted in significantly decreased hematocrit levels, as well as
lowered plasma glutathione concentrations. Chronic administration of RA results in a
sustained increase in GNMT activity and protein abundance with little indication of
hepatotoxicity and no effect on DNA methylation status. However, chronic administration of
retinoic acid, even at therapeutic levels, can adversely impact hematopoiesis and
antioxidant defense.
42
Introduction
Folate-dependent one-carbon metabolism is central to a number of biochemical
processes including the biosynthesis of nucleic acids and the regeneration of methionine
from homocysteine by methionine synthase (MS) (1). The methyl donor for the MS reaction
is 5-methyltetrahydrofolate (5-CH3-THF), which is synthesized by methylenetetrahydrofolate
reductase (MTHFR) from 5,10-methylenetetrahydrofolate (5,10-CH2-THF). The products of
the MS reaction are methionine and tetrahydrofolate, which can be recycled back into the
folate pool. Methionine can be activated to S-adenosylmethionine (SAM), which serves as a
methyl group donor for more than 100 different SAM-dependent transmethylation reactions
(2,3). Methyltransferases catalyze the transfer of a methyl group from SAM to a methyl
acceptor molecule, which may include proteins, lipids, nucleic acids or other small
molecules, thereby generating a methylated product and S-adenosylhomocysteine (SAH),
which can subsequently be metabolized to homocysteine. Most SAM-dependent
methyltransferases are inhibited by SAH, therefore the SAM:SAH ratio is purported to be an
indicator of transmethylation potential.
Glycine N-methyltransferase (GNMT) is highly abundant in liver (1-3% of cytosolic
protein) and is a proposed regulator of hepatic methyl group supply and utilization (2,4). The
reaction catalyzed by GNMT involves the transfer of a methyl group from SAM to glycine,
thereby forming sarcosine, a product for which the physiological function is unclear. The
regulation of GNMT is unique in that it is inhibited by SAH to a lesser extent than most other
methyltransferases and is intricately tied to one-carbon folate metabolism (Figure 1 ).
GNMT is allosterically inhibited by 5-CH3-THF (5), whereas MTHFR activity is suppressed
by SAM (6). Therefore, when methyl group supply is high, SAM concentrations are elevated
and MTHFR activity is inhibited, decreasing the synthesis of 5-CH3-THF and relieving
inhibition of GNMT. Increased GNMT activity would be expected to decrease SAM levels,
thereby restoring the SAM:SAH ratio. Conversely, when methyl supply is low, SAM levels
would also be decreased, relieving the inhibition of MTHFR, increasing 5-CH3-THF
concentrations and inhibiting GNMT, thereby conserving methyl groups. Taken together
with recent reports that the SAM:SAH ratio is elevated up to 100-fold in two newly
developed GNMT knockout mouse models (7,8), there is strong evidence for the role of
GNMT in the regulation of transmethylation potential. Given this critical regulatory role, it is
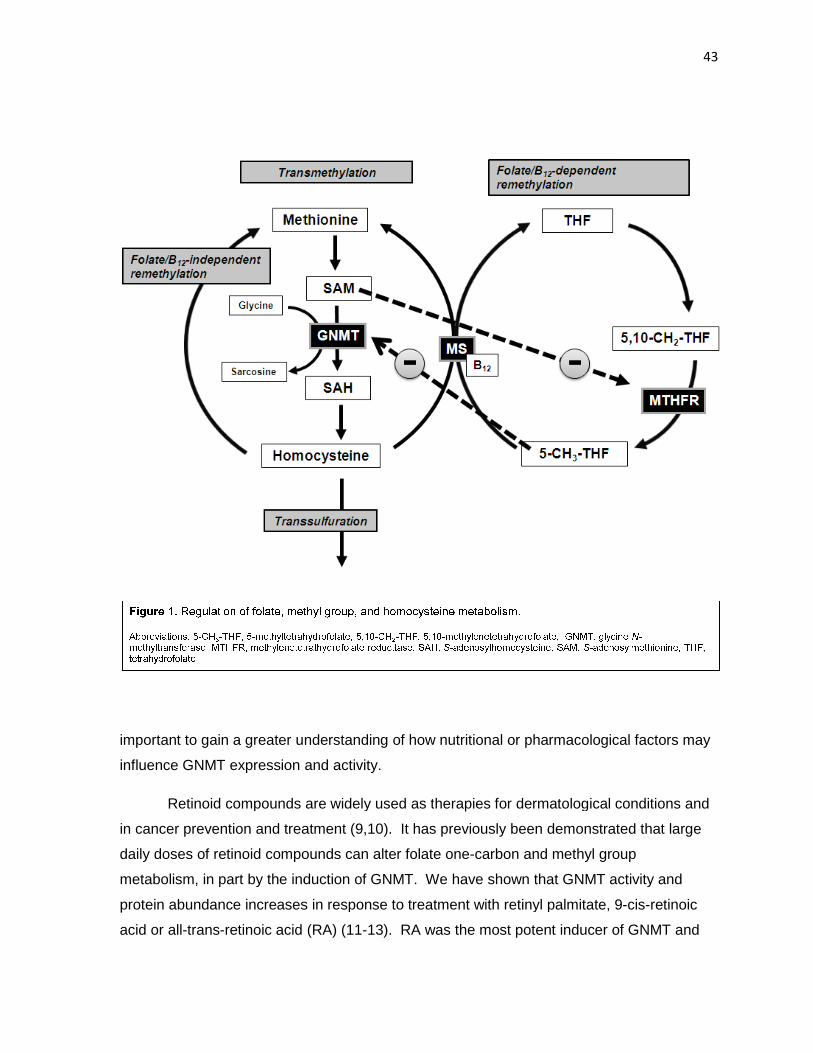
important to gain a greater understanding of how nutritional or
influence GNMT expression and activity.
Retinoid compounds are widely used as t
in cancer prevention and treatment (9,10)
daily doses of retinoid compounds can alter
metabolism, in part by the induction of GNMT.
protein abundance increases in
acid or all-trans-retinoic acid (RA)
important to gain a greater understanding of how nutritional or pharmacological factors may
influence GNMT expression and activity.
Retinoid compounds are widely used as therapies for dermatological conditions and
cancer prevention and treatment (9,10). It has previously been demonstrated that large
retinoid compounds can alter folate one-carbon and methyl group
metabolism, in part by the induction of GNMT. We have shown that GNMT activity and
rotein abundance increases in response to treatment with retinyl palmitate, 9
retinoic acid (RA) (11-13). RA was the most potent inducer of GNMT
43
pharmacological factors may
for dermatological conditions and
been demonstrated that large
methyl group
We have shown that GNMT activity and
response to treatment with retinyl palmitate, 9-cis-retinoic
. RA was the most potent inducer of GNMT and
44
also resulted in significant DNA hypomethylation during short-term studies (7-d), suggesting
that the induction of GNMT compromises methyl group availability for other SAM-dependent
transmethylation reactions (13). It has long been known that the reduction of methyl group
availability by chronic feeding of a methyl-deficient diet results in global and gene-specific
DNA hypomethylation, which is associated with genomic instability and overexpression of
genes, specifically the proto-oncogenes c-myc, c-fos, and c-ras (14-16). The long-term
adverse effects of a methyl deficient diet are an independent cause of liver fibrosis,
cirrhosis, and hepatocellular carcinoma. Hepatotoxicity is also a potential side effect of
retinoids, with increased serum ALT and AST activity reported in up to 33% of patients (10).
Although the impact of short-term retinoid treatment on methyl group metabolism is well-
characterized, data are lacking for effects of retinoid administration after several months,
which is the usual duration of therapeutic treatments. Therefore, the aim of the current
study was to investigate the long-term effects of RA administration on GNMT expression,
DNA methylation and hepatotoxicity
Materials and Methods
Chemicals and reagents Reagents were obtained as follows: 2,4-dinitrophenylhydrazine,
RA, Sigma-Aldrich Chemical Co. (St Louis, MO); Coomassie Plus Protein Reagent, Pierce
Chemical; enhanced chemiluminescence Western blotting detection reagents, Amersham
Biosciences; goat anti-mouse horseradish peroxidase secondary antibody Southern
Biotechnology (Birmingham, AL); phenylmethylsulfonyl fluoride (PMSF), Calbiochem; S-
adenosyl-L-[methyl-3H] methionine, New England Nuclear (Boston, MA). GNMT antibodies
were provided by Yi-Ming Chen, National Yang-Ming University, Taipei, Taiwan (17). All
other chemicals and reagents were of analytical grade.
Animals All animal protocols were approved by and conducted in accordance with the
guidelines set forth by the Iowa State University Institutional Animal Care and Use
Committee. Male Sprague-Dawley rats (50-75 g at onset) were housed in individual cages
with a 12:12 hr light:dark cycle, and given free access to water and semi-purified diet as
previously described (11). Rats were randomly assigned to a treatment dose and duration
45
(n= 5-6 per group, 72 animals total). The treatment regimen consisted of 0, 5, or 30 µmol
RA/kg body weight (control, low RA, high RA) administered orally in corn oil vehicle three
times per week for a total of 2, 4, 8, 16, or 24 wk. Treatment doses were chosen based on
the normal dosages for retinoid therapies and based on previous dose-response studies
demonstrating that the greatest induction of GNMT was with a dose of 30 µmol/kg body
weight (18). The 5 µmol/kg body weight dose is equivalent to 1.5 mg/kg body weight;
treatment for dermatological conditions is usually prescribed at 0.5-2 mg/kg body weight/d
for 6 months (19). Treatment protocol was designed to minimize dermatological irritation.
All treatments were initiated immediately after an acclimation period and rats were
euthanized at the end of the each treatment period. Animals were anesthetized by
intraperitoneal injection with ketamine and xylazine (90 and 10 mg/kg respectively),
heparinized whole blood samples were collected by cardiac puncture, and livers were
rapidly excised. An aliquot of whole blood was collected in hematocrit capillary tubes,
sealed, and percent hematocrit was determined after centrifugation for 5 min in an Autocrit
Ultra 3 Microhematocrit Centrifuge (BD Diagnostics, Franklin Lakes, NJ). A portion of the
liver was immediately homogenized and cytosolic extracts prepared as previously described
(20,21); the remainder was snap frozen in liquid nitrogen and subsequently stored at -70°C.
GNMT activity and abundance GNMT activity was determined based on the method of
Cook and Wagner (22) with minor modifications (11). Briefly, 250 µg protein was added to a
reaction mixture of 0.2 mol/L Tris buffer (pH 9.0), 5 mmol/L dithiothreitol, 2 mmol/L glycine,
and 0.2 mmol/L S-adenosyl-L-[methyl-3H]methionine and incubated at 25°C for 30 min.
Reaction was stopped by addition of 10% trichloroacetic acid and unreacted SAM was
removed by addition of activated charcoal and centrifugation. Aliquots of supernatant were
used for liquid scintillation counting. GNMT abundance was assessed using immunoblotting
and subsequent chemiluminescent detection as described previously (20). SigmaGel
Software (SPSS, Chicago, IL) was used for densitometric analysis of relative abundance.
Plasma homocysteine and glutathione Plasma samples were derivatized for
determination of plasma homocysteine and glutathione as described by Ubbink et al (23)
46
with minor modifications (24). Homocysteine and glutathione were analyzed by HPLC with
fluorometric detection by injecting 100 µL of sample onto a µBondapak C18 Radial-Pak
column (Waters, Milford, MA) using a mobile phase of 40 mL/L acetonitrile in 0.1 mol/L
potassium phosphate buffer (pH 2.1). N-acetylcysteine (1 mmol/L) was used as an internal
standard.
DNA methylation Genomic DNA was isolated from snap frozen tissue using a commercial
kit (cat # A1125, Promega). Global and CpG island DNA methylation status was determined
by the method of Progribny et al (25) and as described previously (21). Briefly, 1 µg DNA
was digested with the methylation-sensitive restriction enzymes HpaII and BssHII – for
assessment of global and CpG island DNA methylation respectively, followed by cytosine
extension assay with Amplitaq DNA Polymerase (Applied Biosystems), and [3H]-dCTP.
After samples were applied to Whatman anion exchange paper, washed in 0.5 mol/L sodium
phosphate buffer, and dried, liquid scintillation counting was utilized for determination of 3H
incorporation.
Alanine aminotransferase (ALT) and aspartate aminotransferase (AST) activity
Plasma levels of ALT and AST activity were determined using the Reitman-Frankel method
(26) with minor modifications. Briefly, 100 µL of plasma was added to 500 µL substrate mix
and incubated at 37˚C for 30 min or 1 hr for ALT and AST assays, respectively. The
substrate mix consisted of 0.1 mol/L sodium-potassium phosphate buffer (pH 7.4), 2 mmol/L
α-ketoglutarate, and 200 mmol/L alanine or aspartate for assessment of ALT or AST
respectively. Following incubation, 500 µL of a color reagent containing 0.1 mol/L 2,4-
dinitrophenylhydrazine in 1 mol/L HCl was added to all samples, which were then incubated
at room temperature for 20 min. Absorbance was measured on a spectrophotometer at 510
nm and compared to a standard curve for determination of ALT and AST activity.
Statistical analysis For each timepoint, data for each treatment group were subjected to a
one-way ANOVA followed by Fisher’s least significant difference test for multiple
comparisons (SigmaStat, SPSS, Chicago, IL). When equal variance or normality tests
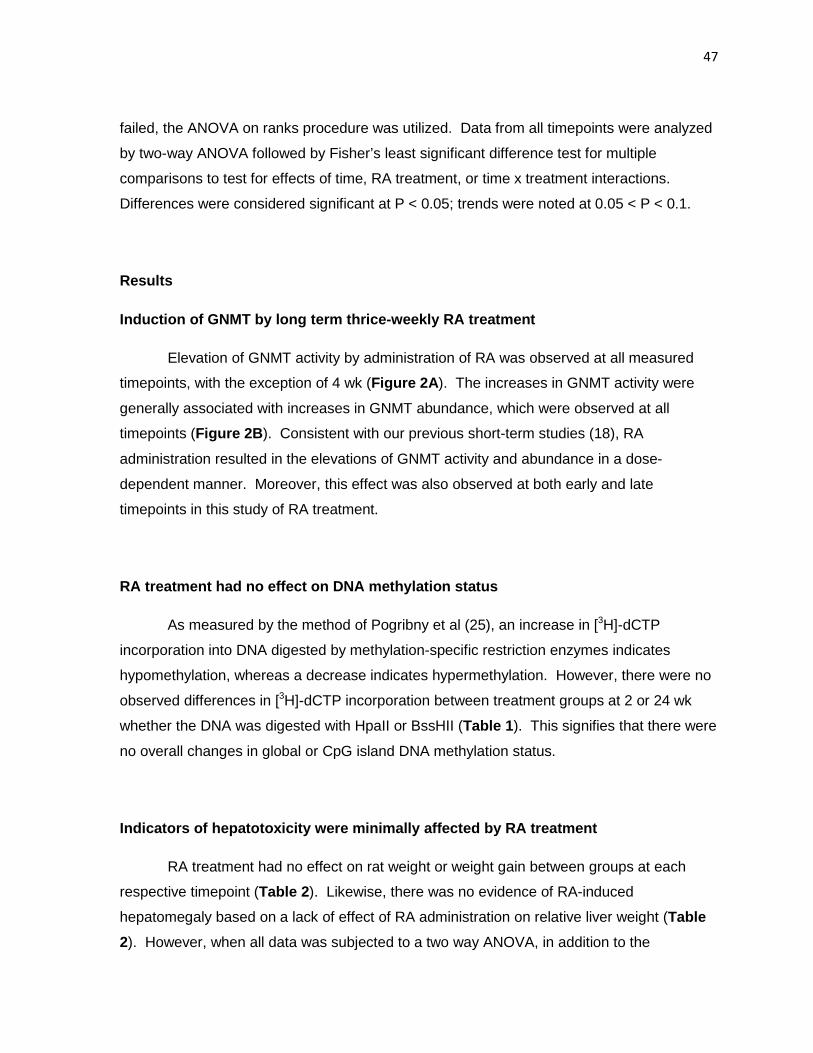
47
failed, the ANOVA on ranks procedure was utilized. Data from all timepoints were analyzed
by two-way ANOVA followed by Fisher’s least significant difference test for multiple
comparisons to test for effects of time, RA treatment, or time x treatment interactions.
Differences were considered significant at P < 0.05; trends were noted at 0.05 < P < 0.1.
Results
Induction of GNMT by long term thrice-weekly RA treatment
Elevation of GNMT activity by administration of RA was observed at all measured
timepoints, with the exception of 4 wk (Figure 2A ). The increases in GNMT activity were
generally associated with increases in GNMT abundance, which were observed at all
timepoints (Figure 2B ). Consistent with our previous short-term studies (18), RA
administration resulted in the elevations of GNMT activity and abundance in a dose-
dependent manner. Moreover, this effect was also observed at both early and late
timepoints in this study of RA treatment.
RA treatment had no effect on DNA methylation status
As measured by the method of Pogribny et al (25), an increase in [3H]-dCTP
incorporation into DNA digested by methylation-specific restriction enzymes indicates
hypomethylation, whereas a decrease indicates hypermethylation. However, there were no
observed differences in [3H]-dCTP incorporation between treatment groups at 2 or 24 wk
whether the DNA was digested with HpaII or BssHII (Table 1 ). This signifies that there were
no overall changes in global or CpG island DNA methylation status.
Indicators of hepatotoxicity were minimally affected by RA treatment
RA treatment had no effect on rat weight or weight gain between groups at each
respective timepoint (Table 2). Likewise, there was no evidence of RA-induced
hepatomegaly based on a lack of effect of RA administration on relative liver weight (Table
2). However, when all data was subjected to a two way ANOVA, in addition to the
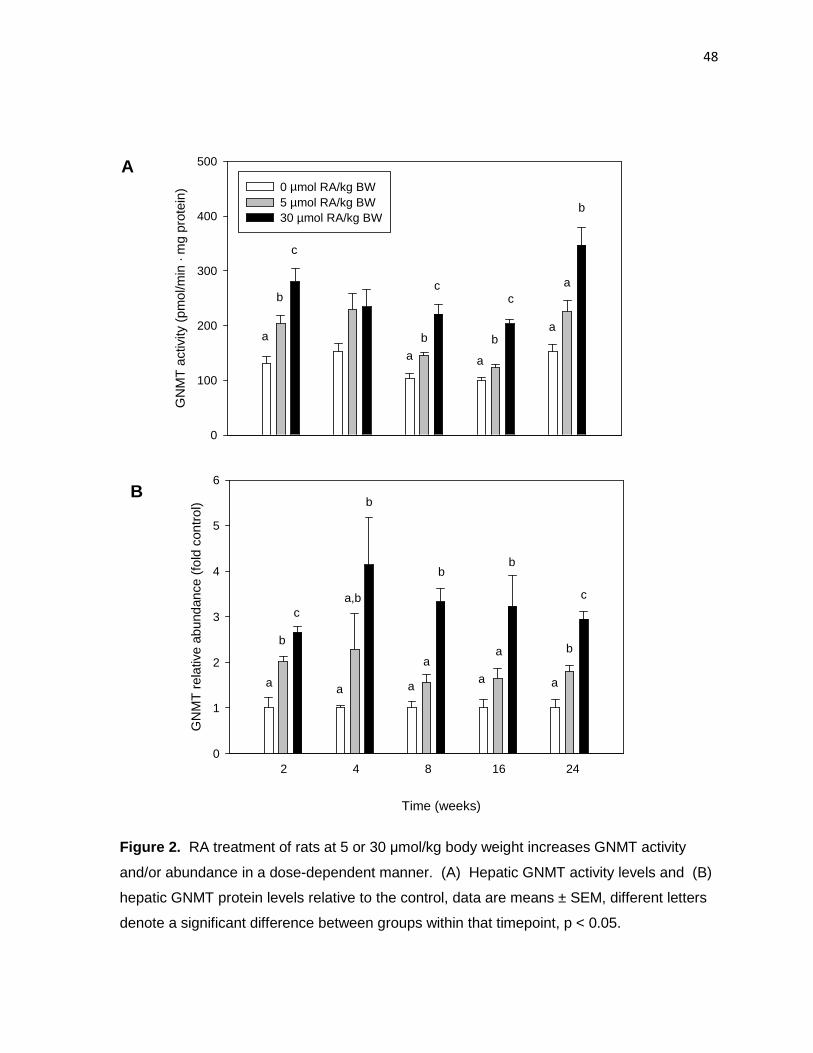
48
Time (weeks)
GN
MT
act
ivity
(pm
ol/m
in ·
mg
prot
ein)
0
100
200
300
400
500
0 µmol RA/kg BW5 µmol RA/kg BW30 µmol RA/kg BW
a
b
c
a
b
c
a
b
c
a
a
b
2 4 8 16 24
GN
MT
rel
ativ
e ab
unda
nce
(fol
d co
ntro
l)
0
1
2
3
4
5
6
a a aa a
a,b
aa
bb
bb
b
c
c
A
B
Figure 2. RA treatment of rats at 5 or 30 µmol/kg body weight increases GNMT activity
and/or abundance in a dose-dependent manner. (A) Hepatic GNMT activity levels and (B)
hepatic GNMT protein levels relative to the control, data are means ± SEM, different letters
denote a significant difference between groups within that timepoint, p < 0.05.
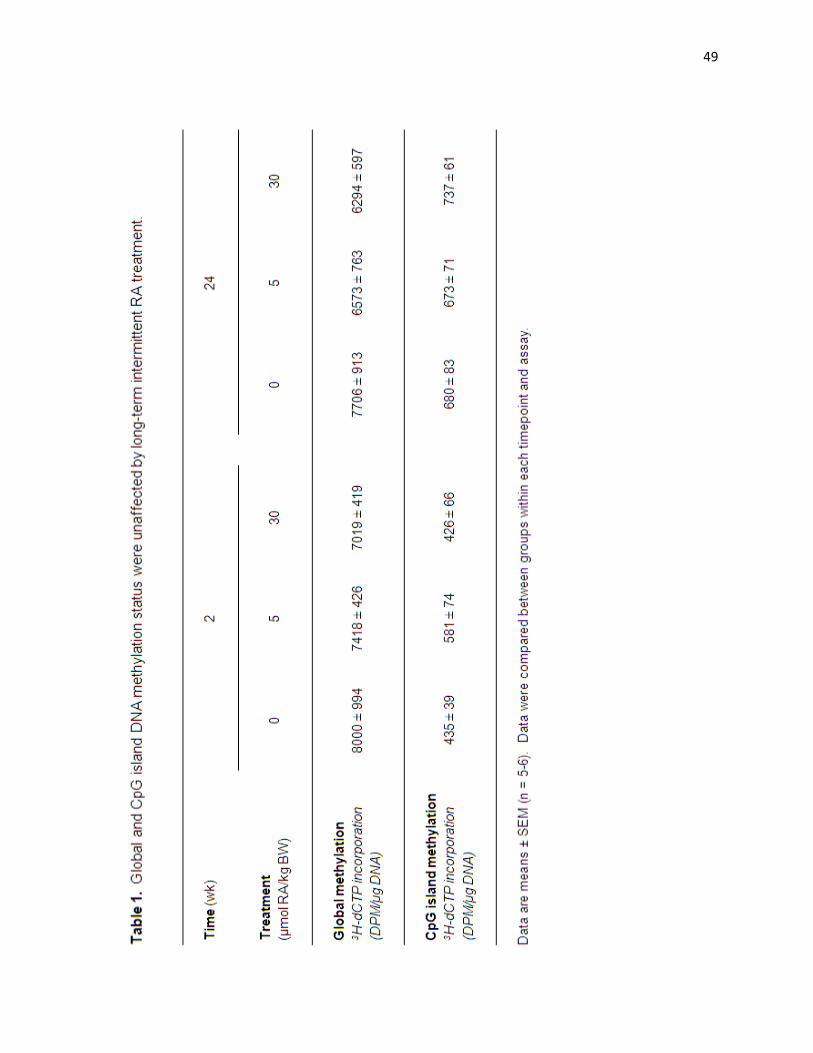
49
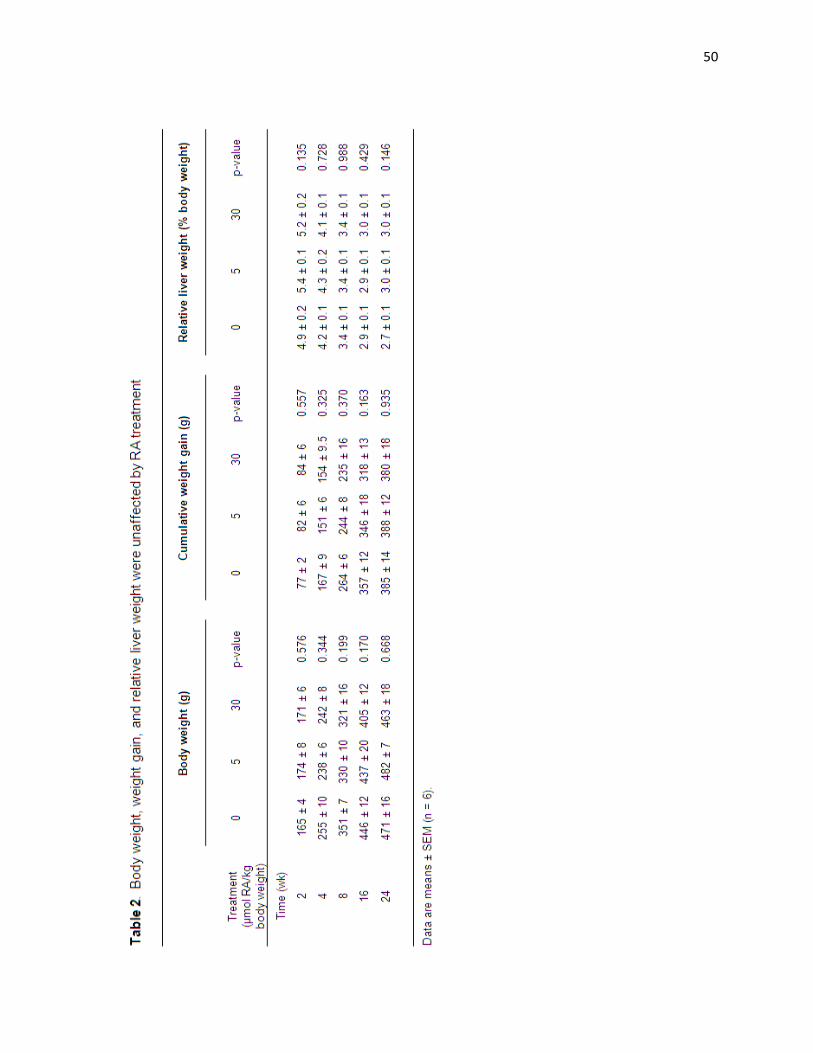
50
51
significant effects of time (p < 0.001), as would be expected due to growth of the animals,
there were also slight trends towards decreased body weight (p = 0.062) and weight gain (p
= 0.098), as well as increased relative liver weight (p = 0.097) associated with RA treatment.
Plasma ALT and AST activity levels at 24 wk were also used as biomarkers of
hepatotoxicity. Activities of these enzymes are high in liver, but normally low in plasma,
therefore ALT and AST activities are only high in plasma when damage to the liver results in
release of the enzymes into the circulation. There were no significant differences observed
in plasma ALT or AST activity at 24 wk (Table 3 ), indicating a lack of hepatotoxicity.
Long term RA treatment decreased plasma glutathione concentrations.
RA treatment did not have a significant effect on plasma homocysteine levels at any
of the individual timepoints assessed. However, two-way ANOVA revealed a trend towards
a decrease in homocysteine with RA treatment (p = 0.073, representative data from 24 wk
shown in Table 3 ). At 24 wk, glutathione levels were found to be decreased by 28% in
animals receiving the high RA treatment compared to the control group (p = 0.013). The
plasma glutathione concentration was also 11% lower in low RA vs. controls, though this
difference did not attain significance (p = 0.103). There were no differences in glutathione
levels between treatment groups detected at earlier timepoints or by two-way ANOVA
analysis (data not shown).
Hematocrit levels are decreased by long-term RA administration
Given the well-established interaction between vitamin A and iron metabolism, as
well as the role of vitamin A status on cellular differentiation, hematocrit levels were
determined as a measure that would be sensitive to either of these effects. There were no
changes observed in hematocrit levels at 2 wk, but beginning at 4 wk hematocrit levels were
lower in RA-treated rats compared to control animals (Figure 3 ). In general, this decrease
in hematocrit was observed in all rats receiving RA, and two-way ANOVA revealed a
significant effects of RA, time, and a treatment by time interaction (p < 0.001).
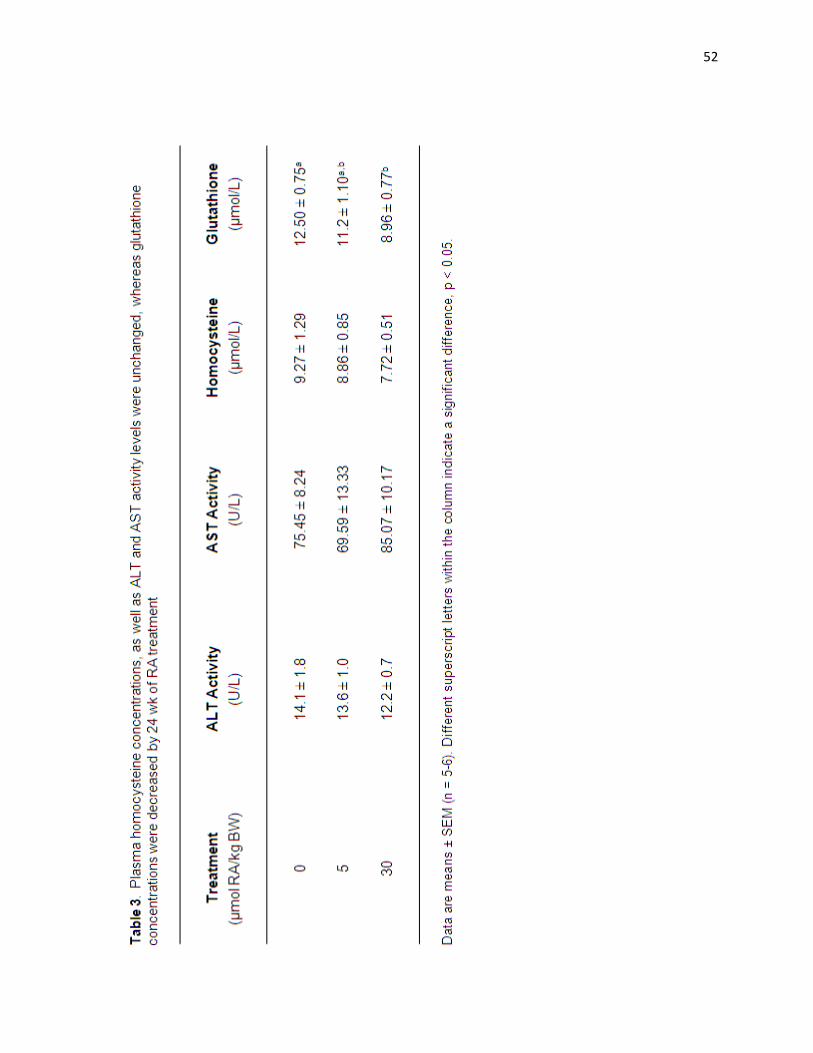
52
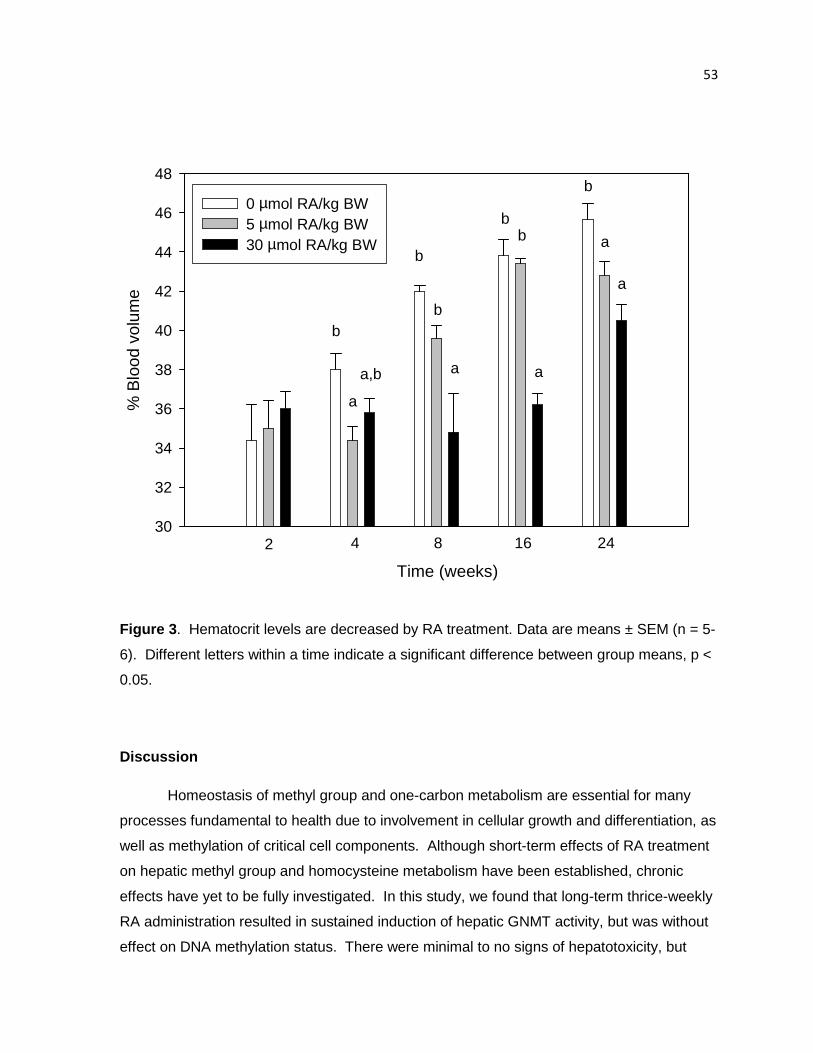
53
% B
lood
vol
ume
30
32
34
36
38
40
42
44
46
48
0 µmol RA/kg BW5 µmol RA/kg BW30 µmol RA/kg BW
a
a,b
b
a
bb
b
a
a
b
2 4 8 16 24
Time (weeks)
a
b
Figure 3 . Hematocrit levels are decreased by RA treatment. Data are means ± SEM (n = 5-
6). Different letters within a time indicate a significant difference between group means, p <
0.05.
Discussion
Homeostasis of methyl group and one-carbon metabolism are essential for many
processes fundamental to health due to involvement in cellular growth and differentiation, as
well as methylation of critical cell components. Although short-term effects of RA treatment
on hepatic methyl group and homocysteine metabolism have been established, chronic
effects have yet to be fully investigated. In this study, we found that long-term thrice-weekly
RA administration resulted in sustained induction of hepatic GNMT activity, but was without
effect on DNA methylation status. There were minimal to no signs of hepatotoxicity, but
54
decreased plasma glutathione and markedly lower hematocrit in RA-treated rats suggests
the potential for adverse effects systemically due to decreased antioxidant defense or on
specific extrahepatic tissues, such as bone.
We have previously demonstrated that the induction of GNMT by RA is rapid,
significant after just one treatment, and dose-dependent (18). The induction of GNMT is
also consistently characterized by elevations in both activity and protein abundance (11-13).
Similar to these short-term studies, we have demonstrated that GNMT activity and/or
abundance in rats treated with RA at all timepoints from two to 24 wk. The increase in
GNMT may be due in part to the effects of RA on folate one-carbon metabolism. Rats fed a
diet high in retinyl acetate or retinyl palmitate or treated with RA have suppressed MTHFR
activity and/or elevated MS activity (15,24,27). Either of these alterations, or both in
concert, would be expected to lower 5-CH3-THF concentrations, which was measured and
observed in rats fed high-vitamin A diets (27). GNMT activity can be enhanced by
phosphorylation of the protein, but when 5-CH3-THF is bound to GNMT, this phosphorylation
was shown to be inhibited in vitro (5). Therefore, with lower intracellular levels of 5-CH3-
THF in the liver, the allosteric regulation of 5-CH3-THF would be relieved, GNMT might be
more easily phosphorylated and specific activity might increase. Perturbation of folate
status and homocysteine concentrations have been documented in two studies of humans
treated with retinoids. Patients treated with 13-cis-retionic acid (0.5 mg/kg body weight) for
45 d had elevated plasma homocysteine (28), whereas Chanson et al (29) found no change
in plasma homocysteine, but folate metabolism was perturbed such that 5-CH3-THF levels
decreased by ~15-20%.
In addition to the potential role of altered folate metabolism, transcriptional and/or
translational control of GNMT is suggested by the strong correlation between GNMT protein
abundance and activity as was found here (r = 0.511, p < 0.001) and in a previous study
(13). Although approximately half the change in GNMT activity can be explained by altered
transcriptional and/or translational control of GNMT by RA administration, the mechanism by
which this occurs is not fully understood. A likely explanation may be found in the recent
analysis of the promoter region of GNMT which identified several putative RAR and RXR
binding sites within the 1800 kb upstream of the transcriptional start site (30). Furthermore,
a binding site for Sp1 was also identified and Sp1 has been implicated in RA-induced
expression of other proteins in several extrahepatic tissues (31-33). Immunoprecipitation
55
for RAR or RXR followed by immunoblotting for RAR and Sp1 has demonstrated that
RAR/RXR can interact directly with Sp1 to stimulate transcription (31). However, the
induction of GNMT by retinoids has been shown to be tissue-specific (13) and these
interactions between RAR/RXR and their putative binding sites within the GNMT promoter or
Sp1 have not been described in the liver. Rather, when HepG2 cells, a rat hepatoma cell
line, were used to characterize the interactions at the human MRP3 gene promoter,
RAR/RXR was shown to decrease Sp1 binding in a dose-dependent manner (34). Notably,
the promoter for this gene does not appear to contain either a RARE or atypical RARE, so
decreased Sp1 binding may not be the effect observed within a promoter with a RARE site
in liver. Additional characterization of the GNMT promoter and its interactions with
transcription factors presents a promising direction for future investigations into the
regulation of GNMT.
Despite the long-term upregulation of GNMT, the level of global and CpG island DNA
methylation and plasma homocysteine levels were maintained. We hypothesize this might
be due to the intermittent nature of the treatment regimen or that other transmethylation
reactions might be compromised in favor of maintenance of DNA methylation patterns.
Retinoic acid has unique characteristics of absorption, transport, and metabolism relative to
other forms of vitamin A, such as retinol or carotenoids (35,36). Retinoic acid is rapidly
absorbed and travels to the liver via the portal vein and bound by albumin, rather than by
absorption and transport in chylomicrons and entrance to circulation after lymphatic
circulation, as for other forms of vitamin A. Additionally, the half-life of all-trans-retinoic acid
in plasma is <1 hr in both rodents and humans, and it is not stored in neither liver nor
extrahepatic tissues (35,37). Given the observed kinetics of retinoic acid, it is possible that
daily RA treatment is necessary for alteration of DNA methylation status and also suggests
the possible influence of other regulatory mechanisms in addition to the upregulation of
GNMT. It is also possible that there were specific changes in DNA methylation patterns that
were not measurable by this assay, which only assesses total changes in methylation
status. Interestingly, since our initial report of RA-induced hypomethylation, studies have
been performed in vitro with the aim of identifying agents for reprogramming of cells for
cloning. Eilertsen et al (38) report that in bovine somatic cells, treatment with RA (100
nmol/L) induced GNMT activity, resulting in a 25% decrease in 5-methylcytosine content of
DNA and upregulation of Oct4, a biomarker of pluripotency. Although this study was
preliminary in nature, it is interesting to note the dramatic effects on cellular phenotype
56
associated with RA-induced upregulation of GNMT expression and DNA hypomethylation.
Genomic and CpG island DNA hypomethylation have also been observed in the tissue of
cleft palates induced by maternal RA treatment of mice during pregnancy (39).
Unfortunately, there appears to be little to no data characterizing the effect of RA on DNA
methylation or the complete complement of methyl group and homocysteine pathways in
humans. Given the evidence of altered folate and homocysteine metabolism in humans
(28,29), this may be a worthy avenue of investigation.
In this study, there were few signs of hepatotoxicity as evidenced by a lack of effect
on plasma ALT and AST activities, and very moderate trends towards decreased body
weight, weight gain, and increased relative liver weight. Retinoid treatment in
dermatological patients may be accompanied by transient increases in ALT or AST that are
normally reversed by ending treatment (40). In this experiment, ALT and AST activity was
only measured at 16 and 24 wk (16 wk data not shown) and although there were no
significant differences between groups at either time, it’s possible that a transient increase
was missed. Our results are also consistent with the results of Hotchkiss et al (41), who
also found no change in plasma ALT and AST activity in rats given 10 or 15 mg RA/kg body
weight – a larger dose than that used here, more similar to that prescribed to leukemia
patients - for 10 or 15 wk. These results indicate minimal risk of hepatotoxicity; however
chronic RA-treatment was not without negative effects.
Hematocrit was significantly decreased in response to both low and high RA
treatment. While the control animals’ hematocrit levels increased, as would be expected for
a growing rat (42), hematocrit levels did not increase at a similar pace in RA-treated
animals, suggesting compromised hematopoiesis. Although vitamin A treatment is often
used for the prevention and treatment of anemia (36), there are also clinical, experimental,
and epidemiological data that retinoic acid can negatively affect bone and/or blood cell
formation. In a case study of an infant suffering from vitamin A intoxication, the bone
marrow aspirant was found to contain vacuolated or binucleated erythroblasts (43). A follow
up in vitro study of primary bone marrow mesenchymal stem cells and K-562 cells
(multipotent, hematopoietic) found that exposure to 20-80 µmol/L RA resulted in the
inhibition of cell proliferation (43). Alternatively, bone marrow diameter and area were
decreased in both male and female rats given 15 mg RA/kg body weight for a treatment
period of 15 weeks (41). However, given the larger dosage used in this study and the lack
57
of effect in rats given a lower dose of RA or 13-cis-retinoic acid, it seems unlikely that
reduced marrow content could account for the differences in hematocrit observed in our
investigations. The epidemiological data tells a slightly different story. The results of four
large epidemiological studies regarding the effect of vitamin A on bone suggests that intake
as low as twice the RDA could be associated with increased risk of osteoporosis and risk of
fracture (36). Although others have not always shown a similar effect, there are several
other potential side effects that warrant consideration in a risk-benefit analysis of treatment
with retinoids. In addition to the commonly reported side effects such as skin and eye
irritation, retinoids are well known to be teratogenic (10). Although still controversial,
emerging data also suggests that retinoid treatment may be linked to the development or
exacerbation of irritable bowel syndrome (42) and depression and suicidal tendencies (45).
Lastly, we have shown a detrimental effect on antioxidant defense as indicated by lower
plasma glutathione concentrations at 24 wk. Hepatic levels may be more sensitive to
retinoid treatment as de Oliviera et al (46) reported decreased hepatic glutathione
concentrations after only 7 d of treatment, thereby creating an pro-oxidant environment.
Intermittent treatment has been studied as an attractive option for therapeutic use
due to associated negative side effects. When intermittent oral treatment with isotretinoin
was provided for 6 mo, it was equally efficacious in reducing moderate acne as daily
treatment, but it was not as successful in ameliorating severe acne (47). Although daily oral
isotretinoin treatment remains the gold standard of systemic acne treatment (48), the side
effects associated with the intermittent treatment were less frequent and less severe than
those associated with daily treatment (47). The data from our study suggests that while
overt clinical signs of vitamin A toxicity may not be present, metabolic perturbations and
lowered hematocrit develop after just a few weeks and persist even with non-daily dosing of
RA. Antioxidant defense is also compromised after long-term supplementation. Although
symptoms of retinoid toxicity generally subside with no ill effects after withdrawal of RA
treatment (19), there remains the possibility that perturbations experienced during treatment
could put the patient at greater risk for complications in the future.
Literature Cited
1. Shane B, Stokstad EL. Vitamin B12-folate interrelationships. Annu Rev Nutr. 1985;5:115-41.
58
2. Kerr SJ. Competing methyltransferase systems. J Biol Chem. 1972;247:4248-52. 3. Katz JE, Dlakić M, Clarke S. Automated identification of putative methyltransferases
from genomic open reading frames. Mol Cell Proteomics. 2003;2:525-40. 4. Yeo EJ, Wagner C. Tissue distribution of glycine N-methyltransferase, a major folate-
binding protein of liver. Proc Natl Acad Sci U S A. 1994;91:210-4. 5. Wagner C, Briggs WT, Cook RJ. Inhibition of glycine N-methyltransferase activity by
folate derivatives: implications for regulation of methyl group metabolism. Biochem Biophys Res Commun. 1985;127:746-52.
6. Kutzbach C, Stokstad EL. Mammalian methylenetetrahydrofolate reductase. Partial purification, properties, and inhibition by S-adenosylmethionine. Biochim Biophys Acta. 1971;250:459-77.
7. Luka Z, Capdevila A, Mato JM, Wagner C. A glycine N-methyltransferase knockout mouse model for humans with deficiency of this enzyme. Transgenic Res. 2006;15:393-7.
8. Liu SP, Li YS, Chen YJ, Chiang EP, Li AF, Lee YH, Tsai TF, Hsiao M, Huang SF, Chen YM. Glycine N-methyltransferase-/- mice develop chronic hepatitis and glycogen storage disease in the liver. Hepatology. 2007;46:1413-25.
9. Freemantle SJ, Spinella MJ, Dmitrovsky E. Retinoids in cancer therapy and chemoprevention: promise meets resistance. Oncogene. 2003;22:7305-15.
10. Sekula-Gibbs S, Uptmore D, Otillar L. Retinoids. J Am Acad Dermatol. 2004;50:405-15.
11. Rowling MJ, Schalinske KL. Retinoid compounds activate and induce hepatic glycine N-methyltransferase in rats. J Nutr. 2001;131:1914-7.
12. Rowling MJ, McMullen MH, Chipman DC, Schalinske KL. Hepatic glycine N-methyltransferase is up-regulated by excess dietary methionine in rats. J Nutr. 2002;132:2545-50.
13. McMullen MH, Rowling MJ, Ozias MK, Schalinske KL. Activation and induction of glycine N-methyltransferase by retinoids are tissue- and gender-specific. Arch Biochem Biophys. 2002;401:73-80.
14. James SJ, Pogribny IP, Pogribna M, Miller BJ, Jernigan S, Melnyk S. Mechanisms of DNA damage, DNA hypomethylation, and tumor progression in the folate/methyl-deficient rat model of hepatocarcinogenesis. J Nutr. 2003;133:S3741-7.
15. Bhave MR, Wilson MJ, Poirier LA. c-H-ras and c-K-ras gene hypomethylation in the livers and hepatomas of rats fed methyl-deficient, amino acid-defined diets. Carcinogenesis. 1988;9:343-8.
16. Zapisek WF, Cronin GM, Lyn-Cook BD, Poirier LA. The onset of oncogene hypomethylation in the livers of rats fed methyl-deficient, amino acid-defined diets. Carcinogenesis. 1992;13:1869-72.
17. Liu HH, Chen KH, Shih YP, Lui WY, Wong FH, Chen YM. Characterization of reduced expression of glycine N-methyltransferase in cancerous hepatic tissues using two newly developed monoclonal antibodies. J Biomed Sci. 2003;10:87-97.
59
18. Ozias MK, Schalinske KL. All-trans-retinoic acid rapidly induces glycine N-methyltransferase in a dose-dependent manner and reduces circulating methionine and homocysteine levels in rats. J Nutr. 2003;133:4090-4.
19. Brelsford M, Beute TC. Preventing and managing the side effects of isotretinoin. Semin Cutan Med Surg. 2008;27:197-206.
20. Tanghe KA, Garrow TA, Schalinske KL. Triiodothyronine treatment attenuates the induction of hepatic glycine N-methyltransferase by retinoic acid and elevates plasma homocysteine concentrations in rats. J Nutr. 2004;134:2913-8.
21. Williams KT, Garrow TA, Schalinske KL. Type I diabetes leads to tissue-specific DNA hypomethylation in male rats J Nutr. 2008;138:2064-9.
22. Cook RJ, Wagner C. Glycine N-methyltransferase is a folate binding protein of rat liver cytosol. Proc Natl Acad Sci U S A. 1984;81:3631-4.
23. Ubbink JB, Hayward Vermaak WJ, Bissbort S. Rapid high-performance liquid chromatographic assay for total homocysteine levels in human serum. J Chromotogr. 1991;565:441-6.
24. Nieman KM, Rowling MJ, Garrow TA, Schalinske, KL. Modulation of methyl group metabolism by streptozotocin-induced diabetes and all-trans-retinoic acid. J Biol Chem. 2004;279:45708-12.
25. Pogribny I, Yi P, James SJ. A sensitive new method for rapid detection of abnormal methylation patterns in global DNA and within CpG islands. Biochem Biophys Res Comm. 1999;262:624-8.
26. Reitman S, Frankel S. A colorimetric method for the determination of serum glutamic oxalacetic and glutamic pyruvic transaminases. Am J Clin Pathol. 1957;28:56-63.
27. Fell D, Steele RD. Modification of hepatic folate metabolism in rats fed excess retinol. Life Sci. 1986;38:1959-65.
28. Schulpis KH, Karikas GA, Georgala S, Michas T, Tsakiris S. Elevated plasma homocysteine levels in patients on isotretinoin therapy for cystic acne. Int J Dermatol. 2001;40:33-6.
29. Chanson A, Cardinault N, Rock E, Martin JF, Souteyrand P, D'Incan M, Brachet P. Decreased plasma folate concentration in young and elderly healthy subjects after a short-term supplementation with isotretinoin. J Eur Acad Dermatol Venereol. 2008;22:94-100.
30. Lee CM, Shih YP, Wu CH, Chen YM. Characterization of the 5' regulatory region of the human Glycine N-methyltransferase gene. Gene. 2009;443:151-7.
31. Cheng YH, Yin P, Xue Q, Yilmaz B, Dawson MI, Bulun SE. Retinoic acid (RA) regulates 17beta-hydroxysteroid dehydrogenase type 2 expression in endometrium: interaction of RA receptors with specificity protein (SP)1/SP3 for estradiol metabolism. J Clin Endocrinol Metab. 2008;93:1915-23.
32. Hong JS, Kim SW, Koo JS. Sp1 up-regulates cAMP-response-element-binding protein expression during retinoic acid-induced mucous differentiation of normal human bronchial epithelial cells. Biochem J. 2008;410:49-61.
33. Chen Y, Kundakovic M, Agis-Balboa RC, Pinna G, Grayson DR. Induction of the reelin promoter by retinoic acid is mediated by Sp1. J Neurochem. 2007;103:650-65.
60
34. Chen W, Cai SY, Xu S, Denson LA, Soroka CJ, Boyer JL. Nuclear receptors RXRalpha:RARalpha are repressors for human MRP3 expression. Am J Physiol Gastrointest Liver Physiol. 2007;292:G1221-7.
35. Hathcock JN, Hattan DG, Jenkins MY, McDonald JT, Sudaresan PR, Wilkening VL. Evaluation of vitamin A toxicity. Am J Clin Nutr. 1990;52:182-202.
36. Penniston KL, Tanumihardjo SA. The acute and chronic toxic effects of vitamin A. Am J Clin Nutr. 2006;83:191-201.
37. Roenigk HH. Liver toxicity of retinoid therapy. J Am Acad Dermatol. 1988;19:199-208.
38. Eilertsen KJ, Floyd Z, Gimble JM. The epigenetics of adult (somatic) stem cells. Crit Rev Eukaryot Gene Expr. 2008;18:189-206.
39. Kuriyama M, Udagawa A, Yoshimoto S, Ichinose M, Sato K, Yamazaki K, Matsuno Y, Shiota K, Mori C. DNA methylation changes during cleft palate formation induced by retinoic acid in mice. Cleft Palate Craniofac J. 2008;45:545-51.
40. Brelsford M, Beute TC. Preventing and managing the side effects of isotretinoin. Semin Cutan Med Surg. 2008;27:197-206.
41. Hotchkiss CE, Latendresse J, Ferguson SA. Oral treatment with retinoic acid decreases bone mass in rats. Comp Med. 2006;56:502-11.
42. Matsuzawa T, Nomura M, Unno T. Clinical pathology reference ranges of laboratory animals. Working Group II, Nonclinical Safety Evaluation Subcommittee of the Japan Pharmaceutical Manufacturers Association. J Vet Med Sci. 1993;55:351-62.
43. Perrotta S, Nobili B, Rossi F, Criscuolo M, Iolascon A, Di Pinto D, Passaro I, Cennamo L, Oliva A, Della Ragione F. Infant hypervitaminosis A causes severe anemia and thrombocytopenia: evidence of a retinol-dependent bone marrow cell growth inhibition. Blood. 2002;99:2017-22.
44. Shale M, Kaplan GG, Panaccione R, Ghosh S. Isotretinoin and intestinal inflammation: what gastroenterologists need to know. Gut. 2009;58:737-41.
45. Marqueling AL, Zane LT. Depression and suicidal behavior in acne patients treated with isotretinoin: a systematic review. Semin Cutan Med Surg. 2007;26:210-20.
46. de Oliveira MR, Oliveira MW, Lorenzi R, Fagundes da Rocha R, Fonseca Moreira JC. Short-term vitamin A supplementation at therapeutic doses induces a pro-oxidative state in the hepatic environment and facilitates calcium-ion-induced oxidative stress in rat liver mitochondria independently from permeability transition pore formation : detrimental effects of vitamin A supplementation on rat liver redox and bioenergetic states homeostasis. Cell Biol Toxicol. 2009;25:545-60.
47. Akman A, Durusoy C, Senturk M, Koc CK, Soyturk D, Alpsoy E. Treatment of acne with intermittent and conventional isotretinoin: a randomized, controlled multicenter study. Arch Dermatol Res. 2007;299:467-73.
48. Ingram JR, Grindlay DJ, Williams HC. Management of acne vulgaris: an evidence-based update. Clin Exp Dermatol. ePub 23 Oct 2009.
61
CHAPTER 4: Type I diabetes leads to tissue-specific DNA hypome thylation in male rats
Published in the Journal of Nutrition, 2008;138:2064-9
Kelly T. Williams, Timothy A. Garrow, and Kevin L. Schalinske
Abstract
Numerous perturbations of methyl group and homocysteine metabolism have been
documented as an outcome of diabetes. It has also been observed that there is a transition
from hypo- to hyperhomocysteinemia in diabetes, often concurrent with development of
nephropathy. The objective of this study was to characterize the temporal changes in
methyl group and homocysteine metabolism in the liver and kidney, as well as to determine
the impact these alterations have on DNA methylation in type 1 diabetic rats. Male
Sprague-Dawley rats were injected with streptozotocin (60 mg/kg body wt) to induce
diabetes and samples were collected at 2, 4 and 8 wk. At 8 wk, hepatic and renal betaine-
homocysteine S-methyltransferase activities were greater in diabetic rats, whereas
methionine synthase activity was lower in diabetic rat liver and there was no difference in
kidney. Cystathionine β-synthase abundance was greater in the liver, but less in the kidney
of diabetic rats. Both hepatic and renal glycine N-methyltransferase (GNMT) activity and
abundance were greater in diabetic rats; however, changes in renal activity and/or
abundance were present only at 2 and 4 wk, whereas hepatic GNMT was induced at all
timepoints. Most importantly, we have shown for the first time that genomic DNA was
hypomethylated in the liver, but not the kidney in diabetic rats. These results suggest that
diabetes-induced perturbations of methyl group and homocysteine metabolism lead to
functional methyl deficiency, resulting in the hypomethylation of DNA in a tissue-specific
fashion.
Key words: diabetes • DNA methylation • folate • homocysteine • rat
62
Introduction
Perturbation of methyl group metabolism is associated with numerous pathologies,
including cancer, cardiovascular disease, neurological problems, and birth defects (1-4).
Methyl group supply is determined largely by two factors: dietary methyl intake and methyl
group utilization. The major dietary methyl donors are methionine, choline, and betaine (5).
Production of 5-methyltetrahydrofolate (5-CH3-THF) from 5-methylenetetrahydrofolate via
methylenetetrahydrofolate reductase (MTHFR) serves as an endogenous methyl donor.
Methyl group metabolism consists of four processes: transmethylation, remethylation by
folate/B12-dependent or -independent means, and transsulfuration. Transmethylation
reactions are essential for many biological processes and involve the transfer of a methyl
group from S-adenosylmethionine (SAM) to various substrates including nucleic acids,
lipids, and proteins by methyltransferases. All SAM-dependent methyltransferase reactions
ultimately result in the generation of S-adenosylhomocysteine (SAH) and subsequently
homocysteine, which can be remethylated back to methionine or irreversibly catabolized by
transsulfuration. Remethylation of homocysteine to generate methionine occurs via folate-
dependent and/or –independent pathways. For folate-dependent remethylation, the B12-
dependent enzyme methionine synthase (MS) utilizes a methyl group from 5-CH3-THF.
Betaine-homocysteine S-methyltransferase (BHMT) catalyzes the folate-independent
remethylation of homocysteine using betaine, a methyl group donor derived from choline
oxidation. Catabolism of homocysteine via the transsulfuration pathway begins with the
irreversible conversion to cystathionine by cystathionine β-synthase (CBS).
Because methyl group metabolism is important in health and disease, identifying and
understanding factors that have a regulatory role is essential. Recently, diabetes has
emerged as a condition characterized by disrupted methyl group metabolism. In the acute
diabetic state, the expression and activity of both hepatic phosphatidylethanolamine N-
methyltransferase (PEMT) and glycine N-methyltransferase (GNMT) were elevated.
Because PEMT and GNMT represent key SAM-dependent enzymes for phosphatidylcholine
synthesis and regulation of methyl group metabolism respectively, this suggested that
transmethylation was increased (6-9). Inappropriate upregulation of GNMT would be
expected to lead to wastage of methyl groups due to incorporation of the methyl groups into
sarcosine. For both type 1 and type 2 diabetic rat models, MS activity was decreased,
whereas BHMT activity was markedly increased (7-10). Elevated expression of CBS as a
63
function of diabetes also suggests enhanced catabolism of homocysteine via the
transsulfuration pathway (7,9,11,12). The net effect of these alterations was that hepatic
levels of both methionine and betaine were decreased (9,11), suggesting the potential
development of methyl deficiency. Furthermore, both the activity of MTHFR in lymphocytes
and the ratio of intracellular SAM:SAH, an indicator of transmethylation potential, in
erythrocytes were decreased in diabetic nephropathy with an inverse relation to the severity
of illness (13). Transmethylation flux has also been shown to be suppressed in diabetics
with renal dysfunction (14). Taken together, this suggests that a diabetic condition has a
profound impact on methyl group metabolism and that both the liver and kidney may be
important in the pathophysiological progression of the disease.
To date, most studies have been conducted early in the progression of the disease or
were cross-sectional. The goal of this study was to determine whether the perturbations of
methyl group metabolism associated with a diabetic condition are sustained over time and
how this might contribute to a functional methyl group deficiency, ultimately resulting in
genomic hypomethylation and altered expression of proteins associated with DNA
methylation, such as DNA methyltransferase 1 (DNMT1) (15). Based on evidence that
aberrations of methyl group metabolism were more severe in diabetics with renal
dysfunction (13,14), it was also of interest to determine whether these effects were tissue-
specific.
Materials and Methods
Chemicals and reagents. Reagents were obtained as follows: [14C-methyl]-betaine was
obtained from Moraveck; Coomassie Plus Protein Reagent, Pierce Chemical; DL-
homocysteine thiolactone, Sigma-Aldrich Chemical; DNMT1 (K-18) antibody and goat anti-
rabbit IgG-horseradish peroxidase, Santa Cruz Technologies; enhanced
chemiluminescence Western blotting detection reagents and 5-[14C]-methyl-THF, Amersham
Pharmacia; goat anti-mouse horseradish peroxidase secondary antibody Southern
Biotechnology; phenylmethylsulfonyl fluoride (PMSF), Calbiochem; and S-adenosyl-L-[3H]-
methionine, New England Nuclear. The GNMT antibody was provided by Y-M.A. Chen
(National Yang-Ming University, Taipei, Taiwan) (16). The CBS antibody was provided by J.
64
Kraus (University of Colorado Health Sciences Center). All other reagents were of analytical
grade.
Rats and diets. All animal experiments were approved by and conducted in accordance
with guidelines established by Iowa State University Laboratory Animal Resources. Thirty
male Sprague-Dawley rats (100-124 g) were housed individually in plastic cages with a 12-h
light-dark cycle. All rats were given ad libitum access to a semi-purified diet (17) and water.
After an acclimation period (4 d), rats were randomly assigned to either the control or
diabetic treatment group for a total treatment time of 2, 4, or 8 wk (5 rats per group per
timepoint). One diabetic rat assigned to wk 8 died during wk 6. All rats were given a single
intraperitoneal injection of either vehicle (10 mmol/L citrate buffer, pH 4.5) or streptozotocin
(STZ, 60 mg/kg body wt), for induction of type 1 diabetes. At each timepoint, rats were
anesthetized with an intraperitoneal injection of ketamine and xylazine (90 and 10 mg/kg
body wt respectively), and heparinized whole blood samples were collected via cardiac
puncture. An aliquot of whole blood was saved for analysis of blood glucose (# 510, Sigma-
Aldrich). The remaining blood was centrifuged at 4,000 × g for 5 minutes, followed by
removal of the plasma layer and storage at -20°C unti l analysis. The liver and left kidney
were rapidly excised and a portion of each tissue was homogenized in ice-cold buffer
containing 10 mmol/L sodium phosphate (pH 7.0), 0.25 mol/L sucrose, 1 mmol/L EDTA, 1
mmol/L sodium azide and 0.1 mmol/L PMSF. After centrifugation at 20,000 × g for 30 min at
4°C, β-mercaptoethanol was added to the supernatants to a final concentration of 10
mmol/L. Remaining tissues were snap frozen in liquid nitrogen and stored at -70°C prior to
isolation of genomic DNA (cat # A1125, Promega).
GNMT and PEMT GNMT and PEMT represent two important SAM-dependent
transmethylation enzymes that also function to regulate homocysteine and methyl group
metabolism. GNMT activity was determined based on the method of Cook and Wagner (18)
with minor modifications (17). GNMT abundance was assessed using immunoblotting and
subsequent chemiluminescent detection. The 32 kDa subunit was separated using SDS-
PAGE. The protein was transferred to a nitrocellulose membrane and incubated with GNMT
antibody followed by incubation with goat anti-mouse horseradish peroxidase secondary
65
antibody. Densitometric analysis (SigmaGel Software, SPSS, Chicago, IL) was used for
relative quantification of GNMT abundance. For PEMT activity, frozen liver was
homogenized in 10 mmol/L Tris-HCl (pH 7.4) and 0.25 mol/L sucrose. Following
centrifugation at 16,000 × g for 20 min at 4°C, the supernatant was removed and
centrifuged at 100,000 × g for 60 min at 4°C. The resulting microsomal pellet w as
resuspended in 0.25 mol/L sucrose. The enzymatic activity of PEMT was determined using
the method of Duce et al (19) with minor modifications (6).
BHMT and MS Remethylation of homocysteine to methionine by the folate/B12-
independent and dependent pathways is controlled by the enzymes BHMT and MS,
respectively. For both enzyme assays, fresh homocysteine solutions (100 mmol/L) were
prepared daily by dissolving a thiolactone derivative in 2 mol/L sodium hydroxide followed by
neutralization with saturated monopotatssium phosphate (20). As described previously (7),
BHMT and MS activities were assessed by radioisotopic assays utilizing [methyl-14C-]
betaine (20) and [methyl-14C-] tetrahydrofolate (21), respectively.
CBS The irreversible catabolism of homocysteine by the transsulfuration pathway is
initiated by the reaction catalyzed by CBS. Abundance of CBS was determined using
immunoblotting and chemiluminescence in a method similar to that described for GNMT
(22). The 63 kDa subunit of CBS was isolated using SDS-PAGE. After electrophoretic
transfer to nitrocellulose, the immunoblot was incubated with a polyclonal CBS antibody
followed by incubation with goat anti-rabbit horseradish peroxidase secondary antibody and
subsequent chemiluminescent and densitometric analysis.
Homocysteine, SAM, and SAH analysis Derivatization of plasma samples was performed
for determination of plasma homocysteine as described by Ubbink et al (23) with minor
modifications (7). Homocysteine was analyzed by HPLC with fluorometric detection by
injecting 100 µL of sample onto a µBondapak C18 Radial-Pak column (Waters, Milford, MA)
using a mobile phase of 40 mL/L acetonitrile in 0.1 mol/L potassium phosphate buffer (pH
2.1). The addition of N-acetylcysteine (1 mmol/L) to each sample prior to derivatization
66
served as an internal standard. For analysis of hepatic SAM and SAH concentrations, liver
samples were prepared using the method of Fell et al (24) and SAM and SAH were
separated and quantified by reverse-phase HPLC with UV detection as described (7).
DNA methylation status Digestion of hepatic and renal DNA followed by cytosine
extension was performed as described (25) for assessment of DNA methylation status.
DNA (1.0 µg) was digested using the methylation-sensitive restriction enzymes HpaII and
BssHII (New England Biolabs) for determination of global and CpG island methylation,
respectively. For the cytosine extension assay, a reaction mixture of the DNA digest, 10X
PCR Buffer II (without MgCl2), 25 mmol/L MgCl2, 0.5 U Amplitaq DNA Polymerase (Applied
Biosystems), and [3H]-dCTP was incubated at 55˚C for 1 h. Following incubation, samples
were applied to Whatman DE-81 ion exchange filter paper and washed in 0.5 mol/L sodium
phosphate buffer (pH 7.0) three times, dried, and 3H incorporation was assessed using liquid
scintillation counting.
DNMT1 abundance The Western blotting procedure described for GNMT and CBS was
also used to determine the DNMT1 abundance, with the following modifications. For
DNMT1, the primary and secondary antibodies used were goat polyclonal anti-DNMT and
donkey anti-goat, respectively.
Statistical analysis For each timepoint, the mean values of each treatment group were
subjected to a Student’s t test (SigmaStat, SPSS, Chicago, IL). A Mann-Whitney rank sum
test was used when variances were unequal. Correlations were determined using the
Pearson product moment correlation method. Differences were considered significant at P
< 0.05.
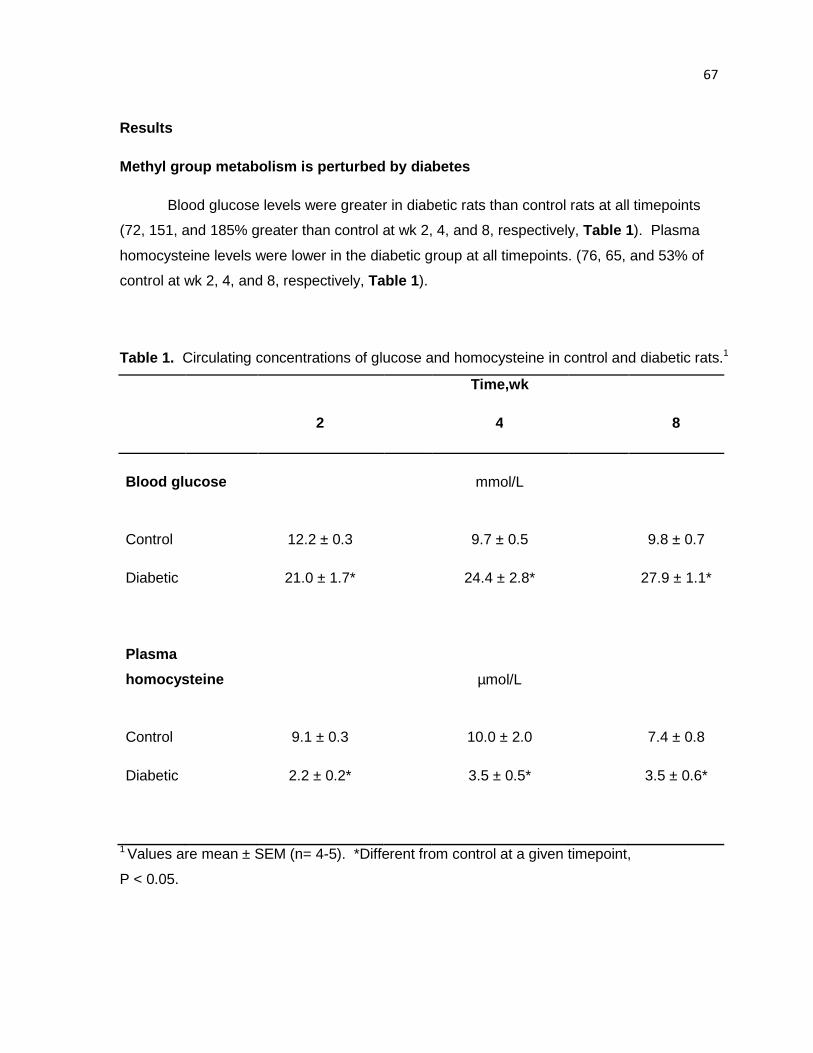
67
Results
Methyl group metabolism is perturbed by diabetes
Blood glucose levels were greater in diabetic rats than control rats at all timepoints
(72, 151, and 185% greater than control at wk 2, 4, and 8, respectively, Table 1). Plasma
homocysteine levels were lower in the diabetic group at all timepoints. (76, 65, and 53% of
control at wk 2, 4, and 8, respectively, Table 1 ).
Table 1. Circulating concentrations of glucose and homocysteine in control and diabetic rats.1
Time,wk
2 4 8
Blood glucose mmol/L
Control 12.2 ± 0.3 9.7 ± 0.5 9.8 ± 0.7
Diabetic 21.0 ± 1.7* 24.4 ± 2.8* 27.9 ± 1.1*
Plasma
homocysteine µmol/L
Control 9.1 ± 0.3 10.0 ± 2.0 7.4 ± 0.8
Diabetic 2.2 ± 0.2* 3.5 ± 0.5* 3.5 ± 0.6*
1 Values are mean ± SEM (n= 4-5). *Different from control at a given timepoint,
P < 0.05.
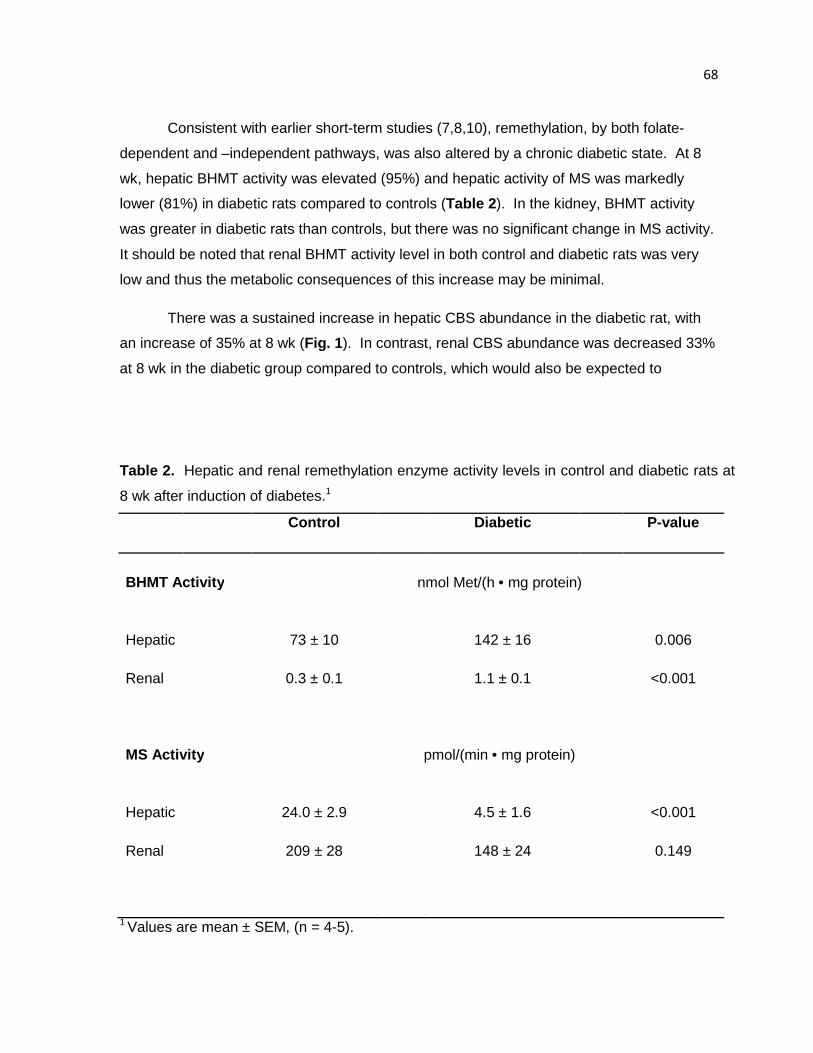
68
Consistent with earlier short-term studies (7,8,10), remethylation, by both folate-
dependent and –independent pathways, was also altered by a chronic diabetic state. At 8
wk, hepatic BHMT activity was elevated (95%) and hepatic activity of MS was markedly
lower (81%) in diabetic rats compared to controls (Table 2). In the kidney, BHMT activity
was greater in diabetic rats than controls, but there was no significant change in MS activity.
It should be noted that renal BHMT activity level in both control and diabetic rats was very
low and thus the metabolic consequences of this increase may be minimal.
There was a sustained increase in hepatic CBS abundance in the diabetic rat, with
an increase of 35% at 8 wk (Fig. 1 ). In contrast, renal CBS abundance was decreased 33%
at 8 wk in the diabetic group compared to controls, which would also be expected to
Table 2. Hepatic and renal remethylation enzyme activity levels in control and diabetic rats at
8 wk after induction of diabetes.1
Control Diabetic P-value
BHMT Activity nmol Met/(h • mg protein)
Hepatic
73 ± 10
142 ± 16
0.006
Renal
0.3 ± 0.1
1.1 ± 0.1
<0.001
MS Activity pmol/(min • mg protein)
Hepatic
24.0 ± 2.9
4.5 ± 1.6
<0.001
Renal
209 ± 28
148 ± 24
0.149
1 Values are mean ± SEM, (n = 4-5).
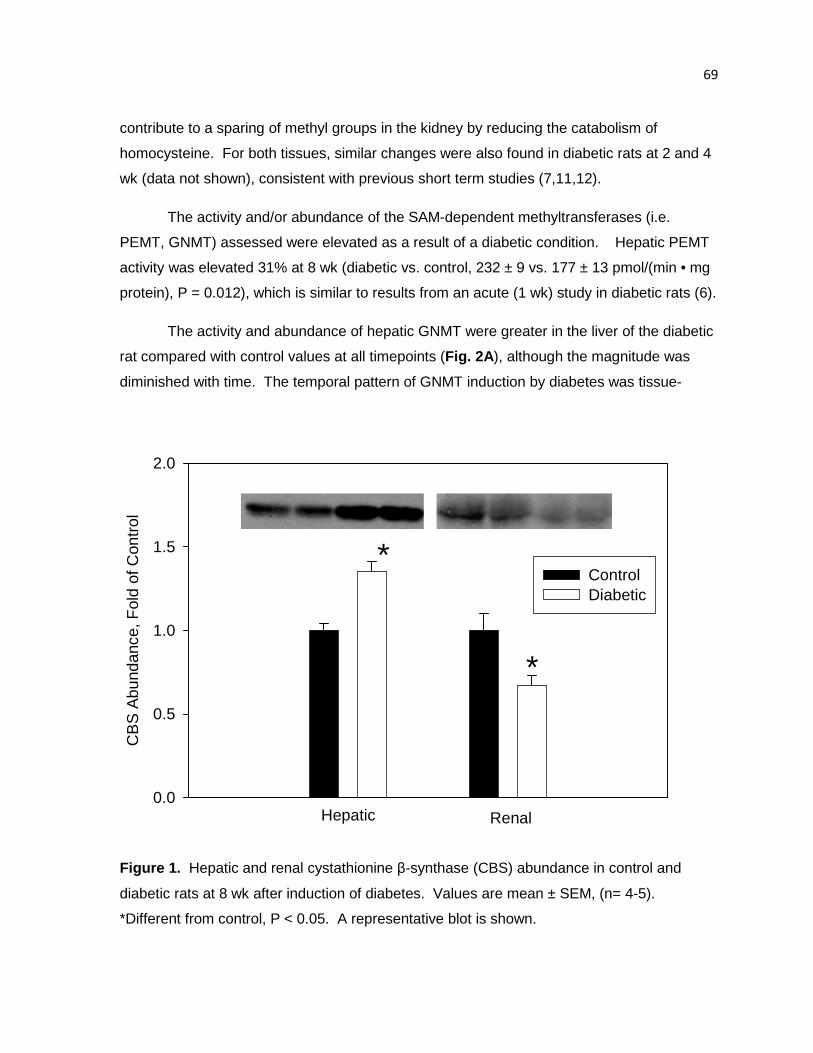
69
contribute to a sparing of methyl groups in the kidney by reducing the catabolism of
homocysteine. For both tissues, similar changes were also found in diabetic rats at 2 and 4
wk (data not shown), consistent with previous short term studies (7,11,12).
The activity and/or abundance of the SAM-dependent methyltransferases (i.e.
PEMT, GNMT) assessed were elevated as a result of a diabetic condition. Hepatic PEMT
activity was elevated 31% at 8 wk (diabetic vs. control, 232 ± 9 vs. 177 ± 13 pmol/(min • mg
protein), P = 0.012), which is similar to results from an acute (1 wk) study in diabetic rats (6).
The activity and abundance of hepatic GNMT were greater in the liver of the diabetic
rat compared with control values at all timepoints (Fig. 2A ), although the magnitude was
diminished with time. The temporal pattern of GNMT induction by diabetes was tissue-
CB
S A
bund
ance
, Fol
d of
Con
trol
0.0
0.5
1.0
1.5
2.0
ControlDiabetic
Hepatic Renal
*
*
Figure 1. Hepatic and renal cystathionine β-synthase (CBS) abundance in control and
diabetic rats at 8 wk after induction of diabetes. Values are mean ± SEM, (n= 4-5).
*Different from control, P < 0.05. A representative blot is shown.
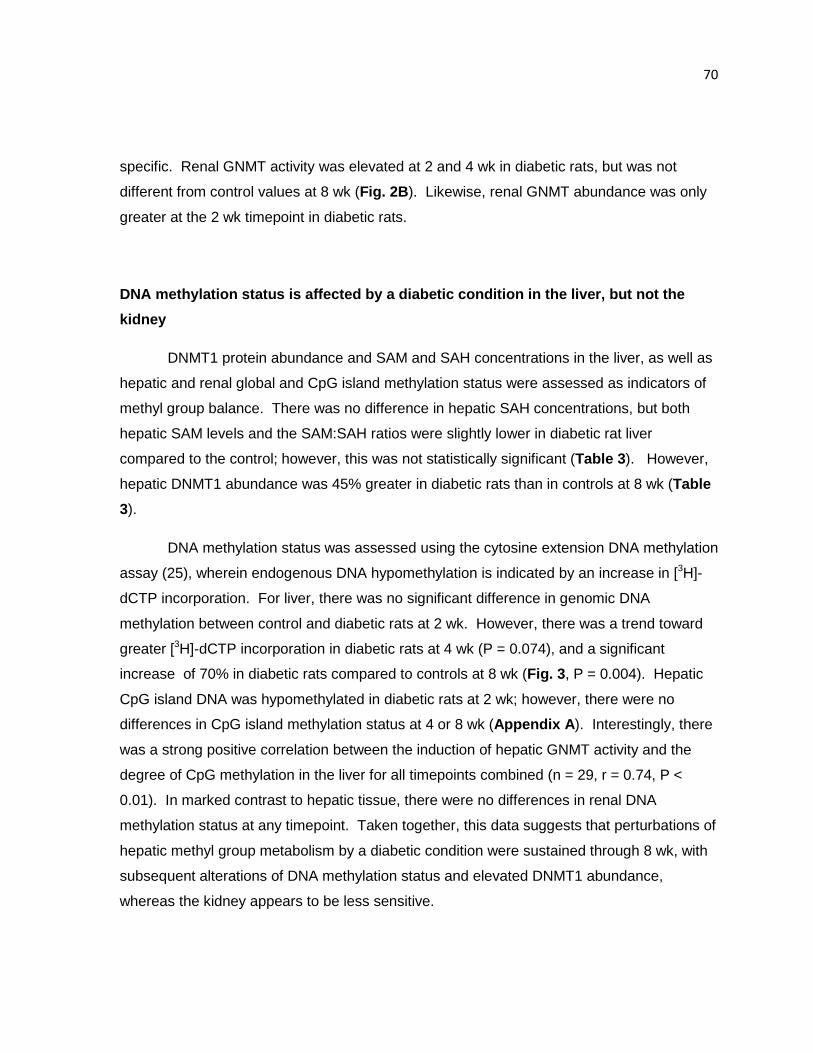
70
specific. Renal GNMT activity was elevated at 2 and 4 wk in diabetic rats, but was not
different from control values at 8 wk (Fig. 2B ). Likewise, renal GNMT abundance was only
greater at the 2 wk timepoint in diabetic rats.
DNA methylation status is affected by a diabetic condition in the liver, but not the
kidney
DNMT1 protein abundance and SAM and SAH concentrations in the liver, as well as
hepatic and renal global and CpG island methylation status were assessed as indicators of
methyl group balance. There was no difference in hepatic SAH concentrations, but both
hepatic SAM levels and the SAM:SAH ratios were slightly lower in diabetic rat liver
compared to the control; however, this was not statistically significant (Table 3). However,
hepatic DNMT1 abundance was 45% greater in diabetic rats than in controls at 8 wk (Table
3).
DNA methylation status was assessed using the cytosine extension DNA methylation
assay (25), wherein endogenous DNA hypomethylation is indicated by an increase in [3H]-
dCTP incorporation. For liver, there was no significant difference in genomic DNA
methylation between control and diabetic rats at 2 wk. However, there was a trend toward
greater [3H]-dCTP incorporation in diabetic rats at 4 wk (P = 0.074), and a significant
increase of 70% in diabetic rats compared to controls at 8 wk (Fig. 3 , P = 0.004). Hepatic
CpG island DNA was hypomethylated in diabetic rats at 2 wk; however, there were no
differences in CpG island methylation status at 4 or 8 wk (Appendix A ). Interestingly, there
was a strong positive correlation between the induction of hepatic GNMT activity and the
degree of CpG methylation in the liver for all timepoints combined (n = 29, r = 0.74, P <
0.01). In marked contrast to hepatic tissue, there were no differences in renal DNA
methylation status at any timepoint. Taken together, this data suggests that perturbations of
hepatic methyl group metabolism by a diabetic condition were sustained through 8 wk, with
subsequent alterations of DNA methylation status and elevated DNMT1 abundance,
whereas the kidney appears to be less sensitive.
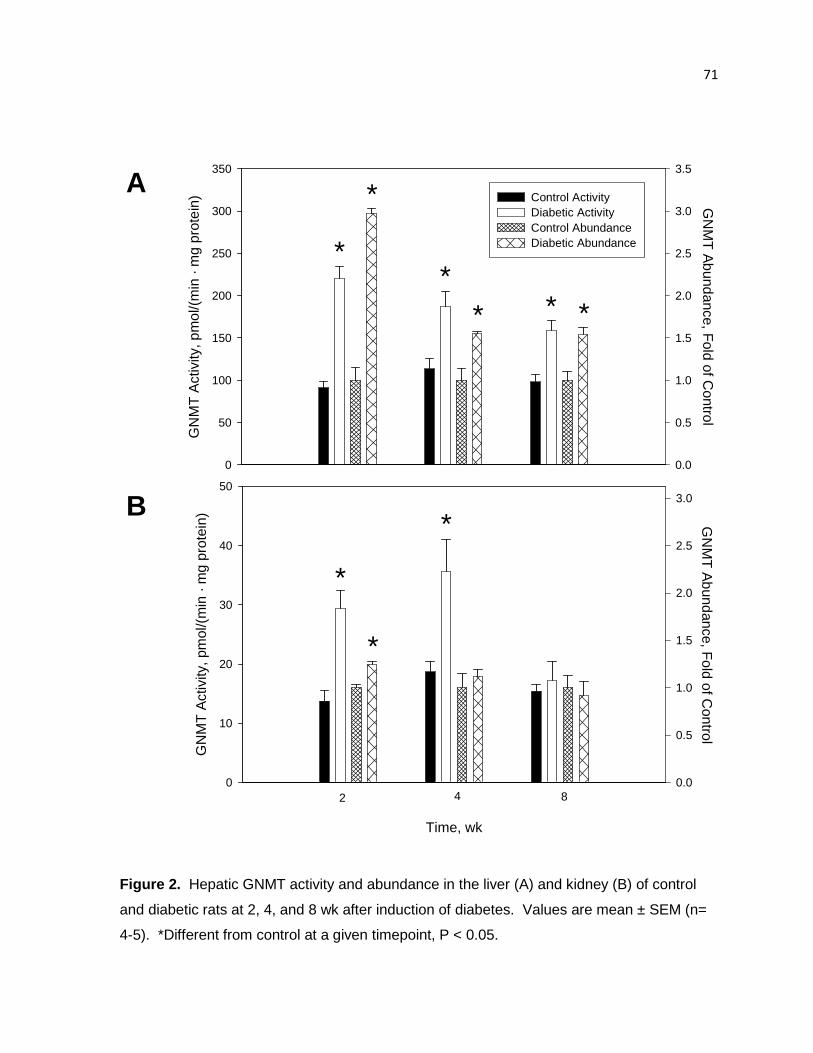
71
Time, wk
GN
MT
Act
ivity
, pm
ol/(
min
· m
g pr
otei
n)
0
10
20
30
40
50
GN
MT
Abundance, F
old of Control
0.0
0.5
1.0
1.5
2.0
2.5
3.0
GN
MT
Act
ivity
, pm
ol/(
min
· m
g pr
otei
n)
0
50
100
150
200
250
300
350
GN
MT
Abundance, F
old of Control
0.0
0.5
1.0
1.5
2.0
2.5
3.0
3.5
Control ActivityDiabetic ActivityControl AbundanceDiabetic Abundance
2 4 8
*
*
*
*
*
** * *
A
B
Figure 2. Hepatic GNMT activity and abundance in the liver (A) and kidney (B) of control
and diabetic rats at 2, 4, and 8 wk after induction of diabetes. Values are mean ± SEM (n=
4-5). *Different from control at a given timepoint, P < 0.05.
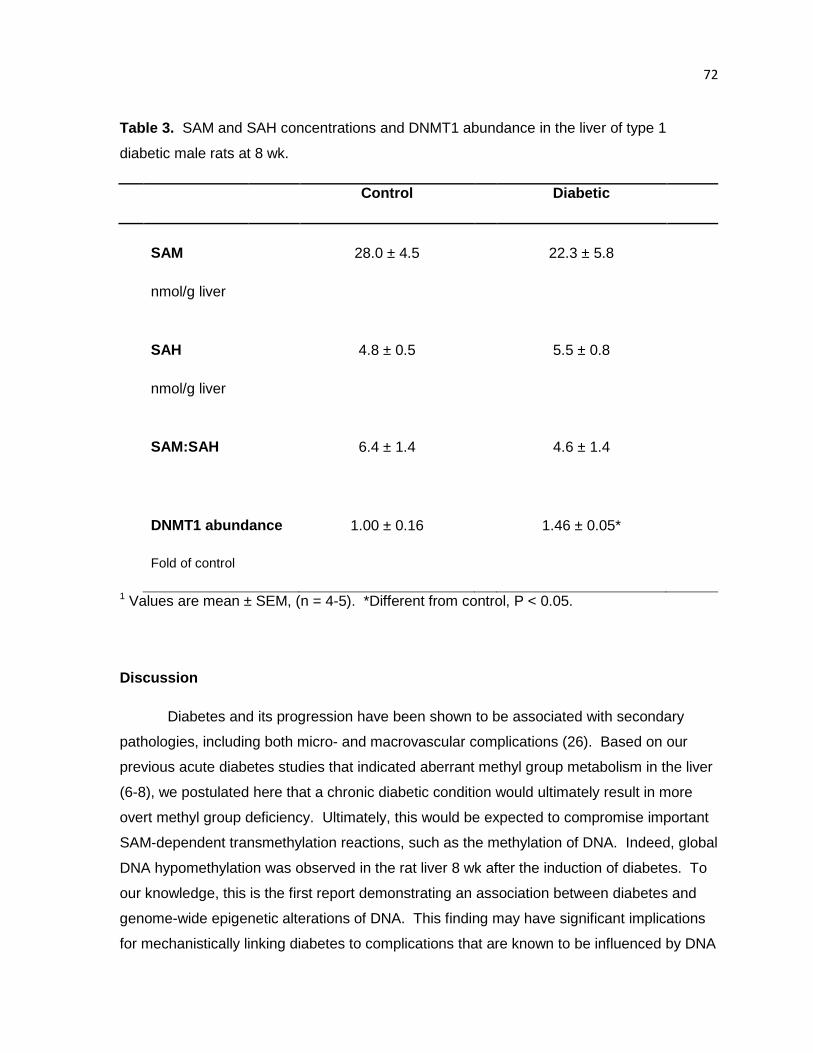
72
Table 3. SAM and SAH concentrations and DNMT1 abundance in the liver of type 1
diabetic male rats at 8 wk.
Control
Diabetic
SAM 28.0 ± 4.5 22.3 ± 5.8
nmol/g liver
SAH 4.8 ± 0.5 5.5 ± 0.8
nmol/g liver
SAM:SAH 6.4 ± 1.4 4.6 ± 1.4
DNMT1 abundance 1.00 ± 0.16 1.46 ± 0.05*
Fold of control
1 Values are mean ± SEM, (n = 4-5). *Different from control, P < 0.05.
Discussion
Diabetes and its progression have been shown to be associated with secondary
pathologies, including both micro- and macrovascular complications (26). Based on our
previous acute diabetes studies that indicated aberrant methyl group metabolism in the liver
(6-8), we postulated here that a chronic diabetic condition would ultimately result in more
overt methyl group deficiency. Ultimately, this would be expected to compromise important
SAM-dependent transmethylation reactions, such as the methylation of DNA. Indeed, global
DNA hypomethylation was observed in the rat liver 8 wk after the induction of diabetes. To
our knowledge, this is the first report demonstrating an association between diabetes and
genome-wide epigenetic alterations of DNA. This finding may have significant implications
for mechanistically linking diabetes to complications that are known to be influenced by DNA
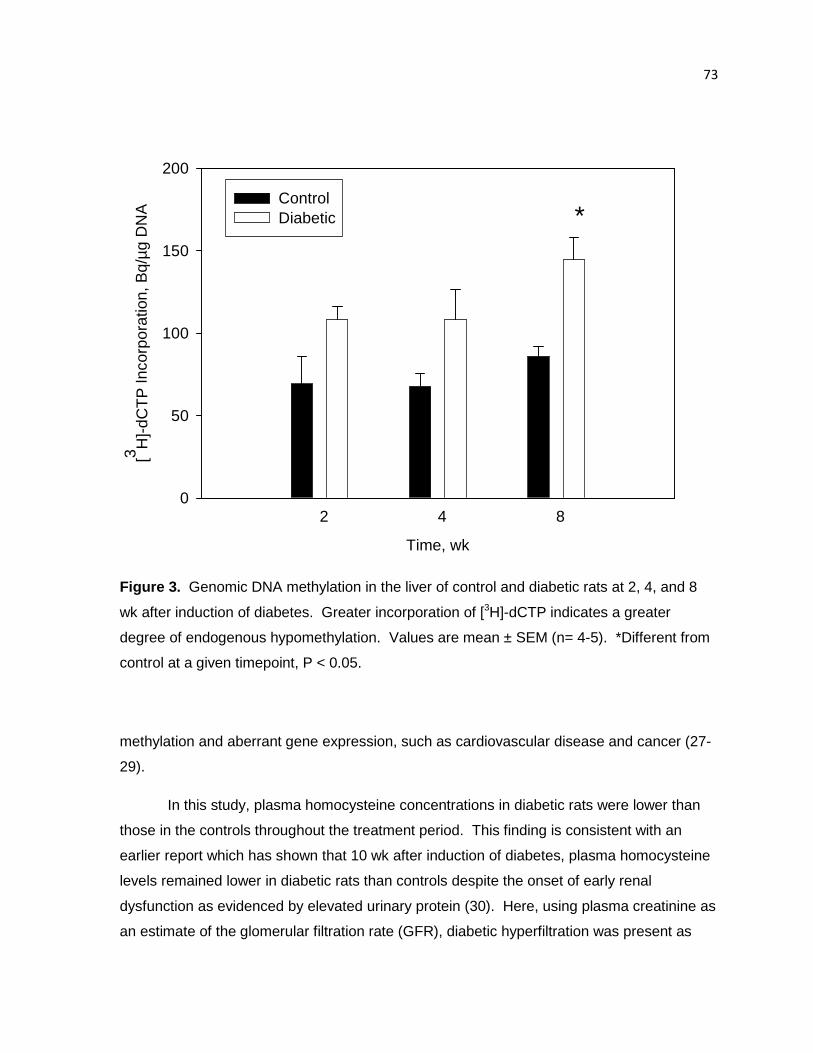
73
Time, wk
[3 H]-
dCT
P In
corp
orat
ion,
Bq/
µg
DN
A
0
50
100
150
200
*
2 4 8
ControlDiabetic
Figure 3. Genomic DNA methylation in the liver of control and diabetic rats at 2, 4, and 8
wk after induction of diabetes. Greater incorporation of [3H]-dCTP indicates a greater
degree of endogenous hypomethylation. Values are mean ± SEM (n= 4-5). *Different from
control at a given timepoint, P < 0.05.
methylation and aberrant gene expression, such as cardiovascular disease and cancer (27-
29).
In this study, plasma homocysteine concentrations in diabetic rats were lower than
those in the controls throughout the treatment period. This finding is consistent with an
earlier report which has shown that 10 wk after induction of diabetes, plasma homocysteine
levels remained lower in diabetic rats than controls despite the onset of early renal
dysfunction as evidenced by elevated urinary protein (30). Here, using plasma creatinine as
an estimate of the glomerular filtration rate (GFR), diabetic hyperfiltration was present as
74
evidenced by lower plasma creatinine levels (Appendix A ). Typically, plasma
homocysteine levels are inversely related to the GFR; thus, during the hyperfiltration that
occurs in early diabetes in both humans and animal models, hypohomocysteinemia is
observed (31-33). However, there was not a significant correlation between plasma
homocysteine and creatinine concentrations (r = 0.279, P = 0.15), suggesting that greater
excretion of homocysteine due to hyperfiltration is not the only determinant of circulating
homocysteine concentrations. This conclusion was also supported by the multivariate
analysis of Wollesen et al (33).
Given the role of the kidney in homocysteine balance (13,14,31), it was of interest to
determine the effects of a diabetic condition in both the liver and the kidney. Hepatic
perturbations of methyl group metabolism were sustained throughout the duration of the
study, whereas the alterations in renal methyl group metabolism were more transient and no
change in DNA methylation was observed. In support of this finding, genomic
hypomethylation has been observed in the liver, but not the kidney, of rats fed a methyl-
deficient diet (34). Dietary-induced methyl deficiency is characterized by: genomic and
regional hypomethylation; perturbed expression of DNA methyltransferases and methyl-
binding proteins; aberrant histone modifications; uracil misincorporation; and DNA strand
breaks (15,34-37). All of these alterations contribute to genomic instability and thus play an
important role in carcinogenesis. Induction of DNMT1 is characteristic of dietary-induced
methyl deficiency (15,37) and was also observed in our diabetic rats at wk 8 in this
experiment.
The results presented here suggest that alterations of methyl group metabolism were
sustained in the liver, whereas the kidney was less sensitive to such changes. Despite
differences in the pathology of type 1 vs. type 2 diabetes, the characteristic changes in
methyl group metabolism appear to be similar for both conditions. The increases in hepatic
GNMT, PEMT, BHMT, and CBS activity and/or abundance, as well as the decrease in
hepatic MS activity has been previously described in acute models of type 1 and/or 2
diabetes (6-12). The data presented here suggests that these hepatic effects are sustained
for at least 8 wk. However, in the kidney there was only transient induction of GNMT, a
decrease in CBS abundance, and no difference in either MS activity or DNA methylation
status. Taken together, the diabetic rat model shows similarities to methyl-deficient rat
model, such that hepatic methyl group and methionine metabolism is perturbed for at least 8
75
wk, resulting in genomic hypomethylation and aberrant expression of DNMT1. Moreover,
these effects are clearly tissue-specific.
The changes induced by a diabetic condition could have secondary consequences,
particularly based on the collective changes in GNMT and DNA methylation. GNMT is
multifunctional and in diabetes it may be upregulated to generate pyruvate from methionine
for gluconeogenesis, especially as its expression is limited to gluconeogenic tissues (38); it
is also a proposed regulator of the SAM:SAH ratio (39). Thus, upregulation of GNMT in
diabetes would be expected to decrease the SAM:SAH ratio, thus limiting the intracellular
transmethylation potential and numerous transmethylation reactions, including DNA
methylation. Although the hepatic SAM:SAH in diabetic rats in this study was not
significantly different, DNA hypomethylation was clearly evident. For liver, dietary methyl
deficiency is an independent carcinogen and has long been known to cause
hypomethylation in the promoter regions of oncogenes (40,41). With the functional methyl
deficiency associated with a diabetic condition, it would be expected that diabetes may also
be associated with increased risk of hepatocellular carcinoma. This is supported by several
epidemiological studies examining the relationship between diabetes and cancer have found
an increased incidence of liver cancers of both type 1 and/or type 2 diabetic patients (42-
45). In addition to hepatic carcinogenesis, hypomethylation of DNA and alterations of
methyl group metabolism have also been implicated in the development of vascular
diseases. Global DNA hypomethylation has been observed in advanced atherosclerosis in
the rabbit and mouse, as well as in humans (27,28). Aberrant DNA methylation patterns
have been detected early in the development of the disease (46) and become more
prevalent with the progression of atherosclerosis, thus suggesting that epigenetic
mechanisms may play a critical role in the atherosclerotic pathogenesis. It remains to be
determined if diabetes-induced changes in DNA methylation are linked to cardiovascular
disease.
Regulation of specific enzymes of methyl group metabolism may also impact DNA
methylation status and pathogenesis of disease. Deficiency of MS or MTHFR were both
reported to have negative effects on cerebral vascular function and lipid deposition was
found in the aorta of mice hetero- or homozygous for the MTHFR knockout (47,48). Both
MTHFR mutants also had lower SAM:SAH ratios and regions of both DNA hypomethylation
in several tissues, suggesting impaired methylation capacity (48). GNMT is proposed to be
76
the primary regulator of methyl group supply and utilization and thus, aberrant regulation of
GNMT activity might be expected to perturb DNA methylation status. A recent report by
Martinez-Chantar et al (49) demonstrates that in GNMT-knockout mice methylation status of
specific genes was increased. We found a similar relationship in the diabetic rat liver, such
that lower levels of GNMT activity were correlated with a greater degree of CpG island
methylation and upregulation of GNMT was associated with hypomethylation. It would
appear that decreasing GNMT activity was associated with the silencing of genes, whereas
increasing GNMT activity would favor the activation of genes.
DNA methylation has also been closely linked to patterns of histone methylation and
other histone modifications which could also contribute to aberrant gene expression and
development of disease (29). Recently it was reported that in lymphocytes cultured under
high glucose, methylation patterns of histones were altered in the regions of several genes
which may be associated with diabetes via signal transduction, transporter, inflammation,
and oxidant stress pathways (50). Mechanistically, evidence suggests that aberrant
expression of methyl-binding proteins, histone methyltransferases and histone acetylases
are also involved (15,37,50).
In summary, we have shown for the first time that chronic alterations of methyl group
metabolism concomitant with genomic hypomethylation in the rat liver as a result of type 1
diabetes. In contrast, the kidney was more resistant to perturbations of methyl group
metabolism and no changes were found in renal DNA methylation. The identification of
widespread genomic DNA hypomethylation is a particularly novel finding and supports our
hypothesis that a functional methyl deficiency develops in a diabetic state and may have
implications concerning gene expression, DNA stability, and the development of secondary
complications, such as vascular diseases and tissue-specific carcinogenesis. Because
regulation of GNMT appears to be a major determinant of DNA hypomethylation, it is of
interest to note that the tissues shown to be susceptible to cancer development in diabetes
(42-45) are the same tissues that are known to express GNMT (38). Future research efforts
will be geared towards further characterizing these metabolic and epigenetic alterations to
gain a better understanding of the consequences of these changes and identifying timely
dietary interventions that might be successful in ameliorating negative effects.
77
Literature Cited
1. Kang SS, Wong PW, Malinow MR. Hyperhomocyst(e)inemia as a risk factor for occlusive vascular disease. Annu Rev Nutr. 1992;12:279-98.
2. Newberne PM, Rogers AE. Labile methyl groups and the promotion of cancer. Annu Rev Nutr. 1986;6:407-32.
3. Mattson MP, Shea TB. Folate and homocysteine metabolism in neural plasticity and neurodegenerative disorders. Trends Neurosci. 2003;26:137-46.
4. Scott JM, Kirke PN, Weir DG. The role of nutrition in neural tube defects. Annu Rev Nutr. 1990;10:277-95.
5. Stead LM, Brosnan JT, Brosnan ME, Vance DE, Jacobs RL. Is it time to reevaluate methyl balance in humans? Am J Clin Nutr. 2006;83:5-10.
6. Hartz CS, Nieman KM, Jacobs RL, Vance DE, Schalinske KL. Hepatic phosphatidylethanolamine N-methyltransferase expression is increased in diabetic rats. J Nutr. 2006;136 3005-9.
7. Nieman KM, Rowling MJ, Garrow TA, Schalinske, KL. Modulation of methyl group metabolism by streptozotocin-induced diabetes and all-trans-retinoic acid. J Biol Chem. 2004;279:45708-12.
8. Nieman KM, Hartz CS, Szegedi SS, Garrow TA, Sparks JD, Schalinske KL. Folate status modulates the induction of hepatic glycine N-methyltransferase and homocysteine metabolism in rats. Am J Physiol Endocrinol Metab. 2006;291:E1235-42.
9. Wijekoon EP, Hall B, Ratnam S, Brosnan ME, Zeisel SH, Brosnan JT. Homocysteine metabolism in ZDF (type 2) diabetic rats. Diabetes. 2005;54:3245-51.
10. Ratnam S, Wijekoon EP, Hall B, Garrow TA, Brosnan ME, Brosnan JT. Effects of diabetes and insulin on betaine-homocysteine S-methyltransferase expression in rat liver. Am J Physiol Endocrinol Metab. 2006;290:E933-9.
11. Jacobs RL, House JD, Brosnan ME, Brosnan JT. Effects of streptozotocin-induced diabetes and of insulin treatment on homocysteine metabolism in the rat. Diabetes. 1998;47:1967-70.
12. Ratnam S, Maclean KN, Jacobs RL, Brosnan ME, Kraus JP, Brosnan JT. Hormonal regulation of cystathionine beta-synthase expression in liver. J Biol Chem. 2002;277:42912-8.
13. Poirier LA, Brown AT, Fink LM, Wise CK, Randolph CJ, Delongchamp RR, Fonseca VA. Blood S-adenosylmethionine concentrations and lymphocyte methylenetetrahydrofolate reductase activity in diabetes mellitus and diabetic nephropathy. Metabolism. 2001;50:1014-8.
14. Tessari P, Coracina A, Kiwanuka E, Vedovato M, Vettore M, Valerio A, Zaramella M, Garibotto G. Effects of insulin on methionine and homocysteine kinetics in type 2 diabetes with nephropathy. Diabetes. 2005;54:2968-76.
15. Ghoshal K, Li X, Datta J, Bai S, Pogribny I, Pogribny M, Huang Y, Young D, Jacob ST. A folate- and methyl-deficient diet alters the expression of DNA
78
methyltransferases and methyl CpG binding proteins involved in epigenetic gene silencing in livers of F344 rats. J Nutr. 2006;136:1522-7.
16. Liu HH, Chen KH, Shih YP, Lui WY, Wong FH, Chen, YMA. Characterization of reduced expression of glycine N-methyltransferase in cancerous hepatic tissues using two newly developed monoclonal antibodies. J Biomed Sci. 2003;10:87–97.
17. Rowling MJ, Schalinske KL. Retinoid compounds activate and induce hepatic glycine N-methyltransferase in rats. J Nutr. 2001;131:1914-7.
18. Cook RJ, Wagner C. Glycine N-methyltransferase is a folate binding protein of rat liver cytosol. Proc Natl Acad Sci U S A. 1984;81:3631-4.
19. Duce AM, Ortiz P, Cabrero C, Mato JM. S-adenosyl-L-methionine synthetase and phospholipid methyltransferase are inhibited in human cirrhosis. Hepatology 1988;8:65-8.
20. Garrow TA. Purification, kinetic properties, and cDNA cloning of mammalian betaine-homocysteine methyltransferase. J Biol Chem. 1996;271:22831-8.
21. Keating JN, Weir PG, Scott JM. Demonstration of methionine synthetase in intestinal mucosal cells of the rat. Clin Sci (Lond). 1985;69:287-92.
22. Tanghe KA, Garrow TA, Schalinske KL. Triiodothyronine treatment attenuates the induction of hepatic glycine N-methyltransferase by retinoic acid and elevates plasma homocysteine concentrations in rats. J Nutr. 2004;134:2913-8.
23. Ubbink JB, Hayward Vermaak WJ, Bissbort S. Rapid high-performance liquid chromatographic assay for total homocysteine levels in human serum. J Chromotogr. 1991;565:441-6.
24. Fell D, Benjamin LE, Steele RD. Determination of adenosine and S-adenosyl derivatives of sulfur amino acids in rat liver by high-performance liquid chromatography. J Chromatogr. 1985;345:150-6.
25. Pogribny I, Yi P, James SJ. A sensitive new method for rapid detection of abnormal methylation patterns in global DNA and within CpG islands. Biochem Biophys Res Comm. 1999;262:624-8.
26. Milicevic Z, Raz I, Beattie SD, Campaigne BN, Sarwat S, Gromniak E, Kowalska I Galic E, Tan M, Hanefeld M. Natural history of cardiovascular disease in patients with diabetes: role of hyperglycemia. Diabetes Care. 2008;31:S155-60.
27. Hiltunen MO, Ylä-Herttuala S. DNA methylation, smooth muscle cells, and atherogenesis. Arterioscler Thromb Vasc Biol. 2003;23:1750-3.
28. Zaina S, Lindholm MW, Lund G. Nutrition and aberrant DNA methylation patterns in atherosclerosis: more than just hyperhomocysteinemia? J Nutr. 2005;135:5-8.
29. Ballestar E, Esteller M. Methyl-CpG-binding proteins in cancer: blaming the DNA methylation messenger. Biochem Cell Biol. 2005;83:374-84.
30. Unlüçerçi Y, Bekpinar S, Gürdöl F, Seferoğlu G. A study on the relationship between homocysteine and diabetic nephropathy in rats. Pharmacol Res. 2002;45:249-52.
31. Friedman AN, Bostom AG, Selhub J, Levey AS, Rosenberg IH. The kidney and homocysteine metabolism. J Am Soc Nephrol. 2001;12:2181-9.
79
32. Premaratne E, Macisaac RJ, Tsalamandris C, Panagiotopoulos S, Smith T, Jerums G. Renal hyperfiltration in type 2 diabetes: effect of age-related decline in glomerular filtration rate. Diabetologia. 2005;48:2486-93.
33. Wollesen F, Brattström L, Refsum H, Ueland PM, Bergland L, Berne C. Plasma total homocysteine and cysteine in relation to glomerular filtration rate in diabetes mellitus. Kidney Int. 1999;55:1028-35.
34. Pogribny IP, James SJ, Jernigan S, Pogribna M. Genomic hypomethylation is specific for preneoplastic liver in folate/methyl deficient rats and does not occur in non-target tissues. Mutat Res. 2004;133:S3740-7.
35. James SJ, Pogribny IP, Pogribna M, Miller BJ, Jernigan S, Melnyk S. Mechanisms of DNA damage, DNA hypomethylation, and tumor progression in the folate/methyl-deficient rat model of hepatocarcinogenesis. J Nutr. 2003;133:S3741-7.
36. Pogribny IP, Tryndyak VP, Muskhelishvili L, Rusyn I, Ross SA. Methyl deficiency, alterations in global histone modifications, and carcinogenesis. J Nutr. 2007;137:S216-22.
37. Lopatina NG, Vanyushin BF, Cronin GM, Poirier LA. Elevated expression and altered pattern of activity of DNA methyltransferase in liver tumors of rats fed methyl-deficient diets. Carcinogenesis. 1998;19:1777-81.
38. Yeo EJ, Wagner C. Tissue distribution of glycine N-methyltransferase, a major folate-binding protein of liver. Proc Natl Acad Sci USA. 1994;91:210-4.
39. Kerr SJ. Competing methyltransferase systems. J Biol Chem. 1972;247:4248-52. 40. Bhave MR, Wilson MJ, Poirier LA. c-H-ras and c-K-ras gene hypomethylation in the
livers and hepatomas of rats fed methyl-deficient, amino acid-defined diets. Carcinogenesis. 1988;9:343-8.
41. Zapisek WF, Cronin GM, Lyn-Cook BD, Poirier LA. The onset of oncogene hypomethylation in the livers of rats fed methyl-deficient, amino acid-defined diets. Carcinogenesis. 1992;13:1869-72.
42. Batty GD, Shipley MJ, Marmot M, Smith GD. Diabetes status and post-load plasma glucose concentration in relation to site-specific mortality: findings from the original Whitehall study. Cancer Causes Control. 2004;15:873-81.
43. Coughlin SS, Calle EE, Teras LR, Petrelli J, Thun MJ. Diabetes mellitus as a predictor of cancer mortality in a large cohort of US adults. Am J Epidemiol. 2004;159:1160-7.
44. Hassan MM, Hwang LY, Hatten CJ, Swaim M, Li D, Abbruzzese JL, Beasley P, Patt YZ. Risk factors for hepatocellular carcinoma: synergism of alcohol with viral hepatitis and diabetes mellitus. Hepatology. 2002;36:1206-13.
45. Rousseau MC, Parent ME, Pollak MN, Siemiatycki J. Diabetes mellitus and cancer risk in a population-based case-control study among men from Montreal, Canada. Int J Cancer. 2006;118:2105-9.
46. Lund G, Andersson L, Lauria M, Lindholm M, Fraga MF, Villar-Garea A, Ballestar E, Esteller M, Zaina S. DNA methylation polymorphisms precede any histological sign of atherosclerosis in mice lacking apolipoprotein E. J Biol Chem. 2004;279:29147-54.
80
47. Dayal S, Devlin AM, McCaw RB, Liu ML, Aming E, Bottiglieri T, Shane B, Faraci FM, Lentz SR. Cerebral vascular dysfunction in methionine synthase-deficient mice. Circulation. 2005;112:737-44.
48. Chen Z, Karaplis AC, Ackerman SL, Pogribny IP, Melnyk S, Lussier-Cacan S, Chen MF, Pai A, John SW et al. Mice deficient in methylenetetrahydrofolate reductase exhibit hyperhomocysteinemia and decreased methylation capacity, with neuropathology and aortic lipid deposition. Hum Mol Genet. 2001;10:433-43.
49. Martinez-Chantar ML, Vázquez-Chantada M, Ariz U, Martinez N, Varela M, Luka Z, Capdevila A, Rodriguez J, Aransay AM et al. Loss of the glycine N-methyltransferase gene leads to steatosis and hepatocellular carcinoma in mice. Hepatology. 2008;47:1191-9.
50. Miao F, Wu X, Zhang L, Yuan YC, Riggs AD, Natarajan R. Genome-wide analysis of histone lysine methylation variations caused by diabetic conditions in human monocytes. J Biol Chem. 2007;282:13854-63.
81
CHAPTER 5: Tissue-specific alterations of methyl g roup metabolism and DNA
hypermethylation in the Zucker (type 2) diabetic fa tty (ZDF) rat
A manuscript to be submitted to the American Journal of Physiology – Endocrinology and
Metabolism
Kelly T. Williams and Kevin L. Schalinske
Abstract
Altered methyl group and homocysteine metabolism was tissue-specific, non-
transient, and preceded hepatic DNA hypomethylation in streptozotocin (STZ)-induced type
1 diabetic rats. Similar perturbations of hepatic methyl group and homocysteine
metabolism have been shown in the Zucker (type 2) diabetic fatty (ZDF) rat in the pre- and
early diabetic stages, but the tissue specificity and effect on epigenetic regulation are
unknown, particularly with respect to disease progression. With this objective in mind, ZDF
and lean rats (ZDF/Gmi fa/fa and +/?) were euthanized at 12 and 21 wk of age, representing
early and advanced diabetic conditions. At 12 wk, hepatic glycine N-methyltransferase
(GNMT), methionine synthase, and cystathionine β-synthase (CBS) activity and/or
abundance were increased, whereas plasma homocysteine was decreased in ZDF rats. At
21 wk, GNMT activity was increased in liver and kidney. In liver only, there was a trend
toward increased CBS protein abundance (78%) and betaine-homocysteine S-
methyltransferase mRNA expression (~100%). Phosphatidylethanolamine N-
methyltransferase activity tended to be lower in ZDF liver despite a significant increase in
mRNA abundance. Homocysteine levels were decreased in plasma and kidney, but not in
liver, at 12 and 21 wk. In contrast to the hypomethylation observed in the STZ-diabetic rat
liver, hepatic genomic DNA was hypermethylated at 12 and 21 wk in ZDF rats, concurrent
with a trend toward increased DNMT1 mRNA expression (p = 0.08) at 21 wk. In conclusion,
the progression of type 2 diabetes in the ZDF rat was associated with tissue- and disease
stage-specific aberrations of methyl group and homocysteine metabolism, with persistent
hepatic global DNA hypermethylation.
82
Introduction
It is estimated that over 12% of the U.S. population is afflicted with diabetes, with
type 2 diabetes representing 95% of cases (1). Diabetes has been identified as a condition
that can profoundly alter methyl group and homocysteine metabolism (2,3). There are three
primary pathways involved in homocysteine metabolism: transmethylation, remethylation via
folate/B12-dependent or –independent means, and transsulfuration (Figure 1 ). For
transmethylation reactions, methionine is activated to S-adenosylmethionine (SAM), which
serves as the universal methyl group donor for numerous methyltransferases, resulting in
the methylation of substrates such as nucleic acids, lipids, and proteins. Methyltransferase
reactions result in the generation of homocysteine, which can be remethylated back to
methionine using methyl groups donated by either 5-methyltetrahydrofolate (5-CH3-THF) or
betaine. For folate-dependent remethylation, the B12-dependent enzyme methionine
synthase (MS) utilizes a methyl group from 5-CH3-THF. Betaine-homocysteine S-
methyltransferase (BHMT) catalyzes the folate-independent remethylation of homocysteine
using betaine, a methyl group donor derived from choline oxidation. Alternatively,
homocysteine can be catabolized through the transsulfuration pathway to cysteine,
beginning with the irreversible conversion to cystathionine by cystathionine β-synthase
(CBS).
We, and others, have previously shown that an early diabetic condition alters methyl
group and homocysteine metabolism. Diabetes induced hepatic protein abundance and
activity of glycine N-methyltransferase (GNMT) and phosphatidylethanolamine N-
methyltransferase (PEMT, 4-9). Both enzymes have important roles in regulation of methyl
groups and homocysteine: GNMT is proposed to be a regulator of the transmethylation
potential via maintenance of the SAM:S-adenosylhomocysteine (SAH) ratio, PEMT is
purported to be the greatest consumer of SAM-derived methyl groups (10) and catalyzes the
sequential trimethylation of phosphatidylethanolamine to phosphatidylcholine. Induction of
BHMT and CBS are also consistently observed in diabetic or glucocorticoid-treated
conditions (4,5,7-9,11,12), whereas the effect of diabetes on MS is not consistent. In sum,
these metabolic alterations result in hypohomocysteinemia in the early diabetic condition,
likely owing in part to greater upregulation of transsulfuration and remethylation via BHMT
such that it overwhelms increases in transmethylation. Importantly, similar aberrations are
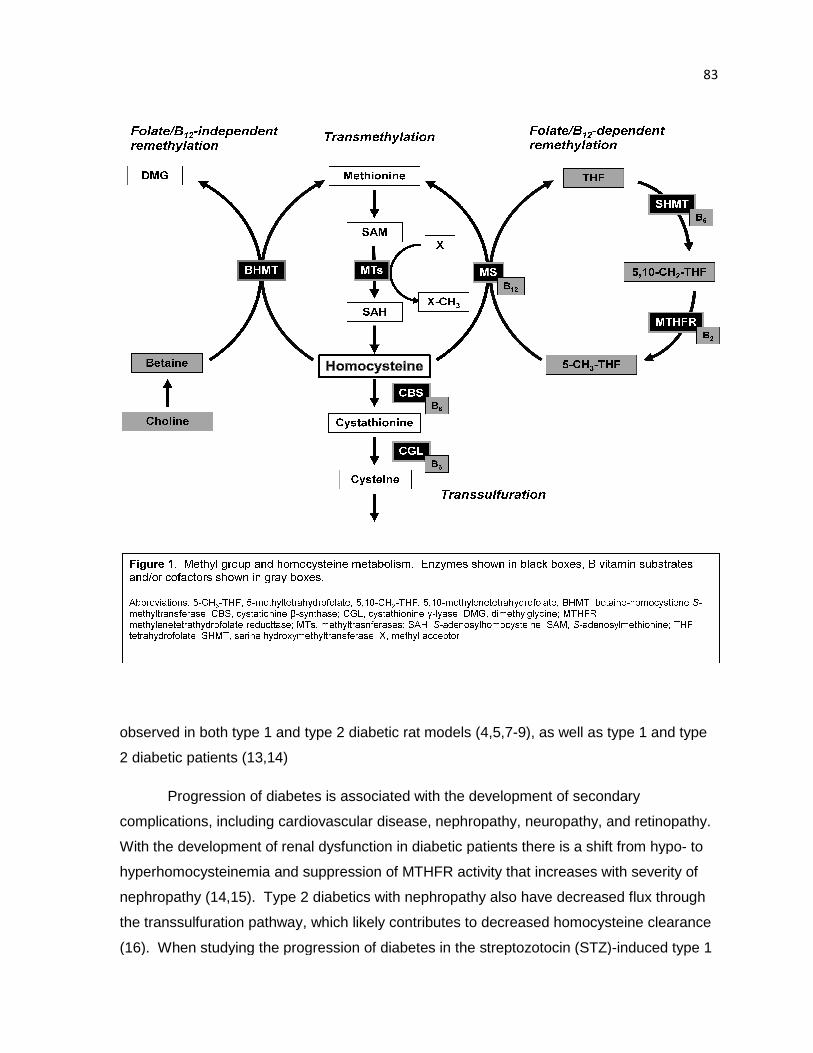
observed in both type 1 and type 2 diabetic rat models (4,5,7
2 diabetic patients (13,14)
Progression of diabetes is associated with the development of secondary
complications, including cardiovascular disease, nephropathy, n
With the development of renal dysfunction in diabetic patients there is a shift from hypo
hyperhomocysteinemia and suppression of MTHFR activity that increases with severity of
nephropathy (14,15). Type 2 diabetics with n
the transsulfuration pathway, which likely contributes to decreased homocysteine clearance
(16). When studying the progression of diabetes in the streptozotocin
observed in both type 1 and type 2 diabetic rat models (4,5,7-9), as well as type 1 and type
Progression of diabetes is associated with the development of secondary
complications, including cardiovascular disease, nephropathy, neuropathy, and retinopathy.
With the development of renal dysfunction in diabetic patients there is a shift from hypo
hyperhomocysteinemia and suppression of MTHFR activity that increases with severity of
nephropathy (14,15). Type 2 diabetics with nephropathy also have decreased flux through
, which likely contributes to decreased homocysteine clearance
(16). When studying the progression of diabetes in the streptozotocin (STZ)
83
9), as well as type 1 and type
Progression of diabetes is associated with the development of secondary
europathy, and retinopathy.
With the development of renal dysfunction in diabetic patients there is a shift from hypo- to
hyperhomocysteinemia and suppression of MTHFR activity that increases with severity of
have decreased flux through
, which likely contributes to decreased homocysteine clearance
(STZ)-induced type 1
84
diabetic rat, we noted that the effect of diabetes was tissue-specific and sustained
alterations of hepatic methyl group and homocysteine metabolism appeared to lead to a
methyl deficient condition, as evidenced by genomic DNA hypomethylation in the liver (7).
The progression of type 2 diabetes from prediabetes to the early diabetic state in the
Zucker (type 2) diabetic fatty (ZDF) rat has been shown nicely by Wijekoon et al. (9),
however the advanced diabetic condition has yet to be fully characterized. Poirier et al (14)
reported no differences between the type 1 and type 2 patients within their study, and the
SAM:SAH ratio decreased with increasing severity of disease. Therefore, we hypothesized
that ZDF rats with advanced diabetes would have perturbed methyl group and
homocysteine metabolism, including chronic upregulation of GNMT, and develop a methyl-
deficient condition. Furthermore, due to the functional methyl deficiency, the animals would
have abnormal DNA methylation and expression of epigenetic regulatory proteins, similar to
that observed in the STZ-diabetic rat (7) or rats fed methyl-deficient diets (16).
Materials and Methods
Chemicals and reagents Reagents were obtained as follows: 3T3 fully methylated DNA,
BssHII, HpaII, and MspI restriction enzymes, New England Biolabs, Inc. (Ipswich, MA); 5-
[3H]-dCTP, MP Biomedicals (Solon, OH); enhanced chemiluminescence Western blotting
detection reagents and 5-[14C]-methyl-THF, Amersham/GE Healthcare (Piscataway, NJ);
CBS antibody (H-300, sc-67154), goat anti-rabbit and goat anti-chicken horseradish
peroxidase secondary antibodies, Santa Cruz Biotechnology, Inc (Santa Cruz, CA); and S-
adenosyl-L-[3H]-methionine, Perkin Elmer Life Sciences (Waltham, MA). All other reagents
were of analytical grade.
Animals All animal protocols were approved by and conducted in accordance with the
guidelines set forth by the Iowa State University Institutional Animal Care and Use
Committee. The first set of experiments utilized rats which were purchased at 11 wk of age,
allowed to acclimate for 1 wk, and terminated at 12 wk of age. For the second study, rats
were purchased at 10 wk of age and sacrificed at 21 wk of age. Each study utilized six lean
(ZDF/Gmi +/?) and six ZDF (ZDF/Gmi fa/fa) rats (Charles River Laboratories, Wilmington,
MA) kept in individual cages with a 12:12 hr light:dark cycle and given ad libitum access to
85
water and Purina 5008 diet. Animals were fasted for 12 hr prior to euthanasia. Rats were
anesthetized by intraperitoneal injection with ketamine and xylazine (90 and 10 mg/kg
respectively). Blood samples were then collected by cardiac puncture and tissues were
collected including the liver, right kidney, and heart. Blood glucose levels were immediately
assessed using a glucometer. Plasma and serum samples were collected by standard
centrifugation methods and stored at -20°C. Serum insu lin levels were analyzed by
Rat/Mouse Insulin ELISA Kit (Linco, Inc., St Charles, MO). A portion of the liver was
immediately homogenized and cytosolic extracts prepared as previously described (7); the
remainder of the liver and all other tissues were snap frozen in liquid nitrogen and
subsequently stored at -70°C. Protein concentrations of extracts were determined using the
Bradford assay with Coomassie Protein Plus Reagent (Thermo Scientific).
Enzyme assays Activities of GNMT, PEMT, and MS were determined using radioisotopic
assays as previously described (5,6,7,17,18). Briefly, GNMT and MS activity in the liver,
kidney, and heart were determined by incubation of cytosolic extracts with reaction mixes
containing S-adenosyl-L-[3H]-methionine and 5-[14C]-methyl-THF, respectively. After halting
the reaction, the unreacted, radiolabeled substrate was removed via sequestration by
activated charcoal or anion exchange resin. Hepatic PEMT activity in microsomal extracts
was assessed in a similar manner by determining the incorporation of S-adenosyl- L-[3H]-
methionine into the lipid fraction by the enzyme in microsomal extracts. Liquid scintillation
counting was used to determine the extent of radiolabel incorporation for all assays.
Western blotting Relative protein abundance was determined using methods previously
described (7) with minor modifications. All proteins were separated using SDS-PAGE.
Ponceau S staining was used to verify equal loading. For assessment of GNMT, blots were
incubated with a newly-procured affinity-purified chicken antibody (Aves Labs, Inc., Tigard,
OR) directed against the following peptide sequence: KER WNR RKE PAF DK (GNMT
residues #97-110), 1:40000 in TTBS/1% BSA. CBS primary antibody was prepared 1:400 in
TTBS/1% BSA; goat anti-chicken or anti-rabbit horseradish peroxidase secondary
antibodies were prepared at 1:5000 in TTBS. Relative protein amounts were quantified by
densitometric analysis with QuantityOne software (Bio-Rad Laboratories, Hercules, CA).
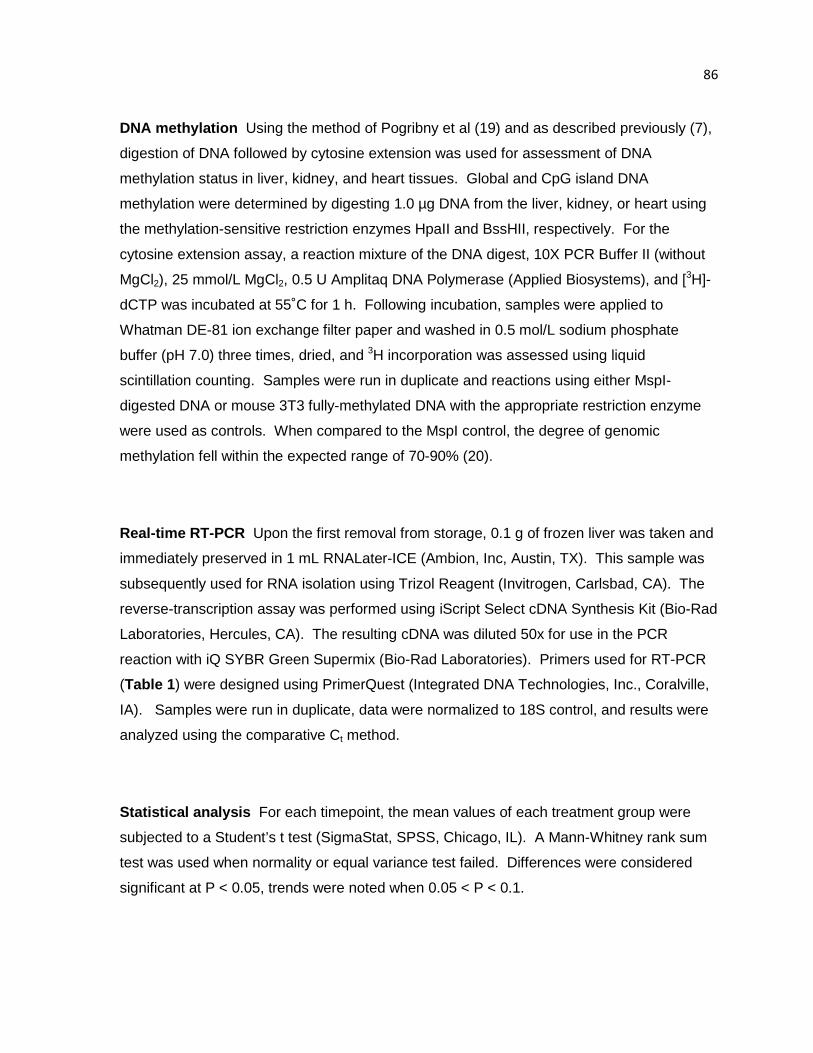
86
DNA methylation Using the method of Pogribny et al (19) and as described previously (7),
digestion of DNA followed by cytosine extension was used for assessment of DNA
methylation status in liver, kidney, and heart tissues. Global and CpG island DNA
methylation were determined by digesting 1.0 µg DNA from the liver, kidney, or heart using
the methylation-sensitive restriction enzymes HpaII and BssHII, respectively. For the
cytosine extension assay, a reaction mixture of the DNA digest, 10X PCR Buffer II (without
MgCl2), 25 mmol/L MgCl2, 0.5 U Amplitaq DNA Polymerase (Applied Biosystems), and [3H]-
dCTP was incubated at 55˚C for 1 h. Following incubation, samples were applied to
Whatman DE-81 ion exchange filter paper and washed in 0.5 mol/L sodium phosphate
buffer (pH 7.0) three times, dried, and 3H incorporation was assessed using liquid
scintillation counting. Samples were run in duplicate and reactions using either MspI-
digested DNA or mouse 3T3 fully-methylated DNA with the appropriate restriction enzyme
were used as controls. When compared to the MspI control, the degree of genomic
methylation fell within the expected range of 70-90% (20).
Real-time RT-PCR Upon the first removal from storage, 0.1 g of frozen liver was taken and
immediately preserved in 1 mL RNALater-ICE (Ambion, Inc, Austin, TX). This sample was
subsequently used for RNA isolation using Trizol Reagent (Invitrogen, Carlsbad, CA). The
reverse-transcription assay was performed using iScript Select cDNA Synthesis Kit (Bio-Rad
Laboratories, Hercules, CA). The resulting cDNA was diluted 50x for use in the PCR
reaction with iQ SYBR Green Supermix (Bio-Rad Laboratories). Primers used for RT-PCR
(Table 1 ) were designed using PrimerQuest (Integrated DNA Technologies, Inc., Coralville,
IA). Samples were run in duplicate, data were normalized to 18S control, and results were
analyzed using the comparative Ct method.
Statistical analysis For each timepoint, the mean values of each treatment group were
subjected to a Student’s t test (SigmaStat, SPSS, Chicago, IL). A Mann-Whitney rank sum
test was used when normality or equal variance test failed. Differences were considered
significant at P < 0.05, trends were noted when 0.05 < P < 0.1.
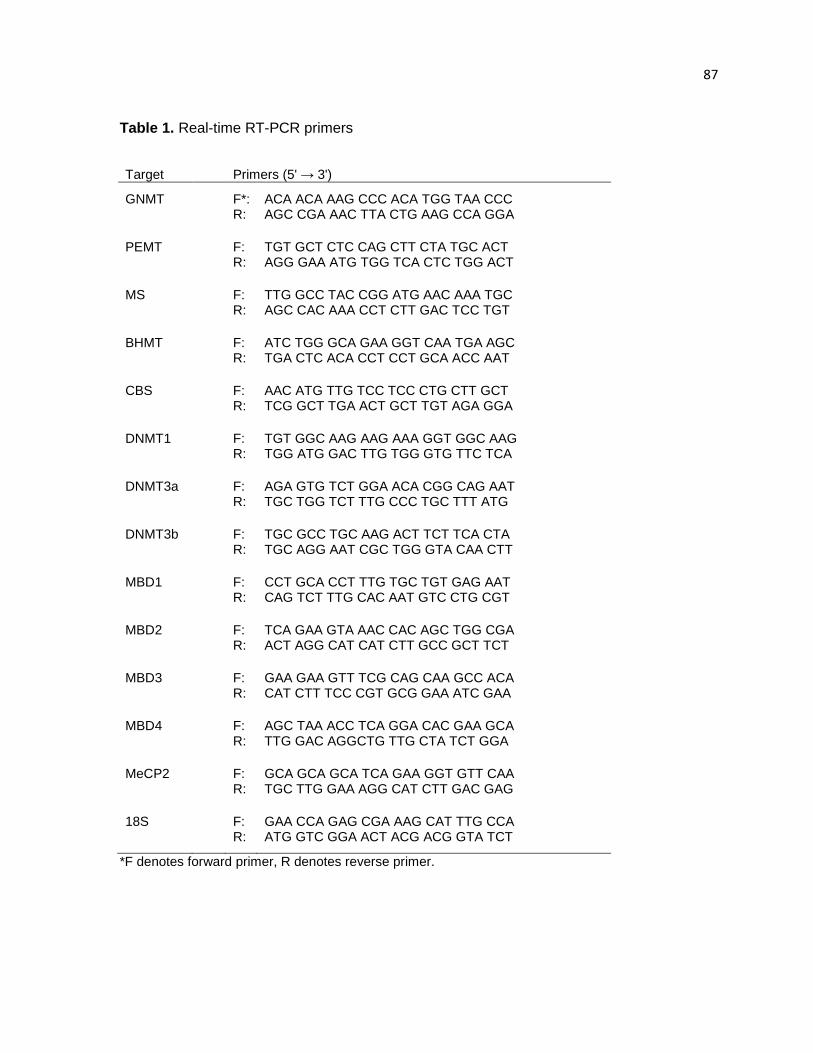
87
Table 1. Real-time RT-PCR primers
Target Primers (5' → 3')
GNMT F*: ACA ACA AAG CCC ACA TGG TAA CCC
R: AGC CGA AAC TTA CTG AAG CCA GGA
PEMT F: TGT GCT CTC CAG CTT CTA TGC ACT R: AGG GAA ATG TGG TCA CTC TGG ACT
MS F: TTG GCC TAC CGG ATG AAC AAA TGC R: AGC CAC AAA CCT CTT GAC TCC TGT
BHMT F: ATC TGG GCA GAA GGT CAA TGA AGC R: TGA CTC ACA CCT CCT GCA ACC AAT
CBS F: AAC ATG TTG TCC TCC CTG CTT GCT R: TCG GCT TGA ACT GCT TGT AGA GGA
DNMT1 F: TGT GGC AAG AAG AAA GGT GGC AAG R: TGG ATG GAC TTG TGG GTG TTC TCA
DNMT3a F: AGA GTG TCT GGA ACA CGG CAG AAT R: TGC TGG TCT TTG CCC TGC TTT ATG
DNMT3b F: TGC GCC TGC AAG ACT TCT TCA CTA R: TGC AGG AAT CGC TGG GTA CAA CTT
MBD1 F: CCT GCA CCT TTG TGC TGT GAG AAT R: CAG TCT TTG CAC AAT GTC CTG CGT
MBD2 F: TCA GAA GTA AAC CAC AGC TGG CGA R: ACT AGG CAT CAT CTT GCC GCT TCT
MBD3 F: GAA GAA GTT TCG CAG CAA GCC ACA R: CAT CTT TCC CGT GCG GAA ATC GAA
MBD4 F: AGC TAA ACC TCA GGA CAC GAA GCA R: TTG GAC AGGCTG TTG CTA TCT GGA
MeCP2 F: GCA GCA GCA TCA GAA GGT GTT CAA R: TGC TTG GAA AGG CAT CTT GAC GAG
18S F: GAA CCA GAG CGA AAG CAT TTG CCA R: ATG GTC GGA ACT ACG ACG GTA TCT
*F denotes forward primer, R denotes reverse primer.
88
Results
General characteristics
The body weights of ZDF rats were significantly greater than their lean counterparts
at 12 wk, whereas there was no significant difference in total body weight between groups at
21 wk (Table 2 ). For the 21 wk experimental group, it was noted that lean controls gained
weight for the duration of the study, but the weight gain of ZDF rats plateaued or declined
beginning around 16 wk of age (Appendix B ), despite markedly increased food intake by
ZDF rats observed at both 12 and 21 wks and throughout the experimental period. All ZDF
rats were hyperglycemic, indicating that the animals were indeed diabetic at both 12 and 21
wk. There was a trend toward hyperinsulinemia in fasted ZDF rats at 12 wks of age, as
would be expected in the early stages of type 2 diabetes with insulin resistance. The
characteristics of the ZDF rat in the advanced diabetic stage were consistent with those
reported by others (21).
Perturbed methyl group metabolism in the ZDF rat
Diabetes produced tissue- and time-specific changes in the expression and activity
of GNMT and PEMT. GNMT activity and protein abundance were elevated in the liver of
ZDF rats compared to lean controls at both 12 and 21 wk of age (Figures 2 and 3). GNMT
mRNA abundance also tended towards an increase in the liver at 21 wks (Table 3 ). Renal
GNMT activity was increased only at 21 wk (p = 0.012) without parallel increases in renal
GNMT protein abundance, suggesting possible post-translational regulation of GNMT
activity in the kidney. Unexpectedly, hepatic PEMT activity was unchanged in the diabetic
rat at 12 wk and there was a trend towards decreased activity at 21 wk (lean vs. ZDF: 88 ±
10 vs. 62 ± 8 pmol/min х mg protein, p = 0.071). However, there was a trend towards
increased hepatic PEMT mRNA abundance at 12 wk and a significant increase of 73% in
PEMT mRNA abundance in ZDF rat liver at 21 wk (Table 3).
Removal of homocysteine via folate/B12-dependent and independent remethylation
or transsulfuration pathways was altered in the ZDF rat. BHMT mRNA abundance was
increased in ZDF rat liver at 21 wk. CBS did not show any changes in mRNA abundance,
but there was a tissue-specific effect on protein abundance (Figure 3 ). Similar to
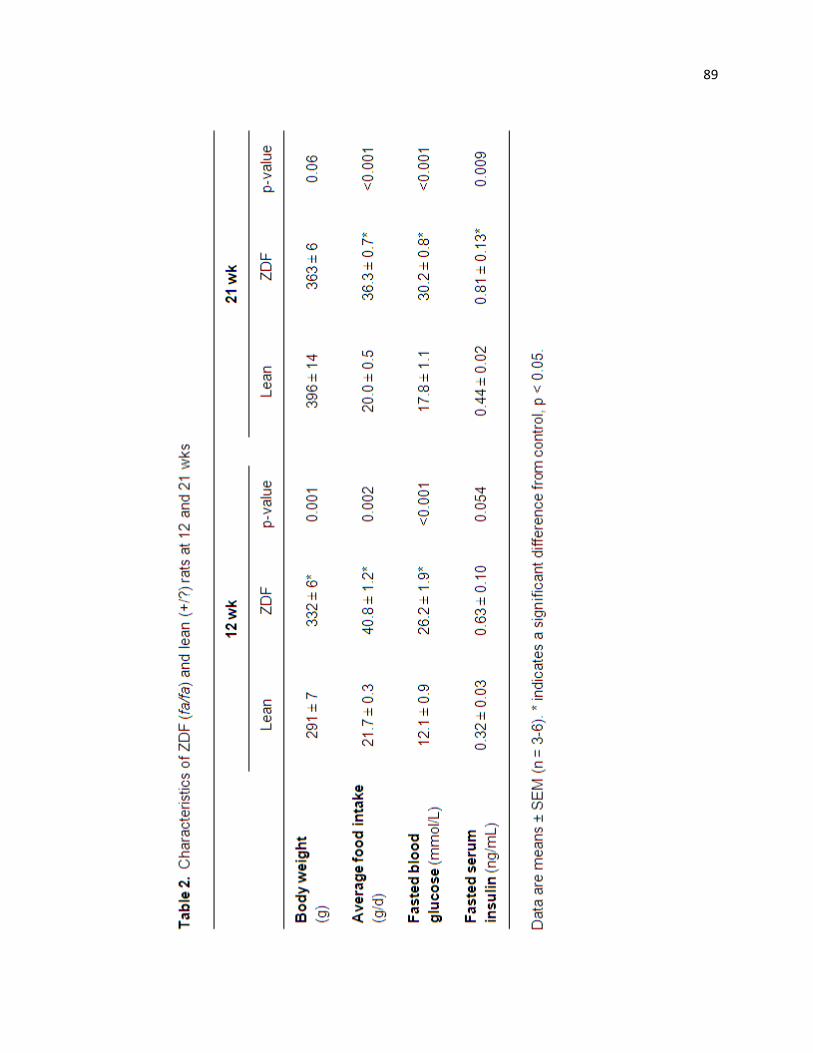
89
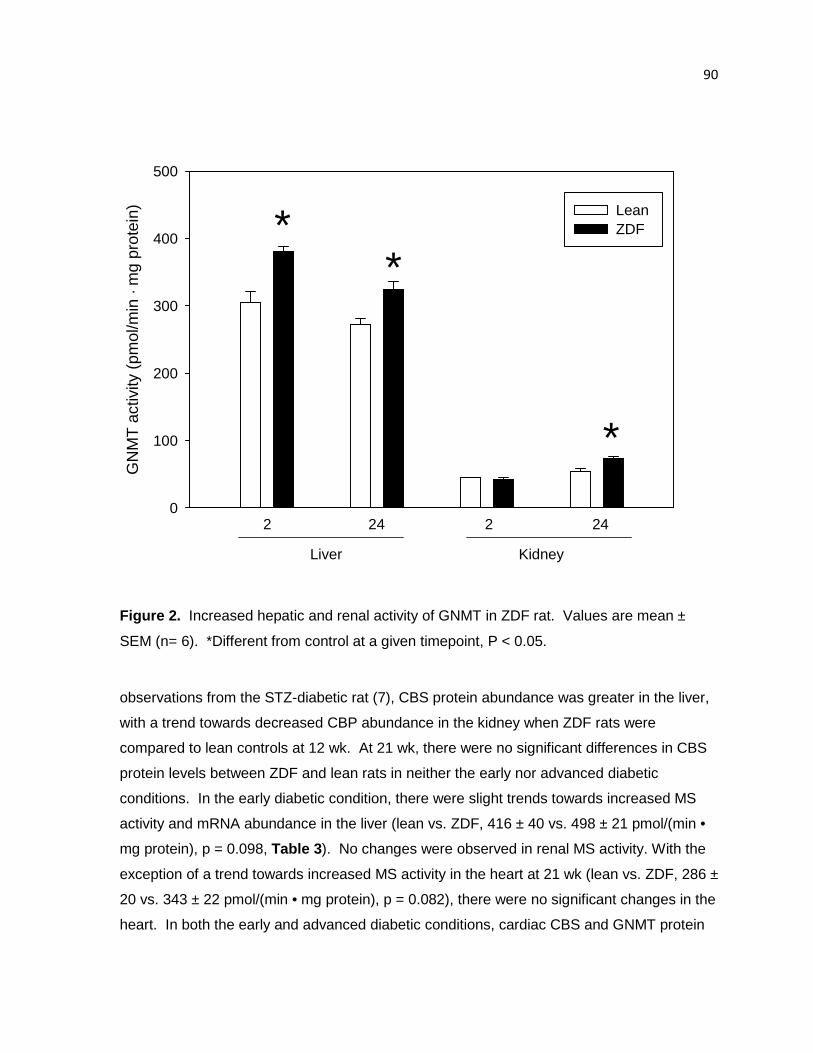
90
GN
MT
act
ivity
(pm
ol/m
in ·
mg
prot
ein)
0
100
200
300
400
500
Lean ZDF *
*
*
2 24 2 24
Liver Kidney
Figure 2. Increased hepatic and renal activity of GNMT in ZDF rat. Values are mean ±
SEM (n= 6). *Different from control at a given timepoint, P < 0.05.
observations from the STZ-diabetic rat (7), CBS protein abundance was greater in the liver,
with a trend towards decreased CBP abundance in the kidney when ZDF rats were
compared to lean controls at 12 wk. At 21 wk, there were no significant differences in CBS
protein levels between ZDF and lean rats in neither the early nor advanced diabetic
conditions. In the early diabetic condition, there were slight trends towards increased MS
activity and mRNA abundance in the liver (lean vs. ZDF, 416 ± 40 vs. 498 ± 21 pmol/(min •
mg protein), p = 0.098, Table 3). No changes were observed in renal MS activity. With the
exception of a trend towards increased MS activity in the heart at 21 wk (lean vs. ZDF, 286 ±
20 vs. 343 ± 22 pmol/(min • mg protein), p = 0.082), there were no significant changes in the
heart. In both the early and advanced diabetic conditions, cardiac CBS and GNMT protein
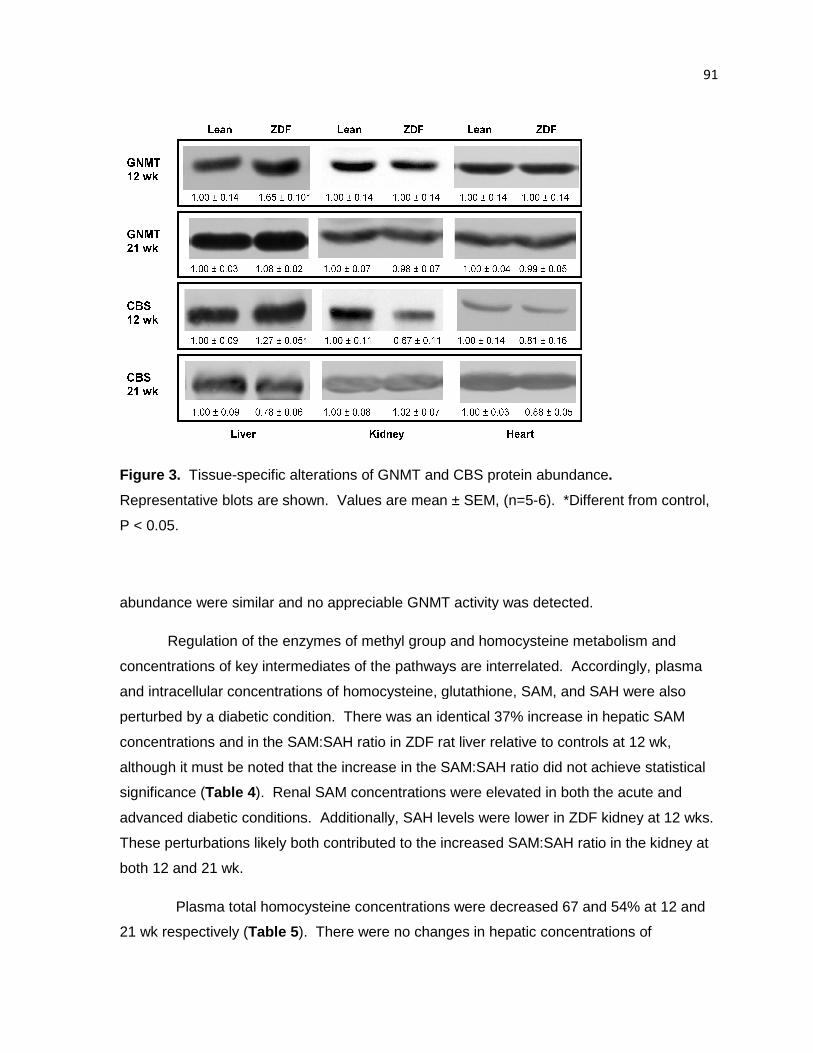
Figure 3. Tissue-specific alterations of GNMT and CBS protein abundance
Representative blots are shown. Values are mean ± SEM, (n=5
P < 0.05.
abundance were similar and no appreciable GNMT activity was detected.
Regulation of the enzymes of methyl group and homocysteine metabolism and
concentrations of key intermediates of t
and intracellular concentrations of homocysteine, glutathione, SAM, and SAH were also
perturbed by a diabetic condition. There was an identical 37% increase in hepatic SAM
concentrations and in the SAM:SAH ratio in ZDF rat liver relativ
although it must be noted that the increase in the SAM:SAH ratio did not achieve statistical
significance (Table 4). Renal SAM concentrations were elevated in both the acute and
advanced diabetic conditions
These perturbations likely both contributed to the increased SAM:SAH ratio in the kidney at
both 12 and 21 wk.
Plasma total homocysteine concentrations were decreased 67 and 54% at 12 and
21 wk respectively (Table 5 ). There were no changes in hepatic concentrations of
specific alterations of GNMT and CBS protein abundance
Representative blots are shown. Values are mean ± SEM, (n=5-6). *Different from contro
similar and no appreciable GNMT activity was detected.
Regulation of the enzymes of methyl group and homocysteine metabolism and
concentrations of key intermediates of the pathways are interrelated. Accordingly, plasma
and intracellular concentrations of homocysteine, glutathione, SAM, and SAH were also
perturbed by a diabetic condition. There was an identical 37% increase in hepatic SAM
the SAM:SAH ratio in ZDF rat liver relative to controls at 12 wk,
although it must be noted that the increase in the SAM:SAH ratio did not achieve statistical
). Renal SAM concentrations were elevated in both the acute and
s. Additionally, SAH levels were lower in ZDF kidney at 12 wks.
These perturbations likely both contributed to the increased SAM:SAH ratio in the kidney at
Plasma total homocysteine concentrations were decreased 67 and 54% at 12 and
). There were no changes in hepatic concentrations of
91
.
6). *Different from control,
Regulation of the enzymes of methyl group and homocysteine metabolism and
ccordingly, plasma
and intracellular concentrations of homocysteine, glutathione, SAM, and SAH were also
perturbed by a diabetic condition. There was an identical 37% increase in hepatic SAM
e to controls at 12 wk,
although it must be noted that the increase in the SAM:SAH ratio did not achieve statistical
). Renal SAM concentrations were elevated in both the acute and
ls were lower in ZDF kidney at 12 wks.
These perturbations likely both contributed to the increased SAM:SAH ratio in the kidney at
Plasma total homocysteine concentrations were decreased 67 and 54% at 12 and
). There were no changes in hepatic concentrations of
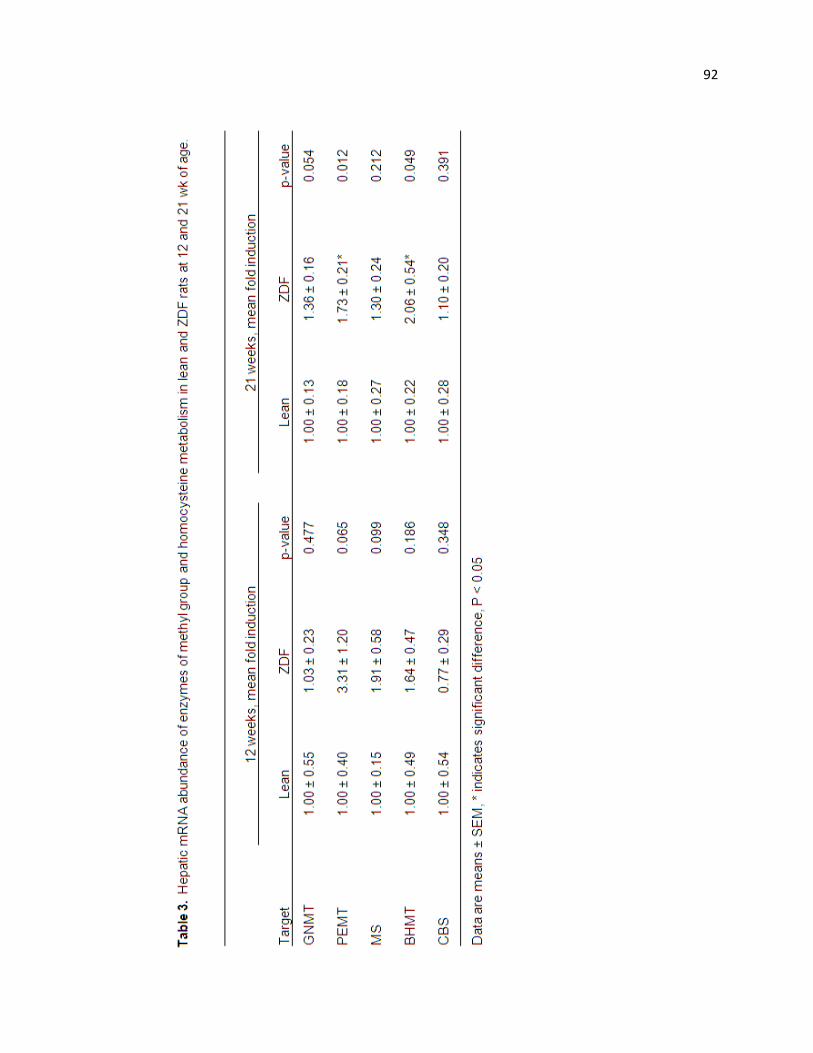
92
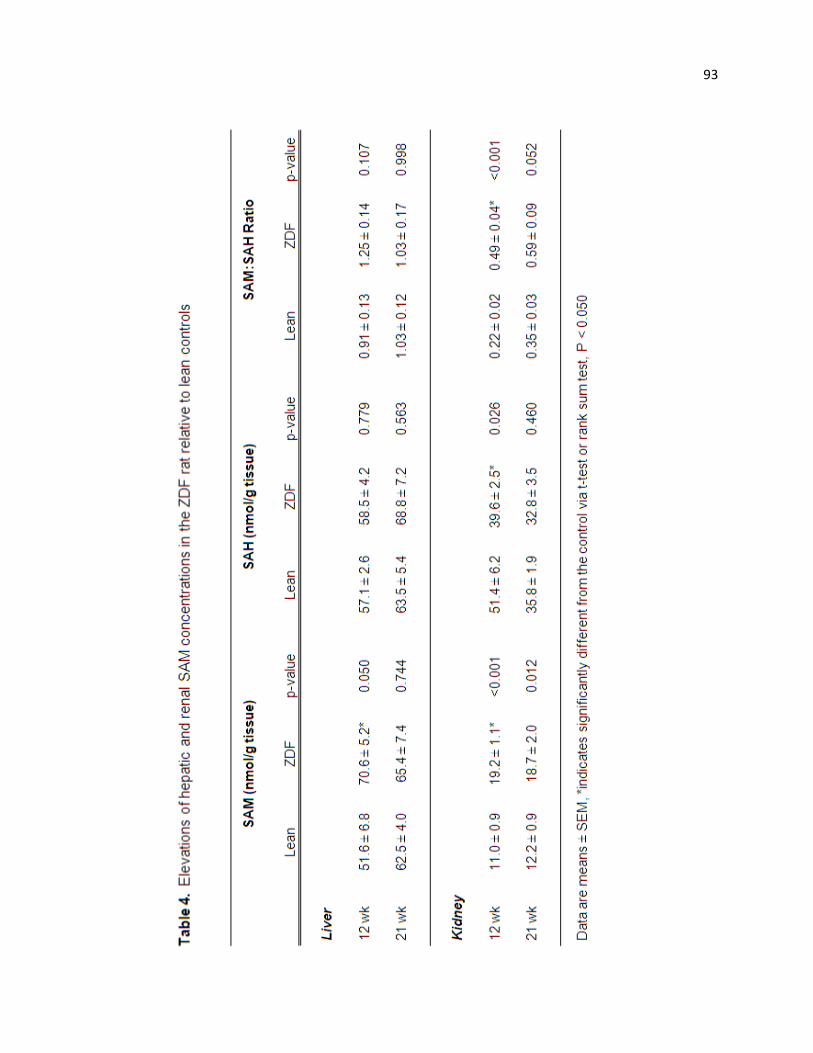
93
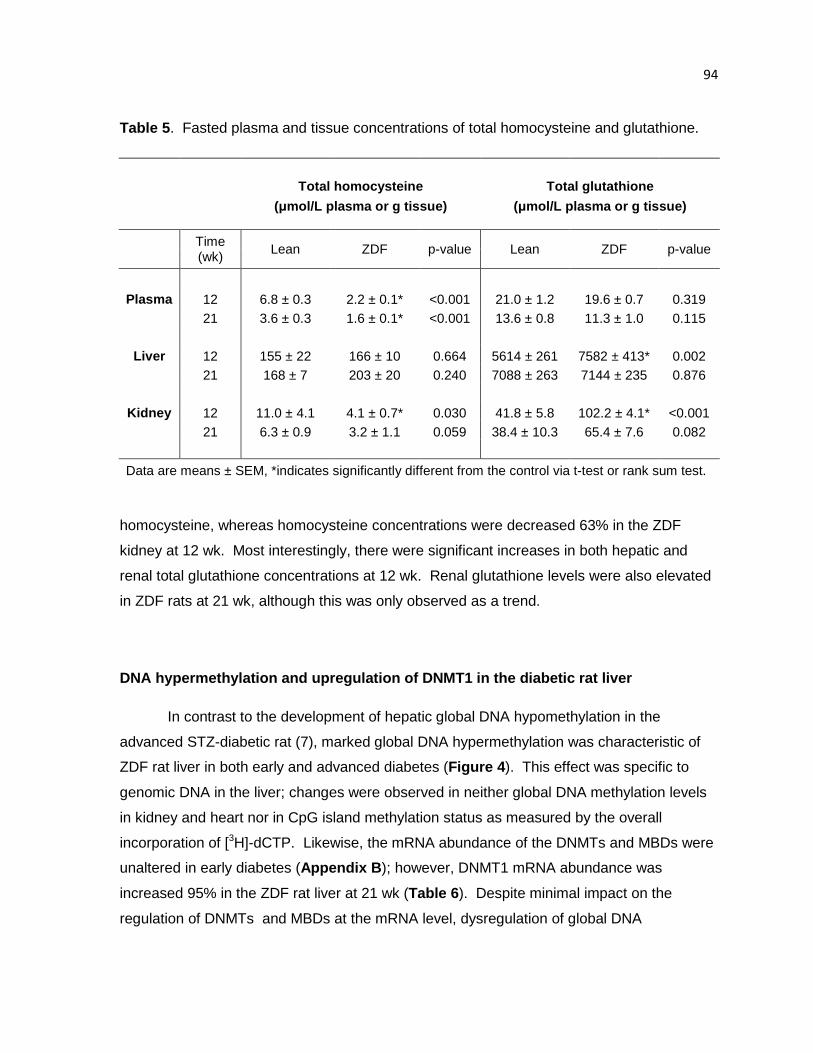
94
Table 5 . Fasted plasma and tissue concentrations of total homocysteine and glutathione.
Total homocysteine Total glutathione
(µmol/L plasma or g tissue) ( µmol/L plasma or g tissue)
Time (wk)
Lean ZDF p-value Lean ZDF p-value
Plasma 12 6.8 ± 0.3 2.2 ± 0.1* <0.001 21.0 ± 1.2 19.6 ± 0. 7 0.319
21 3.6 ± 0.3 1.6 ± 0.1* <0.001 13.6 ± 0.8 11.3 ± 1. 0 0.115
Liver 12 155 ± 22 166 ± 10 0.664 5614 ± 261 7582 ± 413* 0 .002
21 168 ± 7 203 ± 20 0.240 7088 ± 263 7144 ± 235 0.876
Kidney 12 11.0 ± 4.1 4.1 ± 0.7* 0.030 41.8 ± 5.8 102.2 ± 4 .1* <0.001
21 6.3 ± 0.9 3.2 ± 1.1 0.059 38.4 ± 10.3 65.4 ± 7.6 0.082
Data are means ± SEM, *indicates significantly different from the control via t-test or rank sum test.
homocysteine, whereas homocysteine concentrations were decreased 63% in the ZDF
kidney at 12 wk. Most interestingly, there were significant increases in both hepatic and
renal total glutathione concentrations at 12 wk. Renal glutathione levels were also elevated
in ZDF rats at 21 wk, although this was only observed as a trend.
DNA hypermethylation and upregulation of DNMT1 in the diabetic rat liver
In contrast to the development of hepatic global DNA hypomethylation in the
advanced STZ-diabetic rat (7), marked global DNA hypermethylation was characteristic of
ZDF rat liver in both early and advanced diabetes (Figure 4 ). This effect was specific to
genomic DNA in the liver; changes were observed in neither global DNA methylation levels
in kidney and heart nor in CpG island methylation status as measured by the overall
incorporation of [3H]-dCTP. Likewise, the mRNA abundance of the DNMTs and MBDs were
unaltered in early diabetes (Appendix B ); however, DNMT1 mRNA abundance was
increased 95% in the ZDF rat liver at 21 wk (Table 6 ). Despite minimal impact on the
regulation of DNMTs and MBDs at the mRNA level, dysregulation of global DNA
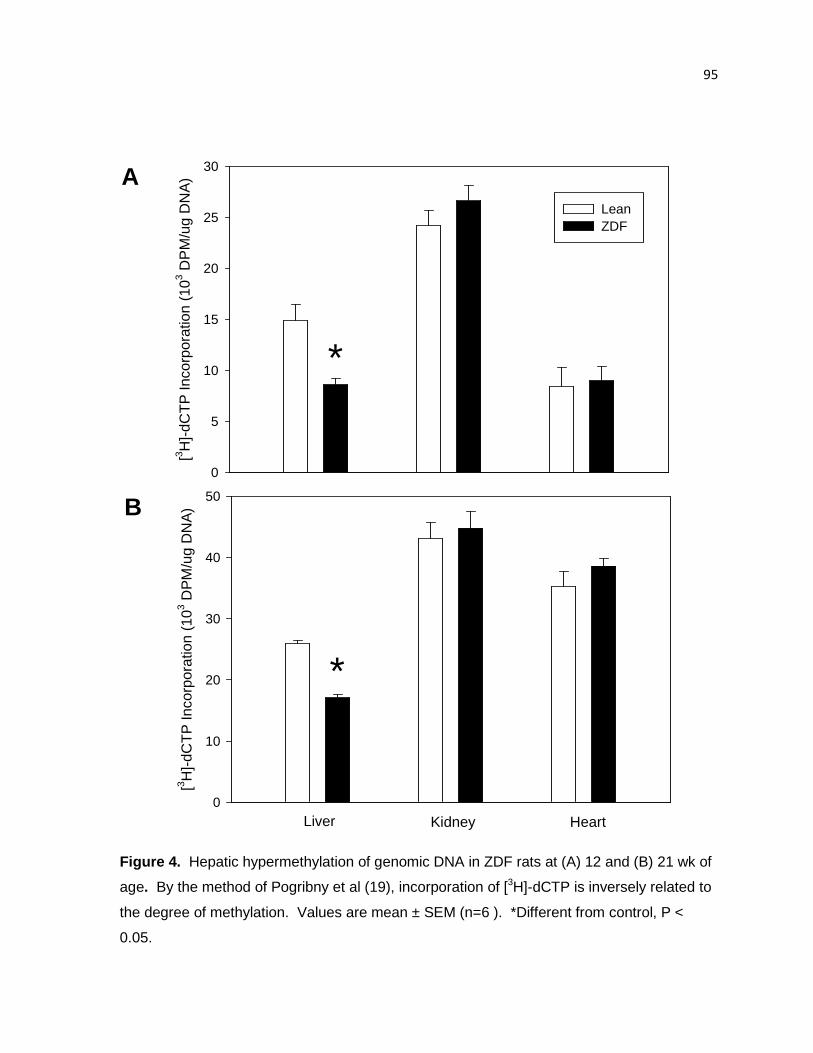
95
[3 H]-
dCT
P In
corp
orat
ion
(103 D
PM
/ug
DN
A)
0
5
10
15
20
25
30
Lean ZDF
[3 H]-
dCT
P In
corp
orat
ion
(103 D
PM
/ug
DN
A)
0
10
20
30
40
50
Liver Kidney Heart
*
*
A
B
Figure 4. Hepatic hypermethylation of genomic DNA in ZDF rats at (A) 12 and (B) 21 wk of
age. By the method of Pogribny et al (19), incorporation of [3H]-dCTP is inversely related to
the degree of methylation. Values are mean ± SEM (n=6 ). *Different from control, P <
0.05.
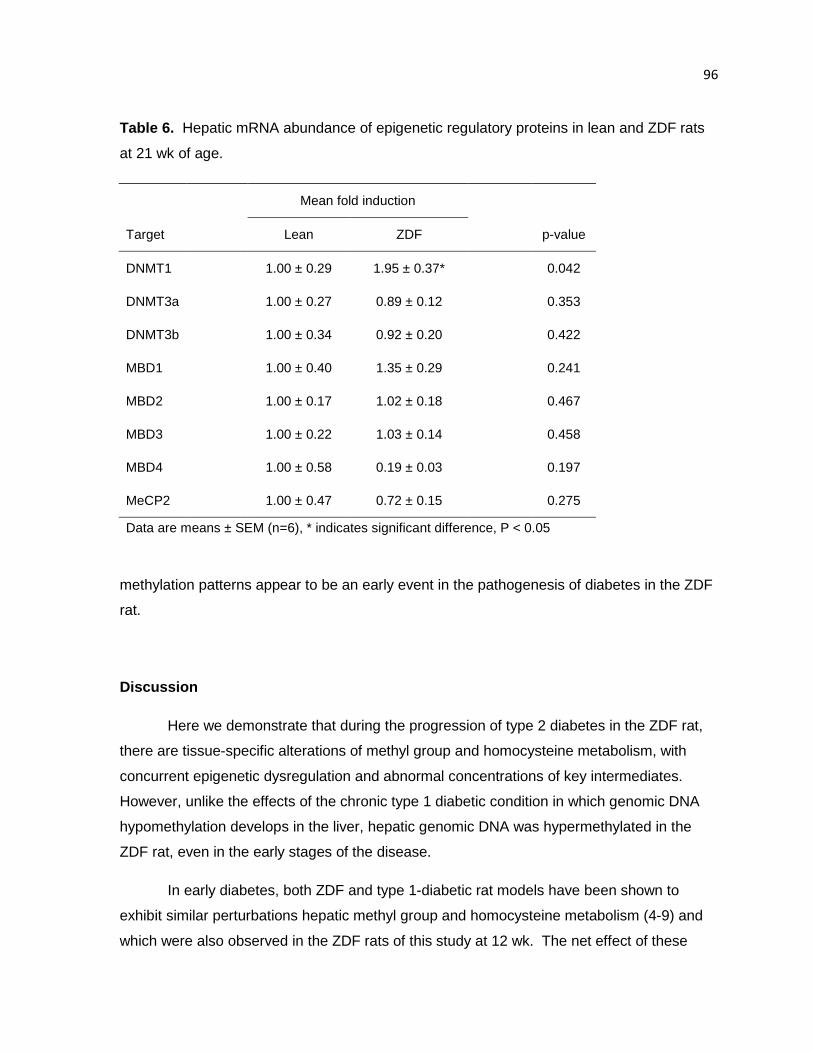
96
Table 6. Hepatic mRNA abundance of epigenetic regulatory proteins in lean and ZDF rats
at 21 wk of age.
Mean fold induction
Target Lean ZDF p-value
DNMT1
1.00 ± 0.29 1.95 ± 0.37*
0.042
DNMT3a
1.00 ± 0.27 0.89 ± 0.12
0.353
DNMT3b
1.00 ± 0.34 0.92 ± 0.20
0.422
MBD1
1.00 ± 0.40 1.35 ± 0.29
0.241
MBD2
1.00 ± 0.17 1.02 ± 0.18
0.467
MBD3 1.00 ± 0.22 1.03 ± 0.14 0.458
MBD4
1.00 ± 0.58 0.19 ± 0.03
0.197
MeCP2 1.00 ± 0.47 0.72 ± 0.15 0.275
Data are means ± SEM (n=6), * indicates significant difference, P < 0.05
methylation patterns appear to be an early event in the pathogenesis of diabetes in the ZDF
rat.
Discussion
Here we demonstrate that during the progression of type 2 diabetes in the ZDF rat,
there are tissue-specific alterations of methyl group and homocysteine metabolism, with
concurrent epigenetic dysregulation and abnormal concentrations of key intermediates.
However, unlike the effects of the chronic type 1 diabetic condition in which genomic DNA
hypomethylation develops in the liver, hepatic genomic DNA was hypermethylated in the
ZDF rat, even in the early stages of the disease.
In early diabetes, both ZDF and type 1-diabetic rat models have been shown to
exhibit similar perturbations hepatic methyl group and homocysteine metabolism (4-9) and
which were also observed in the ZDF rats of this study at 12 wk. The net effect of these
97
metabolic perturbations in the liver in early diabetes seems to favor the loss of methyl
groups the catabolism of methionine to cysteine via induction of GNMT and the
transsulfuration pathway. This might be the anticipated result based the abundance of
evidence supporting GNMT as a regulator of the SAM:SAH ratio (22) and the known
induction of CBS expression and activity by glucocorticoids and SAM (23,24). The
upregulation of CBS may be a compensatory mechanism for self protection of the liver and
kidney against the oxidative stress associated with a diabetic condition; CBS activity has
been shown to be enhanced under conditions of oxidative stress (25). However, many
studies have found depletion of glutathione in diabetic tissues (26), so the significance of
this finding remains unclear.
It also might seem intuitive that when SAM levels have normalized - as occurred in
the liver at 21 wk - that regulation would change to maintain transmethylation potential. As
such, the induction of GNMT was not as great as it was at 12 wk, with only a 19% increase
in activity and an 8% increase in protein abundance. There was also a significant increase
in BHMT mRNA abundance that was not observed in the early diabetic condition. In
diabetes, increases in BHMT mRNA abundance have previously been associated with
increased BHMT activity (12), thereby we suggest remethylation by BHMT may be
increased. Interestingly, PEMT was upregulated at the mRNA level, whereas PEMT activity
was decreased. A decrease in production of homocysteine by PEMT and lesser induction of
GNMT combined with an increase in BHMT activity might be expected to contribute to the
hypohomocysteinemia that persisted in the advanced diabetic state despite no change of
CBS protein abundance when ZDF rats were compared to controls.
The response of the kidney to a diabetic condition appears to be less stringently
regulated. Whereas, enzymes of methyl group and homocysteine metabolism appeared to
be regulated at a transcriptional and/or translational level with respect to SAM
concentrations in the liver, there was a lesser impact on the enzymes of the kidney and
furthermore, renal intracellular concentrations of SAM, SAH, homocysteine, and glutathione
appeared to reflect those in the liver and the plasma. Renal SAM concentrations were
elevated at both 12 and 21 weeks in the liver but GNMT activity only increased in the
advanced diabetic condition and there were not concurrent increases in GNMT protein
abundance. We have demonstrated the tissue specificity of GNMT regulation previously in
response to retinoids (26) as well as the diabetic condition (7). Beyond the increase in
98
GNMT activity, there were no observed alternations of enzymes, nor was DNA methylation
status affected in the kidney. House et al (28) also found a lack of effect of either glucagon
treatment or STZ-diabetes, whereas Jacobs et al (8) reported that renal MS and MTHFR
activities were suppressed by a type 1 diabetic condition.
The liver is unique in that it contains the full complement of pathways. The kidney
also contains all pathways, although BHMT is expressed at low levels in the rat kidney (30)
and MS activity was found not to be quantitatively significant (28,31), making
transsulfuration the primary route for removal of homocysteine in the kidney. Homocysteine
levels in the ZDF liver were not different from controls at 12 or 21 wks, despite decreased
homocysteine concentrations in both the plasma and kidney. The low levels of
homocysteine in the kidney are unlikely to be due to increased urinary excretion because
this was not shown to be a significant method of homocysteine removal in healthy or STZ-
diabetic kidneys (8,31). The kidney has been shown to contribute significantly to the
removal of homocysteine and SAH from the circulation (32) and data suggests it contains
adequate CBS to compensate for acute or chronic increases in plasma homocysteine (28).
Taken together, it could be ascertained that the continued observance of
hypohomocysteinemia in rat models might be due to an irreversible loss of homocysteine via
the transsulfuration pathway, whereas in human patients homocysteine may also be
remethylated to methionine by BHMT in the kidney, thereby conserving the homocysteine
moiety and contributing to the development of hyperhomocysteinemia.
The observation of global DNA hypermethylation in the livers of ZDF rats is
particularly intriguing. DNA methylation is an important modulator of chromatin structure,
repressor of transposable elements, and regulator of gene expression (33,34). DNA is
methylated at cytosine residues within the context of CpG dinucleotides. The CpG
sequence is underrepresented as only 1-4% of the genome. This is proposed to be due to
selection against the sequence due to its high potential for deleterious effects (35).
Increasing amounts of 5-methylcytosine increases the chance of point mutations through the
genome by virtue of the spontaneous deamination (36). Whereas an unmethylated cytosine
base is deaminated to uracil, deamination of methylated cytosine produces thymine. If
these altered bases go undetected by DNA repair enzymes prior to replication and the
transition mutation will be maintained and carried on to daughter cells. Accumulation of
mutations can contribute to genome instability. Another possible explanation for adverse
99
effects of genomic hypermethylation might involve hypercondensation of the chromosome.
Experimental overexpression of DNMT1 was used to induce genomic DNA hypermethylation
and was associated with chromosomal overcondensation, as well as some cases of
chromosomal rearrangement and misalignment of sister chromatids (37), which could be
expected to alter chromosomal segregation during cell division. Genomic hypermethylation
was also associated with increased methylation at histone 3 lysine 9 (H3K9) (37).
Interestingly, increased H3K9 dimethylation has also recently been shown in lymphocytes
from type 1 diabetic patients and was associated with the promoter regions of many genes
of inflammatory processes which may contribute to the development of secondary
complications (38). Moreover, one of the few reports of genomic DNA hypermethylation in
clinical studies found that leukocytic DNA hypermethylation was associated with increased
inflammation (as measured by plasma interleukin-6 concentrations) and increased mortality
in patients with chronic kidney disease (39).
In this study, digestion of DNA by restriction enzymes followed by radiolabeled
cytosine incorporation provided an assessment of total DNA methylation at the consensus
sites for HpaII or BssHII, which represent genomic DNA and CpG island sites respectively.
Genomic hypermethylation in this study could lead to genic or chromosomal mutations that
would not be detected by the method used in this study. Likewise, differential patterns of
methylation in which the overall level of DNA methylation was unchanged would not have
been detected. Subsequent studies will be designed to assess DNA methylation in a more
site-specific manner.
The pathophysiology of ZDF rats is characterized by obesity, hyperglycemia,
hyperinsulinemia, hyperlipidemia, and hypertension (40). ZDF rats develop
hyperinsulinemia and insulin resistance before 7 wks of age, with an incremental initial drop
in elevated insulin levels around 8 wks of age, blood glucose levels rise and the animals
become overtly diabetic by 12 wk of age (41), which we describe here as the early diabetic
state. Although insulin levels continue to drop due to the phenomena of pancreatic β-cell
exhaustion, ZDF rats may remain hyperinsulinemic relative to lean controls well into the
advanced diabetic stage (21), as was also observed in this study. In contrast, as a type 1
models of diabetes, STZ- or alloxan-induced diabetes results in hyperglycemia, but a lack of
insulin production due to selective destruction of the pancreatic beta cells. Treatment of rats
or hepatic cell lines with glucocorticoids, such as dexamethasone or triamcinolone, has also
100
been shown to induce expression of MAT, GNMT, BHMT, and CBS at the transcriptional
level (4,11,12,42,43). Insulin administration has been shown to prevent these alterations in
both rats and/or cell lines. Interestingly, in healthy individuals insulin stimulates
transmethylation, as well as transsulfuration flux (44). Insulin treatment of untreated HepG2
hepatocarcinoma cells was also capable of inducing MAT activity (45). Thus insulin could
be seen as playing a role in elevation of SAM concentrations and the metabolic
perturbations in the early diabetic state. Separate treatment of HepG2 cells with glucose
also resulted in stimulation of MAT activity and furthermore, induced genomic
hypermethylation (45). Several recent cell culture studies that were designed to mimic
hyperglycemia have shown alteration of histone modification which persist after glucose
levels are restored to normal. Based on genome-wide profiling of specific histone
modifications, these studies implicate hyperglycemia in the epigenetic regulation of
pathways involved in signal transduction, oxidative stress, immune function, and
inflammation (38,46-49). The bulk of evidence indicates that aberrations of methyl group
metabolism and epigenetic regulation are likely due to the combination of hyperglycemia, a
lack of insulin/insulin resistance and/or elevated counter-regulatory hormones. Alternatively,
to explain where the response differs with respect to diabetes classification, we might look to
c peptide for new insight. In both human patients and animal models, C peptide is increased
in type 2 diabetes, but markedly decreased in type 1 diabetes (50-53). C peptide has been
shown to be involved in cell signaling – with many insulinomimetic properties - and
furthermore, has been implicated in the development of vascular inflammation and
atherosclerosis in type 2 diabetes (50). However, the actions of c peptide in type 2 diabetics
are largely uncharacterized and may provide an opportunity for investigation into the
differences in the pathology of type 1 and type 2 diabetes.
In summary, we have shown that methyl group and homocysteine metabolism was
altered in a tissue-specific manner during the progression of type 2 diabetes in the ZDF rat.
The response to the diabetic condition and elevated SAM concentrations appears to be
more tightly regulated in the liver than the kidney. Although there are many commonalities
in the regulation of methyl group and homocysteine metabolism in type 1 and type 2
diabetes, the impact on epigenetic regulation varies between the two conditions.
Abnormalities of enzymatic regulation and key metabolite concentrations have been
observed as early as 5 weeks of age (9) and we have shown hepatic DNA hypermethylation
at 12 weeks of age in ZDF rats. Data are lacking prior to these timepoints, thus it is unclear
101
when the abnormalities of methyl group metabolism and epigenetic regulation are initiated in
the ZDF rat. However, it is clear that perturbations of methyl group metabolism and aberrant
DNA methylation are an early event in the development of a diabetic condition in the ZDF rat
with potentially long-lasting effects due to the generally stable nature of epigenetic
mechanisms of regulation.
Literature Cited
1. Campbell RK. Type 2 diabetes: where we are today: an overview of disease burden, current treatments, and treatment strategies. J Am Pharm Assoc. 2009;49:S3-9.
2. Williams KT, Schalinske KL. New insights into the regulation of methyl group and homocysteine metabolism. J Nutr. 2007;137:311-4.
3. Wijekoon EP, Brosnan ME, Brosnan JT. Homocysteine metabolism in diabetes. Biochem Soc Trans. 2007;35:1175-9.
4. Nieman KM, Rowling MJ, Garrow TA, Schalinske KL. Modulation of methyl group metabolism by streptozotocin-induced diabetes and all-trans-retinoic acid. J Biol Chem. 2004;279:45708-12.
5. Nieman KM, Hartz CS, Szegedi SS, Garrow TA, Sparks JD, Schalinske KL. Folate status modulates the induction of hepatic glycine N-methyltransferase and homocysteine metabolism in rats. Am J Physiol Endocrinol Metab. 2006;291:E1235-42.
6. Hartz CS, Nieman KM, Jacobs RL, Vance DE, Schalinske KS. Hepatic phosphatidylethanolamine N-methyltransferase expression is increased in diabetic rats. J Nutr. 2006;136:3005-9.
7. Williams KT, Garrow TA, Schalinske KL. Type I diabetes leads to tissue-specific DNA hypomethylation in male rats. J Nutr. 2008;138:2064-9.
8. Jacobs RL, House JD, Brosnan ME, Brosnan JT. Effects of streptozotocin-induced diabetes and of insulin treatment on homocysteine metabolism in the rat. Diabetes. 1998;47:1967-70.
9. Wijekoon EP, Hall B, Ratnam S, Brosnan ME, Zeisel SH, Brosnan JT. Homocysteine metabolism in ZDF (type 2) diabetic rats. Diabetes. 2005;54:3245-51.
10. Stead LM, Brosnan JT, Brosnan ME, Vance DE, Jacobs RL. Is it time to reevaluate methyl balance in humans? Am J Clin Nutr. 2006;83:5-10.
11. Ratnam S, Maclean KN, Jacobs RL, Brosnan ME, Kraus JP, Brosnan JT. Hormonal regulation of cystathionine beta-synthase expression in liver. J Biol Chem. 2002;277:42912-8.
12. Ratnam S, Wijekoon EP, Hall B, Garrow TA, Brosnan ME, Brosnan JT. Effects of diabetes and insulin on betaine-homocysteine S-methyltransferase expression in rat liver. Am J Physiol Endocrinol Metab. 2006;290:E933-9.
102
13. Abu-Lebdeh HS, Barazzoni R, Meek SE, Bigelow ML, Persson XM, Nair KS. Effects of insulin deprivation and treatment on homocysteine metabolism in people with type 1 diabetes. J Clin Endocrinol Metab. 2006;91:3344-8.
14. Poirier LA, Brown AT, Fink LM, Wise CK, Randolph CJ, Delongchamp RR, Fonseca VA. Blood S-adenosylmethionine concentrations and lymphocyte methylenetetrahydrofolate reductase activity in diabetes mellitus and diabetic nephropathy. Metabolism. 2001;50:1014-8.
15. Herrmann W, Schorr H, Obeid R, Makowski J, Fowler B, Kuhlmann MK. Disturbed homocysteine and methionine cycle intermediates S-adenosylhomocysteine and S-adenosylmethionine are related to degree of renal insufficiency in type 2 diabetes. Clin Chem. 2005;51:891-7.
16. Ghoshal K, Li X, Datta J, Bai S, Pogribny I, Pogribny M, Huang Y, Young D, Jacob ST. A folate- and methyl-deficient diet alters the expression of DNA methyltransferases and methyl CpG binding proteins involved in epigenetic gene silencing in livers of F344 rats. J Nutr. 2006;136:1522-7.
17. Cook RJ, Wagner C. Glycine N-methyltransferase is a folate binding protein of rat liver cytosol. Proc Natl Acad Sci U S A. 1984;81:3631-4.
18. Duce AM, Ortiz P, Cabrero C, Mato JM. S-adenosyl-L-methionine synthetase and phospholipid methyltransferase are inhibited in human cirrhosis. Hepatology 1988;8:65-8.
19. Pogribny I, Yi P, James SJ. A sensitive new method for rapid detection of abnormal methylation patterns in global DNA and within CpG islands. Biochem Biophys Res Comm. 1999;262:624-8.
20. Ehrlich M, Gama-Sosa MA, Huang LH, Midgett RM, Kuo KC, McCune RA, Gehrke C. Amount and distribution of 5-methylcytosine in human DNA from different types of tissues of cells. Nucleic Acids Res. 1982;10:2709-21.
21. Schmidt RE, Dorsey DA, Beaudet LN, Peterson RG. Analysis of the Zucker Diabetic Fatty (ZDF) type 2 diabetic rat model suggests a neurotrophic role for insulin/IGF-I in diabetic autonomic neuropathy. Am J Pathol. 2003 Jul;163(1):21-8.
22. Luka Z, Mudd SH, Wagner C. Glycine N-methyltransferase and regulation of S-adenosylmethionine levels. J Biol Chem. 2009;284:22507-11.
23. Finkelstein JD, Kyle WE, Martin JJ. Abnormal methionine adenosyltransferase in hypermethioninemia. Biochem Biophys Res Commun. 1975;66:1491-7.
24. Goss SJ: Characterization of cystathionine synthase as a selectable, liver specific trait in rat hepatomas. J Cell Sci. 1986;82:309 –320.
25. Zou CG, Banerjee R. Homocysteine and redox signaling. Antioxid Redox Signal. 2005;7:547-59.
26. McMullen MH, Rowling MJ, Ozias MK, Schalinske KL. Activation and induction of glycine N-methyltransferase by retinoids are tissue- and gender-specific. Arch Biochem Biophys. 2002;401:73-80.
27. House JD, Brosnan ME, Brosnan JT. Renal uptake and excretion of homocysteine in rats with acute hyperhomocysteinemia. Kidney Int. 1998;54:1601-7.
103
28. Finkelstein JD. Pathways and regulation of homocysteine metabolism in mammals. Semin Thromb Memost. 2000;26:219-25.
29. Delgado-Reyes CV, Wallig MA, Garrow TA. Immunohistochemical detection of betaine-homocysteine S-methyltransferase in human, pig, and rat liver and kidney. Arch Biochem Biophys. 2001;393:184-6.
30. Bostom A, Brosnan JT, Hall B, Nadeau MR, Selhub J. Net uptake of plasma homocysteine by the rat kidney in vivo. Atherosclerosis. 1995;116:59-62.
31. House JD, Brosnan ME, Brosnan JT. Characterization of homocysteine metabolism in the rat kidney. Biochem J. 1997;328:287-92.
32. Garibotto G, Valli A, Anderstam B, Eriksson M, Suliman ME, Balbi M, Rollando D, Vigo E, Lindholm B. The kidney is the major site of S-adenosylhomocysteine disposal in humans. Kidney Int. 2009;76:293-6.
33. Dunn BK. Hypomethylation: one side of a larger picture. Ann NY Acad Sci. 2003;983:28-42.
34. Lande-Diner L, Zhang J, Ben-Porath I, Amariglio N, Keshet I, Hecht M, Azuara V, Fisher AG, Rechavi G, Cedar H. Role of DNA methylation in stable gene repression. J Biol Chem. 2007;282:12194-200.
35. Lindahl T. Instability and decay of the primary structure of DNA. Nature. 1993;362:709-15.
36. Duncan BK, Miller JH. Mutagenic deamination of cytosine residues in DNA. Nature. 1980;287:560-1.
37. Weissman F, Muyrers-Chen I, Musch T, Stach D, Wiessler M, Paro R, Lyko F. DNA hypermethylation is Drosophila melanogaster causes irregular chromosome condensation and dysregulation of epigenetic histone modifications. Mol Cell Biol. 2003;23:2577-86.
38. Miao F, Smith DD, Zhang L, Min A, Feng W, Natarajan R. Lymphocytes from patients with type 1 diabetes display a distinct profile of chromatin histone H3 lysine 9 dimethylation: an epigenetic study in diabetes. Diabetes. 2008 Dec;57(12):3189-98.
39. Stenvinkel P, Karimi M, Johansson S, Axelsson J, Suliman M, Lindhom B, Heimburger O, Barany P, Alvestrand A, Nordfors L, Qureshi AR, Ekstrom TJ, Schalling M. Impact of imflammation on epigenetic DNA methylation – a novel risk factor for cardiovascular disease? J Intern Med. 2007;261:488-99.
40. Chen D, Wang MW. Development and application of rodent models for type 2 diabetes. Diabetes Obes Metab. 2005;7:307-17.
41. Etgen GJ, Oldham BA. Profiling of Zucker diabetic fatty rats in their progression to the overt diabetic state. Metabolism. 2000;49:684-8.
42. Gil B, Pajares MA, Mato JM, Alvarez L. Glucocorticoid regulation of hepatic S-adenosylmethionine synthetase gene expression. Endocrinology. 1997;138:1251-8.
43. Rowling MJ, Schalinske KL. Retinoic acid and glucocorticoid treatment induce hepatic glycine N-methyltransferase and lower plasma homocysteine concentrations in rats and rat hepatoma cells. J Nutr. 2003;133:3392-8.
104
44. Tessari P, Kiwanuka E, Coracina A, Zaramella M, Vettore M, Valerio A, Garibotto G. Insulin in methionine and homocysteine kinetics in healthy humans: plasma vs. intracellular models. Am J Physiol Endocrinol Metab. 2005;288:E1270-6.
45. Chiang EP, Wang YC, Chen WW, Tang FY. Effects of insulin and glucose on cellular metabolic fluxes in homocysteine transsulfuration, remethylation, S-adenosylmethionine synthesis, and global deoxyribonucleic acid methylation. J Clin Endocrinol Metab. 2009;94:1017-25.
46. Brasacchio D, Okabe J, Tikellis C, Balcerczyk A, George P, Baker EK, Calkin AC, Brownlee M, Cooper ME, El-Osta A. Hyperglycemia induces a dynamic cooperativity of histone methylase and demethylase enzymes associated with gene-activating epigenetic marks that co-exist on the lysine tail. Diabetes. 2009;58:1229-36.
47. El-Osta A, Brasacchio D, Yao D, Pocai A, Jones PL, Roeder RG, Cooper ME, Brownlee M. Transient high glucose causes persistent epigenetic changes and altered gene expression during subsequent normoglycemia. J Exp Med. 2008;205:2409-17.
48. Miao F, Wu X, Zhang L, Yuan YC, Riggs AD, Natarajan R. Genome-wide analysis of histone lysine methylation variations caused by diabetic conditions in human monocytes. J Biol Chem. 2007;282:13854-63.
49. Villeneuve LM, Reddy MA, Lanting LL, Wang M, Meng L, Natarajan R. Epigenetic histone H3 lysine 9 methylation in metabolic memory and inflammatory phenotype of vascular smooth muscle cells in diabetes. Proc Natl Acad Sci U S A. 2008 Jul 1;105(26):9047-52.
50. Hills CE, Brunskill NJ. Cellular and physiological effects of C-peptide. Clin Sci (Lond). 2009;116:565-74.
51. Palmer JP. C-peptide in the natural history of type 1 diabetes. Diabetes Metab Res Rev. 2009;25:325-8.
52. Wahren J. C-peptide: new findings and therapeutic implications in diabetes. Clin Physiol Funct Imaging. 2004;24:180-9.
53. Budde P, Schulte I, Appel A, Neitz S, Kellmann M, Tammen H, Hess R, Rose H. Peptidomics biomarker discovery in mouse models of obesity and type 2 diabetes. Comb Chem High Throughput Screen. 2005;8:775-81.
105
CHAPTER SIX: Summary and conclusions
General discussion of study results
Our working hypothesis was that sustained induction of glycine N-methyltransferase
(GNMT), by either retinoids or a diabetic condition, would lead to a functional methyl
deficiency, whereby methyl groups would be unavailable for other methyltransferase
reactions, such as DNA methylation. We expected that changes in epigenetic regulation,
i.e. DNA methylation, would be associated with adverse effects, such as hepatotoxicity.
Aberrant epigenetic regulation also represents a possible mechanistic link to
hepatocarcinogeneis and the development of the secondary complications of diabetes,
which will be addressed in future studies. The three studies presented here studied retinoic
acid and diabetes as inducers of GNMT activity and abundance. The induction of GNMT by
retinoic acid or diabetes was observed at all measured timepoints, although there were not
consistent changes in DNA methylation status, suggesting an influence of other regulatory
factors. Methyl group and homocysteine metabolism, as well as epigenetic mechanisms,
are intricately tied to health and disease. This information may help in optimization of health
or prevention/treatment of disease by laying the foundation for future studies which will
assess gene-specific changes in epigenetic regulation and determine the impact of
additional regulatory factors.
Here we have demonstrated that induction of hepatic GNMT by all-trans-retinoic acid
(RA) treatment (3x weekly) was sustained for at least 6 months, but was not associated with
changes in DNA methylation status. Although DNA methylation status was unaltered, the
possibility remains that other important transmethylation reactions were compromised.
However, given the rapid clearance of RA from the plasma and lack of storage in the liver, it
is possible that daily RA treatment is necessary for alteration of DNA methylation status and
also suggests the possible influence of other regulatory mechanisms in addition to the
upregulation of GNMT, which was sustained despite non-daily administration of RA.
Furthermore, RA treatment had adverse effects on hematopoiesis and plasma glutathione
levels. This research contributes to the growing body of knowledge that will be useful in the
risk-benefit analysis of RA therapies.
106
In contrast to the response to RA, global DNA methylation status was modulated by
type 1 and type 2 diabetes, though the effect was not the same in both diabetic conditions.
Despite largely similar patterns of tissue-specific and time-dependent alterations of methyl
group and homocysteine metabolism, genomic DNA was hypomethylated in the
streptozotocin (STZ)-induced type 1 diabetic rat liver, but genomic DNA hypermethylation
was observed in the livers of Zucker (type 2) diabetic fatty (ZDF) rats. These reports of
tissue-specific methyl group and homocysteine metabolism, and particularly the association
with aberrant DNA methylation status, during the progression of diabetes are novel findings.
Methyl group and homocysteine metabolism in diabete s
The aberrations of methyl group and homocysteine metabolism in diabetic rats are
time- and tissue-specific. Hepatic alterations are an early event in both type 1 and type 2
diabetes. In the early diabetic and advanced diabetic condition in the STZ-diabetic rat, we
have reported increased hepatic GNMT, phosphatidylethanolamine N-methyltransferase
(PEMT), betaine-homocysteine S-methyltransferase (BHMT), and cystathionine β-synthase
(CBS) activity and/or abundance, whereas methionine synthase (MS) activity was
decreased. The Brosnan group has reported upregulation of enzymes of all four pathways
of hepatic homocysteine metabolism in the prediabetic ZDF rat (1). When data from the
studies presented here are taken together with the data of the Brosnan group, it appears
that many alterations of methyl group and homocysteine metabolism are present in the early
diabetic condition, whereas only a few characteristics are more persistent and are also
observed in the advanced diabetic condition, such as the upregulation of hepatic GNMT and
BHMT, as well as hypohomocysteinemia.
Hypohomocysteinemia may result in rat models of diabetes due to the lower
expression levels of BHMT in the rat liver in comparison to the human liver (2). It has also
been shown that methionine synthase and urinary disposal are not major routes for the
removal of homocysteine in neither the healthy nor STZ-diabetic rat liver (3,4). However,
the kidney has been shown to remove 40% of SAH (5) and at least ~20% of homocysteine
from the circulation (6), thereby it must be assumed that in the rat kidney homocysteine is
irreversibly catabolized by the transsulfuration pathway, which has been shown
experimentally as well (7). In the human kidney, homocysteine may also be remethylated to
107
methionine by BHMT, thereby conserving the homocysteine backbone and possibly
contributing to the development of hyperhomocysteinemia, particularly in the case of
diabetic nephropathy in which transsulfuration flux has been shown to be decreased (8).
Although hyperhomocysteinemia has not been observed even in the advanced diabetic
conditions in the diabetic rat models used in these studies, downregulation of CBS has been
implicated in the development of renal dysfunction in the Dahl salt-sensitive hypertensive rat
(9) and both STZ-diabetic and ZDF rats at least had trends towards decreased CBS
abundance in the kidney. It is of interest to note that renal homocysteine levels were
significantly decreased at 12 wk in the ZDF rats, whereas there was no significant difference
in advanced diabetes. Given that signs of renal dysfunction are evidence as early as 14
weeks of age in the ZDF rat (Anderson and Rowling, unpublished observations), this might
suggest altered renal handling of homocysteine with the progression of renal disease in this
model.
By looking more closely at the data from the ZDF study, we are given greater insight
into the roles of the liver and kidney in the early and advanced diabetic conditions (Figure
1). The enzymes of the liver appear to be tightly regulated as evidenced by increased
GNMT and CBS activity and/or abundance associated with increased intracellular SAM
concentration in the early diabetic condition. When hepatic SAM concentrations are similar
to controls in the advanced diabetic condition, several methyltransferases are still
upregulated at the level of mRNA abundance or protein activity and abundance, but CBS
abundance is not different from controls and BHMT mRNA abundance was increased, likely
indicating a conservation of methionine. In contrast, the enzymes of methyl group and
homocysteine metabolism in the kidney are affected to a lesser extent and metabolite
concentrations seem to generally reflect changes in liver and circulation. The only alteration
at the transcriptional/translational level noted in the kidney was a trend towards decreased
CBS protein abundance in early diabetes. The increase in GNMT activity at 21 weeks was
not accompanied by increased GNMT protein abundance, suggesting regulation only at the
post-translational level. In the STZ-diabetic rat kidney there was only a transient induction in
renal GNMT and CBS protein abundance was decreased. In both the type 1 and type 2
diabetic rat liver, the tissue-specific perturbations of methyl group and homocysteine
metabolism preceded or were concurrent with tissue-specific changes in DNA methylation
status, with abnormal levels of DNA methylation found in the liver, but not the kidney.
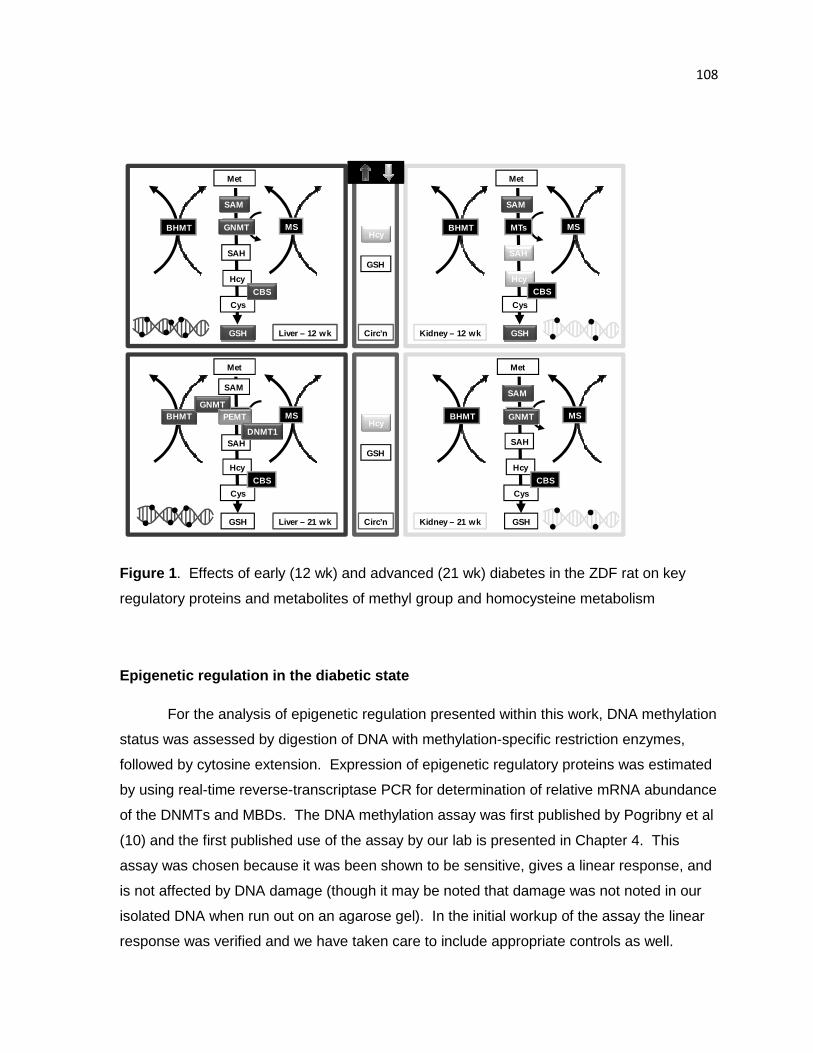
108
Hcy
GSH
Met
SAM
BHMT MTs MS
Cys
Hcy
GSH
CBS
SAH
Hcy
GSH
Met
SAM
BHMT MTs MS
Cys
Hcy
GSH
CBS
SAH
Met
SAM
BHMT MTs MS
Cys
Hcy
GSH
SAH
Met
SAM
BHMT MTs MS
Cys
Hcy
GSH
CBS
SAH
Liver – 12 wk
Liver – 21 wk Circ’n
Circ’n Kidney – 12 wk
Kidney – 21 wk
GNMT
GNMTGNMTPEMT
DNMT1
CBS
Figure 1 . Effects of early (12 wk) and advanced (21 wk) diabetes in the ZDF rat on key
regulatory proteins and metabolites of methyl group and homocysteine metabolism
Epigenetic regulation in the diabetic state
For the analysis of epigenetic regulation presented within this work, DNA methylation
status was assessed by digestion of DNA with methylation-specific restriction enzymes,
followed by cytosine extension. Expression of epigenetic regulatory proteins was estimated
by using real-time reverse-transcriptase PCR for determination of relative mRNA abundance
of the DNMTs and MBDs. The DNA methylation assay was first published by Pogribny et al
(10) and the first published use of the assay by our lab is presented in Chapter 4. This
assay was chosen because it was been shown to be sensitive, gives a linear response, and
is not affected by DNA damage (though it may be noted that damage was not noted in our
isolated DNA when run out on an agarose gel). In the initial workup of the assay the linear
response was verified and we have taken care to include appropriate controls as well.
109
Digestion of DNA by MspI is not methylation-specific and cleaves at all methylated sites,
whereas 3T3 fully-methylated DNA was used as a negative control. Use of these controls
verified that the percent methylation for control samples fell within the expected range of 70-
90% (11). Use of this method was appropriate for an initial study of DNA methylation status,
though it is limited in that it only assesses overall methylation status. We cannot rule out
that there may be gene-specific changes in methylation status that are undetected by this
assay or that there are changes in methylation patterns, without changing the overall level of
CpG island methylation. We anticipate that gene-specific assessment will be the goal of
future studies.
Some of the most intriguing findings of these studies were the detection of hypo- and
hypermethylation of genomic DNA in the type 1 and type 2 diabetic rat liver respectively.
Our lab group has found hepatic genomic DNA hypomethylation in type 1 diabetes is
observed not just in the STZ-diabetic rat, but also in the genetic nonobese diabetic mouse
model (12). Alterations of genomic DNA methylation status have been associated with
increased genomic instability. Genomic DNA hypomethylation is associated with genomic
instability due to a more relaxed chromatin structure and fewer repressive mechanisms
which facilitates a greater number of recombinational events, movement of transposable
elements, loss of imprinting, and overexpression of genes, specifically oncogenes (13).
Thus, genomic hypomethylation is a hallmark of cancerous tissue, including hepatocellular
carcinomas in rat models and in human patients (13-16). Epidemiological studies support a
link between diabetes and cancer as evidenced by an increased incidence of liver cancers
of both type 1 and/or type 2 diabetic patients (17-20).
On the opposite end of the spectrum, genomic hypermethylation could increase
genomic instability by altering chromatin and overall chromosomal structure, as well as by
the accumulation of point mutations. Increasing amounts of methylated cytosine increases
the chance of point mutations throughout the genome due to spontaneous deamination (21).
Unmethylated cytosine bases are deaminated to uracil, whereas deamination of methylated
cytosine produces thymine, a transition mutation. If this TpG-CpG mismatch goes
undetected by DNA repair enzymes prior to replication, the transition mutation will be
maintained in future cells. Another possible explanation for adverse effects of genomic
hypermethylation come from experimental overexpression of DNMT1 which induced
genomic DNA hypermethylation and was associated with chromosomal overcondensation,
110
as well as some cases of chromosomal rearrangement and misalignment of sister
chromatids (22), which could be expected to alter chromosomal segregation during cell
division. Genomic hypermethylation was also associated with increased methylation at
histone 3 lysine 9 (H3K9) (22). Interestingly, increased H3K9 dimethylation has also
recently been shown in lymphocytes from type 1 diabetic patients and was associated with
the promoter regions of many genes of inflammatory processes which may contribute to the
development of secondary complications (23). Moreover, one of the few reports of genomic
DNA hypermethylation in clinical studies found that leukocytic global DNA hypermethylation
was associated with increased inflammation (as measured by plasma interleukin-6
concentrations) and increased mortality in patients with chronic kidney disease (24). Thus,
both hyper- and hypomethylation of genomic DNA have been associated with adverse
clinical outcomes which may be relevant to the diabetic condition.
Possible factors regulating metabolic and epigeneti c aberrations in diabetes
Given the relationship between homocysteine metabolism and epigenetic patterns
with the pathogenesis of disease, it is critical to determine which factors might play a role in
regulating these processes. In the RA-treated rat, it is likely that RA complexed with its
receptors acts directly on the GNMT promoter to increase transcription. However, in the
diabetic condition, there are numerous potential hormonal influences including
glucocorticoid, insulin, incretin hormones and other insulin-related hormones such as c
peptide and insulin-like growth factor 1 (IGF-1) which may play a role. Although diabetes
perturbations of methyl group and homocysteine metabolism were concurrent with or
preceded aberrant DNA methylation levels, when taken together the data from the chronic
RA treatment study, it appears that there are also other influencing factors in each of these
conditions that contribute to dysregulation of DNA methylation.
A diabetic condition could be described, in part, as hyperglycemia due to a lack of
insulin or lack of response to insulin, resulting in a relatively greater effect of glucocorticoids.
Similar to the effects of a diabetic condition, treatment of rats or hepatic cell lines with
glucocorticoids, such as dexamethasone or triamcinolone, has been shown to increase
MAT, GNMT, BHMT, and CBS mRNA abundance, protein abundance, and/or activity levels
(25-29). Insulin administration attenuated these effects in both rats and/or cell lines which
111
were diabetic or treated with glucocorticoids. However, insulin treatment of HepG2, human
hepatocarcinoma cells, cultured in otherwise standard media was also capable of inducing
MAT activity (30). Furthermore, in healthy individuals insulin stimulates transmethylation, as
well as transsulfuration flux (31). In the short term, this might be expected to protect against
the accumulation of homocysteine as proposed by the authors, but if hyperinsulinemia
persists, these changes might be described as an early event in prediabetes or a diabetic
condition, similar to that observed by the Brosnan group and in our studies of the ZDF rat.
However, based on treatment of HepG2 cells, hyperinsulinemia alone was insufficient to
induce alterations of DNA methylation status (30). However, glucose treatment increased
MAT activity and induced genomic DNA hypermethylation. This suggests a critical role for
insulin and/or hyperglycemia in the dysregulation of hepatic methyl group and homocysteine
metabolism and it is possible that the period of hyperinsulinemia in the prediabetic state of
type 2 diabetes may have a unique influence on metabolic and epigenetic perturbations,
though no immediate direct effects on DNA methylation status have yet been observed.
This might be further investigated in cell culture by combining hyperinsulinemic and
hyperglycemic treatments and determining the impact of concurrent treatment vs. initial
treatment with insulin followed by co-treatment to look for additive or synergistic effects.
Alternatively, treating healthy rats with insulin could be used to determine the in vivo effects
on methyl group metabolism and epigenetic regulation.
There are a wide variety of additional factors that are influential in the diabetic
conditions including hormonal factors such as glucagon-like peptide-1 (GLP-1), glucose-
dependent insulinotropic polypeptide (GIP), insulin-like growth factor-1 (IGF-1) and c
peptide. Additionally, many of these parameters are affected by common pharmaceutical
and lifestyle interventions for the treatment of diabetes. GLP-1 and GIP are also known as
the incretin hormones and both hormones act directly on the pancreas to increase
pancreatic beta cell proliferation, insulin synthesis and secretion via direct effects (32).
GLP-1 also enhances glucose uptake and storage through effects on the central nervous
system. Likewise, IGF-1 has insulin-sensitizing effects, acts directly on the pancreatic beta
cells, and additionally, has insulinomimetic effects (33,34). Treatment with IGF-1, agents
which decrease the incretin hormones, or agonists of incretin receptors are the focus of
many anti-diabetic therapies, which are often successful in slowing the progressing of type 2
diabetes and minimizing complications (32-35). However, these medications do not work
indefinitely and do not abrogate all metabolic perturbations of type 2 diabetes (35). Studies
112
of insulin-sensitizing interventions in the ZDF rat show a similar pattern. An exercise
intervention consisting of 8 wk of treadmill running was successful in improving insulin
sensitivity and preventing increases in blood glucose in the ZDF rat at 14 wk of age (36).
However, fasting serum insulin levels continued to rise slowly in ZDF rats despite the
exercise intervention, which might suggest the course of the disease was only delayed. The
effect of exercise on methyl group and homocysteine metabolism was not determined in this
study. However, in the insulin resistant (not diabetic) Zucker fatty rat, three weeks of
troglitazone treatment increased hepatic CBS activity which was proposed to have
contributed to the observed decrease in plasma homocysteine, but the hepatic SAM:SAH
ratio was decreased relative to untreated Zucker fatty rats (37). This data from the strain
from which the ZDF rat was selectively bred suggests that insulin-sensitizing drugs may
modulate methyl group and homocysteine metabolism in the prediabetic condition, though
this limited evidence does not fully explain what effect these alterations may have on
transmethylation reactions. Troglitazone works as an activator of PPARα and γ, suggesting
the possible involvement of yet another regulatory pathway. Whereas the factors discussed
thus far affect beta cell function and insulin action specifically, another possibility lies in c
peptide which, like insulin, is differentially regulated in type 1 and 2 diabetic conditions and
also has independent cellular signaling mechanisms (38).
Future research
There are several areas towards which future research efforts could be directed.
Here are four potential aims: i) perform a more in-depth study of perturbed epigenetic
regulation in type 1 and type 2 diabetes, ii) investigate possible factors involved in the
different epigenetic response in advanced type 1 and type 2 diabetic conditions, iii) define
the mechanisms by which modulators of methyl group and homocysteine exert their effects,
and iv) develop dietary therapies for optimal health, prevention of disease, or treatment of
adverse effects.
The results from the studies presented herein indicate the presence of diabetes-
induced alterations of DNA methylation status. Thus far we have shown this as overall net
changes in DNA methylation, but to gain a greater understanding of the biological
significance of said aberrations will require localization of the sites at which methylation
113
status is changed. This information will be crucial for linking alterations of methyl group
metabolism and epigenetic regulation to the development of secondary complications of
diabetes, which was not addressed by the current studies. To accomplish this, experiments
should be designed to assess both specific changes in epigenetic regulation as well as the
progression of secondary complications of diabetes.
For the determination of specific alterations of epigenetic regulation by DNA
methylation the most comprehensive approach would use of genome-wide analyses such as
the Methyl-Seq technique, which utilizes next-generation sequencing tools, or DNA
methylation-specific microarray. Each technique offers advantages: Methyl-Seq offers a
nonbiased analysis and will analyze changes in DNA methylation at both genic and
nongenic sites (39), whereas microarrays are also available for the entire genome (40) or
specifically covering all known promoter sites for genes and miRNAs, as well as all CpG
islands (41), which may help to focus in on the most biologically-relevant changes. For the
study of individual genes, bisulfite treatment and methylation-specific PCR techniques could
be used. Based on recent genome-wide analyses of histone modifications in cultured and
primary cells from diabetics which revealed widespread and gene-specific alterations of
histones (23,42-45), as well as our data which demonstrated changes in overall DNA
methylation levels, we anticipate that we will likewise find changes in DNA status at specific
sites within the genome. Alterations of DNA methylation status are expected in pathways
involved in signal transduction, oxidative stress, immune function, and inflammation.
Notably, we detected a transient change in methylation status in the CpG islands in the
STZ-diabetic rat; it is possible that a similar transition occurred in the ZDF rat, but was not
captured by our study based on the timepoints at which we collected our samples.
The development of secondary complications and their relationship to epigenetic
alterations observed in diabetic conditions will require more thorough assessments of kidney
and vascular function. Our studies used basic assessments of renal dysfunction by
comparing relative renal weights and plasma creatinine concentrations. Although these
methods are have been used by others in diabetic rats (46,47), renal dysfunction might be
more adequately assessed in future studies by histological examination and measurement
of additional circulatory and urinary substances such as has been performed previously in
diabetic rat models (47). Plasma and urinary levels of hemoglobin, albumin, and creatinine,
as well as plasma cystatin c would all be appropriate biochemical measures (46-48).
114
Plasma cystatin c is a more recently established biomarker of renal dysfunction that has the
additional advantage of not being affected by muscle mass or malignancy and would be
expected to be appropriate for use in a diabetic population (49,50). Histochemistry and
immunohistochemistry methods utilizing hematoxylin and eosin y staining, alone or in
combination with antibodies against transforming growth factor-β, could be utilized for the
assessment of alterations of glomerular structure and detection of renal fibrosis. For future
studies of cardiovascular disease, we have proposed to assess the progression of
atherosclerosis as indicated by the vascular response to vasodilators (51), time to
thrombosis following injury (52), and platelet coactivation activity (53). In similar studies of
ZDF rats, early indicators of vascular and renal dysfunction are noted around 14-16 weeks
of age (54, Anderson and Rowling, unpublished observations) and at necropsy we noted
gross morphological abnormalities in the kidneys of ZDF rats in the advanced diabetic state.
The second and third aims relate to increasing understanding of the specific factors
that are known to alter methyl group metabolism and epigenetic regulation. The divergent
regulation of DNA methylation status by type 1 and type 2 diabetic conditions is an intriguing
finding and efforts should be made to determine possible mediators of this effect. As has
been previously discussed, one possibility lies in the timing of insulin exposure based on
evidence that insulin attenuates abnormal methyl group and homocysteine metabolism in
type 1 diabetic models and patients (8,27,28,55, Nieman and Schalinske, unpublished
observations), whereas hyperinsulinemia in healthy individuals and otherwise untreated cell
culture models was associated with increased transmethylation and transsulfuration (30,31).
At the surface, it appears that the effect of c peptide might also be a promising target of
investigation because it is differentially expressed in type 1 and type 2 diabetes, has some
insulin-like effects, but is also biologically active by a separate receptor, and its functions are
likely not yet fully characterized (38). We, and others, have shown that many other
hormones or biologically active compounds have a profound impact on methyl group and
homocysteine metabolism (56). Studies addressing the mechanisms by which these
compounds - largely ligands for nuclear receptors such as thyroid hormones, retinoids,
glucocorticoids – exert their regulatory effects may help provide for the development of a
more unified theory of regulation of methyl group and homocysteine metabolism.
Lastly, it would be desirable to be able to formulate some form of dietary therapy to
ameliorate the effects of perturbed methyl group metabolism. Methyl group
115
supplementation might be used in type 1 diabetes with the goal of providing adequate levels
of methyl groups for all SAM-dependent transmethylation reactions. When considering
supplementation of methyl groups there are many combinations of donors and cofactors that
could be provided; however, the most efficient approach would be to use an inclusive
mixture that has been shown to be optimally effective in previous studies (57). Thus,
supplementation groups might receive a modification of our standard semi-purified AIN93
diet containing (per kg diet): methionine, 3g; choline, 5 g; betaine, 5 g; folate, 5 mg; B12, 0.5
mg; and B6, 10 mg (57,58). A number of studies have also shown that SAM can be
provided via the diet and is bioavailable in both rats and humans (59-61). It is also of
interest to note that SAM has recently been reported to increase insulin sensitivity (62) and
this compound is available over-the-counter. This makes it an attractive option based on
consumer availability and also lends particular importance to gaining a greater
understanding of the effects of taking such a supplement since many individuals may
already be using this product.
Another possibility for dietary intervention might be through altering methionine and
cysteine content. We have previously shown that methionine supplementation or feeding of
egg white protein (a protein with a higher methionine:cysteine ratio than the casein
standard) can alter methyl group and homocysteine metabolism (63,64). Feeding excess
methionine (10% casein plus 0.3% vs. 0.5-2.0% methionine) results in a dose-dependent
increase in hepatic GNMT (63) and it has long been known that excess methionine and
SAM stimulates transsulfuration (65). When egg white protein was substituted for casein,
hepatic GNMT and BHMT activities were increased and plasma homocysteine was
decreased (64). Given this upregulation of specific transmethylation reactions and
transsulfuration in response to increased methionine or methionine:cysteine ratio, it stands
to reason that feeding diets with a protein with a low methionine:cysteine ratio or by
supplementing cysteine, the drive towards increased transmethylation and transsulfuration
might be reduced. A recent study shows promise for this approach given that 8 wks of L-
cysteine supplementation lowered blood glucose levels and inflammatory markers in ZDF
rats relative to saline-treated controls (66). Plasma glutathione levels were unchanged
between groups, but we have not shown this to be altered in the ZDF rat and data was not
collected on any other key regulatory proteins of metabolites of methyl group or
homocysteine metabolism. This hypothesis certainly warrants future investigation.
116
In addition to the differences in methyl group utilization, specifically with regards to
DNA methylation, between the type 1 and type 2 conditions, challenges to implementation of
dietary therapies include timing effects and confounding factors such as dietary intake and
enzyme polymorphisms. The timing of dietary intervention has been shown to be
particularly important, especially with regards to influencing epigenetic mechanisms. DNA
methylation and other forms of epigenetic regulation seem to be particularly vulnerable to
change during the perinatal and pubertal periods and in aging (67,68). Likewise, it appears
that in the progression of disease, it is likely that there is only a specific window of time in
which the effects may be prevented or reversed, as has been shown in the methyl-deficient
diet model of hepatocarcinogenesis (69). Furthermore, in human populations, the response
of homocysteine and folate one-carbon metabolism to dietary interventions has been shown
to be affected by polymorphisms within these pathways (70-72)
Overall conclusions
In summary, these studies have demonstrated the changes of methyl group and
homocysteine metabolism in long-term intermittent retinoid treatment, as well as during the
progression of type 1 and type 2 diabetic conditions. Furthermore, we have characterized
perturbations of overall epigenetic regulation by DNA methylation in a diabetic condition. In
the diabetic conditions, alterations in methyl group and homocysteine metabolism preceded
or were concurrent with changes in epigenetic regulation. Although GNMT was upregulated
by retinoid treatment and in both diabetic conditions, the effects on DNA methylation status
varied. This disparity suggests a role for additional factors impacting epigenetic regulation.
Future studies should be conducted with the goal of elucidating which factors are most
important in the modulation of methyl group and homocysteine metabolism, as well as
regulation of DNA methylation patterns. It will also be of the utmost interest to determine the
specific nature of the epigenetic alterations observed here and greater efforts must be made
to identify potential linkages between these changes and the development of diabetic
complications, thus providing insight into the biological significance of abnormal methylation
in diabetes and potentially providing targets for future therapies.
117
Literature Cited
1. Wijekoon EP, Hall B, Ratnam S, Brosnan ME, Zeisel SH, Brosnan JT. Homocysteine metabolism in ZDF (type 2) diabetic rats. Diabetes. 2005;54:3245-51.
2. Delgado-Reyes CV, Wallig MA, Garrow TA. Immunohistochemical detection of betaine-homocysteine S-methyltransferase in human, pig, and rat liver and kidney. Arch Biochem Biophys. 2001;393:184-6.
3. Jacobs RL, House JD, Brosnan ME, Brosnan JT. Effects of streptozotocin-induced diabetes and of insulin treatment on homocysteine metabolism in the rat. Diabetes. 1998;47:1967-70.
4. House JD, Brosnan ME, Brosnan JT. Renal uptake and excretion of homocysteine in rats with acute hyperhomocysteinemia. Kidney Int. 1998;54:1601-7.
5. Garibotto G, Valli A, Anderstam B, Eriksson M, Suliman ME, Balbi M, Rollando D, Vigo E, Lindholm B. The kidney is the major site of S-adenosylhomocysteine disposal in humans. Kidney Int. 2009;76:293-6.
6. House JD, Brosnan ME, Brosnan JT. Characterization of homocysteine metabolism in the rat kidney. Biochem J. 1997;328:287-92.
7. Bostom A, Brosnan JT, Hall B, Nadeau MR, Selhub J. Net uptake of plasma homocysteine by the rat kidney in vivo. Atherosclerosis. 1995;116:59-62.
8. Tessari P, Coracina A, Kiwanuka E, Vedovato M, Vettore M, Valerio A, Zaramella M, Garibotto G. Effects of insulin on methionine and homocysteine kinetics in type 2 diabetes with nephropathy. Diabetes. 2005;54:2968-76.
9. Pin-Lan L, Fan Y, Ningjun L. Hyperhomocysteinemia: association with renal transsulfuration and redox signaling in rats. Clin Chem Lab Med. 2007;45:1688-93.
10. Pogribny I, Yi P, James SJ. A sensitive new method for rapid detection of abnormal methylation patterns in global DNA and within CpG islands. Biochem Biophys Res Comm. 1999;262:624-8.
11. Ehrlich M, Gama-Sosa MA, Huang LH, Midgett RM, Kuo KC, McCune RA, Gehrke C. Amount and distribution of 5-methylcytosine in human DNA from different types of tissues of cells. Nucleic Acids Res. 1982;10:2709-21.
12. Nieman KM, MeGuire AS, Schalinske KL. Characterization of homocysteine and methyl group metabolism in female non-obese diabetic (NOD) mice. FASEB J. 2009;23:557.5.
13. Dunn BK. Hypomethylation: one side of a larger picture. Ann N Y Acad Sci. 2003;983:28-42.
14. James SJ, Pogribny IP, Pogribna M, Miller BJ, Jernigan S, Melnyk S. Mechanisms of DNA damage, DNA hypomethylation, and tumor progression in the folate/methyl-deficient rat model of hepatocarcinogenesis. J Nutr. 2003;133:3740S-3747S.
15. Martinez-Chantar ML, Vázquez-Chantada M, Ariz U, Martinez N, Varela M, Luka Z, Capdevila A, Rodriguez J, Aransay AM et al. Loss of the glycine N-methyltransferase gene leads to steatosis and hepatocellular carcinoma in mice. Hepatology. 2008;47:1191-9.
118
16. Tischoff I, Tannapfel A. DNA methylation in hepatocellular carcinoma. World J Gastroenterol. 2008;14:1741-8.
17. Batty GD, Shipley MJ, Marmot M, Smith GD. Diabetes status and post-load plasma glucose concentration in relation to site-specific mortality: findings from the original Whitehall study. Cancer Causes Control. 2004;15:873-81.
18. Coughlin SS, Calle EE, Teras LR, Petrelli J, Thun MJ. Diabetes mellitus as a predictor of cancer mortality in a large cohort of US adults. Am J Epidemiol. 2004;159:1160-7.
19. Hassan MM, Hwang LY, Hatten CJ, Swaim M, Li D, Abbruzzese JL, Beasley P, Patt YZ. Risk factors for hepatocellular carcinoma: synergism of alcohol with viral hepatitis and diabetes mellitus. Hepatology. 2002;36:1206-13.
20. Rousseau MC, Parent ME, Pollak MN, Siemiatycki J. Diabetes mellitus and cancer risk in a population-based case-control study among men from Montreal, Canada. Int J Cancer. 2006;118:2105-9.
21. Duncan BK, Miller JH. Mutagenic deamination of cytosine residues in DNA. Nature. 1980;287:560-1.
22. Weissman F, Muyrers-Chen I, Musch T, Stach D, Wiessler M, Paro R, Lyko F. DNA hypermethylation is Drosophila melanogaster causes irregular chromosome condensation and dysregulation of epigenetic histone modifications. Mol Cell Biol. 2003;23:2577-86.
23. Miao F, Smith DD, Zhang L, Min A, Feng W, Natarajan R. Lymphocytes from patients with type 1 diabetes display a distinct profile of chromatin histone H3 lysine 9 dimethylation: an epigenetic study in diabetes. Diabetes. 2008 Dec;57(12):3189-98.
24. Stenvinkel P, Karimi M, Johansson S, Axelsson J, Suliman M, Lindhom B, Heimburger O, Barany P, Alvestrand A, Nordfors L, Qureshi AR, Ekstrom TJ, Schalling M. Impact of imflammation on epigenetic DNA methylation – a novel risk factor for cardiovascular disease? J Intern Med. 2007;261:488-99.
25. Rowling MJ, Schalinske KL. Retinoic acid and glucocorticoid treatment induce hepatic glycine N-methyltransferase and lower plasma homocysteine concentrations in rats and rat hepatoma cells. J Nutr. 2003;133:3392-8.
26. Nieman KM, Rowling MJ, Garrow TA, Schalinske KL. Modulation of methyl group metabolism by streptozotocin-induced diabetes and all-trans-retinoic acid. J Biol Chem. 2004;279:45708-12.
27. Ratnam S, Wijekoon EP, Hall B, Garrow TA, Brosnan ME, Brosnan JT. Effects of diabetes and insulin on betaine-homocysteine S-methyltransferase expression in rat liver. Am J Physiol Endocrinol Metab. 2006;290:E933-9.
28. Ratnam S, Maclean KN, Jacobs RL, Brosnan ME, Kraus JP, Brosnan JT. Hormonal regulation of cystathionine beta-synthase expression in liver. J Biol Chem. 2002;277:42912-8.
29. Gil B, Pajares MA, Mato JM, Alvarez L. Glucocorticoid regulation of hepatic S-adenosylmethionine synthetase gene expression. Endocrinology. 1997;138:1251-8.
119
30. Chiang EP, Wang YC, Chen WW, Tang FY. Effects of insulin and glucose on cellular metabolic fluxes in homocysteine transsulfuration, remethylation, S-adenosylmethionine synthesis, and global deoxyribonucleic acid methylation. J Clin Endocrinol Metab. 2009;94:1017-25.
31. Tessari P, Kiwanuka E, Coracina A, Zaramella M, Vettore M, Valerio A, Garibotto G. Insulin in methionine and homocysteine kinetics in healthy humans: plasma vs. intracellular models. Am J Physiol Endocrinol Metab. 2005;288:E1270-6.
32. Baggio LL, Drucker DJ. Biology of incretins: GLP-1 and GIP. Gastroenterology. 2007;132:2131-57.
33. Clemmons DR. Involvement of insulin-like growth factor-I in the control of glucose homeostasis. Curr Opin Pharmacol. 2006;6:620-5.
34. Rajpathak SN, Gunter MJ, Wylie-Rosett J, Ho GY, Kaplan RC, Muzumdar R, Rohan TE, Strickler HD. The role of insulin-like growth factor-I and its binding proteins in glucose homeostasis and type 2 diabetes. Diabetes Metab Res Rev. 2009;25:3-12.
35. Campbell RK. Type 2 diabetes: where we are today: an overview of disease burden, current treatments, and treatment strategies. J Am Pharm Assoc. 2009;49:S3-9.
36. Pold R, Jensen LS, Jessen N, Buhl ES, Schmitz O, Flyvbjerg A, Fujii N, Goodyear LJ, Gotfredsen CF, Brand CL, Lund S. Long-term AICAR administration and exercise prevents diabetes in ZDF rats. Diabetes. 2005;54:928-934.
37. Fonseca V, Keebler M, Dicker-Brown A, DeSouza C, Poirier LA, Murthy SN, McNamara DB. The effect of troglitazone on plasma homocysteine, hepatic and red blood cell S-adenosyl methionine, and S-adenosyl homocysteine and enzymes in homocysteine metabolism in Zucker rats. Metabolism. 2002;51:783-6.
38. Hills CE, Brunskill NJ. Cellular and physiological effects of C-peptide. Clin Sci (Lond). 2009;116:565-74.
39. Brunner AL, Johnson DS, Kim SW, Valouev A, Reddy TE, Neff NF, Anton E, Medina C, Nguyen L, Chiao E, Oyolu CB, Schroth GP, Absher DM, Baker JC, Myers RM. Distinct DNA methylation patterns characterize differentiated human embryonic stem cells and developing human fetal liver. Genome Res. 2009;19:1044-56.
40. Rauch TA, Wu X, Zhong X, Riggs AD, Pfeifer GP. A human B cell methylome at 100-base pair resolution. Proc Natl Acad Sci U S A. 2009;106:671-8.
41. Irizarry RA, Ladd-Acosta C, Wen B, Wu Z, Montano C, Onyango P, Cui H, Gabo K, Rongione M, Webster M, Ji H, Potash JB, Sabunciyan S, Feinberg AP. The human colon cancer methylome shows similar hypo- and hypermethylation at conserved tissue-specific CpG island shores. Nat Genet. 2009;41:178-86.
42. Brasacchio D, Okabe J, Tikellis C, Balcerczyk A, George P, Baker EK, Calkin AC, Brownlee M, Cooper ME, El-Osta A. Hyperglycemia induces a dynamic cooperativity of histone methylase and demethylase enzymes associated with gene-activating epigenetic marks that co-exist on the lysine tail. Diabetes. 2009;58:1229-36.
43. El-Osta A, Brasacchio D, Yao D, Pocai A, Jones PL, Roeder RG, Cooper ME, Brownlee M. Transient high glucose causes persistent epigenetic changes and altered gene expression during subsequent normoglycemia. J Exp Med. 2008;205:2409-17.
120
44. Miao F, Wu X, Zhang L, Yuan YC, Riggs AD, Natarajan R. Genome-wide analysis of histone lysine methylation variations caused by diabetic conditions in human monocytes. J Biol Chem. 2007;282:13854-63.
45. Villeneuve LM, Reddy MA, Lanting LL, Wang M, Meng L, Natarajan R. Epigenetic histone H3 lysine 9 methylation in metabolic memory and inflammatory phenotype of vascular smooth muscle cells in diabetes. Proc Natl Acad Sci U S A. 2008 Jul 1;105(26):9047-52.
46. Xiao X, Ma B, Dong B, Zhao P, Tai N, Chen L, Susan Wong F, Wen L. Cellular and humoral immune responses in the early stages of diabetic nephropathy in NOD mice. J Autoimmun. Epub 2009 Feb 4.
47. Segev Y, Eshet R, Rivkis I, Hayat C, Kachko L, Phillip M, Landau D. Comparison between somatostatin analogues and ACE inhibitor in the NOD mouse model of diabetic kidney disease. Nephrol Dial Transplant. 2004 Dec;19(12):3021-8.
48. Jeansson M, Granqvist AB, Nyström JS, Haraldsson B. Functional and molecular alterations of the glomerular barrier in long-term diabetes in mice. Diabetologia. 2006;49:2200-9.
49. Chew JS, Saleem M, Florkowski CM George PM. Cystatin C – a paradigm of evidence based laboratory medicine. Clin Biochem Rev. 2008;29:47-62.
50. Chudleigh RA, Ollerton RL, Dunseath G, Peter R, Harvey JN, Luzio S, Owens DR. Use of cystatin C-based estimations of glomerular filtration rate in patients with type 2 diabetes. Diabetologia. 2009;52:1274-8.
51. Dayal S, Bottiglieri T, Arning E, Maeda N, Malinow MR, Sigmund CD, Heistad DD, Faraci FM, Lentz SR. Endothelial dysfunction and elevation of S-adenosylhomocysteine in cystathionine β-synthase-deficient mice. Circ Res. 2001; 88: 1203-9.
52. Wilson KM, Lynch CM, Faraci FM, Lentz SR. Effect of mechanical ventilation on carotid artery thrombosis induced by photochemical injury in mice. J Thromb Haemost. 2003; 1: 2669-74.
53. Dayal S, Wilson KM, Leo L, Arning E, Bottiglieri T, Lentz SR. Enhanced susceptibility to arterial thrombosis in a murine model of hyperhomocysteinemia. Blood 2006; 108: 2237-43.
54. Oltman CL, Richou LL, Davidson EP, Coppey LJ, Lund DD, Yorek MA. Progression of coronary and mesenteric vascular dysfunction in Zucker obese and Zucker diabetic fatty rats. Am J Physiol Heart Circ Physiol. 2006;291:H1780-7.
55. Hartz CS, Nieman KM, Jacobs RL, Vance DE, Schalinske KS. Hepatic phosphatidylethanolamine N-methyltransferase expression is increased in diabetic rats. J Nutr. 2006;136:3005-9.
56. Williams KT, Schalinske KL. New insights into the regulation of methyl group and homocysteine metabolism. J Nutr. 2007;137:311-4.
57. Wolff JL, Kodell RL, Moore SR, Cooney CA. Maternal epigenetics and methyl supplements affect agouti gene expression in Av/a mice. FASEB J. 1998;12: 949-957.
121
58. Nieman KM, Hartz CS, Szegedi SS, Garrow TA, Sparks JD, Schalinske KL. Folate status modulates the induction of hepatic glycine N-methyltransferase and homocysteine metabolism in rats. Am J Physiol Endocrinol Metab. 2006;291:E1235-42.
59. Bailey, S.M., Robinson, G., Pinner, A., Chamlee, L., Ulasova, E., Pompilius, M., Page, G.P., Chhieng, D., Jhala, N., Landar, A., Kharbanda, K.K., Ballinger, S. & Darley-Usmar, V. (2006) S-adenosylmethionine prevents chronic alocohol-induced mitochondrial dysfunction in the rat liver. Am. J. Physiol. Gastrointest. Liver Physiol. 291: G857-G867.
60. Goren, J.L., Stoll, A.L., Damico, K.E., Sarmiento, I.A. & Cohen, B.M. (2004) Bioavailability and lack of toxicity of S-adenosyl-L-methionine (SAMe) in humans. Pharmacotherapy 24: 1501-1507.
61. Garcia-Ruiz, C., Morales, A., Colell, A., Ballesta, A., Rodes, J., Kaplowitz, N. & Fernandez-Checa, J.C. (1995) Feeding S-adenosyl-L-methionine attenuates both ethanol-induced depletion of mitochondrial glutathione and mitochondrial dysfunction in periportal and perivenous rat hepatocytes. Hepatology 21: 207-214.
62. Jin CJ, Park HK, Cho YM, Pak YK, Lee KU, Kim MS, Friso S, Choi SW, Park KS, Lee HK. S-adenosyl-L-methionine increases skeletal muscle mitochondrial DNA density and whole body insulin sensitivity in OLETF rats. J Nutr. 2007;137:339-44.
63. Rowling MJ, McMullen MH, Chipman DC, Schalinske KL. Hepatic glycine N-methyltransferase is up-regulated by excess dietary methionine in rats. J Nutr. 2002;132:2545-50.
64. Schalinske KL, Luchtel RA, Garrow TA. Folate-independent remethylation of homocysteine is increased by dietary egg white protein. FASEB J. 2009;23:335.2.
65. Finkelstein JD. Methionine metabolism in mammals. J Nutr Biochem. 1990;1:228-37. 66. Jain SK, Velusamy T, Croad JL, Rains JL, Bull R. L-cysteine supplementation lowers
blood glucose, glycated hemoglobin, CRP, MCP-1, and oxidative stress and inhibits NF-kappaB activation in the livers of Zucker diabetic rats. Free Radic Biol Med. 2009;46:1633-8.
67. Burdge GC, Lillycrop KA, Phillips ES, Slater-Jefferies JL, Jackson AA, Hanson MA. Folic acid supplementation during the juvenile-pubertal period in rats modifies the phenotype and epigenotype induced by prenatal nutrition. J Nutr. 2009;139:1054-60.
68. Choi SW, Friso S, Keyes MK, Mason JB. Folate supplementation increases genomic DNA methylation in the liver of elder rats. Br J Nutr. 2005;93:31-5.
69. Pogribny IP, Ross SA, Wise C, Pogribna M, Jones EA, Tryndyak VP, James SJ, Dragan YP, Poirier LA. Irreversible global DNA hypomethylation as a key step in hepatocarcinogenesis induced by dietary methyl deficiency. Mutat Res. 2006;593:80-7.
70. Friso S, Choi SW. Gene-nutrient interactions in one-carbon metabolism. Curr Drug Metab. 2005;6:37-46.
71. Silaste ML, Rantala M, Sämpi M, Alfthan G, Aro A, Kesäniemi YA. Polymorphisms of key enzymes in homocysteine metabolism affect diet responsiveness of plasma homocysteine in healthy women. J Nutr. 2001;131:2643-7.

122
72. Beagle B, Yang TL, Hung J, Cogger EA, Moriarty DJ, Caudill MA. The glycine N-methyltransferase (GNMT) 1289 C->T variant influences plasma total homocysteine concentrations in young women after restricting folate intake. J Nutr. 2005;135:2780-5.
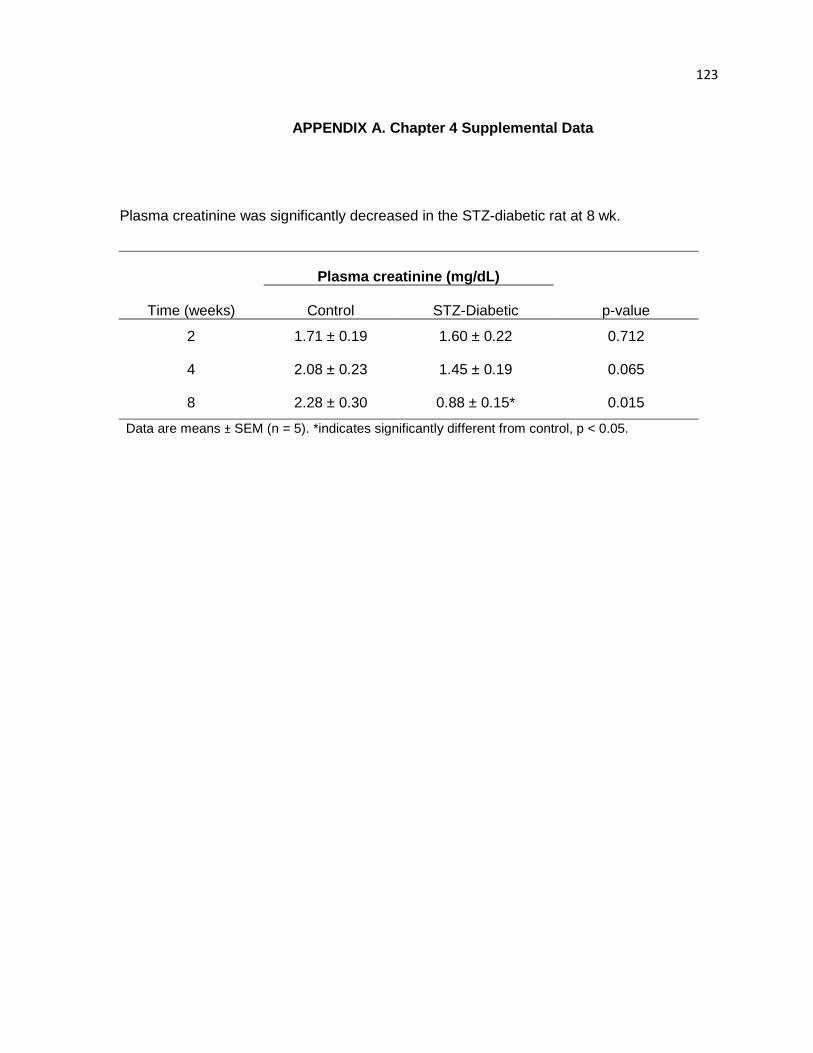
123
APPENDIX A. Chapter 4 Supplemental Data
Plasma creatinine was significantly decreased in the STZ-diabetic rat at 8 wk.
Plasma creatinine (mg/dL)
Time (weeks) Control STZ-Diabetic p-value
2 1.71 ± 0.19 1.60 ± 0.22 0.712
4 2.08 ± 0.23 1.45 ± 0.19 0.065
8 2.28 ± 0.30 0.88 ± 0.15* 0.015
Data are means ± SEM (n = 5). *indicates significantly different from control, p < 0.05.
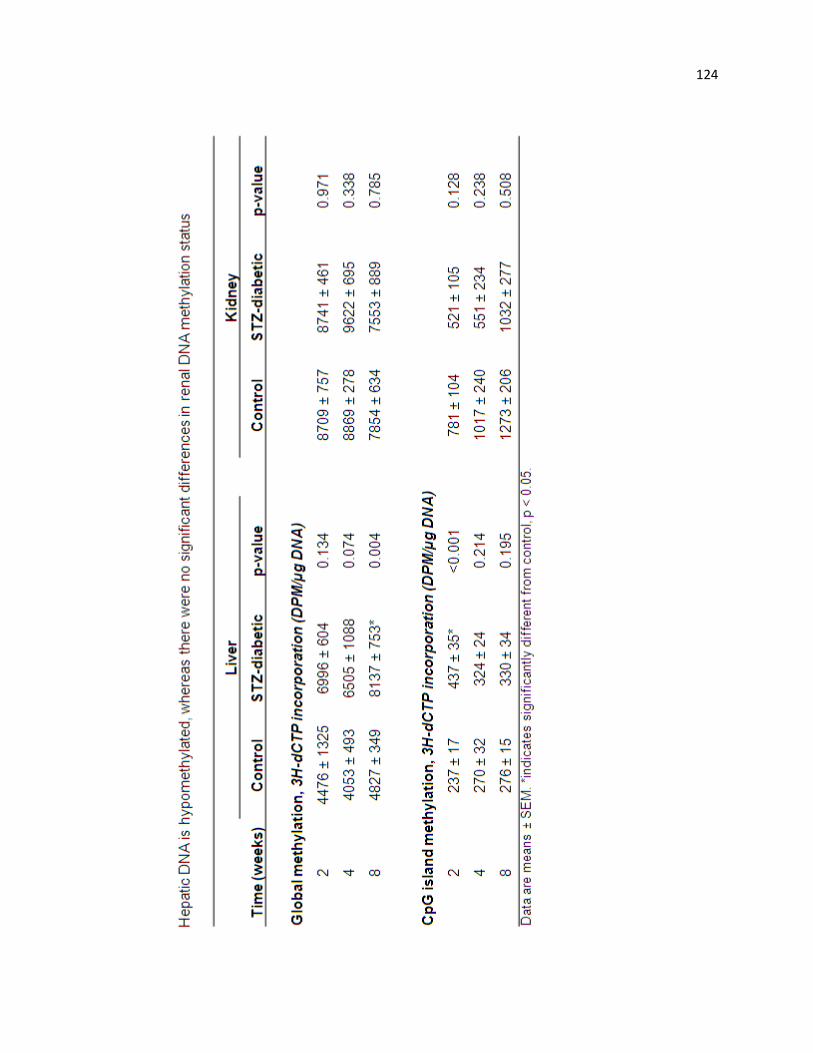
124
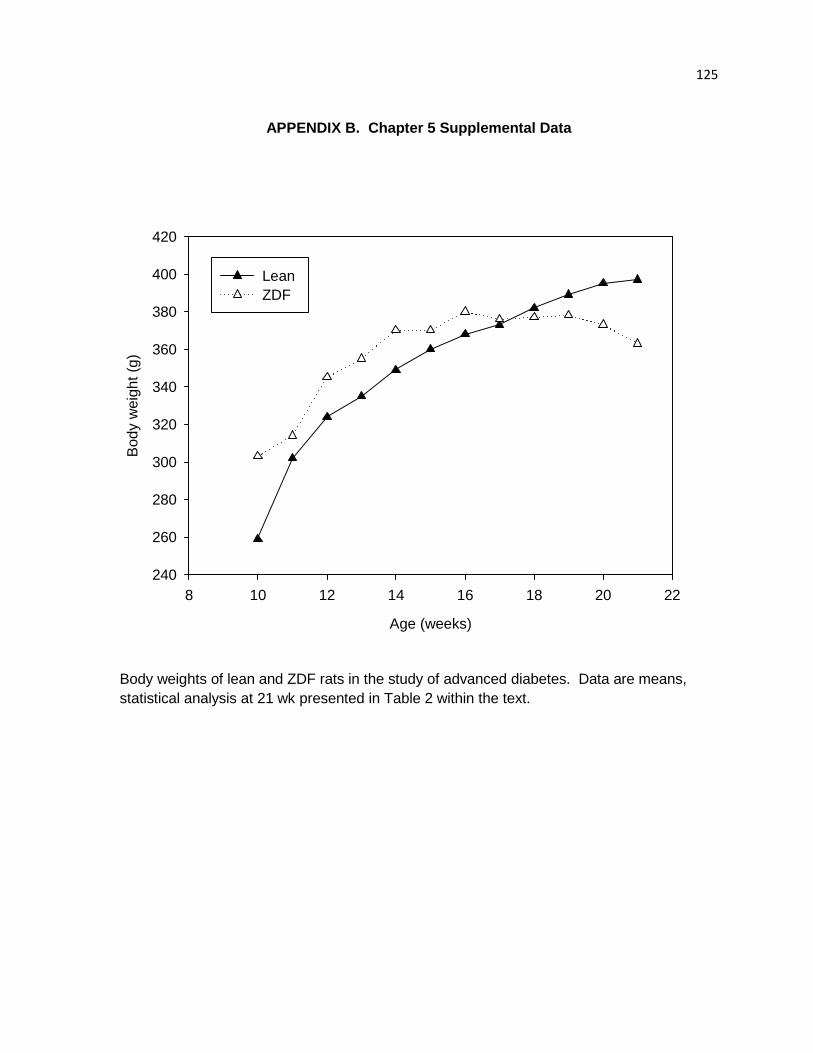
125
APPENDIX B. Chapter 5 Supplemental Data
Age (weeks)
8 10 12 14 16 18 20 22
Bod
y w
eigh
t (g)
240
260
280
300
320
340
360
380
400
420
Lean ZDF
Body weights of lean and ZDF rats in the study of advanced diabetes. Data are means, statistical analysis at 21 wk presented in Table 2 within the text.
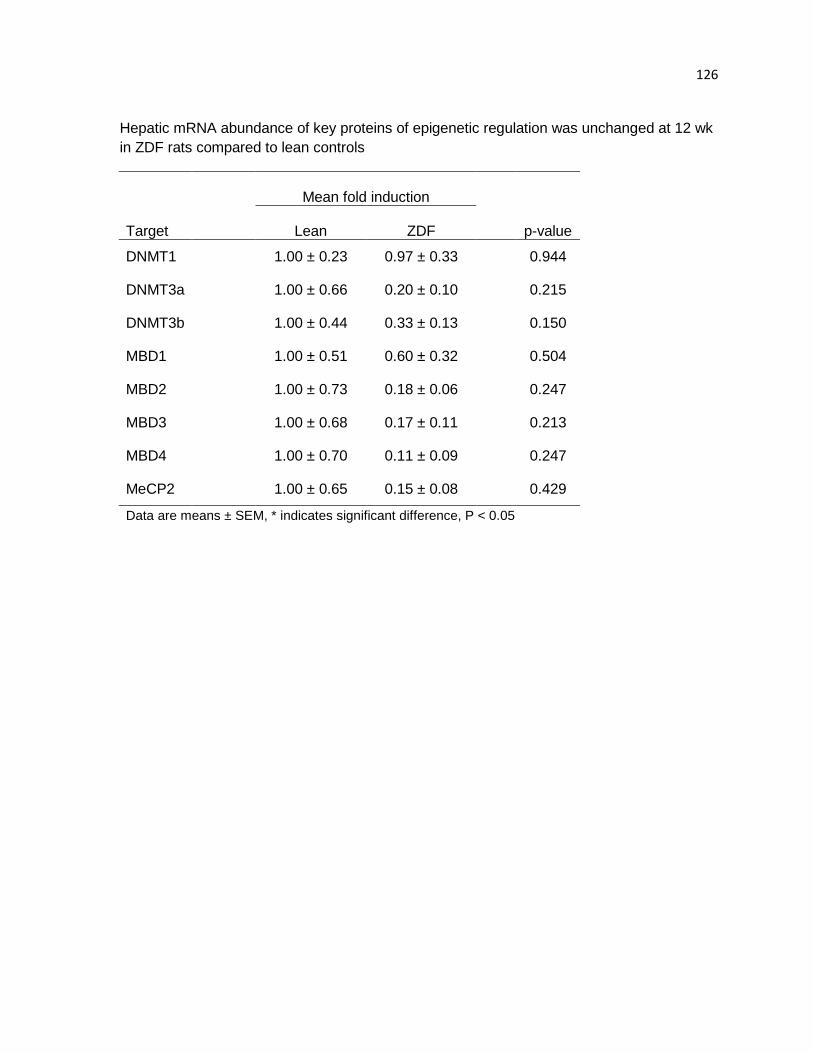
126
Hepatic mRNA abundance of key proteins of epigenetic regulation was unchanged at 12 wk in ZDF rats compared to lean controls
Mean fold induction
Target Lean ZDF p-value
DNMT1 1.00 ± 0.23 0.97 ± 0.33 0.944
DNMT3a 1.00 ± 0.66 0.20 ± 0.10 0.215
DNMT3b 1.00 ± 0.44 0.33 ± 0.13 0.150
MBD1 1.00 ± 0.51 0.60 ± 0.32 0.504
MBD2 1.00 ± 0.73 0.18 ± 0.06 0.247
MBD3 1.00 ± 0.68 0.17 ± 0.11 0.213
MBD4 1.00 ± 0.70 0.11 ± 0.09 0.247
MeCP2 1.00 ± 0.65 0.15 ± 0.08 0.429
Data are means ± SEM, * indicates significant difference, P < 0.05


![Homocysteine-lowering interventions for preventing … · 2018. 12. 15. · [Intervention Review] Homocysteine-lowering interventions for preventing cardiovascular events Arturo J](https://img.pdfslide.us/doc/110x75/5ff89452656730039f05d58a/homocysteine-lowering-interventions-for-preventing-2018-12-15-intervention.jpg)