Embed Size (px)
Citation preview
Retinal Acuity Evaluation with the Potential Acuity Meter in Glaucoma Patients PENNY A. ASBELL, MD, BESSIE CHIANG,BA, ANJNI AMIN, BS, STEVEN M. PODOS, MD
Abstract: The potential acuity meter (PAM) is designed to evaluate retinal acuity in the presence of media opacities. We looked at patients with glaucoma but with clear media, and compared best corrected visual acuity with PAM results to see if they produced comparable results . Sixty eyes in 38 glaucoma patients and 20 eyes in 10 normal ocular patients were evaluated. Our results indicate that PAM visual acuity is a reliable indicator of Snellen visual acuity in normal eyes, in eyes with mild to moderate glaucomatous damage, and when PAM visual acuity measurements were better than 20/60. However, when visual field loss is severe and when PAM visual acuity readings were worse than 20/60, the correspondence between these and Snellen visual acuity was erratic. Poor PAM results will not correlate with postoperative visual acuity in patients with advanced glaucoma and cataracts. [Key words: cataract, glaucoma, potential acuity meter (PAM), retinal acuity, visual field.] Ophthalmology 92:764-767, 1985
Technological advances in recent years have contributed to better evaluation of potential visual acuity in patients with ocular media opacity. Quantitative measurements of visual acuity dependent solely on retinal function can be estimated by the potential acuity meter (PAM) (Mentor 0 & 0, Inc.) and the laser interferometer (U), using Snellen letters and interference patterns, respectively. Individual studies involving cataract patients have demonstrated the preoperative predictive capacities of the PAM and the LI.l-4 The U was also evaluated for predictability of visual potential in the presence of corneal opacities,S in amblyopia,6 in anterior segment disease7 and in senile macular degeneration.8 Reports of its efficacy vary.
As yet, no studies using the PAM in glaucoma patients have been published. In the present study, we evaluated patients with glaucoma and clear ocular media in order
From the Department of Ophthalmology, Mount Sinai School of Medicine, New York.
Presented at the Eighty·ninth Annual Meeting of the American Academy of Ophthalmology, Atlanta, Georgia, November 11 - 15, 1984.
Reprint requests to Penny A. Asbell, MD, Department of Ophthalmology, Mount Sinai School of Medicine, One Gustave L. Levy Place, New York, NY 10029.
764
to determine whether the PAM visual acuity corresponds with the standard Snellen VA measurements.
MATERIALS AND METHODS
All 38 patients (60 eyes) included in our study were examined at the Mount Sinai Hospital. The diagnosis of glaucoma was made on the basis of (1) increased intraocular pressure (greater than 22 mmHg), (2) characteristic glaucomatous visual field loss, and (3) increased cupping of the optic nerve head. Visual field defects, measured by Goldmann perimetry, were divided into four categories according to the severity of the field loss, with category 1 having the least damage and category 4 having the most damage: (I) category 1, baring of the blind spot and/or small paracentral scotoma; (2) category 2, nasal step; (3) category 3, arcuate scotoma; and (4) category 4, severe glaucomatous field loss as double arcuate scotomas and/or only 5 to 10° central field remaining.
When an eye fit into more than one category, it was placed under the category of the more severe pathology.
All patients were first examined with a slit lamp to detect opacities in the ocular media. Only those with
ASBELL, et al • PAM VISUAL ACUITY IN GLAUCOMA
NLP V LP [l ~ V I
%x / ~oo / I
2%0 V I
2%0 I // I
2%0 V 2?,SO 2 ~ I
2%0 I 2 2 V I 3 2%, 4 I l/ I
2% 2e 8 /1 1 2%0 ~ 2 2 I I
2%0 2%e 2%0 % 2%0 ~ 2~ "eo F%o raxoo I~ LP NLP
PAM VA
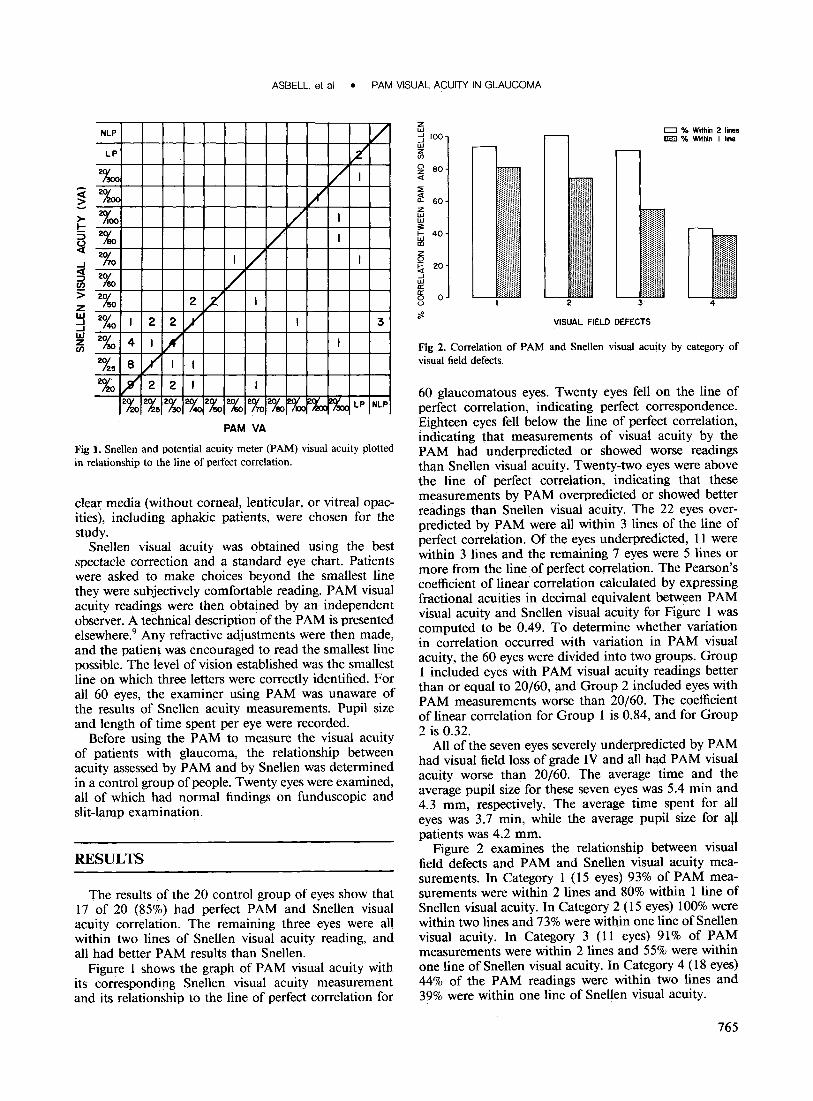
Fig 1. Snellen and potential acuity meter (PAM) visual acuity plotted in relationship to the line of perfect correlation.
clea~ media (without corneal, lenticular, or vitreal opacities), including aphakic patients, were chosen for the study.
Snellen visual acuity was obtained using the best spectacle correction and a standard eye chart. Patients were asked to make choices beyond the smallest line they were subjectively comfortable reading. PAM visual acuity readings were then obtained by an independent observer. A technical qescription of the PAM is presented elsewhere.9 Any refractive adjustments were then made and the patient was encouraged to read the smallest lin~ possible. The level of vision established was the smallest line on which three letters were correctly identified. For all 60 eyes, the examiner using PAM was unaware of the results of Snellen acuity measurements. Pupil size and length of time spent per eye were recorded.
Before using the PAM to measure the visual acuity of patients with glaucoma, the relationship between acuity assessed by PAM and by Snellen was determined in a control group of people. Twenty eyes were examined, all of which had normal findings on funduscopic and slit-lamp examination.
RESULTS
The results of the 20 control group of eyes show that 17 of 20 (85%) had perfect PAM and Snellen visual acuity correlation. The remaining three eyes were all within two lines of Snellen visual acuity reading,and all had better PAM results than Snellen.
Figure 1 shows the graph of PAM visual acuity with its corresponding Snellen visual acuity measurement and its relationship to the line of perfect correlation for
z w j 100 w z (f)
~ 80 «
«0.:::;:
60 z w w ~ ~ 40
§ !;( 20 ..J W 0::
15 0 o
VISUAL FIELD DEFECTS
c::J % Within 2 lines ~ % Within I line
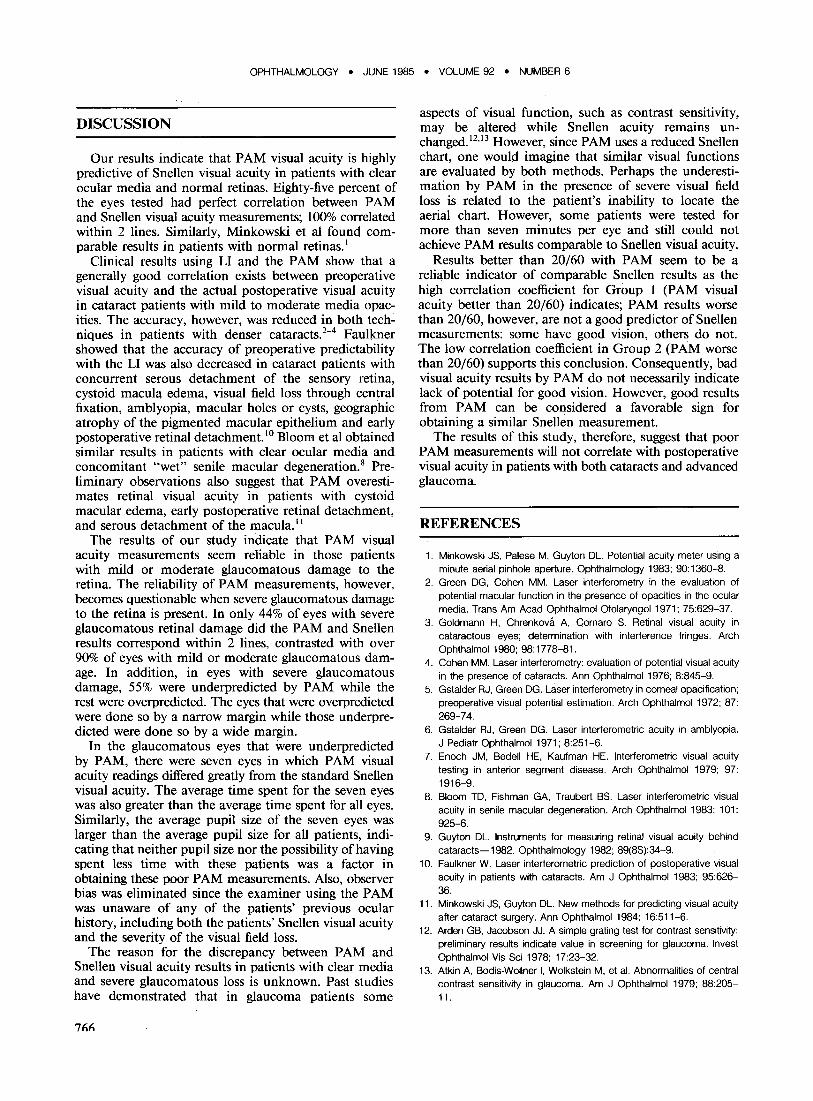
Fig 2. Correlation of PAM and Snellen visual acuity by category of visual field defects.
60 glaucomatous eyes. Twenty eyes fell on the line of perfect correlation, indicating perfect correspondence. Eighteen eyes fell below the line of perfect correlation, indicating that measurements of visual acuity by the PAM had underpredicted or showed worse readings than Snellen visual acuity. Twenty-two eyes were above the line of perfect correlation, indicating that these measurements by PAM overpredicted or showed better readings than Snellen visual acuity. The 22 eyes overpredicted by PAM were all within 3 lines of the line of perfect correlation. Of the eyes underpredicted, 11 were within 3 lines and the remaining 7 eyes were 5 lines or more from the line of perfect correlation. The Pearson's coefficient of linear correlation calculated by expressing fractional acuities in decimal equivalent between PAM visual acuity and Snellen visual acuity for Figure 1 was computed to be 0.49. To determine whether variation in correlation occurred with variation in PAM visual acuity, the 60 eyes were divided into two groups. Group 1 included eyes with PAM visual acuity readings better than or equal to 20/60, and Group 2 included eyes with PAM measurements worse than 20/60. The coefficient of linear correlation for Group 1 is 0.84, and for Group 2 is 0.32.
All of the seven eyes severely underpredicted by PAM had visual field loss of grade IV and all had PAM visual acuity worse than 20/60. The average time and the average pupil size for these seven eyes was 5.4 min and 4.3 mm, respectively. The average time spent for all eyes was 3.7 min, while the average pupil size for aU patients was 4.2 mm.
Figure 2 examines the relationship between visual field defects and PAM and Snellen visual acuity measurements. In Category 1 (15 eyes) 93% of PAM measurements were within 2 lines and 80% within 1 line of Snellen visual acuity. In Category 2 (15 eyes) 100% were within two lines and 73% were within one line of Snellen visual acuity. In Category 3 (11 eyes) 91% of PAM measurements were within 2 lines and 55% were within one line of Snellen visual acuity. In Category 4 (18 eyes) 44% of the PAM readings were within two lines and 39% were within one line of Snellen visual acuity.
765
OPHTHALMOLOGY • JUNE 1985 • VOLUME 92 • NUMBER 6
DISCUSSION
Our results indicate that PAM visual acuity is highly predictive of Snellen visual acuity in patients with clear ocular media and normal retinas. Eighty-five percent of the eyes tested had perfect correlation between PAM and Snellen visual acuity measurements; 100% correlated within 2 lines. Similarly, Minkowski et al found comparable results in patients with normal retinas. I
Clinical results using LI and the PAM show that a generally good correlation exists between preoperative visual acuity and the actual postoperative visual acuity in cataract patients with mild to moderate media opacities. The accuracy, however, was reduced in both techniques in patients with denser cataracts.2
-4 Faulkner
showed that the accuracy of preoperative predictability with the LI was also decreased in cataract patients with concurrent serous detachment of the sensory retina, cystoid macula edema, visual field loss through central fixation, amblyopia, macular holes or cysts, geographic atrophy of the pigmented macular epithelium and early postoperative retinal detachment. 10 Bloom et al obtained similar results in patients with clear ocular media and concomitant "wet" senile macular degeneration.s Preliminary observations also suggest that PAM overestimates retinal visual acuity in patients with cystoid macular edema, early postoperative retinal detachment, and serous detachment of the macula. II
The results of our study indicate that PAM visual acuity measurements seem reliable in those patients with mild or moderate glaucomatous damage to the retina. The reliability of PAM measurements, however, becomes questionable when severe glaucomatous damage to the retina is present. In only 44% of eyes with severe glaucomatous retinal damage did the PAM and Snellen results correspond within 2 lines, contrasted with over 90% of eyes with mild or moderate glaucomatous damage. In addition, in eyes with severe glaucomatous damage, 55% were underpredicted by PAM while the rest were overpredicted. The eyes that were overpredicted were done so by a narrow margin while those underpredicted were done so by a wide margin.
In the glaucomatous eyes that were underpredicted by PAM, there were seven eyes in which PAM visual acuity readings differed greatly from the standard Snellen visual acuity. The average time spent for the seven eyes was also greater than the average time spent for all eyes. Similarly, the average pupil size of the seven eyes was larger than the average pupil size for all patients, indicating that neither pupil size nor the possibility of having spent less time with these patients was a factor in obtaining these poor PAM measurements. Also, observer bias was eliminated since the examiner using the PAM was unaware of any of the patients' previous ocular history, including both the patients' Snellen visual acuity and the severity of the visual field loss.
The reason for the discrepancy between PAM and Snellen visual acuity results in patients with clear media and severe glaucomatous loss is unknown. Past studies have demonstrated that in glaucoma patients some
7F.F.
aspects of visual function, such as contrast sensitivity, may be altered while Snellen acuity remains unchanged. 12
,13 However, since PAM uses a reduced Snellen chart, one would imagine that similar visual functions are evaluated by both methods. Perhaps the underestimation by PAM in the presence of severe visual field loss is related to the patient's inability to locate the aerial chart. However, some patients were tested for more than seven minutes per eye and still could not achieve PAM results comparable to Snellen visual acuity.
Results better than 20/60 with PAM seem to be a reliable indicator of comparable Snellen results as the high correlation coefficient for Group 1 (PAM visual acuity better than 20/60) indicates; PAM results worse than 20/60, however, are not a good predictor of Snellen measurements: some have good vision, others do not. The low correlation coefficient in Group 2 (PAM worse than 20/60) supports this conclusion. Consequently, bad visual acuity results by PAM do not necessarily indicate lack of potential for good vision. However, good results from PAM can be considered a favorable sign for obtaining a similar Snellen measurement.
The results of this study, therefore, suggest that poor PAM measurements will not correlate with postoperative visual acuity in patients with both cataracts and advanced glaucoma.
REFERENCES
1. Minkowski JS, Palese M, Guyton DL. Potential acuity meter using a minute aerial pinhole aperture. Ophthalmology 1983; 90:1360-8.
2. Green DG, Cohen MM. Laser interferometry in the evaluation of potential macular function in the presence of opacities in the ocular media. Trans Am Acad Ophthalmol Otolaryngol1971; 75:629-37.
3. Goldmann H, Chrenkova A, Comaro S. Retinal visual acuity in cataractous eyes; determination with interference fringes. Arch Ophthalmol 1980; 98: 1778-81.
4. Cohen MM. Laser interferometry: evaluation of potential visual acuity in the presence of cataracts. Ann Ophthalmol 1976; 8:845-9.
5. Gstalder RJ, Green DG. Laser interferometry in comeal opacification; preoperative visual potential estimation. Arch Ophthalmol 1972; 87: 269-74.
6. Gstalder RJ, Green DG. Laser interferometric acuity in amblyopia. J Pediatr Ophthalmol1971; 8:251-6.
7. Enoch JM, Bedell HE, Kaufman HE. Interferometric visual acuity testing in anterior segment disease. Arch Ophthalmol 1979; 97: 1916-9.
8. Bloom TO, Fishman GA, Traubert BS. Laser interferometric visual acuity in senile macular degeneration. Arch Ophthalmol 1983; 101: 925-6.
9. Guyton DL. Instruments for measuring retinal visual acuity behind cataracts-1982. Ophthalmology 1982; 89(8S):34-9.
10. Faulkner W. Laser interferometric prediction of postoperative visual acuity in patients with cataracts. Am J Ophthalmol 1983; 95:626-36.
11. Minkowski JS, Guyton DL. New methods for predicting visual acuity after cataract surgery. Ann Ophthalmol1984; 16:511-6.
12. Arden GB, Jacobson JJ. A simple grating test for contrast sensitivity: preliminary results indicate value in screening for glaucoma. Invest Ophthalmol Vis Sci 1978; 17:23-32.
13. Atkin A, Bodis-Wollner I, Wolkstein M, et al. Abnormalities of central contrast sensitivity in glaucoma. Am J Ophthalmol 1979; 88:205-11.
ASBELL, et al • PAM VISUAL ACUITY IN GLAUCOMA
Discussion by
George W. Weinstein, MD
Accurate prognosis for patients being considered for cataract and corneal surgery is an important goal for. ophthalmologists. A number of instruments have been developed to allow preoperative evaluation of patients with corneal opacities and cataracts, in order to permit an assessment of the best achievable postoperative acuity. These devices have included instruments which are based on both subjective and objective principles, including the potential acuity meter and the laser interferometer in the former category and the visual evoked potential in the latter category. Each of these approaches is designed to detect the coexistence of other disorders, such as amblyopia, macular abnormalities, and optic neuropathies, which could compound the loss of visual acuity caused by the opacity of the media.
A commonly encountered clinical situation is the patient with both glaucoma and cataract. The ophthalmologist who wishes to assess the relative effect of each on visual acuity has a difficult challenge.
Dr. Asbell and co-workers have explored the use of the potential acuity meter (PAM) to assess the accuracy of this device in patients with mild, moderate, and severe glaucoma damage who have clear media. By extension, these studies would apply to patients with glaucoma and corneal opacity or cataract in whom the ophthalmologist is seeking to determine best achievable postoperative acuity.
Dr. Asbell's report indicates that the potential acuity meter can produce unreliable results in patients with advanced
From the Department of Ophthalmology, West Virginia University Medical Center, Morgantown.
glaucomatous field defects. This is particularly true when PAM results are poor. The authors conclude that good results from PAM are a favorable sign, but bad results from PAM are unreliable.
The opportunity to discuss this paper gave me the occasion to investigate the problem in our own institution. We studied 21 patients with chronic open-angle glaucoma and clear media, subdividing them by visual field loss into three groups: minimal, moderate, and severe. There were eight patients in the first group, seven in the second and six in the third. A total of 39 eyes were tested, and this was performed in a double masked fashion.
Our results showed that 30 of the 39 eyes (77%) showed no difference between Snellen and PAM acuity results, or only 1 line difference. Three eyes had 2 lines difference between the Snellen and PAM results. Of these, 2 were in the minimal field loss group and one was in the moderate field loss group. Four eyes showed a difference of greater than 2 lines, and all of these were in the severe field loss group (this represented 4 of the 10 eyes in that group, or 40%). In each of these cases, the PAM results were worse tHan the Snellen acuity results.
Therefore, our study confirms. the work of Dr. Asbell and co-authors, implying that the PAM test would be a poor predictor of postoperative acuity in patients with opacities of the media if severe visual field defects are present. Of course, preoperatively, one may not know whether a given patient with chronic open-angle glaucoma has mild, moderate, or severe visual field loss, thereby producing a degree of uncertainty for all patients with chronic open-angle glaucoma who have corneal opacities or cataract.
767
![The treatment of malignant glaucoma in nanophthalmos: a ...glaucoma, uveal effusion syndrome with or without ex-udative retinal detachment, and acute ACG [8, 9]. Several theories can](https://img.pdfslide.us/doc/110x75/60a14203da491a740322475d/the-treatment-of-malignant-glaucoma-in-nanophthalmos-a-glaucoma-uveal-effusion.jpg)


![Glaucoma Detection Using Retinal Nerve Fiber Layer Texture ......glaucoma. The best way todetect glaucoma is optic nerve head (ONH), and the imaging modalities used (optical coherencetomography[OCT],](https://img.pdfslide.us/doc/110x75/604c2d786805e8157444d61f/glaucoma-detection-using-retinal-nerve-fiber-layer-texture-glaucoma-the.jpg)


![FUZZY CLUSTERING TECHNIQUES BASED ON GLAUCOMA … · optic cup detection for glaucoma detection using the cup to disc ratio in retinal fundus images. Joshi G.D. et al[10]. developed](https://img.pdfslide.us/doc/110x75/5f0f495b7e708231d44368c2/fuzzy-clustering-techniques-based-on-glaucoma-optic-cup-detection-for-glaucoma-detection.jpg)

![Research Paper Role of Citicoline in an in vitro AMD model...glaucoma disease [6–8]. Parisi et al. demonstrated that injected intramuscularly improves retinal and function in glaucoma](https://img.pdfslide.us/doc/110x75/60f9f78c4fa9a7154d19ae95/research-paper-role-of-citicoline-in-an-in-vitro-amd-model-glaucoma-disease.jpg)


![Managing the Glaucoma Suspect.CENY.2015 [Read-Only] · developing glaucoma but without definitive ... – History – Best visual acuity – Pupils – Anterior segment evaluation](https://img.pdfslide.us/doc/110x75/5ed2280362fb5e456c0761c8/managing-the-glaucoma-read-only-developing-glaucoma-but-without-definitive-.jpg)