Embed Size (px)
Citation preview

CHAPTER
Reticulate Evolution and Phylogenetic Networks 6
So far, we have modeled the evolutionary process as a bifurcating treelike process. The main feature of trees is that the flow of information in one lineage is independent of that in another lineage. In real life, however, many process-es—including recombination, hybridization, polyploidy, introgression, genome fusion, endosymbiosis, and horizontal gene transfer—do not abide by lineage independence and cannot be modeled by trees.
Reticulate evolution refers to the origination of lineages through the com-plete or partial merging of two or more ancestor lineages. The nonvertical con-nections between lineages are referred to as reticulations. In this chapter, we introduce the language of networks and explain how networks can be used to study non-treelike phylogenetic processes. A substantial part of this chapter will be dedicated to the evolutionary relationships among prokaryotes and the very intriguing question of the origin of the eukaryotic cell.
NetworksNetworks were briefly introduced in Chapter 4 in the context of protein-protein interactions. Here, we provide a more formal description of networks and their use in phylogenetics. As mentioned in Chapter 5, trees are connected graphs in which any two nodes are connected by a single path. In phylogenetics, a network is a connected graph in which at least two nodes are connected by two or more pathways. In other words, a network is a connected graph that is not a tree. All networks contain at least one cycle, i.e., a path of branches that can be followed in one direction from any starting point back to the starting point. Typically, a network is depicted in diagrammatic form as a set of dots or circles for the vertices, joined by lines or curves for the edges (Figure 6.1, left side).
The edges may be directed or undirected. For example, if the vertices rep-resent proteins, and the edges denote participation in the building of a dimer, trimer, or higher order n-mer, then the edges are undirected because if protein A participates in an n-mer with protein B, then protein B also participates in the n-mer with protein A. The networks in Figures 6.1a and 6.1b consist solely of undirected edges.
© 2016 Sinauer Associates, Inc. This material cannot be copied, reproduced, manufactured or disseminated in any form without express written permission from the publisher.

238 Chapter 6
A directed edge represents an interaction that has at least one direction. For example, the edge may represent the activation of one protein by another. Such an interaction is directed because the fact that protein A activates protein B does not mean that protein B activates protein A. The networks in Figures 6.1c and 6.1d consist solely of directed edges. A directed edge may be uni-directional, as is the case when A activates B but B does not ac-tivate A, or bidirectional, as when A activates B and B activates A (Figure 6.1c). A network is called a directed network if all its edges are directed; it is an undirected network if all its edges are undirected. In a mixed network, some edges are directed and some are undirected.
If the edges of the network are equal in strength of interac-tion, frequency, likelihood of occurrence, importance, physical distance, and so forth, they are said to be unweighted. The net-work shown in Figure 6.1a contains only undirected, unweighted edges. If the edges of a network are assigned a weight, they are said to be weighted. A network containing solely undirected, weighted edges is shown in Figure 6.1b.
Similar to undirected edges, directed edges may also be unweighted (Figure 6.1c) or weighted (Figure 6.1d). Directed, weighted edges are particularly useful when dealing with hori-zontal gene transfer (Chapter 9), in which the weight of an edge may represent the number of transfers from one taxon to another.
Networks can also be fully represented by matrices (Figure 6.1, right side), which are amenable to algebraic manipulations. Networks can be fully defined by an n × n matrix, where n is the number of vertices. The aij element in the matrix denotes the edge
between vertex i and vertex j. If an edge connects vertex i with vertex j in an undi-rected unweighted network (Figure 6.1a), then aij = 1, and aij = 0 otherwise. In such a network, aij = aji. In the matrix representation of an undirected weighted network (Figure 6.1b), aij equals the weight of the edge connecting vertex i with vertex j, and aij = 0 otherwise. In this type of matrix too, aij = aji. In the matrix representation of a directed unweighted network (Figure 6.1c), aij = 1 if a directed edge is pointing from vertex i to vertex j, and aji = 1 if a directed edge is pointing from vertex j to vertex i. If the edge is unidirectional (green arrow), then aij ≠ aji. If the edge is bidirectional (red arrow), then aij = aji. In the matrix representation of a weighted directed network (Fig-ure 6.1d), aij equals the weight of the directed edge pointing from vertex i to vertex j, and aji equals the weight of the directed edge pointing from vertex j to vertex i.
Phylogenetic and Phylogenomic NetworksReticulate (network-like) evolution refers to evolutionary processes that violate the independence of evolutionary lineages by allowing some lineages to merge and pro-duce new lineages. Reticulate evolution is modeled by networks instead of by trees (Figure 6.2).
Graur 1e Sinauer AssociatesMorales StudioGraur1e_06.01.ai 08-24-15 12-02-15
a a b c d e0a 1 0 0 11b 0 1 1 10c 1 0 0 00d 1 0 0 11e 1 0 1 0
(a) Networks Matrices
b
c
de
a a b c d e0a 3 0 0 23b 0 1 2 10c 1 0 0 00d 2 0 0 42e 1 0 4 0
(b)
3
1
b
c
de
2
4
2
1
a a b c d e0a 1 0 0 10b 0 1 1 00c
Out
In
In
0 0 0 00d 1 0 0 00e 1 0 1 0
22011
0 3 1 2 1
(c)
b
c
de
a a b c d e0a 3 0 0 20b 0 1 2 00c
Out
0 0 0 00d 0 0 0 00e 1 0 4 0
53005
0 4 1 6 2
(d)
b
c
de
3
1
212
4
Figure 6.1 Networks, shown on the left, are composed of vertices (circles) and edges (lines or arrows). For each network, the matrix represen-tation is shown on the right. (a) An undirected unweighted network. (b) An undirected weighted network. (c) A directed unweighted network. Unidirec-tional and bidirectional edges are denoted by green and red arrows, respec-tively. (d) A weighted directed network. In both (c) and (d), “In” on the matrix denotes the sum of the weights of the vertices pointing toward that vertex, and “Out” denotes the sum of the weights of the vertices pointing away from that vertex.
© 2016 Sinauer Associates, Inc. This material cannot be copied, reproduced, manufactured or disseminated in any form without express written permission from the publisher.

Reticulate Evolution and Phylogenetic Networks 239
While the term “phylogenetic tree” is well defined (Chapter 5), the meaning of “phylogenetic network” is somewhat ambiguous, and in the literature there exist many different usages of the term. Here, we will use a modified form of a definition originally proposed by Huson and Bryant (2005). According to this definition, a phylogenetic network is a net-work in which taxa are represented by nodes and various relationships between two taxa are represented by directed or undirected edges. As in the case of phylogenetic trees, a directed edge may represent ancestry and descent, whereby one taxon or a genomic component is assumed to be derived from another. In contradistinction to phylogenetic trees, however, a directed edge in a phylogenetic network may also represent a partial genetic relationship—that is, one taxon may have only contrib-uted partially to the genome of another taxon. Undirected edges repre-sent relationships between two nodes in which it is impossible with the data at hand to tell which is the ancestor and which is the descendant.
Formally, a phylogenetic network is defined as a graph in which at least one OTU is connected to the common ancestor by two or more paths. This feature distinguishes a phylogenetic network from a phylo-genetic tree.
As in the case of phylogenetic trees, in which only rooted ones can explicitly describe the evolutionary process, only rooted (or directed) phylogenetic networks can explicitly describe the evolution of taxa in the presence of reticulate events. Two conditions must be met for a phy-logenetic network to be rooted. First, all the branches emanating from all the nodes must have a direction, either incoming or outgoing, repre-senting the flow of genetic information. Second, there must exist a node within the network with no incoming branches. A network lacking such a node is called a circuit. Circuits are seldomly used in phylogenetics.
The methodology for reconstructing phylogenetic networks from em-pirical data is still in its infancy despite a veritable deluge of publications on the subject (e.g., Nakhleh et al. 2005; Huson and Bryant 2006; Jin et al. 2007a,b; Than et al. 2008; Willson 2008; Huson et al. 2009, 2011; Meng and Kubatko 2009; Nakhleh 2009; Huson and Scornavacca 2011; Morrison 2011). In other words, although many methods for building networks out of comparative molecular data have been proposed in the literature, it would be premature to assess their relative usefulness or the conditions under which they yield trustworthy inferences. Some meth-ods seem to have wider applications; others serve narrower purposes. Some methods employ simple algorithms; others are computationally expensive and time-consuming. Here, we present two simple methods for reconstructing unrooted phylogenetic networks. Those interested in more advanced examinations of network methodology should consult Huson et al. (2011) and Morrison (2011).
The term phylogenomic network refers to a network in which the nodes repre-sent genomes and the edges represent either the presence of homologous genes or instances of horizontal gene transfer. In cases where edges represent homologous genes, an edge may be weighted by the number of genes common to two genomes. In cases where edges represent horizontal gene transfers, an edge may be weighted by the number of such transfers between two genomes. If the donor-recipient rela-tionships are known, the horizontal gene transfers should be represented by directed edges (Dagan 2011).
The median network methodThe median network method (Bandelt et al. 1995, 2000) reconstructs phylogenetic networks from binary data. Molecular sequences can be first transformed into binary data, say by using purines (R) versus pyrimidines (Y) instead of the four nucleotides,
Graur 1e Sinauer AssociatesMorales StudioGraur1e_06.02.ai 08-24-15 11-16-15
OTU 1
(a)
ACCTOTU 2GCCT
G2C
T4A C3A
A1G
OTU 3GCCA
AGCT
OTU 4AGCT
OTU 5AGAT
(b)
ACAT
C3T
G2C
OTU 6ACCA
ACCA
AGCT
OTU 7TGCA
TGCAACAT
OTU 5
HTU 4 HTU 3HTU 2
HTU 1
T4AA1T
Figure 6.2 Divergent versus reticulate evolu-tion. (a) In a binary bifurcating tree, each lineage is assumed to evolve independently. Thus, the sequences of the extant OTUs (1–5) are expected to trace back to the common ancestor of all OTUs via a single path and to have each accumulated all the substitutions that occurred on their individual paths. (b) An example of reticulate evolution with three OTUs, in which the common ancestor, HTU 1, gave rise to HTUs 2 and 3, and HTU 4 resulted from a reticulate event (recombination) involving HTUs 2 and 3. Reticulate evolution can only be represented by phylogenetic networks, graphs in which two or more paths may connect an OTU to the common ancestor. Nucleotide substitutions are marked on the branches by using the OMIM format (www.ncbi.nlm.nih.gov/omim). For example, “A1G” denotes a change from A to G in nucleotide position 1.
© 2016 Sinauer Associates, Inc. This material cannot be copied, reproduced, manufactured or disseminated in any form without express written permission from the publisher.

240 Chapter 6
or by using only nucleotide sites that contain only two nucleotides in all the taxa un-der study. Alternatively, the method can be used on binary molecular data, such as the presence or absence of a character state. In both cases, constant sites are excluded from the analysis and each binary site is translated into a split in which each of the resulting partitions contains OTUs that have the same character state at a site. For example, let us assume that the character states at a certain homologous position in OTUs 1, 2, 3, 4, and 5 are R, R, Y, Y, and R, respectively. At this site, the split will result in two partitions (1, 2, 5) and (3, 4).
Let us now consider all the homologous sites in the aligned sequences. Each site that contains two character states can be split into two. We can then cluster all the sites supporting the same split into split patterns. These patterns can be added se-quentially in the process of constructing a network, as illustrated in Figure 6.3. This method is not much limited by the number of OTUs or the number of patterns (which is, of course, positively correlated with the number of OTUs). However, when the number of patterns increases, it may become very difficult to display the network on a two-dimensional page.
The conditioned-reconstruction methodThe conditioned-reconstruction method (Lake and Rivera 2004) can be used to infer massive reticulate events, such as genome fusion, rather than events affecting particu-lar genes, such as horizontal gene transfer. The method uses genome-wide statements concerning the presence (P) or absence (A) of orthologous genes. In this method, the distance between two genomes, X and Y, is solely a function of the frequencies of the four possible character state patterns (i.e., PP, PA, AP, and AA). If an orthologous gene is present in both X and Y, then the pattern for that ortholog is PP. Likewise, if the X ortholog is present and the Y ortholog is absent, the pattern is PA, and if the X ortholog is absent and the Y ortholog is present, the pattern is AP. Of course, in deal-ing with only two genomes, one can only consider the set of all genes present in X or Y—that is, the union of the set of genes present in X and the set of genes present in Y. Hence, the AA set will by necessity be empty, i.e., its frequency will be zero. Because
Figure 6.3 Median network methodology. The data consist of five OTUs (A–E). There were 42 aligned sites that contained exactly two character states. At the top of the figure, the sequence alignment for these 42 sites is shown in tabular format, with the rows of homolo-gous characters in the order in which they appear in the original sequences. To provide visual clues about the patterns among the sequences, each nucleotide is uniquely colored. We then rearrange the columns so that identical splitting patterns are adjacent to one another. In our example, we have eight different patterns, so there will be eight steps in the process of infer-ring the phylogenetic network. We note that the order in which the pattern groups are added to the analysis does not affect the result; any order will do. (a) First, we consider the pattern defined by sites 1, 5, 20, 35, and 39. This pattern splits the taxa into two groups, A and B on the one hand, and C, D, and E on the other. The length of the branch between the two groups is 5 character-state differences. (b) Next, we add the pattern defined by sites 17, 18, 27, and 29. This pattern does not contradict the previous split; it merely adds a new split, with C and D on one side and E on the other. (c) In the next step, we add the pattern defined by sites 32 and 41. These sites yield a split that contradicts one of the previous splits. In order to put A and E in a group together, we need to add a pair of branches rather than a single branch. Thus, characters 32 and 41 are represented by two branches rather than one. Note that characters 1, 5, 20, 35, and 39 are now represented by a pair of parallel edges as well. (d) In the next step, we add the group defined by the single site 3. Again, rather than a single branch, a set of parallel branches needs to be added, each originating in a different preexisting group. (e–h) Each of the next four pattern groups splits the data into a single OTU, on the one hand, and the other four OTUs, on the other. Thus, in each case, we need to add a single branch to the growing phylogenetic network. Since the data are binary, every character splits the sequences into two groups (bipartitions), each group being defined by its shared nucleotide pattern. The resulting median network (h) displays all the bipartitions. (i) Some partitions (red dashed lines) are in conflict. Partition I conflicts with partition II and IV; partition II conflicts with I; partition III conflicts with IV; and IV conflicts with I and III.
© 2016 Sinauer Associates, Inc. This material cannot be copied, reproduced, manufactured or disseminated in any form without express written permission from the publisher.

Reticulate Evolution and Phylogenetic Networks 241
Graur 1e Sinauer AssociatesMorales StudioGraur1e_06.03.ai 11-16-15
(a)
A, BC, D, E
1, 5, 20, 35, 39
(b)
A, B
E
C, D17, 18, 27, 29
(c)
A
B
E
C, D32, 41
(d)
A
B
E
C
D
3
(e)
A
B
E
C
D
21, 24, 40
(f)
A
B
E
C
D
6, 8, 9
(g)
A
B
E
C
D
4, 10, 22, 23, 26, 30, 31, 33
(h)
A
B
E
C
D
2, 7, 11, 12, 13, 14, 15, 16, 19, 25, 28, 34, 36, 37, 38, 42
(i)
A
B
I
IIIII
IV
E
C
D
A
A
G
G
G
A
B
C
D
E
C
T
T
T
T
T
T
T
C
C
G
G
G
G
T
A
A
C
C
C
G
G
A
G
G
T
C
C
C
C
C
C
T
C
C
T
T
G
T
T
T
T
T
T
G
C
T
T
T
T
G
A
A
A
A
T
C
C
C
C
T
C
C
C
C
T
A
A
A
A
A
G
G
G
G
T
T
C
C
T
A
A
G
G
A
T
C
C
C
C
T
T
C
C
C
T
C
T
T
T
T
T
T
T
C
C
C
C
C
A
T
C
T
T
T
T
C
C
C
C
C
C
C
C
G
T
T
C
C
T
G
C
C
C
C
T
T
C
C
T
T
T
T
T
C
A
A
A
A
G
C
T
T
T
C
G
G
G
G
A
A
C
C
C
C
T
T
C
C
C
C
A
A
A
A
A
G
G
G
G
T
C
C
C
C
A
A
G
G
G
T
C
T
T
T
T
C
C
C
T
A
1OTU
Informative data
2 3 4 5 6 7 8 9 10 11 12 13 14 15 16 17 18 19 20 21 22 23 24 25 26 27 28 29 30 31 32 33 34 35 36 37 38 39 40 41 42
G
G
G
G
Data rearranged into eight nucleotide patterns
20OTU 35 1 39 5 23 26 10 22 30 4 33 31 2 11 36 7 13 14 19 25 38 15 12 28 34 16 37 4217 27 29 18 21 24 40 8 9 632 41 3
T
T
C
C
C
T
T
C
C
C
A
A
G
G
G
A
A
G
G
G
A
A
C
C
C
A
B
C
D
E
C
C
C
C
A
C
C
C
C
G
T
T
T
T
T
T
T
T
T
T
T
T
G C C
G
G
G
G
T
G
G
G
G
A
A
A
A
A
G
C
T
T
T
T
C
T
T
T
T
C
A
A
A
A
T
C
C
C
C
C
C
C
C
C
C
C
C
C
C
C
C
C
C
C
C
C
C
C
C
C
C
C
C
C
C
C
C
T T T T T T
A
A
A
A
G
A
A
A
A
G A A
G
G
G
G
G
G
G
G
G
G
G
G
A AT
T
C
C
T
T
T
C
C
T
T
T
C
C
T
A
A
G
G
A
T
C
T
T
T
T
T
T
T
T
T
T
C
T
C
C
C
T
C
C
T
T
G
T
T
G
G
A
G
G
C
T
T
T
C
T
C
C
C
T
T
T
T
C
C
© 2016 Sinauer Associates, Inc. This material cannot be copied, reproduced, manufactured or disseminated in any form without express written permission from the publisher.

242 Chapter 6
of the particular distance model used by Lake and Rivera (2004), the distance between X and Y cannot be computed for cases in which the frequency of AA is zero. To overcome this dif-ficulty, an additional genome, called the con-ditioning genome, is added. Only those genes that are present in the conditioning genome are used. The use of a conditioning genome affects the probabilities of all four joint states in the two-genome example (i.e., it affects the probabilities of PP, PA, AP, and AA). For a gene to be coded as present, it must be present in the conditioning genome and in the genome being coded. For a gene to be coded absent, it must be present in the conditioning genome and absent in the genome being coded. There-fore, if a gene is present in genome X, absent in genome Y, but not present in the conditioning genome, it will not be included in the count of PA patterns. Similar reasoning applies to the PP, AP, and AA categories.
Let us now examine the case of four taxa (W, X, Y, and Z) and one conditioning genome. We assume that there is no horizontal gene transfer affecting subsets of genes. With four taxa and two character states (A and P), there can be 16 possible joint states (Figure 6.4a). In the absence of reticulation, we ex-pect all the genes to support a single tree. Of course, sampling and stochastic errors may result in a few genes not supporting the single tree. If reticulate evo-lution occurs but is infrequent, we expect the majority of genes to support one tree, but we also expect to find alternative trees that are significantly supported by the data (Figure 6.4b).
Next, let us examine the case of genome fusion (Figure 6.4c). We assume that there are three taxa (W, X, and Y) connected to one another by a traditional unrooted tree, as well as an additional taxon, Z, that was created by a fusion between a relative of W and a relative of Y. We further assume that the respective patterns of presence and absence of genes in W and Y are the same as in their relatives. We note that, with three taxa, there are eight possible joint states.
The rules for assigning P or A to each gene in the fused genome (Z) are simple: every gene present in either genome W or genome Y is present in genome Z. If the same gene ortholog is present in both W and Y, then two copies of that ortholog will exist in genome Z, but only one will be counted. Using these rules, one can deduce all the possible patterns. For illustration, consider a gene that in genomes W, X, and Y has the AAP pattern. Genome Z will contain a copy from the ancestor of Y, and the resulting pattern for W, X, Y, and Z will be AAPP. Thus, a genome fu-sion between the ancestor of W and the ancestor of Y can only create 8 possible joint states (as opposed to
Graur 1e Sinauer AssociatesMorales StudioGraur1e_06.04.ai 08-24-15 11-05-15
WXYZ
W
Z
X
Y
PPPPPPPAPPAPPAPPAPPPAAAAPAAP100% <100%
>0%
>0%
APPAPAPAAPAPAAPPAAAPAAPAAPAAPAAAPPAA
(a)
(c)Z
X
W Y
WXYZ
W
Z
X
Y
W
X
Y
Z
W
X
1
Y
Z
W
W1 Z Y X
Z2 Y X W
Y1 X W Z
X2 W Z
Z
Y
W
W
1 Z Y
Y
X
X
W Z Y X
Z
X
Y
2W
Z
Y
Z
PPPPPPPAPPAPPAPPAPPPAAAAPAAPAPPAPAPAAPAPAAPPAAAPAAPAAPAAPAAAPPAA
(b)
WXYZPPPPPPAPPAPPAPPPPAAPAPAAAAPPAAAA
WXYPPPPPAPAPAPPPAAAPAAAPAAA
Figure 6.4 The conditioned-reconstruction method. (a) Sixteen possible joint states for four taxa W, X, Y, and Z. In the absence of any reticulate event, we would expect 100% of all genes to support a single unrooted tree. (b) If reticulate evolution is infrequent, we would expect the majority of genes to support one tree but would also expect to find alternative trees that are significantly supported by the data. (c) The fu-sion of two genomes produces a cycle graph. Z was produced by a fu-sion of a relative of W that descended from the ancestor marked by the red circle and a relative of Y that descended from the ancestor marked by the blue circle The two four-taxon trees that are simultaneously supported by the four genome patterns are numbered 1 and 2. These four-taxon trees are consistent with a repeated arrangement W-Z-Y-X, W-Z-Y-X, … , which corresponds to the cycle graph shown at the bot-tom. (Modified from Lake and Rivera 2004.)
© 2016 Sinauer Associates, Inc. This material cannot be copied, reproduced, manufactured or disseminated in any form without express written permission from the publisher.

Reticulate Evolution and Phylogenetic Networks 243
the 16 states that can be created without genome fusion). The sum of the probabilities of these 8 patterns should be 1.
With four genomes, there can be three unrooted trees. Pattern AAPP supports the tree in which genomes W and X are paired on one side of the central branch, and ge-nomes Y and Z are paired on the other side; this is tree (WX)(YZ). Pattern PAAP sup-ports tree (WZ)(XY). The other six patterns are uninformative. Pattern APAP would have supported tree (WY)(XZ); however, pattern APAP cannot appear (i.e., it has a zero probability). If patterns PAAP and AAPP appear with high probability, then two trees are simultaneously supported. After ruling out the possibility of a stochastic artifact, this simultaneous support for contradicting trees can be taken as indicative of reticulation. We can then examine whether or not the trees that have been obtained belong to the subset of trees predicted by the fusion event. Subsequently, we can as-certain whether or not the trees can form a cycle by alternately placing them below each other and successively shifting one taxon to the right, thereby forming a repeat-ing pattern as would be formed if the cycle graph were continuously rolled (Figure 6.4c). If this is the case, then the results support genome fusion.
As we will see later, the conditioned-reconstruction method was used to tackle the origin of the eukaryotic cell.
Inferred reticulations: Are they real?An inferred phylogenetic network is a summary of all the phylogenetic conflicts in the data set, i.e., a list of all the partitions that conflict with other partitions. In other words, an inferred phylogenetic network is a visual representation of all the phylo-genetic signals within a data set that cannot be made to conform to a strict treelike phylogeny. Note that even if the true evolutionary process is entirely treelike, phylo-genetic conflict may occur because of (1) stochastic error, (2) methodological issues in data collection (e.g., taxon sampling, character sampling, choice of outgroups), (3) ho-moplasy (e.g., parallelism, convergence, reversal), and (4) inappropriate data analysis (e.g., model misspecification, choice of optimality criterion). An additional source of phylogenetic conflict in otherwise treelike processes may be incomplete lineage sort-ing due to the ancestral population’s polymorphic state at a locus. Of course, scientists are mostly interested in phylogenetic conflicts that uncover real reticulations, such as those arising when the data under study are derived from two or more phylogenetic histories. Unfortunately, deciding whether a phylogenetic conflict represents a real evolutionary reticulation or an artifact due to analytical quirks is very difficult.
It is important to emphasize that any data conflict can create reticulations, ir-respective of its source, and factors that have nothing to do with the evolutionary process itself may confound the search for genuine reticulate gene-flow processes (Morrison 2010). Thus, the mere fact that one can build a phylogenetic network with a data set does not mean that the evolutionary processes that gave rise to the data were reticulate. A phylogenetic network may hint at the existence of reticulate processes, or it may merely represent methodological or stochastic flukes in the data. Conversely, the fact that “feeding” sequences to a tree-making program yields a tree does not prove that the evolutionary process that gave rise to the extant sequences under study was exclusively treelike.
Examples of Real-Life Phylogenetic NetworksMany evolutionary processes are known to violate lineage independence and, hence, cannot be modeled by phylogenetic trees. Here, we illustrate the process of reticula-tion by using as an example the evolution of a common allele in the ABO-blood-group system in humans. The phenomenon of speciation by polyploidy in woodferns will be used to illustrate the conceptual difficulties of dealing with speciation by hy-bridization, specifically the difficulties arising from the fact that, by definition, spe-cies produced by hybridization are paraphyletic. A few other examples of reticulate evolution due to polyploidy will be found in Chapter 7. Later in this chapter, we will
© 2016 Sinauer Associates, Inc. This material cannot be copied, reproduced, manufactured or disseminated in any form without express written permission from the publisher.

244 Chapter 6
deal with the reticulate evolutionary processes in prokaryotes and the genome fusions that may have given rise to the eukaryotic cell.
Reticulate evolution by recombination: A resurrected blood-group allele in humansIn terms of information flow, genetic recombination entails the splitting and rejoining of two unrelated or distantly related DNA sequences to form a new DNA sequence. The recombinant sequence, therefore, is a merger of two evolu-tionary histories. Understandably, such a process cannot be modeled by trees. Instead, we need to represent it as a network. In Figure 6.5, we illustrate the consequence of a recombination event on the structure of the phylogenetic net-work. We start with four sequences: two sequences that underwent recombi-nation, the resulting recombinant sequence, and an outgroup sequence that is reasonably close to the ancestral sequence that gave rise to the two recombining sequences. We assume that at each stage of the evolutionary process, changes can accumulate independently on each of the branches. The resulting phyloge-netic network illustrates what happens when the network is based on data from the recombinant sequence, its parental sequences, and an outgroup. The pa-rental alleles will emerge on opposing branches emanating from the rectangle, and each will have a long external branch. The recombinant allele, on the other hand, will have a short external branch and will be located across from the out-group. The network will be a reflection of a phylogenetic conflict, whereby one part of the recombinant sequence is closely related to one parent, whereas the other part of the recombinant sequence is related to the other. If the process that gave rise to the network was indeed a recombination event, then the sites sup-porting one or the other constituent tree will be clustered on the recombinant sequence, rather than being interleaved with one another.
As an example, here we examine the evolution of the human ABO blood group in chromosome 9, which encodes a glycosyltransferase that catalyzes the transfer of carbohydrates to the H antigen (Figure 6.6). Three allele groups, A, B, and O, segregate at the ABO glycosyltransferase locus. The human ABO glycosyltransferase gene consists of seven exons, with most of the coding se-quence found in exon 7. The A and B alleles code for glycosyltransferases that
Graur 1e Sinauer AssociatesMorales StudioGraur1e_06.05.ai 08-24-15 10-21-15
1
(a)
(c)
2 3 4 5 6 7 8 9 10 11 12 13 14 15
A T T A T C C C G A C C T C Tout
2, 4, 5 8, 11 1, 6,12 7 9,13,15 3, VI10,14
out
Aanc T C A T C C C G G C C T T T
Ap1 A C G C C C C C G C C A T A
p1
p2
T A T
A G C
T A T
A G C
C C
C C
G G
G G
A C C
A C C
T T G
A C C
C
C
C
G
G T T
C A A
G T T
G T T
T A C
C G T
C G T
C G Tr1
Tp2 T C A T T C G G G G G T T T
Ar1 A C G C C G G G G G C T T T
Tr2 T C A T T C C C G C C T T A
1
(b)
2 3 4 5 6 7 8 9 10 11 12 13 14 15
A T T A T C C C G A C C T C Tout
out p1
Ap1 A C G C C C C C G C C A T A
p2
Tp2 T C A T T C G G G G G T T T
r1
Ar1 A C G C C G G G G G C T T T
V
III
III
(d)
Sites Sites
r2 T T C A T T C C C G C C T T A
Aanc T C A T C C C G G C C T T T
PatternsIV VIII III VI
IV
Figure 6.5 A phylogenetic network rep-resentation of a recombination event. (a) An alignment of seven sequences derived from a simple evolutionary scenario, in which a 15 bp ancestral sequence (anc) gives rise to two descendant sequences (p1 and p2). Subsequently, five nucleo-tide substitutions are assumed to occur in the lineage leading to p1 (blue letters), and four substitutions in the lineage lead-ing to p2 (red letters). Next, a recombi-nation between sites 6 and 7 produces two recombinants, r1 and r2. After the recombination, sequences p1, p2, and r1 each accumulate a nucleotide substitution, at site 7, 12, and 13, respectively (green letters). It is also assumed that there are three nucleotide differences (orange let-ters) between anc and an outgroup (out), at sites 3, 10, and 14. (b) We assume that we only have access to extant sequenc-es, i.e., we do not have the sequence of anc. Moreover, we assume that r1 and r2 were produced by a single recombination event and that the transmission of both recombinant alleles to the next genera-tion is highly improbable. Thus, only r1 is available for the analysis. (c) The 15 aligned sites can be divided into six pat-terns (I–VI), from which we can build a phylogenetic network. (d) The phylogenetic network represents the relationship of four sequences (p1, p2, r1, and out). Patterns determining each split are shown on the branches. The two recombining alleles (p1 and p2) are located on opposing branches emanating from the rectangle. Both have long external branches. The recombinant allele (r1), on the other hand, has a short external branch and is located across from the outgroup (out). Note that the pattern that supports the short external branch leading to the recombinant allele (r1) repre-sents a single nucleotide substitution that occurred after the recombination event. In contrast, the patterns supporting the long external branches of alleles p1 and p2 (III and V) represent nucleotide substitutions that occurred both before and after the recombination event.
© 2016 Sinauer Associates, Inc. This material cannot be copied, reproduced, manufactured or disseminated in any form without express written permission from the publisher.

Reticulate Evolution and Phylogenetic Networks 245
transfer N-acetylgalactosamine or galactose, respectively, to the H antigen. There are two nonsynonymous nucleotide differences in exon 7 that determine the functional distinction between the glycosyltransferases encoded by the A and B alleles (Figure 6.6c). Allele O is similar to allele A except for the deletion of a G at position 261 in exon 6, which induces a frameshift that results in a truncated protein devoid of any glycosyltransferase activity.
Each allele group consists of many alleles that differ from one another in sequence. However, all alleles within each allele group exhibit identical enzymatic activities. Within each allele group, some alleles are common, some are rare, and some are pri-vate alleles, i.e., they were only found in one or a few individuals.
Kitano et al. (2012) examined the phylogenetic relationships among several com-mon alleles belonging to all three groups. Here, we will only discuss three of these alleles, O01, A101, and B101, as well as an outgroup, the chimpanzee A allele. In the aligned sequences, there were 72 sites that consisted of exactly two character states (Figure 6.6a) and could be used with the median network method. The structure of the resulting phylogenetic network (Figure 6.6b) has all the topological features as-sociated with the occurrence of a reticulation event whereby genetic information from both O01 and B101 has been transferred to A101. We note, for example, that the ex-ternal branches leading to O01 and B101 are much longer than the branch leading to A101 (which has a length of 0), and that A101 is located across the rectangle from the outgroup. In the alignment, we note that 20 of the 21 sites supporting the clustering of A101 and B101 are clustered in the 5′ part of the gene, while all 9 sites supporting a clustering of A101 with O01 are concentrated in the 3′ part. This lack of interleaving is a telltale sign of recombination.
A simplified evolutionary scheme is shown in Figure 6.6c. Based on the fact that chimpanzee populations segregate alleles A and O, and since O is clearly derived from A, this allele is assumed to have been the ancestral allele in humans. Approxi-mately 2 million years ago, the B allele was derived from an ancestral A allele by two nucleotide substitutions. Sometime later, the O allele was derived from another ancestral A allele by a nucleotide deletion, and because it is nonfunctional the O al-lele has evolved rapidly ever since. Fortuitously, upstream of the nucleotide deletion
Graur 1e Sinauer AssociatesMorales StudioGraur1e_06.06.ai 08-24-15 10-21-15
26
Chimpanzee
(b)
(a)
(c)
4 7 4 5 2 5 6 8 1 6 9 1 4 8 9 0 1 3 5 6 2 3 4 5 6 9 0 1 2 4 6 7 6 5 6 7 1 2 3 7 8 9 1 2 3 4 5 6 1 2 6 8 9 0 6 0 1 5 4 9 0 2 4 7 8 2 4 7 9 0 3 41 1 2 2 2 2 3 3 3 4 4 4 4 5 5 5 5 5 6 6 6 6 6 6 7 7 7 7 7 7 8 9 9 1 1 1 1 2 2 2 3 3 3 3 3 3 4 4 4 4 4 5 5 6 6 6 7 7 8 8 8 9 9 0 0 0 0 1 1 1
1 1 1 1 1 1 1 1 1 1 1 1 1 1 1 1 1 1 1 1 1 1 1 1 1 1 1 1 1 1 2 2 2 2 2 2 2
GC T AT T AAAGAGGAT GAC CGACGCAT AT T T C T G T T CGCCCG T T C T AT CGCGACGGGGCGAGGGCGAGCG T C TChimpanzee
GC T G T T AAAACAG T T GGC CGACAT AT GC T CAT AGCAGC T T ACC T CGCGAAT G T T A – AT AAAAACGAAT T CACO01
GCCACCGG T ACAAACAAT T AG T T C T CAT AT CGAT CAC T C T ACC T CGCGAAT G T T GGAT AGAAACGGAT T CACA101
AB101 T CACCGG T ACAAACAAT T AG T GC T CAT AT CGAT CAC T C T ACC T CGCGAAT G T T GGGCGGGGGACAG T GCAC
12 21
9
A
Recombination
A O
B
4
O01O01
A101
A101
B101
B101
A
Figure 6.6 Inferring a reticulation from a phylogenetic network. (a) An alignment of sites containing exactly two character states for three major ABO blood-group alleles in humans (O02, A101, and B101) and allele A from chimpanzee. Site numbers follow Kitano et al. (2012). Two sites (197 and 198; red shading) define the difference between A and B alleles in exon 7. Site 160 (blue shading) represents the nucleo-tide deletion in exon 6 that defines O alleles. Two different splits are shown below the sequences. Red squares denote the split ((chim-panzee, O01),(A101, B101)); blue squares denote the split ((chimpan-zee, B101),(O01, A101)). No sites support the third possible split, ((chimpanzee, A101),(O01, B101)). (b) A median phylogenetic network showing the telltale signs of reticu-lation. (c) A simplified scheme of the evolutionary pathway for three human ABO alleles. The A, B, and O lineages are shown in black, red, and blue, respectively. The two nucleotide substitutions in exon 7 that are crucial for the functional differences between the A and B alleles are shown, accompanied by the resulting amino acid replace-ments (in parentheses). (Modified from Kitano et al. 2012.)
© 2016 Sinauer Associates, Inc. This material cannot be copied, reproduced, manufactured or disseminated in any form without express written permission from the publisher.

246 Chapter 6
no other nonsense mutation occurred, and the two positions that define the A allele have not been substituted. Thus, by about 1.5 million years ago the original A al-lele became extinct. Approximately 260,000 years ago, a recombination occurred that joined the intact exon 6 from a B101 and the A-defining sites in exon 7 from O01. The result was a “resurrected” functional A allele. In the period between the extinction of the ancestral A allele group and the emergence of A101, it is assumed that human populations possessed only two allele groups, B and O. The resurrection of an A allele occurred before the emergence of anatomically modern humans. Nowadays, A101 has a worldwide distribution and a very high frequency. It is, therefore, reasonable to assume that the increase in A101 frequency was driven by some kind of very strong positive selection, although the nature of this selection remains a mystery.
Speciation by hybridization: The reticulate evolution of woodfernsDryopteris is a cosmopolitan fern genus consisting of about 225 species. Of its 13 North American species that reproduce sexually, 7 are diploid, 5 are tetraploid, and one is hexaploid. Using sequence data from nine plastid and two nuclear sequences to reconstruct the phylogenetic relationships among the diploid species revealed that the tetraploid Dryopteris species were derived through hybridization of diploid spe-cies, while the hexaploid species was a hybrid between a tetraploid mother (the donor of the plastid sequence) and a diploid father (Figure 6.7). Sessa et al. (2012) identified four diploid progenitors of four tetraploid and one hexaploid taxa. One hypotheitical diploid taxon, tentatively referred to as Dryopteris “semicristata,” has yet to be identi-fied in nature.
Based on divergence time analyses, the earliest Dryopteris allopolyploids are thought to have been formed within the last 6 million years. Sessa et al. (2012) found no evidence for recurrent formation of any of the polyploids. In other words, the poly-ploids are bona fide species rather than accidental hybrids. In addition, the four tetra-ploids were found to be transgressive with respect to geographic range relative to one or both of their diploid “parents.” That is, their habitat ranges extend beyond those of the parents, suggesting that ecological advantages in novel habitats may promote long-term regional coexistence of the hybrid taxa with their progenitors.
As is evident from the example in Figure 6.7, it is impossible to define monophyletic clades or sister taxa within phylogenetic networks. Moreover, species concepts that were already problematic in taxa abiding by the tree model become utterly inappropri-ate in cases in which speciation is driven by reticulate processes such as hybridization.
We note that speciation by hybridization occurs in many plant and animal species. Even the poster child for divergent treelike evolution, the genus Geospiza (Darwin’s finches), has been shown to experience periodic reticulate gene flow among its con-stituent species. This gene flow has resulted in a significant reduction in the genetic
Graur 1e Sinauer AssociatesMorales StudioGraur1e_06.07.ai 08-24-15 10-20-15
D. goldiana (GG)
D. ludoviciana (LL)
D. “semicristata” (SS)
D. cristata (SSLL)
D. clintoniana (SSLLGG)
D. celsa (LLGG)6
6
7 7
6
7
6
7
6
7
D. carthusiana (IISS)
D. campyloptera (IIEE)D. intermedia (II)
D. expansa (EE)
Figure 6.7 A phylogenetic network showing the process of speciation by hybridization and consequent polyploidization events in North American fern species belonging to genus Dryopteris. The five different genomes in the network are denoted G, L, S, I, and E. Tetraploid D. campyloptera (IIEE) was derived by hybridiza-tion between the diploid species, D. expansa (EE) and D. intermedia (II). Tetraploid D. celsa (LLGG) was derived by hybridization between the diploid species, D. ludoviciana (LL) and D. goldiana (GG). Tetra-ploid D. carthusiana (IISS) and D. cristata (SSLL) were derived from hybridizations involving diploids D. intermedia (II) and D. ludoviciana (LL), respectively, and an as yet hy-pothetical diploid called D. “semi-cristata.” Hexaploid D. clintoniana (SSLLGG) was derived by hybridiza-tion between tetraploid D. cristata and diploid D. goldiana. The sexes of the two parents giving rise to the polyploid species were inferred through comparisons of organ-elle sequences that are maternally inherited.
© 2016 Sinauer Associates, Inc. This material cannot be copied, reproduced, manufactured or disseminated in any form without express written permission from the publisher.

Reticulate Evolution and Phylogenetic Networks 247
difference between species as well as the occasional creation of hybrids whose fitness is greater than that of their nonhybrid parents (Arnold and Larson 2004; Grant et al. 2004). Finally, hybrid speciation has also been found in at least one mammalian taxon. The Clymene dolphin, Stenella clymene, arose through hybridization between a striped dolphin (S. coeruleoalba) father and a spinner dolphin (S. longirostris) mother (Amaral et al. 2014). Stenella clymene is currently genetically isolated from its parental species, although low levels of introgressive hybridization below the level of detection may be occurring.
The Tree of Life HypothesisThe “tree of life” has been variously used as a metaphor, an iconographic device, a re-search tool, and a hypothesis (Mindell 2013). As an iconographic device, the tree of life entails the treelike representation of the phylogenetic relationships among all extant and extinct taxa. Of course, it is impossible to include all phylogenetic relationships within a single image, so in practice, the tree of life principally highlights the first di-vergence events that subsequently gave rise to all the taxa in the world. The tree of life hypothesis is the assertion that the evolutionary relationships among all organisms can be accurately described by means of a rooted, bifurcating tree. In this section, we will assess the suitability of the tree of life hypothesis to describe all of evolutionary history.
The tree of life hypothesis is based on two assumptions. The first is the monophy-letic view of life, according to which all life forms, be they humans, sponges, onions, algae, or bacteria, are evolutionarily related to one another. This view was first articu-lated by Charles Darwin in 1859: “All the organic beings which have ever lived on this Earth have descended from one primordial form, into which life was first breathed.” The second assumption was put forward by Alfred Wallace a year earlier: “There is a general principle in nature which will cause many varieties to survive the parent species, and to give rise to successive variations departing further and further from the original type.” This evolutionary “principle” instituted the practice of describing the evolutionary history of the living world as a branching tree, in which descendant species become isolated almost instantaneously from their ancestors and then become hermetically isolated from one another through progressive divergence. According to the tree of life hypothesis, all of Earth’s organisms, both extant and extinct, can be neatly placed at terminal nodes on a gigantic bifurcating tree.
The tree of life hypothesis has had great appeal in the field of molecular evolution, most probably because it made an intuitive and logical connection between a molecu-lar phenomenon (DNA replication) and an evolutionary phenomenon (speciation). As a matter of fact, because DNA replication is binary, at the most fundamental level (i.e., tracing the evolutionary history of individual nucleotide positions), evolution can accurately be described as a bifurcating, rooted, treelike process. As Maddison et al. (2007) put it, “all life on Earth [is] intimately connected in a single tree-like structure of flowing nucleotide sequences, housed in the bodies of organisms they help build. This tree is billions of years in age, with myriad branches, and millions of extant leaves. The existence of this tree, and that each of us is part of one of its leaves, is one of the most profound realizations that we as a species have achieved.”
For about 100 years following Wallace’s and Darwin’s pronouncements, biologists found only a very few exceptions to the “rule” that there is but one tree of life and that this tree is forever bifurcating. The tree of life informed scientists that evolutionary lineages diverge continuously away from one another and that interactions among descendant lineages are rare and, if they occur at all, have only transient and trivial consequences. In the last 50 years, however, numerous reticulate evolutionary events have been discovered, especially among prokaryotes, which have raised doubts about the universality of the tree of life phylogenetic framework.
The initial reaction to the discovery of reticulations was to regard them as “phylo-genetic noise,” more so since scientists realized quite quickly that methodological ar-tifacts and stochastic errors can give rise to the appearance of reticulation even when
© 2016 Sinauer Associates, Inc. This material cannot be copied, reproduced, manufactured or disseminated in any form without express written permission from the publisher.

248 Chapter 6
no reticulation has actually occurred. Under the “noise” assumption, reticulations were assumed to occur either infrequently or not at all and, hence, to have almost no effect on the underlying treelike structure of the evolutionary process. One “quick and dirty” approach was to assume a priori that a phylogenetic process is binary and, hence, that the “true tree” can be “extracted” by putting aside or averaging out the few genes or positions within a gene that have experienced reticulate evolution and then focusing on the “well-behaved” data.
Implicit in the tree of life hypothesis is the assumption that different genes in a ge-nome have identical evolutionary histories (Doolittle 2004). This situation is illustrated in Figure 6.8a. We know now that, in its strictest sense, this so-called standard or all-core model only applies to a subset of macroscopic multicellular eukaryotes. For pro-karyotes and for the many unicellular eukaryotes in which horizontal gene transfer is a common occurrence, more realistic models are required to allow for reticulate events.
Figure 6.8b describes the stable-core model. In this model, there is a stable core of a few genes that are never horizontally transferred between genomes. If for a group of taxa a stable core of genes can be shown to exist, then these core genes can be used to construct a phylogenetic tree on which reticulate events can subsequently be superimposed. Thus, the validity of a taxon that experiences reticulate evolution but possesses a stable core of genes may be assessed by the tree methodology. If, on the other hand, reticulate evolution predominates, the assumption that a tree exists will yield misleading results.
In Figure 6.8c, no gene is exempt from transfer. In this shifting-core or no-core model, each gene can have an evolutionary history that is different from any other gene. If evolution occurs along the lines of the no-core model, then no phylogenetic tree exists. Paraphrasing Doolittle (1999), scientists frequently fail to find the true tree, not because their methods are inadequate or because they have chosen the wrong genes or the wrong reconstruction method, but because there is no tree to be found in the first place.
Many researchers have expressed the belief that a stable core of genes that are im-mune to transfer does indeed exist. The belief in a stable core of genes is based on the complexity hypothesis (Jain et al. 1999), which states that genes whose functional products (at the DNA, RNA, or protein levels) interact with the products of other genes will coevolve. That is, mutations that will affect the structure and function of one gene product (call it A) will be compensated by mutations that will affect the in-teracting product of another gene (product B). By means of compensatory mutations, the essential interactions between A and B are preserved throughout evolution. The same is true for a second lineage, in which the homologous gene products A′ and B′
Graur 1e Sinauer AssociatesMorales StudioGraur1e_06.08.ai 11-09-15
(a) All core (b) Stable core (c) No core
Figure 6.8 Three models for relationships among genome and gene phylogenies for four taxa A, B, C, and D. Each gene lineage is represented by a different color. (a) In the all-core model no genes are exchanged among the ge-nomes, so that each gene in a ge-nome has exactly the same evolu-tionary history as any other gene in that genome. (b) In the stable-core model, some, possibly even most, genes can be transferred among different genomes over evolution-ary time, but a core of genes is immune to this process. Here, the core genome consists of two genes (black and blue lineages) that have identical phylogenetic topologies. These core genes can be used to reconstruct species phylogeny and construct a tree. (c) In the no-core model, no gene is immune from horizontal gene transfer, so in prin-ciple each gene can have a different phylogenetic history from any other gene. In the case shown here, no two genes have the same phyloge-netic topology.
© 2016 Sinauer Associates, Inc. This material cannot be copied, reproduced, manufactured or disseminated in any form without express written permission from the publisher.

Reticulate Evolution and Phylogenetic Networks 249
will also coevolve. If gene B in one lineage is replaced by gene B′ from another lineage, then the product of gene A may interact less effectively with the product of gene B′ than with the product of gene B. Similarly, product A′ may not be as effective in its interaction with B as it was with B′. Inefficient interactions between gene products may negatively affect the fitnesses of the carriers of these mismatched genes. Such genotypes will subsequently be wiped out by purifying selection. Purifying selection is extremely efficient in prokaryotes, which usually have enormous effective popula-tion sizes. The corollary of the complexity hypothesis is that interacting genes would be very difficult to transfer horizontally from taxon to taxon without reducing the fit-ness of the recipient. Moreover, the more interactions a gene product is involved with, the less likely it is that the gene can be viably transferred horizontally.
One such supposedly “untransferable” gene is the small subunit rRNA-specifying gene that has served as a de facto “universal molecular chronometer” (Woese 1987) for many years. The small subunit rRNA is an important interacting component at the center of an enormously complex structure, the ribosome. It interacts directly and indirectly with two other RNAs and at least 50 proteins in performing a function (translation) that is vital and essential to life.
Because of their numerous interactions, informational genes—the genes involved in replication, transcription, ribosome biogenesis, and translation—should be hard to transfer even across very short evolutionary distances. Indeed, these genes are rare among reliably identified horizontally transferred genes. Nonetheless, there are confirmed reports of horizontal transfer involving informational genes (e.g., Green 2005), including small subunit rRNA-specifying genes.
A rigorous test of the stable-core idea for any higher taxon would entail (1) the comparison of all the genomes under study, (2) extracting the set of genes common to all taxa, (3) using these genes to reconstruct phylogenetic trees, and (4) tallying up how many phylogenies are congruent with one another. Efforts in this direction have so far failed (Doolittle 2004); there are fewer than 50 genes shared by most genomes, and few of these genes yield statistically robust trees, let alone trees that can be mean-ingfully compared with other trees for congruence. Thus, at present it is not possible to prove that there exists a stable core of genes common to all species. Of course, absence of evidence is not evidence of absence.
Let us, however, contemplate the possibility that a stable core of genes as hypoth-esized in Figure 6.8c does not exist. Let us further imagine that all genes are transfer-able horizontally, at least in principle, but that the likelihood of transfer varies greatly among genes and among evolutionary lineages. Under such a regime, the success of the transfer would be determined by the nature of the sequence being transferred, the similarities or dissimilarities between the donor and recipient species, and the physical proximity of the donor and the recipient (Chapter 9). Thus, although a stable core of genes may not exist, in the short run at least, the presence of biased horizontal gene transfer may preserve a treelike phylogenetic structure.
The Vertical and Horizontal Components of Prokaryote EvolutionGenome evolution in prokaryotes entails both treelike components generated by ver-tical inheritance from an ancestor to descendants and network-like components gen-erated by horizontal gene transfer. One of the most important questions in the field of prokaryotic phylogeny is, Can the vertical component of the phylogeny be recovered?
Because of extremely variable rates of evolution among lineages and the great antiquity of many taxonomic groups, reconstructing the evolutionary relationships among prokaryotes would have been a formidable task even in the absence of reticu-lations. The superimposition of horizontal gene transfers on top of an already diffi-cult-to-reconstruct phylogenetic tree results in a situation in which the reconstruction of evolutionary relationships among prokaryotic taxa is, for all intents and purposes, unattainable. There are two main reasons for this situation.
© 2016 Sinauer Associates, Inc. This material cannot be copied, reproduced, manufactured or disseminated in any form without express written permission from the publisher.

250 Chapter 6
First, prokaryotic lineages experience a very high rate of gene turnover (gene gain and loss), which causes the number of orthologous genes available for phylogenetic analysis to decline precipitously as the number of taxa under study increases. More-over, in contrast to eukaryotes, in which changes in the gene repertoire occur mostly via DNA duplication, in prokaryotes high rates of horizontal gene transfer determine gene content (Treangen and Rocha 2011). For those of us accustomed to the comfort-ing verticality of vertebrate phylogeny, such radical departures from the Darwinian paradigm seem difficult to swallow. However, if we remember how quickly antibiotic resistance has spread across taxonomic boundaries via horizontal gene transfer, it becomes clear that the process of evolution operates quite differently in prokaryotes than it does in eukaryotes.
Second, it is an underappreciated but very important observation that in prokary-otes, the mechanisms of genetic recombination are identical with the mechanisms of horizontal gene transfer. That is, recombination in prokaryotes is never reciprocal; it is always unidirectional, from donor to recipient, and always entails recombina-tion across small parts of the genome, rather than whole-chromosome pairing and assortment as in eukaryotes. Because prokaryotic growth is clonal, the process of recombination overlaid upon clonal growth generates descendant lineages that have increasingly divergent collections of genes. Over time, “conspecific” cells will have little in common with one another in terms of their genomic content. Thus, the term “genome” in reference to prokaryotic species is meaningless. Instead, we use the term “pangenome” to refer to the collection of all genes found in a “species” (Chapter 10). For example, an analysis of 61 sequenced strains of Escherichia coli revealed that there are close to 16,000 gene families distributed among the strains, but only about 4,000 in any individual genome, and slightly less than 1,000 gene families present in all 61 genomes (Lukjancenco et al. 2010). Microbiologists call these 1,000 shared gene families the “core genome” and the remainder the “accessory genome.” Concepts like pangenomes, core genomes, and accessory genomes (Chapter 10) are fundamentally foreign to the field of eukaryote phylogenetics, where all individuals belonging to a species have approximately the same number and arrangement of gene loci.
There are currently two extreme schools of thought. One school believes that pro-karyotic evolution cannot be dealt with by phylogenetic trees at all (e.g., Bapteste et al. 2009) and that a new metaphor or a new heuristic device is needed. Accepting this view requires a redefinition, or at least a revision, of the term “species” as far as pro-karyotes are concerned. The other school of thought believes that, although reticulate evolution is common in prokaryotes, a central treelike signal remains that cannot be realistically explained by a self-reinforcing pattern of biased horizontal gene transfer (Puigbò et al. 2010). In this view, trees are “the natural representation of the histories of individual genes given the fundamentally bifurcating process of gene replication.” Some researchers believe that the rate of horizontal gene transfer is too low to obscure an underlying treelike structure. In their opinion, horizontal gene transfers, even when relatively common, should not affect treelike evolutionary history but are seen more as “cobwebs” connecting tree branches (Ge et al. 2005).
Boucher and Bapteste (2009) suggest a distinction between open lineages and closed lineages. A closed lineage is one in which the majority of evolutionary chang-es occur vertically. According to their analysis, eubacterial species such as Staphy-lococcus aureus and Escherichia coli are closed lineages, while Streptococcus pyogenes and Neisseria gonorrhoeae represent open lineages. The distinction between open and closed lineages is not absolute, however, and whether a phylogenetic tree may or may not be used in evolutionary reconstruction is not a clear-cut decision.
Prokaryote taxonomy and the meaning of “species” in prokaryotesEver since Aristotle, approximately 2,500 years ago, the meaning of the basic biologi-cal unit—the “species”—has been debated. Systematics entails the belief that species (e.g., Homo sapiens or Allium cepa) exist extramentally. That is, species are not arbitrary
© 2016 Sinauer Associates, Inc. This material cannot be copied, reproduced, manufactured or disseminated in any form without express written permission from the publisher.

Reticulate Evolution and Phylogenetic Networks 251
social constructs; they are real and have verifiable characteristics. In particular, indi-viduals belonging to a species are said to share a combination of traits that unite them as members of that species and distinguish them from members of other species. This approach works quite well as far as multicellular, sexually reproducing eukaryotes are concerned. In prokaryotes, the term “species” is incalculably more abstruse, since in addition to the question “What is a species?” we must also concern ourselves with the question “Do species exist?”
Notwithstanding these difficulties, for pragmatic, clinical, and epidemiological reasons, microbiologists require a taxonomy that is effective, predictive, and stable. As stated in Brenner et al. (2005), “bacterial classifications are devised for microbiolo-gists, not for the entities being classified. Bacteria show little interest in the matter of their classification.” How else will microbiologists communicate their science to their peers and the general public? How else can we diagnose the etiological agent of a disease or determine which bacteria to use in mitigating the polluting effects of oil spills? When we have a cough, we need to know whether it’s Legionella, Streptococcus, or something else. The taxonomy determines which particular antibiotic is prescribed, even though in many cases the pathogen may have already acquired, via horizontal gene transfer, the resistance genes that will not only render this particular antibiotic ineffectual, but also cast doubt on its taxonomic status.
Let us first tackle the problem of nomenclature. The taxonomic requirement for describing and naming a new prokaryotic taxon is that one strain be designated as the type strain that could subsequently be used as reference for any further taxonomic identification. The designated type strain should be deposited in two international collections and made publicly available. Unfortunately, this system of identification does not seem to work for prokaryotes. First, the vast majority of prokaryotes are not culturable. Put simply, for some prokaryotes we possess the genomic sequence but not its physical embodiment as a living organism. Second, Richter and Rosselló-Móra (2009) found that fewer than 30% of the sequenced genomes in databases actually belonged to the type strain of the species to which they were supposed to belong.
Let us deal with prokaryote classification by noting first that, as opposed to the classification of eukaryotes, prokaryote taxonomy cannot follow phylogenetics be-cause phylogenetic relationships among taxa are mostly unrecoverable. The early clas-sification of prokaryotes was based solely on phenotypic similarities, but in the late 1960s some genome-based methods were developed to evaluate taxonomic relation-ships. Among them, DNA-DNA hybridization techniques became popular in deter-mining crude genome similarities among organisms. DNA-DNA hybridization tend-ed to be reproducible and was an improvement over methods relying on phenotypes. Over the years, a practice was established whereby strains were deemed to belong to a coherent taxon (or genospecies) if they shared DNA-DNA hybridization values with greater than 70% similarity. With the advent of genome sequences, DNA-DNA hybridization techniques became obsolete, and attempts were made to use measures such as the average nucleotide identity between genome pairs as the gold standard for clustering genomes into meaningful taxonomic standards. A value of 95% nucleotide identity between 16S rRNAs was found to be equivalent to the DNA-DNA hybridiza-tion critical value of 70% (Richter and Rosselló-Móra 2009). It should be noted that these threshholds (or any others) are by necessity arbitrary. Moreover, if measures of sequence similarity or dissimilarity are applied to commensal and pathogenic strains of E. coli, the resulting classification might indicate the existence of many different species rather than the single species recognized so far.
Several comparative measures, which rely on more than a single gene, have been suggested. One such method, multilocus sequence typing, in which the sequences of a small number of housekeeping genes (usually seven) are compared, is mainly used in epidemiological studies. Multilocus sequence typing and other comparative sequence methods frequently fail to identify important taxonomic entities, which may have many genes with similar sequences in common with other species, yet differ in gene content. One such example concerns Burkholderia mallei, the causative agent of
© 2016 Sinauer Associates, Inc. This material cannot be copied, reproduced, manufactured or disseminated in any form without express written permission from the publisher.

252 Chapter 6
equine glanders, a disease characterized by pneumonia and necrosis of the tracheobronchial tree if B. mallei is inhaled, or by pustular skin lesions, abscesses, and sep-sis if the skin is the portal of entry.
Sequence comparisons based on 16S rRNA indicated that B. mallei is indistinguishable from the mostly sap-rophytic B. pseudomallei and a B. pseudomallei-like bac-terium called B. thailandensis, which lives on dead or de-caying organic matter. In contrast to B. mallei, which is an obligate parasite of horses, mules, and donkeys with no other known natural reservoir, B. pseudomallei and B. thailandensis are free-living organisms. As shown in Fig-ure 6.9, a multilocus sequence-typing analysis revealed that all B. pseudomallei isolates are tightly clustered and well separated from the B. thailandensis isolates. In con-trast, B. mallei was found to be nested within B. pseudom-allei. So, while B. pseudomallei and B. thailandensis are un-ambiguously distinct species, B. mallei is merely a derived clone with a peculiar ecological distribution (an eco-type) of B. pseudomallei. This means that, on taxonomic and phylogenetic grounds, B. pseudomallei and B. mallei should not be given separate species names, although the important differences in their biochemical activities and in the clinical symptoms and epidemiology justify their being classified as two species. These differences are due to gene content rather than sequence differences.
The current practice in prokaryote taxonomy is to apply standard phylogenetic tools (Chapter 5) to a set of informational genes, for example, genes that specify ribosomal RNAs or encode proteins for ribosome bio-genesis and information-processing functions. These genes are thought to be only very rarely transferred horizontally and are, hence, regarded as suitable mark-ers for reconstructing the vertical evolutionary history of prokaryotes. Each newly discovered or characterized prokaryotic taxon is, thus, defined and assigned to it proper taxonomic grouping on the basis of a very small number of genes, and such classifications may be irrel-evant to the traits that are of most interest to clinicians and public health workers.
Basic to any notion of “species” is that in nature they comprise discrete clusters of organisms, defined genom-ically and phenotypically. That is, genome space “is not uniformly filled by a seamless spectrum of intergrading types” (Helal et al. 2011). Results from metagenomics, i.e., the sequencing of genetic material recovered di-rectly from environmental samples consisting of organ-isms that cannot be grown in culture in the laboratory, suggest that communities of microbes do not exist as discrete sets of species, in which the genomes of differ-ent individuals resemble one another to a great extent. Rather, a wide spectrum of organisms displaying dispa-rate levels of sequence dissimilarity may form a species (Huson et al. 2009).
These findings have led some researchers to abandon the strict notion of “species” in prokaryotes. Doolittle
Figure 6.9 A phylogenetic tree for three Burkholderia species: B. mallei, B. pseudomallei, and B. thailandensis. The tree is based on sequence similarity of a concatenation of seven housekeeping gene segments (ace, gltB, gmhD, lepA, lipA, nark, and ndh) from a large collection of B. pseudomallei and B. thailandensis isolates, as well as a single isolate of B. mallei. (Isolate numbers are listed to the right of the species name.) The total length of the ungapped aligned sequences was 3,399 base pairs. The position of B. mallei within the B. pseudomallei strains is shaded blue. (Modified from Gevers et al. 2005.)
Graur 1e Sinauer AssociatesMorales StudioGraur1e_06.09.ai 08-24-15 11-16-15
pseudomallei 4
pseudomallei 24
pseudomallei 22
pseudomallei 35
pseudomallei 37
pseudomallei 5
pseudomallei 9
pseudomallei 18
pseudomallei 38
pseudomallei 67
mallei
pseudomallei 2
pseudomallei 6
pseudomallei 1
pseudomallei 27
pseudomallei 26
pseudomallei 12
pseudomallei 11
pseudomallei 16
pseudomallei 8
pseudomallei 15
pseudomallei 34
pseudomallei 29
pseudomallei 32
pseudomallei 31
pseudomallei 21
pseudomallei 41
pseudomallei 19
thailandensis 74
thailandensis 76
thailandensis 78
thailandensis 79
thailandensis 75
© 2016 Sinauer Associates, Inc. This material cannot be copied, reproduced, manufactured or disseminated in any form without express written permission from the publisher.

Reticulate Evolution and Phylogenetic Networks 253
and Zhaxybayeva (2009), for instance, came to the conclusion that there is no “prin-cipled way” in which questions about prokaryotic species, such as how many species there are, or how large their populations are, or how widely they are distributed, can be answered. Instead, they advocate the acceptance of a fuzzier notion of prokaryotic species. Accordingly, it is possible that some prokaryotes form species either by re-strictive horizontal gene transfer or by periodic selection, while others may not form species at all. Thus, “species” is no longer a term describing a category with universal biological application, but merely a useful descriptor of certain types of populations, which we nominally call a “species,” although the category itself may not be real. Of course, at some point the degree of fuzziness becomes too extreme for even species nominalism to work.
If we completely abandon the phylogenetic tree metaphor for prokaryotes, we must also be disabused of the notion that there is a uniquely natural hierarchical scheme for prokaryotes, which in turn would mean that the hope of ever unambiguously know-ing what species are is a delusion (Doolittle 2009a,b). According to this view, the term “species” in prokaryotes should be recognized as a useless reification that we must and can do without.
The Phylogeny of EverythingIn this section, we attempt to trace evolutionary history to its very beginning, thus supplying the foundation on which to build a phylogeny that will encompass all life on Earth. This feat will require us to deal with (1) the eukaryote-prokaryote divide, (2) the eubacterial-archaebacterial divide, (3) the internal taxonomic and phylogenetic divisions within prokaryotes, (4) the origin of the eukaryotic cell, and (5) the identi-fication of the first divergence event in evolutionary history.
The eukaryote-prokaryote divide and the taxonomic validity of ProcaryotaThe dichotomy between Eucaryota and Procaryota was first proposed by Chatton (1925) and later formalized by Stanier and van Niel (1962) and Ris and Chandler (1963). (In the 1970s, Chatton’s original spelling fell out of fashion, and the terms “Eu-caryota” and “Procaryota” were gradually replaced by “Eukaryota” and “Prokaryota,” respectively.) As opposed to eukaryotes, which were defined by their distinct nucleus and cytoplasm, prokaryotes for a very long time were defined by what they do not have: they were said to be those organisms that lack a membrane-enclosed nucleus. Subsequently, other negative character states were added, such as lack of spliceoso-mal introns and spliceosomes and a primary lack of mitochondria. As a consequence, some claimed that prokaryotes were taxonomically illegitimate because they could only be defined by “a negative and therefore scientifically invalid description” (Woese 1998; Pace 2006, 2009). Pace (2009) even advocated banishing the term “prokaryote” from our textbooks and language. These assessments on the validity of Prokaryota have turned out to be inaccurate, as prokaryotes are now known to share several posi-tive characters in common, including chromosomes attached to membranes (Cavalier-Smith 2007) and cotranscriptional translation, i.e., a process whereby the nascent messenger RNA is translated into a protein as the RNA is still being transcribed (Martin and Koonin 2006; Whitman 2009). This situation is completely different from that in eukaryotes, in which mRNA is produced in the nucleus and then exported to the cytoplasm for translation. Thus, in addition to negative traits, at least two positive traits can be regarded as prokaryotic synapomorphies.
The Eubacteria-Archaebacteria divideIn traditional classification, prokaryotes consisted of a single kingdom, Bacteria, that included the cyanobacteria (which once were called blue-green algae and classified within Plantae). The studies of Woese and Fox (1977a) and Fox et al. (1977, 1980) on the rRNA sequences of a few methanogenic bacterial genera (e.g., Methanobacterium
© 2016 Sinauer Associates, Inc. This material cannot be copied, reproduced, manufactured or disseminated in any form without express written permission from the publisher.

254 Chapter 6
and Methanosarcina) challenged this traditional view. Methanogens are unusual pro-karyotes that are obligatory anaerobes in oxygen-free environments such as sewage treatment plants and the intestinal tracts of animals; they generate methane (CH4) by combining carbon dioxide (CO2) and molecular hydrogen (H2). Because of their size, their lack of a nuclear membrane, and their low DNA content, methanogens were con-sidered bacteria, which at the time was synonymous with prokaryotes. According to the traditional view, they were, hence, expected to be more closely related to the other bacteria than to the eukaryotes. However, in terms of rRNA dissimilarity, methano-gens turned out to be equidistant from both taxa (Sapp and Fox 2013). On the basis of these findings and the fact that the methanogenic metabolism was thought at the time to be suited to the kind of atmosphere believed to have existed on the primitive Earth (rich in CO2, but virtually devoid of oxygen), Woese and Fox (1977a) established a new taxon for the methanogens and their relatives, Archaebacteria (literally, archaic bacteria). The name “Archaebacteria” implies that this taxon is evolutionarily at least as ancient as the other group of bacteria, which they renamed Eubacteria (literally, true bacteria). The term urkaryotes (literally, primordial nucleated organisms) was proposed for those ancestors of eukaryotes that existed prior to the endosymbiotic acquisition of mitochondria and chloroplasts from prokaryotes. (This nomenclature gave rise to the Archezoa theory, discussed on page 258.)
As it turned out, Archaebacteria was found to include, in addition to methanogens, many prokaryotes that live in extremely harsh environments (extremophiles), such as the thermophiles and the hyperthermophiles, which live in hot springs at tempera-tures as high as 110°C, and the halophiles, which are highly salt-dependent and grow in such habitats as the Great Salt Lake and the Dead Sea.
What distinguishes Archaebacteria from Eubacteria? Archaebacteria shares a num-ber of features with eukaryotes. For example, the archaebacterial elongation factor EF-2 contains the amino acid diphthamide, the methionyl initiator tRNA is not for-mylated, the aminoacyl stem of the initiator tRNA terminates with the base pair AU, the DNA polymerases are not inhibited by either aphidicolin or butylphenyl-dGTP, and peptide synthesis is inhibited by anisomycin but not by chloramphenicol as in eu-bacteria. Archaebacteria also differ from eubacteria in ribosomal protein composition, membrane lipid synthesis, cell wall constituents, and flagellar composition, as well as the enzymes involved in the synthesis of tetrahydrofolate and tetrahydromethanop-terin (Sousa and Martin 2014).
For taxonomic purposes, archaebacteria are mainly identified by the phospholipids in their membranes (Figure 6.10), which are strik-ingly different from those in eubacteria and eukaryotes. First, their membranes are composed of glycerol-ether phospholipids, whereas eubacteria and eukaryotes have membranes composed mainly of glyc-erol-ester phospholipids. Second, archaebacterial lipids have a glycerol group with a stereochemistry that is the reverse of that found in other organisms. That is, archaebacterial membranes have L-glycerol, while eubacteria and eukaryotes have D-glycerol. (The L-glycerol ethers constitute a convenient synapomorphy for almost all archaebacterial taxa.) Finally, the lipid tails of archaebacterial phospholipids consist of isoprenoid side chains with multiple side branches. In contrast, the fatty acids in the membranes of other organisms have straight chains with almost no branches. The isoprene side chains of archaebacteria can be joined together. That is, either the two side chains of a single phospholipid can join together, or they can be joined to side chains of another phospholipid on the other side of the membrane. No other group of organisms can form such transmembrane phospholipids.
Another interesting property of the side branches is their ability to form carbon rings. This happens when one of the side branches curls around and bonds with another atom down the chain to make a ring of five carbon atoms. Such rings are thought to provide structural
Graur 1e Sinauer AssociatesMorales StudioGraur1e_06.10.ai 10-29-15
CH2
(a)
(b)
O
O
P
O–
O–
Ester link
Unbranched fatty acids
HCC O
H2CEther link
Phosphate
Phosphate
L-glycerol
D-glycerol
Branched isoprenes
C O
CH2
HC
C O
C O
O
OO
O
P
O–
O–H2C
Figure 6.10 The basic chemical structures of membrane phospholipids in eubacteria and eukary-otes (a) and archaebacteria (b).
© 2016 Sinauer Associates, Inc. This material cannot be copied, reproduced, manufactured or disseminated in any form without express written permission from the publisher.
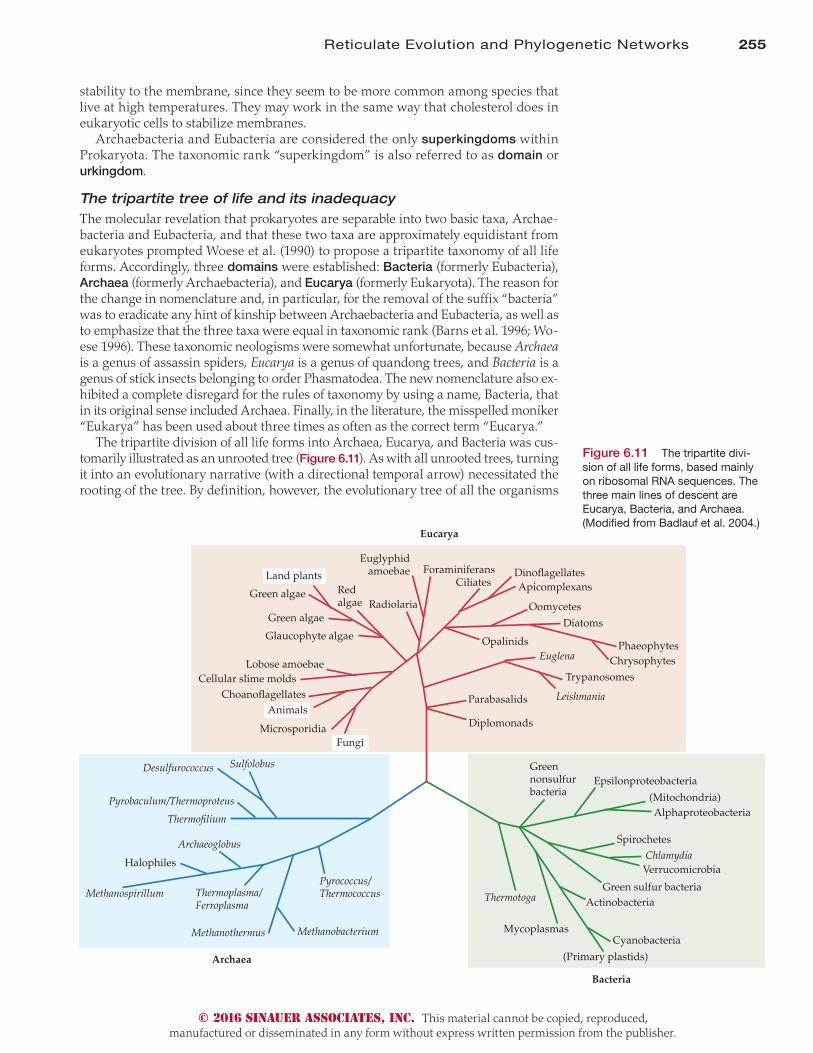
Reticulate Evolution and Phylogenetic Networks 255
stability to the membrane, since they seem to be more common among species that live at high temperatures. They may work in the same way that cholesterol does in eukaryotic cells to stabilize membranes.
Archaebacteria and Eubacteria are considered the only superkingdoms within Prokaryota. The taxonomic rank “superkingdom” is also referred to as domain or urkingdom.
The tripartite tree of life and its inadequacyThe molecular revelation that prokaryotes are separable into two basic taxa, Archae-bacteria and Eubacteria, and that these two taxa are approximately equidistant from eukaryotes prompted Woese et al. (1990) to propose a tripartite taxonomy of all life forms. Accordingly, three domains were established: Bacteria (formerly Eubacteria), Archaea (formerly Archaebacteria), and Eucarya (formerly Eukaryota). The reason for the change in nomenclature and, in particular, for the removal of the suffix “bacteria” was to eradicate any hint of kinship between Archaebacteria and Eubacteria, as well as to emphasize that the three taxa were equal in taxonomic rank (Barns et al. 1996; Wo-ese 1996). These taxonomic neologisms were somewhat unfortunate, because Archaea is a genus of assassin spiders, Eucarya is a genus of quandong trees, and Bacteria is a genus of stick insects belonging to order Phasmatodea. The new nomenclature also ex-hibited a complete disregard for the rules of taxonomy by using a name, Bacteria, that in its original sense included Archaea. Finally, in the literature, the misspelled moniker “Eukarya” has been used about three times as often as the correct term “Eucarya.”
The tripartite division of all life forms into Archaea, Eucarya, and Bacteria was cus-tomarily illustrated as an unrooted tree (Figure 6.11). As with all unrooted trees, turning it into an evolutionary narrative (with a directional temporal arrow) necessitated the rooting of the tree. By definition, however, the evolutionary tree of all the organisms
Graur 1e Sinauer AssociatesMorales StudioGraur1e_06.11.ai 08-24-15 10-20-15
Archaea
SulfolobusDesulfurococcus
Pyrobaculum/Thermoproteus
Thermo�lium
Archaeoglobus
Halophiles
Methanospirillum Thermoplasma/Ferroplasma
Methanothermus Methanobacterium
Pyrococcus/Thermococcus
Eucarya
FungiMicrosporidia
AnimalsChoano�agellates
Cellular slime moldsLobose amoebae
Glaucophyte algae
Green algae
Green algae
Land plantsRed algae Radiolaria
Euglyphidamoebae Foraminiferans
CiliatesDino�agellatesApicomplexans
Oomycetes
Diatoms
PhaeophytesChrysophytes
OpalinidsEuglena
Trypanosomes
LeishmaniaParabasalids
Diplomonads
Bacteria
Green nonsulfur bacteria (Mitochondria)
Alphaproteobacteria
Spirochetes
ChlamydiaVerrucomicrobia
Green sulfur bacteriaActinobacteria
Cyanobacteria
(Primary plastids)
Mycoplasmas
Thermotoga
Epsilonproteobacteria
Figure 6.11 The tripartite divi-sion of all life forms, based mainly on ribosomal RNA sequences. The three main lines of descent are Eucarya, Bacteria, and Archaea. (Modified from Badlauf et al. 2004.)
© 2016 Sinauer Associates, Inc. This material cannot be copied, reproduced, manufactured or disseminated in any form without express written permission from the publisher.

256 Chapter 6
in the world has no outgroup. That is, in the “tree of everything,” all organisms belong to the ingroup. An ingenious method to infer the root of the tree was suggested by Schwartz and Dayhoff (1978) and put into practice by Gogarten et al. (1989) and Iwabe et al. (1989). The idea was to use a pair of paralogous genes that exist in all organisms and must, therefore, be derived from a gene duplica-tion event that occurred before the divergence of the three domains (Figure 6.12). Suppose, for example, that gene A gave rise by gene duplication to genes A1 and A2 before the divergence of the three lineages. Subsequently, as the three organismic lineages diverged, A1 and A2 should also diverge in the same order. Therefore, A2 se-quences may serve as outgroups with which the tree derived from the A1 sequences can be rooted. Similarly, A1 sequences can be used to root the tree derived from A2.
Iwabe et al. (1989) applied this concept to two paralogous elongation factor genes, EF-Tu and EF-G, which are present in all prokaryotes and eukaryotes and must, therefore, have been derived from a duplication event that occurred before the three
domains diverged from one another. Thus, the EF-Tu sequences can be used as out-groups to infer the root of the tree for the EF-G sequences, and vice versa (Figure 6.13). The EF-G subtree indicated that Eucarya (represented by a slime mold and a mammal) is a sister taxon of Archaea (represented by Methanococcus jannaschii) to the exclusion of Bacteria (represented by Micrococcus luteus and Escherichia coli). The EF-Tu sequences yielded the same topology. We note that in reconstructing the phylogenetic trees for duplicate genes, we must ensure that our identification of orthologous genes (genes whose homology is due to a speciation event) is correct. This is not always an easy task, especially with distantly related organisms that may have experienced multiple gene acquisitions, losses, and changes in function.
An interesting solution for this problem was suggested by Lawson et al. (1996). In their study of the carbamoyl phosphate synthetase gene, they took advantage of the fact that the gene contains an ancient internal gene duplication that is found in all three domains of life. The duplicated sequences remained linked to each other in the same orientation within the single-copy gene, and hence the orthology identification became a trivial task. When the internal duplication was used to root a gene tree consisting of eight eukaryotic sequences, seven bacterial sequences, and an archaeal sequence, the eukaryotes were found to cluster with the archaeons. For a while, the phylogenetic question seemed comfortably settled: The living world was composed
Graur 1e Sinauer AssociatesMorales StudioGraur1e_06.13.ai 08-24-15 11-15-15
Bacteria
Eucarya
Archaea
Eucarya
Bacteria
Archaea
EF-Tu
EF-G
Gene duplication
Figure 6.13 Phylogenetic tree inferred from a simultaneous com-parison of the duplicated elonga-tion factor genes EF-Tu and EF-G from Archaea, Bacteria, and Eu-carya. Both subtrees indicate that Archaea and Eucarya are sister taxa in a lineage that excludes Bacteria. (Modified from Iwabe et al. 1989.)
Graur 1e Sinauer AssociatesMorales StudioGraur1e_06.12.ai 11-05-15
Domain 1
Domain 2
Domain 3
Domain 1
Domain 2
Domain 3
Gene A
Gene A1
Gene A2
Figure 6.12 Duplication of gene A (blue square) into A1 (red square) and A2 (green square) prior to the divergence of three domains results in identical topologies for the two subtrees. (Modified from Li 1997.)
© 2016 Sinauer Associates, Inc. This material cannot be copied, reproduced, manufactured or disseminated in any form without express written permission from the publisher.

Reticulate Evolution and Phylogenetic Networks 257
of three domains, with Bacteria diverging first from the common ancestor of Eu-carya and Archaea. Lamentably, this very simple picture—Vita est omnis divisa in partes tres—did not last for long.
The first sign of trouble was the fact that different genes yielded different and conflicting phylogenetic trees. With three monophyletic domains, there are three possible rooted trees (Figure 6.14a–c). Moreover, if any of the three domains turns out not to be monophyletic, the number of possible trees increases. With increas-ingly large genomic databases, the rooting of the “tree of everything” by using molecular data started yielding a very confusing collection of contradictory trees. Each tree in Figure 6.14 has at one time or another been supported by some genes (or some tree-making methodology) and refuted by others. Was the first diver-gence event a fundamental split between eukaryotes and prokaryotes, as in Figure 6.14a? Or did the first divergence event entail a split between the Bacteria and the common ancestor of Eucarya and Archaea, which later diverged from each other (Figure 6.14b)? Moreover, the suggestion has been made that Archaea may not be monophyletic, and that Eucarya may be a sister taxon of Crenarchaeota (eocytes), a phylum of sulfur-dependent archaeons (Figure 6.14d; Rivera and Lake 1992).
Another problem with the tree of life concerned the inability of researchers to increase the number of genes in phylogenetic studies. The largest number of orthologous protein sequences ever used to study prokaryote and eukaryote relationships by means of strict bifurcating trees was 31 (Ciccareli et al. 2006). These 31 orthologous protein sequences from 191 genomes yielded an alignment in which there were only 1,212 gapless sites that could be used in a phylogenetic analysis. Dagan and Martin (2006) noted that the average prokaryotic proteome consists of about 3,000 protein-coding genes, hence the 31-protein tree represents only about 1% of the average prokaryotic proteome and only 0.1% of a large eu-karyotic proteome, such as ours. Thus, although a “tree” was obtained, this tree is not the tree of life, but the “tree of one percent” (Dagan and Martin 2006).
In time, researchers started to think that the conflicting phylogenetic trees ob-tained by using different genes and proteins tell a true evolutionary story, rather than being artifacts of data, methodology, stochastic error, or a combination of these factors. For example, in a maximum likelihood analysis of 605 protein se-quences from Eucarya, Archaea, and Gram-positive and Gram-negative members of Bacteria, Ribeiro and Golding (1998) found 59 trees (10%) significantly sup-porting the Archaea-Eucarya clade, 14 (2%) significantly supporting the Gram-negative–Eucarya clade, and 3 (0.5%) supporting the Gram-positive–Eucarya clade. The vast majority of the protein trees (529, or 87%) either did not provide significant support for any phylogenetic tree or provided statistically weak sup-port for one of the three possible trees. Ribeiro and Golding (1998) also tested the trees that significantly supported the Gram-negative–Eucarya clade and con-cluded that it was unlikely for the statistically significant support to be due to convergent evolution or methodological errors. In more recent studies, 15% of all eukaryote genes were traced to cyanobacteria, 26% to proteobacteria, and 10% to archaebacteria (Pisani et al. 2007), indicating that the eukaryotic genome may have multiple origins.
From the late 1990s, it became increasingly clear that the phylogenetic rela-tionships among the three domains of life may not easily be solvable by models employing strictly bifurcating trees. In other words, the tree of life may be impos-sible to reconstruct, or the tree of life may not be a tree at all.
The Origin of EukaryotesMore than 20 mutually incompatible evolutionary scenarios have been proposed in the literature to account for eukaryote origins (Pisani et al. 2007). These sce-narios can be divided into two broad categories. Scenarios in the first category de-pict the evolution of eukaryotes from a prokaryote as a gradual process, whereby
Graur 1e Sinauer AssociatesMorales StudioGraur1e_06.14.ai 08-24-15
ProkaryotesArchaea
Bacteria
Eucarya
(a)
Archaea
Bacteria
Eucarya(b)
Archaea
Bacteria
Eucarya(c)
“Archaea”
Eucarya
Crenarchaeota
EuryarchaeotaBacteria
(d)
Figure 6.14 Four rooted trees depicting different possible evolution-ary relationships of Archaea, Bacteria, and Eucarya. (a) The prokaryote tree, in which Eucarya is the outgroup. (b) The Archaea-Eucarya tree, in which Bac-teria is the outgroup. (c) The Eucarya-Bacteria tree, in which Archaea is the outgroup. In all three of these trees, Archaea is monophyletic. (d) The eocyte tree, in which Eucarya is nested within a paraphyletic Archaea (paraphyly is in-dicated by the use of quotation marks). Crenarchaeota (eocytes) and Euryar-chaeota are two purportedly monophy-letic subdivisions within Archaea. Each of the four trees is supported by some data sets and contradicted by oth-ers. For example, tree (a) is supported by data from DNA topoisomerase II, citrate synthase, and heat shock protein 70; tree (b) is supported by data from elongation factors Tu/G and ribosomal proteins S18, L15, and L5; tree (c) is supported by data from glyceraldehyde 3-phosphate dehydrogenase and malate dehydrogenase; and tree (d) is support-ed by morphological data pertaining to ribosome structure, as well as by some molecular data sets. (Data from Lake et al. 1984; Saccone et al. 1995; Cox et al. 2008.)
© 2016 Sinauer Associates, Inc. This material cannot be copied, reproduced, manufactured or disseminated in any form without express written permission from the publisher.

258 Chapter 6
the prokaryotic lineage destined to become eukaryotic incrementally grew in size and evolved such traits as a membrane-enclosed nucleus, the endoplasmic reticulum, and phagotrophy (the ability to engulf other cells). Only much later did these primitive eu-karyotes gain mitochondria through endosymbiosis. The second category of scenarios dispenses with the slow, incremental “progress” from a prokaryotic to a eukaryotic state and instead proposes that eukaryotes were “born” through an “encounter” that resulted in the merger of two prokaryotes.
The origin of eukaryotes: The gradual origin hypothesisThe gradual origin hypothesis envisions a slow, gradual process of evolution in which the acquisition of mitochondria occurred after the transition to the eukaryotic state. Adherents of the gradual origin hypothesis consider eukaryotes to be a primary lin-eage of life, and consider the tree of life to be indeed a bifurcating tree (e.g., Ciccarelli et al. 2006).
Let us examine one corollary of the gradual origin hypothesis. If eukaryotes in-deed evolved gradually from a prokaryotic lineage, and if the subsequent evolution of eukaryotes is a run-of-the-mill treelike process, then it is entirely imaginable that descendants of eukaryotic lineages that diverged before the symbiotic event that gave rise to the mitochondria might still exist (Figure 6.15). The eukaryotic lineages that diverged before the establishment of the mitochondria would be represented today by organisms devoid of mitochondria. The lack of mitochondria (the amitochondri-ate condition) is, according to this theory, a plesiomorphy (i.e., an ancestral character state) shared by taxa descended from lineages that diverged at the base of the eukary-ote tree. These taxa form a paraphyletic group called “Archezoa” (where the quotation marks denote the lack of monophyly).
Parasitic protists, such as metamonads (e.g., Giardia and Hexamita), parabasalids (e.g., Trichomonas), archamoebae (e.g., Entamoeba), and microsporids (e.g., Encephalitozoon and Nosema), were thought to be the modern descendants of these ancient amitochondri-ate lineages (Cavalier-Smith 1983, 1989). The mitochondriate clade that diverged into animals, plants, fungi, and the vast majority of protists was called Metakaryota. In other words, the eukaryotes were claimed to have acquired mitochondria as bona fide eukaryotes, i.e., after they had already acquired a membrane-enclosed nucleus.
In time, however, all archezoans were phylogenetically “demoted” from their pre-endosymbiotic status by the findings that each archezoan taxon is nested phy-logenetically within a mitochondriate group. In other words, phylogenetic analyses have shown that the lack of mitochondria was always a derived state—a secondary
Graur 1e Sinauer AssociatesMorales StudioGraur1e_06.15.ai 08-24-15
Animalia
Fungi
Plantae
Dino�agellates
Ciliates
Mitochondria
Mycetozoa
Euglenozoa
Metakaryota
Microsporidia“Archezoa”
Metamonada
Archaea
Sulfobacteria
Halobacteria
Methanobacteria
Gram-positive bacteria
E. coli
Cyanobacteria
Eucarya
Bacteria
Figure 6.15 The phylogeny of eukary-otes according to the Archezoa theory. The symbiotic event that gave rise to the mitochondria occurred only after several lin-eages had diverged from the Metakaryota. These early divergent lineages evolved into the paraphyletic “Archezoa,” represented here by the Microsporidia and Metamonada. In the scheme presented here, eukaryotes are a sister taxon of Archaea, although this relationship is immaterial to the Archezoa theory.
© 2016 Sinauer Associates, Inc. This material cannot be copied, reproduced, manufactured or disseminated in any form without express written permission from the publisher.

Reticulate Evolution and Phylogenetic Networks 259
loss of the organelle from a lineage that once possessed mitochondria (Embley and Hirt 1998; Keeling 1998; Van de Peer 2000; Hampl et al. 2009). Moreover, detailed molecular cell biology and phylogenetic investigations have shown that all so-called amitochondriate eukaryotes examined so far contain a double-membrane-bounded organelle of mitochondrial ancestry, a mitochondrial organelle, and thus are not ami-tochondriate after all (Hjort et al. 2010).
Mitochondrial organelles are functionally and genomically diverse. Müller et al. (2012) classified mitochondria into five functional classes. Classes 1–4 generate ATP; class 5 does not. Class 1 consists of aerobic mitochondria, such as the canonical, rat liver–type mitochondrion that is featured in most biology and biochemistry textbooks. Class 1 mitochondria use oxygen as the terminal electron acceptor. Class 2 consists of anaerobic mitochondria, which use an endogenously produced electron accep-tor, such as nitrate or fumarate, instead of oxygen. As opposed to class 3 and class 4 mitochondria, class 2 do not produce H2. Class 3 consists of hydrogen-producing mitochondria, which, however, possess a proton-pumping electron transport chain as well as a hydrogenase. Class 3 mitochondria can, thus, function aerobically as well as anaerobically as hydrogenosomes—hydrogen-producing organelles. Class 4 mi-tochondria are the hydrogenosomes, i.e., anaerobically functioning ATP-producing mitochondria-derived organelles that can use protons as an electron acceptor, which results in the formation of hydrogen. Class 4 mitochondria do not possess an electron transport chain. Class 5 are the mitosomes, which do not produce ATP. Mitochondria belonging to classes 1, 2, and 3 possess a genome; classes 4 and 5 do not.
Interestingly, despite their functional, morphological, and genomic diversity, all mitochondrial organelles can be traced down to a single endosymbiotic event be-tween two prokaryotes. Subsequent evolution gave rise to the different classes of mitochondrial organelles. Some have retained their own genome and translation sys-tem; in others, the entire genome has been lost. Irrespective of whether they have a genome or not, however, all types of mitochondrial organelles must import most of their proteome from the cytosol. Moreover, in most eukaryotes, a variable number of essential RNAs are also imported. Thus, the import of macromolecules, both proteins and RNAs, is essential for mitochondrial biogenesis.
The common shared characteristics of all classes of mitochondria are a double membrane and several enzymes with proteobacterial similarities. The genomes of those mitochondria that possess genomes have been revealed through phylogenetic analysis to be vestigial and derived from proteobacteria (Chapter 5). As seen in Figure 6.16, each of the classes of mitochondrial organelles may have been derived multiple times independently. More important, however, is the observation that none of the eukaryotic lineages examined so far lacks organelles of mitochondrial origin. The amitochondriate condition does not exist in eukaryotes.
Finally, we note that the nuclear envelope and the nuclear pore complex are made out of proteins of both archaebacterial and eubacterial origins, suggesting that the nucleus arose in a cell that already contained the mitochondrial endosymbiont.
All in all, gradual origin hypotheses have turned out to be untenable and have been almost completely abandoned. For the sake of fairness, however, we should note that some scientists still believe such hypotheses to be capable of explaining the origin of eukaryotes (e.g., Cavalier-Smith 2009; Forterre and Prangishvili 2013).
The origin of eukaryotes: The fateful encounter hypothesisThe alternatives to the gradual origin hypothesis are scenarios that invoke a phyloge-netic merger—some say a “freakish” merger—between two prokaryotes. According to these scenarios, collectively referred to as the sudden origin or fateful encounter hypothesis, the eukaryotic cell is a chimera, and all eukaryotes (including you, ewe, and yew) owe their existence to a fusion between two organisms that occurred more than 2 billion years ago (de Duve 2005; Lane 2009; Yong 2014). In other words, the rise of eukaryotes is assumed to be fundamentally different from the gradual evolutionary transition that gave rise to multicellularity, photosynthesis, terrestriality, and myriad
© 2016 Sinauer Associates, Inc. This material cannot be copied, reproduced, manufactured or disseminated in any form without express written permission from the publisher.

260 Chapter 6
other evolutionary novelties. This merger, as far as we know, was a “fluke event of incredible improbability” that only happened once (Yong 2014).
The earliest version of this type of hypothesis was put forward by Martin and Müller (1998), who pointed out that it is very common in nature for eubacteria and archaebacteria to develop a mutually beneficial metabolic association called mutual syntrophy, in which one species in a pair lives from the waste products of the other species and vice versa. Mutual syntrophy is known in nature to lead at times to symbiotic associations. A good example of this type of association is the large plas-mid that is passed around among members of a group of marine prokaryotes called Roseobacter. The plasmid encodes photosynthetic reaction centers and chlorophyll
Graur 1e Sinauer AssociatesMorales StudioGraur1e_06.16.ai 08-24-15 11-05-15
Fasciola hepatica
Arenicola marina
Sipunculus nudus
Mytilus edulis
Ascaris lumbricoides
Spinoloricus sp.
Fusarium oxysporum
Piromyces sp.
Encephalitozoon cuniculi
Entamoeba histolytica
Mastigamoeba balamuthi
Giardia lamblia
Trichomonas vaginalis
Tritrichomonas foetus
Euglena gracilis
Trypanosoma brucei
Cryptosporidium parvum
Nyctotherus ovalis
Loxodes sp.
Blastocystis hominis
Valvulineria bradyana
Gromia sp.
Chlamydomonas reinhardtii
Platyhelminthes
Polychaeta
Sipuncula
Bivalvia
Nematoda
Loricifera
Ascomycota
Chytridiomyceta
Microsporidia
Foraminifera
Gromiida
Chlorophyta
Archamoebae
Diplomonadida
Parabasalia
Euglenida
Kinotoplastida
Apicomplexa
Ciliophora
Heterokonta
Class 1: Aerobic mitochondria
Class 2: Anaerobically functioning mitochondria
Class 3: Hydrogen-producing mitochondria
Schematic phylogeny Example species Organelle Group Supergroup
Opisthokonta
Amoebozoa
Excavata
Chromalveoloates
Rhizaria
Arachaeplastida
Class 4: Hydrogenosomes
Class 5: Mitosomes
Figure 6.16 Phylogenetic distribution of organelles of mitochondrial origin. The distri-bution is plotted across a sche-matic phylogeny for six clades of eukaryotes. The mitochon-drion class for each example species is indicated by an icon. The presence of a genome is indicated by a blue circle inside the icon. Sizes of mitochondrial types are not drawn to scale. Note the absence of lineages lacking organelles of mitochon-drial origin among eukaryotes. (Modified from Müller et al. 2012.)
© 2016 Sinauer Associates, Inc. This material cannot be copied, reproduced, manufactured or disseminated in any form without express written permission from the publisher.

Reticulate Evolution and Phylogenetic Networks 261
synthesis—everything needed to make its recipient instantaneously photosynthetic (Petersen et al. 2012).
Based on the biochemistry of mitochondria and hydrogenosomes, Martin and Müller (1998) sketched out a scenario for how a merger of two cells may have given rise to eukaryotes. According to this scenario, called the hydrogen hypothesis, the merger involved, on the one hand, a methanogenic (methane-producing) archae-bacterium that had the capability of deriving energy from the bonding of hydrogen (H2) and carbon dioxide (CO2) and, on the other, a eubacterium that fed on organic compounds and produced H2 and CO2, which the archaebacterium could use.
Over time, the two organisms involved in the mutual syntrophy that gave rise to eukaryotes became inseparable, i.e., the archaebacteria engulfed the eubacterium; then the archaebacterial component evolved the ability to provide organic compounds to the endosymbiont, which eventually became an organelle—the mitochondrion.
In addition to the hydrogen hypothesis, there are many other variants of the fateful encounter hypothesis, which differ in the reasons for the merger and the exact identi-ties of the archaebacterium and the eubacterium that were involved in the encounter (Searcy 1986; Vellai et al. 1998; Davidov and Jurkevitch 2009). Notwithstanding the differences among the scenarios, all fateful encounter hypotheses are united by one critical feature setting them apart from the gradual origin ideas: they all maintain that the host cell was a bona fide prokaryote. This host prokaryote had not started to grow in size, it did not yet have a nucleus, and it had not embarked on an evolutionary journey on the path of becoming a eukaryote. According to the sudden origin ideas, mitochondria were not merely one of many innovations in the evolution of eukary-otes. The acquisition of mitochondria was the origin of eukaryotes; they were one and the same event—eukaryotic inventions came later. The acquisition of mitochondria by a prokaryote was the sine qua non that turned the prokaryote into a eukaryote. Accordingly, all living eukaryotic lineages descended from a common ancestor that had mitochondria (Hampl et al. 2008). Most important in the phylogenetic context is that if eukaryotes are indeed a chimeric lineage, then the tree of life is not a tree, but a network containing a merger of two independent lineages.
Let us now review the evidence pertaining to the fateful encounter hypothesis. Rivera and Lake (2004) used the method of conditioned reconstruction to elucidate the phylogenetic relationships among eukaryotes, eubacteria, and two archaebacte-rial phyla (Figure 6.17). Five unrooted trees with a cumulative posterior probability of 96.3% were found. These trees matched a repeated pattern and could be curled into a ring. In fact, a combinatorial analysis of the genomic fusion of two organisms valid for all possible prefusion trees has shown that the conditioned reconstruction algorithm recovers all permutations of the cycle graph, and only those permutations.
In the next stage of the analysis, Rivera and Lake (2004) set out to identify the “fu-sion organism.” In a tree, each leaf (external node) contacts only one other node in the tree, so eliminating one taxon from the analysis does not otherwise change the tree. Similarly, in a conditioned reconstruction, eliminating a nonfusion organism from the analysis will delete that one leaf from the ring, without affecting the ring. However, eliminating a fusion organism, which by definition contacts two nodes of a ring, will delete the leaf, open the ring, and convert the ring into a tree. When the taxa in Figure 6.17 were systematically removed, the ring opened only when both yeast genomes were simultaneously removed, indicating that the eukaryotic genome is a product of genome fusion between two prokaryotes. Furthermore, the conditioned reconstruction analysis of 24 prokaryotic genomes in the absence of any eukaryotic genomes resulted only in trees with no rings. These results support the conclusion that eukaryotes are the chimerical products of a genome fusion event between two prokaryotes.
By using 5,741 single-gene families distributed across 185 genomes, Pisani et al. (2007) corroborated the chimerical origin of eukaryotic genomes and the derivation of nuclear genes from three main sources: cyanobacteria, proteobacteria, and archae-bacteria. These three distinct symbiotic partners gave rise, respectively, to plastids,
© 2016 Sinauer Associates, Inc. This material cannot be copied, reproduced, manufactured or disseminated in any form without express written permission from the publisher.

262 Chapter 6
mitochondria, and the nucleus. A schematic depiction of the phylogenetic relation-ships among eubacteria, archaebacteria, and eukaryotes is shown in Figure 6.18.
Eukaryotes as an “organizational upgrade”The origin of the eukaryotic cell is one of the hardest and most interesting puzzles in evolutionary biology (Lake 2007). Any theory attempting to describe the evolution of eukaryotes must be able to explain the following seven eukaryotic characteristics: (1) The eukaryotic cell is considerably more complex than the prokaryotic cell, pos-sessing, among others, a nucleus with a contiguous endoplasmic reticulum, Golgi bodies, flagella with a 9+2 pattern of microtubule arrangement, and organelles sur-rounded by double membranes. (2) Only eukaryotes have achieved great size and morphological complexity, whereas prokaryotes have remained small and have not evolved either morphological complexity or multicellularity. (3) The protein-coding genes of eukaryotes are interspersed with introns that need to be removed prior to translation by spliceosomes. (4) The process of transcription is physically and tem-porally separated from the process of translation. (5) The eukaryote genome consists of components that are archaebacterial and components that are eubacterial. (6) The distribution of the archaebacterial and eubacterial genomic components is not ran-dom with respect to function. (7) There are no known precursor structures among prokaryotes from which such attributes could be derived, and no intermediate cell types are known that would point to a gradual evolutionary change of a prokary-ote into a eukaryote. For all intents and purposes, the eukaryotic cell represents a sudden “organizational upgrade” or “evolutionary leap.” Moreover, any theory on eukaryote evolution must provide a reason why the time it took for prokaryotes to evolve out of inanimate matter is so much shorter than the time it took eukaryotes to evolve out of prokaryotes.
Admittedly, we do not have clear-cut answers to all these conundrums. Testable theories have been suggested, however, and in the following sections, we will deal with several hypotheses that address one or a few of these puzzles.
Graur 1e Sinauer AssociatesMorales StudioGraur1e_06.17.ai 08-24-15 10-21-15
E
E
H M
M
B
B
Pγ
Pγ
PγY1 Y2
Y1 Y2
E H
H
M B
61% (I)
77% (I+II)
87% (I+II+III)
95% (I+II+III+IV)
96% (I+II+III+IV+V)
Five mostprobableunrooted trees
Fullyresolvedring
Cumulativebootstrap values
I
II
III
IV
V
Figure 6.17 Conditioned recon-structions provide evidence for the ring of life. The genomes are from two eukaryotes (Schizosaccharo-myces pombe and Saccharomyces cerevisiae, denoted by Y1 and Y2, respectively); an α-proteobacterium (Xylella fastidiosa, denoted by Pγ ); a bacillus (Staphylococcus aureus, denoted by B); and three archae-bacteria, two belonging to phylum Euryarchaeota (Halobacterium sp. and Methanosarcina mazei, denoted by H and M, respectively) and one belonging to phylum Crenarchaeota (the eocyte Sulfolobus tokodaii, denoted by E). A euryarchaeote (Archaeoglobus fulgidus) was used as the conditioning genome. The analyses are based on 2,408 orthologous gene sets. Of these, 433, 239, 285, 292, 329, 293, 204, and 333 sets contained seven, six, five, four, three, two, one, and no or-thologs, respectively. The five most probable unrooted trees (I−V) are shown with leaves pointing upward to emphasize that each is part of a repeating pattern. Cumulative bootstrap scores are shown at the right of each tree. For example, the bootstrap for tree I is 61%, while the cumulative bootstrap value for trees I, II, and III is 87%. Adding ad-ditional trees does not significantly improve the cumulative bootstrap values. A fully resolved ring of taxa is shown. (Modified from Rivera and Lake 2004.)
© 2016 Sinauer Associates, Inc. This material cannot be copied, reproduced, manufactured or disseminated in any form without express written permission from the publisher.

Reticulate Evolution and Phylogenetic Networks 263
The nonrandom origin of operational and informational genes in eukaryotesThe origin of the vast majority of eukaryotic genes can be traced to either eubacterial or archaebacterial genes. For example, more than two-thirds of the nuclear genes of the yeast Saccharomyces cerevisiae are derived from eubacteria, with the balance from archaebacteria. Intriguingly, the distribution of the archaebacterial and eubacterial genes in the eukaryotic genome is not random with respect to function.
Productive genes (i.e., protein-coding and RNA-specifying genes) can be rough-ly divided into two major gene classes: operational and informational. Operational
Graur 1e Sinauer AssociatesMorales StudioGraur1e_06.18.ai 08-24-15 10-20-15
Eubacteria
Archaebacteria
M
P
MethanogensProteobacteria
Cyanobacteria
Prokaryotes
Eukaryotes
“Protista”
Fungi
AnimalsEuglenophyta
Chlorarachniophyta
Red algaeDino�agellates
Cryptomonads
Land plants
Figure 6.18 Schematic phyloge-netic network depicting the evolution of eukaryotes through endosymbiotic events. There are two primary symbiot-ic events: M (for mitochondria) denotes the endosymbiosis of a proteobacte-rium into an archaebacterium that gave rise to eukaryotic cells. P (for plastids) denotes the endosymbiosis of a cya-nobacterium into a eukaryote that gave rise to the lineage leading to kingdom Plantae. The two primary domains of life are Eubacteria and Archaebacteria, and the root of the network of life is located between the two primary do-mains. Eukaryotic lineages are marked by circles. Lineages that resulted from primary symbioses are denoted by open circles. Lineages that resulted from secondary and higher-order sym-bioses are denoted by solid circles. (Modified from Kowallik 2008.)
© 2016 Sinauer Associates, Inc. This material cannot be copied, reproduced, manufactured or disseminated in any form without express written permission from the publisher.

264 Chapter 6
genes are involved mainly in day-to-day processes of cell maintenance and encode, in addition to enzymes and structural proteins, the components of the machinery for amino acid and nucleotide biosynthesis. Informational genes, on the other hand, function primarily in DNA replication, transcription, protein synthesis, and other processes involved in the conversion of information from DNA into proteins. Because eukaryotes originated from a fusion of a eubacterium and an archaebacterium, one might expect that the first eukaryote contained two sets of informational genes and two sets of operational genes. Assuming that the subsequent processes of gene dupli-cation and loss were random, one would expect to find nuclear genes from both op-erational and informational classes to be derived randomly from either archaebacte-rial or eubacterial ancestral genes. Strangely, however, almost all informational genes in eukaryotes seem to be of archaebacterial origin, while the majority of operational genes are of eubacterial origin.
What can account for such a distribution? The solution seems to be related to the complexity hypothesis (p. 248). Accordingly, each informational gene in an organism has coevolved to function effectively with the other informational genes in the same organism and cannot easily be transferred from species to species. Thus, two sets of informational genes cannot coexist in the same cell. Indeed, attempts to fuse a cyano-bacterial genome into the genome of a host Bacillus subtilis were successful only when the cyanobacterial ribosomal RNA operons were removed from the fused chromo-some (Itaya et al. 2005). We also know that, consistent with the complex interactions within the ribosome, even a single damaged ribosomal subunit can radically affect protein synthesis (e.g., Prescott and Dahlberg 1990).
The fact that only one set of informational genes can exist within a genome sug-gests at least two possible explanations for why the eubacterial informational genes disappeared from the eukaryote genome. One explanation may be that the archae-bacterial informational genes are “better” in some sense than the eubacterial ones. One such advantage may be related to the fact that the archaebacterium involved in the fateful encounter was the host, which supplied such informational cytoplasmic components as the ribosomes and the transcription factors, while the eubacterium was the endosymbiont. Alternatively, the archaebacterial informational genes may have been luckier. For example, if a chance mutation inactivated an informational gene of eubacterial origin, then it was probably only a matter of time before all eubac-terial informational genes interacting with this gene were eliminated, thus initiating a cascade resulting in the elimination of all such informational proteins.
Why are operational genes of archaebacterial origin almost completely absent from the eukaryotic genome? Valentine (2007) suggested that the evolution of archaebacte-ria is the story of adaptation to energy stresses. Thus, archaebacteria can outcompete eubacteria in ecological niches where chronic energy stress is a dominant feature. In contrast, many eubacteria are adapted to niches in which energy sources are abun-dant. The lipid membranes illustrate the differences between the two energy adapta-tions (Figure 6.10). The archaebacterial membranes, composed of isoprenoid glycerol-ether lipids, form structures that are less permeable to ions, thereby decreasing the amount of energy lost during maintenance of a chemiosmotic potential. Unfortu-nately, this low permeability, which is important during energy stress, reduces the efficiency of respiration and signal transduction, which is important in eukaryotes. As the protomitochondrion became the “powerhouse” of the eukaryotic cell, adapta-tions to chronic energy stress became irrelevant (Davidov and Jurkevitch 2007). This evolutionary scenario provides a reasonable explanation not only for the lack of ar-chaebacterial operational genes in eukaryotes, but also for the fact that the eukaryotic membranes, including the cytoplasmic membrane, are eubacteria-like, despite the fact that the host cell was an archaebacterium (Davidov and Jurkevitch 2009).
Why genes in pieces? The origin of the nuclear membraneThe main defining characteristic of a eukaryote, which is the existence of a nuclear envelope separating the nucleus from the cytosol, raises the question of why there
© 2016 Sinauer Associates, Inc. This material cannot be copied, reproduced, manufactured or disseminated in any form without express written permission from the publisher.

Reticulate Evolution and Phylogenetic Networks 265
should be a need for such compartmentalization. Another characteristic of eukary-otes is the existence of “genes in pieces,” in which the coding regions are interrupted by introns that need to be spliced out prior to translation. Martin and Koonin (2006) formulated a hypothesis according to which the separation between transcription and posttranscriptional modifications, on the one hand, and translation, on the other, was needed to deal with the very different kinetic properties of intron splicing and protein synthesis on the ribosome.
According to this hypothesis, the origin of eukaryotes was a prokaryote host that, by definition, lacked a nucleus and acquired another prokaryote that eventually be-came the mitochondrion. Scientists currently agree that the anucleated host was an archaebacterium and the engulfed prokaryote that evolved into the mitochondrion was a proteobacterium. In the past, a common criticism facing “archaebacterial host” models has been that phagotrophy (the engulfment of particulate matter, especially food) is unknown in prokaryotes. According to this argument, prokaryotes can only external materials through osmotrophy (the taking in of dissolved nutrients and other molecules from the medium). This argument has lost some of its strength with the discovery of many endosymbioses in which one prokaryote was found to live inside another (non-phagotrophic) prokaryote (Wujec 1979; von Dohlen et al. 2001; Thao et al. 2002).
Let us start the description of the evolution of the eukaryotic cell at the stage in which the proteobacterial ancestor of mitochondrial organelles is engulfed inside an archaebacterial host with one or more cytosolic chromosomes. The first thing that must happen is that the rates of cell division in the host and symbiont become coor-dinated. Only progeny with synchronized division rates will persist as a consortium of two genomes. If the host archaebacterium lyses, the symbionts are set free, ending the association. However, if a symbiont lyses, a genome’s worth of eubacterial DNA is left in the cytosol of the host, free to recombine. As long as there is more than one symbiont per progeny, symbiont lysis can occur repeatedly, resulting in a constant flow of symbiont DNA into the host’s chromosomes.
We now know that eukaryotic introns, as well as their cognate spliceosomal small nuclear RNAs (snRNAs), originated from self-splicing group II introns (Cech 1986; Cavalier-Smith 1991). These introns, which behave as mobile elements and are cur-rently found among free-living proteobacteria, are thought to have invaded the in-tronless archaebacterial genome, which in time became the eukaryotic nuclear ge-nome. Given the antiquity and conservation of many eukaryotic intron positions, it is reasonable to assume that many spliceosomal introns are directly derived from group II introns in the proteobacteria that later became the mitochondrion.
Spreading of group II introns, which are essentially mobile elements, within the chromosomes of the archaebacterial host would presumably pose a hazard to the sur-vival of the early eukaryote. These mobile introns had to be spliced out before transla-tion, to prevent production of frameshifted proteins containing translated noncoding regions, which in all likelihood would be defective. We note, however, that translation is a fast process, on the order of 10 amino acids per second in prokaryotes, whereas splicing is slow, in the range of 0.005–0.01 intron per second. The slow splicing of introns would have made it difficult for them to function in a prokaryote, because the coexistence of DNA and functional ribosomes in the same cell compartment would allow ribosomes to translate unspliced pre-mRNA sequences.
There are three routes for solving the problem of possessing spliceosome-depen-dent introns in cotranscriptionally translated mRNA. The first solution would be the invention of an extremely fast and efficient spliceosome capable of outrunning the ribosomes. This would entail an unrealistic splicing efficiency in the ancestral spliceo-some exceeding that of the modern one. The second solution would be the removal of all introns from the genome. This has not occurred. The third solution would be the invention of a means to physically separate splicing from translation, allowing the former (slow) process to go to completion first, before the latter (fast) process sets in. Physical separation in cells usually entails membranes, so the third solution would involve the invention of a membrane separating splicing from translation, with pores
© 2016 Sinauer Associates, Inc. This material cannot be copied, reproduced, manufactured or disseminated in any form without express written permission from the publisher.

266 Chapter 6
sufficiently large and selective enough to export matured ribosomal subunits, mRNA, and tRNA. The fact that the nuclear membrane consists of proteins of both eubacte-rial and archaebacterial origin indicates that this was indeed the route pursued by the evolutionary process immediately after the establishment of the endosymbiosis that gave rise to the eukaryote cell. Thus, the incipient function of the nuclear envelope was to allow translation only from postsplicing mRNAs with intact reading frames (Martin and Koonin 2006).
A related problem with having a second genome in such close quarters would be the transfer of mobile elements from the endosymbiont to the host genome. As mo-bile elements bombard a genome, they can disrupt the proper working of its genes. The selective pressure that forged nucleus-cytosol compartmentalization is assumed to have been the rapid spread of type II introns and other mobile elements following the endosymbiotic event. Thus, the nucleus may have evolved as a defense against mobile element attack. We also note that group II introns and other retrotranspos-able elements reproduce through RNA-mediated transposition. With the invention of a nucleus, RNA molecules were moved across a barrier outside the nucleus. This barrier reduced the chances of reinsertion of mobile elements back into the DNA ge-nome. Interestingly, according to this view, the nucleus was not important; what was important was a DNA-free cytosol, a dedicated translation compartment that was free of transcriptionally active DNA.
A problem of a much more severe nature arises, however, with the mutational de-cay of the self-splicing group II introns, resulting in the inactivation of the maturase and the RNA elements that facilitate splicing. Modern examples from prokaryotes and organelles suggest that splicing with the help of maturase and RNA elements pro-vided by intact group II introns in trans could have initially rescued gene expression at such loci, although maturase action in trans is much less effective than in cis. Thus, the mutational decay in the invading introns would create the necessity for a new splicing machinery. We do not currently know how the transition from self-splicing to spliceo-some-dependent splicing occurred, as there are no evolutionary grades detectable in the origin of the spliceosome, which apparently was present in its fully fledged state in the common ancestor of all eukaryotic lineages. We note that, in all likelihood, prokaryotes have never possessed spliceosomal introns, so spliceosomes must have originated in eukaryotic cells. Spliceosomes and spliceosomal introns are universal among eukaryotes, although a few lineages, such as microsporidia, have lost them secondarily. Thus, eukaryotic introns must be as old as the eukaryotes themselves, which would suggest that spliceosomal intron origin and spread occurred within a narrow window of evolutionary time: subsequent to the origin of the mitochondrion, but before the diversification of the major eukaryotic lineages.
All complex life is eukaryotic: The energetics of gene expressionThroughout their evolution, prokaryotes have been extraordinarily inventive in terms of their biochemistry and have utilized practically every energy source our planet has to offer. In fact, among microbiologists, a rule of thumb has been that if a chemical reaction yields sufficient energy to support life, a prokaryote that exploits this source must surely exist. However, when judged by their morphological, organismal, and cel-lular complexity, prokaryotes seem to have advanced little beyond their 4-billion-year-old ancestors. At most, prokaryotes attained a rudimentary level of morphological and behavioral melioration. For example, cyanobacteria and planctomycetes have evolved internal membranes, myxobacteria have evolved a simple form of social multicellular-ity, and some eubacteria, such as Epulopiscium fishelsoni and Thiomargarita namibien-sis, have attained cell sizes exceeding those of many single-celled eukaryotes. Not-withstanding these sporadic prokaryotic innovations, as a rule, all complex life in the world is eukaryotic. Moreover, complex forms of organization such as multicellularity, sex, and phagocytosis have evolved independently multiple times in eukaryotes.
Enigmatically, almost every “defining” characteristic of eukaryotes is also found in prokaryotes, including nucleus-like structures, recombination, linear chromosomes,
© 2016 Sinauer Associates, Inc. This material cannot be copied, reproduced, manufactured or disseminated in any form without express written permission from the publisher.
Reticulate Evolution and Phylogenetic Networks 267
internal membranes, multiple replicons, giant cell size, polyploidy, dynamic cytoskel-etons, predation, parasitism, introns, intercellular signaling, endocytosis-like pro-cesses, and endosymbiosis. It seems as though the prokaryotes made repeated starts up the ladder of complexity, but always fell short. By contrast eukaryotes, despite their meager metabolic repertoire, burst whatever constraints hampered prokaryotes and experimented with the opportunities afforded by greater cell size and more elaborate organization. Why?
The answer, according to Lane and Martin (2010), resides in the bioenerget-ic changes brought about by the evolution of the mitochondria by endosymbiosis. Broadly speaking, chemical energy in the form of adenosine triphosphate (ATP) is coupled to the transfer of protons (H+ ions) across a membrane. In prokaryotes, ATP synthesis scales with the surface area of the only available membrane, the plasma membrane. In contrast, protein synthesis scales with cell volume. Consider, for sim-plicity, a prokaryote that is approximately spherical. If the prokaryote has a typical radius of 1 µm, i.e., one-millionth of a meter, then the ratio of the surface area to the volume is 3 µm−1. If the prokaryotic cell were to have a typical protozoan radius of 50 µm, then the surface-area-to-volume ratio would be 0.06 µm−1, a 50-fold decrease. Thus, larger prokaryotic cells are energetically less efficient than smaller ones.
In eukaryotes, energy production is achieved by hundreds and even thousands of mitochondria, all descended from a singular endosymbiotic event that occurred ap-proximately 1.5 billion years ago. These mitochondria possess highly wrinkled inner membranes that greatly increase the total surface area available for energy-producing oxidative phosphorylation, while at the same time freeing the plasma membrane for other tasks.
Lane and Martin (2010) looked at the amount of power, defined as the amount of energy consumed per unit time, that is available to the cell. In prokaryotes, the power available to the cell is on the order of 0.5 picowatt (pW), or one trillionth (10−12) of a Watt. In comparison, the amount of power available to a eukaryotic cell is on aver-age 2,300 pW, which is approximately 5,000 times more power that that available to a prokaryote.
How does the cell use this energy? The energy cost of DNA replication accounts for a mere 2% of the energy budget of microbial cells during growth. In contrast, protein synthesis accounts for ∼75% of the total energy budget. Thus, in dealing with cell en-ergetics, we need to mainly consider gene expression and may, as an approximation, ignore everything else.
Let us now look at the “available power per gene,” which was defined as the mean energy available in a cell for expressing one gene per unit time. A prokaryotic gene has on average 0.03 femtowatt (fW) of metabolic power, or one quadrillionth (10−15) of a Watt. In contrast, a eukaryote has on average 57 fW available power per gene, i.e., about 2,000 times more than a prokaryote. Thus, the most important difference be-tween prokaryotes and eukaryotes is the amount of energy available per gene. We note that the energy allocation per gene is greater in eukaryotes than in prokaryotes, de-spite the fact that eukaryotes have on average 4–6 times more genes than prokaryotes.
What does increased cell complexity entail? The main factors that underlie cell complexity are gene number and, to a lesser extent, genome size. Can a prokaryotic cell increase its genome size and gene number? If the genome size of a prokary-otic cell is increased tenfold, the cost of replicating the genome itself will account for about 20% of its energy budget, which under certain conditions may be sustainable. However, if the number of genes is increased tenfold, a huge energy crisis may en-sue, whereby the prokaryote will need to drastically reduce the amount of energy it devotes to the synthesis of each of its proteins. The energy allocation per gene may, thus, reach very low levels, maybe too low for viability.
Can the energy supply be increased in prokaryotes? To do that, a prokaryote would need to grow in size, but as mentioned previously, the increase in plasma membrane surface would be insufficient to offset the greater demand for protein synthesis due to increased cell volume.
© 2016 Sinauer Associates, Inc. This material cannot be copied, reproduced, manufactured or disseminated in any form without express written permission from the publisher.

268 Chapter 6
Mitochondria bestowed upon eukaryotes abundant energy to expand their ge-nomes by orders of magnitude and to greatly increase their genomic repertoire. Ge-nome size in eukaryotes is on average 500 times larger than the mean DNA content in prokaryotic cells, and some 3,000 new protein families are thought to have originated during the prokaryote-to-eukaryote transition. Moreover, the abundant energy pro-duced by the mitochondria allowed eukaryotes to be “wasteful.” Eukaryotic genomes harbor approximately 12 genes per Mb, compared with about 1,000 in prokaryotes. If the average prokaryote had a eukaryotic gene density, it would encode fewer than 100 genes. Prokaryotes must therefore maintain high gene density, around 500–1,000 genes per Mb. They do so by eliminating intergenic and intragenic material (includ-ing regulatory elements and microRNAs), by organizing genes into operons, and by restricting the median length of proteins—all of which reduce their energetic costs.
The evolutionary leap from prokaryotes to eukaryotes required orders of magni-tude more energy than any prokaryote can provide. For more than 3 billion years pro-karyotes have remained simple because of energy constraints. Throughout prokaryote evolution, natural selection has favored small and spare cells with streamlined ge-nomes, rapid reproduction, little superfluous DNA, and tightly disciplined regulation of gene expression. Marching under the banner “Small Is Beautiful,” prokaryotes have flourished, multiplied, and in a sense inherited the Earth. From any point of view except that of a eukaryote chauvinist, we live in a prokaryotic world (Harold 2011).
The eukaryotic cell as a one-off innovation and a possible solution to the Fermi paradoxThe fossil record does not tell us much about the origin of eukaryotes. Paleontolo-gists have found fossils of prokaryotes dating back 3.5 billion years (Altermann and Kazmierczak 2003). The earliest fossils that have been shown almost certainly to be eukaryotes are approximately 1.7–1.8 billion years old (Rasmussen et al. 2008). Thus, the evolution of life from inanimate matter (abiogenesis) took considerably less time than the evolution of eukaryotes from prokaryotes. Tellingly, no transitional forms from the intervening years have ever been discovered.
The kind of cell merger and subsequent developments that gave rise to the mito-chondria are extremely improbable. Indeed, prokaryotes have managed to produce eukaryotes only once in more than 3 billion years, despite prokaryotes’ contact with one another all the time. Gradual evolution, on the other hand, is a common occur-rence. Why, then, do we believe a less likely scenario over a more likely one? The reason is that the more likely scenario has been empirically refuted, and in the spirit of Sherlock Holmes, we are compelled to hypothesize the “improbable”—a “fateful encounter”—when the only other viable option—the gradual origin of eukaryotes from prokaryotes—has been deemed “impossible.”
Interestingly, the improbability of evolving complexity has implications for the search for intelligent alien life. Lane (2010) reasoned that life is certain to emerge on other worlds, as long as the right chemical conditions for life are met. However, with-out a “fateful merger,” such life would forever be simple and microbial.
In the early 1950s, Enrico Fermi noticed a puzzling contradiction between what was thought at the time to be a very high probability that intelligent life exists some-where among the billions of planets in the Milky Way and our inability to find any signs of such intelligence—a contradiction that has since become known as the Fermi paradox (Jones 1985). The Fermi paradox stemmed from the Drake equation (1962), which is a product of several probabilities used to arrive at an estimate of the number of civilizations in the Milky Way that are capable of interstellar communication. Ac-cording to the Drake equation, this number, N, was equal to the mathematical product of (1) the average rate of star formation in the galaxy, (2) the fraction of stars that have planets, (3) the average number of planets that can potentially support life per star, (4) the fraction of those planets that actually develop life, (5) the fraction of planets bearing life in which intelligence has developed, (6) the fraction of these civiliza-tions that have developed communication technologies that emit detectable signs into
© 2016 Sinauer Associates, Inc. This material cannot be copied, reproduced, manufactured or disseminated in any form without express written permission from the publisher.

Reticulate Evolution and Phylogenetic Networks 269
space, and (7) the length of time over which such civilizations release detectable sig-nals. According to Drake’s (1962) calculations, N ranges from 20 to 50,000,000, which prompted Fermi to puzzle on our inability to encounter intelligent extraterrestrials.
In the original calculations by Drake and his disciples, it was assumed that, from among those planets that can potentially support life, the fraction of planets on which life actually develops is 100%; in other words, life emerges whenever conditions for the emergence of life exist. It was further assumed that the fraction of planets on which intelligence has evolved is equal to the fraction of planets on which life has emerged. Lane (2010) thinks that it is quite likely the first assumption holds, i.e., that extraterrestrial life exists. The second assumption, on the other hand, is a gross over-estimation. “The unavoidable conclusion,” Lane writes, “is that the universe should be full of bacteria, but more complex life should be rare. And if intelligent aliens do exist, they would probably have something like mitochondria, too.”
Archaebacterial Systematics: Clade-Specific Archaebacterial Genes and Clade-Specific Horizontal Gene Imports from EubacteriaThe leading molecular taxonomy database (Federhen 2012) recognizes twelve archae-bacterial subdivisions (phyla), of which Crenarchaeota (or Eocyta) and Euryarchaeo-ta are better characterized than the others. Crenarchaeota consists of a single class (Thermoprotei) and five orders, of which Thermoproteales, Desulfurococcales, and Sulfolobales are largely accepted as monophyletic. Euryarchaeota consists of eight classes and thirteen orders, of which nine orders—Haloarchaea, Methanosarcina-les, Methanocellales, Methanomicrobiales, Archaeoglobales, Thermoplasmatales, Methanococcales, Methanobacteriales, and Thermococcales—have been shown to be monophyletic. In addition to the above taxa, numerous unclassified, unnamed, and unassigned taxa are listed in the database. Moreover, by using metagenomics, which involves sequencing bulk DNA from the environment and assembling more or less complete genomes from such data, numerous new archaebacterial taxa continue to be discovered, resulting in a taxonomy that is in a state of constant flux (Rinke et al. 2013; Raymann et al. 2015; Spang et al. 2015).
The archaebacterial orders were identified by using ribosomal RNA, as well as 30–40 informational protein-coding genes that are found in almost all genomes so far studied. Of course, as mentioned previously, these genes comprise only about 1% of the average prokaryotic genome, so although such trees yield useful taxonomic information, they provide little insight into the remaining 99% of the genome. In particular, such phylogenies do not predict gene content, nor do they reveal the gene innovations underlying the origin of major clades.
Nelson-Sathi et al. (2015) investigated the phylogenetic distribution of 25,762 protein-coding gene families among 134 sequenced archaebacterial genomes and searched for homologs in 1,847 completely sequenced eubacterial genomes. Archae-bacterial-specific gene families (i.e., families not found in eubacteria) were found to define 12 traditionally recognized archaebacterial orders: Haloarchaea, Methanosar-cinales, Methanocellales, Methanomicrobiales, Archaeoglobales, Thermoplasmatales, Methanococcales, Methanobacteriales, Thermococcales, Sulfolobales, Desulfurococ-cales, and Thermoproteales (Figure 6.19). That is, genes that had no homologs in eubacteria were found to be clade-specific, i.e., to be part of genomes belonging to a single archaebacterial clade and no other. More surprising, however, was the finding that each of these 12 clades had acquired genes from eubacteria, and that 2,264 of these genes occur specifically in only one higher archaebacterial taxon, though at the same time they are ubiquitous among the eubacteria, clearly indicating that they are archaebacterial imports from eubacteria.
Do the origins of the clades coincide with the acquisitions of the imported genes? There can be two explanations for the taxonomic distribution of eubacterial genes in archaebacteria. If an imported gene was acquired at the origination of each
© 2016 Sinauer Associates, Inc. This material cannot be copied, reproduced, manufactured or disseminated in any form without express written permission from the publisher.

270 Chapter 6
archaebacterial clade, then gene phylogenies of the imported genes in an archaebacterial clade should be identical, or at least similar, to the phylogenies for the archaebacterial clade-specific genes from the same clade. Alternatively, an imported gene might have been acquired in one lineage and then spread through the clade, in which case the imported-gene phylogeny should be different from the phylogenies of the archaebacterial clade-specific genes. The null
hypothesis—that the import and recipient tree sets were drawn from the same dis-tribution—could not be rejected for six clades: Thermoproteales, Desulfurococcales, Methanobacteriales, Methanococcales, Methanosarcinales, and Haloarchaea. For these six clades, the origin of their group-specific eubacterial genes and the origin of the archaebacterial clade-specific gene were indistinguishable. The eubacteria-to-archaebacteria transfers predominantly consist of genes involved in metabolic func-tions, with the most frequently represented of these functions being amino acid im-port, energy production and conversion, inorganic ion transport, and carbohydrate transport.
Have the imported genes been acquired piecemeal by independent horizontal gene transfer events, or have they all been mass transferred at once in a manner similar to that in the origin of eukaryotes? The evidence suggests that, for lineages in which the origin of the eubacterial genes and the origin of the higher archaebacterial taxon are indistinguishable, the latter mechanism seems more likely. The main reason for this assessment is that prokaryotes are known to rapidly eliminate useless genes. Thus, selection is needed to preserve the transferred genes in the recipient. The acquisition of a complete pathway composed of many genes would provide a selectable functional unit. In contrast, one gene from a pathway consisting of many genes would rarely be of any use to its recipient, and would most certainly be eliminated during evolution. This may also be the reason why entire pathways in prokaryotes are organized as operons. Encoded by operons, such pathways may be maintained in the recipient genome more frequently than individual gene transfers. This rationale underlies the selfish operon theory that explains why prokaryotes have operons in the first place
Graur 1e Sinauer AssociatesMorales StudioGraur1e_06.19.ai 08-24-15 10-20-15
Thermoproteales
Desulfurococcales
Sulfolobales
Euryarchaeota
Crenarchaeota
Thermoprotei
Methanomicrobia
Thermococcales
Methanobacteriales
Methanococcales
ThermoplasmatalesArchaeoglobales
MethanomicrobialesMethanocellales
Methanosarcinales
Haloarchaea
59
40
129
101
128
100
4951
8385
338
1,047
Figure 6.19 Gene acquisitions from eubacteria cor-respond to major archaebacterial clades. An unrooted tree for archaebacteria was based on 70 informational genes from 134 sequenced genomes. From these data, 12 well-defined archaebacterial orders were identified by phylogenetic analysis. Upon phylogenetic reconstruction, these gene families yielded a monophyletic archaebacte-rial gene tree that excluded their eubacterial homologs. Each of these clades is characterized by a large number of genes that have homologs in eubacteria but cannot be found in any other archaebacterial clade. Numbers on the right represent gene families found in at least two eubacte-rial taxa and at least two members of that archaebacterial clade (but in no other archaebacterial clade). For example, there are 129 distinct gene families present in at least two species belonging to Sulfolobales that are not found in any other archaebacterial clade but that are present in at least two eubacterial groups. Maximum likelihood phylogenetic reconstruction of these 129 gene families yields a phylo-genetic tree in which all the Sulfolobales genes are mono-phyletic. The vertical edges of the triangles are proportion-al to the number of genomes in each group. For example, the shortest vertical edge (Methanocellales) represents three genomes. (Data from Nelson-Sathi et al. 2015.)
© 2016 Sinauer Associates, Inc. This material cannot be copied, reproduced, manufactured or disseminated in any form without express written permission from the publisher.

Reticulate Evolution and Phylogenetic Networks 271
(Lawrence and Roth 1996), as well as why operons for the same function can be as-sembled independently during evolution (Martin and McInerney 2009).
Interestingly, albeit inexplicably, interdomain horizontal gene transfer has been found to be a highly asymmetrical process, with transfers from eubacteria to archae-bacteria being more than five times as frequent as transfers from archaebacteria to eubacteria. This extreme asymmetry in interdomain gene transfer probably relates to the specialized lifestyle of methanogens, which served as recipients in 83% of the observed gene transfers.
The Two Primary Domains of LifeSince the eukaryotes are almost certainly chimeric in origin and, therefore, phyloge-netically derived, we can ignore them in dealing with the very early stages of cellular evolution. In this section, we discuss attempts to find the root of the tree of life after the reticulation called Eukaryota is removed. The outlines of the very early stages of cellular evolution are fiercely debated in the literature, with little agreement even about the nature of the questions to be asked. One may glean a taste of the feroc-ity of the disagreements by noting that no universally accepted nomenclature exists. The putative common ancestor of all extant organisms has been referred to as the “progenote” (Woese and Fox 1977b), the “cenancestor” (Fitch and Upper 1987), the “commonote” (Kagawa et al. 1995), the “last universal common ancestor” (Kyripides et al. 1999), the “last universal cellular ancestor” (Philippe and Forterre 1999), and the “universal ancestor” (Doolittle 2000).
Because prokaryote evolution was traditionally viewed as a treelike bifurcating process, efforts to identify the most ancient divergence focused on positioning a root on a phylogenetic tree constructed from one or several genes. Such studies have de-livered widely conflicting results on the position of the root, this being mainly due to methodological problems inherent to long divergence times as well as the fact that horizontal gene transfer occurs quite frequently in prokaryotes. Dagan et al. (2010) used a network-based procedure that takes into account both gene presence or ab-sence and the level of sequence similarity among individual gene families. On the basis of 562,321 protein-coding gene families from 191 genomes, they found that the deepest divide in the prokaryotic world is on the branches separating the archaebacte-ria from the eubacteria. This result takes us back to Fox et al.’s (1977) original division of the prokaryotes into two domains.
Of course, the placement of the root may be erroneous due to unequal rates of sequence change between archaebacteria and eubacteria. Dagan et al. (2010) spe-cifically test for such rate inequalities across all prokaryotic lineages, and neither the archaebacteria as a group nor the eubacteria as a group harbor evidence for elevated evolutionary rates, either in the recent evolutionary past or in their common ancestor. The interdomain prokaryotic position of the root is thus not attributable to lineage-specific rate variation.
These findings suggest that only two primary domains of life exist (Williams et al. 2013). According to the nomenclatorial codes in systematics, these primary domains should be referred to as Archaebacteria and Eubacteria, since these names are senior (i.e., older) synonyms. Archaea and Bacteria are junior synonyms and, hence, invalid.
The Public Goods HypothesisSome scientists feel that the failure of the tree metaphor to account for the evolution of prokaryotes necessitates a new metaphor that can (1) accommodate all evolving entities, such as taxa, genes, and genomes, and (2) take into account both horizontal and vertical gene transfer.
McInerney et al. (2011) put forward the public goods hypothesis, according to which nucleotide sequences are seen as goods, passed from organism to organism both vertically and horizontally. In the field of economics, from which this hypoth-
© 2016 Sinauer Associates, Inc. This material cannot be copied, reproduced, manufactured or disseminated in any form without express written permission from the publisher.

272 Chapter 6
esis takes its inspiration, four categories of goods are recog-nized according to their rivalry, on the one hand, and their excludability, on the other (Table 6.1). A good is rivalrous if the consumption of the good by one individual reduces the availability of that good for another individual. It is nonrival-rous if the consumption of the good by one individual does not reduce its availability for another individual. A good is excludable if it is possible to exclude the good from being available to everybody; it is nonexcludable if it is impossible or at least very difficult to exclude the good from being avail-able to others. A good that is both rivalrous and excludable is
called a private good; a good that is rivalrous and nonexcludable is called a common good; a good that is both nonrivalrous and nonexcludable is called a public good; and a good that is nonrivalrous and excludable is a club good. Most goods with which we are familiar are private goods. Fish stocks, public pasture lands, and fossil energy sources, on the other hand, are common goods. The air that we breathe is an example of a public good. First, the breathing of air by one individual does not greatly reduce the availability of air for other individuals, so this makes air a nonrivalrous good. Sec-ond, it is impossible to effectively exclude other individuals from accessing air, so this makes air nonexcludable. (Note, however, that context matters. As far as scuba diving is concerned, air is not a public good, but a private good.) Men-only clubs, private parks, and access to pay-per-view television are examples of club goods.
Since DNA is replicable, it is very difficult to imagine a situation in which DNA is a rivalrous good. In fact, a gene copy can be used almost indefinitely without “using up” the gene. When gene copies are moved either vertically or horizontally, they are mostly moved using a copy-and-paste mechanism, not by a “stealing” mechanism such as cut-and-paste. These features seem to suggest that most genes are nonrival-rous—the use of a gene by one organism does not preclude its use by another. Thus, as far as genes are concerned, we can disregard private and common goods. If we furthermore consider the wide-ranging means of horizontally transferring genes in prokaryotes, along with the experimental demonstration that barriers to gene transfer are few, we must conclude that many genes have the property of being nonexcludable. That is to say, it is very difficult for prokaryotes to completely prevent other prokary-otes from obtaining a particular gene. Thus, many genes are public goods, available for all organisms to integrate into their genomes.
Some DNA sequences, however, are nonrivalrous but excludable, for example, if they are inherited in a strictly vertical fashion, or if their horizontal transfer is re-stricted by biochemical, taxonomic, and ecological factors. Such sequences might be better described as club goods than public goods. For instance, a protein-coding gene may be excludable if it uses a genetic code that is unique to a particular group of or-ganisms. This DNA sequence could produce a defective protein in an organism that uses a different genetic code. Excludability of the gene in this case would come from an intrinsic characteristic of the molecular sequence and would be independent of function. In another scenario, a protein might only function, say, in the absence of oxygen, and therefore all aerobic organisms would be excluded from using the gene that encodes this protein. In this case, the function of the encoded gene is the feature that would make a gene a club good. Other restrictions leading to excludability may involve toxicity or a function that depends on a highly connected network of proteins. It is currently not possible to state how many genes can be categorized as public goods and how many as club goods.
We note in summary that the public goods hypothesis is currently no more than a conceptual framework; it has yet to yield testable and refutable predictions.
Table 6.1The four categories of goods classified according to rivalry and excludability
Excludable Nonexcludable
Rivalrous Private goods Common goods
Nonrivalrous Club goods Public goods
Source: From McInerney et al. (2011).
© 2016 Sinauer Associates, Inc. This material cannot be copied, reproduced, manufactured or disseminated in any form without express written permission from the publisher.