Embed Size (px)
Citation preview
GIScience 2016 Workshop
Rethinking the ABCs: Agent-Based Models
and Complexity Science in the age of Big
Data, CyberGIS, and Sensor Networks
September 27th, 2016
Montreal, Canada
Edited by
Daniel G. Brown
Eun-Kyeong Kim
Liliana Perez
Raja Sengupta
2
Table of Content
About the Workshop ............................................................................................... 3
Workshop Organizers ............................................................................................. 4
Extended Abstracts ................................................................................................. 5
An Adaptive Agent-Based Model of Homing Pigeons: A Genetic
Algorithm Approach (Francis Oloo and Gudrun Wallentin) ........................... 6
Developing High Fidelity, Data Driven, Verified Agent Based Models of
Coupled Socio-Ecological Systems of Alaska Fisheries (Martin Cenek and
Maxwell Franklin) ........................................................................................... 11
Extracting and Visualizing Geo-Social Semantics from the User Mention
Network on Twitter (Caglar Koylu) .............................................................. 16
Geospatial Agent-Based Approach for Modelling Biological Control
Dynamics of Forest Insect Infestation (Taylor M. Anderson and Suzana
Dragićević) ....................................................................................................... 23
Short Abstracts ...................................................................................................... 28
A Complex-Network Perspective on Alexander’s Wholeness (Bin Jiang) 29
Leveraging Coupled Agent-Based Models to Explore the Resilience of
Tightly-Coupled Land Use Systems (Patrick Bitterman and David A.
Bennett) ............................................................................................................ 30
Migrant Routing in the U.S. Urban System (Xi Liu and Clio Andris) ........ 31
MIRACLE: A Prototype Cloud-Based Reproducible Data Analysis and
Visualization Platform for Outputs of Agent-Based Models (Xiongbing Jin,
Kirsten Robinson, Allen Lee, Gary Polhill, Calvin Pritchard, and Dawn
Parker) .............................................................................................................. 32
Spatial Informants of Modeled Phenomena: A Geospatial Analysis of Civil
Violence during the Egyptian Revolution of 2011 (T. Martin Smyth) ........ 33
3
About the Workshop
A broad scope of concepts and methodologies from complexity science – including
Agent-Based Models, Cellular Automata, network theory, chaos theory, and
scaling relations – has contributed to a better understanding of spatial/temporal
dynamics of complex geographic patterns and process.
Recent advances in computational technologies such as Big Data, Cloud
Computing and CyberGIS platforms, and Sensor Networks (i.e. the Internet of
Things) provides both new opportunities and raises new challenges for ABM and
complexity theory research within GIScience. Challenges include
parameterization of complex models with volumes of georeferenced data being
generated, scale model applications to realistic simulations over broader geographic
extents, explore the challenges in their deployment across large networks to take
advantage of increased computational power, and validate their output using real-
time data, as well as measure the impact of the simulation on knowledge,
information and decision-making both locally and globally via the world wide web.
The scope of this workshop is to explore novel complexity science approaches to
dynamic geographic phenomena and their applications, addressing challenges and
enriching research methodologies in geography in a Big Data Era. The topics
include:
1. Multisensor Data Fusion for parameterizing complex models
a. Handling the 5Vs (Volume, Velocity, Variety, Value, and Veracity)
b. Multi-scale interactions in geographic complex phenomena
c. Semantic interoperability
2. Integrating theory with practice:
a. Big data analytics integrated with complexity theories
b. Spatiotemporal analysis in complexity theories
c. Dynamic geo-social network analysis
d. Observer-Expectancy effect of real-time simulations
e. Scaling relations (power laws) in geography
f. Game theoretic approach to geographic problems
4
3. Output Validation:
a. Can modeled pattern or process outputs be validated with real-time data?
b. How can complex models output be visualized and communicated?
c. How can increased use of massive sensitivity analyses improve process
validation?
d. Observer-Expectancy effect of real-time models’ simulations
Workshop Organizers
Co-Chairs
Daniel G. Brown, University of Michigan, USA.
Eun-Kyeong Kim, The Pennsylvania State University, USA.
Liliana Perez, Université de Montréal, Canada.
Raja Sengupta, McGill University, Canada.
Program Committee
Clio Andris, The Pennsylvania State University, USA.
David A. Bennett, University of Iowa, USA.
Christopher Bone, University of Oregon, USA.
Andrew Crooks, George Mason University, USA.
Suzana Dragicevic, Simon Fraser University, Canada.
Petter Holme, Sungkyunkwan University, Korea.
Bin Jiang, University of Gävle, Sweden.
Alan M. MacEachren, The Pennsylvania State University, USA.
Huina Mao, Oak Ridge National Laboratory, USA.
Danielle Marceau, University of Calgary, Canada.
Mir-Abolfazl Mostafavi, Universite Laval, Canada.
Atsushi Nara, San Diego State University, USA.
David O’sullivan, University of California, Berkeley, USA.
Shaowen Wang, University of Illinois at Urbana–Champaign, USA.
Taha Yessari, Oxford Internet Institute, University of Oxford, UK.

5
Extended Abstracts
6
An Adaptive Agent-Based Model of Homing Pigeons: A
Genetic Algorithm Approach
Francis Oloo1 and Gudrun Wallentin1
1 University of Salzburg, Interfaculty Department of Geoinformatics (ZGIS), Schillerstrasse 30-
5020 Salzburg, Austria
{francisomondi.oloo,gudrun.wallentin}@sbg.ac.at
Abstract. Conventional ABMs are formalized from well established theory of the
systems of interest. Simulation outcomes are then used to valid of the conceptual
understanding. Integration of real-time sensor data streams into modelling workflows
opens up the possibility to simulate on the go where calibration and validation
procedures are automated processes and are executed during simulation runs. Real-
time simulation models result in surprising patterns and increasingly well calibrated
parameters and rule sets. Which raises question on the epistemological implications
of data-driven modelling to traditional system analysis and modelling approaches? In
this contribution, we explore this question by implementing a flocking model that
evolves in real-time. Specifically, genetic algorithm is used to simulate optimum
parameters to describe trajectories of homing pigeons based on emulated GPS-sensor
stream that updates the model continuously. Validity of the approach is compared to
the conventional approach and results are discussed in the light of calibration
uncertainty, repeatability, and transferability.
1 Introduction
Traditionally, models have been built from well-established theory of the underlying
systems and empirical data is introduced at later stages for calibration and validation in an
iterative process of exploration, resulting in a set of parameters that produce the optimal
representation of the underlying system. Recent developments in data capture and
transmission, specifically in sensor technology invite the incorporation of the rich data
emanating from such platforms into modelling and simulation environments. The
emergence of miniaturized sensors and intelligent sensor networks to monitor real-world
phenomena provides an opportunity of using sensor data streams to investigate, understand
and represent local level behaviour of system entities and the influence of such behaviour
on overall system outcomes. That sensors can dynamically capture and transmit spatio-
temporal characteristics in real-time also raises the question on the suitability of traditional
methods of model specification, calibration, and validation.
7
In this contribution, we implement an agent-based model (ABM) of adaptive rule sets
of homing pigeons during their flight from a release site to a home loft. It is our view that
concepts of adaptation and emergence which are inherent in ABMs [1] can provide the entry
point for incorporation of sensor observations into ABMs by facilitating automation of
model calibration and implementation of adaptive rule sets of agent behaviours.
Furthermore, sensor streams can potentially influence model specifications by providing
continuous feedback on aspects of the systems of interest and thus provide information on
the adaptation among the agents represented in the model [2]. Adaptive rule sets are
important in understanding emergence in complex systems and have been applied to study
movement patterns of fish [3] and to model the influence of feeding, growth and survival
probabilities in habitat selection among salmonids [4].
Adaptation within ABMs is hinged on the ability of agents to sense their environments,
learn about possible actions to take in different circumstances and respond to stimuli from
other agents or from the environment [5]. Learning within ABM has been achieved through
reinforcement learning [6], evolutionary (genetic) algorithms and through machine learning
methods [7]. However, the implementations of these methods have been through theory
driven approaches to modelling. Spatial learning is the precursor to successful adaptation
and has been identified as one of the challenges to representation of spatially aware agents
[6]. We thus hypothesize that real-time high resolution spatio-temporal data streams can
facilitate the implementation of spatial learning and help in understanding and
representation of local spatial-temporal behaviour of agents. In this task, we use genetic
algorithms to model the navigation of homing pigeons from a release site to a known loft.
2 Methods
GPS trajectories in this study were sourced from an experimental research on leadership
among homing pigeons in Seuzach Switzerland [8]. The data, contained information on five
separate homing flights with each flight capturing the coordinates; speed and flight height
of at least 7 pigeons at a time interval of 0.25 seconds.
A flocking and navigation model of the pigeons from the release site to the home loft
was implemented in Netlogo. The purpose of this model was to identify the optimal
parameters for simulation of navigation of homing pigeons which are represented as
autonomous agents. Agents can sense other agents in their vicinity and the environment and
make independent decisions with the goal of flying home in a flock and by following
realistic flight paths. Two sets of pigeon agents are represented in the model; “real” birds
that use the empirical data from the emulated GPS trajectories to navigate and simulated
birds that learn from the real birds and use flocking and navigation rules to arrive at the
homing loft. At each time step, step distance, relative turn-angle, sinuosity of flight path
and the mean distance between flock mates is evaluated. Additionally, during the learning
runs of the model, a measure of fitness is calculated for the simulated birds.
Simulated flights of the birds are controlled by flocking and navigation rules. Flocking
rules are modified from Reynolds flocking model [9] and are guided by alignment,
8
coherence and separation procedures which are achieved through maximum alignment
turns, maximum cohere turns, maximum separation turns and minimum separation distance.
Navigation behaviour is guided by an elevation turn angles which allows agents to fly along
a topographic isoline and loft-turn which is an angle that specifies the general direction
towards the home loft. Additionally, visible distance and the maximum view angle of the
agents are specified by corresponding parameters.
Initial calibration resulted in a set of suitable parameters for simulation of flocking and
navigation behaviour of the simulated agents without learning from the emulated GPS
tracks. These set of parameters which included maximum alignment turn, maximum
coherence turn, maximum separation turn, maximum loft turn, maximum elevation turn,
vision distance, maximum view angle, minimum and maximum step distance provided the
elements for encoding a chromosome of candidate navigation parameters. A disturbance
was introduced to the elements of individual agent chromosomes adding a random value
from a normal distribution with a mean of 0.0 and standard deviation of 0.1. Genetic
algorithm creates a generic range of optimal parameters to simulate the flight behaviour of
homing pigeons from the release sites to the homing loft. Student’s t-test at 95% confidence
interval was used to compare the simulated and observed flight trajectories.
3 Results
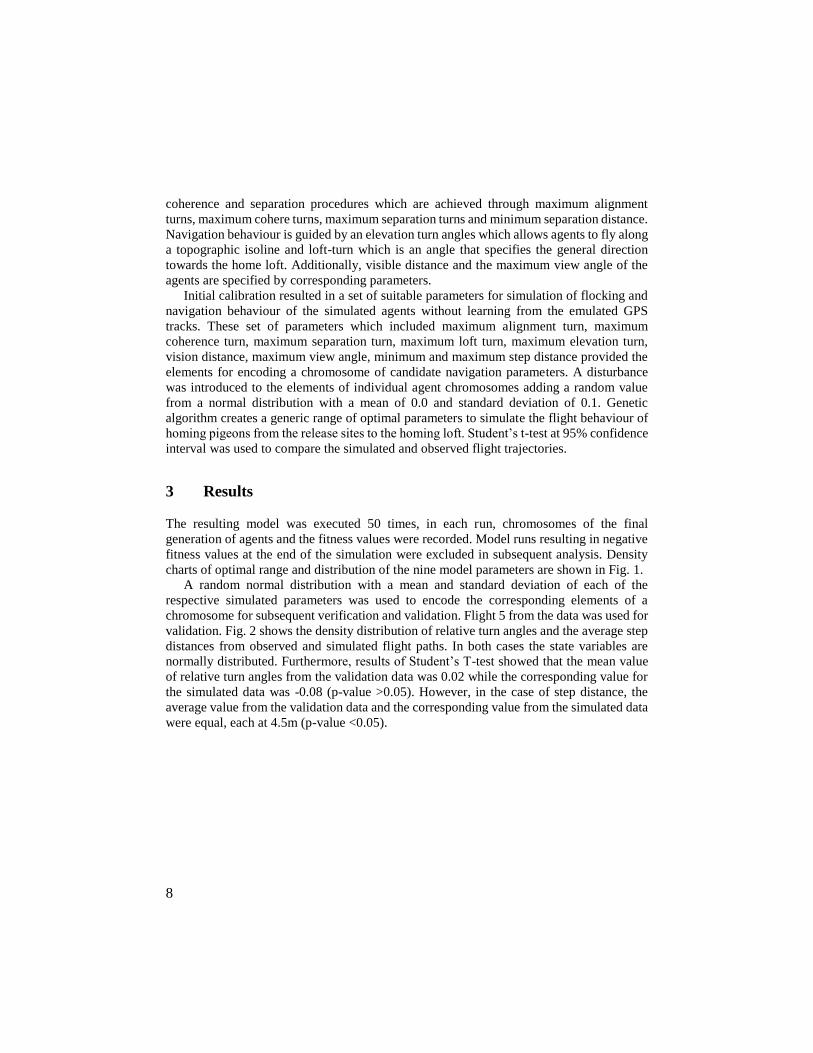
The resulting model was executed 50 times, in each run, chromosomes of the final
generation of agents and the fitness values were recorded. Model runs resulting in negative
fitness values at the end of the simulation were excluded in subsequent analysis. Density
charts of optimal range and distribution of the nine model parameters are shown in Fig. 1.
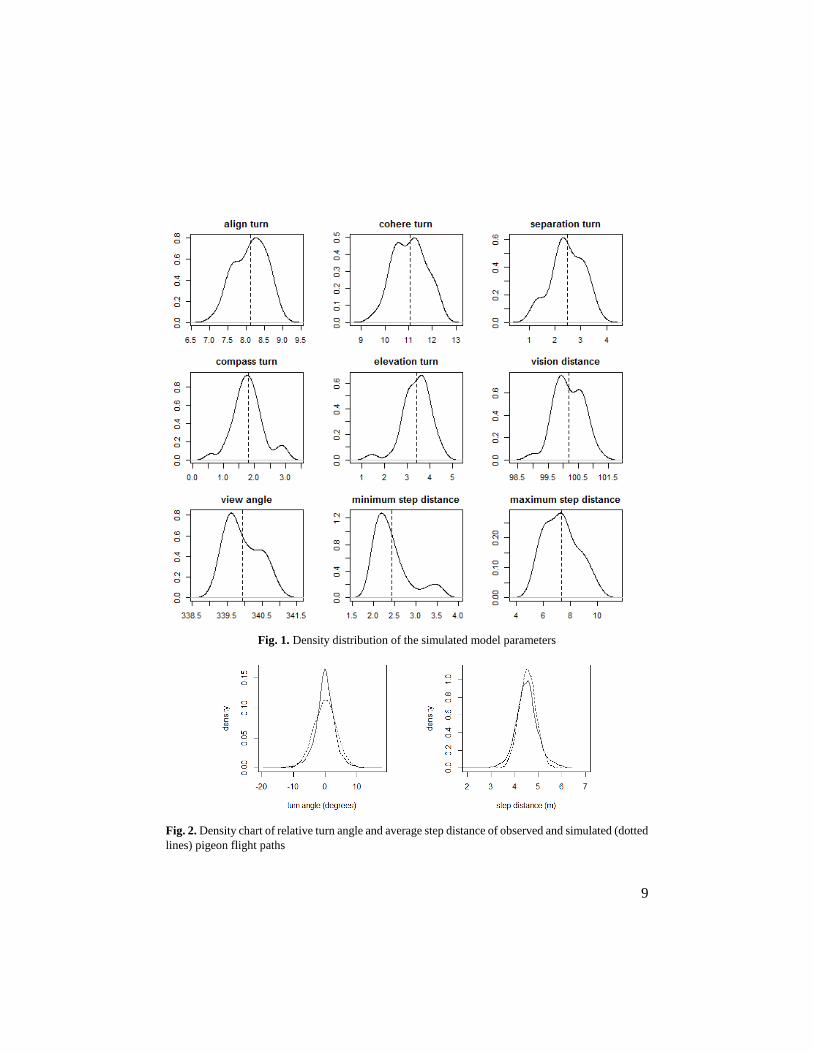
A random normal distribution with a mean and standard deviation of each of the
respective simulated parameters was used to encode the corresponding elements of a
chromosome for subsequent verification and validation. Flight 5 from the data was used for
validation. Fig. 2 shows the density distribution of relative turn angles and the average step
distances from observed and simulated flight paths. In both cases the state variables are
normally distributed. Furthermore, results of Student’s T-test showed that the mean value
of relative turn angles from the validation data was 0.02 while the corresponding value for
the simulated data was -0.08 (p-value >0.05). However, in the case of step distance, the
average value from the validation data and the corresponding value from the simulated data
were equal, each at 4.5m (p-value <0.05).
9
Fig. 1. Density distribution of the simulated model parameters
Fig. 2. Density chart of relative turn angle and average step distance of observed and simulated (dotted
lines) pigeon flight paths
10
4 Conclusion
Whereas agents presented herewith were not trained to remember all the possible states of
their environment, parameters resulting from the genetic algorithm were able to
successfully simulate the core state variables including relative turn-angle and step-distance
which are vital in describing animal movement trajectories. Imitated data streams
successfully represented dynamic spatial and temporal characteristics of autonomous
pigeon agents thus providing a basis on which to compare the simulated state variables
against corresponding empirical values during the life of a model, thus giving credence to
the hypothesis that dynamic data streams from sensor observations can be incorporated into
agent based models to improve the understanding of moving organisms. More importantly,
availability of dynamic and high resolution data streams makes it possible to develop
models without over-reliance on the theories and assumptions hence a data-driven approach
to modelling. Additionally, by providing instantaneous calibration and verification of
models during the model run results in robust parameters and hence improving their
transferability to other settings and scenarios. Finally, genetic algorithm ensures an
evolution of optimal solutions and parameters and thus making a strong case its
consideration in data-driven hypothesis generation and knowledge discovery.
References
1. Macal, C.M., North, M.J.: Tutorial on agent-based modeling and simulation. In: Proceedings of
the 37th conference on Winter simulation, Winter Simulation Conference (2005) 2–15
2. Holland, J.H.: Complex adaptive systems. Daedalus (1992) 17–30
3. Railsback, S.F., Lamberson, R.H., Harvey, B.C., Duffy, W.E.: Movement rules for individual-
based models of stream fish. Ecological Modelling 123 (1999) 73–89
4. Railsback, S.F., Harvey, B.C.: Analysis of habitat-selection rules using anindividual-based model.
Ecology 83 (2002) 1817–1830
5. McLane, A.J., Semeniuk, C., McDermid, G.J., Marceau, D.J.: The role of agent-based models in
wildlife ecology and management. Ecological Modelling 222 (2011) 1544–1556
6. Bennett, D.A., Tang, W.: Modelling adaptive, spatially aware, and mobile agents: Elk migration
in yellowstone. International Journal of Geographical Information Science 20 (2006) 1039–1066
7. Okunishi, T., Yamanaka, Y., Ito, S.i.: A simulation model for japanese sardine (sardinops
melanostictus) migrations in the western north pacific. Ecological Modelling 220 (2009) 462–479
8. Santos, C.D., Neupert, S., Lipp, H.P., Wikelski, M., Dechmann, D.K.: Temporal and contextual
consistency of leadership in homing pigeon flocks. PloS one 9 (2014) e102771
9. Reynolds, C.W.: Flocks, herds and schools: A distributed behavioral model. In: ACM SIGGRAPH
computer graphics. Volume 21., ACM (1987) 25–34
11
Developing High Fidelity, Data Driven, Verified Agent
Based Models of Coupled Socio-Ecological Systems of
Alaska Fisheries
Martin Cenek1, Maxwell Franklin1
1 University of Alaska Anchorage, Anchorage AK 99508, USA
[email protected],[email protected]
1 Extended Abstract
Alaska salmon fisheries are a source of commercial revenue, renewable subsistence
resource, cultural identity, and recreational destination for Alaskans, native populations,
and out of state eco-tourists alike. We constructed a high fidelity, adaptable, data-driven
agent based model that generalizes the socio-ecological dynamics of Kenai River, Alaska.
Interactions among the model’s agents can be altered to study the impact of fishing
regulation changes or salmon run-timing dynamics. Agents are driven by stochastic
principles derived from 35 years of integrated data including salmon runs, municipality
management reports, and Alaska Department of Fish and Game management reports.
Longitudinal and seasonal correlations between the model’s simulation outputs and the
reported system measurements are used to validate the model.
To model accurate salmon agents counts, we reconstructed the temporal distribution of
the salmon run by taking 35 years of reported sonar counts as the baseline and adding the
harvest of the major stakeholder groups. The genetic sampling of randomly selected salmon
caught by the drift gillnet, set gillnet, as well as test fisheries at the mouth of Upper Cook
Inlet is used to determine how much salmon caught by the off-shore fishermen were
returning to the Kenai River watershed instead of the rest of the inlet tributaries [2]. Time
frames of these harvests are reported alongside estimated harvest from genetic sampling by
gear type.
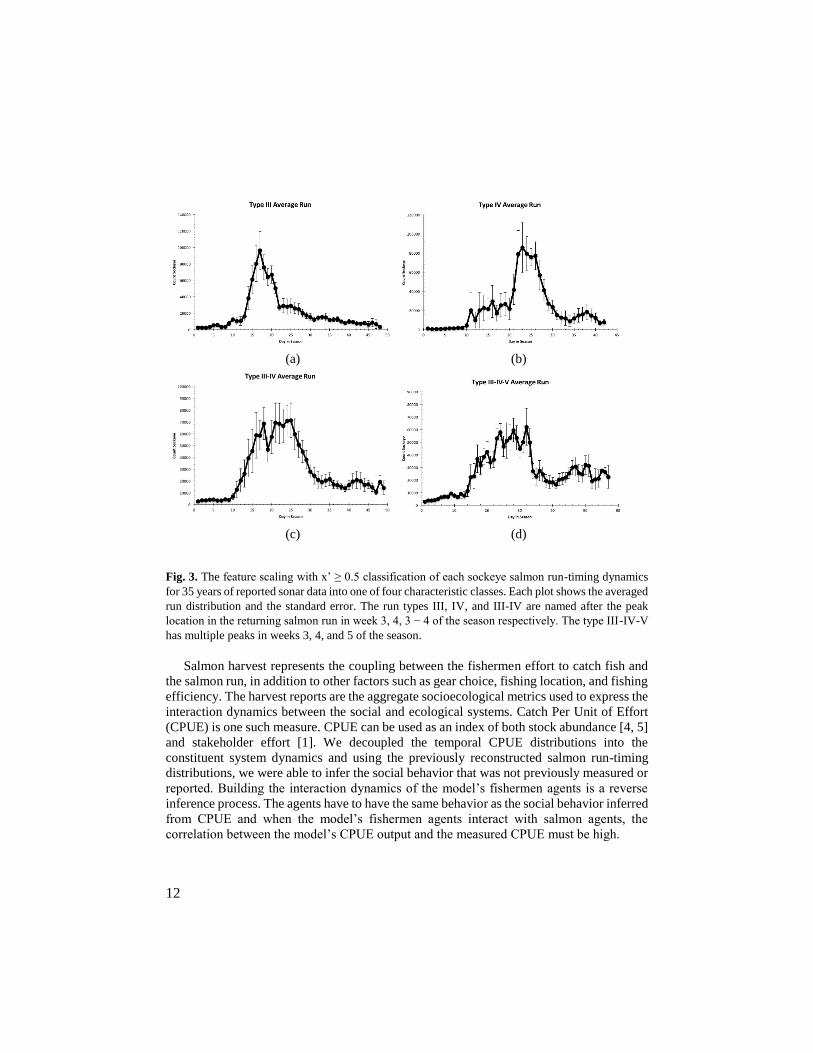
Salmon runs were grouped into four categories by their overall characteristics of run-
timing dynamics. We used the sonar records to categorize the run-timing patterns using
feature-scaling to filter daily sockeye counts with values x’ ≥ 0.5 (Equation 1). The
temporally aligned and weekly binned series of filtered sonar data for 35 years were
mutually compared. The distributions with high similarity were grouped into the four
resulting prototype categories. Averaging the series in each prototype category produced
the generalized baseline time-series distribution of the salmon runs with variance margins
(Fig. 1).
x’ = (x − min(x))/(max(x) − min(x)) (1)
12
(a) (b)
(c) (d)
Fig. 3. The feature scaling with x’ ≥ 0.5 classification of each sockeye salmon run-timing dynamics
for 35 years of reported sonar data into one of four characteristic classes. Each plot shows the averaged
run distribution and the standard error. The run types III, IV, and III-IV are named after the peak
location in the returning salmon run in week 3, 4, 3 − 4 of the season respectively. The type III-IV-V
has multiple peaks in weeks 3, 4, and 5 of the season.
Salmon harvest represents the coupling between the fishermen effort to catch fish and
the salmon run, in addition to other factors such as gear choice, fishing location, and fishing
efficiency. The harvest reports are the aggregate socioecological metrics used to express the
interaction dynamics between the social and ecological systems. Catch Per Unit of Effort
(CPUE) is one such measure. CPUE can be used as an index of both stock abundance [4, 5]
and stakeholder effort [1]. We decoupled the temporal CPUE distributions into the
constituent system dynamics and using the previously reconstructed salmon run-timing
distributions, we were able to infer the social behavior that was not previously measured or
reported. Building the interaction dynamics of the model’s fishermen agents is a reverse
inference process. The agents have to have the same behavior as the social behavior inferred
from CPUE and when the model’s fishermen agents interact with salmon agents, the
correlation between the model’s CPUE output and the measured CPUE must be high.
13
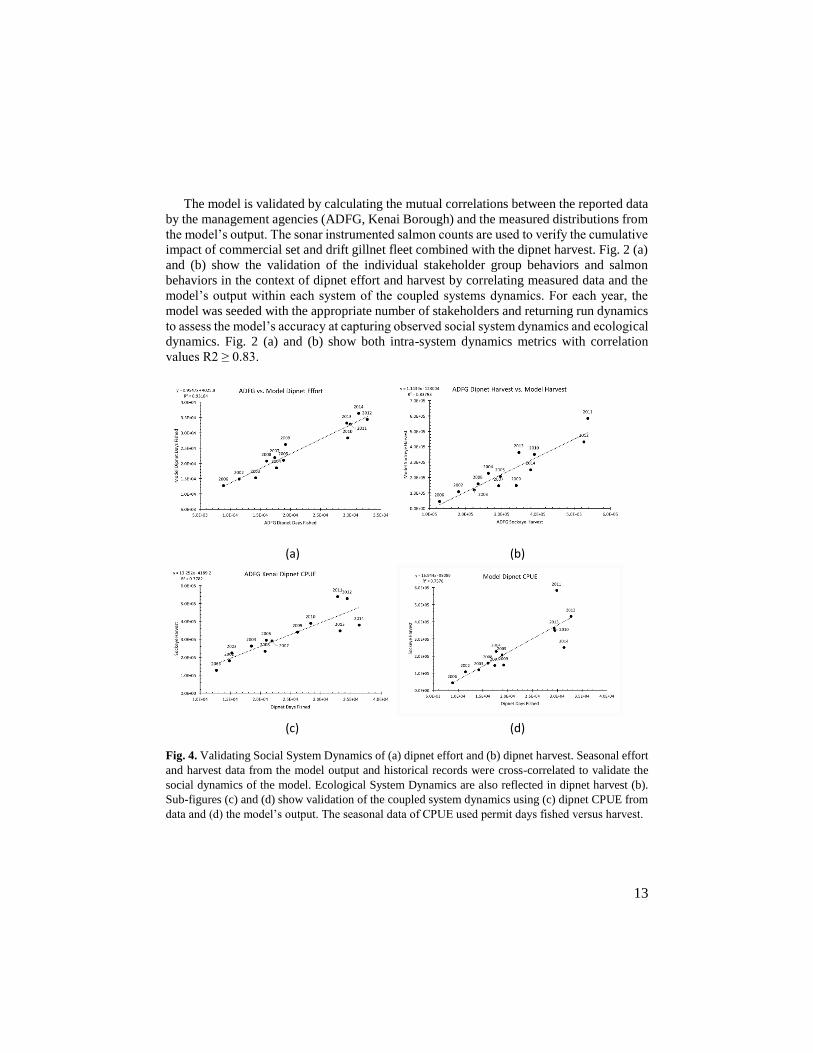
The model is validated by calculating the mutual correlations between the reported data
by the management agencies (ADFG, Kenai Borough) and the measured distributions from
the model’s output. The sonar instrumented salmon counts are used to verify the cumulative
impact of commercial set and drift gillnet fleet combined with the dipnet harvest. Fig. 2 (a)
and (b) show the validation of the individual stakeholder group behaviors and salmon
behaviors in the context of dipnet effort and harvest by correlating measured data and the
model’s output within each system of the coupled systems dynamics. For each year, the
model was seeded with the appropriate number of stakeholders and returning run dynamics
to assess the model’s accuracy at capturing observed social system dynamics and ecological
dynamics. Fig. 2 (a) and (b) show both intra-system dynamics metrics with correlation
values R2 ≥ 0.83.
(a) (b)
(c) (d)
Fig. 4. Validating Social System Dynamics of (a) dipnet effort and (b) dipnet harvest. Seasonal effort
and harvest data from the model output and historical records were cross-correlated to validate the
social dynamics of the model. Ecological System Dynamics are also reflected in dipnet harvest (b).
Sub-figures (c) and (d) show validation of the coupled system dynamics using (c) dipnet CPUE from
data and (d) the model’s output. The seasonal data of CPUE used permit days fished versus harvest.
14
Measuring model outcomes with simple metrics loses the information about how the
goal was met, or how the nature of interactions between the model’s agents changed to
produce the system-wide (outcomes) dynamics. Visually inspecting each model behavior is
infeasible for the combinatorial parameter space. We developed a statistical based toolbox
called Geometry of Behavioral Spaces that records agents’ behaviors independent of the
knowledge of the parameter space that drives the model and produces a state-space
transition network that characterizes the agent behaviors [3].
We described a construction of a high fidelity ABM from data sources with high
diversity, unknown accuracy, and various reporting frequencies. We constructed collections
of temporal distributions that described the individual social and ecological system
dynamics as well as the coupled system dynamics. The regressions between the data
collections representing instrumented measurements and the model’s outputs measure the
accuracy of the model’s construction in generalizing the socio-ecological systems. The data
collections from instrumented measurements often contained multiple distributions
describing the same observed phenomena. By cross-correlating these equivalency
distributions, we performed manual ensemble learning to establish trustworthiness of each
source distribution.
Future research includes implementing plausible future scenarios identified in a series
of participatory stakeholder engagement meetings to understand how the coupled system
dynamics will change in each scenario. The social scenarios include using dipnetters as a
means for managing escapement, alteration of commercial gillnet fishing gear for reducing
non-target species by-catch, and using sports fishermen as a means for controlling
escapement. The ecological scenarios include compressing the salmon run duration by two
weeks while maintaining the abundance and inversely keeping the overall dynamics while
reducing the overall salmon abundance. Finally, we will use the statistical toolbox
(Geometry of Behavioral Spaces Framework) to analyze agent behavior to understand
system outcomes and model changes in terms of agent behaviors.
2 Acknowledgments
This work was funded by Alaska EPSCoR NSF award #OIA-1208927. The authors would
also like to thank all project collaborators for their comments and suggestions especially to
Dr. Dan Rinella, Molly McCarthy, and ADFG Staff for sharing their incredible wealth of
knowledge of Kenai Fisheries.
References
1. Effort and catch per unit effort. http://www.fao.org/, 2016. Accessed: 2016- 04-01.
2. Barclay, A. W., Habicht, C., Tobias, T., Willette, T. M., Templin, W. D., Hoyt, H. A., and
Chenoweth, E. L. Genetic stock identification of Upper Cook Inlet sockeye salmon harvest, 2005-
15
2008, 2009, 2010, 2011. Alaska Department of Fish and Game, Division of Sport Fish, Research
and Technical Services, 2010, 2013, 2014.
3. Cenek, M., and Dahl, S. Geometry of behavioral spaces: A computational approach to analysis and
understanding of agent based models and agent behaviors. Chaos: An Interdisciplinary Journal of
Nonlinear Science (Under review. Pre-print available on request.).
4. E, R. W. Handbook of computations for biological statistics of fish populations. Fisheries Research
Board of Canada, 1958.
5. Quinn, T. P. The Behavior and Ecology of Pacific Salmon & Trout. University of Washington
Press, 2005
16
Extracting and Visualizing Geo-Social Semantics from the
User Mention Network on Twitter
Caglar Koylu1
1 Department of Geographical and Sustainability Sciences, University of Iowa, 316 Jessup Hall,
Iowa City, IA 52242, USA
Abstract. This paper introduces an approach for extracting and visualizing geo-social
semantics of user mentions on Twitter. The approach consists of three steps. First,
data filtering and processing is performed to construct a directed area-to-area mention
network in which tweets are aggregated into flow bins between geographic areas.
Second, using flow bins as documents, a probabilistic topic model is employed to
detect a collection of topics, and classify each area-to-area flow into a mixture of
topics with differing probabilities. Third, for each topic, a modularity graph of
mentions is obtained and visualized using a flow map and a topic cloud to infer
semantics from the set of frequently co-occurring words for each topic. To
demonstrate, a dataset of 19 million geo-tagged mentions during the primary elections
(Feb-Jun, 2016) in the U.S. were analyzed. The results highlight changing patterns of
symmetry, distance and clustering of flows by the topic of content.
1 Introduction
Previous studies have utilized user generated textual content such as geo-tagged tweets and
messages exchanged in location-based social networks (LBSN) to study the effect of
geographic proximity on social interactions [1-3]; the influence of information diffusion
and social networks on real-world geographic events, such as demonstrations, protests, and
group activities [4]; and the structural and geographic characteristics of the communication
network [5-7]. Such studies use information flows to model social interactions, but often
ignore the content of the information exchanged between the individuals of the network.
A variety of computational and semantic analysis techniques have been developed to
infer human behavior, ideological and attitudinal similarity between individuals [8],
common topics and way of speaking [9], group identities [10], demographic and socio-
economic characteristics [11] from large volumes of user-generated textual data. Latent
Dirichlet Allocation (LDA) [12, 13] has been successfully employed to detect geographic
events, and recommend places and friends based on user location and similarity of shared
content between users in LBSNs. Despite these efforts, there has been little work that
17
focuses on understanding of geographic patterns of interpersonal communication and how
the common topics of information vary based on the geographic distance and characteristics
of locations [14].
We introduce an approach for extracting and visualizing geo-social semantics from the
big data of user mentions on Twitter. The approach consists of three steps. First, data
filtering and processing is performed and a bi-directional area-to-area mention network is
constructed. In an area-to-area mention network, the original locations of tweets are
aggregated into a small set of areas (e.g., counties) and mentions are combined into flow
bins between these geographical areas. Second, flow bins are used to train a probabilistic
topic model which generates a collection of topics and classify each flow bin into a mixture
of topics with differing probabilities. Third, for each topic, a modularity graph of mentions
is obtained and visualized using a flow map and a topic cloud to infer semantics from the
set of frequently co-occurring words for each topic. To demonstrate, geo-tagged tweets
within the Contiguous U.S. during presidential primaries and caucuses between February 1,
2016 and June 14, 2016 were collected through Twitter’s streaming API.
2 Data processing and filtering
The data consisted of 284,868,345 tweets, and 4,571,070 million distinct users. We
removed tweets from non-personal accounts (e.g., weather, emergency, and job ads), and
external sources such as pictures and check-ins (e.g., Instagram, Foursquare); users with
more than 3000 followers; and users whose velocities (i.e., equals to the distance divided
by time between two consecutive tweets) are above (1,000km/h) which would indicate spam
users and bots. After the initial filtering, the number of tweets decreased to 75.0%
(213,649,745) and the users to 88% (4,050,523).
A Twitter user can reply or mention other users by including their @username in her
tweet. When a user A (sender) mentions user B (recipient), the tweet include only the
location of the sender. The location of the recipient in a mention can be derived only if the
recipient has a geo-tagged tweet in the sample. Among the filtered tweets, 45%
(95,855,784) include a user mention, and 65.0% (2,632,840) of the users mentioned another
user in a tweet at least once. The recipient’s location was successfully extracted in 19.80%
(19,046,949) of all mention tweets to form a network of geo-tagged user mentions.
3 Topic Modeling
Given a collection of textual documents (e.g., books, articles, emails), LDA models a
collection of k topics as a multinomial distribution over words within these documents.
𝑃(𝑍|𝑊, 𝐷) = 𝑊𝑍+𝛽𝑤
𝑡𝑜𝑡𝑎𝑙 𝑡𝑜𝑘𝑒𝑛𝑠 𝑖𝑛 𝑍 + 𝛽∗ 𝐷𝑍+ ∝
18
The probability that word W came from topic Z, is calculated as the normalized product
of the frequency of W in Z (𝑊𝑍+𝛽𝑤 ) and the number of other words in document D that
already belong to Z (𝐷𝑍+ ∝). β and βw are hyper-parameters that represent the chance that
word W belongs to topic Z even if it is nowhere else associated with Z.
Training a topic model with short documents (i.e., individual tweets) results in unstable
classifications with increased uncertainty due to the severe data sparsity [15]. To alleviate
the problem, previous work combined tweets into temporal [16], spatio-temporal [17], and
user bins [18]. We combine tweets into area-to-area (i.e., county-to-county) flow bins to
capture interpersonal conversations between geographic areas. Each user is assigned to a
home county, and mention tweets are added into a flow bin based on the home counties of
the recipient and sender of each mention. Each tweet is added to an origin-destination flow
bin only once to avoid duplicate content when a tweet includes multiple mentions between
the same county pair.
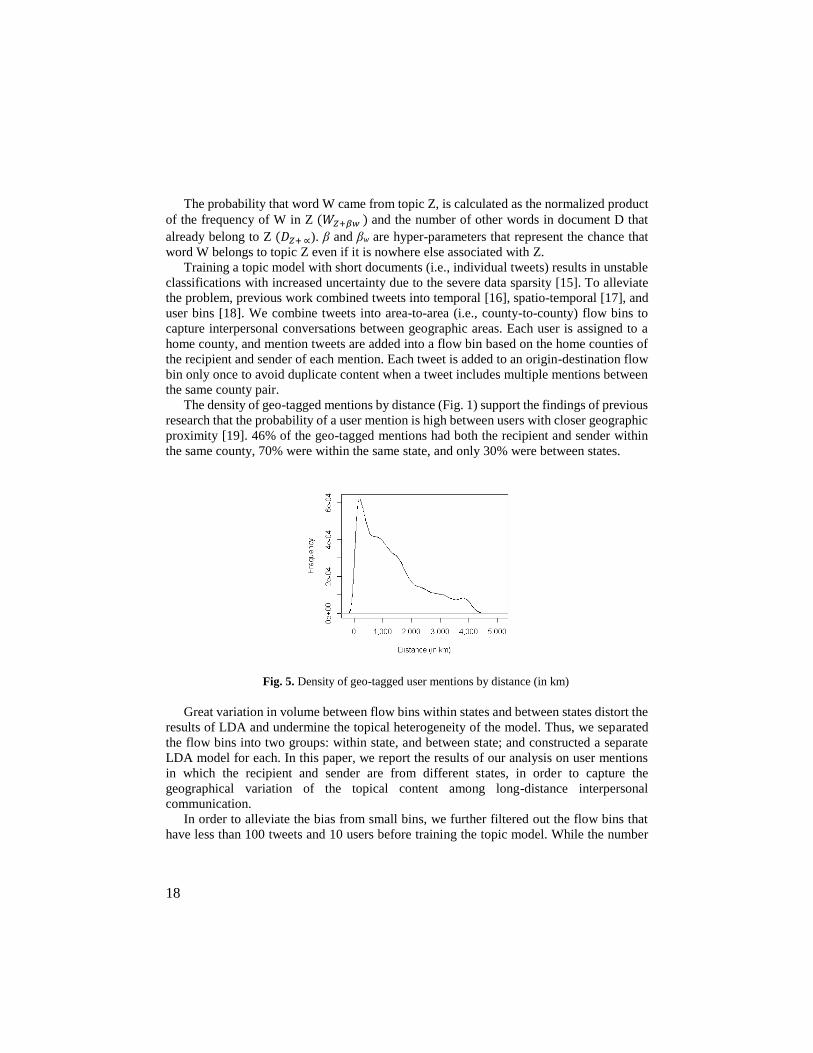
The density of geo-tagged mentions by distance (Fig. 1) support the findings of previous
research that the probability of a user mention is high between users with closer geographic
proximity [19]. 46% of the geo-tagged mentions had both the recipient and sender within
the same county, 70% were within the same state, and only 30% were between states.
Fig. 5. Density of geo-tagged user mentions by distance (in km)
Great variation in volume between flow bins within states and between states distort the
results of LDA and undermine the topical heterogeneity of the model. Thus, we separated
the flow bins into two groups: within state, and between state; and constructed a separate
LDA model for each. In this paper, we report the results of our analysis on user mentions
in which the recipient and sender are from different states, in order to capture the
geographical variation of the topical content among long-distance interpersonal
communication.
In order to alleviate the bias from small bins, we further filtered out the flow bins that
have less than 100 tweets and 10 users before training the topic model. While the number
19
of flow bins (or county pairs) decreased from 350,295 to 49,436; the volume of mentions
was reduced by only 13%. We used the Mallet toolkit [20] to implement the LDA model
and trained a set of topic models with differing number of topics (20, 50, and 100), number
of iterations (2000), and evaluated the topical overlap using cosine similarity. We selected
50 topics as it produced the less overlapping topics than 100, and more distinct topics than
20.
4 Mapping Modularity Flows
The topic model classifies each flow bin with a mixture of topics with differing probabilities.
For example, a flow from county A to county B may be comprised of 50% topic 5, 30%
topic 2, 10% topic 32, and 10% in other topics. Among a set of fuzzy classification of flow
bins, one may isolate each topic to create a separate graph and estimate the weight of a link
by multiplying the probability of isolated topic by the volume of user mentions on that link.
Although the number of mentions have been significantly reduced after excluding
within-state mentions, county-to-county pairs still form a complex graph with a large
number of links that requires further simplification. One can reduce the graph by graph
partitioning and regionalization [21, 22] which combines unit areas into a smaller set of
natural regions where there are more flows within regions than across regions. In order to
ease the interpretation of our results, and reveal user mention patterns at the state level, we
aggregate county pairs into state-to-state user mention flows for each topic and calculate a
modularity measure to select the flows that are above expectation [22]. Expected number
of mentions on a link is calculated as:
EM (O, D) = FO FD f (O, D) / (FS 2 - ∑ 𝐹𝑖2𝑛
𝑖=0)
where FO is the number of mentions originated from state O, FD is the number of times that
state D is mentioned, f (O,D) is the number of mentions from state O to state D, FS is the
number of mentions between all states, and ∑ 𝐹𝑖2𝑛
𝑖=0 is used to remove within-state
expectations. Finally, modularity of a link O-D for topic Z is calculated as:
MODZ (O, D) = PZ (AM - EM)
where PZ is the probability of topic Z, AM is actual number of mentions, and EM is expected
number of mentions on the link O-D.
5 Results
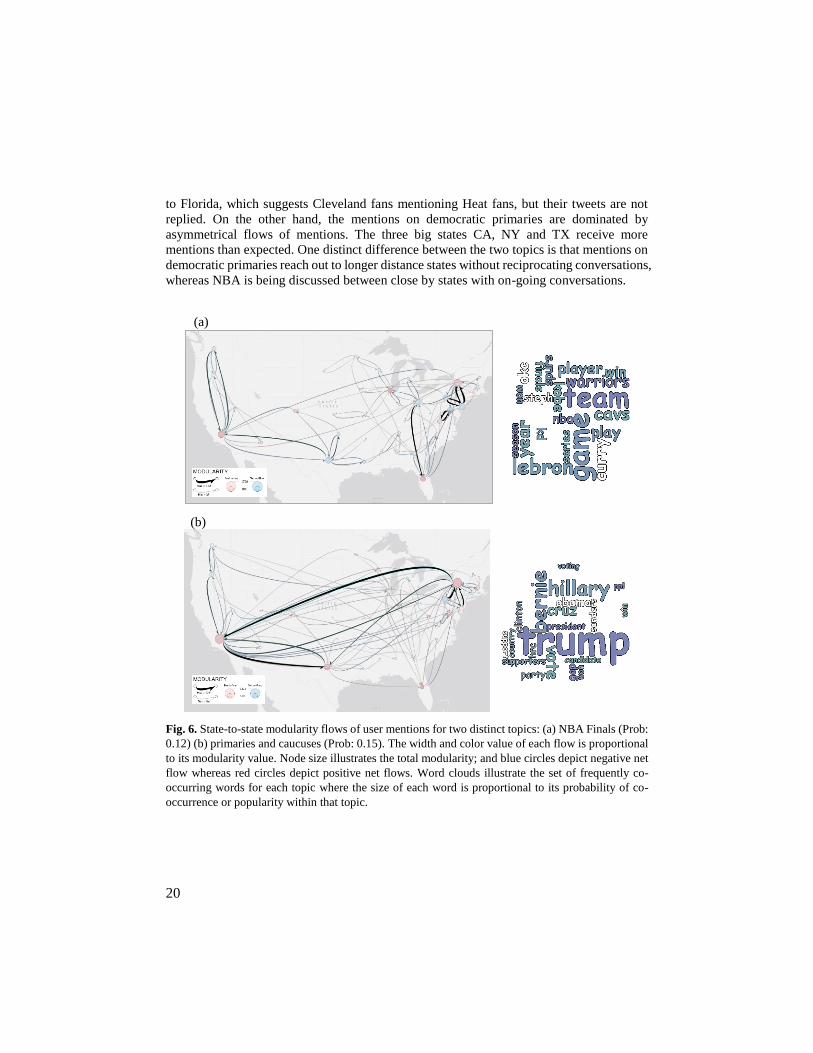
Fig. 2 illustrates modularity flows of two topic graphs: (a) NBA finals (b) democratic
primaries. The mentions on NBA finals have symmetrical flows which suggest on-going
conversations between pairs of states. A distinct asymmetrical flow is observed from Ohio
20
to Florida, which suggests Cleveland fans mentioning Heat fans, but their tweets are not
replied. On the other hand, the mentions on democratic primaries are dominated by
asymmetrical flows of mentions. The three big states CA, NY and TX receive more
mentions than expected. One distinct difference between the two topics is that mentions on
democratic primaries reach out to longer distance states without reciprocating conversations,
whereas NBA is being discussed between close by states with on-going conversations.
(a)
(b)
Fig. 6. State-to-state modularity flows of user mentions for two distinct topics: (a) NBA Finals (Prob:
0.12) (b) primaries and caucuses (Prob: 0.15). The width and color value of each flow is proportional
to its modularity value. Node size illustrates the total modularity; and blue circles depict negative net
flow whereas red circles depict positive net flows. Word clouds illustrate the set of frequently co-
occurring words for each topic where the size of each word is proportional to its probability of co-
occurrence or popularity within that topic.
21
6 Conclusion and Future Work
We introduced a novel approach for extracting and visualizing geo-social semantics from
the bi-directional user mention network on Twitter. The results highlighted distinct
geographic patterns of symmetry, distance and clustering for user mentions. A major
limitation of this study is that the temporal variation in topics is ignored. Future work is
needed to incorporate temporal flow binning, and train the topic model to extract temporally
varying patterns of mention topics between origin-destination pairs.
References
1. Backstrom, L., Sun, E., Marlow, C.: Find me if you can: improving geographical prediction with
social and spatial proximity. In: Proceedings of the 19th international conference on World wide
web, pp. 61-70. ACM, (Year)
2. Mok, D., Wellman, B., Carrasco, J.: Does distance matter in the age of the Internet? Urban Studies
47, 2747-2783 (2010)
3. Garc, R., #237, a-Gavilanes, Mejova, Y., Quercia, D.: Twitter ain't without frontiers: economic,
social, and cultural boundaries in international communication. Proceedings of the 17th ACM
conference on Computer supported cooperative work & social computing, pp. 1511-1522. ACM,
Baltimore, Maryland, USA (2014)
4. Vasi, I.B., Suh, C.S.: Protest in the Internet Age: Public Attention, Social Media, and the Spread
of “Occupy” Protests in the United States. (2013)
5. Takhteyev, Y., Gruzd, A., Wellman, B.: Geography of Twitter networks. Social Networks 34, 73-
81 (2012)
6. Park, P., Weber, I., Mejova, Y., Macy, M.: The mesh of civilizations and international email flows.
WebSci 2013 Proceedings. ACM (2013)
7. Kylasa, S.B., Kollias, G., Grama, A.: Social ties and checkin sites: Connections and latent
structures in Location Based Social Networks. In: Proceedings of the 2015 IEEE/ACM
International Conference on Advances in Social Networks Analysis and Mining 2015, pp. 194-
201. ACM, (Year)
8. Adamic, L.A., Lento, T.M., Adar, E., Ng, P.C.: Information evolution in social networks. arXiv
preprint arXiv:1402.6792 (2014)
9. McCallum, A., Wang, X., Corrada-Emmanuel, A.: Topic and role discovery in social networks
with experiments on enron and academic email. Journal of Artificial Intelligence Research 30, 249-
272 (2007)
10. Tamburrini, N., Cinnirella, M., Jansen, V.A., Bryden, J.: Twitter users change word usage
according to conversation-partner social identity. Social Networks 40, 84-89 (2015)
11. Lansley, G., Longley, P.A.: The geography of Twitter topics in London. Computers, Environment
and Urban Systems 58, 85-96 (2016)
12. Pozdnoukhov, A., Kaiser, C.: Space-time dynamics of topics in streaming text. In: Proceedings of
the 3rd ACM SIGSPATIAL International Workshop on Location-Based Social Networks, pp. 1-
8. ACM, (Year)
22
13. Hu, B., Ester, M.: Spatial topic modeling in online social media for location recommendation. In:
Proceedings of the 7th ACM conference on Recommender systems, pp. 25-32. ACM, (Year)
14. Yardi, S., Boyd, D.: Tweeting from the Town Square: Measuring Geographic Local Networks. In:
ICWSM. (Year)
15. Yan, X., Guo, J., Lan, Y., Cheng, X.: A biterm topic model for short texts. In: Proceedings of the
22nd international conference on World Wide Web, pp. 1445-1456. International World Wide
Web Conferences Steering Committee, (Year)
16. Malik, S., Smith, A., Hawes, T., Papadatos, P., Li, J., Dunne, C., Shneiderman, B.: TopicFlow:
visualizing topic alignment of Twitter data over time. Proceedings of the 2013 IEEE/ACM
International Conference on Advances in Social Networks Analysis and Mining, pp. 720-726.
ACM, Niagara, Ontario, Canada (2013)
17. Gerber, M.S.: Predicting crime using Twitter and kernel density estimation. Decision Support
Systems 61, 115-125 (2014)
18. Hong, L., Davison, B.D.: Empirical study of topic modeling in twitter. In: Proceedings of the First
Workshop on Social Media Analytics, pp. 80-88. ACM, (Year)
19. Liben-Nowell, D., Novak, J., Kumar, R., Raghavan, P., Tomkins, A.: Geographic routing in social
networks. Proceedings of the National Academy of Sciences of the United States of America 102,
11623-11628 (2005)
20. McCallum, A.K.: {MALLET: A Machine Learning for Language Toolkit}. (2002)
21. Andrienko, G., Andrienko, N., Mladenov, M., Mock, M., Pölitz, C.: Discovering bits of place
histories from people's activity traces. In: Visual Analytics Science and Technology (VAST), 2010
IEEE Symposium on, pp. 59-66. IEEE, (Year)
22. Guo, D.: Flow Mapping and Multivariate Visualization of Large Spatial Interaction Data. vol. 15,
pp. 1041-1048. IEEE, IEEE Transactions on Visualization and Computer Graphics (2009)
23
Geospatial Agent-Based Approach for Modelling Biological
Control Dynamics of Forest Insect Infestation
Taylor M. Anderson1*, Suzana Dragićević1
1 Department of Geography, Simon Fraser University, 8888 University Drive, Burnaby, Canada
{taylora,suzanad}@sfu.ca
Abstract. Geospatial agent-based models (ABM) can be designed to explore
scenarios related to propagation of various spatio-temporal phenomena including
forest insect infestation and related management strategies. The main objective of this
study is to develop an ABM to represent dynamics between the two forest insects, the
emerald ash borer (EAB) Agrilus planipennis and the Tetrastichus planipennisi (TP),
a stingless wasp used as a biological control larval parasitoid for EAB. The model is
implemented on real geospatial datasets from the City of Oakville, Canada, a region
much affected with EAB infestation. For that purpose, an EAB-TP ABM is developed
in order to simulate spatio-temporal dynamics and the biological control of EAB
infestation using TP. Results indicate that ABM makes a suitable approach for the
representation of EAB-TP dynamics for the simulation of EAB biological control,
useful in forest and pest management.
1 Introduction
The eradication of the emerald ash borer (EAB) an invasive wood-boring beetle native to
Asia is of primary focus for forest management in southwestern Ontario, Canada, to prevent
further decline of North American ash trees. Since visible symptoms of infested trees are
limited, preventing direct management via insecticides, and native predators are lacking,
eradication measures have been extended to biological control, a strategy that uses natural
enemies to control pest populations. Pest-parasitoid interactions between the Tetrastichus
planipennisi (TP) and EAB result in the parasitism and death of EAB larvae by TP larvae,
resulting in a 1-2% reduction of EAB within one year and up to 30% after four years (Duan
et al. 2013).
In the biological control of any forest insect infestation, it is important to understand the
spatial patterns of insects’ dispersal, interactions, and dynamics, but this information can be
difficult to obtain from the field. Alternatively, an agent-based model (ABM) can be used
as a virtual laboratory to simulate these patterns and better understand complexity of the
* Corresponding author
24
infestation dynamics and its control with natural predators. Existing EAB models use
differential equations (Barlow et al. 2014) and diffusion models (Muirhead et al. 2006),
however are limited in their representation of spatio-temporal complexity inherent to insect
infestation processes (With 2002). Specifically, EAB infestation can be conceptualized as
a complex system, whereby heterogeneous individuals interact at local level and across a
varying spatial environment and generate large scale patterns of infestation (BenDor et al,
2006; Anderson and Dragicevic, 2016a).
In order to extend existing modelling efforts and address the complexity of EAB
infestation, Anderson and Dragicevic (2015) developed an ABM of EAB infestation that is
capable of capturing the complexity inherent to insect infestation processes by representing
heterogeneous individuals or agents that interact within a geospatial environment from
which patterns of infestation emerge. ABMs can be used for scenario development, for
example, optimizing release strategies of TP for the control of EAB. However no such
modelling approaches can be found in the literature that represents the pest-parasitoid
interactions and spatio-temporal dynamics of both EAB and TP insects. Therefore, the main
objective of this study is to develop the geospatial ABM to simulate spatio-temporal
dynamics and the biological control of EAB infestation using TP.
2 Methods
2.1 Data Sets, Study Site, and Model Overview
The developed ABM modeling approach is implemented on geospatial datasets
representing the Town of Oakville, Ontario, Canada, a leader in EAB infestation data
collection, management, and eradication. The epicenter of EAB infestation in Oakville, first
discovered in 2008, lies in the North Iroquois Ridge community. The Town of Oakville
developed GIS datasets containing ash tree inventory with location and attributes for tree
species and the delimitation of EAB infestations for the Town of Oakville observed in 2009,
providing the actual EAB spread rate of 1.977 km/year.
The EAB-TP ABM has been developed representing two years of insect dispersal in the
Town of Oakville (2008-2009) and to measure the effects of the TP interactions on the
population of EAB. This model implements the release of 600 TP agents, the minimum
number of TP required for release reported in the literature (Gould et al. 2016), at the
epicenter of EAB infestation, in June 2009, one year after EAB infestation begins in the
region. In order to compare and optimize the biological control, an EAB-Baseline ABM has
been developed to represent EAB infestation only. The model expands from the existing
ABM of EAB infestation (Anderson and Dragicevic 2015), and was tested against real
datasets delimiting EAB extent and validated with 72% accuracy in simulating the location
of EAB infestation. Fifty simulation runs have been executed for both developed models
and the simulation results are combined in order to determine where the spatial extent of
EAB and TP spread occurs on average. The averaged simulation results from each model
are compared in order to determine the simulated impact of TP on EAB populations.
25
2.2 Agents, State Variables, and Model Processes
The ABM includes agents that represent EAB insects, EAB larvae, TP insects, TP larvae,
and ash trees. Agents are programmed to behave as their real world counterparts by
incorporating biological information documented in the literature into the agents design in
the form of state variables and parameters. State variables describe the state of the agent at
a given point in time i.e. age, location. Parameters describe the capabilities of a particular
agent over its life time i.e. maximum flight distance/day, chance of fertility, maximum
number of offspring.
Dispersal of both EAB and TP agents is governed by their preferences for specific host
tree characteristics (size, type, health) and spatial distributions. Population dynamics
emerge from the local interactions between EAB and TP larvae agents. For example, for
every one EAB larvae, 5-122 TP larvae will feed on it, killing it, and collectively reducing
the EAB population (Duan et al. 2013). This interaction is simulated in the model where the
number of TP larvae agents it will take to kill an EAB agent is generated randomly from 5-
122 and once this threshold has been reached, the EAB agent is removed from the
simulation.
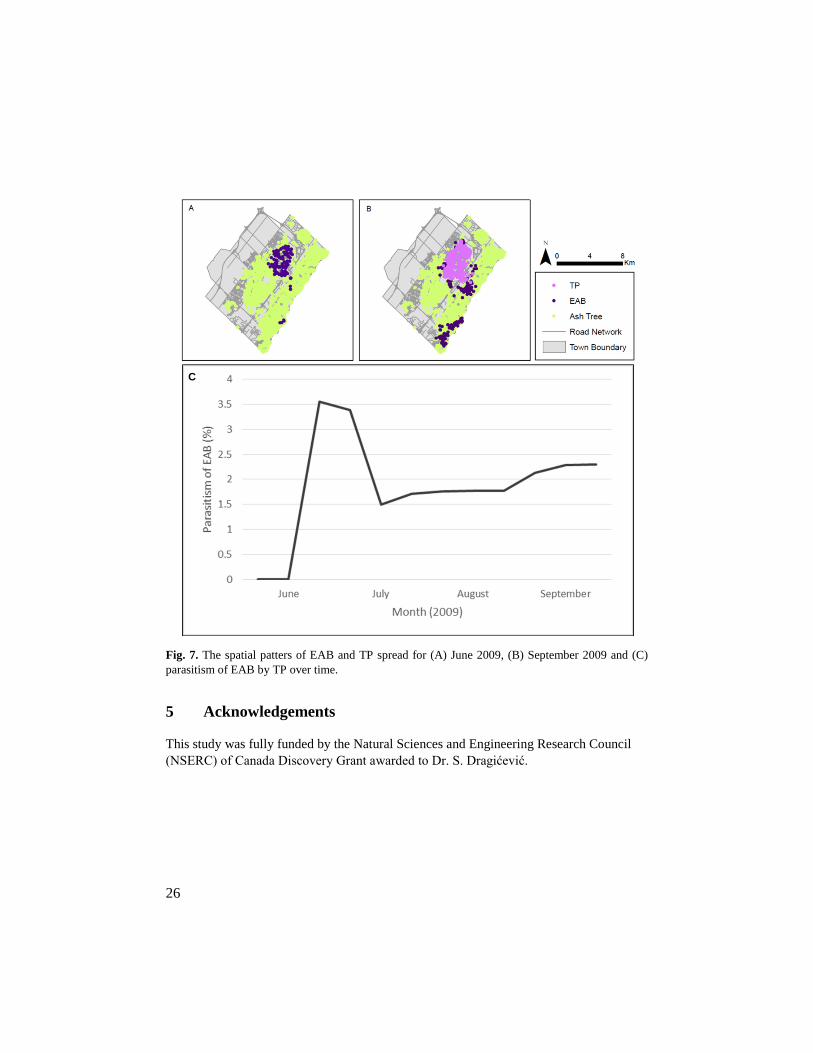
3 Results
The simulation results and parasitism of EAB larvae by TP larvae over time are presented
in Fig. 1. The comparison of number of larvae between the simulation results obtained from
EAB-TP and EAB-Baseline agent-based models indicates a parasitism rate of 1.8%
following the first year of TP release. The simulation result is consistent with the parasitism
rate recorded in the literature of 1-2% (Duan et al. 2013).
4 Conclusions
Representation of insect infestation as a complex system using ABM can help to understand
and analyze implications of biological control, specifically in understanding how
interactions at a small scale generate emergent parasitoid-pest dynamics. The results
indicate that an ABM is a suitable approach for capturing the EAB-TP interaction dynamics.
Currently, biological control strategies using TP for EAB management are non-specific.
The further development of several scenarios to simulate how the EAB population will
respond to variations TP release densities, number of TP release points, and timing of
release using the proposed EAB-TP ABM would be beneficial for planning by forest pest
managers when time and resources for data collection are limited (Anderson and
Dragicevic, 2016b).
26
Fig. 7. The spatial patters of EAB and TP spread for (A) June 2009, (B) September 2009 and (C)
parasitism of EAB by TP over time.
5 Acknowledgements
This study was fully funded by the Natural Sciences and Engineering Research Council
(NSERC) of Canada Discovery Grant awarded to Dr. S. Dragićević.
C
27
References
1. Anderson T and Dragicevic S, 2015, An agent-based modeling approach to represent infestation
dynamics of the emerald ash borer beetle. Ecological Informatics, 30:97-109.
2. Anderson, T., Dragicevic, S., 2016a. Geosimulation approach for data scarce environments:
Modeling dynamics of forest insect infestation across different landscapes. ISPRS International
Journal of Geo-Information. 5(2), 9
3. Anderson T and Dragicevic S, 2016b, Geospatial pest-parasitoid agent based model for optimizing
biological control of forest insect infestation. Ecological Modelling, 337: 310-329.
4. Barlow LA, Cecile J, Bauch, CT and Anand M, 2014, Modelling interactions between forest pest
invasions and human decisions regarding firewood transport restrictions. PLoS ONE, 9(4): e90511.
5. BenDor, T. K., Metcalf, S. S., Fontenot, L. E., Sangunett, B., and Hannon, B. Modeling the spread
of the emerald ash borer. Ecological Modelling. 2006, 197, 221-236
6. Duan JJ, Bauer LS, Abell KJ, Lelito JP and Van Driesche R, 2013, Establishment and abundance
of tetrastichus planipennisi (hymenoptera: Eulophidae) in Michigan: Potential for success in
classical biocontrol of the invasive emerald ash borer (Coleoptera: Buprestidae). Journal of
Economic Entomology, 106(3): 1145-1154.
7. Muirhead JR, Leung B, Overdijk C, Kelly DW, Nandakumar K, Marchant KR and MacIsaac HJ,
2006, Modelling local and long‐distance dispersal of invasive emerald ash borer Agrilus
planipennis (Coleoptera) in North America. Diversity and Distributions, 12(1): 71-79.
8. Gould JS, Bauer LS and Duan JD, 2016, Emerald ash borer biological control release and
recovery guidelines - USDA-APHIS-ARS-FS. Riverdale, Maryland.
9. With KA, 2002, The landscape ecology of invasive spread. Conservation Biology, 16(5):1192-
1203.

28
Short Abstracts
29
A Complex-Network Perspective on Alexander’s Wholeness*
Bin Jiang1
1 Engineering and Sustainable Development, Division of GIScience, University of Gävle, SE-801 76
Gävle, Sweden
“Nature, of course, has its own geometry. But this is not Euclid’s or
Descartes’ geometry. Rather, this geometry follows the rules, constraints,
and contingent conditions that are, inevitably, encountered in the real
world.”
Christopher Alexander et al. (2012)
Abstract. The wholeness, conceived and developed by Christopher Alexander, is
what exists to some degree or other in space and matter, and can be described by
precise mathematical language. However, it remains somehow mysterious and
elusive, and therefore hard to grasp. This paper develops a complex network
perspective on the wholeness to better understand the nature of order or beauty for
sustainable design. I bring together a set of complexity-science subjects such as
complex networks, fractal geometry, and in particular underlying scaling hierarchy
derived by head/tail breaks – a classification scheme and a visualization tool for data
with a heavy-tailed distribution, in order to make Alexander’s profound thoughts more
accessible to design practitioners and complexity-science researchers. Through
several case studies (some of which Alexander studied), I demonstrate that the
complex-network perspective helps reduce the mystery of wholeness and brings new
insights to Alexander’s thoughts on the concept of wholeness or objective beauty that
exists in fine and deep structure. The complex-network perspective enables us to see
things in their wholeness, and to better understand how the kind of structural beauty
emerges from local actions guided by the 15 fundamental properties, and in particular
by differentiation and adaptation processes. The wholeness goes beyond current
complex network theory towards design or creation of living structures.
Keywords: theory of centers, living geometry, Christopher Alexander, head/tail
breaks, and beauty
* This abstract is that of the newly published paper: Jiang B. (2016), A complex-network
perspective on Alexander's wholeness, Physica A, 463, 475-484, and I may add something new into
the presentation from this more recent pre-print: http://arxiv.org/abs/1607.07169
30
Leveraging Coupled Agent-Based Models to Explore the
Resilience of Tightly-Coupled Land Use Systems
Patrick Bitterman1, David A. Bennett1
1 University of Iowa, Iowa City, IA 52242, USA
Abstract. This paper argues that agent-based models (ABMs) possess an inherent
advantage for modeling and exploring the specified resilience of social-ecological
systems. Coupled systems are often complex adaptive systems, and the ability of
ABMs to integrate heterogeneous actors, dynamic couplings, and processes across
spatiotemporal scales is vital to understanding resilience in the context of complexity
theory. To that end, we present the results of a preliminary stylized model designed to
explore resilience concepts in an agricultural land use system. We then identify
strengths and opportunities for further ABM development, and outline future work to
integrate empirically-parameterized agent behavioral rules with robust biophysical
models to explore resilience and complexity.
Keywords: resilience, agent-based modeling, complexity, adaptive capacity
31
Migrant Routing in the U.S. Urban System
Xi Liu1 and Clio Andris1
1 Department of Geography, The Pennsylvania State University, University Park, PA, USA
{clio, xiliu}@psu.edu
Abstract. In this article, we create directional networks of U.S. core-based statistical
areas where the number of nodes is equal to the number of links (edges = nodes = n)
in each network. Cities link to the most popular destination city of its out-migrants for
a given year. This destination city is called its cityfriend or best friend, and does not
depend on migrant volume. Data is sourced from the U.S. Internal Revenue Service.
The resultant networks are not fully connected but instead join cities into graph motifs
or “constellations” within the galaxy of cities. We visualize these networks and create
subnetworks based on wealth discrepancies. We find that the network of poorer
migrants reveals a chain of local movements, which is substantially different than that
of wealthy migrants, who flock to hub cities.
Keywords: migration, networks, complexity, cities, mobility
32
MIRACLE: A Prototype Cloud-Based Reproducible Data
Analysis and Visualization Platform for Outputs of Agent-
Based Models
Xiongbing Jin1, Kirsten Robinson1, Allen Lee2, Gary Polhill3, Calvin
Pritchard2, and Dawn Parker1
1 University of Waterloo {x37jin,k4robins,dcparker}@uwaterloo.ca 2 Arizona State University [email protected], [email protected]
3 The James Hutton Institute [email protected]
Abstract. Since the agent-based models we design have stochastic elements and many
potential parameter combinations, multiple model runs that sweep parameters are
conducted, creating large quantities of computationally generated, hyper-dimensional,
“big data”. Understanding the models’ implications requires structured exploration of
these complex output data. In response to this need, the MIRACLE team has
developed a cloud-based community platform for the management, analysis and
visualization of such data, as well as the sharing of associated analysis/visualization
methods and results. We anticipate that the platform will facilitate improved
communication within research groups, as well as increasing access and transparency
for external communities. This paper provides contextual background and a case study
to the MIRACLE data storage and analysis web tool.
Keywords: reproducibility, agent-based models, big data
33
Spatial Informants of Modeled Phenomena: A Geospatial
Analysis of Civil Violence during the Egyptian Revolution of
2011
T. Martin Smyth1
1 Stony Brook University, Stony Brook, New York, USA
Abstract. This paper seeks to model the spatial distribution of civil violence
associated with political protest demonstrations during the initial period of the
Egyptian revolution of 2011. A spatially constructed index of protest event visibility
is introduced and a simple logistic regression analysis applied to assess its efficacy as
a predictor of civil violence incidence. Agent-based models of political phenomena
have been largely agnostic as to the spatial informants of modeled phenomena. The
method developed in this paper is intended as an important first step toward modeling
the influence of an urbanized topography as a spatial informant of political outcomes.
Keywords: protest, violence, location analytics, Egypt, Arab spring