Embed Size (px)
Citation preview
Page 1
Contents
List of Figures ......................................................................................................................... 2
Executive Summary ............................................................................................................... 3
Report .................................................................................................................................... 5
List of Recommendations .................................................................................................... 27
Appendices .......................................................................................................................... 31
1A State Accountability Measures and Targets .................................................. 32
1B Undergraduate Progress Index, WSU and Peers ............................................ 34
2 Spring 2007 Telephone Survey of Non-Returning Students ......................... 35
3 List of WSU Data Sets Reviewed by Retention Council ................................ 50
Bibliography ........................................................................................................................ 52
Retention Council Members
Manuel Acevedo*, Director,
Multicultural Student Services Carol Anelli, Associate Professor,
Entomology Mary Bloodsworth-Lugo, Associate
Dean, College of Liberal Arts Pam Bradetich, Senior Associate
Director, Athletics Department, Denny Davis, Professor, College of
Agriculture, Human and Natural Resource Sciences
Chio Flores*, Associate Director, Office of Financial Aid and Scholarship Services
Cathy Fulkerson, Director, Institutional Research
Fran Hermanson*, Director, Student Affairs Research
Al Jamison*, Interim Vice President, Office of Student Affairs, Equity and Diversity
Janet Kendall, Director, Center for Distance and Professional Education
Terese King, Director, New Student Programs
Vicki McCracken, Professor, School of Economic Sciences
Mary Sanchez-Lanier*, Associate Dean, College of Sciences
Joan Menzies, Director of Student Services, WSU - Spokane
Robert Olsen*, Associate Dean, College of Engineering and Architecture
Susan Poch*, Associate Vice-President of Educational Development/ Director, Student Advising and Learning Center
Jerman Rose, Associate Dean, College of Business
Jane Sherman, Vice Provost, Academic Policy and Evaluation
Ken Vreeland, Special Assistant to the Provost & Executive Vice President
Mary Wack*, Vice Provost, Office of Undergraduate Education
Pat Wright, Director, Student Affairs – WSU Tri-Cities
Nancy Youlden, Vice Chancellor, Student Affairs – WSU Vancouver
*Members of the Retention Work Group
Page 2
LIST OF FIGURES
Figure 1 First-Year Retention Rates: WSU Students Overall and WSU Multicultural Students, Cohorts 1997-2006
Figure 2 Six-Year Graduation Rates: WSU Students Overall and WSU Multicultural Students, Cohorts 1992-2001
Figure 3 First-Year Retention Rates: WSU, Peer Average, WSU Multicultural, Peer Multicultural Average, and AAU Peer Average, Cohorts 1997-2006
Figure 4 Six-Year Graduation Rates: WSU, Peer Average, WSU Multicultural, Peer Multicultural Average, and AAU Peer Average, Cohorts 1997-2006
Figure 5 Attrition: New and Continuing Undergraduates (Fall 2005 to Fall 2006)
Figure 6 Attrition: All Undergraduates by Class Standing (Fall 2005 to Fall 2006)
Figure 7 Attrition by Certification Status (Fall 2005 to Fall 2006)
Page 3
EXECUTIVE SUMMARY
In February 2007, Provost Robert Bates convened the Retention Council to support university enrollment management efforts. The Council was directed to focus on retention of students, and to develop plans to encourage student success and persistence to graduation. His charge was to:
Review best practices that encourage student success at WSU and the national level;
Analyze WSU data to determine WSU populations at risk of attrition;
Identify structures and processes that may contribute to students leaving before graduation;
Recommend or implement policies, procedures, and programs to encourage student achievement and success to graduation and bring our retention rates in line with our peers, particularly those that are AAU institutions.
The Council focused on undergraduate students, and found that the freshmen retention rates and six-year graduation rates at WSU have been mostly flat for a decade. Multicultural students lag behind Caucasian students in almost all measures. While our rates by some national measures are average or better than average, more direct peer and aspirational peer comparisons show that we can improve significantly.
To meet our state accountability targets by 2011, all our student outcome measures must increase by 3.5% to 9%, depending on the measure. These targets are realistic and achievable if approached by coordinated institutional action. The advantages are many, for the students and the institution, including elevating our rankings in our peer and aspirational peer groups and increasing our revenue stream.
The data-driven analysis of groups with higher likelihood of leaving WSU—students with financial need, multicultural students, freshmen, undeclared sophomores, transfer students, and juniors with declared majors in certain areas—suggest that intensification of institutional actions already underway in a more intentional and coordinated fashion could enable WSU to exceed its state targets substantially.
Major recommendations:
Create a university-wide strategic retention plan with explicit goals, assigned responsibilities, and mechanisms of accountability.
Enhance the current data support system pending replacement by an enterprise student information system. Insure easy access at the department and other levels to relevant student information and reports.
Define key metrics for addressing retention efforts and create a standard data inquiry that is easily retrievable and that can be used effectively to measure our progress in certain targeted areas (a “dashboard” of sorts).
Coordinate scholarship policies among Enrollment Management, college deans, and Student Affairs, Equity and Diversity in order to structure optimal “stacking” of central and college dollars; target students at risk of attrition for financial reasons; and assess
Page 4
effectiveness of improved processes in terms of retention outcomes. Raising need-based scholarships should be a campaign priority.
While academic factors are not major reasons for leaving cited by departing students, they are important secondary factors. Departments and faculty can have a major positive impact on retention and graduation rates by helping to:
o Create a culture of high standards and expectations for student success for the freshman year and beyond
o Substantially reduce the number of uncertified sophomores
o Track the retention/graduation rates of their certified majors
o Support the reform of the advising system
More specific recommendations are provided under various report subheadings, and are summarized at the end of the report.
Page 5
Report on Undergraduate Retention Issues
at Washington State University
WHY RETENTION NOW?
Student retention and graduation rates have become widely accepted as measures of the quality of the undergraduate experience, and thus of institutional effectiveness in promoting student success and in achieving its mission. Political leaders, the public, educational groups, and institutions themselves are utilizing these rates as indicators of institutional health, educational quality, financial condition, and responsiveness to accountability demands. For example, US News and World Report college rankings rest in part on a four-year average of six-year graduation rates as well as, to a lesser degree, on first year retention rates. The Retention Committee looked at four major factors that make retention an issue requiring institutional action now: state accountability measures; the university’s own strategic goals; the financial impact of attrition; and the university’s ethical obligation to students it matriculates.
State and national accountability. Since 1995, the Washington State Legislature has required all public four-year institutions to submit accountability plans as part of the budgeting process. The current plan includes six-year graduation rates, three-year graduation rates for transfer students, and one-year retention rates for entering freshmen. Washington State University’s ambitious goals for 2011 include:
Increase from 64% to 68% the six-year graduation rate for entering freshmen
Increase from 62% to 68% the three-year graduation rate for transfers
Increase from 84% to 87% the first-year retention rate for entering freshmen
We have an additional responsibility to the students with greatest financial need, Pell grant recipients. (See Appendix 1A for WSU’s state accountability measures and targets.)
Recent debates in Washington, DC on accreditation and accountability in the context of the reauthorization of the Higher Education Act have elevated the importance of graduation rates as a measure of institutional student outcomes.
University strategic goals. As part of the 2002-2007 Strategic Plan, a university benchmark was established to “improve retention and graduation rates equal to our peer average.” WSU’s six-year graduation rate and first year retention rate place it sixteenth out of twenty-one peer institutions. (See Appendix 1b for WSU and peer graduation and retention rates). The 2006 Equity Scorecard details the differential graduation rates for subgroups of the student population.
Financial impact of attrition. Increasing student retention rates directly affects the economic health and viability of the institution. Since state budget allocations are dictated by student enrollment, and tuition revenues are a primary source of operating budgets, the financial ramification of retention is of obvious concern. At Washington State University in fall of 2006, we recruited 2699 entering freshmen to the Pullman campus, yet overall, 2006 undergraduates didn’t return that fall who were enrolled the previous spring. We lost the equivalent of over 70% of the entering freshman class. That represents roughly $12 million in lost revenue to the university.
Page 6
Failure to retain students operates like an ongoing budget cut. The loss of future tuition and fees from students who leave, and the increased recruitment costs to replace them, underscore the importance of retention.
Our ethical obligation to students. While retention and graduation rates provide significant benchmarks indicating quality and effectiveness, they also measure the institution’s commitment to students who matriculate. Every faculty and staff member has an ethical commitment to each student who enrolls here. That commitment is enacted in the beliefs, and in corresponding actions, that students who are admitted to WSU can graduate; that we are all responsible for a culture of student success; and that collective dedication to student success will create an environment that attracts and retains students.
Our commitment is to engage students actively in the intellectual and social life of this community of scholars such that they develop, grow, and mature as self-aware, engaged and productive learners during the short few years they are here with us. We acknowledge that the experiences of students at Washington State University shape their lives in many ways including earning potential, quality of life, quality of health and ability to contribute as leaders and citizens. The more successful they are at WSU, the greater their contributions to the health and well-being of our state and nation, and to their future engagement with WSU.
PROVOST BATES’ CHARGE TO THE RETENTION COUNCIL
In February 2007, Provost Robert Bates convened the Retention Council to aid university enrollment management efforts. The Council was directed to focus on retention of students, and to develop plans to encourage student success and persistence to graduation.
His charge was to:
Review best practices that encourage student success at WSU and the national level;
Analyze WSU data to determine WSU populations at risk of attrition;
Identify structures and processes that may contribute to students leaving before graduation;
Recommend or implement policies, procedures, and programs to encourage student achievement and success to graduation and bring our retention rates in line with our peers, particularly those that are AAU institutions.
The twenty-one member council met monthly to discuss and examine issues, data, and best practices for retention. A subgroup, the Retention Work Group, met weekly to wrestle with specific topics, generate pertinent data, and propose recommendations for consideration by the Council.
Overview of Undergraduate Retention and Graduation at Washington State University
For the past decade, retention and graduation rates have remained generally stagnant. While some measures show slight upward or downward trends, and most demonstrate occasional fluctuations over the ten-year period, overall the trajectories are disappointing. In the same timeframe, peer and
Page 7
AAU rates have climbed steadily upward, so that WSU is now farther behind peers than it was in 1997.
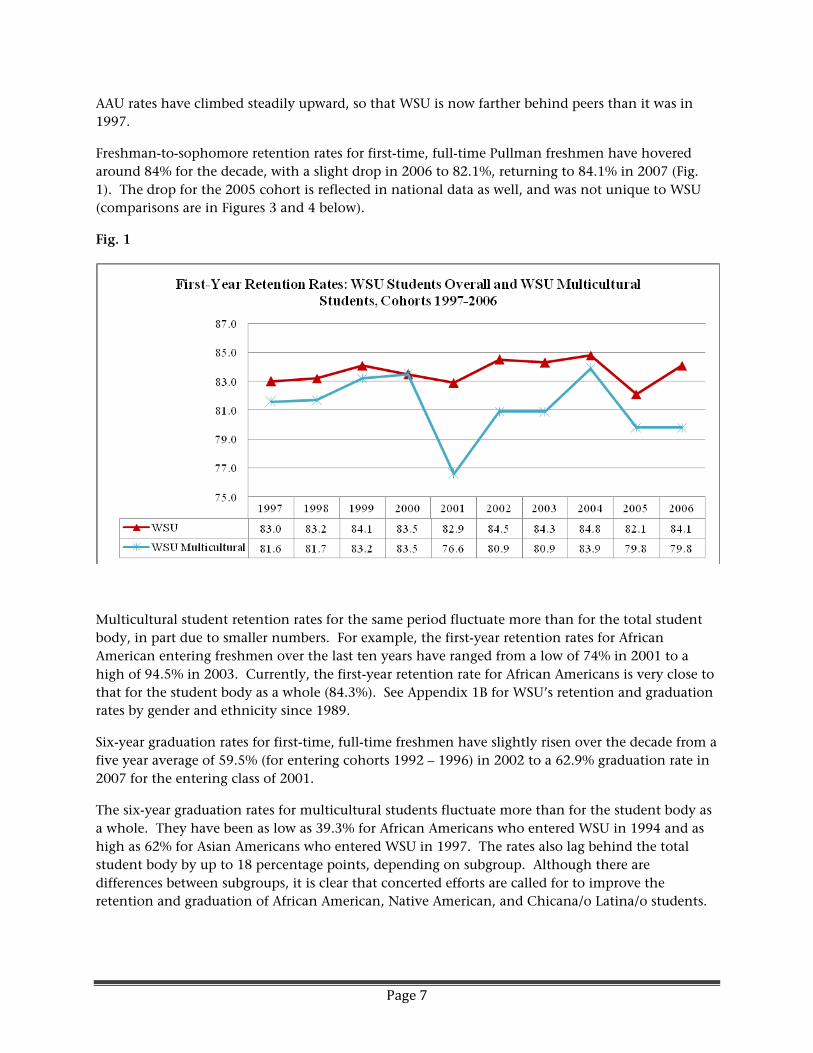
Freshman-to-sophomore retention rates for first-time, full-time Pullman freshmen have hovered around 84% for the decade, with a slight drop in 2006 to 82.1%, returning to 84.1% in 2007 (Fig. 1). The drop for the 2005 cohort is reflected in national data as well, and was not unique to WSU (comparisons are in Figures 3 and 4 below).
Fig. 1
Multicultural student retention rates for the same period fluctuate more than for the total student body, in part due to smaller numbers. For example, the first-year retention rates for African American entering freshmen over the last ten years have ranged from a low of 74% in 2001 to a high of 94.5% in 2003. Currently, the first-year retention rate for African Americans is very close to that for the student body as a whole (84.3%). See Appendix 1B for WSU’s retention and graduation rates by gender and ethnicity since 1989.
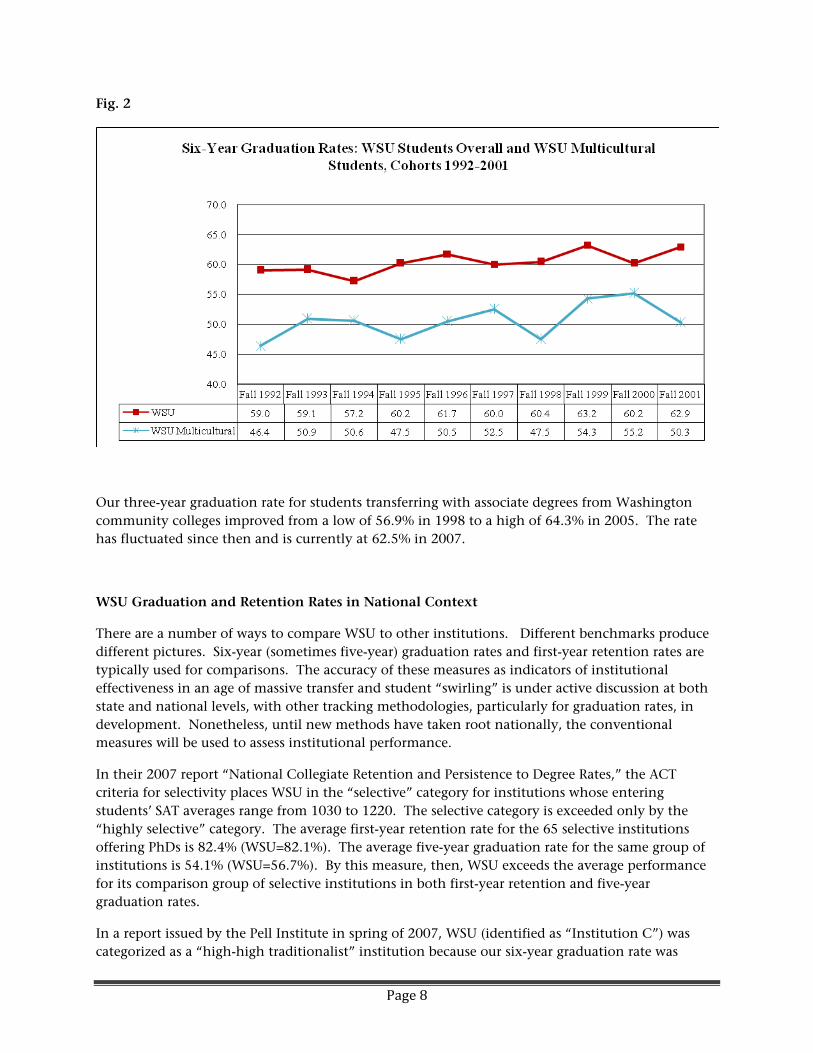
Six-year graduation rates for first-time, full-time freshmen have slightly risen over the decade from a five year average of 59.5% (for entering cohorts 1992 – 1996) in 2002 to a 62.9% graduation rate in 2007 for the entering class of 2001.
The six-year graduation rates for multicultural students fluctuate more than for the student body as a whole. They have been as low as 39.3% for African Americans who entered WSU in 1994 and as high as 62% for Asian Americans who entered WSU in 1997. The rates also lag behind the total student body by up to 18 percentage points, depending on subgroup. Although there are differences between subgroups, it is clear that concerted efforts are called for to improve the retention and graduation of African American, Native American, and Chicana/o Latina/o students.
Page 8
Fig. 2
Our three-year graduation rate for students transferring with associate degrees from Washington community colleges improved from a low of 56.9% in 1998 to a high of 64.3% in 2005. The rate has fluctuated since then and is currently at 62.5% in 2007.
WSU Graduation and Retention Rates in National Context
There are a number of ways to compare WSU to other institutions. Different benchmarks produce different pictures. Six-year (sometimes five-year) graduation rates and first-year retention rates are typically used for comparisons. The accuracy of these measures as indicators of institutional effectiveness in an age of massive transfer and student “swirling” is under active discussion at both state and national levels, with other tracking methodologies, particularly for graduation rates, in development. Nonetheless, until new methods have taken root nationally, the conventional measures will be used to assess institutional performance.
In their 2007 report “National Collegiate Retention and Persistence to Degree Rates,” the ACT criteria for selectivity places WSU in the “selective” category for institutions whose entering students’ SAT averages range from 1030 to 1220. The selective category is exceeded only by the “highly selective” category. The average first-year retention rate for the 65 selective institutions offering PhDs is 82.4% (WSU=82.1%). The average five-year graduation rate for the same group of institutions is 54.1% (WSU=56.7%). By this measure, then, WSU exceeds the average performance for its comparison group of selective institutions in both first-year retention and five-year graduation rates.
In a report issued by the Pell Institute in spring of 2007, WSU (identified as “Institution C”) was categorized as a “high-high traditionalist” institution because our six-year graduation rate was
Page 9
higher than predicted based upon the academic profile of admitted and enrolled students, and because we have a six-year graduation rate higher than the national average. This good news may be tempered by erroneous data having been submitted in the past, which skewed our students’ academic profile too low, thus lowering the predicted graduation rate and inflating the gap between predicted and actual rates.
A different picture emerges when we juxtapose ourselves against WSU’s traditionally defined peers and aspirational peers.
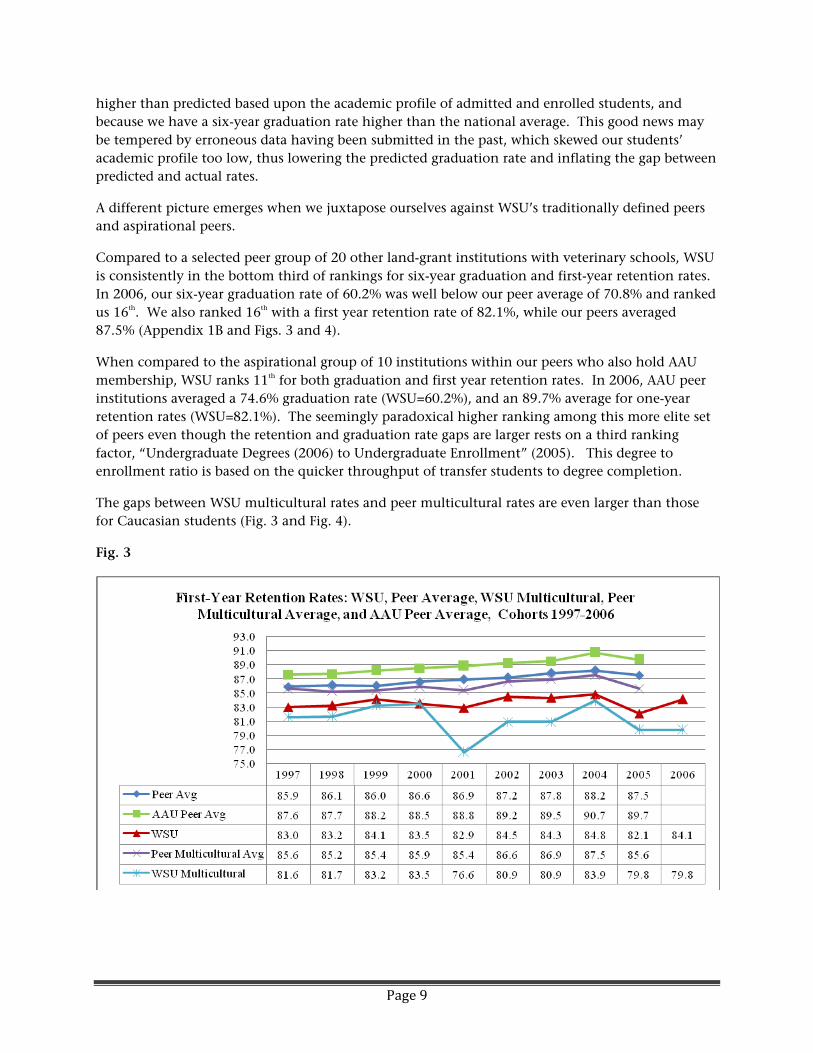
Compared to a selected peer group of 20 other land-grant institutions with veterinary schools, WSU is consistently in the bottom third of rankings for six-year graduation and first-year retention rates. In 2006, our six-year graduation rate of 60.2% was well below our peer average of 70.8% and ranked us 16th. We also ranked 16th with a first year retention rate of 82.1%, while our peers averaged 87.5% (Appendix 1B and Figs. 3 and 4).
When compared to the aspirational group of 10 institutions within our peers who also hold AAU membership, WSU ranks 11th for both graduation and first year retention rates. In 2006, AAU peer institutions averaged a 74.6% graduation rate (WSU=60.2%), and an 89.7% average for one-year retention rates (WSU=82.1%). The seemingly paradoxical higher ranking among this more elite set of peers even though the retention and graduation rate gaps are larger rests on a third ranking factor, “Undergraduate Degrees (2006) to Undergraduate Enrollment” (2005). This degree to enrollment ratio is based on the quicker throughput of transfer students to degree completion.
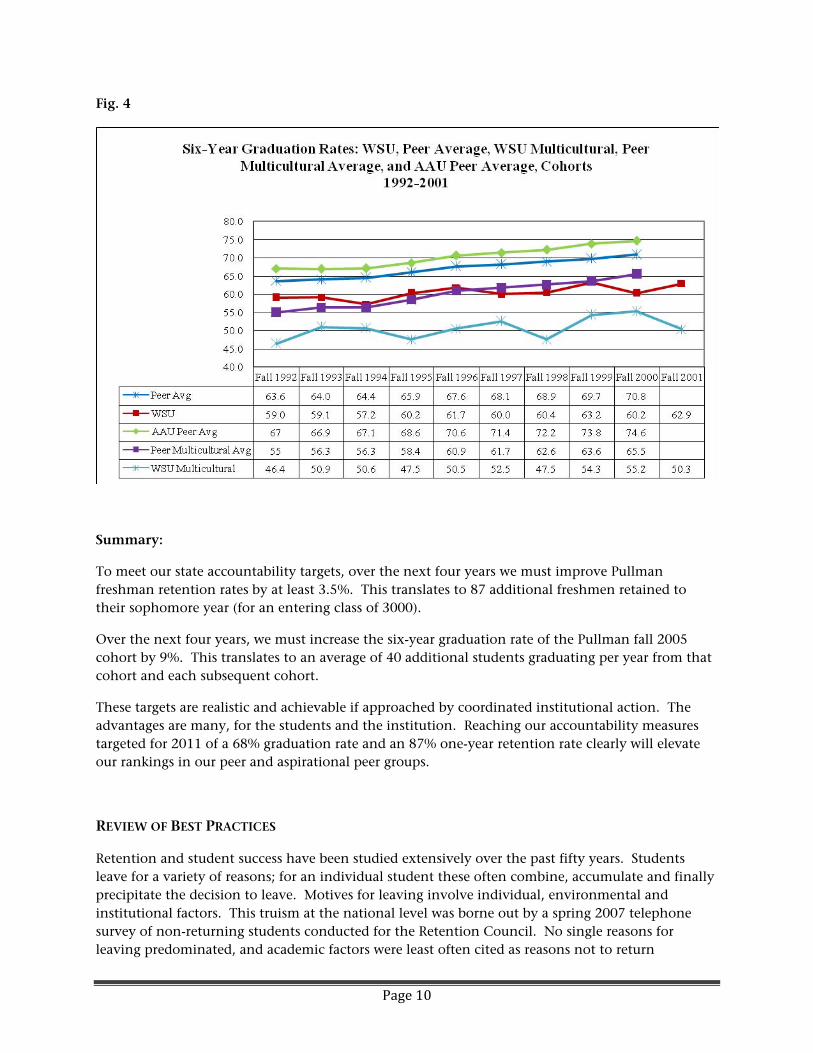
The gaps between WSU multicultural rates and peer multicultural rates are even larger than those for Caucasian students (Fig. 3 and Fig. 4).
Fig. 3
Page 10
Fig. 4
Summary:
To meet our state accountability targets, over the next four years we must improve Pullman freshman retention rates by at least 3.5%. This translates to 87 additional freshmen retained to their sophomore year (for an entering class of 3000).
Over the next four years, we must increase the six-year graduation rate of the Pullman fall 2005 cohort by 9%. This translates to an average of 40 additional students graduating per year from that cohort and each subsequent cohort.
These targets are realistic and achievable if approached by coordinated institutional action. The advantages are many, for the students and the institution. Reaching our accountability measures targeted for 2011 of a 68% graduation rate and an 87% one-year retention rate clearly will elevate our rankings in our peer and aspirational peer groups.
REVIEW OF BEST PRACTICES
Retention and student success have been studied extensively over the past fifty years. Students leave for a variety of reasons; for an individual student these often combine, accumulate and finally precipitate the decision to leave. Motives for leaving involve individual, environmental and institutional factors. This truism at the national level was borne out by a spring 2007 telephone survey of non-returning students conducted for the Retention Council. No single reasons for leaving predominated, and academic factors were least often cited as reasons not to return
Page 11
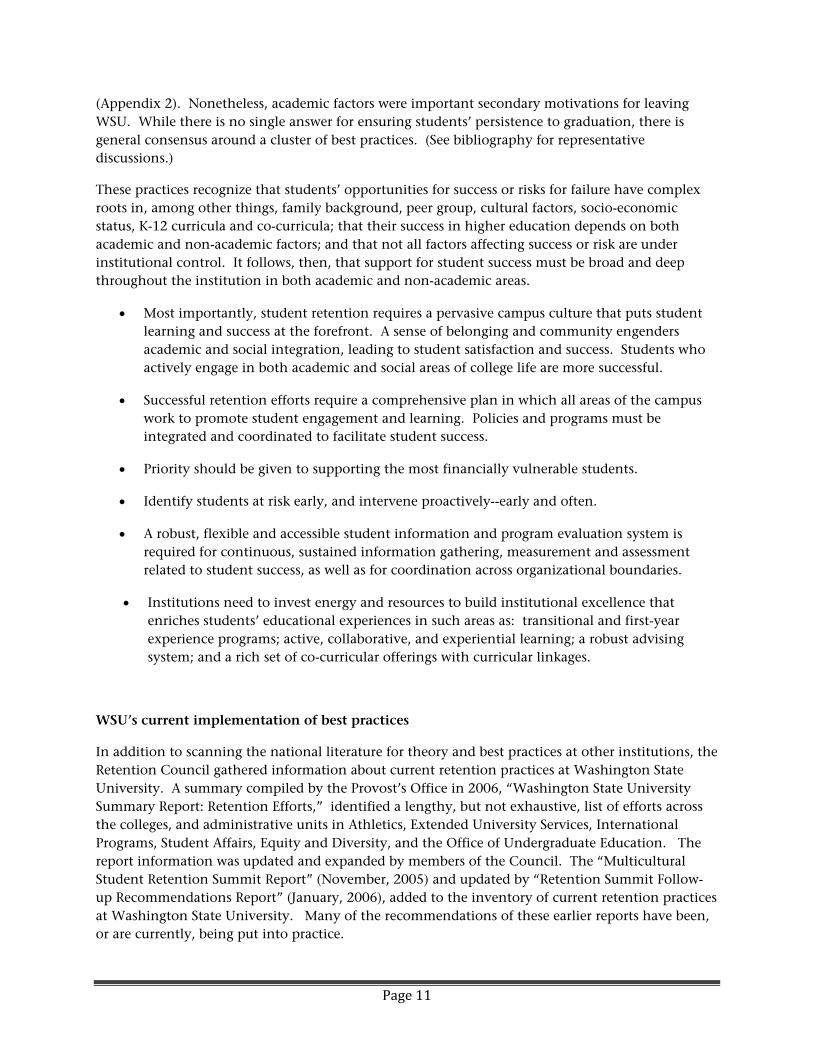
(Appendix 2). Nonetheless, academic factors were important secondary motivations for leaving WSU. While there is no single answer for ensuring students’ persistence to graduation, there is general consensus around a cluster of best practices. (See bibliography for representative discussions.)
These practices recognize that students’ opportunities for success or risks for failure have complex roots in, among other things, family background, peer group, cultural factors, socio-economic status, K-12 curricula and co-curricula; that their success in higher education depends on both academic and non-academic factors; and that not all factors affecting success or risk are under institutional control. It follows, then, that support for student success must be broad and deep throughout the institution in both academic and non-academic areas.
Most importantly, student retention requires a pervasive campus culture that puts student learning and success at the forefront. A sense of belonging and community engenders academic and social integration, leading to student satisfaction and success. Students who actively engage in both academic and social areas of college life are more successful.
Successful retention efforts require a comprehensive plan in which all areas of the campus work to promote student engagement and learning. Policies and programs must be integrated and coordinated to facilitate student success.
Priority should be given to supporting the most financially vulnerable students.
Identify students at risk early, and intervene proactively--early and often.
A robust, flexible and accessible student information and program evaluation system is required for continuous, sustained information gathering, measurement and assessment related to student success, as well as for coordination across organizational boundaries.
Institutions need to invest energy and resources to build institutional excellence that enriches students’ educational experiences in such areas as: transitional and first-year experience programs; active, collaborative, and experiential learning; a robust advising system; and a rich set of co-curricular offerings with curricular linkages.
WSU’s current implementation of best practices
In addition to scanning the national literature for theory and best practices at other institutions, the Retention Council gathered information about current retention practices at Washington State University. A summary compiled by the Provost’s Office in 2006, “Washington State University Summary Report: Retention Efforts,” identified a lengthy, but not exhaustive, list of efforts across the colleges, and administrative units in Athletics, Extended University Services, International Programs, Student Affairs, Equity and Diversity, and the Office of Undergraduate Education. The report information was updated and expanded by members of the Council. The “Multicultural Student Retention Summit Report” (November, 2005) and updated by “Retention Summit Follow-up Recommendations Report” (January, 2006), added to the inventory of current retention practices at Washington State University. Many of the recommendations of these earlier reports have been, or are currently, being put into practice.
Page 12
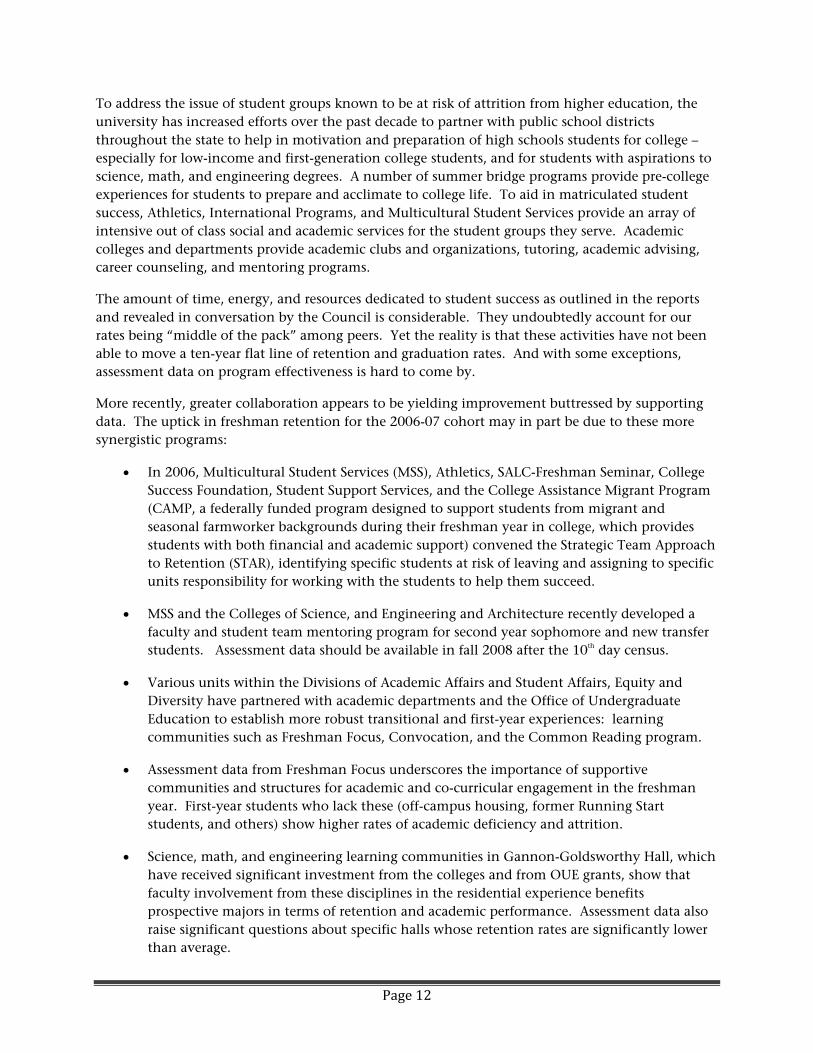
To address the issue of student groups known to be at risk of attrition from higher education, the university has increased efforts over the past decade to partner with public school districts throughout the state to help in motivation and preparation of high schools students for college – especially for low-income and first-generation college students, and for students with aspirations to science, math, and engineering degrees. A number of summer bridge programs provide pre-college experiences for students to prepare and acclimate to college life. To aid in matriculated student success, Athletics, International Programs, and Multicultural Student Services provide an array of intensive out of class social and academic services for the student groups they serve. Academic colleges and departments provide academic clubs and organizations, tutoring, academic advising, career counseling, and mentoring programs.
The amount of time, energy, and resources dedicated to student success as outlined in the reports and revealed in conversation by the Council is considerable. They undoubtedly account for our rates being “middle of the pack” among peers. Yet the reality is that these activities have not been able to move a ten-year flat line of retention and graduation rates. And with some exceptions, assessment data on program effectiveness is hard to come by.
More recently, greater collaboration appears to be yielding improvement buttressed by supporting data. The uptick in freshman retention for the 2006-07 cohort may in part be due to these more synergistic programs:
In 2006, Multicultural Student Services (MSS), Athletics, SALC-Freshman Seminar, College Success Foundation, Student Support Services, and the College Assistance Migrant Program (CAMP, a federally funded program designed to support students from migrant and seasonal farmworker backgrounds during their freshman year in college, which provides students with both financial and academic support) convened the Strategic Team Approach to Retention (STAR), identifying specific students at risk of leaving and assigning to specific units responsibility for working with the students to help them succeed.
MSS and the Colleges of Science, and Engineering and Architecture recently developed a faculty and student team mentoring program for second year sophomore and new transfer students. Assessment data should be available in fall 2008 after the 10th day census.
Various units within the Divisions of Academic Affairs and Student Affairs, Equity and Diversity have partnered with academic departments and the Office of Undergraduate Education to establish more robust transitional and first-year experiences: learning communities such as Freshman Focus, Convocation, and the Common Reading program.
Assessment data from Freshman Focus underscores the importance of supportive communities and structures for academic and co-curricular engagement in the freshman year. First-year students who lack these (off-campus housing, former Running Start students, and others) show higher rates of academic deficiency and attrition.
Science, math, and engineering learning communities in Gannon-Goldsworthy Hall, which have received significant investment from the colleges and from OUE grants, show that faculty involvement from these disciplines in the residential experience benefits prospective majors in terms of retention and academic performance. Assessment data also raise significant questions about specific halls whose retention rates are significantly lower than average.
Page 13
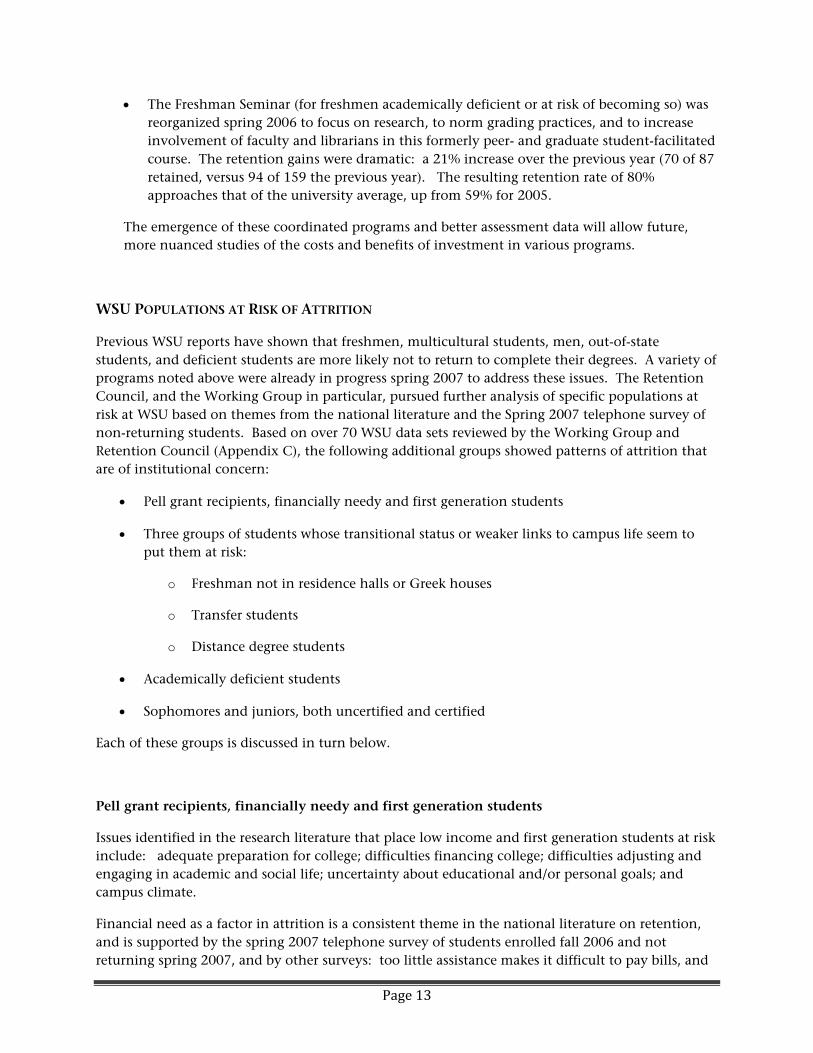
The Freshman Seminar (for freshmen academically deficient or at risk of becoming so) was reorganized spring 2006 to focus on research, to norm grading practices, and to increase involvement of faculty and librarians in this formerly peer- and graduate student-facilitated course. The retention gains were dramatic: a 21% increase over the previous year (70 of 87 retained, versus 94 of 159 the previous year). The resulting retention rate of 80% approaches that of the university average, up from 59% for 2005.
The emergence of these coordinated programs and better assessment data will allow future, more nuanced studies of the costs and benefits of investment in various programs.
WSU POPULATIONS AT RISK OF ATTRITION
Previous WSU reports have shown that freshmen, multicultural students, men, out-of-state students, and deficient students are more likely not to return to complete their degrees. A variety of programs noted above were already in progress spring 2007 to address these issues. The Retention Council, and the Working Group in particular, pursued further analysis of specific populations at risk at WSU based on themes from the national literature and the Spring 2007 telephone survey of non-returning students. Based on over 70 WSU data sets reviewed by the Working Group and Retention Council (Appendix C), the following additional groups showed patterns of attrition that are of institutional concern:
Pell grant recipients, financially needy and first generation students
Three groups of students whose transitional status or weaker links to campus life seem to put them at risk:
o Freshman not in residence halls or Greek houses
o Transfer students
o Distance degree students
Academically deficient students
Sophomores and juniors, both uncertified and certified
Each of these groups is discussed in turn below.
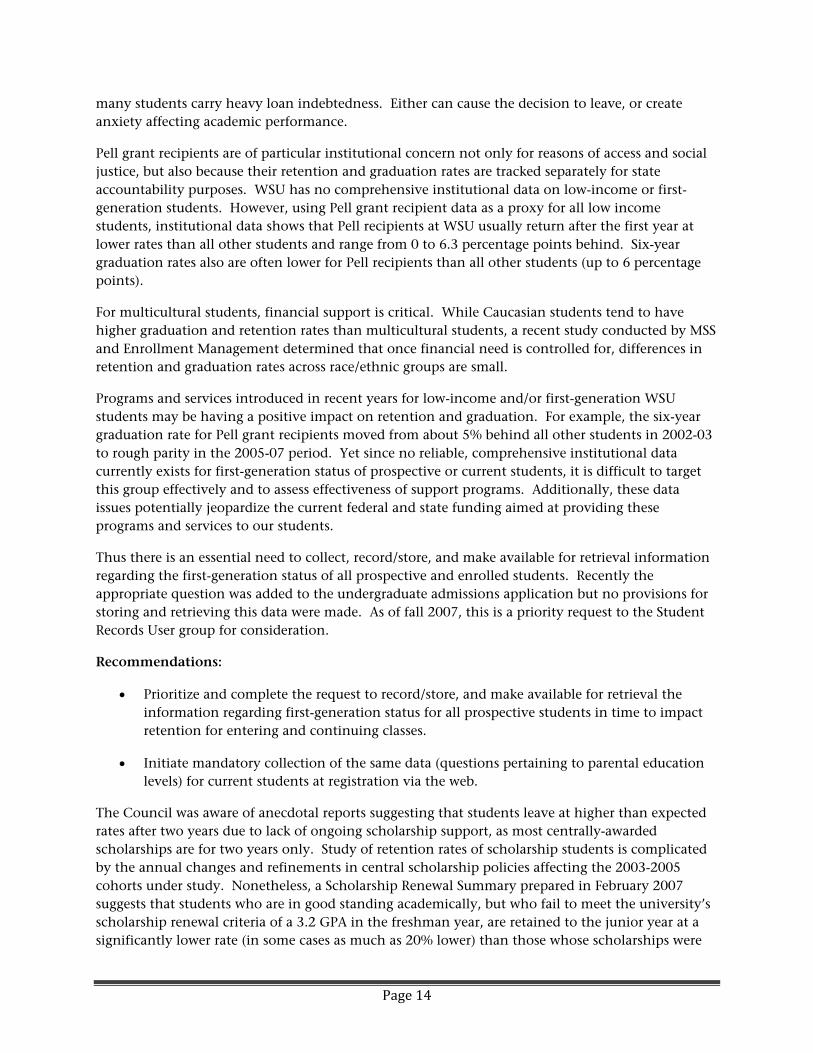
Pell grant recipients, financially needy and first generation students
Issues identified in the research literature that place low income and first generation students at risk include: adequate preparation for college; difficulties financing college; difficulties adjusting and engaging in academic and social life; uncertainty about educational and/or personal goals; and campus climate.
Financial need as a factor in attrition is a consistent theme in the national literature on retention, and is supported by the spring 2007 telephone survey of students enrolled fall 2006 and not returning spring 2007, and by other surveys: too little assistance makes it difficult to pay bills, and
Page 14
many students carry heavy loan indebtedness. Either can cause the decision to leave, or create anxiety affecting academic performance.
Pell grant recipients are of particular institutional concern not only for reasons of access and social justice, but also because their retention and graduation rates are tracked separately for state accountability purposes. WSU has no comprehensive institutional data on low-income or first-generation students. However, using Pell grant recipient data as a proxy for all low income students, institutional data shows that Pell recipients at WSU usually return after the first year at lower rates than all other students and range from 0 to 6.3 percentage points behind. Six-year graduation rates also are often lower for Pell recipients than all other students (up to 6 percentage points).
For multicultural students, financial support is critical. While Caucasian students tend to have higher graduation and retention rates than multicultural students, a recent study conducted by MSS and Enrollment Management determined that once financial need is controlled for, differences in retention and graduation rates across race/ethnic groups are small.
Programs and services introduced in recent years for low-income and/or first-generation WSU students may be having a positive impact on retention and graduation. For example, the six-year graduation rate for Pell grant recipients moved from about 5% behind all other students in 2002-03 to rough parity in the 2005-07 period. Yet since no reliable, comprehensive institutional data currently exists for first-generation status of prospective or current students, it is difficult to target this group effectively and to assess effectiveness of support programs. Additionally, these data issues potentially jeopardize the current federal and state funding aimed at providing these programs and services to our students.
Thus there is an essential need to collect, record/store, and make available for retrieval information regarding the first-generation status of all prospective and enrolled students. Recently the appropriate question was added to the undergraduate admissions application but no provisions for storing and retrieving this data were made. As of fall 2007, this is a priority request to the Student Records User group for consideration.
Recommendations:
Prioritize and complete the request to record/store, and make available for retrieval the information regarding first-generation status for all prospective students in time to impact retention for entering and continuing classes.
Initiate mandatory collection of the same data (questions pertaining to parental education levels) for current students at registration via the web.
The Council was aware of anecdotal reports suggesting that students leave at higher than expected rates after two years due to lack of ongoing scholarship support, as most centrally-awarded scholarships are for two years only. Study of retention rates of scholarship students is complicated by the annual changes and refinements in central scholarship policies affecting the 2003-2005 cohorts under study. Nonetheless, a Scholarship Renewal Summary prepared in February 2007 suggests that students who are in good standing academically, but who fail to meet the university’s scholarship renewal criteria of a 3.2 GPA in the freshman year, are retained to the junior year at a significantly lower rate (in some cases as much as 20% lower) than those whose scholarships were
Page 15
renewed a second year. This dynamic is especially visible in the UAA and CAA awards, which impact the largest number of students.
Recommendations:
Revisit criteria for renewal of scholarships and consider thresholds below 3.2 GPA.
Conduct a follow-up study of the retention effects of raising the renewal GPA of the UAA award from 3.0 to 3.2 GPA.
Continue annual monitoring of scholarship policies for impacts on retention.
Since so much of WSU’s scholarship money is located in the colleges, WSU has evolved a central-decentralized model of scholarship funding. Central awards for the first two years are intended to be picked up by the colleges for the next two. Additionally, some colleges may “stack” scholarship awards on the central awards during the first two years. The Achilles heel of the system is the vast difference among the colleges in available scholarship resources. Thus, students’ chances of obtaining scholarship funding after the second year depend, not so much on merit or financial need, but on the scholarship wealth of the major they have declared. Some faculty and program administrators have suspected that this might be a factor in attrition at the upper division, especially in majors with less scholarship wealth.
With this in mind, the Council examined GPA and retention data for the Fall 2003 freshman cohort of central scholarship winners. This data does not support the hypothesis that in and of itself, loss of central scholarship funding after the second year triggers attrition. However, it does reinforce the need to continue investigation of multiply-interacting factors affecting persistence (e.g., finances, social integration, academics) particularly for out-of-state and multicultural students.
Recommendations:
Scholarship policies should be coordinated among the Enrollment Management division, college deans, and Student Affairs, Equity and Diversity in order to structure optimal “stacking” of central and college dollars. Greater use of four-year awards should be considered.
The Office of Financial Aid, with assistance as needed from Admissions, Institutional Research, and Information Technology Services, should identify students at risk of attrition for financial reasons and communicate that information on a regular basis to units that have a role in funding or advising students.
The Office of Enrollment Management, in collaboration with the academic colleges, should take the lead in assessing the effectiveness of improved scholarship and financial aid processes in terms of retention outcomes.
Need-based scholarships should be a fundraising priority during the campaign.
The Working Group was concerned about the potential for low-income students’ employment to affect their persistence adversely, by interfering with the time needed for academics. Examination of Pell grant recipients who were employed on campus (the only reliable employment data that we have) showed that student employment seems overall to assist students’ performance and retention if a moderate number of hours was worked. The exception to this finding is for low-income
Page 16
freshmen: work-study experience in the first year may place low income freshmen at risk of attrition.
Recommendation:
To the extent possible, package financial aid such that low income students do not have to work in their first, transitional year.
Attrition Patterns by Academic Standing
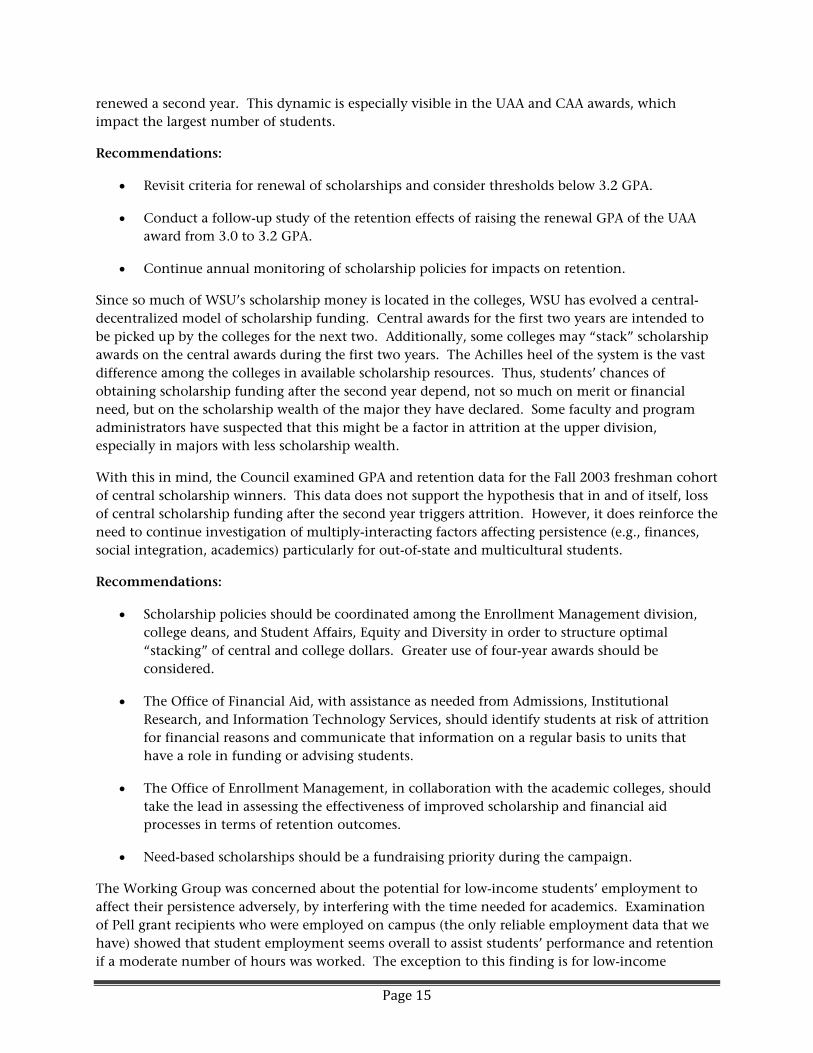
A one-year snapshot of attrition by various academic statuses underscores the importance of the first year (whether for freshmen or transfer students). It also reveals (Fig. 5) that the majority of non-returning students are not first-time freshman entrants into higher education, or transfer students in their first year at WSU, but continuing students:
Fig. 5
Attrition ‐ New and Continuing Undergraduates (Fall 2005 to Fall 2006)
Continuing 59.6% 1165
New Freshmen 26.9% 526
New Transfers 13.5% 264
100% 1955
59.6%26.9%
13.5%
Attrition ‐ New and Continuing Undergraduates (Fall 2005 to Fall 2006)
Continuing
New Freshmen
New Transfers
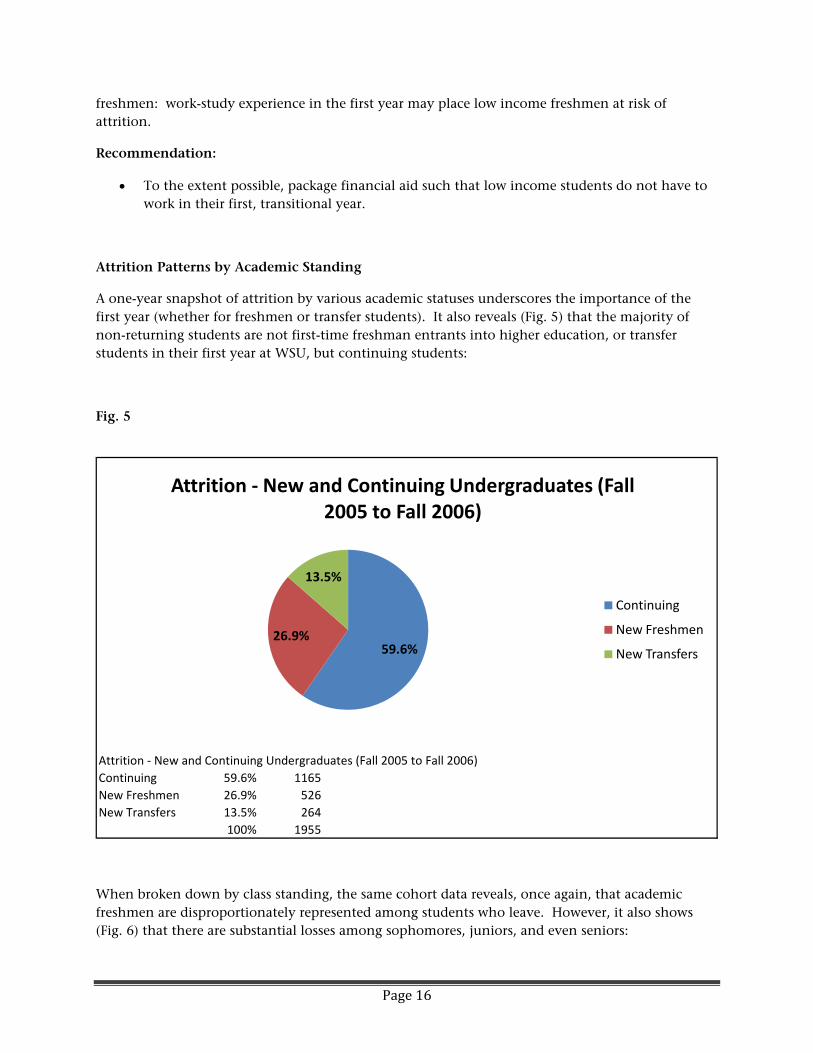
When broken down by class standing, the same cohort data reveals, once again, that academic freshmen are disproportionately represented among students who leave. However, it also shows (Fig. 6) that there are substantial losses among sophomores, juniors, and even seniors:
Page 17
Fig. 6
Attrition ‐ All Undergraduates by Class Standing (Fall 2005 to Fall 2006)
Freshmen 38% 739
Sophomores 23% 451
Juniors 22% 438
Seniors 17% 327
100% 1955
38%
23%
22%
17%
Attrition ‐ All Undergraduates by Class Standing (Fall 2005 to Fall 2006)
Freshmen
Sophomores
Juniors
Seniors
Freshmen
Retaining students through and beyond the freshman year is the bedrock of institutional retention plans across the country, as six-year graduation rates are calculated on cohorts of entering freshmen. The growing attention to the freshman year experience at WSU, as manifested by new mandatory orientation policies, transitional programs such as Convocation and Common Reading, and learning communities such as Freshman Focus, Freshman Seminar, and the Gannon-Goldsworthy Science-Math-Engineering community, are promising steps toward a first-year experience oriented toward student success. The Retention Council nonetheless recognizes there is still considerable strategic work to be done to achieve this goal.
Recommendation:
Form a team of representatives from relevant offices for a Freshman Year Success Program, whose mission it will be to assess and coordinate programs for the overall success of freshmen students, and to communicate support needs to the relevant administrators.
In examining attrition data for freshmen more closely, the Council discovered that freshmen who got waivers from the first-year live-in rule were 50% more likely not to return to WSU than students living in residence halls or Greek housing (74% vs. 82% in 2005). These students petitioned for the exception based on health, religious, or family reasons. This is congruent with the finding in the retention literature that freshmen who are not well integrated and engaged in the campus
Page 18
community, and who lack robust community support systems, are at risk of attrition. This finding was subsequently corroborated by assessment data from the 2006 Freshman Focus cohort. While the N is relatively small, bringing the retention rate for this group to the university average would in itself cover 10% of our first-year retention target.
Accordingly, the waiver policy for the live-in rule was immediately changed in summer 2007 to require an informed consent signature for the higher level of risk of attrition. Additionally, the new policy attempted to spread a safety net up front by requiring various interviews with university staff before the beginning of the semester (Financial Aid, Counseling Services, SALC Advisor). Of the 70 required to see an advisor, only 30 actually did so in Fall 07. This “natural experiment” will allow determination of retention differences between the two groups, and thus of the effectiveness of these interventions in fall 2008.
Recommendation:
SALC should assess effectiveness of this policy change with fall-to-spring and fall-to-fall retention data.
Housing
Since the spring 2007 Telephone Survey of non-returning students indicated that housing ranked lower than many other factors among their concerns, the Council did not make this an initial focus of investigation. However, once the consequences of not living in university-approved housing came to light, the Council reviewed other reports with an eye to housing issues. Data on freshman academic performance broken out by residence hall showed that at least one hall is of concern in its association with residents’ substantially lower retention rates.
Recommendations:
Housing, Residence Life, SALC and the Director of Learning Communities should investigate whether changes in policy or practice around Stephenson Hall assignments can improve its retention rates.
This group, or a similarly constituted task force including representatives involved with residential learning communities, should determine whether emerging assessment data on academic performance and retention by hall suggests additional changes to housing policies and practices.
“High-risk” courses
Student success in the first year is the foundation for retention and graduation. Data from Fall 2006 showed that many commonly required or commonly taken freshman courses are “high risk” for students, with failing grades of C- (for certain majors), D, F, or W (withdrawals after the 9th week) equaling or exceeding 25% of all grades awarded in the course or section. A freshman first-semester schedule that contains multiple courses of this type clearly puts the student at risk of academic deficiency, and creates a first-year experience stamped by widespread academic failure. Several colleges represented on the Retention Council conducted their own follow-up studies and are
Page 19
working with freshman year faculty to interpret and act on the results. The goal is not to lower academic standards, but to offer well-designed, well-taught first-year courses to students who are academically prepared and who are placed into the right level courses.
Recommendations:
Student Affairs, Equity and Diversity in cooperation with ITS should create a Web-based early alert system to identify freshmen who are at academic risk, particularly in the first semester (AwareNet to be implemented spring 2008), and trigger follow-up action by appropriate offices.
The Vice Provost for Undergraduate Education, Institutional Research, the academic colleges and CPDE should conduct follow-up studies of “high-risk courses,” academic deficiency, and retention patterns to determine appropriate actions at the department level where these courses are taught.
Faculty selection and faculty development programs for instructors of lower-division courses must remain an institutional priority. Lead units include the academic colleges, the Graduate School, the OUE, the Provost’s Office, the Teaching Academy, and CTLT.
The Provost and the Vice President for SAED should insure sufficient funding and support for first-year programs aimed at student success.
Class size reduction in first-year/lower division courses must remain a goal within an overall first-year student success agenda.
Academic deficiency
The spring 2007 telephone survey of students who left, and follow-up analyses of attrition by college, indicate that academic deficiency, while important, is not primary among causes for attrition (Appendix 2). However, concerns over academic performance are an important secondary consideration for students who leave. The impact of academic deficiency differs among student subgroups. 31% of sophomores leaving were deficient, but only 16% of juniors.
There was concern among the Retention Council and Working Group over the apparent paradox that despite having demonstrably more qualified entering students than five or ten years ago, the academic deficiency rates appear to be increasing rather than decreasing as might be expected. The freshman first-semester deficiency rate in Pullman fell from a high of 19% in 2000 to a low of 12.3% in 2004, yet rose to 16.8% in 2006. The overall rate of deficiency in fall ‘06 was approximately 5%.
The Council followed up with additional inquiries regarding changes to academic regulations affecting academic deficiency status, and freshman year grading practices (see above) contributing to deficiency. In response to the strategic plan’s call for quality in a variety of university endeavors, Faculty Senate changes to academic deficiency regulations in 2003 resulted in a more stringent process for those students who were academically deficient. Deficiency was redefined to include either a cumulative GPA below 2.0, OR (for the first time) a semester GPA below 2.0. Students deficient for the first time were required to have a face to face interview with an advisor. A related academic regulation was changed to a dismissal rule, referred to as “two strikes and you’re out”:
Page 20
two deficient semesters and the student was to be dismissed from the university. The effect of this rule on retention is not known. Recently, the dismissal rule has been deleted and now all students who are academically deficient for the first time, whether in terms of semester or cumulative GPA, are required to have an interview with an advisor in the Student Advising and Learning Center. In line with findings at other institutions, it is hoped that this stronger and earlier intervention will reduce repeated academic deficiency and thus contribute to improved retention and graduation rates.
Recommendations:
SALC should track fall 2007 deficiency and retention rates to determine, in conjunction with the Faculty Senate, whether the policy changes regarding academic deficiency have been effective.
Transfer Students
Among the least visible student sub-groups, transfer students are even more at risk of attrition than freshmen, possibly because they enter with even greater variation in academic preparedness and life circumstances. Unlike freshmen, they tend not to cluster in given courses, and are virtually impossible for departments and faculty to recognize in the ebb and flow of students through their courses.
Calculating historical data on retention of transfer students is problematic because of the range of transfer credits on entry, the range of prior institutions attended, and the level of commitment to current education (i.e. full-time vs. part-time at each of WSU’s campuses). One study of the transfer student cohort entering fall 2005 revealed a one-year attrition rate of 30% across all WSU campuses, and a 20.11% attrition rate for students at the Pullman campus. On the Pullman campus, the freshmen entering fall ‘05 and not returning in fall ‘06 combined with the 264 first year transfers not returning fall ‘06 to account for 40% of all students who did not return. Academic deficiency seems to have pronounced effect on transfer students, with 40% of transfers leaving in an academically deficient status.
Transfer students may be at an additional risk if they enter the university ready to certify into a major only to find that the requirements are such that additional courses or a higher grade point average is necessary to certify. Unable to certify, transfer students who already have a history of transition may find it easier to leave the university than to complete certification requirements.
Recommendations:
Continue implementing the new Transfer Team, which is committed to the success of transfer students from application to graduation, including recruitment, orientation, transcript evaluation, and academic advising (Enrollment Management, Admission, New Student Programs, SALC, MSS, and academic advisors from the colleges).
Use web-based systems to assist faculty and departmental advisors in identifying and supporting transfer students (SALC, ITS, and colleges).
Page 21
Use assessed outcomes of the model program between Multicultural Student Services and Engineering to mentor transfer students as a basis for similar programs in other colleges.
Distance students
Students enrolling through Distance Degree Programs (DDP) are very different from the typical Pullman student (average age 35, most work full- or part-time, most have families and extended families to care for). DDP has analyzed the retention of students admitted to WSU to obtain their degrees through DDP since fall 1999. On average, about 30% of students who enroll in distance courses do not re-enroll through DDP after their first semester. Reasons are both academic (online courses are more difficult than students thought they would be) and personal (a family member became ill and the student had to take care of them, their job responsibilities increased).
In 2005 DDP course designers began working with faculty to develop “First Semester Experience (FSE)” courses which provide opportunities for students to demonstrate or acquire competence in skills needed to be successful in online classes (e.g., comfort with computer technology and software, navigating the learning management system, motivation, working in “virtual” groups). New students are required to take an FSE course during their first semester. In addition, a fifth DDP academic advisor was hired within the last year, allowing advisors to provide more “high touch” attention to their advisees. We believe both of these interventions have made a difference in student retention, as data over the past three semesters (summer ‘06, fall ‘06, and spring ‘07) shows that only 15% of students did not re-enroll for subsequent semesters.
Recommendations:
Continue monitoring of DDP retention rates in relation to those of all campuses.
Use data regarding advisor-to-student ratios in DDP to assist in advising reforms on the Pullman campus.
Sophomores and juniors, both certified and uncertified
Of the 1955 students enrolled in fall 2005 who did not return fall 2006, 45% or 889 students were sophomores or juniors, about evenly divided between the two groups.
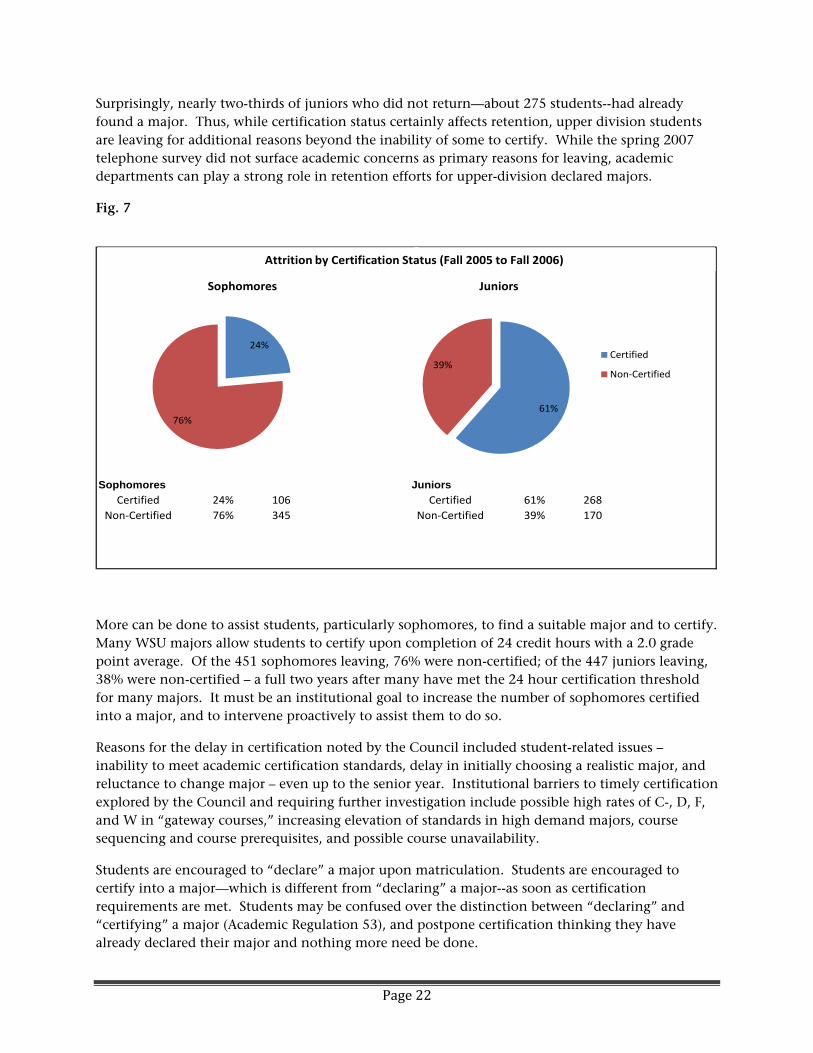
Since some of the most sought-after majors are highly “impacted,” that is, there are fewer spots for certified majors than there are students seeking those spots (e.g., Communications, Business, Nursing), the Council hypothesized that a large factor in students’ leaving might be inability to certify into a major. When the 2005-2006 cohort data was examined by certification status, the data surprisingly pointed out two different retention concerns (Fig. 7).
Three-quarters of the sophomores who left (nearly 350 students) were not certified. This is consistent with multiple data sets over multiple years that show higher attrition rates for students undecided on an academic area or major. It further underscores the need articulated in the 2004 “Undergraduate Academic Progress Report” that students should be vigorously encouraged to declare an academic interest as early as possible after matriculation.
Page 22
Surprisingly, nearly two-thirds of juniors who did not return—about 275 students--had already found a major. Thus, while certification status certainly affects retention, upper division students are leaving for additional reasons beyond the inability of some to certify. While the spring 2007 telephone survey did not surface academic concerns as primary reasons for leaving, academic departments can play a strong role in retention efforts for upper-division declared majors.
Fig. 7
Sophomores Juniors
Certified 24% 106 Certified 61% 268
Non‐Certified 76% 345 Non‐Certified 39% 170
24%
76%
Sophomores
61%
39%
Juniors
Certified
Non‐Certified
Attrition by Certification Status (Fall 2005 to Fall 2006)
More can be done to assist students, particularly sophomores, to find a suitable major and to certify. Many WSU majors allow students to certify upon completion of 24 credit hours with a 2.0 grade point average. Of the 451 sophomores leaving, 76% were non-certified; of the 447 juniors leaving, 38% were non-certified – a full two years after many have met the 24 hour certification threshold for many majors. It must be an institutional goal to increase the number of sophomores certified into a major, and to intervene proactively to assist them to do so.
Reasons for the delay in certification noted by the Council included student-related issues – inability to meet academic certification standards, delay in initially choosing a realistic major, and reluctance to change major – even up to the senior year. Institutional barriers to timely certification explored by the Council and requiring further investigation include possible high rates of C-, D, F, and W in “gateway courses,” increasing elevation of standards in high demand majors, course sequencing and course prerequisites, and possible course unavailability.
Students are encouraged to “declare” a major upon matriculation. Students are encouraged to certify into a major—which is different from “declaring” a major--as soon as certification requirements are met. Students may be confused over the distinction between “declaring” and “certifying” a major (Academic Regulation 53), and postpone certification thinking they have already declared their major and nothing more need be done.
Page 23
Recommendations:
Develop a comprehensive strategy for assisting students to certify a major in a timely fashion, e.g.:
o Develop message to freshmen detailing path to major selection (Career Services, SALC, college representatives).
o Implement a telecounseling process for freshmen and sophomore students whereby students are contacted early in fall semester with relevant questions and support (Admissions, Telecounseling, SALC).
o Support major selection for sophomores by sending students with 30+ credits who have not yet certified a message detailing benefits of major selection and certification (Career Services, SALC, academic departments).
o Develop podcasting program to provide regular broadcasts regarding advising, deadlines, changes, and other curricular messages (SALC).
Reinvigorate a standing committee, the Academic Advising and Reinstatement Subcommittee of the Faculty Senate’s Academic Affairs Committee, which should, among other responsibilities, re-examine the language of Academic Rule 53 on certification and change as needed.
Two aspects of certification requirements may affect retention patterns. First, many majors have a variety of requirements above and beyond good academic standing that must be fulfilled before certifying into that major. Some of these selective certification requirements may be unnecessary obstacles for students who wish to certify.
Second, certification requirements for departments can and do change. Students, thinking they are on the right path and not yet in contact with departmental advisors, may not realize that changes have been made in specific major certification requirements until they are ready to certify. For example, a higher overall GPA may be needed, or a higher GPA in certain required core courses. The discovery that a student cannot certify, or will need extra time (and therefore money) to do so, may be a key factor in the decision to leave the university.
A related study was conducted by the Council of the 2003-2005 incoming students to determine the first-to-second-year migratory patterns of students over the past three years as they change majors across colleges. Most students stayed in their initial college of choice, but the next largest group left the university, with a small number moving to another college, mostly to the College of Liberal Arts (data set “First to Second Year Field of Study Migration”). Students seem to tenaciously hold on to their initial choice of major – even up to the senior year (“Pullman Undergraduate Retention Rates by Year, Class Standing, and College”) and leave when it seems they will be unable to certify.
Recommendations:
Examine selective certification requirements and remove unnecessary barriers to certification (departments, Academic Advising and Reinstatement Subcommittee, and SALC).
Page 24
Certified majors
The reasons for certified students to leave are unclear. Over 43% of sophomores and juniors leaving had certified into a major, with fewer than 10% of them academically deficient. For many of these, in keeping with the Spring 2007 telephone survey and the national literature, personal and financial reasons may well have tipped the balance.
In order for strategic interventions to be developed, further investigation at department levels is needed to determine why certified students in good academic standing choose to leave – particularly those with only one or two more years to graduation. Are students not able to access support services to solve personal, health, or financial challenges? Are departing students clustered in some majors rather than others? If so, are there issues in those departments that would affect student persistence, such as lack of access to advisors, or inability to get courses for the major? Follow-up analysis is clearly warranted, as retaining these students will boost graduation rates in the shorter term.
In reviewing the academic advising report of 2006, the Council discussed the need to improve and modify the advising system in order better to assist students in their selection of an appropriate major early on, the need to use the advising system to redirect students unable to certify into impacted majors, and as an improved information system for advisors and students to provide clear and comprehensive information for course selection and academic planning.
Currently, many students are advised in departments across campus as “declared” majors. Specific departmental advising is thought to be advantageous to students. However, when students change majors, or fail to certify, departmental advisors are often not equipped to help them move to the next major. There is no orchestrated way to ensure that students take the correct courses and get good advising in the handoff process.
Recommendations:
Coordinate information between SALC and prospective departments regarding students who are attempting to certify, with development of appropriate “off-ramp” support for students who must find another major (departments and SALC).
Reinvigorate a standing committee, the Academic Advising and Reinstatement Subcommittee of the Faculty Senate’s Academic Affairs Committee. Faculty and advisors on this committee should examine academic regulations, oversee training and assessment, and report both to the Provost and to AAC on recommended changes.
The February 2008 implementation of DARWIN should be accompanied by an outreach campaign to faculty and students regarding the benefits of this web-based degree-audit system. This campaign could also be a vehicle for introducing some of the advising reforms recommended in the Faculty Senate and consultants’ reports.
STRUCTURES AND PROCESSES THAT CONTRIBUTE TO ATTRITION
National studies and consensus on best practices indicate that student success efforts that result in retention gains are a responsibility shared widely across the university. Institutions with higher
Page 25
than anticipated graduation rates are often characterized by a pervasive culture of high expectations reinforced by opportunities for personal connections among students, faculty, and staff that create a sense of belonging and community. They continue operating with matriculated students as if they were still recruiting them as freshmen, in terms of the quality and intensity of contacts with the institution.
High-performing institutions recognize that retention and graduation of students who matriculate is a fundamental responsibility of the institution, not a “nice-to-do” or add-on to other responsibilities. Retention following from student success is understood to be everyone’s business, with responsibilities for developing and executing a strategic retention plan clearly assigned and communicated.
A number of areas and offices at WSU are well-versed in retention issues and many staff and faculty have stepped forward to develop programs intended to increase student success and retention. Nonetheless, the WSU community as a whole can generally be characterized as lacking awareness of retention issues and goals. Moreover, due to lack of a public retention agenda and the frequent administrative reorganizations and leadership changes in areas involved with enrollment management and student retention, formal responsibilities for retention goals and actions are diffuse or uncertain. In moving toward an institutional student success and retention agenda, lead responsibilities need to be assigned and communicated widely.
Many of the existing programs are funded contingently on temporary money, carry-forward funds, or grants. The Council had limited evidence of permanent investment in retention efforts. Year-to-year funding uncertainties, and lack of an institutional mandate, have bred a reluctance to engage in larger-scale and longer-term thinking in the face of competing priorities for staff time.
Coordination of decentralized projects/initiatives
While WSU has a large inventory of programs and services aimed at student success, some specific to improving student retention, and many of them collaborative efforts intended to be more effective by spanning organizational boundaries, most are pockets of success that are relatively unconnected. Most efforts identified by the Council seem undertaken independently as “projects” by various departments in pursuit of sometime short term goals benefiting students within their areas; seldom are initiatives undertaken as elements of a larger student success agenda.
As noted in the literature this episodic and additive inventory of retention programming absent a larger student success agenda seems to have similar effect here as nationally—we are getting less for our efforts than we should.
Information systems
The limitations of our information infrastructure have been widely publicized in recent months. To provide a “culture of evidence” for formative and summative evaluation of our many efforts to improve student success, we need to move from many, often incompatible, student information systems to a single enterprise system. Recognizing that this is one or two biennia out, there is an immediate need for coordinated tracking and information sharing regarding at-risk populations,
Page 26
with associated communications capabilities for student outreach. This would include a next-generation degree-audit system (whether DARWIN or another) that can form the basis of a revised, web-supported advising system.
Information Systems capabilities needed:
Waitlisting function in METRO to manage section demand.
Course demand prediction system tied to degree audit system. DARWIN in and of itself cannot do this. Next step should be to investigate feasibility of porting DARWIN data structure and linking it with student and enrollment data to gauge probabilities of needs for course offerings and develop a method for course pre-requisite checking.
Integration of data from EMAS, CollegeNet, FAFSA, DARWIN and Student Data Warehouse to identify students with multiple risk factor for attrition, as a basis for early and ongoing identification and intervention. Make this information available to advisors.
An extension or upgrade of WebCAT that faculty and staff can use as an early warning system to trigger intervention.
The Retention Council recognized that availability of information system tools per se was unlikely to make a dramatic difference in retention rates. WSU already has in place some of the tools and systems that have generated “buzz” recently at other universities (e.g., DARWIN and WebCat). What is needed here is broad and deep communication and education regarding the purposes and uses of the tools.
Assessment and planning
The Institutional Research Office and the Office of Student Affairs Research and Assessment provide considerable support for many of WSU’s data needs in support of retention efforts and their assessment. Still, there are no regular mechanisms for broad-based monitoring of progress in order to provide detailed feedback about what is working for which student populations in which programs. This is partly a planning and coordination issue, and partly a data access issue. The current data repositories are difficult and expensive for departmental users. As a result, student data is underutilized at the department level—which is where many retention efforts can be expanded or accelerated. Moreover, rarely is program evaluation budgeted into the efforts of retention and student success.
Recommendation:
Explore feasibility of centrally funding access to the data warehouses and developing corporate documents so that anyone working with students can have ready access to easily retrievable information about the students they advise and work with.
Page 27
Retention Council Recommendations
Major recommendations:
Create a university-wide strategic retention plan with explicit goals, assigned responsibilities, and mechanisms of accountability.
Enhance the current data support system pending replacement by an enterprise student information system. Insure easy access at the department and other levels to relevant student information and reports.
Define key metrics for addressing retention efforts and create a standard data inquiry that is easily retrievable and that can be used effectively to measure our progress in certain targeted areas (a “dashboard” of sorts).
Coordinate scholarship policies among Enrollment Management, college deans, and Student Affairs, Equity and Diversity in order to structure optimal “stacking” of central and college dollars; target students at risk of attrition for financial reasons; and assess effectiveness of improved processes in terms of retention outcomes. Raising need-based scholarships should be a campaign priority.
While academic reasons are not major reasons for leaving cited by departing students, they are important secondary factors. Departments and faculty can have a major positive impact on retention and graduation rates by helping to:
o Create a culture of high standards and expectations for student success for the freshman year and beyond
o Substantially reduce the number of uncertified sophomores
o Track the retention/graduation rates of their certified majors
o Support the reform of the advising system
Specific recommendations
Pell grant recipients, financially needy and first generation students
Prioritize and complete the request to record/store, and make available for retrieval the information regarding first-generation status for all prospective students in time to in time to impact retention for entering and continuing classes.
Initiate mandatory collection of the same data (questions pertaining to parental education levels) for current students at registration via the web.
Revisit criteria for renewal of scholarships and consider thresholds below 3.2 GPA.
Page 28
Conduct follow-up study of the retention effects of raising the renewal GPA of the UAA award from 3.0 to 3.2 GPA.
Continue annual monitoring of scholarship policies for impacts on retention.
Scholarship policies should be coordinated among the Enrollment Management division, college deans, and Student Affairs, Equity and Diversity in order to structure optimal “stacking” of central and college dollars.
The Office of Financial Aid, with assistance as needed from Admissions, Institutional Research, and Information Technology Services, should identify students at risk of attrition for financial reasons and communicate that information on a regular basis to units that have a role in funding or advising students.
The Office of Enrollment Management, in collaboration with the academic colleges, should take the lead in assessing the effectiveness of improved scholarship and financial aid processes in terms of retention outcomes.
Need-based scholarships should be a fundraising priority during the campaign.
To the extent possible, package financial aid such that low income students do not have to work in their first, transitional year.
Attrition Patterns by Academic Standing
Form a team of representatives from relevant offices for a Freshman Year Success Agenda, whose mission it will be to assess and coordinate programs for the overall success of freshmen students, and to communicate support needs to the relevant administrators.
Housing
Housing, Residence Life, SALC and the Director of Learning Communities should investigate whether changes in policy or practice around Stephenson Hall assignments can improve its retention rates.
This group, or a similarly constituted task force including representatives involved with residential learning communities, should determine whether emerging assessment data on academic performance and retention by hall suggests additional changes to housing policies and practices.
“High-risk” courses
SAED in cooperation with ITS should create a Web-based early alert system to identify freshmen who are at academic risk, particularly in the first semester (to be implemented spring 2008), and trigger follow-up action by appropriate offices.
The Vice Provost for Undergraduate Education, Institutional Research, the academic colleges and CPDE should conduct follow-up studies of “high-risk courses,” academic deficiency, and retention patterns to determine appropriate actions at the department level where these courses are taught.
Page 29
Faculty selection and faculty development programs for instructors of lower-division courses must remain an institutional priority. Lead units include the academic colleges, the Graduate School, the OUE, the Provost’s Office, the Teaching Academy, and CTLT.
The Provost and the Vice President for SAED should insure sufficient funding and support for first-year programs aimed at student success.
Class size reduction in first-year/lower division courses must remain a goal within an overall first-year student success agenda.
Academic deficiency
SALC should track Fall 2007 deficiency and retention rates to determine, in conjunction with the Faculty Senate, whether the policy changes have been effective.
Transfer Students
Continue implementing the new Transfer Team, which is committed to the success of transfer students from application to graduation, including recruitment, orientation, transcript evaluation, and academic advising (Enrollment Management, Admission, New Student Programs, SALC, MSS, and academic advisors from the colleges).
Use web-based systems to assist faculty and departmental advisors in identifying and supporting transfer students (SALC, ITS, and colleges).
Use assessed outcomes of the model program between Multicultural Student Services and Engineering to mentor transfer students as a basis for similar programs in other colleges.
Distance students
Continue monitoring of DDP retention rates in relation to those of all campuses.
Use data regarding advisor-to-student ratios in DDP to assist in advising reforms on the Pullman campus.
Sophomores and juniors, both certified and uncertified
Develop a comprehensive strategy for assisting students to certify a major in a timely fashion, e.g.:
o Develop message to freshmen detailing path to major selection (Career Services, SALC, college representatives).
o Implement a telecounseling process for freshmen and sophomore students whereby students are contacted early in fall semester with relevant questions and support (Admissions, Telecounseling, SALC).
o Support major selection for sophomores by sending students with 30+ credits who have not yet certified a message detailing benefits of major selection and certification (Career Services, SALC, academic departments).
Page 30
o Develop podcasting program to provide regular broadcasts regarding advising, deadlines, changes, and other curricular messages (SALC).
Reinvigorate a standing committee, the Academic Advising and Reinstatement Subcommittee of the Faculty Senate’s Academic Affairs Committee, which should, among other responsibilities, re-examine the language of Academic Rule 53 on certification and change as needed.
Examine selective certification requirements and remove unnecessary barriers to certification (departments, Academic Advising and Reinstatement Subcommittee, and SALC).
Certified majors
Coordinate information between SALC and prospective departments regarding students who are attempting to certify, with development of appropriate “off-ramp” support for students who must find another major (departments and SALC).
The February 2008 implementation of DARWIN should be accompanied by an outreach campaign to faculty and students regarding the benefits of this web-based degree-audit system. This campaign could also be a vehicle for introducing some of the advising reforms recommended in the Faculty Senate and consultants’ reports.
Information Systems and Assessment
Explore feasibility of centrally funding access to the data warehouses and developing corporate documents so that anyone working with students can have ready access to easily retrievable information about the students they advise and work with.
Information Systems capabilities needed to support a robust institutional strategy for retention:
Waitlisting function in METRO to manage section demand.
Course demand prediction system tied to degree audit system. DARWIN in and of itself cannot do this. Next step should be to investigate feasibility of porting DARWIN data structure and linking it with student and enrollment data to gauge probabilities of needs for course offerings and develop a method for course pre-requisite checking.
Integration of data from EMAS, CollegeNet, FAFSA, DARWIN and Student Data Warehouse to identify students with multiple risk factor for attrition, as a basis for early and ongoing identification and intervention. Make this information available to advisors.
An extension or upgrade of WebCAT that faculty and staff can use as an early warning system to trigger intervention.
Page 31
APPENDICES
1A State Accountability Measures and Targets
1B Undergraduate Progress Index, WSU and Peers
1C WSU Retention and Graduation Rates by Gender and Ethnicity Since 1989
2 Spring 2007 Telephone Survey of Non-Returning Students
3 List of WSU Data Sets Reviewed by Retention Council
Page 32
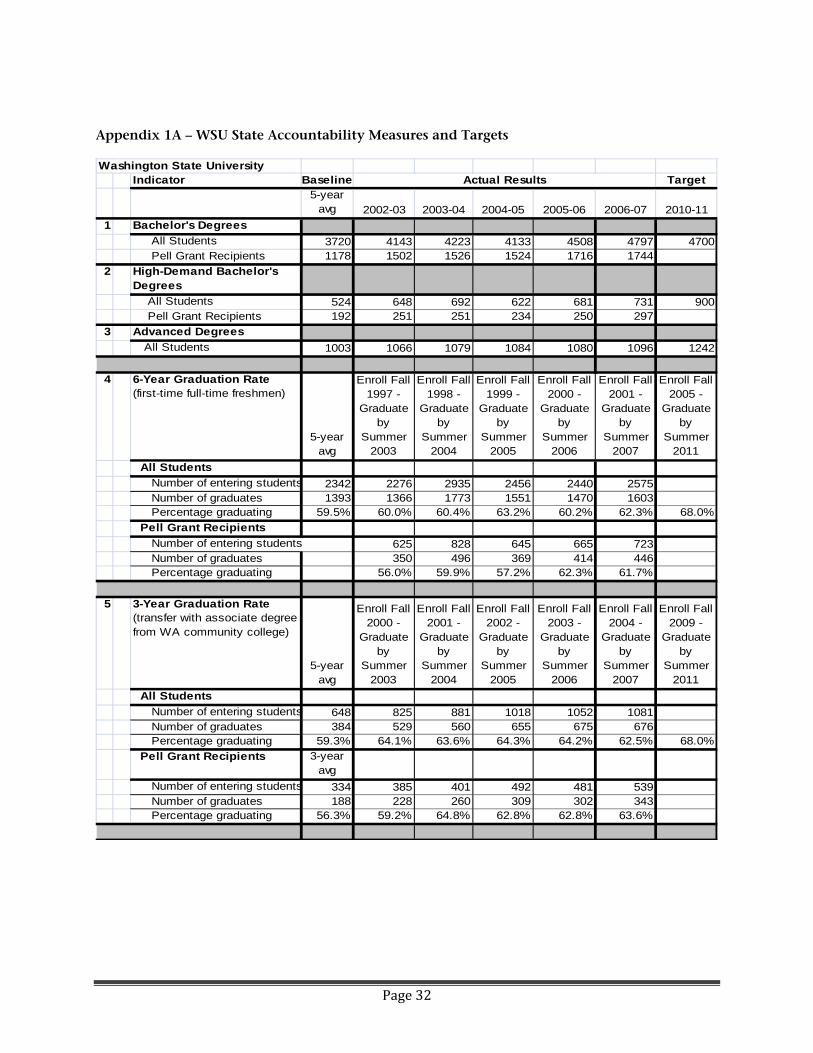
Appendix 1A – WSU State Accountability Measures and Targets
Washington State UniversityIndicator Baseline Target
5-year avg 2002-03 2003-04 2004-05 2005-06 2006-07 2010-11
1 Bachelor's Degrees
All Students 3720 4143 4223 4133 4508 4797 4700 Pell Grant Recipients 1178 1502 1526 1524 1716 1744
2 High-Demand Bachelor's Degrees
All Students 524 648 692 622 681 731 900 Pell Grant Recipients 192 251 251 234 250 297
3 Advanced Degrees
All Students 1003 1066 1079 1084 1080 1096 1242
4 6-Year Graduation Rate (first-time full-time freshmen)
5-year avg
Enroll Fall 1997 -
Graduate by
Summer 2003
Enroll Fall 1998 -
Graduate by
Summer 2004
Enroll Fall 1999 -
Graduate by
Summer 2005
Enroll Fall 2000 -
Graduate by
Summer 2006
Enroll Fall 2001 -
Graduate by
Summer 2007
Enroll Fall 2005 -
Graduate by
Summer 2011
All Students
Number of entering students 2342 2276 2935 2456 2440 2575 Number of graduates 1393 1366 1773 1551 1470 1603 Percentage graduating 59.5% 60.0% 60.4% 63.2% 60.2% 62.3% 68.0% Pell Grant Recipients
Number of entering students 625 828 645 665 723 Number of graduates 350 496 369 414 446 Percentage graduating 56.0% 59.9% 57.2% 62.3% 61.7%
5 3-Year Graduation Rate (transfer with associate degree from WA community college)
5-year avg
Enroll Fall 2000 -
Graduate by
Summer 2003
Enroll Fall 2001 -
Graduate by
Summer 2004
Enroll Fall 2002 -
Graduate by
Summer 2005
Enroll Fall 2003 -
Graduate by
Summer 2006
Enroll Fall 2004 -
Graduate by
Summer 2007
Enroll Fall 2009 -
Graduate by
Summer 2011
All Students
Number of entering students 648 825 881 1018 1052 1081 Number of graduates 384 529 560 655 675 676 Percentage graduating 59.3% 64.1% 63.6% 64.3% 64.2% 62.5% 68.0% Pell Grant Recipients 3-year
avg
Number of entering students 334 385 401 492 481 539 Number of graduates 188 228 260 309 302 343 Percentage graduating 56.3% 59.2% 64.8% 62.8% 62.8% 63.6%
Actual Results
Page 33
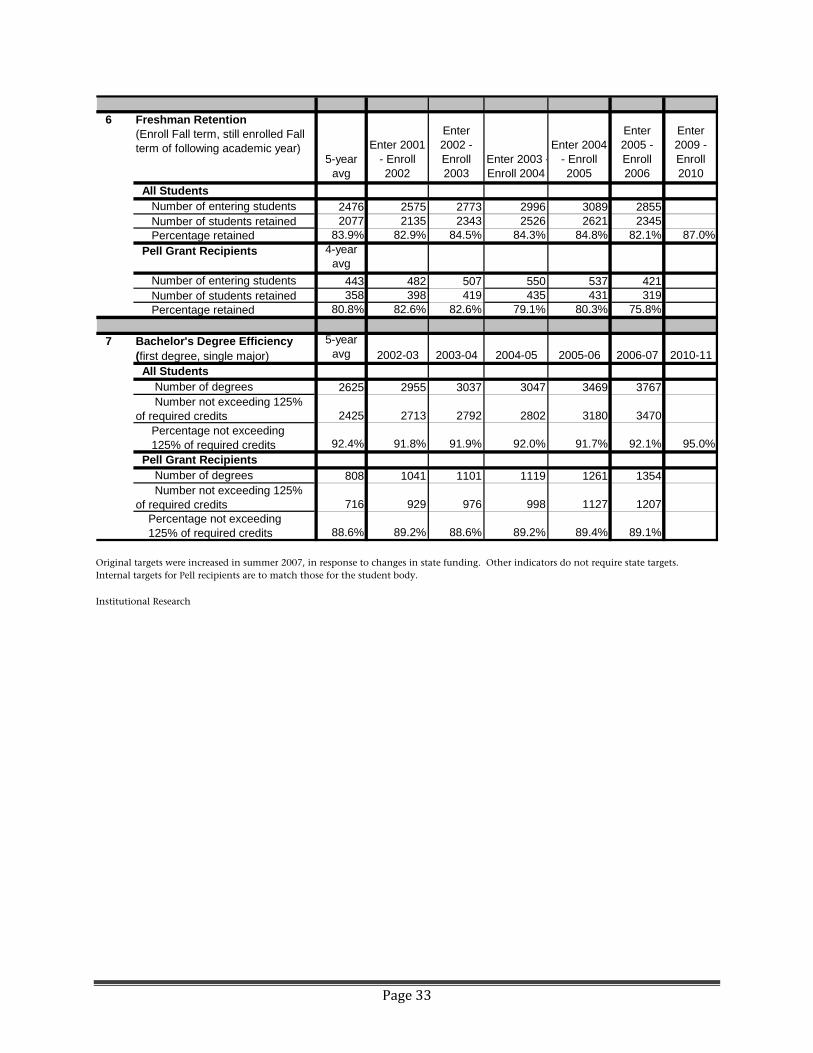
6 Freshman Retention (Enroll Fall term, still enrolled Fall term of following academic year)
5-year avg
Enter 2001 - Enroll 2002
Enter 2002 - Enroll 2003
Enter 2003 -Enroll 2004
Enter 2004 - Enroll 2005
Enter 2005 - Enroll 2006
Enter 2009 - Enroll 2010
All Students Number of entering students 2476 2575 2773 2996 3089 2855 Number of students retained 2077 2135 2343 2526 2621 2345 Percentage retained 83.9% 82.9% 84.5% 84.3% 84.8% 82.1% 87.0%
Pell Grant Recipients 4-year avg
Number of entering students 443 482 507 550 537 421 Number of students retained 358 398 419 435 431 319 Percentage retained 80.8% 82.6% 82.6% 79.1% 80.3% 75.8%
7 Bachelor's Degree Efficiency (first degree, single major)
5-year avg 2002-03 2003-04 2004-05 2005-06 2006-07 2010-11
All Students Number of degrees 2625 2955 3037 3047 3469 3767 Number not exceeding 125% of required credits 2425 2713 2792 2802 3180 3470 Percentage not exceeding 125% of required credits 92.4% 91.8% 91.9% 92.0% 91.7% 92.1% 95.0%
Pell Grant Recipients Number of degrees 808 1041 1101 1119 1261 1354 Number not exceeding 125% of required credits 716 929 976 998 1127 1207 Percentage not exceeding 125% of required credits 88.6% 89.2% 88.6% 89.2% 89.4% 89.1%
Original targets were increased in summer 2007, in response to changes in state funding. Other indicators do not require state targets. Internal targets for Pell recipients are to match those for the student body.
Institutional Research
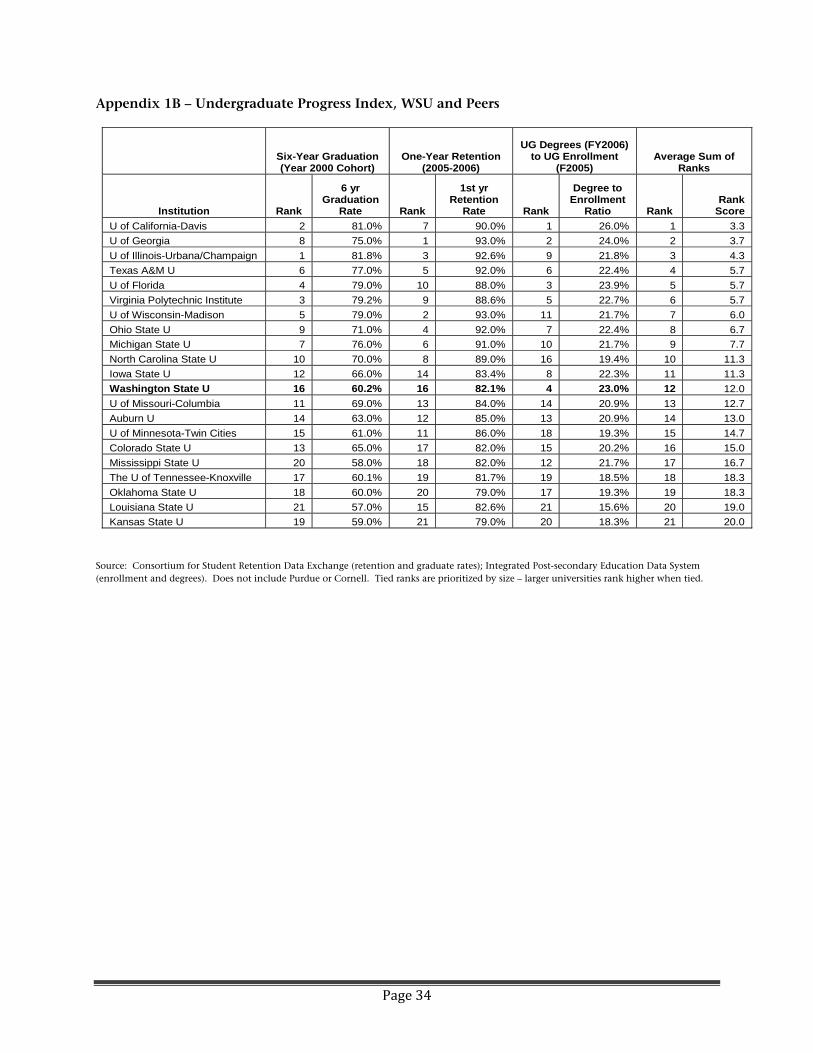
Page 34
Appendix 1B – Undergraduate Progress Index, WSU and Peers
Six-Year Graduation (Year 2000 Cohort)
One-Year Retention (2005-2006)
UG Degrees (FY2006) to UG Enrollment
(F2005) Average Sum of
Ranks
Institution Rank
6 yr Graduation
Rate Rank
1st yr Retention
Rate Rank
Degree to Enrollment
Ratio Rank Rank
Score
U of California-Davis 2 81.0% 7 90.0% 1 26.0% 1 3.3
U of Georgia 8 75.0% 1 93.0% 2 24.0% 2 3.7
U of Illinois-Urbana/Champaign 1 81.8% 3 92.6% 9 21.8% 3 4.3
Texas A&M U 6 77.0% 5 92.0% 6 22.4% 4 5.7
U of Florida 4 79.0% 10 88.0% 3 23.9% 5 5.7
Virginia Polytechnic Institute 3 79.2% 9 88.6% 5 22.7% 6 5.7
U of Wisconsin-Madison 5 79.0% 2 93.0% 11 21.7% 7 6.0
Ohio State U 9 71.0% 4 92.0% 7 22.4% 8 6.7
Michigan State U 7 76.0% 6 91.0% 10 21.7% 9 7.7
North Carolina State U 10 70.0% 8 89.0% 16 19.4% 10 11.3
Iowa State U 12 66.0% 14 83.4% 8 22.3% 11 11.3
Washington State U 16 60.2% 16 82.1% 4 23.0% 12 12.0
U of Missouri-Columbia 11 69.0% 13 84.0% 14 20.9% 13 12.7
Auburn U 14 63.0% 12 85.0% 13 20.9% 14 13.0
U of Minnesota-Twin Cities 15 61.0% 11 86.0% 18 19.3% 15 14.7
Colorado State U 13 65.0% 17 82.0% 15 20.2% 16 15.0
Mississippi State U 20 58.0% 18 82.0% 12 21.7% 17 16.7
The U of Tennessee-Knoxville 17 60.1% 19 81.7% 19 18.5% 18 18.3
Oklahoma State U 18 60.0% 20 79.0% 17 19.3% 19 18.3
Louisiana State U 21 57.0% 15 82.6% 21 15.6% 20 19.0
Kansas State U 19 59.0% 21 79.0% 20 18.3% 21 20.0
Source: Consortium for Student Retention Data Exchange (retention and graduate rates); Integrated Post-secondary Education Data System (enrollment and degrees). Does not include Purdue or Cornell. Tied ranks are prioritized by size – larger universities rank higher when tied.
Page 35
Appendix 2 - Telephone Survey of Non-Returning Students Spring 2007
SPRING 2007 SURVEY OF NON-RETURNING STUDENTS
INTRODUCTION Student retention is a growing point of interest at WSU and
other colleges. Much work has been done to examine the connection between retention and common student attributes such as incoming academic credentials, performance in college-level courses, and affiliation with certain student groups (e.g., fraternity/sorority, living group). While informative, this work can only indirectly name the reasons students are not retained at the university. In this study, we sought to make direct contact with non-retained students or their families to inquire about the reasons for discontinuing enrollment at WSU.
METHODS With the generous assistance of the Telecounseling Center, a
telephone survey was administered to assess potential reasons for students leaving WSU. First, the survey asked general questions about the reasons for originally enrolling at WSU, plans to return, and enrollment at other schools. Then the respondents were presented with 25 potential reasons for their leaving WSU and asked to rate the degree to which each of these situations factored in their non-retention. The reasons reflected personal/ academic, financial, and institutional. (A copy of the survey instrument can be found in Appendix A.)
The population of interest in this study was undergraduate students who were enrolled at the Pullman campus for the Fall 2006 term, but not enrolled for the Spring 2007. Students were excluded from the study sample if they were denied reinstatement after academic deficiencies, dismissed for improper conduct, or earned a degree during the Fall 2006 term. Following these exclusions, there were 684 former students in the population. We experienced a contactability rate of 42.7% and cooperation rate of 72.3% to arrive at a total of 211 successful contacts.
RESULTS A large majority of non-retained students enrolled at WSU intending to earn a degree (69%, bachelors degree or certification; 10%, graduate degree). It was interesting to find that 10% of the non-retained students enrolled at WSU with
Page 36
no definite purpose in mind. (See Appendix B-1 for full, graphical results.)
Plans to re-enroll at WSU were split among respondents (Appendix B-2). The largest percentage of respondents (47%) did not plan to re-enroll. Somewhat fewer respondents planned to return (34%). Many respondents were unsure about their future with WSU (17%).
A majority of the respondents were enrolled at another institution or planned to do so in the future (58%, Appendix B-3). Western Washington University was the most common school reported (8 respondents), followed closely by Eastern Washington University (7 respondents). University of Washington and Central Washington University were each reported five times. Most responses, however, were for community colleges within the state, totaling over 60. This pattern of responses indicated that non-retained students were more likely to be in a place of re-assessment rather than using WSU as a stepping stone to pursue more prestigious opportunities. For the most part, this indication is corroborated in the responses to the list of potential reasons for leaving WSU.
The situations most often cited as major reasons for not returning to WSU were all personal reasons (Appendix B-4). The situations respondents most often cited as minor reasons were a mix of personal and institutional (Appendix B-5). Among all situations presented to the respondents, there was no one reason or small set of reasons that were common to a large portion of respondents. Relatedly, for each of the situations except two, most respondents denied that situation was any reason for not enrolling in the Spring 2007 term. Sometimes this percentage was as high as around 80%. The situations least often recognized as a reason for leaving WSU were all institutional (Appendix B-6).
Responses to all survey items were compared for sub-groups within the response sample. These sub-group comparisons took place for student respondents versus parent respondents and responses for non-retained students who were at one time registered for Spring 2007 courses (“pre-registered”) versus those who were not.
Unsurprisingly, parents were more likely to refuse answers to questions. One could surmise that, speaking for someone else, the parents were more measured in their responses. It could also be that they were more private than their “millennial” children. Where responses were given, students were more likely to cite a desire to get away from college, a desire to work, or the presence of too many required courses as reasons for their departure from WSU. They were less likely than their parents to claim dissatisfaction with their academic performance.
Page 37
Differences in responses between respondents pre-registered and not mostly fell in logical places. Non-returning students who were pre-registered were much more likely to re-enroll at WSU, and less likely to be enrolled or planning to enroll at another institution. Pre-registered students were more likely to cite academic or emotional/family/health problems as a major reason for not returning. Respondents who were not pre-registered were more likely to express an interest in getting away from college for a while, a strong desire to live in a new location, or distaste with the size of WSU. Perhaps a little surprising, pre-registered respondents were more likely to say that lack of contact with faculty was a major reason for their non-return. Respondents who were not pre-registered were more likely to cite lack of faculty contact as a minor reason.
Page 38
APPENDIX
Survey instrument A-1
Why respondents enrolled at WSU B-1
Respondents’ plans for re-enrollment at WSU B-2
Enrollment at colleges other than WSU B-3
Situations cited most often as major reasons for leaving WSU
B-4
Situations cited most often as minor reasons for leaving WSU
B-5
Situations cited least often as reasons for leaving WSU
B-6
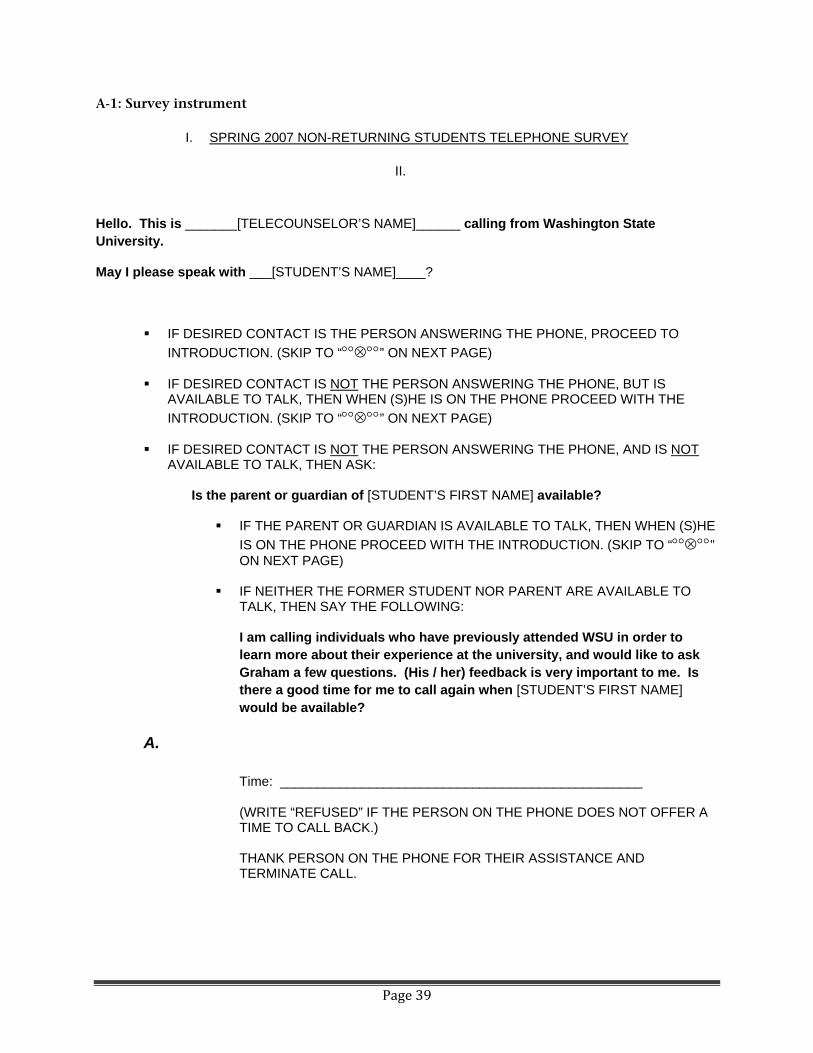
Page 39
A-1: Survey instrument
I. SPRING 2007 NON-RETURNING STUDENTS TELEPHONE SURVEY
II.
Hello. This is _______[TELECOUNSELOR’S NAME]______ calling from Washington State University.
May I please speak with ___[STUDENT’S NAME]____?
IF DESIRED CONTACT IS THE PERSON ANSWERING THE PHONE, PROCEED TO
INTRODUCTION. (SKIP TO “” ON NEXT PAGE) IF DESIRED CONTACT IS NOT THE PERSON ANSWERING THE PHONE, BUT IS
AVAILABLE TO TALK, THEN WHEN (S)HE IS ON THE PHONE PROCEED WITH THE
INTRODUCTION. (SKIP TO “” ON NEXT PAGE) IF DESIRED CONTACT IS NOT THE PERSON ANSWERING THE PHONE, AND IS NOT
AVAILABLE TO TALK, THEN ASK:
Is the parent or guardian of [STUDENT’S FIRST NAME] available?
IF THE PARENT OR GUARDIAN IS AVAILABLE TO TALK, THEN WHEN (S)HE
IS ON THE PHONE PROCEED WITH THE INTRODUCTION. (SKIP TO “” ON NEXT PAGE)
IF NEITHER THE FORMER STUDENT NOR PARENT ARE AVAILABLE TO
TALK, THEN SAY THE FOLLOWING:
I am calling individuals who have previously attended WSU in order to learn more about their experience at the university, and would like to ask Graham a few questions. (His / her) feedback is very important to me. Is there a good time for me to call again when [STUDENT’S FIRST NAME] would be available?
A.
Time: _________________________________________________
(WRITE “REFUSED” IF THE PERSON ON THE PHONE DOES NOT OFFER A TIME TO CALL BACK.) THANK PERSON ON THE PHONE FOR THEIR ASSISTANCE AND TERMINATE CALL.
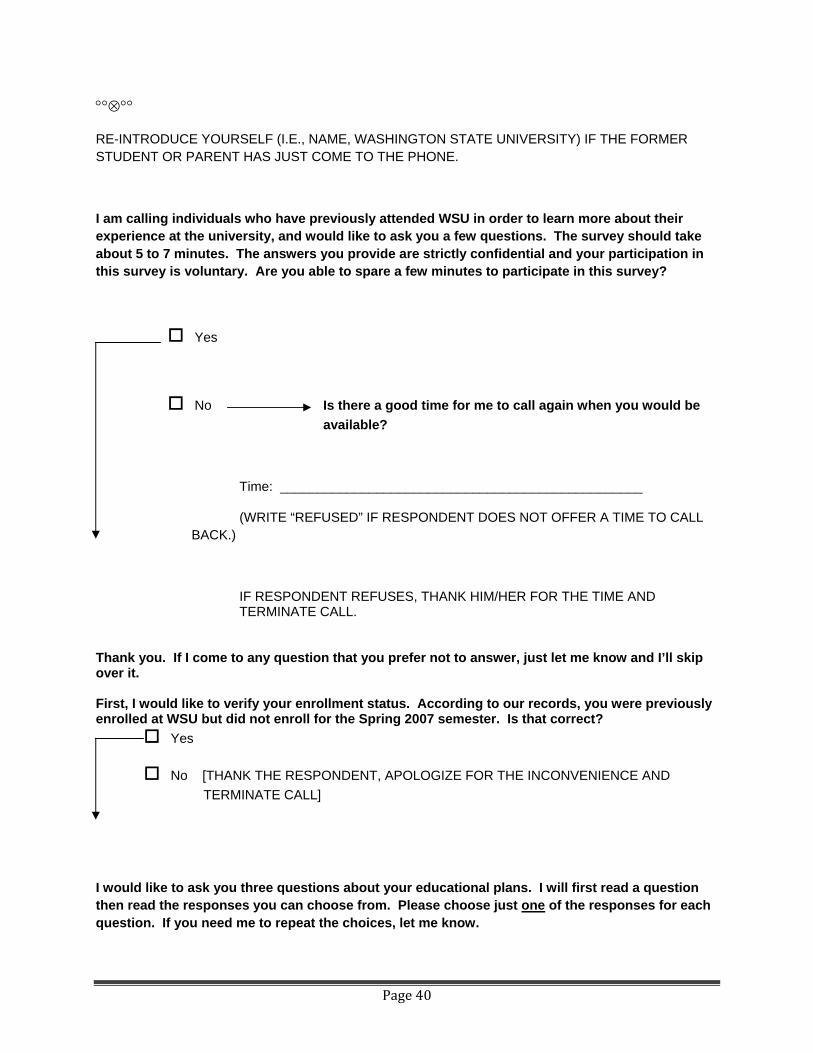
Page 40
RE-INTRODUCE YOURSELF (I.E., NAME, WASHINGTON STATE UNIVERSITY) IF THE FORMER STUDENT OR PARENT HAS JUST COME TO THE PHONE.
I am calling individuals who have previously attended WSU in order to learn more about their experience at the university, and would like to ask you a few questions. The survey should take about 5 to 7 minutes. The answers you provide are strictly confidential and your participation in this survey is voluntary. Are you able to spare a few minutes to participate in this survey?
Yes
No Is there a good time for me to call again when you would be
available?
Time: _________________________________________________
(WRITE “REFUSED” IF RESPONDENT DOES NOT OFFER A TIME TO CALL BACK.)
IF RESPONDENT REFUSES, THANK HIM/HER FOR THE TIME AND TERMINATE CALL.
Thank you. If I come to any question that you prefer not to answer, just let me know and I’ll skip over it. First, I would like to verify your enrollment status. According to our records, you were previously enrolled at WSU but did not enroll for the Spring 2007 semester. Is that correct?
Yes
No [THANK THE RESPONDENT, APOLOGIZE FOR THE INCONVENIENCE AND
TERMINATE CALL]
I would like to ask you three questions about your educational plans. I will first read a question then read the responses you can choose from. Please choose just one of the responses for each question. If you need me to repeat the choices, let me know.
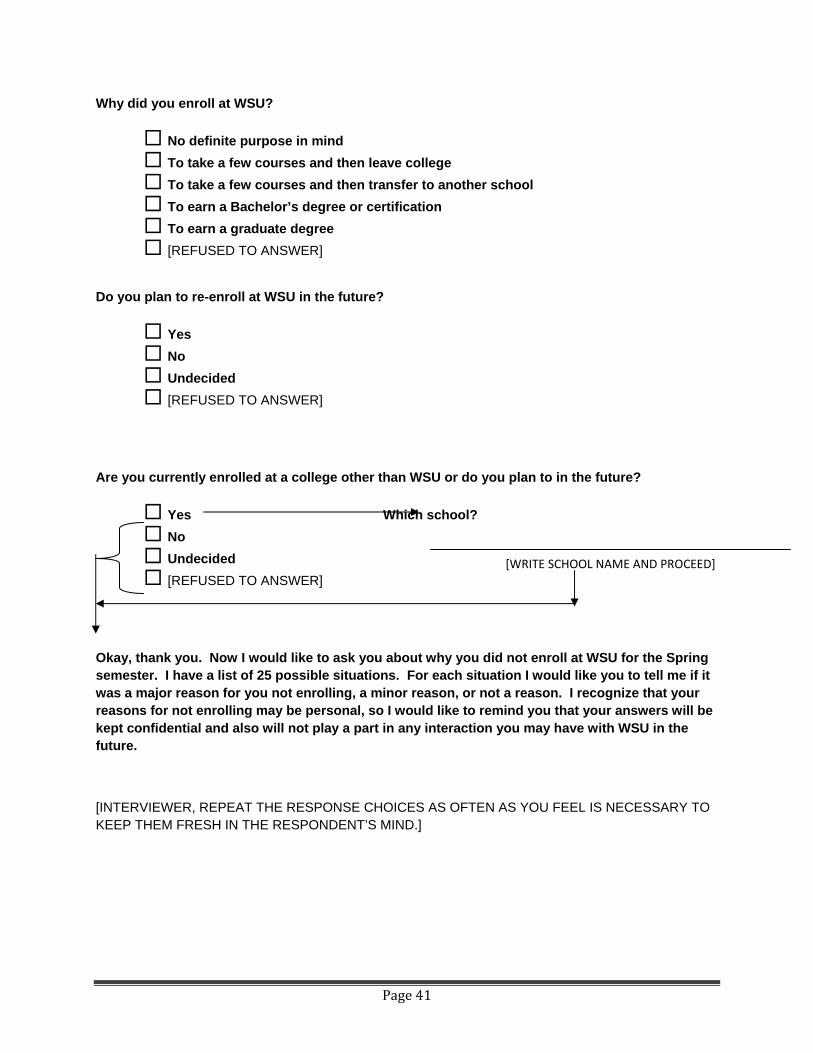
Page 41
Why did you enroll at WSU?
No definite purpose in mind
To take a few courses and then leave college
To take a few courses and then transfer to another school
To earn a Bachelor’s degree or certification
To earn a graduate degree
[REFUSED TO ANSWER]
Do you plan to re-enroll at WSU in the future?
Yes
No
Undecided
[REFUSED TO ANSWER]
Are you currently enrolled at a college other than WSU or do you plan to in the future?
Yes Which school?
No
Undecided
[REFUSED TO ANSWER]
Okay, thank you. Now I would like to ask you about why you did not enroll at WSU for the Spring semester. I have a list of 25 possible situations. For each situation I would like you to tell me if it was a major reason for you not enrolling, a minor reason, or not a reason. I recognize that your reasons for not enrolling may be personal, so I would like to remind you that your answers will be kept confidential and also will not play a part in any interaction you may have with WSU in the future.
[INTERVIEWER, REPEAT THE RESPONSE CHOICES AS OFTEN AS YOU FEEL IS NECESSARY TO KEEP THEM FRESH IN THE RESPONDENT’S MIND.]
[WRITE SCHOOL NAME AND PROCEED]
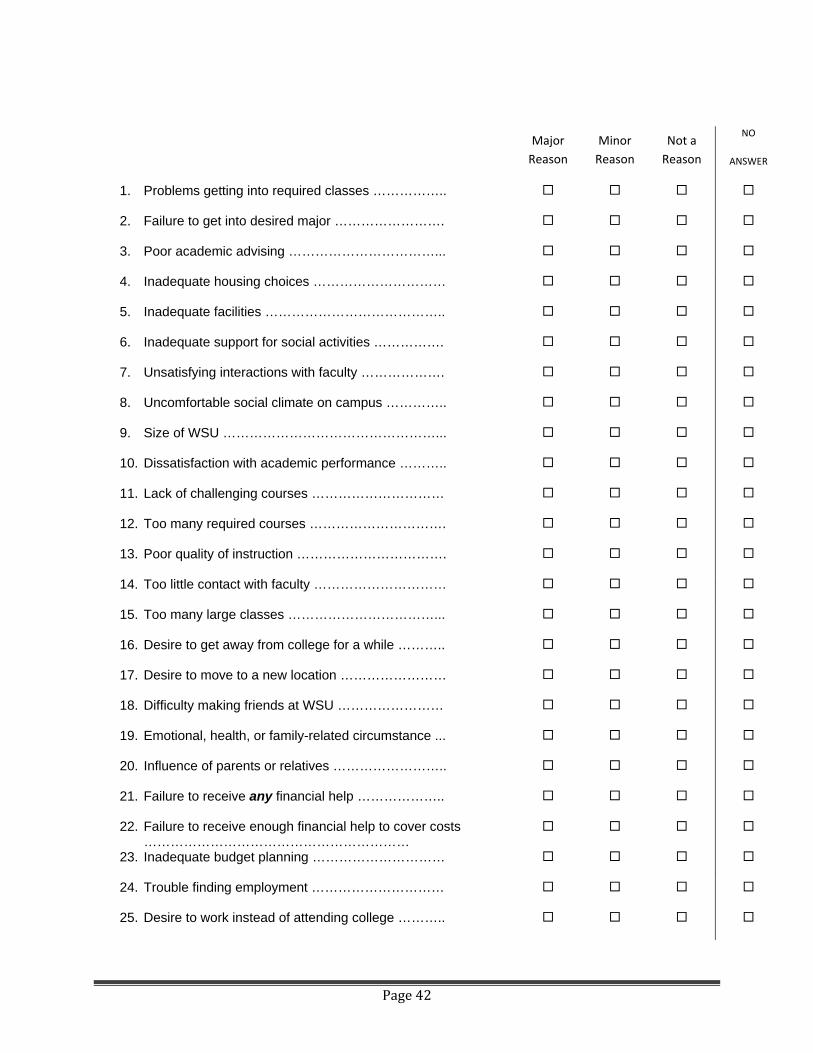
Page 42
Major
Reason
Minor
Reason
Not a
Reason
NO
ANSWER
1. Problems getting into required classes ……………..
2. Failure to get into desired major …………………….
3. Poor academic advising ……………………………...
4. Inadequate housing choices …………………………
5. Inadequate facilities …………………………………..
6. Inadequate support for social activities …………….
7. Unsatisfying interactions with faculty ……………….
8. Uncomfortable social climate on campus …………..
9. Size of WSU …………………………………………...
10. Dissatisfaction with academic performance ………..
11. Lack of challenging courses …………………………
12. Too many required courses ………………………….
13. Poor quality of instruction …………………………….
14. Too little contact with faculty …………………………
15. Too many large classes ……………………………...
16. Desire to get away from college for a while ………..
17. Desire to move to a new location ……………………
18. Difficulty making friends at WSU ……………………
19. Emotional, health, or family-related circumstance ...
20. Influence of parents or relatives ……………………..
21. Failure to receive any financial help ………………..
22. Failure to receive enough financial help to cover costs ……………………………………………………
23. Inadequate budget planning …………………………
24. Trouble finding employment …………………………
25. Desire to work instead of attending college ………..

Page 43
Thank you. Finally, I would like to give you the chance to freely respond and comment on anything I have not addressed. Do you have anything you would like to add? Is there anything you would say to new WSU students that you think might help them the most?
Thank you again, [STUDENT’S FIRST NAME], for your time and responses. I wish you the best of luck.
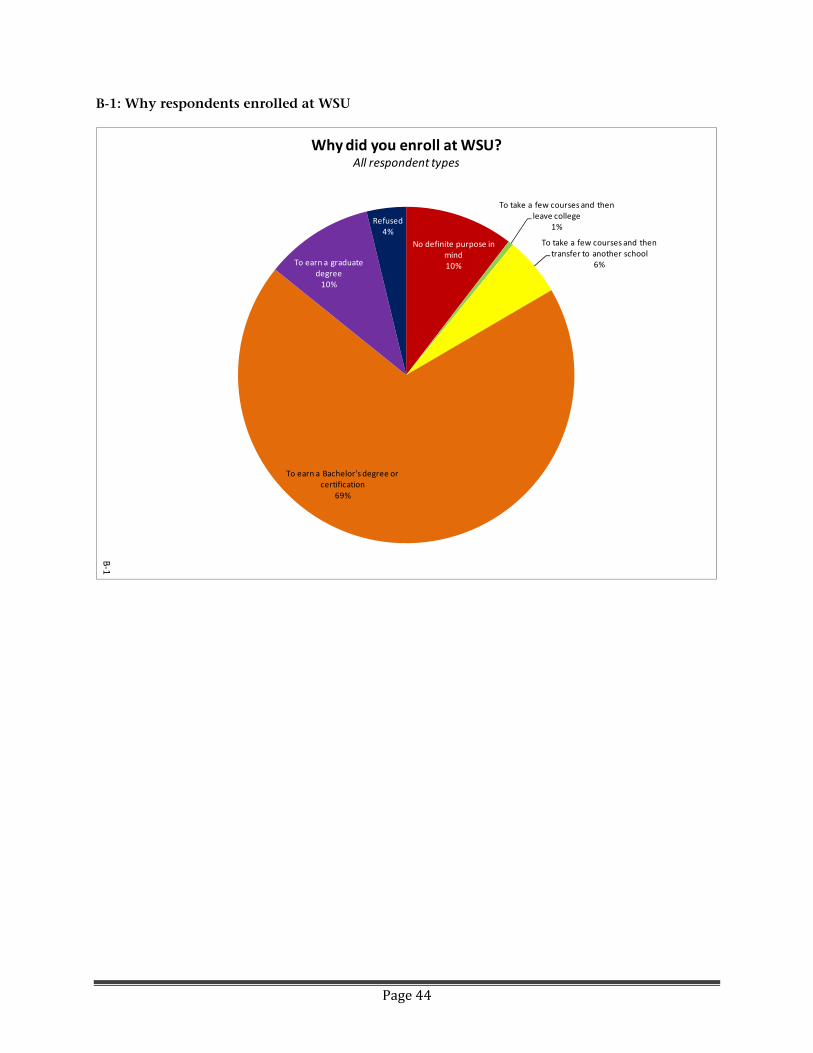
Page 44
B-1: Why respondents enrolled at WSU
No definite purpose in mind10%
To take a few courses and then leave college
1%
To take a few courses and then transfer to another school
6%
To earn a Bachelor's degree or certification
69%
To earn a graduate degree10%
Refused4%
Why did you enroll at WSU?All respondent types
B‐1
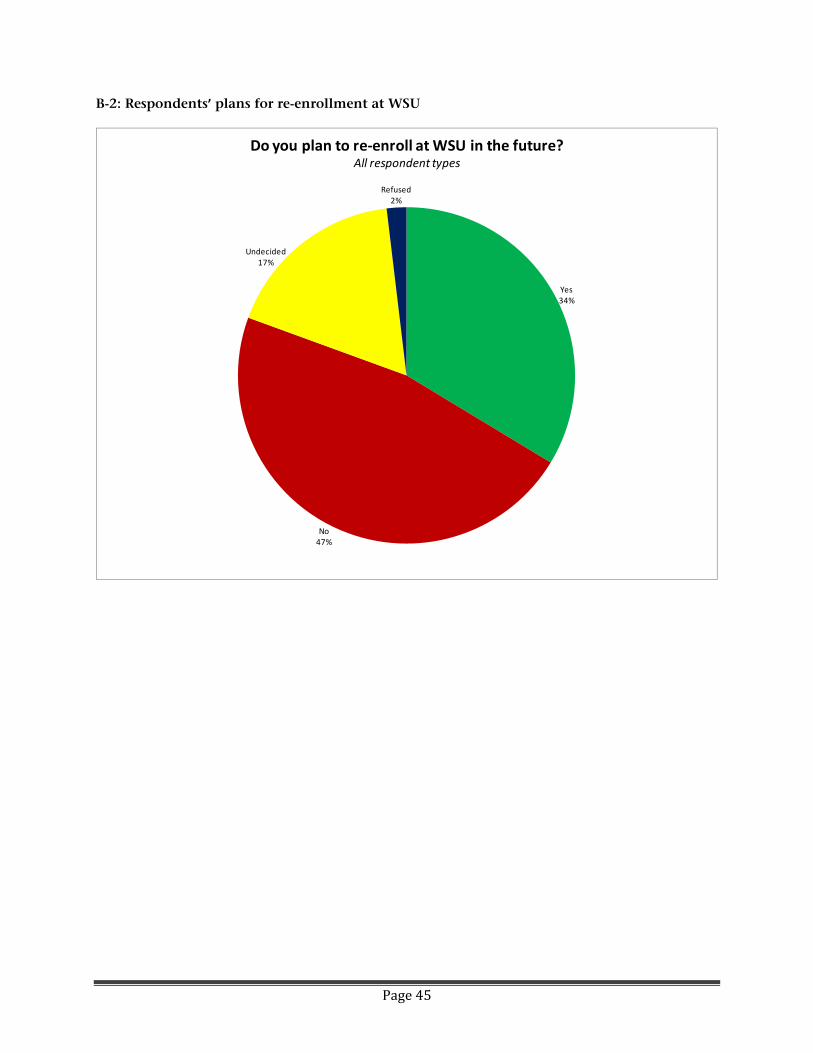
Page 45
B-2: Respondents’ plans for re-enrollment at WSU
Yes34%
No47%
Undecided17%
Refused2%
Do you plan to re‐enroll at WSU in the future?All respondent types
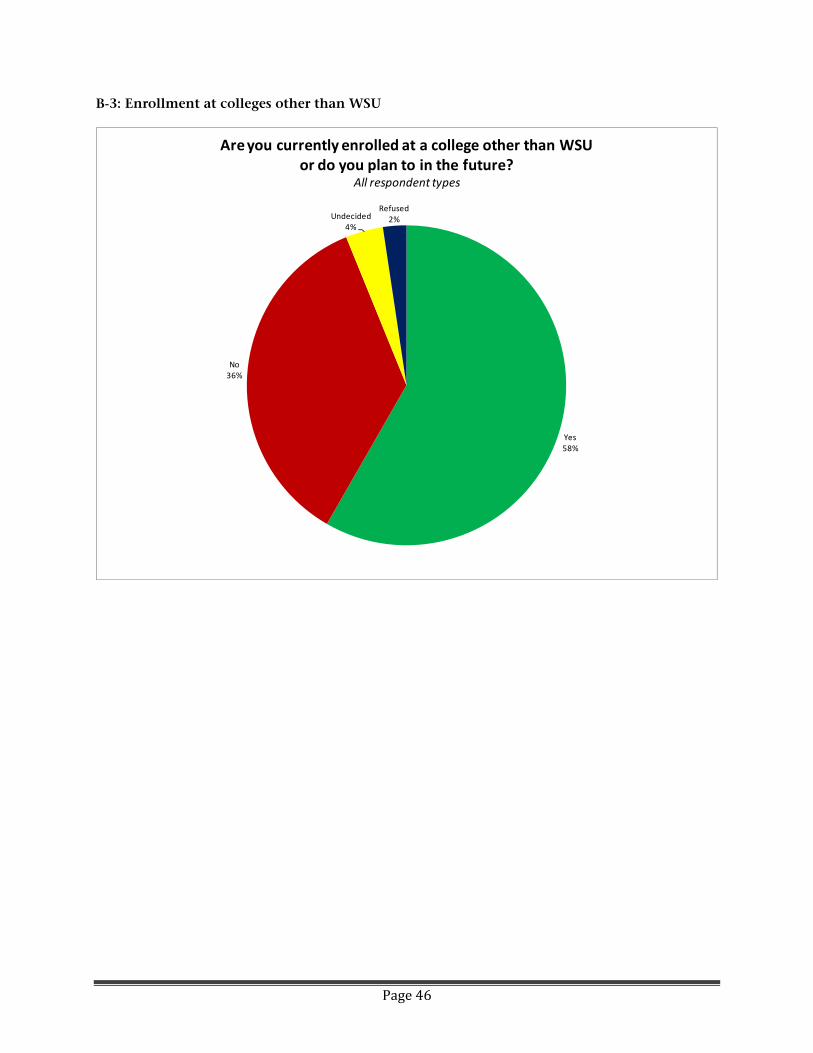
Page 46
B-3: Enrollment at colleges other than WSU
Yes58%
No36%
Undecided4%
Refused2%
Are you currently enrolled at a college other than WSU or do you plan to in the future?
All respondent types
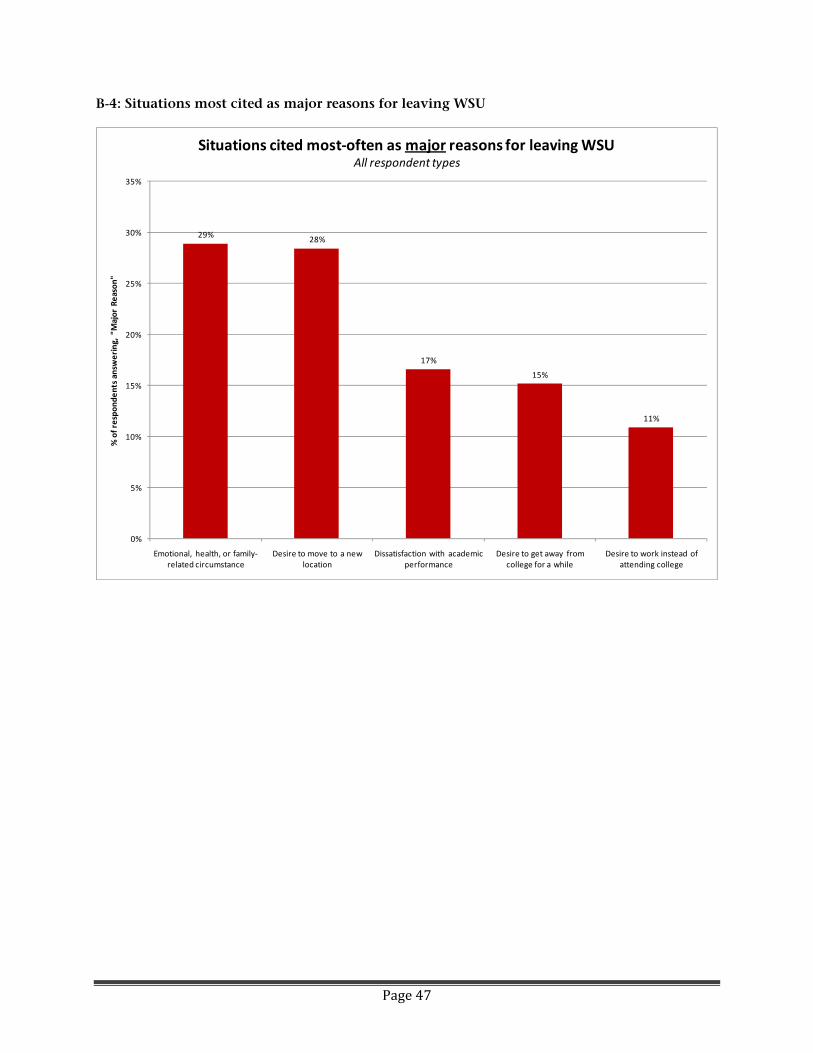
Page 47
B-4: Situations most cited as major reasons for leaving WSU
29%28%
17%
15%
11%
0%
5%
10%
15%
20%
25%
30%
35%
Emotional, health, or family‐related circumstance
Desire to move to a new location
Dissatisfaction with academic performance
Desire to get away from college for a while
Desire to work instead of attending college
% of respondents answ
ering, "Major Reason"
Situations cited most‐often as major reasons for leaving WSUAll respondent types
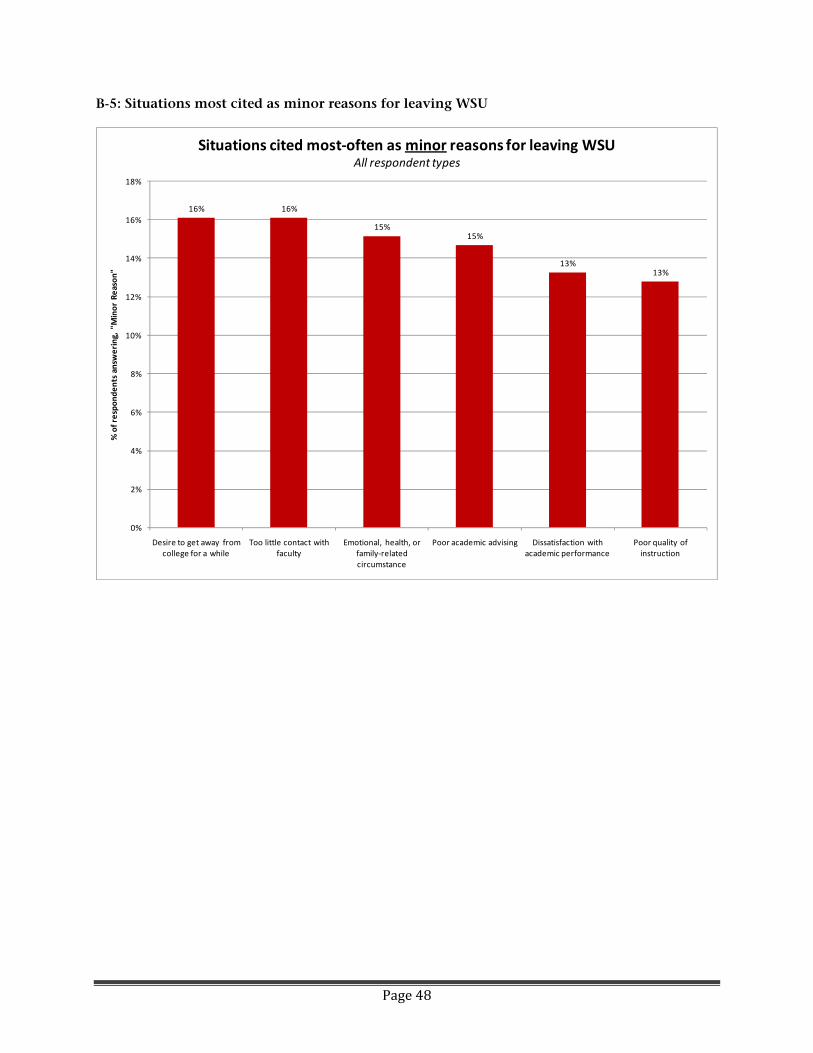
Page 48
B-5: Situations most cited as minor reasons for leaving WSU
16% 16%
15%15%
13%13%
0%
2%
4%
6%
8%
10%
12%
14%
16%
18%
Desire to get away from college for a while
Too little contact with faculty
Emotional, health, or family‐related circumstance
Poor academic advising Dissatisfaction with academic performance
Poor quality of instruction
% of respondents answ
ering, "Minor Reason"
Situations cited most‐often as minor reasons for leaving WSUAll respondent types
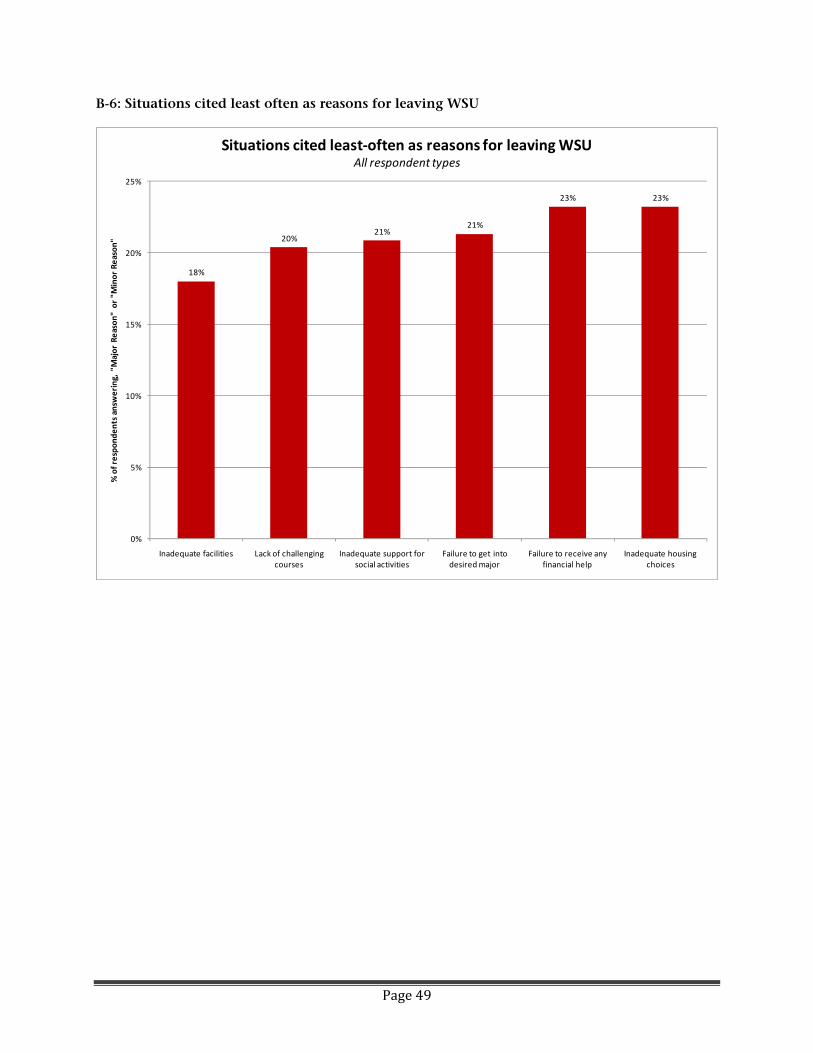
Page 49
B-6: Situations cited least often as reasons for leaving WSU
18%
20%21%
21%
23% 23%
0%
5%
10%
15%
20%
25%
Inadequate facilities Lack of challenging courses
Inadequate support for social activities
Failure to get into desired major
Failure to receive any financial help
Inadequate housing choices
% of respondents answ
ering, "Major Reason" or "M
inor Reason"
Situations cited least‐often as reasons for leaving WSUAll respondent types
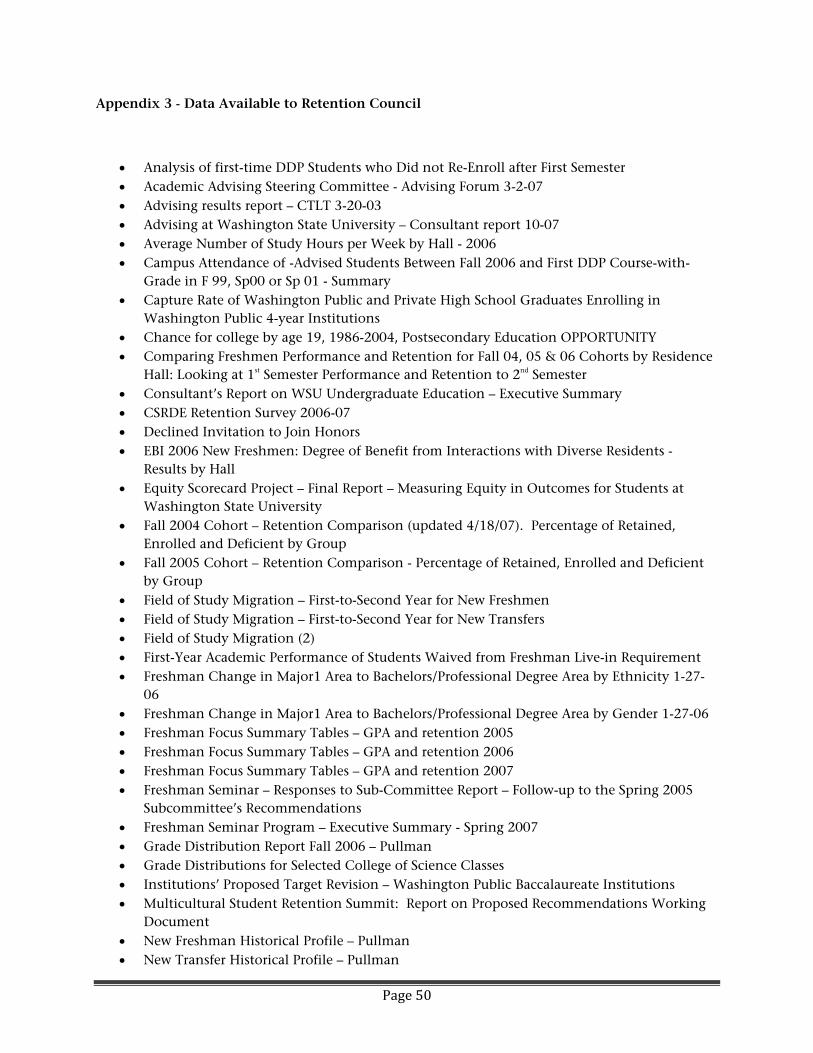
Page 50
Appendix 3 - Data Available to Retention Council
Analysis of first-time DDP Students who Did not Re-Enroll after First Semester Academic Advising Steering Committee - Advising Forum 3-2-07 Advising results report – CTLT 3-20-03 Advising at Washington State University – Consultant report 10-07 Average Number of Study Hours per Week by Hall - 2006 Campus Attendance of -Advised Students Between Fall 2006 and First DDP Course-with-
Grade in F 99, Sp00 or Sp 01 - Summary Capture Rate of Washington Public and Private High School Graduates Enrolling in
Washington Public 4-year Institutions Chance for college by age 19, 1986-2004, Postsecondary Education OPPORTUNITY Comparing Freshmen Performance and Retention for Fall 04, 05 & 06 Cohorts by Residence
Hall: Looking at 1st Semester Performance and Retention to 2nd Semester Consultant’s Report on WSU Undergraduate Education – Executive Summary CSRDE Retention Survey 2006-07 Declined Invitation to Join Honors EBI 2006 New Freshmen: Degree of Benefit from Interactions with Diverse Residents -
Results by Hall Equity Scorecard Project – Final Report – Measuring Equity in Outcomes for Students at
Washington State University Fall 2004 Cohort – Retention Comparison (updated 4/18/07). Percentage of Retained,
Enrolled and Deficient by Group Fall 2005 Cohort – Retention Comparison - Percentage of Retained, Enrolled and Deficient
by Group Field of Study Migration – First-to-Second Year for New Freshmen Field of Study Migration – First-to-Second Year for New Transfers Field of Study Migration (2) First-Year Academic Performance of Students Waived from Freshman Live-in Requirement Freshman Change in Major1 Area to Bachelors/Professional Degree Area by Ethnicity 1-27-
06 Freshman Change in Major1 Area to Bachelors/Professional Degree Area by Gender 1-27-06 Freshman Focus Summary Tables – GPA and retention 2005 Freshman Focus Summary Tables – GPA and retention 2006 Freshman Focus Summary Tables – GPA and retention 2007 Freshman Seminar – Responses to Sub-Committee Report – Follow-up to the Spring 2005
Subcommittee’s Recommendations Freshman Seminar Program – Executive Summary - Spring 2007 Grade Distribution Report Fall 2006 – Pullman Grade Distributions for Selected College of Science Classes Institutions’ Proposed Target Revision – Washington Public Baccalaureate Institutions Multicultural Student Retention Summit: Report on Proposed Recommendations Working
Document New Freshman Historical Profile – Pullman New Transfer Historical Profile – Pullman
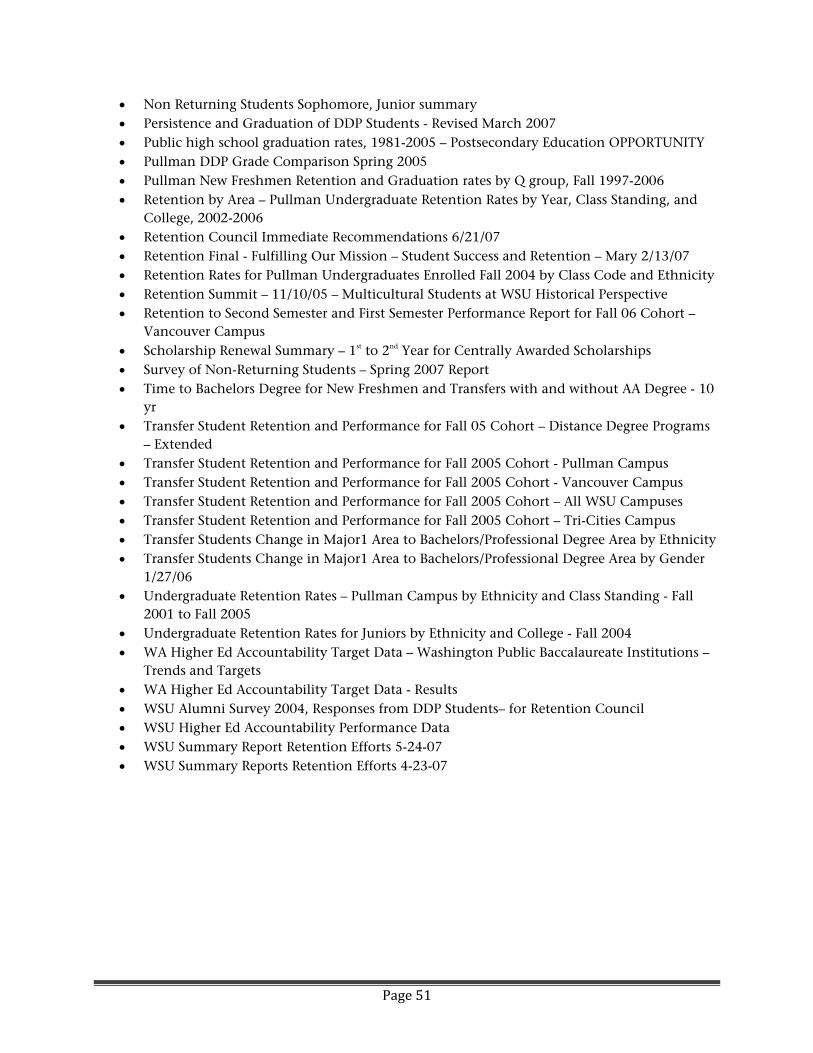
Page 51
Non Returning Students Sophomore, Junior summary Persistence and Graduation of DDP Students - Revised March 2007 Public high school graduation rates, 1981-2005 – Postsecondary Education OPPORTUNITY Pullman DDP Grade Comparison Spring 2005 Pullman New Freshmen Retention and Graduation rates by Q group, Fall 1997-2006 Retention by Area – Pullman Undergraduate Retention Rates by Year, Class Standing, and
College, 2002-2006 Retention Council Immediate Recommendations 6/21/07 Retention Final - Fulfilling Our Mission – Student Success and Retention – Mary 2/13/07 Retention Rates for Pullman Undergraduates Enrolled Fall 2004 by Class Code and Ethnicity Retention Summit – 11/10/05 – Multicultural Students at WSU Historical Perspective Retention to Second Semester and First Semester Performance Report for Fall 06 Cohort –
Vancouver Campus Scholarship Renewal Summary – 1st to 2nd Year for Centrally Awarded Scholarships Survey of Non-Returning Students – Spring 2007 Report Time to Bachelors Degree for New Freshmen and Transfers with and without AA Degree - 10
yr Transfer Student Retention and Performance for Fall 05 Cohort – Distance Degree Programs
– Extended Transfer Student Retention and Performance for Fall 2005 Cohort - Pullman Campus Transfer Student Retention and Performance for Fall 2005 Cohort - Vancouver Campus Transfer Student Retention and Performance for Fall 2005 Cohort – All WSU Campuses Transfer Student Retention and Performance for Fall 2005 Cohort – Tri-Cities Campus Transfer Students Change in Major1 Area to Bachelors/Professional Degree Area by Ethnicity Transfer Students Change in Major1 Area to Bachelors/Professional Degree Area by Gender
1/27/06 Undergraduate Retention Rates – Pullman Campus by Ethnicity and Class Standing - Fall
2001 to Fall 2005 Undergraduate Retention Rates for Juniors by Ethnicity and College - Fall 2004 WA Higher Ed Accountability Target Data – Washington Public Baccalaureate Institutions –
Trends and Targets WA Higher Ed Accountability Target Data - Results WSU Alumni Survey 2004, Responses from DDP Students– for Retention Council WSU Higher Ed Accountability Performance Data WSU Summary Report Retention Efforts 5-24-07 WSU Summary Reports Retention Efforts 4-23-07
Page 52
Bibliography
Academic Advising Committee (2007). Advising at Washington State University: Report provided by the Academic Advising Committee, an ad hoc Faculty Senate Committee.
ACT Inc. (2007). National Collegiate Retention and Persistence to Degree Rates. Iowa City, IA: Retrieved from http://www.act.org/path/policy/pdf/retain_2007.pdf
American Association of State Colleges and Universities (2005). Student Success in State Colleges and Universities. Washington, D.C.: American Association of State Colleges and Universities, Available from http://www.aascu.org/GRO/docs.htm
Angrist, J., Lang, D., Oreopoulos, P., (Dec. 2006). Lead Them to Water and Pay Them to Drink: An Experiment with Services and Incentives for College Achievement. National Bureau of Economic Research (NBER). Abstract retrieved from http://www.nber.org/papers/w12790
Basken, P., (2007). “Federal Panel Shows Greater Tolerance of Letting Colleges Define Their Own Measures of Success.” The Chronicle of Higher Education. Available from http://chronicle.com/temp/email2.php?id=6B93fds6gKcwcBKnHXjFwZ8hXJbRpxBk
Braxton, J. M., (June 2006). “Faculty Professional Choices in Teaching That Foster Student Success.” Commissioned paper, National Postsecondary Education Cooperative (NPEC). Retrieved from http://nces.ed.gov/npec/pdf/Braxton_Report.pdf
Bridges, B. K., & Hayek, J.C., (July 2006). “What Matters to Student Success: A Review of the Literature.” Commissioned paper, National Postsecondary Education Cooperative. Retrieved from http://nces.ed.gov/npec/pdf/Kuh_Team_Report.pdf
Capaldi, E. D., Lombardi, J. V. & Yellen, V., (2006). “Improving Graduation Rates: A Simple Method That Works.” Change, July/August 2006, (Vol. 38, No. 4, pp. 44-60). Available from http://www.carnegiefoundation.org/change/
Center for the Study of College Student Retention (2007). Bedford, NH: http://www.cscsr.org/email.htm
Cost of Recruiting Report: Summary of findings for two-year and four-year institutions (2006). National Research Study by Noel-Levitz, Iowa City, IA: Available from www.noellevitz.com
Chickering, A., & Gamson Z. F., (Eds.), (1987). Seven principles for good practice in undergraduate education. The American Association for Higher Education Bulletin (AASHE), March 1987.
Coughlan, C. L., Robinson, A., & Courtney, K., (May 2006). “Match as Predictor? Exploring the Predictive Validity of the Match between Expectations and Early College Experiences and Student Retention Outcomes.” Presentation at the 46
Annual Forum of the Association for Institutional Research, Chicago, IL., May 14-18, 2006.
Cultivating Campus Cultures that Value Student Success. (2006). Teleconference aired March 30, 2006
by the National Resource Center for the First-year Experience and Students in Transition. Retrieved March 30, 2006, from http://www.sc.edu/fye/index.html
Page 53
Engle, J., & O’Brien, C. (2007). Demography Is Not Destiny: Increasing the Graduation Rates of Low-Income College Students at Large Public Universities. The Pell Institute for the Study of Opportunity in Higher Education. Washington, D.C.
Ewell, P., & Wellman, J., (May 2007). “Enhancing Student Success in Education: Summary Report of the NPEC Initiative and National Symposium on Postsecondary Student Success.” Commissioned paper, National Postsecondary Education Cooperative. Retrieved from http://nces.ed.gov/npec/pdf/Ewell_Report.pdf
The Forgotten Student: Understanding and Supporting Sophomores. (2006). Teleconference aired March 9, 2006 by the National Resource Center for the First-year Experience and Students in Transition. Retrieved March 9, 2006, from http://www.sc.edu/fye/index.html
Hearn, J.C., (October 2006). “Student Success: What Research Suggests for Policy and Practice.” Commissioned paper, National Postsecondary Education Cooperative (NPEC). Retrieved from http://nces.ed.gov/npec/pdf/synth_Hearn.pdf
Hoover, E., (2007). “Practical Steps, Not a 'Magic Template,' Are Key to Student Retention, Officials Are Told.” The Chronicle of Higher Education. Retrieved from http://chronicle.com/daily/2007/10/512n.htm
Hossler, D., (2005). “Managing Student Retention: Is the Glass Half Full, Half Empty, or Simply Empty?” White Paper for AACRAO’s Strategic Enrollment (SEM) Conference, Chicago, IL., November 13-16, 2005.
Horn, L., Carroll, C. D., (Oct. 2006). Placing College Graduation Rates in Context: How 4-Year College Graduation Rates Vary With Selectivity and the Size of Low-Income Enrollment. Report from Institute of Education Sciences (IES) National Center for Education Statistics.
How to Strengthen Advising to Increase Student Success and Retention (2006). Teleconference aired April 4, 2006 by Noel-Levitz, Iowa City, IA: Retrieved April 4, 2006 from https://www.noellevitz.com/
Huesman, R. L., Brown, A. K., Lee, G., Kellogg, J. P., & Radcliffe, P. M., (Sept 2007). “Modeling Student Academic Success: Does Usage of Campus Recreation Facilities Make a Difference?” Paper presented at The National Symposium on Student Retention, Milwaukee WI., September 24•26, 2007.
Kahveci, A., Southerland, S. A., & Gilmer, P. J.,(2006). “Retaining Undergraduate Women in Science, Mathematics, and Engineering.” Journal of College Science Teaching. Nov/Dec 2006; 36, 3; Research Library pg. 34.
Kuh, G. D., Kinzie, J., Buckley, J.A., Bridges, B.K., & Hayek, J.C. (2007). Piecing together the student success puzzle: Research, propositions, and recommendations. San Francisco, CA: Jossey-Bass.
Kuh, G. D., Kinzie, J., Cruce, T., Shoup, R., & Gonyea, R. M., (2007). Connecting the Dots: Multi-Faceted Analyses of the Relationships between Student Engagement Results from the NSSE, and the Institutional Practices and Conditions That Foster Student Success. Bloomington, IN.: Report for Lumina Foundation for Education Grant #2518.
Page 54
Kuh, G. D., Kinzie, J., Schuh, J.H., Whitt, E.J., & Associates (2005). Student Success in College: Creating Conditions that Matter. San Francisco, CA: Jossey-Bass.
Lotkowski, V.A., Robbins, S.B., & Noeth, R.J. (2004). “The role of academic and non-academic factors in improving college retention.” Iowa City, IA: ACT Policy Report. Retrieved from https://asis-spt.ad.wsu.edu/osa/rcg/Shared%20Documents/Literature/college_retention.pdf
National Student Satisfaction and Priorities Report (2007). Noel-Levitz, Iowa City, IA: Retrieved from https://www.noellevitz.com/NR/rdonlyres/CB7710B8-C2B9-4F93- 99D6-BEBEEC9488F4/0/2007NationalStudentSatisfactionReport.pdf
Perna, L. W., & Thomas, S. L., (July 2006). A Framework for Reducing the College Success Gap and Promoting Success for All. Commissioned paper, National Postsecondary Education Cooperative (NPEC). Retrieved from http://nces.ed.gov/npec/pdf/Perna_Thomas_Report.pdf
“Questions That Matter – Setting the Research Agenda on Access and Success in Postsecondary Education. Report of the Social Science Research Council (SSRC) Project Transitions to College: From Theory to Practice.” Retrieved from http://programs.ssrc.org/ki/images/QTM.pdf
Robbins, S., Casillas, A., Allen, J., & Oh, I., Why College Students Stay: Using Academic Performance,
Motivation, and Social Engagement Constructs to Predict Third-year College Retention. Sax, L. J., (May 2005). “Using Entering Student Data to Estimate Campus Retention Rates Report:
Spring 2005.” Paper presented at the annual meeting for the Association for Institutional Research, San Diego, CA. Retrieved from the Higher Education Research Institute (HERI) web page http://www.gseis.ucla.edu/heri/publications-main.php
Smart, J. C., Feldman, K. A., & Ethington, C. A., (July 2006). “Holland's Theory and Patterns of
College Student Success.” Commissioned paper, National Postsecondary Education Cooperative (NPEC). Retrieved from http://nces.ed.gov/npec/pdf/Smart_Team_Report.pdf
Stern, P., Pavelcheck, D., (Nov. 2006). “Predicting Post-Secondary Success.” Washington State University, Social & Economic Research Center (SESRC) – Puget Sound Division.
Swail, W. S., Redd, K. E., & Perna, L W., Retaining Minority Students in Higher Education A Framework for Success. Ashe-Eric Higher Education Report (Vol. 30, No 2). San Francisco: Jossey-Bass, 2006.
Tinto, V. 1993. Leaving College: Rethinking the Causes and Cures of Student Attrition (2nd. edition). Chicago: The University of Chicago Press. Tinto, V., Pusser, B., (June 2006). “Moving From Theory to Action: Building a Model of Institutional
Action for Student Success.” Commissioned paper, National Postsecondary Education Cooperative (NPEC). Retrieved from http://nces.ed.gov/npec/pdf/Tinto_Pusser_Report.pdf
Tinto, V., (July 2004). Student Retention and Graduation Facing the Truth, Living with the Consequences. The Pell Institute for the Study of Opportunity in Higher Education Occasional Paper. Retrieved from http://www.pellinstitute.org/tinto/TintoOccasionalPaperRetention.pdf