Embed Size (px)
Citation preview
Retail Technology in the Next CenturyW h a t ’s “ I n S to re” fo r C o n s u m e r s
An Indiana University–KPMG Study
INDIANA UNIVERSITY
Table of Contents
1 Preface
2 Introduction
5 Consumers’ Current Shopping Behavior
8 Consumers’ Experiences at Discount Stores
10 Overview of Technologies
15 Enhancing the Shopping Experience
20 One-to-One Marketing
24 Conclusion
25 Study Methodology/Participant Demographics
IN
DI
AN
A
UN
IV
ER
SI
TY
—
K
PM
G
ST
UD
Y
1
oday’s retail industry must face one trulysignificant reality — the consumer is in charge. Consumers enjoy more choice than everbefore and have access to an ever-increasing amount of information upon which to base theirbuying decisions. Consumers today are very sophisticated and have a clear understanding ofvalue. What is value? Is it price? Yes. Is it quality? Yes. Is it information? Yes. But it’s alsoselection, convenience, service and entertainment. Providing this value is a dauntingchallenge for retailers.
The Indiana University Center for Education and Research in Retailing (IU Center) andKPMG’s Retail Industry practice believe strongly that successful retailers in the future will be
those able to meet this challenge by understanding theincreasingly sophisticated consumer and by deliveringthe value they expect. The IU Center is dedicated toeducating future retail leaders and executing leading-edge research for the benefit of the retail industry.KPMG, a key partner of the IU Center, deliversunderstandable business advice through a wide rangeof assurance, tax and consulting services.
The IU Center and KPMG are pleased to presentRetail Technology in the Next Century: What’s “InStore” for Consumers, a research study that, true toour mission, takes a hard look at consumers. The focus
is on consumers’ acceptance of technology, but we also present some significant findings onshopping behavior and consumers’ reactions to one-to-one marketing strategies. We would liketo acknowledge IU’s Professor Raymond Burke as the primary researcher in this project and tothank him for his research contributions, which included the design and analysis of the study.
We hope you find this study interesting and thought-provoking. Most important, we hopeyou’re able to use the findings to help you capture the loyalty and buying power of consumers— both today and in the future.
Theresa WilliamsDirector, Center for Education and Research in RetailingIndiana University Kelley School of Business
Mark J. LarsonNational Director — Retail IndustryKPMG
P r e f a c e
T
IN
DI
AN
A
UN
IV
ER
SI
TY
—
K
PM
G
ST
UD
Y
2
here’s a myth about online retailing andit goes like this: The Internet makes it as easy to shop at a store located across the country as at one located across the street — perhaps even easier. Some consultants have gone so faras to say that the physical store may be a liability, burdening the conventional retailer withunnecessary overhead.
With a few exceptions, this claim is not true today. Shopping online is harder than shoppingin a conventional store. Consumers have a difficult time navigating through the vast electroniclandscape and finding stores they can trust and the brands they want. Shoppers cannot touchand feel the merchandise. Orders can take several days to be delivered and shipping costs areexcessive. Customer service is often poor and returns are inconvenient.
So why did retail sales over the Internet jump from $520 million in 1996 to over $8 billion in1998? Why have the market valuations of Internet retailers skyrocketed over the same period?Because the Internet can provide certain advantages that are not delivered in the physical store:
Interactivity
Consumers can electronically search for the products, brands and prices that meet theirindividual requirements.
Product information
The Internet can provide detailed, current product specifications and warranty information,present usage suggestions and address frequently asked questions.
Product selection
Online retailers can offer a virtually unlimited assortment of merchandise.
Personalization
Online retailers can track consumers’ shopping habits and preferences and offer customizedproducts, product suggestions, prices and promotions.
Community
Web sites can allow customers to talk with each other, sharing personal experiences andproduct evaluations.
Dynamic marketing
Products, prices and merchandising can be changed instantly in response to changes inconsumer demand, competitive activities and inventory levels.
Multimedia
Web sites can display animation, sound, video and three-dimensional graphics to capturecustomers’ attention and generate product interest.
I n t r o d u c t i o n
T
IN
DI
AN
A
UN
IV
ER
SI
TY
—
K
PM
G
ST
UD
Y
3
Pushbutton purchase
Online retailers can save addresses and credit card information in a database so consumerscan purchase new items more easily.
At the present time, no single Internet retailer offers all of these benefits. However, some ofthe leading retail sites provide several of these advantages, and consumers have respondedpositively. We can be sure that electronic retailers will work hard to fix their currentproblems. Technologies will continue to evolve, allowing online retailers to display theirmerchandise in more realistic and engaging ways and provide personalized customer service.
Until now, conventional retailers have been slow to react. Many are preoccupied with other,pressing issues such as Y2K, Efficient Consumer Response (ECR), Collaborative Planning,
Forecasting and Replenishment (CPFR) and the ongoing rash ofmergers and acquisitions. Others have expressed concern that if theygo online they will cannibalize the sales of their physical stores. Themajority of those that have reacted have not used Internet shoppingsites to their full advantage. Their sites typically have limitedselections of merchandise, confusing user interfaces and minimaladvertising and promotional support.
What can conventional retailers do to respond to the growing threatof Internet retailing? Should they invest precious resources to buildan online presence or focus on improving their physical stores? Can the Internet be used to draw customers into the store, thusmagnifying the benefits of geographic location? And how can in-store technologies, like kiosks, electronic signage, body scanningand self-checkout, be used to deliver many of the same benefits asonline shopping?
To address these issues, the IU Center and KPMG conducted anational survey of consumers’ acceptance of retail technology. Theprimary goal of this research was to provide retailers with a roadmap to help guide their decisions concerning the adoption and
implementation of new online and in-store technologies. We attempted to:◗ Measure consumers’ satisfaction with the current discount store shopping experience and
their usage of existing technologies;◗ Test consumers’ interest in new retail technologies and assess the potential effects of these
technologies on consumer behavior;◗ Identify which innovations build on retailers’ strengths and which address their
weaknesses;◗ Specify which product categories benefit most from each technology.
One of the areas where technology can have a major impact on retailing is one-to-onemarketing. The goal of one-to-one marketing is to recognize the unique needs, preferencesand shopping habits of individual consumers and tailor marketing programs to their personalrequirements. Technology can play a critical role in this process, collecting consumer data,identifying shoppers at the point of contact and customizing marketing activities. However,
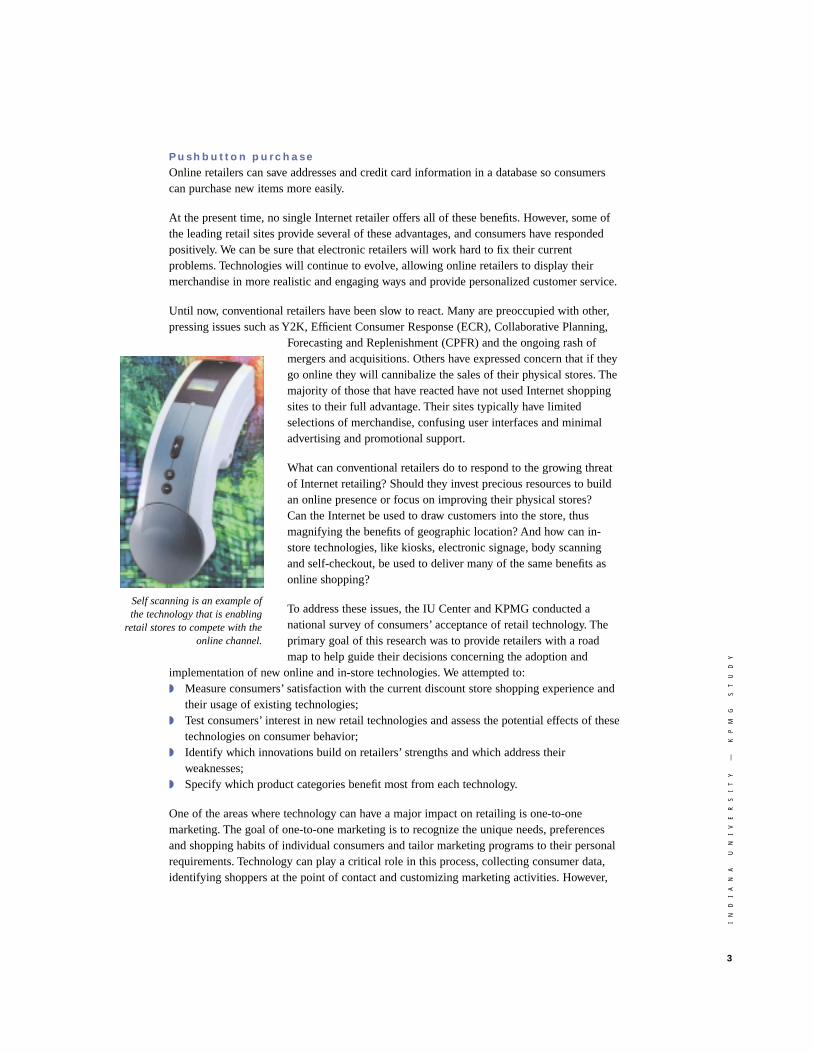
Self scanning is an example ofthe technology that is enabling
retail stores to compete with theonline channel.
IN
DI
AN
A
UN
IV
ER
SI
TY
—
K
PM
G
ST
UD
Y
4
there has been relatively little research on consumers’ evaluation of one-to-one marketingpractices, particularly when they involve the use of technology. Therefore, a secondary goalof the IU-KPMG study was to measure consumers’ willingness to share personalinformation, their interest in personalized marketing programs and their acceptance of thesupporting technologies.
The following report summarizes the key findings from this research and highlights the majorimplications for retail practice in the 21st century.
Raymond R. BurkeE.W. Kelley Professor of Business AdministrationDirector, Customer Interface LabIndiana University
tore-based formats are still
the most frequented shopping channel
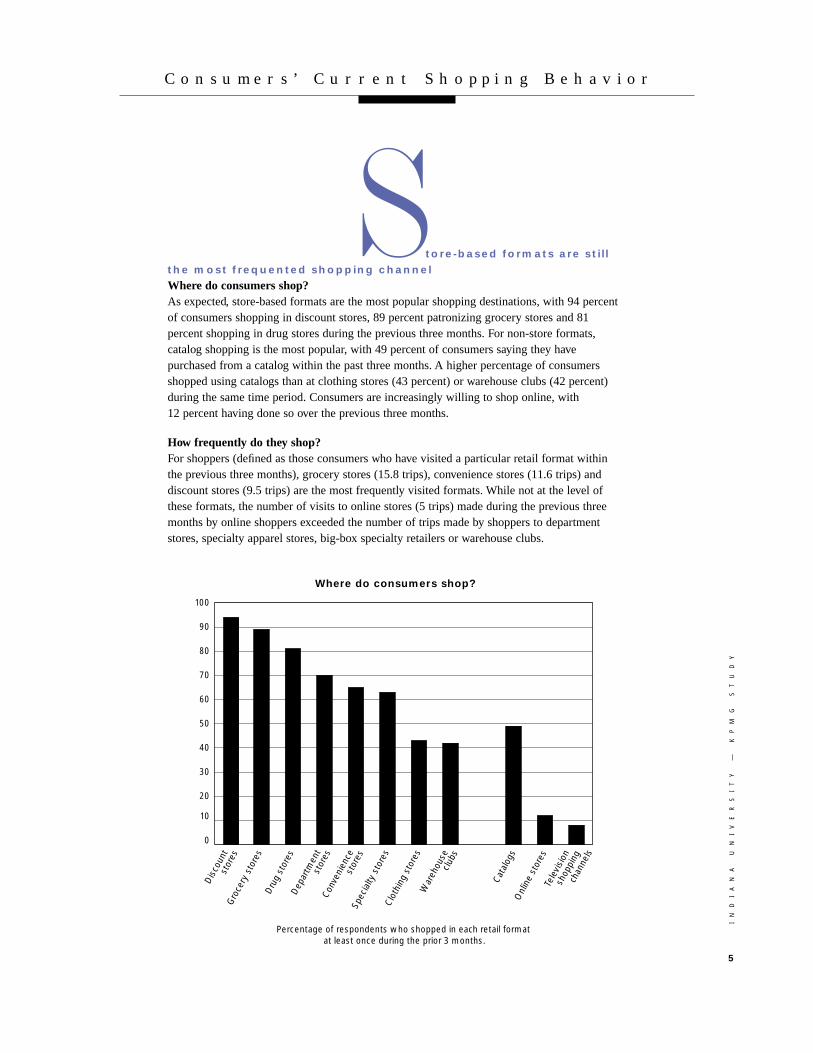
Where do consumers shop?As expected, store-based formats are the most popular shopping destinations, with 94 percentof consumers shopping in discount stores, 89 percent patronizing grocery stores and 81percent shopping in drug stores during the previous three months. For non-store formats,catalog shopping is the most popular, with 49 percent of consumers saying they havepurchased from a catalog within the past three months. A higher percentage of consumersshopped using catalogs than at clothing stores (43 percent) or warehouse clubs (42 percent)during the same time period. Consumers are increasingly willing to shop online, with 12 percent having done so over the previous three months.
How frequently do they shop?For shoppers (defined as those consumers who have visited a particular retail format withinthe previous three months), grocery stores (15.8 trips), convenience stores (11.6 trips) anddiscount stores (9.5 trips) are the most frequently visited formats. While not at the level ofthese formats, the number of visits to online stores (5 trips) made during the previous threemonths by online shoppers exceeded the number of trips made by shoppers to departmentstores, specialty apparel stores, big-box specialty retailers or warehouse clubs.
IN
DI
AN
A
UN
IV
ER
SI
TY
—
K
PM
G
ST
UD
Y
5
C o n s u m e r s ’ C u r r e n t S h o p p i n g B e h a v i o r
S
0
10
20
30
40
50
60
70
80
90
100
Tele
visi
on
Onl
ine
stor
es
Cata
logs
War
ehou
se
Clot
hing
sto
res
Spec
ialty
sto
res
Conv
enie
nce
Dep
artm
ent
Dru
g st
ores
Gro
cery
sto
res
Dis
coun
t
Percentage of respondents who shopped in each retail format at least once during the prior 3 months.
Where do consumers shop?
stor
es
stor
es
stor
es
club
s
shop
ping
chan
nels
IN
DI
AN
A
UN
IV
ER
SI
TY
—
K
PM
G
ST
UD
Y
6
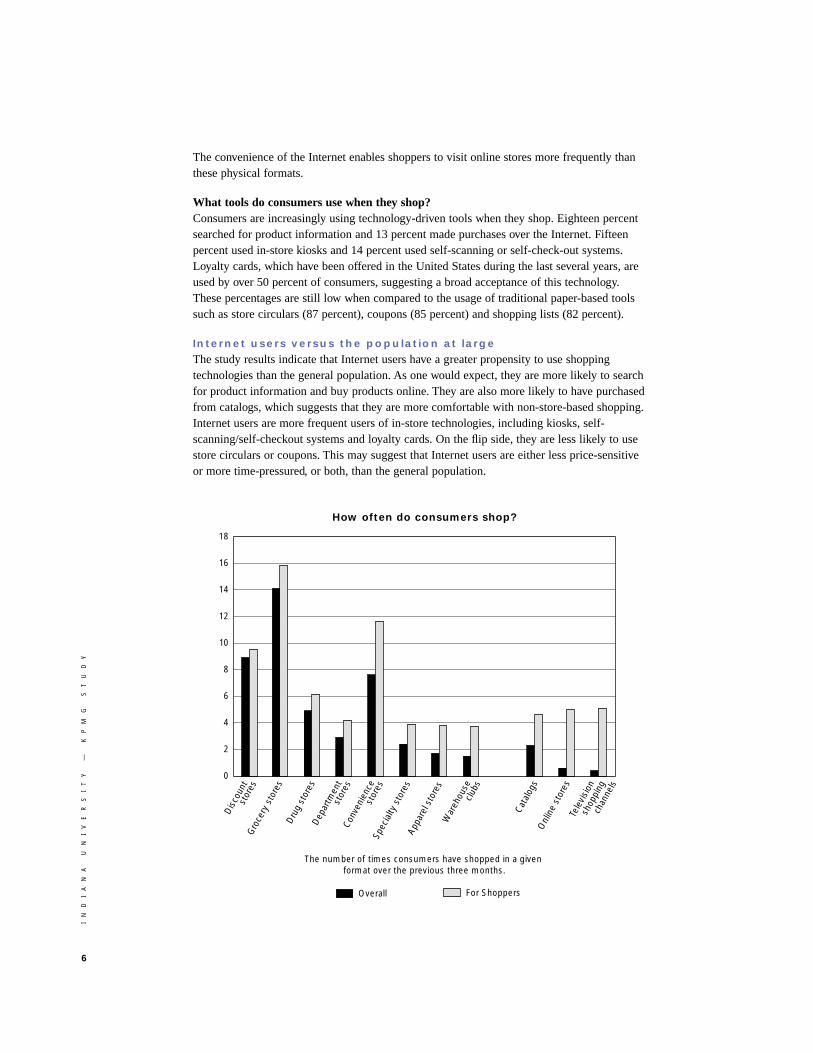
The convenience of the Internet enables shoppers to visit online stores more frequently thanthese physical formats.
What tools do consumers use when they shop?Consumers are increasingly using technology-driven tools when they shop. Eighteen percentsearched for product information and 13 percent made purchases over the Internet. Fifteenpercent used in-store kiosks and 14 percent used self-scanning or self-check-out systems.Loyalty cards, which have been offered in the United States during the last several years, areused by over 50 percent of consumers, suggesting a broad acceptance of this technology.These percentages are still low when compared to the usage of traditional paper-based toolssuch as store circulars (87 percent), coupons (85 percent) and shopping lists (82 percent).
Internet users versus the population at large
The study results indicate that Internet users have a greater propensity to use shoppingtechnologies than the general population. As one would expect, they are more likely to searchfor product information and buy products online. They are also more likely to have purchasedfrom catalogs, which suggests that they are more comfortable with non-store-based shopping.Internet users are more frequent users of in-store technologies, including kiosks, self-scanning/self-checkout systems and loyalty cards. On the flip side, they are less likely to usestore circulars or coupons. This may suggest that Internet users are either less price-sensitiveor more time-pressured, or both, than the general population.
0
2
4
6
8
10
12
14
16
18
For ShoppersOverall
Tele
visi
on
Onl
ine
stor
es
Cata
logs
War
ehou
se
Appa
rel s
tore
s
Spec
ialty
sto
res
Conv
enie
nce
Dep
artm
ent
Dru
g st
ores
Gro
cery
sto
res
Dis
coun
t
The number of times consumers have shopped in a given format over the previous three months.
How often do consumers shop?
shop
ping
chan
nels
club
s
stor
es
stor
es
stor
es
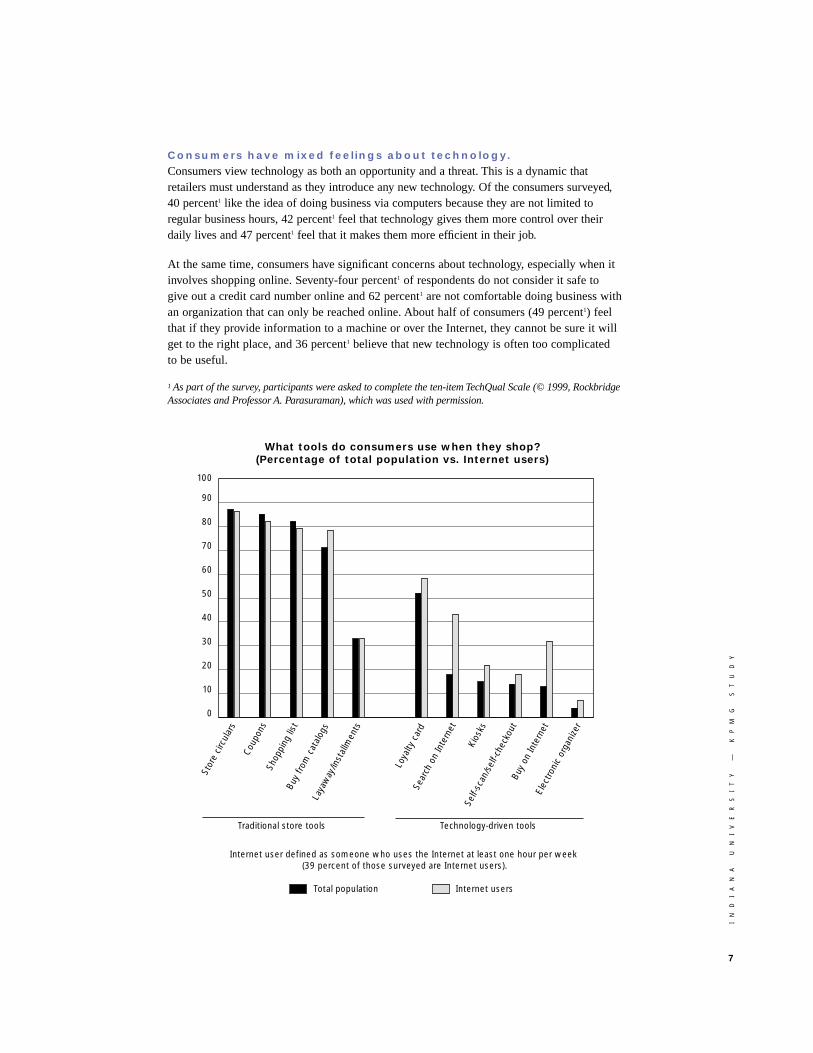
Consumers have mixed feelings about technology.
Consumers view technology as both an opportunity and a threat. This is a dynamic thatretailers must understand as they introduce any new technology. Of the consumers surveyed,40 percent1 like the idea of doing business via computers because they are not limited toregular business hours, 42 percent1 feel that technology gives them more control over theirdaily lives and 47 percent1 feel that it makes them more efficient in their job.
At the same time, consumers have significant concerns about technology, especially when itinvolves shopping online. Seventy-four percent1 of respondents do not consider it safe togive out a credit card number online and 62 percent1 are not comfortable doing business withan organization that can only be reached online. About half of consumers (49 percent1) feelthat if they provide information to a machine or over the Internet, they cannot be sure it willget to the right place, and 36 percent1 believe that new technology is often too complicated to be useful.
1 As part of the survey, participants were asked to complete the ten-item TechQual Scale (© 1999, RockbridgeAssociates and Professor A. Parasuraman), which was used with permission.
IN
DI
AN
A
UN
IV
ER
SI
TY
—
K
PM
G
ST
UD
Y
7
0
10
20
30
40
50
60
70
80
90
100
Internet usersTotal population
Elec
troni
c or
gani
zer
Buy
on In
tern
et
Self-
scan
/sel
f-che
ckou
t
Kios
ks
Sear
ch o
n In
tern
et
Loya
lty c
ard
Laya
way
/inst
allm
ents
Buy
from
cat
alog
s
Shop
ping
list
Coup
ons
Stor
e ci
rcul
ars
Internet user defined as someone who uses the Internet at least one hour per week (39 percent of those surveyed are Internet users).
What tools do consumers use when they shop?(Percentage of total population vs. Internet users)
Traditional store tools Technology-driven tools
IN
DI
AN
A
UN
IV
ER
SI
TY
—
K
PM
G
ST
UD
Y
8
here is no doubt that discount stores havesignificant strengths that appeal to today’s consumer. However, the survey responses point tosome weaknesses that can make conventional discount stores vulnerable to competition fromonline retailers.
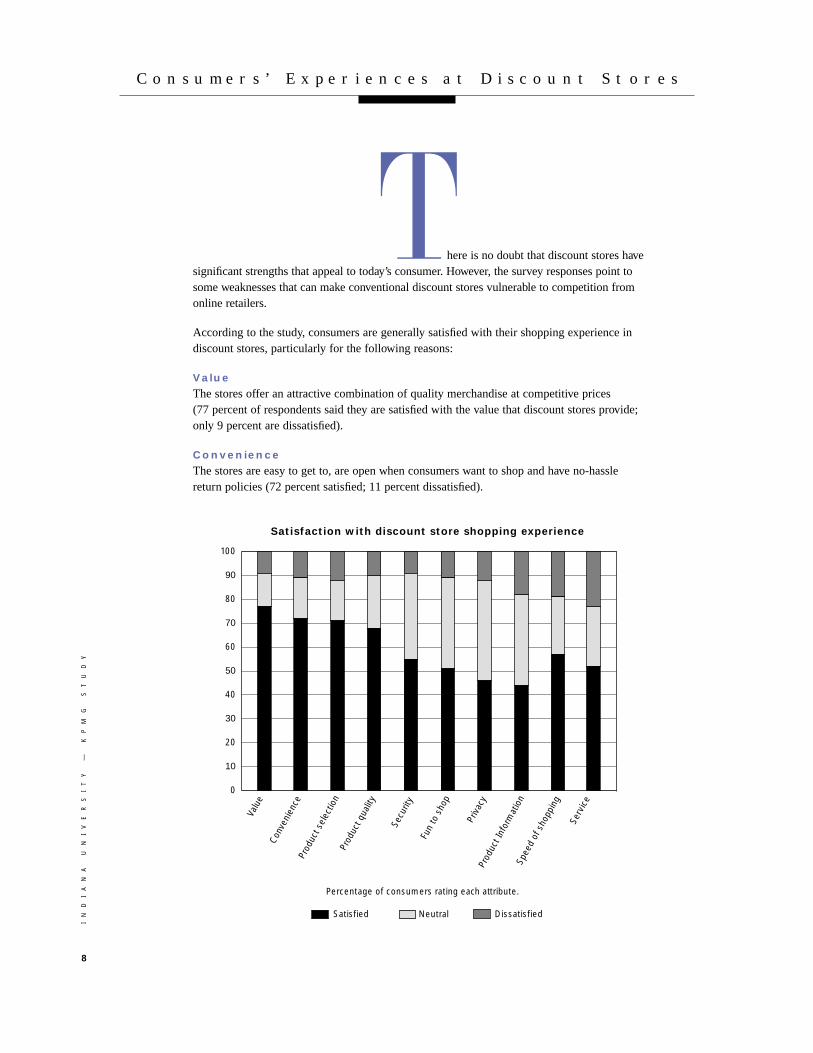
According to the study, consumers are generally satisfied with their shopping experience indiscount stores, particularly for the following reasons:
Value
The stores offer an attractive combination of quality merchandise at competitive prices (77 percent of respondents said they are satisfied with the value that discount stores provide;only 9 percent are dissatisfied).
Convenience
The stores are easy to get to, are open when consumers want to shop and have no-hasslereturn policies (72 percent satisfied; 11 percent dissatisfied).
C o n s u m e r s ’ E x p e r i e n c e s a t D i s c o u n t S t o r e s
T
0
10
20
30
40
50
60
70
80
90
100
DissatisfiedNeutralSatisfied
Prod
uct I
nfor
mat
ion
Priv
acy
Serv
ice
Secu
rity
Fun
to s
hop
Spee
d of
sho
ppin
g
Prod
uct q
ualit
y
Conv
enie
nce
Prod
uct s
elec
tion
Valu
e
Percentage of consumers rating each attribute.
Satisfaction with discount store shopping experience
Product selection
They carry a range of products that suit the needs of most consumers (71 percent satisfied; 12 percent dissatisfied).
Product quality
Items are well-made and meet consumers’ expectations of performance (67 percent satisfied;10 percent dissatisfied).
However, there are a significant number of customers who are displeased with theirexperiences at discount stores. Areas of dissatisfaction that consumers specified in the surveyare as follows:
Levels of service
Knowledgeable employees are available to provideinformation about products and promotions, andprocess consumers’ transactions at the point of sale(52 percent satisfied; 23 percent dissatisfied).
Speed of shopping
The store is easy to navigate, products are easy to findand checkout is completed in a timely manner (57percent satisfied; 19 percent dissatisfied).
Product information
Specific product information is readily availablethrough the product label, store signage or aknowledgeable sales clerk (44 percent satisfied; 18percent dissatisfied).
Internet users
Significantly, the survey results indicate that Internetusers are less-satisfied with the key attributes ofservice, speed of shopping and product informationthan is the total population. These attributes,
particularly speed of shopping and product information, are considered the strengths of onlineretailers. This suggests that discount store retailers may be particularly vulnerable to losingpresent Internet users (39 percent of respondents) who tend to be higher-income and college-educated consumers.
How can discount stores counter these challenges? First, they can emphasize, and even improveupon, their strengths — value, convenience, product selection and product quality. Second, theycan address the weaknesses that may open the door for online retailers. Several technologiesdescribed in the next section can help discount store retailers level the playing field.
IN
DI
AN
A
UN
IV
ER
SI
TY
—
K
PM
G
ST
UD
Y
9
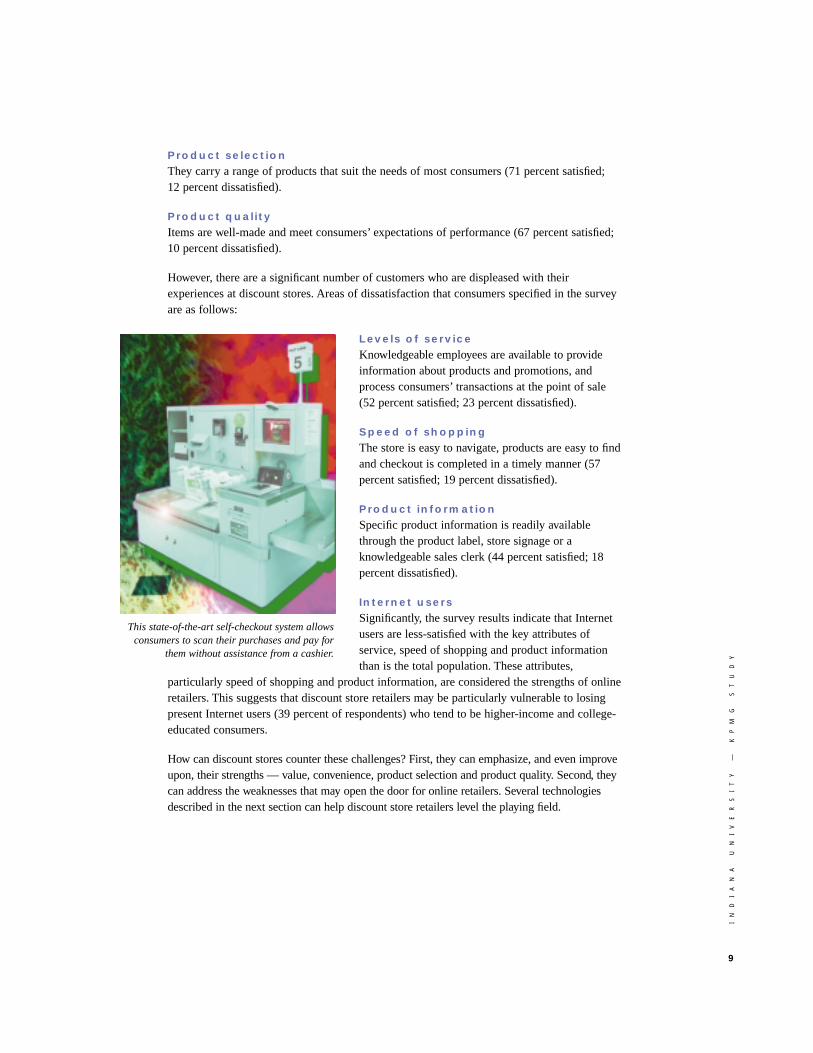
This state-of-the-art self-checkout system allowsconsumers to scan their purchases and pay for
them without assistance from a cashier.
IN
DI
AN
A
UN
IV
ER
SI
TY
—
K
PM
G
ST
UD
Y
10
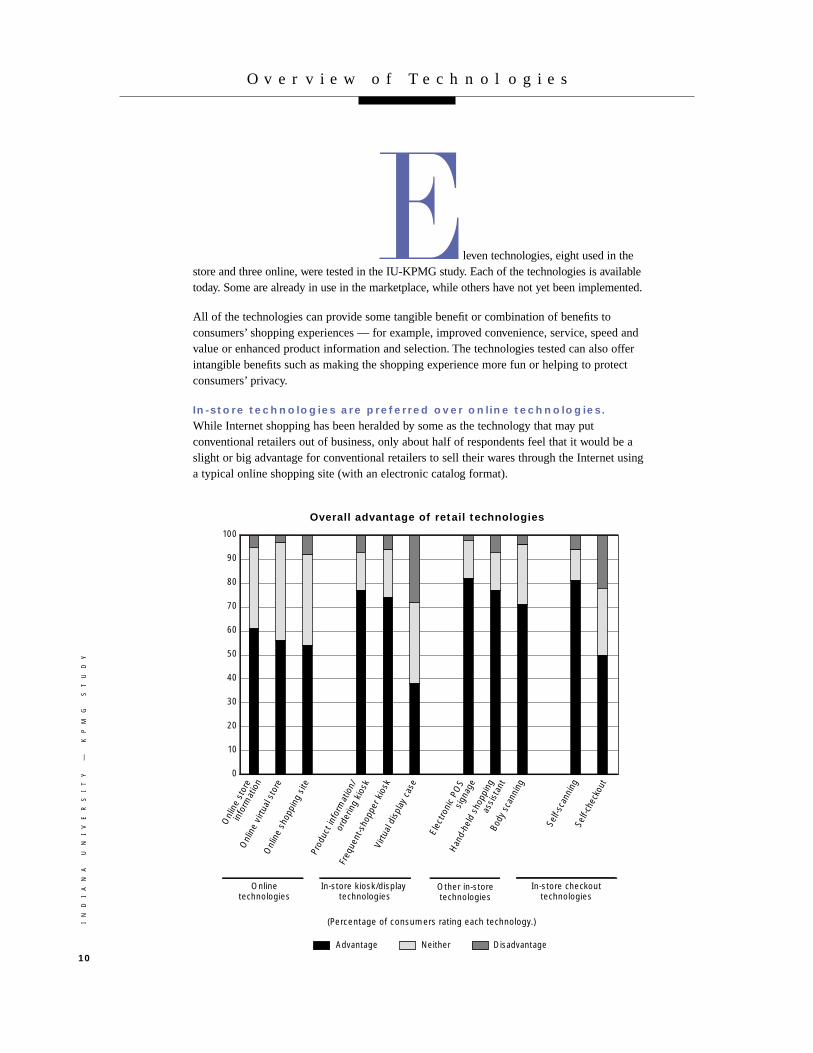
leven technologies, eight used in thestore and three online, were tested in the IU-KPMG study. Each of the technologies is availabletoday. Some are already in use in the marketplace, while others have not yet been implemented.
All of the technologies can provide some tangible benefit or combination of benefits toconsumers’ shopping experiences — for example, improved convenience, service, speed andvalue or enhanced product information and selection. The technologies tested can also offerintangible benefits such as making the shopping experience more fun or helping to protectconsumers’ privacy.
In-store technologies are preferred over online technologies.
While Internet shopping has been heralded by some as the technology that may putconventional retailers out of business, only about half of respondents feel that it would be aslight or big advantage for conventional retailers to sell their wares through the Internet usinga typical online shopping site (with an electronic catalog format).
O v e r v i e w o f T e c h n o l o g i e s
E
0
10
20
30
40
50
60
70
80
90
100
DisadvantageNeitherAdvantage
Self-
chec
kout
Self-
scan
ning
Body
sca
nnin
g
Han
d-he
ld s
hopp
ing
Elec
troni
c PO
S
Virtu
al d
ispl
ay c
ase
Freq
uent
-sho
pper
kio
sk
Prod
uct i
nfor
mat
ion/
Onl
ine
shop
ping
site
Onl
ine
virtu
al s
tore
Onl
ine
stor
e
(Percentage of consumers rating each technology.)
Overall advantage of retail technologies
info
rmat
ion
orde
ring
kios
k
sign
age
assi
stan
t
Onlinetechnologies
In-store kiosk/display technologies
Other in-storetechnologies
In-store checkouttechnologies
IN
DI
AN
A
UN
IV
ER
SI
TY
—
K
PM
G
ST
UD
Y
11
In comparison, over 70 percent believed that they would benefit from the retailers’ adoption of sixof the in-store technologies evaluated in the survey. These include technologies for providingmore accurate and complete product information (the product information/ordering kiosk and thehand-held shopping assistant), pricing (electronic point-of-sale signage and self-scanning) andpromotional information (the frequent-shopper kiosk). Consumers were also enthusiastic about
technologies that would expand the product selection (the productinformation/ordering kiosk), allow them to purchase custom-fit clothing(body scanning) and scan their own purchases to speed checkout (self-scanning). Only 9 percent or less of respondents believed that these sixnew retail technologies would be a disadvantage.
Following is a review of the technologies that were tested, a descriptionof their specific features and a summary of consumers’ reactions.
Online technologies
OverviewThree different types of online technologies were tested — the“traditional” online shopping site, the online 3-D virtual store and theonline store information site. All three require that consumers haveaccess to a computer and the Internet. All three provide detailedproduct information — such as specifications, operating instructions,usage suggestions and warranty information — and allow consumersto search for specific items by entering a product category or brandname. They differ in the way products are displayed on the screen —
in a two- or three-dimensional format — and by whether the site allows consumers to actuallypurchase products online or just retrieve store, product and promotional information.
Online shopping siteThe online shopping site represents the most common form of Internet-based retailing today.Consumers shop from an electronic catalog displaying an extensive selection of merchandise,along with product descriptions, photographs and prices. Consumers can shop at any hourfrom their home or office, purchase products by adding them to an electronic “shoppingbasket,” enter their billing information and have the merchandise shipped directly to themwithin a few business days.
Online 3-D virtual storeThe 3-D virtual store is a more visually realistic online shopping experience. It has the samebasic functionality as the online shopping site, but it allows consumers to see the layout of thevirtual store from above, “walk” down the store aisles, “pick up” products from the virtualstore shelves, rotate packages and magnify their labels for additional information, and “drop”products into a simulated shopping basket. Fulfillment is handled in the same way as theonline shopping site.
Online store information siteThe online store information site provides information about consumers’ local retail store andthe products it carries, with details about store hours, location, travel directions, productavailability and special promotions. Although products cannot be purchased through this site,an online map shows consumers where products are located in the store. Consumers have theoption of placing a 24-hour “courtesy hold” on any product, so they can visit the store andsee the item before making a purchase. Depending on the activities in the physical store, thesite may also show video clips of new store displays, product demonstrations and other
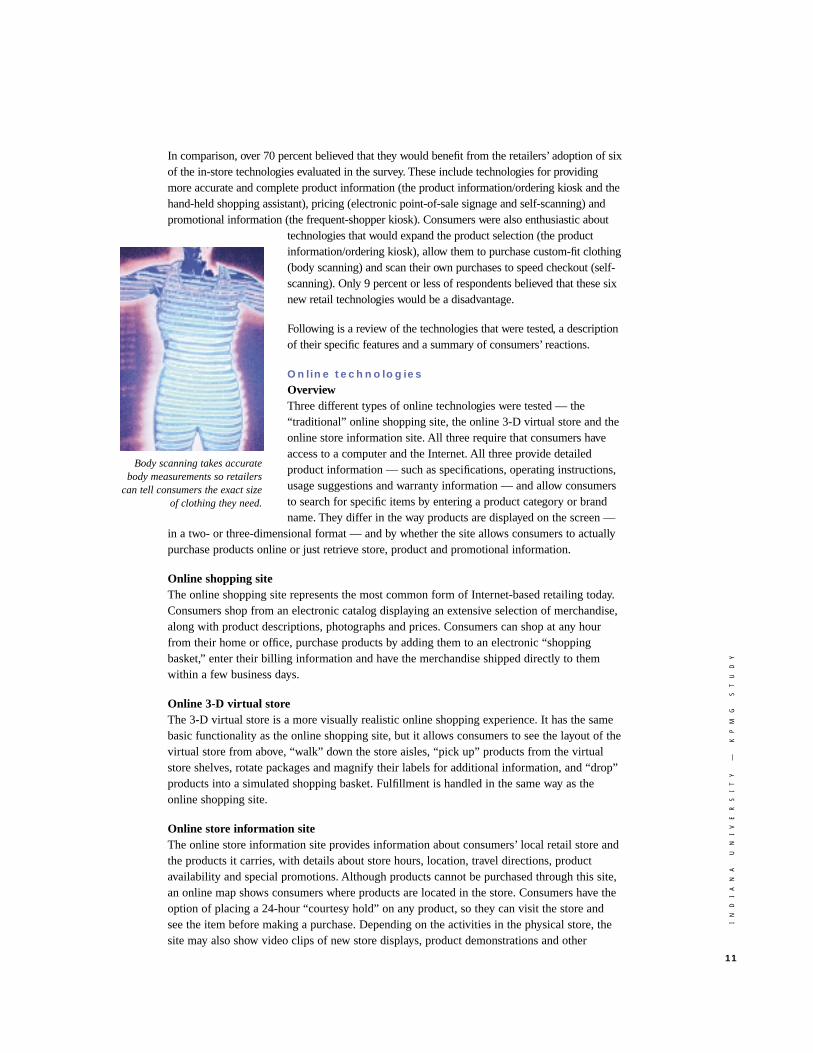
Body scanning takes accuratebody measurements so retailers
can tell consumers the exact sizeof clothing they need.
IN
DI
AN
A
UN
IV
ER
SI
TY
—
K
PM
G
ST
UD
Y
12
events. Members of frequent-shopper programs can receive personalized shoppingsuggestions and a list of possible rewards.
SummaryConsumers were generally positive about all three online technologies. On average, 57percent of shoppers rated the technologies as an advantage, 50 percent indicated that theywould be more likely to shop at a store selling or promoting their wares online, and 63percent said they would use the technologies at least some of the time they shop. Consumerssaw the greatest advantage in online technologies that were directly tied to the in-storeshopping experience. Fifty-six percent believed it would be beneficial to show three-dimensional images of products and store aisles, and 61 percent would like to access localstore information. People cited the convenience of shopping from home at any hour and theability to search for product and pricing information as the most appealing features. Theirgreatest concerns were the inability to touch and feel products when shopping online, thesecurity of their credit card information and their lack of or difficulty in using computers.
In-store kiosk and display technologies
OverviewThree different kinds of in-store kiosk and display technologies were tested. All three areaccessible in the store and do not require consumers to have a computer or Internet access.Their differences revolve around the way products are displayed on screen — in a two- orthree-dimensional format — and whether the device allows consumers to search for productinformation, purchase products, or display customer-specific promotions based on pastpurchasing behavior.
For the promotional site (frequent-shopper kiosk), customers must have a frequent-shoppercard to access the system. The “buying” sites (product information/ordering kiosk and virtualdisplay case) provide product specifications, operating instructions, usage suggestions andwarranty information. Consumers who use the buying sites receive a purchase ticket andneed to see a cashier to pay for the product.
Product information/ordering kiosk The product information/ordering kiosk is an easy-to-use computer and touch-screen videodisplay that provides shoppers with additional information about products in the store as wellas offering an expanded selection of items that can be special ordered. If a product isavailable in the store, the kiosk prints a map of the store and highlights the item’s location.
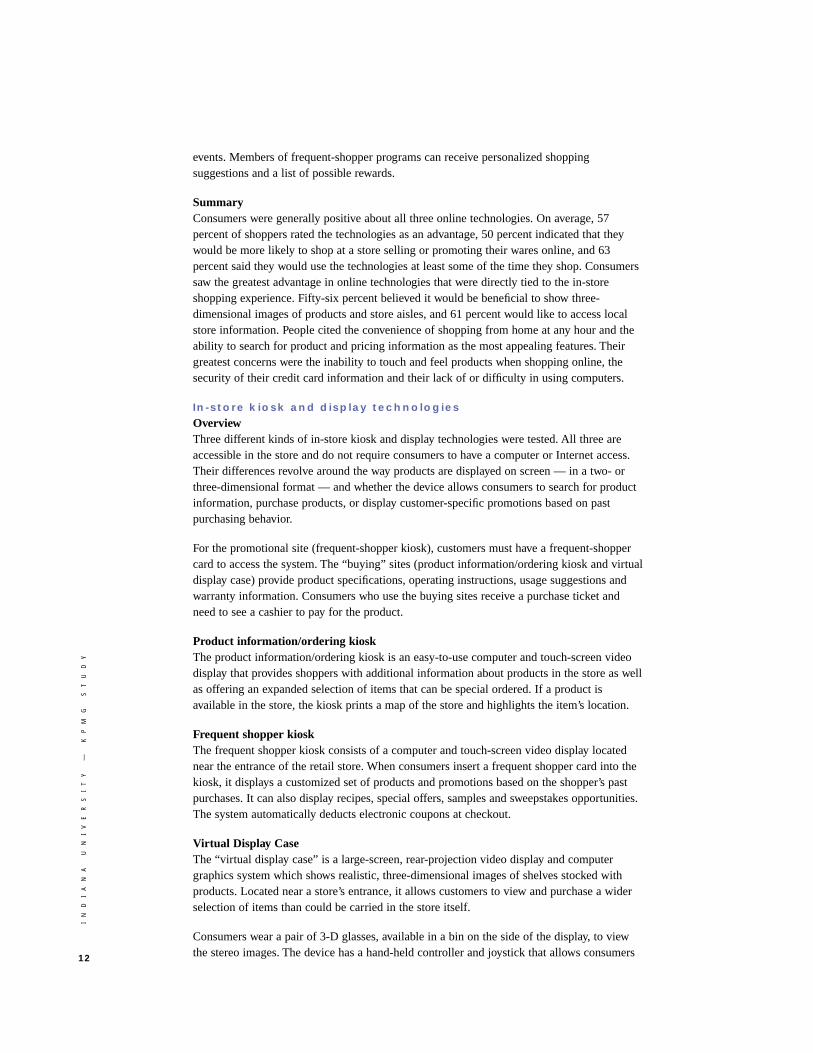
Frequent shopper kiosk The frequent shopper kiosk consists of a computer and touch-screen video display locatednear the entrance of the retail store. When consumers insert a frequent shopper card into thekiosk, it displays a customized set of products and promotions based on the shopper’s pastpurchases. It can also display recipes, special offers, samples and sweepstakes opportunities.The system automatically deducts electronic coupons at checkout.
Virtual Display CaseThe “virtual display case” is a large-screen, rear-projection video display and computergraphics system which shows realistic, three-dimensional images of shelves stocked withproducts. Located near a store’s entrance, it allows customers to view and purchase a widerselection of items than could be carried in the store itself.
Consumers wear a pair of 3-D glasses, available in a bin on the side of the display, to viewthe stereo images. The device has a hand-held controller and joystick that allows consumers
IN
DI
AN
A
UN
IV
ER
SI
TY
—
K
PM
G
ST
UD
Y
13
to select between different product categories, zoom in on shelf displays and pick up productsand examine them from any angle. When products are selected from the virtual shelf, theyappear to float in space. To select a product for purchase, consumers simply drop it into asimulated shopping basket.
SummaryConsumers were very positive about both the product information/ordering and frequentshopper kiosks. On average, 76 percent rated the kiosks as an advantage, 60 percent weremore likely to shop at a store with these technologies, and 80 percent expected to use thetechnologies at least some of the time they shopped. Consumers felt that the product
information/ordering kiosk would make shopping faster and easierby helping them find what they wanted and provide detailed/currentproduct information. Shoppers liked the frequent shopper kioskbecause it would highlight items that were on special and eliminatethe need to clip and carry coupons, thus saving them money. Thevirtual display case received lower scores because the productsshown on the screen could not be physically examined andpurchased in the store, and special glasses were required to view thestereo images. In all three cases, consumers disliked the prospect ofwaiting in line to use the machines and recommended that severalkiosks be installed in each store to accommodate demand.
Other in-store shopping technologies
Electronic point-of-sale (POS) signageElectronic POS signs are battery- or solar-powered liquid-crystaldisplays (LCDs) which show the names and prices of merchandise(including unit pricing and currency conversions). These signs are attached to store shelves, peg hooks or directly to products,replacing conventional price tags and printed shelf labels. Theinformation displayed on the signs is electronically transmitted from the store’s central computer, which also feeds prices to thecheckout registers.
Hand-held shopping assistantThe hand-held shopping assistant is a lightweight palm-size device with a touch-sensitiveLCD screen and a product barcode reader. By scanning the barcodes of products locatedthroughout the store, shoppers can access additional product information such asspecifications, operating instructions, usage suggestions and warranty information. Thisinformation is downloaded through a wireless modem from the manufacturer’s Web site.Shoppers use a store-issued identification card to obtain a shopping assistant from adispenser rack.
Body scanningBody scanning is a computerized system for taking body measurements, which is much moreaccurate than using a tape measure. Retailers who use this technology can tell consumers theexact size of clothing they need, as well as order custom-made products. Dimensions arestored on a “smart card” that can be used at any time in a particular store.
Consumers enter a private scanning booth where a computer uses video cameras to take bodymeasurements from several angles and then generates a 3-D model. Consumers can then selectfrom a variety of clothing styles in assorted colors, and the computer will show them an image
This frequent shopper kioskprovides tailored information
about products, specials, and promotional items.
IN
DI
AN
A
UN
IV
ER
SI
TY
—
K
PM
G
ST
UD
Y
14
of their body wearing the finished clothing. When consumers see something they like, theycan order the clothes, which will be custom-manufactured for their unique measurements.
SummaryAll three of these technologies — electronic POS signage, hand-held shopping assistant andbody scanning — received high ratings from consumers, with at least 70 percent ofrespondents saying the devices improved the shopping experience. Each of the technologieshad unique benefits and drawbacks. For the electronic POS signage, consumers liked havingaccurate price information on the shelf which helped them to make faster product decisionsand avoid errors and manual price checks at checkout. Their main concerns were that thetechnology might be prone to failure and that hardware costs would lead to higher store prices.For the hand-held shopping assistant, shoppers were very enthusiastic about having access toaccurate, detailed and current product information without the hassle of looking for a clerkwho may or may not be knowledgeable. They expressed concern that the device might slowdown the shopping process, especially if there are communication delays. Body scanning wasappealing because it helped consumers find clothes that fit without the time-consumingprocess of trying on items. However, consumers worried about their loss of privacy and thepotentially higher cost of custom-made clothing.
In-store checkout technologies
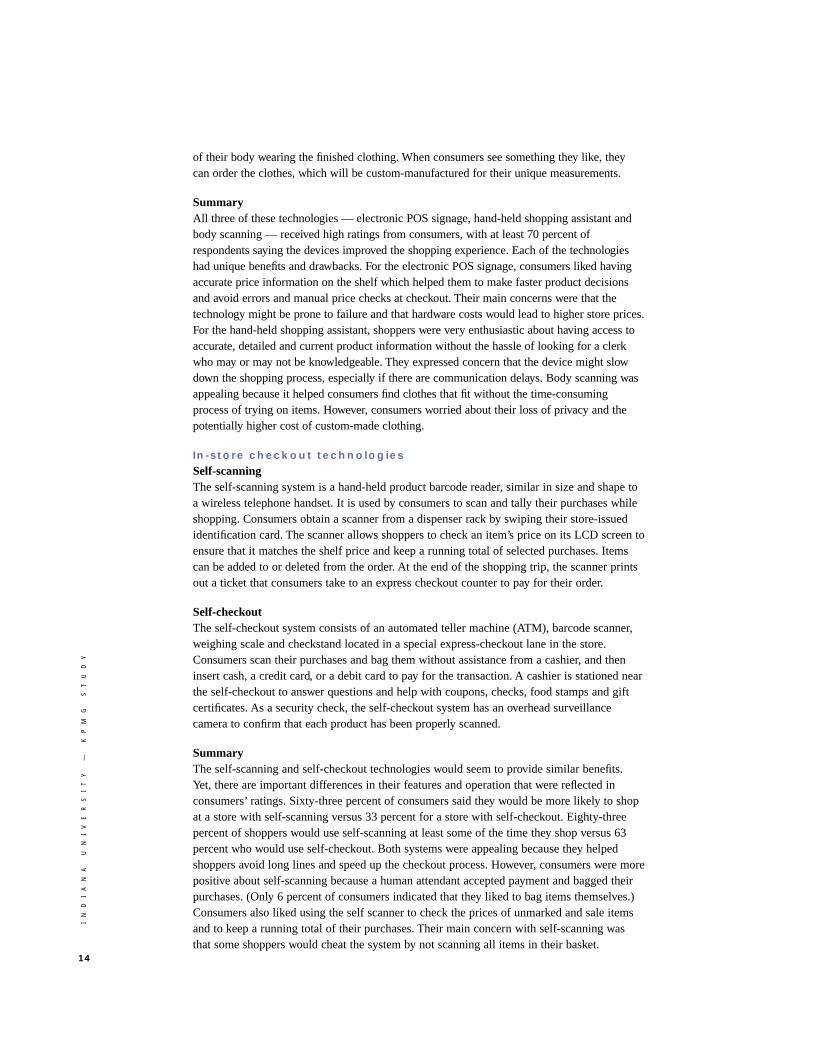
Self-scanningThe self-scanning system is a hand-held product barcode reader, similar in size and shape toa wireless telephone handset. It is used by consumers to scan and tally their purchases whileshopping. Consumers obtain a scanner from a dispenser rack by swiping their store-issuedidentification card. The scanner allows shoppers to check an item’s price on its LCD screen toensure that it matches the shelf price and keep a running total of selected purchases. Itemscan be added to or deleted from the order. At the end of the shopping trip, the scanner printsout a ticket that consumers take to an express checkout counter to pay for their order.
Self-checkoutThe self-checkout system consists of an automated teller machine (ATM), barcode scanner,weighing scale and checkstand located in a special express-checkout lane in the store.Consumers scan their purchases and bag them without assistance from a cashier, and theninsert cash, a credit card, or a debit card to pay for the transaction. A cashier is stationed nearthe self-checkout to answer questions and help with coupons, checks, food stamps and giftcertificates. As a security check, the self-checkout system has an overhead surveillancecamera to confirm that each product has been properly scanned.
SummaryThe self-scanning and self-checkout technologies would seem to provide similar benefits. Yet, there are important differences in their features and operation that were reflected inconsumers’ ratings. Sixty-three percent of consumers said they would be more likely to shopat a store with self-scanning versus 33 percent for a store with self-checkout. Eighty-threepercent of shoppers would use self-scanning at least some of the time they shop versus 63percent who would use self-checkout. Both systems were appealing because they helpedshoppers avoid long lines and speed up the checkout process. However, consumers were morepositive about self-scanning because a human attendant accepted payment and bagged theirpurchases. (Only 6 percent of consumers indicated that they liked to bag items themselves.)Consumers also liked using the self scanner to check the prices of unmarked and sale itemsand to keep a running total of their purchases. Their main concern with self-scanning wasthat some shoppers would cheat the system by not scanning all items in their basket.
IN
DI
AN
A
UN
IV
ER
SI
TY
—
K
PM
G
ST
UD
Y
15
he IU-KPMG study asked consumers (allother things being equal) how they would rate a given store that provided these technologies ona series of attributes versus a store that did not. These attributes were divided into two groupsfor analysis:◗ Attributes that consumers identified as being weaknesses of discount stores — service,
speed of shopping and product information;◗ Attributes that were identified as being discount store strengths — value, convenience,
product selection and product quality.
While all the technologies were seen to enhance the shopping experience in one or more ways, afew stood out in their ability to provide significant improvement on a combination of attributes.
How can technology improve the discount store experience?
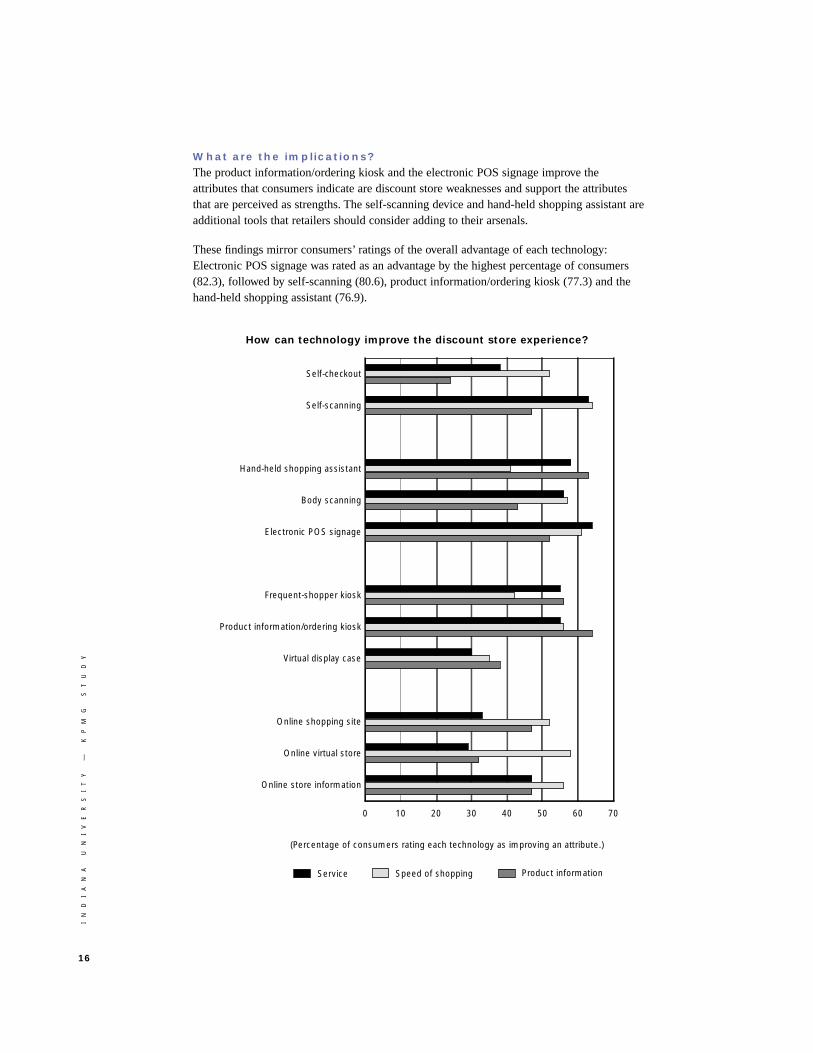
Two technologies in the group — the electronic POS signage and the product information/ordering kiosk — received high marks for their ability to improve each of the identifiedweaknesses of service, speed of shopping and product information. Both technologies receiveda positive rating from 50 percent or more of consumers on each of the three attributes.
Following directly behind these two technologies interms of rankings are self-scanning and the hand-heldshopping assistant. They received strong marks (50 percent or higher) for two of the three attributes,with both technologies improving on the servicedimension. The hand-held shopping assistant scoredwell on “providing product information,” while theself-scanning device enhanced the “speed ofshopping.”
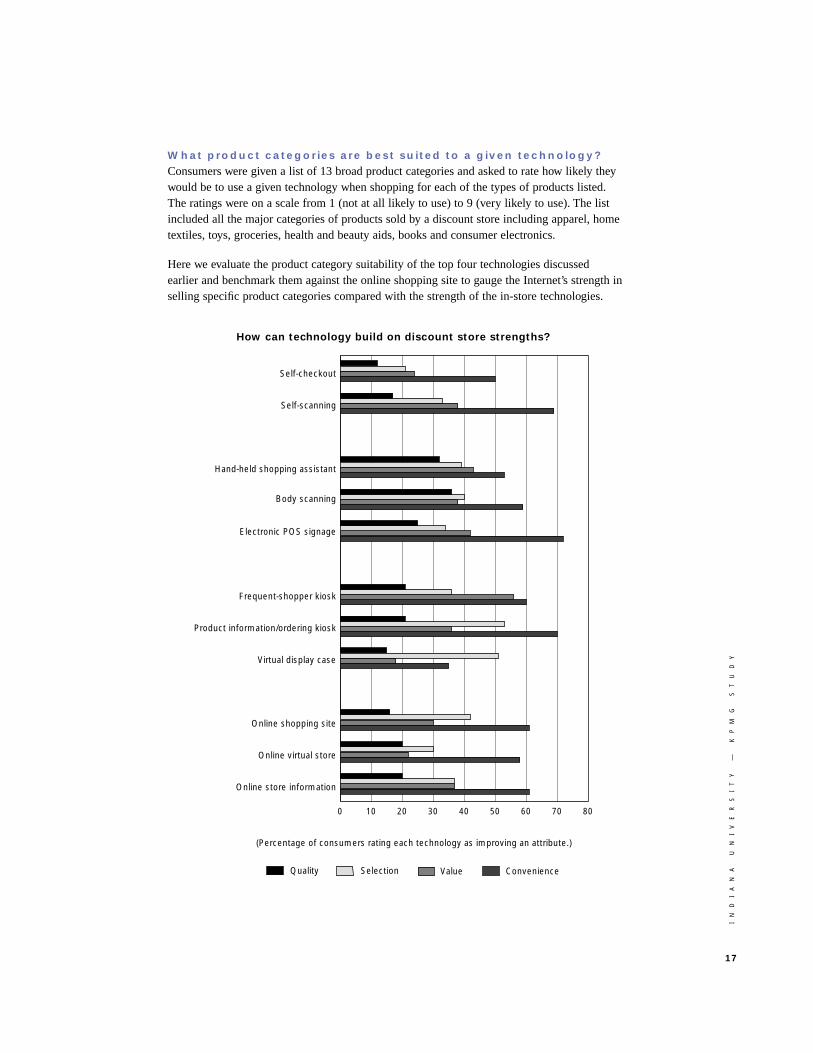
How can technology build on
discount store strengths?
No one technology strongly addressed all theattributes considered discount store strengths. The product information/ordering kiosk had thebest rating overall, driven by its rankings for “convenience” and “product selection.” Thefrequent-shopper kiosk came in a close second with a strong ranking for “convenience” andthe highest ranking of all the technologies tested for enhancing “value.”
While all of the technologies, with the exception of the virtual display case, were perceived byover 50 percent of the consumers surveyed to improve convenience, the electronic POS signagestands out in this group as providing the highest level of convenience. None of the technologiesreceived a high rating for its ability to improve product quality. Body scanning had the bestscore on this dimension, and was, in fact, the only technology tested that could actuallyinfluence product quality. Yet, consumers perceived “convenience” to be its greatest strength.
E n h a n c i n g t h e S h o p p i n g E x p e r i e n c e
T
This self-scanning system scans and talliespurchases while shopping.
IN
DI
AN
A
UN
IV
ER
SI
TY
—
K
PM
G
ST
UD
Y
16
What are the implications?
The product information/ordering kiosk and the electronic POS signage improve theattributes that consumers indicate are discount store weaknesses and support the attributesthat are perceived as strengths. The self-scanning device and hand-held shopping assistant areadditional tools that retailers should consider adding to their arsenals.
These findings mirror consumers’ ratings of the overall advantage of each technology:Electronic POS signage was rated as an advantage by the highest percentage of consumers(82.3), followed by self-scanning (80.6), product information/ordering kiosk (77.3) and thehand-held shopping assistant (76.9).
0 10 20 30 40 50 60 70
Product informationSpeed of shoppingService
Online store information
Online virtual store
Online shopping site
Virtual display case
Product information/ordering kiosk
Frequent-shopper kiosk
Electronic POS signage
Body scanning
Hand-held shopping assistant
Self-scanning
Self-checkout
(Percentage of consumers rating each technology as improving an attribute.)
How can technology improve the discount store experience?
IN
DI
AN
A
UN
IV
ER
SI
TY
—
K
PM
G
ST
UD
Y
17
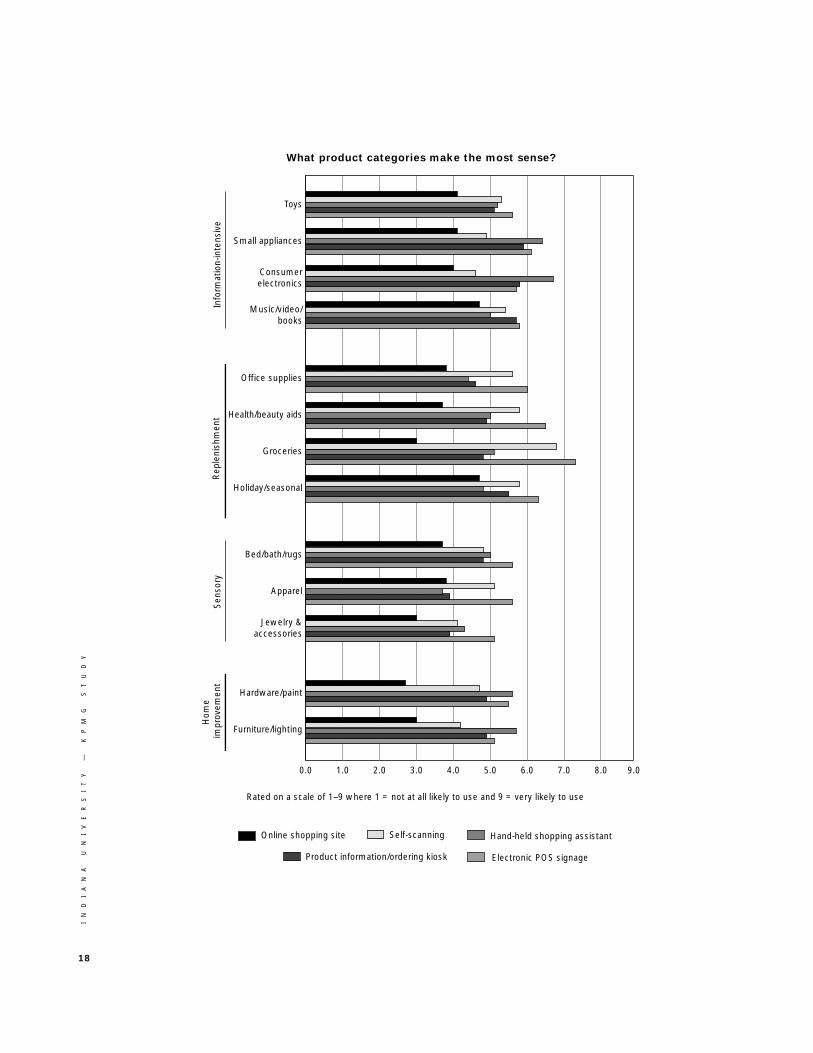
What product categories are best suited to a given technology?
Consumers were given a list of 13 broad product categories and asked to rate how likely theywould be to use a given technology when shopping for each of the types of products listed.The ratings were on a scale from 1 (not at all likely to use) to 9 (very likely to use). The listincluded all the major categories of products sold by a discount store including apparel, hometextiles, toys, groceries, health and beauty aids, books and consumer electronics.
Here we evaluate the product category suitability of the top four technologies discussedearlier and benchmark them against the online shopping site to gauge the Internet’s strength inselling specific product categories compared with the strength of the in-store technologies.
0 10 20 30 40 50 60 70 80
ValueSelectionQuality
Online store information
Online virtual store
Online shopping site
Virtual display case
Product information/ordering kiosk
Frequent-shopper kiosk
Electronic POS signage
Body scanning
Hand-held shopping assistant
Self-scanning
Self-checkout
(Percentage of consumers rating each technology as improving an attribute.)
How can technology build on discount store strengths?
Convenience
IN
DI
AN
A
UN
IV
ER
SI
TY
—
K
PM
G
ST
UD
Y
18
0.0 1.0 2.0 3.0 4.0 5.0 6.0 7.0 8.0 9.0
Jewelry &accessories
Apparel
Bed/bath/rugs
Sen
sory
Furniture/lighting
Hardware/paint
Hom
e im
prov
emen
t
Music/video/books
Consumerelectronics
Small appliances
ToysIn
form
atio
n-in
tens
ive
Holiday/seasonal
Groceries
Health/beauty aids
Office supplies
Rep
leni
shm
ent
Rated on a scale of 1–9 where 1 = not at all likely to use and 9 = very likely to use
Electronic POS signageProduct information/ordering kiosk
Hand-held shopping assistantSelf-scanningOnline shopping site
What product categories make the most sense?
IN
DI
AN
A
UN
IV
ER
SI
TY
—
K
PM
G
ST
UD
Y
19
All categories
Electronic POS signage is unique in that consumers see it as being applicable for everycategory, with the greatest appeal in the frequently purchased categories of grocery and healthand beauty aid products. Consumers appreciate the convenience of having accurate pricing onthe shelf, which helps to avoid time-consuming price checks at the cashier.
Information-intensive categories
Four product categories — music/videos/books, consumer electronics, toys and smallappliances — can best be described as information-intensive categories, either because theyinclude an extensive selection of items (such as books and toys) or because the product iscomplex in nature and the features are not necessarily apparent (such as consumer electronicsand small appliances). These are categories for which consumers are most in need of accurateproduct information.
The product information/ordering kiosk and the hand-held shopping assistant received a higherrating than the online shopping site in virtually every product category. More important, theyoutranked it by a significant margin in the very information-intensive product categories thatare known to be selling strongly on the Internet — music/videos/books, consumer electronics,toys and small appliances.
Consumers were more likely to use the hand-held shopping assistant than the productinformation/ordering kiosk when shopping for small appliances and consumer electronics,perhaps because it’s easier to carry the device with them rather than use something positionedin a central location. However, they had a greater interest in using the kiosk when shoppingfor music, videos and books.
Replenishment categories
The self-scanning device was seen as particularly beneficial in the product categories that arereplenished at regular intervals, such as groceries, health and beauty aids, office supplies andholiday or seasonal merchandise. Because consumers are already familiar with these productsand purchase them as part of a larger shopping trip, they want to minimize the time spentsearching for items, checking prices and paying for their order.
Sensory/high-touch categories
Consumers expressed a strong interest in using body scanning and self-scanning to purchaseapparel. These technologies make it easier to find clothes that fit and then check out quickly.Both the hand-held shopping assistant and the product information/ordering kiosk are seen asbeneficial for the category of home textiles, which includes bed, bath and rugs. The need formore information may be driving consumers’ interest in using these technologies since suchinformation is scarce at the point of purchase. None of these devices was seen as suitable forjewelry or accessories, perhaps because of the unique and personal nature of these items.
Home improvement/design categories
The hand-held shopping assistant and the product information/ordering kiosk had the highestapplicability for the home improvement categories of hardware/paint and furniture/lighting.The need for product information is driving these product categories as well. These are notproducts that consumers shop for on a regular basis — their purchase is usually driven bysome type of home improvement effort — so at the time of purchase consumers need toacquaint themselves with the available items and their features.
IN
DI
AN
A
UN
IV
ER
SI
TY
—
K
PM
G
ST
UD
Y
20
erhaps the most important asset ofconventional retailers is their current customer base. These shoppers know the retailer’sreputation for quality, selection and value, are comfortable shopping in its stores, and feelthey have a relationship with the store, its personnel and products. Technology can play acritical role in building and maintaining these relationships. It can be used to:◗ Learn about the unique needs, preferences and shopping habits of individual consumers;◗ Identify consumers at the point of communication and the point of purchase;◗ Customize retailing activities to better meet the needs of individual shoppers.
The objective of this approach, called “one-to-one” marketing, is to create alearning relationship with each consumer, strengthen customer loyalty andmaximize their lifetime value to the retailer.
Consultants proclaim that one-to-one marketing is nothing short of arevolution. Yet despite this enthusiasm, there has been relatively littleresearch on consumers’ acceptance of these new approaches, particularlywhen they involve the use of technology — until now. The followingresults from the IU-KPMG study deal specifically with technology’s rolein one-to-one marketing and how consumers feel about it.
Consumers like the idea of having retailers
customize marketing activities to their unique
needs and preferences.
Consumers are generally positive about having the retailer tailor itsmarketing activities to their individual requirements. Surprisingly, theyare most positive about merchants charging different prices for differentcustomers, with 63 percent saying they like customized prices and 62percent liking customized promotional offers. Less than 6 percent dislikethis practice. Consumers are also favorable toward customized store
circulars and advertising (54 percent), product assortments (51 percent) and productsuggestions and recommendations (45 percent), with less than 9 percent disapproving.
And they are generally willing to share information about
themselves and their shopping habits.
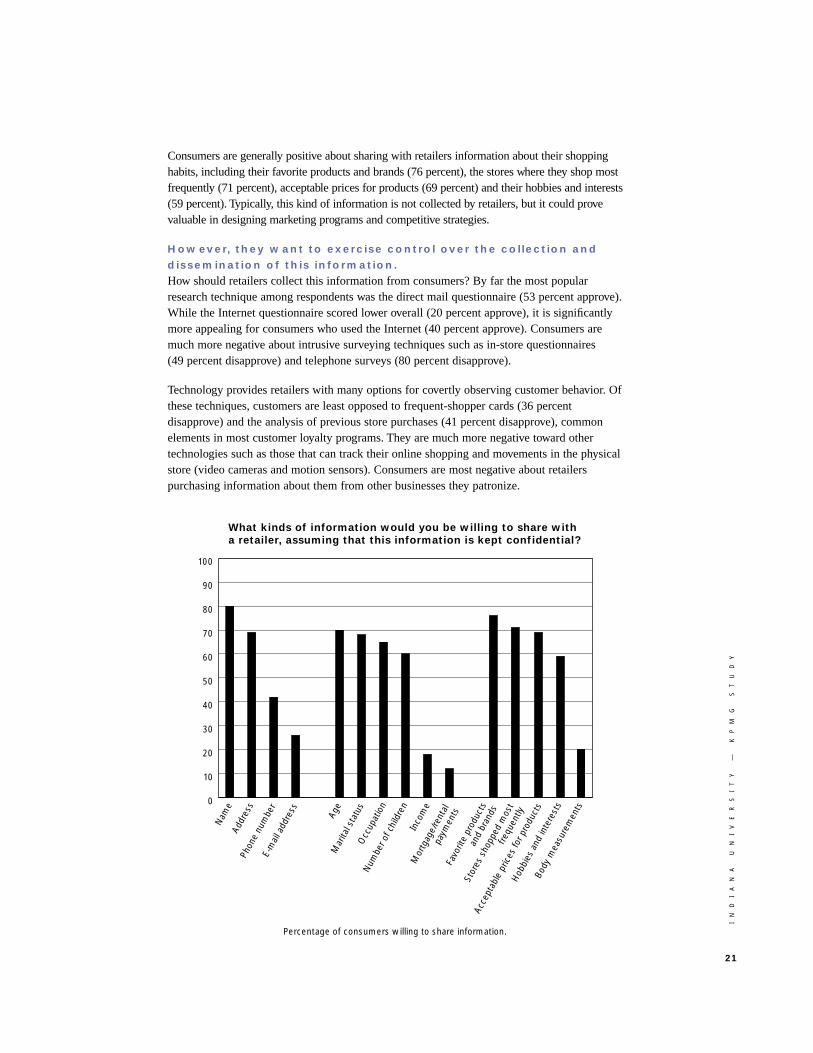
According to the IU-KPMG study, most consumers are willing to share information that wouldallow retailers to contact them individually: Eighty percent would provide their names and 69percent would share their addresses. A smaller percentage is willing to give out their phonenumbers. While the overall willingness to share one’s e-mail address was low (26 percent), thenumbers are, of course, much higher for respondents who are Internet users (50 percent).
Over 60 percent of consumers are willing to provide demographic information about theirage, marital status, occupation and number of children, but consumers are reluctant toprovide financial information such as income and mortgage/rental payments.
O n e - t o - O n e M a r k e t i n g
P
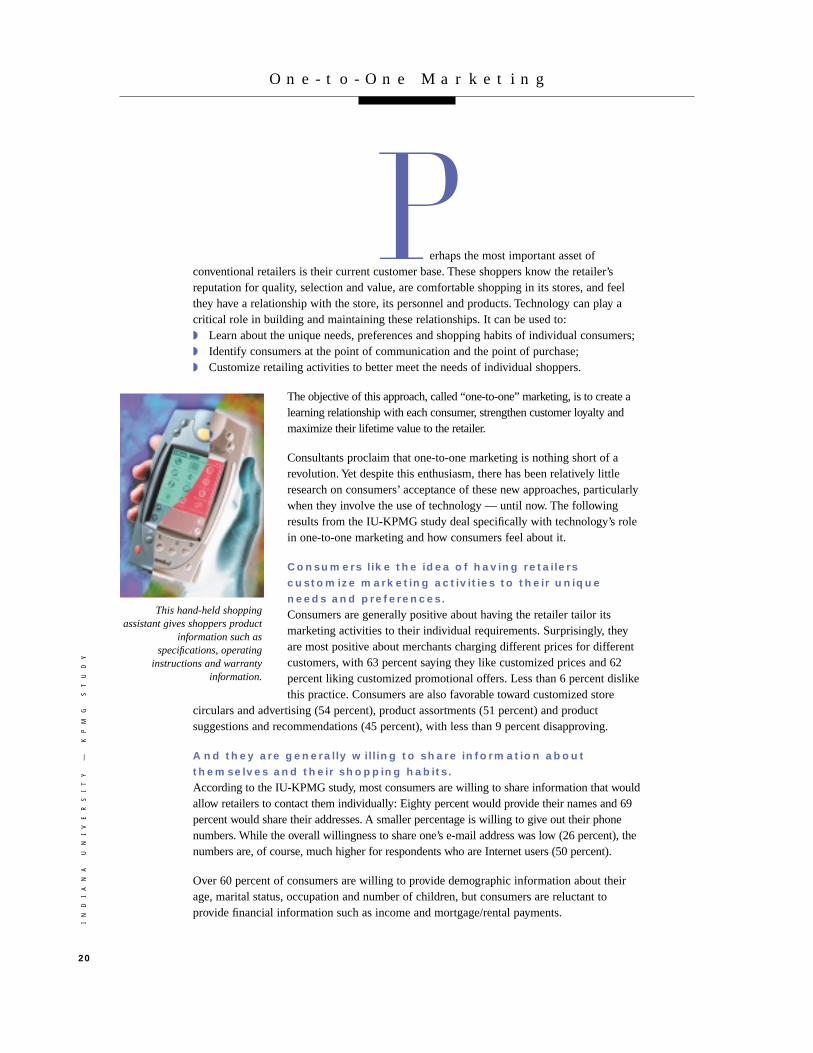
This hand-held shoppingassistant gives shoppers product
information such asspecifications, operating
instructions and warrantyinformation.
IN
DI
AN
A
UN
IV
ER
SI
TY
—
K
PM
G
ST
UD
Y
21
Consumers are generally positive about sharing with retailers information about their shoppinghabits, including their favorite products and brands (76 percent), the stores where they shop mostfrequently (71 percent), acceptable prices for products (69 percent) and their hobbies and interests(59 percent). Typically, this kind of information is not collected by retailers, but it could provevaluable in designing marketing programs and competitive strategies.
However, they want to exercise control over the collection and
dissemination of this information.
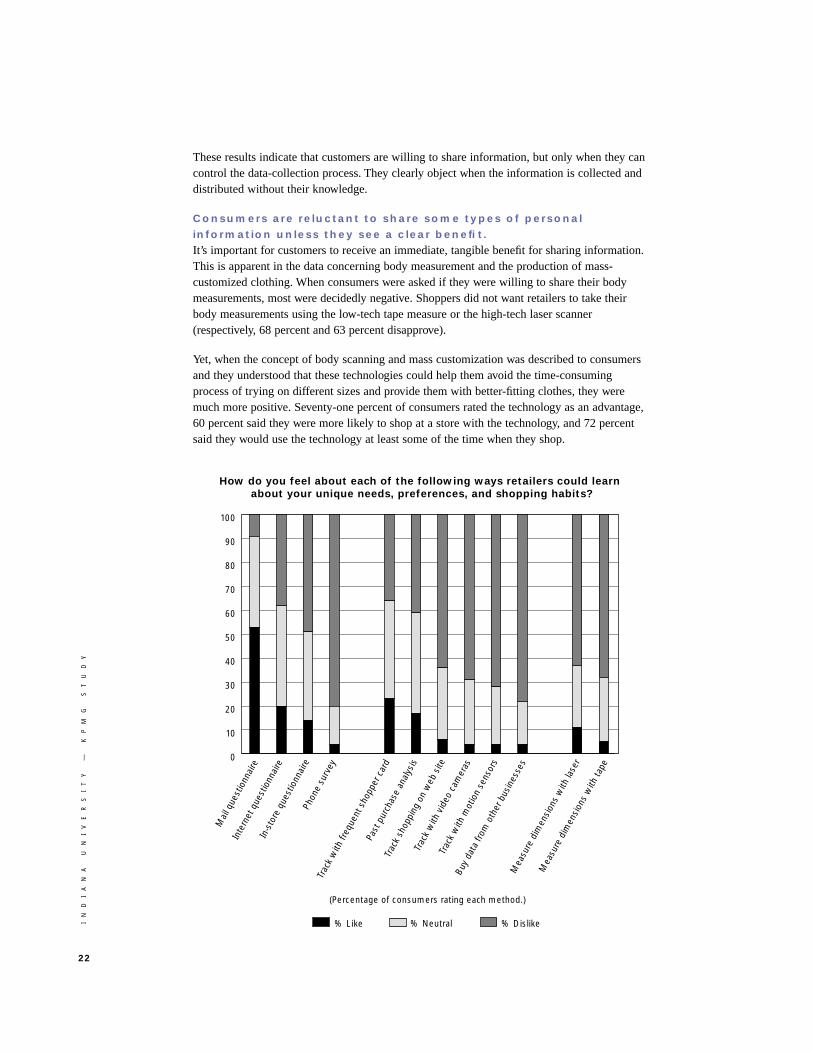
How should retailers collect this information from consumers? By far the most popularresearch technique among respondents was the direct mail questionnaire (53 percent approve).While the Internet questionnaire scored lower overall (20 percent approve), it is significantlymore appealing for consumers who used the Internet (40 percent approve). Consumers aremuch more negative about intrusive surveying techniques such as in-store questionnaires (49 percent disapprove) and telephone surveys (80 percent disapprove).
Technology provides retailers with many options for covertly observing customer behavior. Ofthese techniques, customers are least opposed to frequent-shopper cards (36 percentdisapprove) and the analysis of previous store purchases (41 percent disapprove), commonelements in most customer loyalty programs. They are much more negative toward othertechnologies such as those that can track their online shopping and movements in the physicalstore (video cameras and motion sensors). Consumers are most negative about retailerspurchasing information about them from other businesses they patronize.
0
10
20
30
40
50
60
70
80
90
100
Body
mea
sure
men
ts
Hob
bies
and
inte
rest
s
Acce
ptab
le p
rices
for p
rodu
cts
Stor
es s
hopp
ed m
ost
frequ
ently
Favo
rite
prod
ucts
an
d br
ands
Mor
tgag
e/re
ntal
pa
ymen
ts
Inco
me
Num
ber o
f chi
ldre
n
Occ
upat
ion
Mar
ital s
tatu
s
Age
E-m
ail a
ddre
ss
Phon
e nu
mbe
r
Addr
ess
Nam
e
What kinds of information would you be willing to share with a retailer, assuming that this information is kept confidential?
Percentage of consumers willing to share information.
IN
DI
AN
A
UN
IV
ER
SI
TY
—
K
PM
G
ST
UD
Y
22
These results indicate that customers are willing to share information, but only when they cancontrol the data-collection process. They clearly object when the information is collected anddistributed without their knowledge.
Consumers are reluctant to share some types of personal
information unless they see a clear benefit.
It’s important for customers to receive an immediate, tangible benefit for sharing information.This is apparent in the data concerning body measurement and the production of mass-customized clothing. When consumers were asked if they were willing to share their bodymeasurements, most were decidedly negative. Shoppers did not want retailers to take theirbody measurements using the low-tech tape measure or the high-tech laser scanner(respectively, 68 percent and 63 percent disapprove).
Yet, when the concept of body scanning and mass customization was described to consumersand they understood that these technologies could help them avoid the time-consumingprocess of trying on different sizes and provide them with better-fitting clothes, they weremuch more positive. Seventy-one percent of consumers rated the technology as an advantage,60 percent said they were more likely to shop at a store with the technology, and 72 percentsaid they would use the technology at least some of the time when they shop.
0
10
20
30
40
50
60
70
80
90
100
% Dislike% Neutral% Like
Mea
sure
dim
ensi
ons
with
tape
Mea
sure
dim
ensi
ons
with
lase
r
Buy
data
from
oth
er b
usin
esse
s
Trac
k w
ith m
otio
n se
nsor
s
Trac
k w
ith v
ideo
cam
eras
Trac
k sh
oppi
ng o
n w
eb s
ite
Past
pur
chas
e an
alys
is
Trac
k w
ith fr
eque
nt s
hopp
er c
ard
Phon
e su
rvey
In-s
tore
que
stio
nnai
re
Inte
rnet
que
stio
nnai
re
Mai
l que
stio
nnai
re
How do you feel about each of the following ways retailers could learn about your unique needs, preferences, and shopping habits?
(Percentage of consumers rating each method.)
IN
DI
AN
A
UN
IV
ER
SI
TY
—
K
PM
G
ST
UD
Y
23
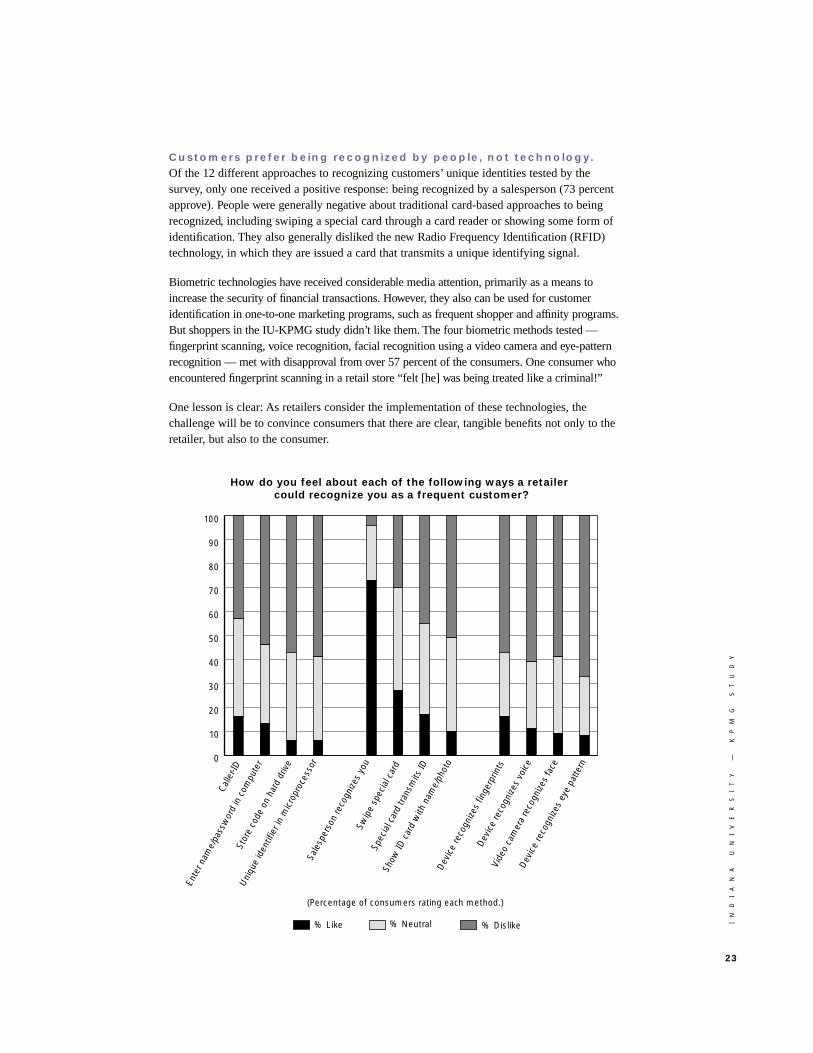
Customers prefer being recognized by people, not technology.
Of the 12 different approaches to recognizing customers’ unique identities tested by thesurvey, only one received a positive response: being recognized by a salesperson (73 percentapprove). People were generally negative about traditional card-based approaches to beingrecognized, including swiping a special card through a card reader or showing some form ofidentification. They also generally disliked the new Radio Frequency Identification (RFID)technology, in which they are issued a card that transmits a unique identifying signal.
Biometric technologies have received considerable media attention, primarily as a means toincrease the security of financial transactions. However, they also can be used for customeridentification in one-to-one marketing programs, such as frequent shopper and affinity programs.But shoppers in the IU-KPMG study didn’t like them. The four biometric methods tested —fingerprint scanning, voice recognition, facial recognition using a video camera and eye-patternrecognition — met with disapproval from over 57 percent of the consumers. One consumer whoencountered fingerprint scanning in a retail store “felt [he] was being treated like a criminal!”
One lesson is clear: As retailers consider the implementation of these technologies, thechallenge will be to convince consumers that there are clear, tangible benefits not only to theretailer, but also to the consumer.
0
10
20
30
40
50
60
70
80
90
100
% Like % Neutral % Dislike
Dev
ice
reco
gnize
s ey
e pa
ttern
Vide
o ca
mer
a re
cogn
izes
face
Dev
ice
reco
gnize
s vo
ice
Dev
ice
reco
gnize
s fin
gerp
rints
Show
ID c
ard
with
nam
e/ph
oto
Spec
ial c
ard
trans
mits
ID
Swip
e sp
ecia
l car
d
Sale
sper
son
reco
gnize
s yo
u
Uni
que
iden
tifie
r in
mic
ropr
oces
sor
Stor
e co
de o
n ha
rd d
rive
Ente
r nam
e/pa
ssw
ord
in c
ompu
ter
Calle
r-ID
How do you feel about each of the following ways a retailer could recognize you as a frequent customer?
(Percentage of consumers rating each method.)
IN
DI
AN
A
UN
IV
ER
SI
TY
—
K
PM
G
ST
UD
Y
24
hat can bricks-and-mortar retailers do torespond to the growing threat of purely online businesses? First, they can use the Internet tomake it easier for consumers to shop in their stores, thus increasing the value of their existinglocations. The IU-KPMG study found that over half of consumers felt that it would be anadvantage for conventional retailers to promote their wares online, and that consumers weremost enthusiastic about technologies that integrated online with in-store activities. A Web sitefor the local store could announce new items, highlight store specials, let consumers checkwhat’s in stock, hold items for pickup and provide store layouts and hours of operation. Byusing product photographs, video clips and 3-D models of the physical store on its Web site,the retailer can leverage consumers’ familiarity with and loyalty to the conventional store,making it easier for shoppers to transition between the online and in-store environments.
Once the consumer is in the store, merchants can use technology to deliver many of the samebenefits as online shopping. Information/ordering kiosks and hand-held shopping assistants canhelp consumers search for the products they want and provide detailed product specifications,usage instructions and warranty information. Body scanning lets shoppers buy merchandisethat fits correctly and avoid the time-consuming process of trying on clothes. Frequent shopperkiosks can display personalized promotions and product suggestions and list the rewardspatrons have earned. Electronic signage and self-scanning technology can provide accuratepricing information and speed checkout.
A key finding from this research is that consumers are willing to embrace new technologies,both online and in the physical store, but only if they enhance the shopping experience.Consumers didn’t ask for barcode scanners, touch-screen kiosks, liquid-crystal displays,stereo glasses, Internet access or any other specific technology. They wanted more accurateprice information, more complete and current product information, help in finding items thatmeet their needs, better selections of merchandise, fewer out-of-stocks and faster checkout.New technologies hold the promise of delivering these benefits to consumers on a mass scalewithout costly increases in staff, floor space and product inventory.
Of course, there are expenses associated with acquiring and installing new technologies,integrating them with existing systems, and educating staff and customers to use them. Tohelp minimize the risk of failure, we suggest that retailers take the following precautions:◗ Experiment with new technologies in the product categories where they deliver the
greatest value;◗ Deploy in-store technologies in communities with a relatively high percentage of
“technology adopters”;◗ Make the technology easy to use and provide support and training;◗ Promote the technology benefits that consumers rated as most important;◗ Minimize or eliminate those aspects of technology that consumers disliked;◗ Track consumer usage of and satisfaction with technologies and make refinements
when necessary.
It’s critical that conventional retailers take these steps now, before customers becomecomfortable with online shopping and loyal to online businesses. If merchants wait until theyfeel the bite on profitability, it may be too late.
C o n c l u s i o n
W
S t u d y M e t h o d o l o g y / P a r t i c i p a n t D e m o g r a p h i c s
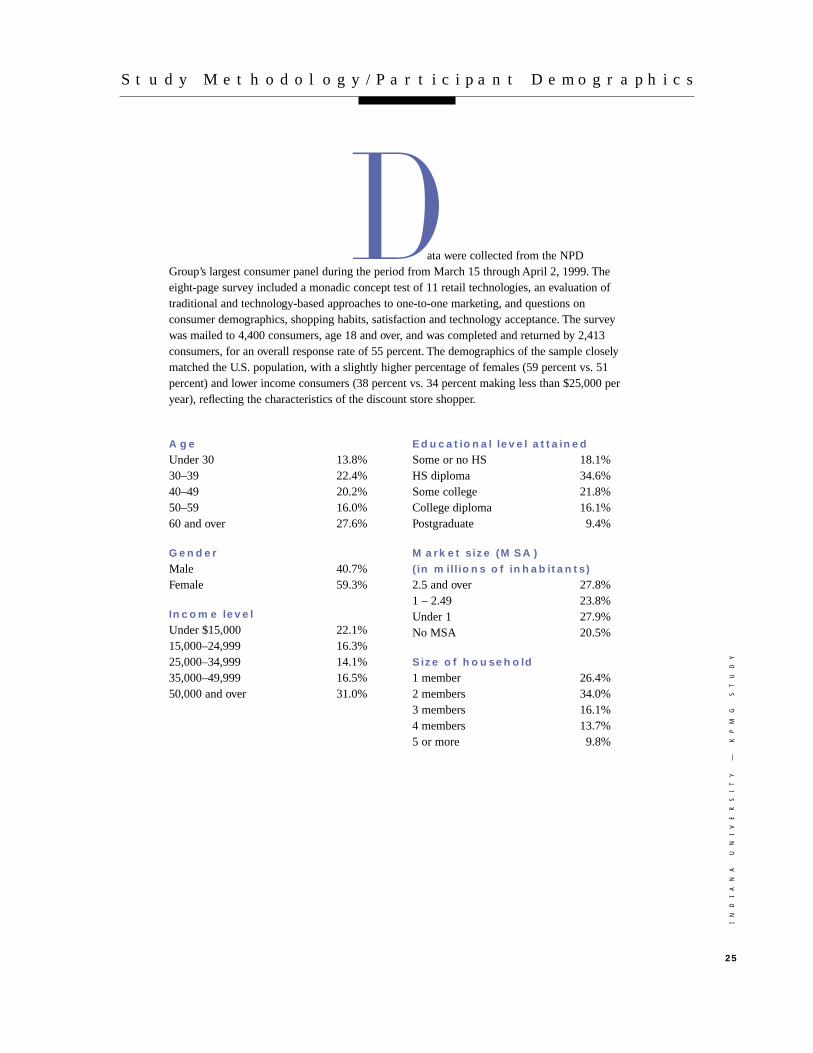
ata were collected from the NPDGroup’s largest consumer panel during the period from March 15 through April 2, 1999. Theeight-page survey included a monadic concept test of 11 retail technologies, an evaluation oftraditional and technology-based approaches to one-to-one marketing, and questions onconsumer demographics, shopping habits, satisfaction and technology acceptance. The surveywas mailed to 4,400 consumers, age 18 and over, and was completed and returned by 2,413consumers, for an overall response rate of 55 percent. The demographics of the sample closelymatched the U.S. population, with a slightly higher percentage of females (59 percent vs. 51percent) and lower income consumers (38 percent vs. 34 percent making less than $25,000 peryear), reflecting the characteristics of the discount store shopper.
DAge
Under 30 13.8%30–39 22.4%40–49 20.2%50–59 16.0%60 and over 27.6%
Gender
Male 40.7%Female 59.3%
Income level
Under $15,000 22.1%15,000–24,999 16.3%25,000–34,999 14.1%35,000–49,999 16.5%50,000 and over 31.0%
Educational level attained
Some or no HS 18.1%HS diploma 34.6%Some college 21.8%College diploma 16.1%Postgraduate 9.4%
Market size (MSA)
(in millions of inhabitants)
2.5 and over 27.8%1 – 2.49 23.8%Under 1 27.9%No MSA 20.5%
Size of household
1 member 26.4%2 members 34.0%3 members 16.1%4 members 13.7%5 or more 9.8%
IN
DI
AN
A
UN
IV
ER
SI
TY
—
K
PM
G
ST
UD
Y
25

Copyright © 1999 by the Trustees of Indiana University.
Copyright © 1999 KPMG LLP, the U.S. member firm of KPMGInternational. All rights reserved. Printed in the U.S.A.