Embed Size (px)
Citation preview

Retail Sourcing Report Facts & Insight
Q4 2017

© 1995-2017 Copyright by CBX Software. All rights reserved.
1
FORWARD
RETAIL SOURCING REPORT
CBX Software’s Retail Sourcing Report provides research and analysis
aimed at informing global sourcing and buying decisions for retailers, brands
and other sourcing professionals. Each issue includes a snapshot of key
information impacting global sourcing, such as economic conditions in
sourcing countries, container shipping prices, currency exchange rates and
commodity costs. We also cover hot topics ourselves and include insight
from analysts and other experts.
If you like this content, please share:
LinkedIn, Facebook, Twitter
Americas +1.858.935.6112
Asia +852.2378.6300
EMEA +44.20.8133.0328
www.cbxsoftware.com
Statement of Indemnity: CBX Software recommends that any information provided in this report be
weighed against other sources and experts on the individual topics covered. As such, CBX Software bears no legal or financial responsibility for any potential harm or outcome which may result directly or indirectly from information provided in this report.

Q4 2017 Retail Sourcing Report
2 2
Content
RETAIL SOURCING REPORT ............................................................................................................................ 0
FORWARD ..................................................................................................................................................... 1
PURCHASING MANAGER’S INDEX (PMI) ................................................................................................... 3
MAJOR ECONOMIC INDICATORS .............................................................................................................. 4
GLOBAL COMPETITIVENESS INDEX ......................................................................................................... 5
CHINA WAGE TREND SNAPSHOT .............................................................................................................. 6
GLOBAL LOW COST SOURCING COUNTRY WAGE SNAPSHOT ........................................................... 7
CONTAINER FREIGHT RATES FOR MAJOR ROUTES ............................................................................. 8
GLOBAL COMMODITY RATES .................................................................................................................. 10
CRUDE OIL ................................................................................................................................................. 10 RUBBER ..................................................................................................................................................... 10 METALS ...................................................................................................................................................... 10 WOOD ........................................................................................................................................................ 11 WOOL, HIDES, COTTON ............................................................................................................................... 11 PLASTICS AND FIBERS ................................................................................................................................. 12
QUALITY FOCUS ........................................................................................................................................ 12
KEY QUALITY KPIS ..................................................................................................................................... 12
SPECIAL FOCUS TOPICS .......................................................................................................................... 13
CHINA’S BELT AND ROAD INITIATIVE ............................................................................................................. 13 RETAIL STORE CLOSURES ........................................................................................................................... 14
ABOUT CBX SOFTWARE ........................................................................................................................... 15

© 1995-2017 Copyright by CBX Software. All rights reserved.
3
Purchasing Manager’s Index (PMI)
To help understand industry and economic conditions in a country, the PMI Index tracks variables such as
output, new orders, stock levels, employment and prices across private companies in the manufacturing,
construction, retail and service sectors. Over 30 countries and regions participate in various PMI surveys.
A reading below 50 indicates contraction from the previous month, while a reading above 50 indicates
growth. This update looks at a selection of emerging economies and key sourcing countries, providing
indicators for recent months based on data provided by IHS Markit, NIKKEI, CAIXIN and other sources.
https://www.markiteconomics.com/public/page.mvc/pressreleases
Q4 News & Analysis: Global manufacturing conditions improved through Q3 alongside economic
expansion. The European region drove strong demand and countries such as Russia and Brazil returned to
growth. With the exception of Malaysia and Myanmar, most Asia manufacturing economies saw growth in
new orders, production output and sustained levels of both domestic and international demand. Despite input
cost pressures and rising inflation, the indicators are that Q4 should be strong quarter for growth.
Country Jul
2017 Aug 2017
Sep 2017
Summary of Indicators
Brazil 50.0 50.9 50.9 Despite cost pressures, Brazilian manufacturing saw sustained growth into Q4 based on domestic and international demand. Inventory levels remained low.
China 51.1 51.6 51.0 Chinese manufacturing saw a sustained improvement through Q3, with expansion in new orders, despite inflation pressures and inspection delays.
Czech Republic
55.3 54.9 56.6 Manufacturing in Czechoslovakia saw strong improvements into Q4, with expansion in new orders, output and export sales and employment growth.
Egypt 48.6 48.9 47.4 Business downturn extended into Q4 with inflation, reductions in new orders, output and employment, despite some improvement in export demand.
India 47.9 51.2 51.2 India saw a sustained improvement in manufacturing conditions into Q4, despite inflation, with increases in new orders, output and employment growth
Indonesia 48.6 50.7 50.4 Business conditions in Indonesia improved into Q4 with an increase in new orders both domestically and for export. Employment increased marginally.
Malaysia 48.3 50.4 49.9 Malaysian manufacturing trended fairly flat heading into Q4 on a decline in new orders and reports of weak demand both domestically and internationally.
Mexico 51.2 52.2 52.8 Manufacturing conditions in Mexico improved at the highest rate in almost 2 years, with order expansion, output increases and employment growth.
Myanmar 49.1 49.3 49.4 Business confidence hit a low in Q3 on contraction in output and, decreased demand alongside cost inflation and labor and raw material shortages.
Poland 52.3 52.5 53.7 Despite input cost inflation, in Q3, Poland saw the fastest increase in new orders in more than 2 years, with output growth and a backlog in fulfillment.
Russia 52.7 51.6 51.9 Russia saw an increase in exports and new orders through Q3 and into Q4, with output and employment growth, alongside input price increases.
South Africa
50.1 49.8 48.5 Business conditions deteriorate through Q3 based on falling output, new orders, employment as well as decreased demand in the domestic market.
South Korea
49.1 49.9 50.6 South Korea’s manufacturing sector recovered somewhat in later Q3/early Q4 on new order growth, despite declines in export demand, especially to China.
Turkey 53.6 55.3 53.5 Manufacturing conditions continued to improve through Q3 and into Q4 in Turkey, with robust growth in orders, output, purchasing and employment.
Vietnam 51.7 51.8 53.3 Vietnam saw robust growth momentum in manufacturing through Q3, with growth in new output, orders and employment, driven by customer demand.
Sources: IHS Markit Economics, Nikkei, Caixin

Q4 2017 Retail Sourcing Report
4 4
Major Economic Indicators
This section looks at major economic indicators from key “low-cost” sourcing destinations, also pulling out
highlights and sourcing trends in these countries.
Q4 News & Analysis: The second half of 2017 looks optimistic for global trade as exports from Turkey,
India, Thailand, Cambodia and other countries all saw yoy increases. China has concluded trade and
development agreements with various countries which will support infrastructure growth and further
economic development, giving China increasing global influence.
Selected Highlights:
Bangladesh –Bangladesh exports grew early in the 2017 fiscal year by 13.84% yoy to US$6.62 billion.
Cambodia – Garment exports grew by only 4% yoy in the first half of 2017, much slower than 9% of 2016.
India – India’s readymade garment exports grew yoy by 4.9% to US$7.5 bln in 1H 2017, faster than 2016.
Indonesia – The Indonesian government launched its 16th economic policy package in Q3 to drive activity.
Pakistan – Pakistan is gearing up to sign two FTA’s with Thailand and Turkey aimed at boosting exports.
Philippines – Philippines’ GDP grew by 6.45% yoy in Q2 2017, due to growth in services and agriculture.
Thailand – Thai exports grew by 10.5% yoy to US$18.85 bln in July, the fifth month with sustained growth.
Turkey – The Turkish economy grew by 5.1% yoy in Q2 2017, the third fastest among G20 countries.
Vietnam – Vietnamese exports grew to US$135.5 bln in the first 8 months of 2017, a 17.9% yoy growth.
CPI (% yoy growth)
Mar 2017
Apr 2017
May 2017
Jun 2017
Jul 2017
Aug 2017
Bangladesh 5.4 5.5 5.8 5.9 - -
Cambodia 4.2 3.2 2.7 2.3 - -
India 3.9 3.0 2.2 1.5 - -
Indonesia 3.6 4.2 4.3 4.4 3.9 3.8
Pakistan 4.9 4.8 5.0 3.9 - -
Philippines 3.4 3.4 3.1 2.7 2.8 3.1
Thailand 0.8 0.4 0.0 -0.1 0.2 0.3
Turkey 11.3 11.9 11.7 10.9 - -
Vietnam 4.7 4.3 3.2 2.5 2.5 3.4
Exports (% yoy growth)
Mar 2017
Apr 2017
May 2017
Jun 2017
Jul 2017
Aug 2017
Bangladesh 9.8 3.5 1.4 -14.9 - -
Cambodia 48.6 20.3 19.7 37.7 - -
India 27.6 19.8 8.3 4.4 - -
Indonesia 24.3 13.6 24.1 -11.8 41.1 -
Pakistan 3.6 5.2 -11.0 16.2 - -
Philippines 18.1 19.1 14.0 0.8 - -
Thailand 9.0 8.0 12.7 11.7 10.5 -
Turkey 13.5 7.7 12.4 2.3 - -
Vietnam 15.1 16.8 18.4 18.8 18.8 19.3
Imports (% yoy growth)
Mar 2017
Apr 2017
May 2017
Jun 2017
Jul 2017
Aug 2017
Bangladesh 18.2 18.4 7.1 - - -
Cambodia 8.7 2.6 1.1 8.2 - -
India 45.3 49.1 33.1 19.0 - -
Indonesia 17.5 10.5 24.0 -17.2 54.0 -
Pakistan 41.2 30.8 27.9 2.2 - -
Philippines 18.0 -0.1 16.6 -2.5 - -
Thailand 19.2 13.3 18.3 13.7 18.5 -
Turkey 7.0 9.9 21.7 -1.5 - -
Vietnam 24.9 24.0 24.7 24.1 23.6 22.5
Sources: Fung Group, Various Statistical Bureaus

© 1995-2017 Copyright by CBX Software. All rights reserved.
5
Global Competitiveness Index
The Global Competitiveness Index is a ranking of countries based on their competitiveness across different
measures such as government regulations, labor market efficiency, education, infrastructure and other
measures important to doing business in a country. Below is a selection of emerging economies which are
important sourcing locations. Most of these countries are increasing in their competitiveness on various
measures every year, while China remains ahead, but with few relative gains.
Note: The below chart was updated based on data released in January 2017
Global Competitiveness Index: Selected Indicators, 2016-2017 (Ranking of 138 countries)
Rank/138 Bangladesh Cambodia China India Indonesia Pakistan Philippines Thailand Turkey Vietnam
Overall competitiveness
106(↑3) 89(↑4) 28(-) 39(↑41) 41(↑8) 122(↑9) 57(↑9) 34(↑8) 55(↑2) 60(↑12)
Institutions 125(↑7) 104(↑7) 45(↑6) 42(↑18) 56(↓1) 111(↑8) 91(↓14) 84(↓2) 74(↑1) 82(↑3)
Intellectual property protection
129((↑6) 130(↑2) 62(↑1) 42(↑8) 50(↓2) 109(↑3) 74(↓3) 121(↓8) 95(↓13) 92(↓4)
Burden of government regulation
93(↑14) 65(↑4) 21(↑5) 23(↑4) 37(↑4) 75(↑11) 117(↓16) 61(↑20) 71(↓6) 88(↑2)
Strength of investor protection
79(↓37) 94(↓13) 108(↑2) 8(↓2) 79(↓37) 25(↓4) 120(↑1) 36(↓11) 20(↓7) 101(↓1)
Infrastructure 114(↑9) 106(↓5) 42(↓3) 68(↑13) 60(↑2) 116(↑1) 95(↓5) 49(↓5) 48(↑5) 79(↓3)
Quality of roads 113(-) 93(↑1) 39(↑3) 51(↑10) 75(↑5) 77(-) 106(↓9) 60(↓9) 28(↑8) 89(↑4)
Quality of railroad 72(↑3) 98(↑2) 14(↑2) 23(↑6) 39(↑4) 53(↑7) 89(↓5) 77(↑1) 55(↓2) 52(↓4)
Quality of port 89(↑4) 76(↑7) 43(↑7) 48(↑12) 75(↑7) 84(↓18) 113(↓10) 65(↓13) 52(↑1) 77(↓1)
Quality of air transport
115(↑6) 99(↑1) 49(↑2) 63(↑8) 62(↑4) 91(↓12) 116(↓18) 42(↓4) 29(↑4) 86(↓11)
Quality of electricity supply
110(↑10) 106(↑2) 56(↓3) 88(↑10) 89(↓3) 121(↑8) 94(↓5) 61(↓5) 84(↓4) 85(↑2)
Macroeconomic environment
65(↓16) 50(↑14) 8(-) 75(↑16) 30(↑3) 116(↑12) 20(↑4) 13(↑14) 54(↑14) 77(↓8)
Health & primary education
105(↓4) 103(↓16) 41(↑3) 85(↓1) 100(↓20) 128(↓1) 81(↑5) 86(↓19) 79(↓6) 65(↓4)
Higher education & training
118(↑4) 134(↓11) 54(↑14) 81(↑9) 63(↑2) 123(↑1) 58(↑5) 62(↓6) 50(↑5) 83(↑12)
Goods market efficiency
96(↑5) 76(↑17) 56(↑2) 60(↑31) 58(↓3) 117(↓1) 99(↓19) 37(↓7) 52(↓7) 81(↑2)
Prevalence of trade barriers
56(↓12) 86(↓3) 78(-) 47(↑35) 91(↑22) 112(↓6) 60(↓17) 75(↓2) 44(↓2) 108(↓8)
Trade tariffs, %duty
125(↑3) 96(↑1) 118(↓1) 123(↑1) 62(↑2) 134(↑3) 49(↑2) 85(↑6) 76(↓4) 91(↓5)
Burden of customs procedures
116(↑7) 127(↑1) 55(↑1) 37(↑17) 73(↓1) 113(↓2) 121(↓14) 82(↑3) 74(↑8) 103(↓13)
Labor market efficiency
120(↑1) 58(↓20) 39(↓2) 84(↑19) 108(↑7) 129(↑3) 86(↓4) 71(↓4) 126(↑1) 63(↓11)
Cooperation in labor-employer relations
91(↑11) 70(↑6) 47(↑15) 67(↑19) 45(↑4) 134(↓3) 27(↓1) 36(↓2) 119(↓7) 79(↓8)
Flexibility of wage determination
69(↑16) 104(↑3) 82(↓9) 112(↑8) 109(↓24) 120(↓6) 97(↓1) 107(↑4) 62(↓10) 84(↓17)
Pay and productivity
83(↑24) 63(↓6) 27(↓7) 33(↑14) 29(↑4) 97(↓2) 37(↓18) 52(↑1) 94(↓8) 62(↓17)
Business sophistication
107(↑10) 114(↑8) 34(↑4) 35(↑17) 39(↓3) 95(↓9) 52(↓10) 43(↓8) 65(↓7) 96(↑4)
Local supplier quantity
47(↑18) 125(↑6) 16(↓1) 36(↑18) 40(↓1) 102(↓49) 60(↑4) 59(↓25) 41(↓14) 86(↓16)
Local supplier quality
78(↑15) 125(↑3) 57(↑6) 59(↑7) 70(↑4) 111(↓13) 74(↓10) 77(↓18) 48(↑1) 109(↓4)
State of cluster development
77(↓15) 46(↑19) 21(↑3) 27(↑2) 29(↓1) 76(↓8) 66(↓21) 62(↓23) 57(↓5) 53(↑6)
Source: World Economic Forum (WEF)

Q4 2017 Retail Sourcing Report
6 6
China Wage Trend Snapshot
Q4 News & Analysis: At least seven of China’s provinces and regions raised their minimum wage levels through Q3 2017, with Jilin and Henan making increases in October. These provinces which increased wages by between 5% and 18% include: Fujian, Hunan, Guizhou, Tianjin, Inner Mongolia, Beijing, Jilin and Henan. In addition, 13 provinces and regions through China issued new guidelines on salary increases through Q3. These guidelines, which are influential for worker’s expectations, suggest higher increases for operations with higher performance and even freezing or reducing wages at enterprises with operating difficulties or poor performance. However, guideline state that wages should not go lower than minimum levels. Note: These are official wage guidelines mandated by each province or region based on information publicly available as of October 1, 2017. As such these numbers serve as an indicator. Actual wages may include benefits, food, housing and other costs. Minimum wage is typically 40-60% of average total wage.
2015/2017 Minimum Wage Updates (official) Asterisk (*) Shows Variance By District
City/Region/Province Monthly Min Avg Wage (RMB)
Increase % Effective Date
Anhui 1,520 20.6% Nov 1, 2015
Beijing 2,000 5.8% Sep 1, 2017
Fujian 1,700 13.3% Jul 1, 2017
Chongqing 1,500 n/a Jan 1, 2015
Gansu 1,620 10.2% Jun 1, 2017
Guangxi 1,400 16.7% Jan 1, 2015
Guangdong 1,895 22.3% May 1, 2015
Guizhou 1,680 5.0% Jul 1, 2017
Hainan 1,430 12.6% Feb 1, 2016
Heilongjiang 1,480 27.6% Oct 1, 2015
Henan 1,570 8.2% Oct 1, 2017
Hebei 1,650 12.5% Jul 1, 2016
Hubei 1,550 19.2% Sep 1, 2015
Hunan 1,580 13.6% Jul 1, 2017
Inner Mongolia 1,610 8.0% Aug 1, 2017
Jiangsu 1,710 8.1% Jul 1, 2017
Jiangxi 1,530 10.1% Oct 1, 2015
Jilin 1,630 18.1% Oct 1, 2017
Ningxia 1,480 34.5% Nov 1, 2015
Shaanxi 1,680 11.7% May 1, 2017
Shandong 1,810 6.7% Jun 1, 2017
Shanghai 2,300 5% Apr 1, 2017
Shenzhen 2,130 4.9% Jun 1, 2017
Sichuan 1,500 7.1% Jul 1, 2015
Tianjin 2,050 5.1% Jul 1, 2017
Tibet 1,400 16.7% Jan 1, 2015
Xinjiang Uyghur 1,670 12.9% Jul 1, 2015
Yunnan 1,570 10.6% Sep 1, 2015
Zhejiang 1,860 12.7% Nov 1, 2015

© 1995-2017 Copyright by CBX Software. All rights reserved.
7
Global Low Cost Sourcing Country Wage Snapshot
Below is a snapshot of minimum wages in selected Asian sourcing locations, with the addition of Egypt and
Ethiopia. Wages vary by region or province and indicate either an estimated or actual/official rate. In cases
with a distinct variance, we provide an average. With greater visibility into social conditions in low cost
countries, currency fluctuations, increasing unrest and union pressure, wages in traditional low cost sourcing
countries are on the rise. Currency fluctuations mean that these figures are approximate at the time of
finalizing this report.
Q4 News & Analysis: Countries which have announced minimum wage increases recently include:
Cambodia (11% increase effective January 2018), Malaysia, expected for 2018. Multiple regions and
provinces in China have also announced increases for Q3/Q4. Other countries such as India, Myanmar and
Vietnam are still in the process of revising their minimum wage laws.
Notes: Figures are provided in USD/month based on currency exchange as of October 1, 2017. Minimum
wage policies are updated as per data available at the time of finalizing this report and are based primarily
on unskilled wages. Consult sources such as Fair Wage Guide or Wageindicator.org to assess and
calculate benchmarks for wages in particular countries and regions.
BANGLADESH CAMBODIA CHINA EGYPT ETHIOPIA
$68 (Jan 2017) $170 (Jan 2018) $137-$639 (Jan 2017) $172 (Jan 2017) $20-$40 (Jan 2017)
Bangladesh raised the minimum wage for garment workers – up by 77%. To 5,300 Taka ($68) following a labor dispute that shut factories in the Ashulia industrial zone.
Ahead of new elections, Cambodian workers will receive an 11% increase in min. wages effective early 2018. Monthly wages will increase to $170 from $153, of which $5 will be paid by the government.
Minimum wages in China are set by local governments and vary widely by region and how wages are calculated (with housing, food, overtime etc.) Wages continue to increase each year.
Egypt’s official minimum wage (for public workers) was raised to 1,200 EGP/month as of Jan 2017 according to CAPMAS. Actual wages for non-public workers are mostly below this amount.
Many government institutions and public enterprises set their own minimum wages which accounts for variations. Public sector employees are on the low end ($23) while the private sector is higher (+/-$40)
INDIA INDONESIA LAO PDR MALAYSIA MYANMAR
$40-$130 (Jan 2017) $106-$252 (Jan 2017) $111 (Jan 2017) $233-$253 (Jan 2017) $80 (Jan 2017)
Indian min. wages vary by region and skill level; however, the central Indian labor ministry has proposed fixing minimum wages at 15k Rupees/month ($242) as of late 2014 - a big gap between actual rates.
Indonesia wages vary widely by their 34 provinces and regions and skill levels. The provinces suggest an increase for 2017 based on inflation of 3.07% and economic growth of 5.18%, which means a raise of 8.25% for 2017.
Talks are still underway to increase the min. wage, based on rising living costs from a 2011 min. of 626,000 Lao kip ($78) per month to a proposal by labor unions to raise wages to 900,000 Lao kip ($99) in key provinces.
Wages vary by region and are supposed to be review every 2 years. Malaysian officials announced that a new minimum wage for 2018 to bridge the gap between Peninsular Malaysia and East Malaysia.
Myanmar set a minimum wage of 3,600 kyat ($2.80) for an eight-hour work day, in 2015, mostly impacting garment workers. As of 2017, a committee is evaluating a new wage increase.
PHILLIPPINES SRI LANKA THAILAND VIETNAM
$110-220 (Jan 2017) $67 (Jan 2017) $190-$196 (Jan 2017) $113-165 (Jan 2017)
Wages in the Philippines vary by region skills level and wage classification. Wage agreements are constantly being renegotiated in the different regions. We provide an estimate of factory workers across the country.
Sri Lanka’s adopted two laws on minimum wages as of early 2016, mandating a minimum wage of Rs 10,000 (+/- $67) and an increase of Rs 2,500 (+/-f$17) for workers earning less than Rs 40,000 per month (+/- $270)
Thailand implemented a new minimum wage policy as of January 2017, under which min. wages will vary across the 69 provinces. This is the first adjustment since 2013. Wages range from 300 to 310 THB ($8.50-$9) per day for unskilled workers.
Vietnam announced a 7.3% wage increase for 2017, where workers must be compensated between VND 2.58 million ($113) and VND 3,75 million ($165). This is a compromise on worker’s demands for an 11% increase.
Sources: WageIndicator.org, SAFSA, Wikipedia, Local News Reports
Q4 2017 Retail Sourcing Report
8 8
Container Freight Rates for Major Routes
This was a good year for global container shipping which saw container port handling increase by 6% in the
first half of 2017. Shipping consultants, Drewry, reported that the industry should make an operating profit
of around US$6 billion in 2017.
The shipping container was somewhat of a surprise given the political and economic climate with Brexit and
populist movements, a Trump presidency and terrorism. The fourth quarter which is typically the busiest
season of the year, should be strong, but expectations are that rates should back off in the new year.
Asia - Europe Trade Lanes
2017 spot rate levels on the Asia-Europe market have been stable for 2017 compared to the volatility of
2011-2016 which saw bankruptcies, consolidation, rate wars and volatility. This has meant increasing
freight rates but also greater predictability and
stability for major trade lanes. Supply and
demand levels have come closer, with a
reduction in capacity, along with increased
utilization of the backhaul.
While rates dipped somewhat in Q3, predictions
are that rates should increase by 3-5% annually
in the near term. According to Shanghai
Shipping Exchange data, rates from Shanghai to
Rotterdam dropped to $769 per TEU in
September, following a 2 month declining trend.
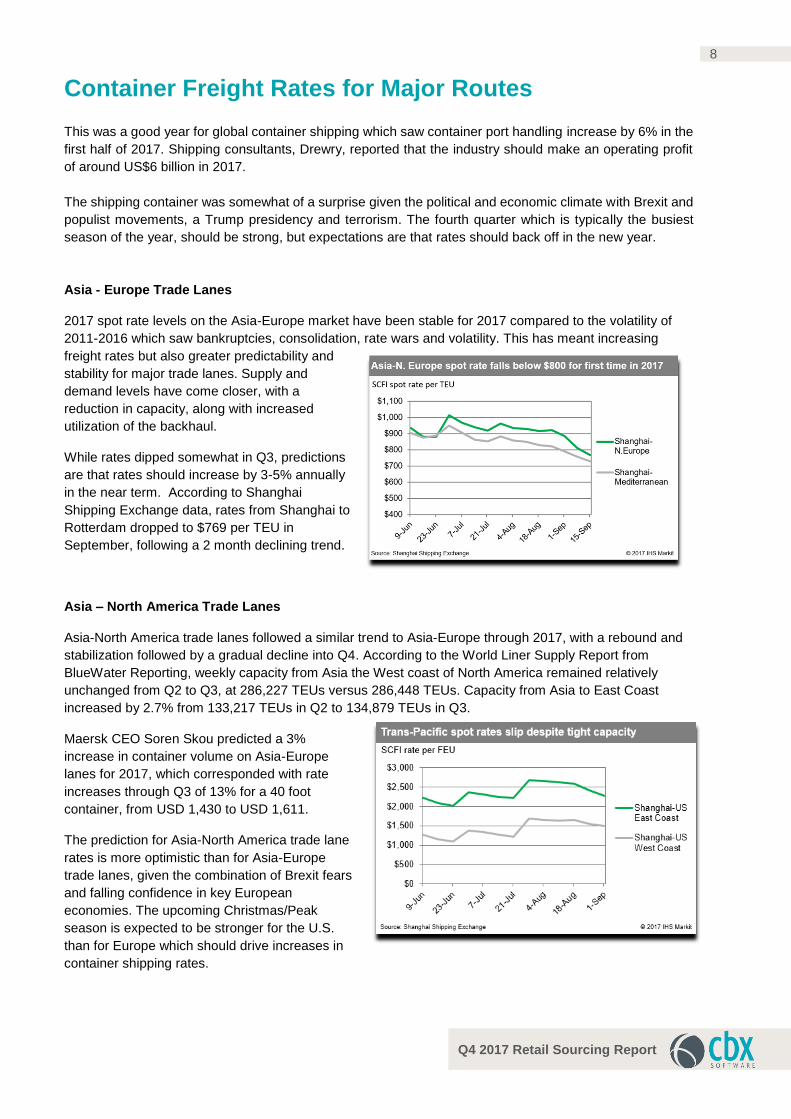
Asia – North America Trade Lanes
Asia-North America trade lanes followed a similar trend to Asia-Europe through 2017, with a rebound and
stabilization followed by a gradual decline into Q4. According to the World Liner Supply Report from
BlueWater Reporting, weekly capacity from Asia the West coast of North America remained relatively
unchanged from Q2 to Q3, at 286,227 TEUs versus 286,448 TEUs. Capacity from Asia to East Coast
increased by 2.7% from 133,217 TEUs in Q2 to 134,879 TEUs in Q3.
Maersk CEO Soren Skou predicted a 3%
increase in container volume on Asia-Europe
lanes for 2017, which corresponded with rate
increases through Q3 of 13% for a 40 foot
container, from USD 1,430 to USD 1,611.
The prediction for Asia-North America trade lane
rates is more optimistic than for Asia-Europe
trade lanes, given the combination of Brexit fears
and falling confidence in key European
economies. The upcoming Christmas/Peak
season is expected to be stronger for the U.S.
than for Europe which should drive increases in
container shipping rates.

© 1995-2017 Copyright by CBX Software. All rights reserved.
9
Currency Exchange Rates
Following are exchange rates and indicators for major currencies commonly factored into global sourcing costing estimations. The US dollar had a rough year, depreciating more than 8% so far, the biggest slump since 2009, however it is expected to make a comeback in 2018. EUR to USD (October 1, 2016 – October 1, 2017)
EUR to CNY (October 1, 2016 – October 1, 2017)
USD / CNY (October 1, 2016 – October 1, 2017)
Sources: Oanda.com, XE.com, News/Analyst Reports
Despite a pick-up in US economic activity, the dollar still depreciated by more than 10% in 2017 against the Euro. The Eurozone economy has performed well, with GDP expected to grow by 2% in 2017.
EUR/USD - Rate
2 years 1.12
1 year 1.12
6 months 1.06
3 months 1.14
30 days 1.18
The EUR is expected to continue an appreciation trend which should continue in 2018. Political risks in the region still linger, but overall the EUR should remain strong against the Chinese Yuan into 2018, especially if the EUR remains strong against the USD.
EUR/CNY - Rate
2 years 7.11
1 year 7.48
6 months 7.34
3 months 7.74
30 days 7.78
The USD continued to lose ground against the Chinese Yuan through Q3 and into Q4, a trend which should continue through the remainder of 2017. China has focused on maintaining stability of their currency ahead of the five-year Communist Party Congress.
USD/CNY - Rate
2 years 6.34
1 year 6.65
6 months 6.89
3 months 6.78
30 days 6.58

Q4 2017 Retail Sourcing Report
10 10
Global Commodity Rates
Q2 News & Analysis: Oil and metal prices have increased through to Q4 due in part to strong demand from
China, which saw an 18.7% yoy growth in September imports. Iron ore shipments to China rose by more
than 10% yoy in September to a record 102.8 mln tons, while crude oil imports reached 9 mln barrels per
day, compared to the daily average of 8.5 mln per day from January to September. According to some
analysts though, strong commodity prices in metals have been sustained by speculation versus demand as
investors look to place money in alternatives to property and infrastructure focused investments.
Crude Oil
Rubber
Metals
40
45
50
55
60Oil US$ per barrel
Dated Brent,lightblend 38 API
Dubai,medium,fob Dubai Fateh32 API
West TexasIntermedia 40API, MidlandTexas
40
60
80
100
120
140
Rubber, Singapore Commodity Exchange, No. 3 Rubber Smoked Sheets, US cents per pound
0
1000
2000
3000
0
4000
8000
12000
16000
20000
24000
Metals US$ per metric ton
Tin Aluminum Copper Nickel Zinc Lead Iron
Natural rubber prices rallied into Q4 based on supply shortages, growth in crude oil prices and rising demand from China. Global prices hovered above 80 cents per pound in September, at least 10 cents higher yoy. Key supplier countries, including Indonesia, Malaysia and Thailand are proposing an output cut which should also impact prices.
Oil prices gained momentum in Q3/Q4 on strong Chinese imports and instability in the Middle East which is still attempting to curb output. Analysts predict that prices are not likely to reach higher than $60 a barrel in 2018, given improvements in efficiency and technology, along with decreased demand from China, the world’s biggest importer. Oil prices hovered around $50 in early October.
Metal prices have followed the trend of other commodities in higher prices based on growth in demand from China, and a weak USD. According to some analysts, a key driver in the rally in base metal prices is Chinese speculation versus a real change in fundamentals. Another issue is excess capacity in some metals such as steel, which could impact prices in 2018.

© 1995-2017 Copyright by CBX Software. All rights reserved.
11
Wood
Wool, Hides, Cotton
Global cotton output is expected to increase by 10% to 25.4 mln tons in 2017-2018 based on growth in production in India and the US, according to the International Cotton Advisory Committee (ICAC). Global consumption is expected to increase by 2.7% this year, while cotton trade is expected to remain stable at 8 mln tons in 2017-2018. The US should be the highest exporter while Bangladesh will be the biggest cotton importer. India, Pakistan, Turkey and Brazil are expected to pick up demand in the coming year. Wool prices pushed higher on demand from emerging markets in Asia and Eastern Europe and a weak USD.
0
100
200
300
400
500
600
700
800
900
Wood US$ per cubic meter
Soft logs
Hard logs
Hard Sawn
Soft Sawn
900
950
1000
1050
1100
1150
Wool, Coarse, Australian Wool Exchange, US cents per kg
950
1050
1150
1250
1350
1450
1550
Wool, fine, Australian Wool Exchange, US cents / kilogram
60
65
70
75
80
Hides, Heavy native steers, wholesale dealer's price, fob Shipping Point, US cents / pound
70
75
80
85
90
Cotton 'A Index', Middling 1-3/32 inch staple, CIF Liverpool, US cents / lb

Q4 2017 Retail Sourcing Report
12 12
Plastics and Fibers
A selection of plastic related prices is provided below. These are calculated from offer prices in the Plasticker
Material Exchange, which provide an indication of trends.
Analysis: Natural disasters such as Hurricane Harvey led to shortages in some plastics in Q3/Q4, including
polyethylene and polypropylene, used in package of both commercial and consumer products. Prices also
increased and are expected to continue rising until the end of the year.
Sources of above commodity charts: IMF data, Index Mundi, Plasticker
Quality Focus
This report frequently covers quality control and quality assurance issues. Audit and inspection data provide
an indicator of activity in various sourcing regions. As we head into the final quarter, inspection and quality
audit demands are reflect the growth in the region. According to Asia Inspection (AI) data, notably for Q3,
inspection and audit volumes rose by 22.7% in Cambodia, 18.7% in Pakistan and 65% for Latin America.
Data shows that manufacturers are still struggling with compliance on working hours and wages, especially
in the textiles and apparel industry.
Key Quality KPIs
0.20
0.30
0.40
0.50
0.60
0.70
0.80
0.90
1.00
Plastics & Fibers, Regrind/ Flakes (Euros/kg)
Nylon
Polyester
ABS
PVC
PP
PS

© 1995-2017 Copyright by CBX Software. All rights reserved.
13
Special Focus Topics
China’s Belt and Road Initiative
China’s plan to create and connect vast sea and land routes across over 60 countries and three continents,
known as the Belt and Road Initiative (BRI), has received considerable attention following a diplomatic forum
in Beijing in May attended by leaders from 28 countries.
Formerly known as One Belt, One Road (OBOR), the BRI consists of two components: an overland Silk
Road Economic Belt connecting China with Central Asia and an ocean based Maritime Silk Road to China’s
South. The plans include improving both infrastructure and creating trade agreements with various countries.
The China led plan pushed by President Xi Jinping, involves around 65 countries in Asia, Europe, the Middle
East and Africa, which make up over 70% of global population and is forecasted to cost around US$4 trillion.
On the plus side
China probably stands to benefit most from the initiative, given that it will create jobs and expand markets
and access to natural resources for China as well as building extensive influence in regional and global
affairs. It will also help to integrate and improve infrastructure and conditions for remote regions of China.
Many developing countries have responded well to the deal, given it will provide necessary infrastructure to
develop their own economies. An example is a China funded railroad in Kenya, connecting Mombasa to
Nairobi, which will eventually integrate African countries such as Uganda, Rwanda and South Sudan.
On the other hand
Some countries and organizations are concerned about the environmental, social and financial risks of the
BRI. Other countries, including Japan, Russia and India are concerned about the geopolitical power and
influence that China will have in the long term if the initiative is realized. So far China has pledged over
US$100 bln to finance project such as the China-Pakistan corridor and a high-speed railway project
connecting China and Singapore. China has also extended around US$900 bln in credit to countries such
as Ethiopia, Kenya and Sri Lanka which is unlikely to ever be repaid.
The United States is also clearly concerned about how this initiative will impact their own strategic and
economic interests and do not want China dominating the Eurasian region. President Trump was noticeably
not present at the Beijing forum and has expressed clear intentions to push in favor of US versus global
interests in all existing and proposed international agreements. The US is still the number one largest
economy, but they recognize the threat from China in what many now call the Asian Century.

Q4 2017 Retail Sourcing Report
14 14
Retail Store Closures
If you are thinking about giving a retail gift card this Christmas, you should consider carefully where you buy
it. This year was a tough one for bricks and mortar retailers in the US, with the recent retail bankruptcy
announcements of Toys R Us, Perfumania and Sears. Reasons for the closures include changing business
models, shifting tastes, growth in e-commerce, consolidation and bankruptcies.
The apparel and electronics sectors saw the largest number of planned and actual closures. Some 2,336
apparel store closures were announced to date, including well-known brands such as The Limited, Wet Seal,
BCB Max Azria and American Apparel, while electronics retailers announced 928 store closures, including
retailers such as hhgregg and Radioshack. Department stores also struggled with Sears/Kmart closing 358
stores, JC Penney, 138 stores and Macy’s 68 stores.
Who is doing well?
While the number of store closures might be scary, it does not mean that bricks and mortar retail dying. In
fact, according to IHL Group, various banners will open 4,162 retail stores in 2017. Retail sectors that are
expanding in the US include wireless retailers such as T-Mobile and Sprint, discount stores such as Dollar
Tree and Dollar General, convenience stores such as 7-Eleven and Couche-Tard (Circle K), along with
European grocery retailers such as Lidl and Aldi.
German retailer and grocery giant, Lidl is expanding in the US, opening 37 locations in the Eastern
seaboard, with plans to open another 100 in 2017.
Aldi, another European grocery retailer announced a $3.4 billion investment in the US, with plans to
grow to 2,500 stores by the end of 2022. This would make Aldi America’s third largest grocery retailer
after Wal-Mart and Kroger.
Walmart plans to grow its stores by 280 in each of 2018 and 2019, most of which will happen in
China and Mexico.
Apple stores ranked number one in sales per square foot, generating $1,560 per square foot, a trend
which is expected to continue.
The challenge for retailers today is to move quickly, satisfy challenging customer demands and effectively
manage inventory and supply chains. It also helps if they can see the future.
© 1995-2017 Copyright by CBX Software. All rights reserved.
15
This exclusive event brings together over 100 sourcing executives at leading retailers and brands to learn and exchange ideas on the most pressing issues in retail global sourcing today.
Topics Include: Strategies for Optimizing your Sourcing Operations, Private Label Sourcing Done
Right, Effective Quality Control, Leveraging Technology for Global Sourcing and more.
Past Attendees Include: Alliance Boots, Berghaus, Dollar General, El Corte Ingles, Marks &
Spencer, MGB Metro, Pets at Home, Poundland, Target, Tchibo – and many more.
To pre-register for a complimentary seat (qualified attendees only):
Contact: Judy Mak at +852 2378 6300 or email [email protected].
About CBX Software
CBX Software is the world’s leading Total Sourcing Management solution provider, from concept, to delivery – combining people, process and solutions. CBX helps retailers and brands streamline product development and sourcing, all the way through order & production. CBX empowers the supply chain network by driving collaboration to over 15,000 retail & supplier partners, 30,000 users in more than 50 countries. For more information, visit www.cbxsoftware.com.
Americas +1.858.935.6112 Asia +852.2378.6300 EMEA +44.20.8133.0328
www.cbxsoftware.com
Click below to learn more about how CBX Software can help!
Request a Callback Request a Demonstration
Don’t miss the 10th Edition of CBX Global Sourcing Day
on December 8, 2017