Embed Size (px)
Citation preview
8/3/2019 Retail Sales Index September 2011
http://slidepdf.com/reader/full/retail-sales-index-september-2011 1/4
RETAIL SALES INDEX
September 2011
DE PARTME NT OF STATISTICS
The RSI is
currently based on
a matched sample
of reporting retail
stores. The sales
data are collected
from these stores
through a monthly
mail survey. The
Department of
Statistics wishes to
acknowledge the
continuous support
of the business
community in
supplying the
required sales data.
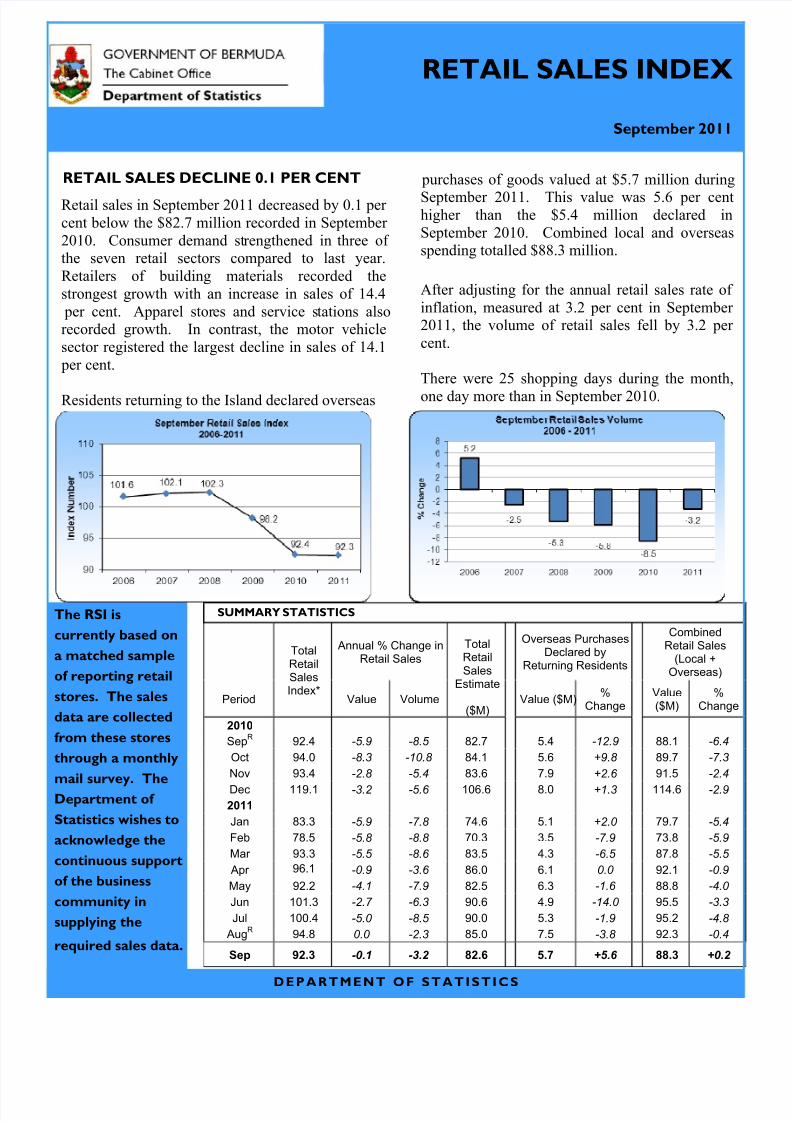
RETAIL SALES DECLINE 0.1 PER CENT
Retail sales in September 2011 decreased by 0.1 per cent below the $82.7 million recorded in September 2010. Consumer demand strengthened in three of the seven retail sectors compared to last year.Retailers of building materials recorded thestrongest growth with an increase in sales of 14.4 per cent. Apparel stores and service stations alsorecorded growth. In contrast, the motor vehiclesector registered the largest decline in sales of 14.1 per cent.
Residents returning to the Island declared overseas
purchases of goods valued at $5.7 million during
September 2011. This value was 5.6 per centhigher than the $5.4 million declared inSeptember 2010. Combined local and overseasspending totalled $88.3 million.
After adjusting for the annual retail sales rate of inflation, measured at 3.2 per cent in September 2011, the volume of retail sales fell by 3.2 per cent.
There were 25 shopping days during the month,
one day more than in September 2010.
SUMMARY STATISTICS
TotalRetailSalesIndex*
Annual % Change inRetail Sales
TotalRetailSales
Estimate
($M)
Overseas PurchasesDeclared by
Returning Residents
CombinedRetail Sales
(Local +Overseas)
Period Value Volume Value ($M)%
ChangeValue($M)
%Change
2010
SepR
92.4 -5.9 -8.5 82.7 5.4 -12.9 88.1 -6.4
Oct 94.0 -8.3 -10.8 84.1 5.6 +9.8 89.7 -7.3
Nov 93.4 -2.8 -5.4 83.6 7.9 +2.6 91.5 -2.4
Dec 119.1 -3.2 -5.6 106.6 8.0 +1.3 114.6 -2.9
2011
Jan 83.3 -5.9 -7.8 74.6 5.1 +2.0 79.7 -5.4
Feb 78.5 -5.8 -8.8 70.3 3.5 -7.9 73.8 -5.9
Mar 93.3 -5.5 -8.6 83.5 4.3 -6.5 87.8 -5.5
Apr 96.1 -0.9 -3.6 86.0 6.1 0.0 92.1 -0.9
May 92.2 -4.1 -7.9 82.5 6.3 -1.6 88.8 -4.0
Jun 101.3 -2.7 -6.3 90.6 4.9 -14.0 95.5 -3.3
Jul 100.4 -5.0 -8.5 90.0 5.3 -1.9 95.2 -4.8
AugR
94.8 0.0 -2.3 85.0 7.5 -3.8 92.3 -0.4
Sep 92.3 -0.1 -3.2 82.6 5.7 +5.6 88.3 +0.2
8/3/2019 Retail Sales Index September 2011
http://slidepdf.com/reader/full/retail-sales-index-september-2011 2/4
BE RMU DA RE TAIL SALE S INDE X
DE PARTME NT OF STATISTICS
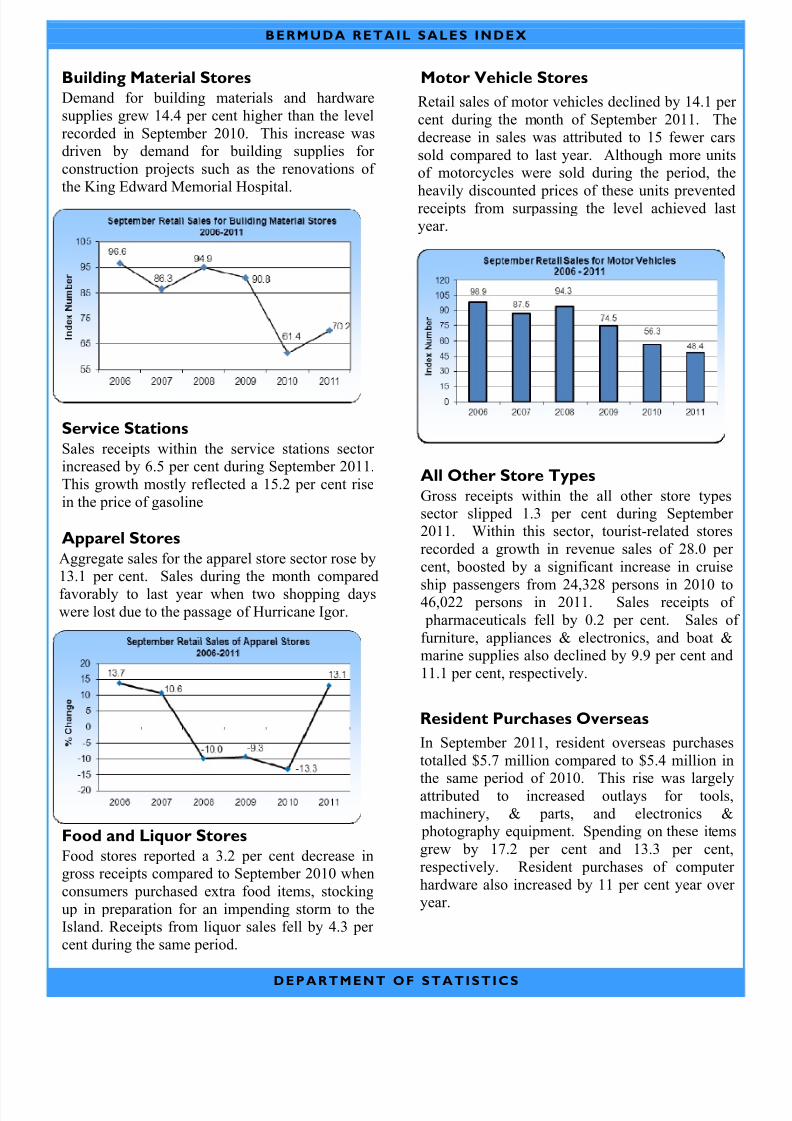
Building Material Stores
Demand for building materials and hardwaresupplies grew 14.4 per cent higher than the levelrecorded in September 2010. This increase wasdriven by demand for building supplies for construction projects such as the renovations of the King Edward Memorial Hospital.
Service Stations
Sales receipts within the service stations sector increased by 6.5 per cent during September 2011.This growth mostly reflected a 15.2 per cent risein the price of gasoline
Apparel Stores
Aggregate sales for the apparel store sector rose by13.1 per cent. Sales during the month compared
favorably to last year when two shopping dayswere lost due to the passage of Hurricane Igor.
Food and Liquor Stores
Food stores reported a 3.2 per cent decrease ingross receipts compared to September 2010 whenconsumers purchased extra food items, stockingup in preparation for an impending storm to theIsland. Receipts from liquor sales fell by 4.3 per cent during the same period.
Motor Vehicle Stores
Retail sales of motor vehicles declined by 14.1 per cent during the month of September 2011. Thedecrease in sales was attributed to 15 fewer carssold compared to last year. Although more unitsof motorcycles were sold during the period, the
heavily discounted prices of these units preventedreceipts from surpassing the level achieved lastyear.
All Other Store Types
Gross receipts within the all other store typessector slipped 1.3 per cent during September 2011. Within this sector, tourist-related storesrecorded a growth in revenue sales of 28.0 per cent, boosted by a significant increase in cruise
ship passengers from 24,328 persons in 2010 to46,022 persons in 2011. Sales receipts of pharmaceuticals fell by 0.2 per cent. Sales of furniture, appliances & electronics, and boat &marine supplies also declined by 9.9 per cent and11.1 per cent, respectively.
Resident Purchases Overseas
In September 2011, resident overseas purchasestotalled $5.7 million compared to $5.4 million in
the same period of 2010. This rise was largelyattributed to increased outlays for tools,machinery, & parts, and electronics & photography equipment. Spending on these itemsgrew by 17.2 per cent and 13.3 per cent,respectively. Resident purchases of computer hardware also increased by 11 per cent year over year.
8/3/2019 Retail Sales Index September 2011
http://slidepdf.com/reader/full/retail-sales-index-september-2011 3/4
8/3/2019 Retail Sales Index September 2011
http://slidepdf.com/reader/full/retail-sales-index-september-2011 4/4
BE RMU DA RE TAIL SALE S INDE X
DE PARTME NT OF STATISTICS
EXPLANATORY NOTES
The Retail Sales Index (RSI) was first developed in1982. It is a key economic indicator used to assess thecurrent performance of sales activity in the retail sector of the economy.
The RSI is a self-weighting index. This means that
stores reporting a large value of sales have a greater impact on the movement of the index than storesreporting a low level of sales activity.
The RSI serves to:
1) measure monthly and annual movements of retailsales
2) provide an estimated gross turnover of sales in thelocal retail sector
3) act as a barometer of change in the level of demand for both the domestic and tourist markets
The index is structured into seven broad sectors:
Food Stores Liquor Stores
Motor Vehicle Dealers
Service Stations
Building Materials
Apparel Stores
All Other Store Types
Total retail stores across the seven sectors representroughly 70% of all retail activity on the Island. The base period 2006 recorded a gross turnover in retail sales of
$1.1 billion.Retail outlets that participate in the retail sales surveyand trade in similar types of goods are grouped intothese seven sectors. It is important to note that sector classifications are not interchangeable with commodityclassifications. This is because most retail outlets sellseveral kinds of commodities. The sector classificationgenerally reflects the individual commodity or thecommodity group, which is the primary source of theestablishment’s receipts, or some mixture of commodities, which characterizes the establishment’s business.
CONCEPTS AND DEFINITIONS
Retail Trade
Retail trade is the sector of the economy that includesestablishments that are engaged in the sale of merchandise for personal or household consumption andin the rendering of services that are incidental to the saleof the merchandise.
Retail Establishment
A retail establishment is one that operates at a fixed place of business and is engaged in sales activities toattract the general public to buy merchandise.
Value Sales
The dollar value of a quantity of goods and services soldfor cash or credit. Sales include the amounts receivedfrom customers for: immediate and layaway purchases;rentals; installations; maintenance; repairs andalterations.
Gross Sales
Gross sales are sales for which no deductions have beenmade for the return of merchandise, allowances anddiscounts.
Volume Sales
The dollar value of a quantity of goods and services soldat current retail market prices adjusted to eliminate theeffect of price change.
Estimated Gross Turnover
Estimated gross turnover is the total value of retail salesgenerated in the retail sector. It is calculated byapplying the all-items index number for the currentmonth to the average monthly sales figure determined inthe base year.
Base Period
This is the time period used as a reference point for
measuring the shift in the value of retail sales. The base period for the Bermuda RSI is 2006.
Overseas Purchases
Overseas purchases reflect the value of goods declared by residents through HM Customs while travelling onvacation or business trips.
Published by the Government of Bermuda November 2011
The Cabinet OfficeDepartment of StatisticsCedar Park Centre,48 Cedar Avenue, Hamilton HM 11P.O. Box HM 3015Hamilton HM MX, BermudaTel: (441) 297-7761, Fax: (441) 295-8390E-mail: [email protected]: www.statistics.gov.bm