Embed Size (px)
Citation preview
R e t a i l , O f f i c e , a n d L o d g i n g M a r k e t A n a l y s i s
B - 1W a s i l l a C o m p r e h e n s i v e P l a n
RETAIL, OFFICE, & LODGINGMARKET ANALYSIS
WASILLA, ALASKA
Prepared For: USKH INC.
351 West Parks Highway, Suite 200Wasilla, Alaska 99654
Prepared By: GIBBS PLANNING GROUP, Inc.
330 E. Maple Street No. 310 Birmingham, Michigan 48009
28 September 2009
A p p e n d i x B
B - 2 W a s i l l a C o m p r e h e n s i v e P l a n
________________________________________________________________________
________________________________________________________________________
TABLE OF CONTENTS INTRODUCTION ……………………………………….…….……..……...……………….. 1 Executive Summary …………………………………………...……….…....…...…..……… 1 Background ……………………………………...…………………....…..….………..……… 3 Methodology ……………………………………………..………………….....……..……….. 4 Limits of Study …………………………………………..……………….………..………….. 6 Trade Area …………………………………………………..……………..…………………….7 Demographic Characteristics ……………………………………….…..…..….……….... .8 Table 1: Demographic Comparison Table …………………………………………..……. 9 Tapestry Lifestyles ………………………………..…………..………….…………............. 10 Table 2: Tapestry Lifestyles …………………………………..…………..…..…………….. 10 Graph 1: Tapestry Lifestyles Segmentation Graph ……….…………………………… 12 Employment Base …………….………………………………………………….……………. 12 Office Market Analysis ………………………………………………………………………... 13 Table 3: Office Space Vacancy and Lease Rates ………………………………………... 14 Tourist Retail Expenditure …………………….…………………………..…...…………... 15 Hotel/Hospitality Market Analysis ……………………………………………………….… 16 TRADE AREA CHARACTERISTICS ………………………………….…….………….. 17 Location ……………………………………………………..…………......………………....... 17 Access ………………………………………...……………..………..…...……………..…… 17 Table 4: Traffic Counts …………………………………………….………..…………….…. 18 Other Shopping Areas …………………………………….……………..………..….……… 18 Table 5: Existing Regional Centers ………………………………………..…………….… 21 SUMMARY OF FINDINGS ………………………………………………..…….………… 21 Table 6: Supportable Retail ………………………………………………….…..………….. 23 Rationale …………………………………………………...…...…….....…………………….. 25 APPENDIX Recommended Supportable Retail Table …………………………………………..…….. 27 Retail Expenditure Potential Table ………………………………………………………....29 Trade Area Map: Population by Census Tract ………………………………………..…. 30 Trade Area Map: Households by Census Tract …………………………………………. 31 Trade Area Map: Average Household Income by Census Tract …………………..…. 32 Trade Area Map: Regional Competition ……………………………………………..……. 33 Regional Competition Table …………………………………………………………………. 34 Trade Area Competition Map: Community Centers …………………………………… 36 Business-Facts: WorkPlace and Employment Summary ………………………………37 Market Profile Table ……………………………………………………………………….......38 Population by Age Table ……………………………………………………………………… 46 Income Profile Table …………………………………………………………………………… 52 Demographic and Income Table ………................................................................ 53 P rimary Tapestry Lifestyles Table ………………………………………………………….. 55 Tapestry Lifestyle Segment Descriptions …………………………………………………. 56
Midland Crowd Rural Resort Dwellers Sophisticated Squires Green Acres Milk & Cookies Up and Coming Families In Style Aspiring Young Families Old and Newcomers Midlife Junction
Housing Profile Table ………………………………………………………………..…………66 Potential Expenditure Capture from Tourism …………………………………………… 69 Existing and Planned Lodging in South Central Alaska ……………………………….70 Tourism Graphs: #1 Occupancy, #2 Average Daily Rates, #3 RevPar, #4 Rooms Sold, #5 Available Rooms, #6 Sensitivity, #7 Rooms vs Sold …………...74
B-2B-3B-4B-5B-8B-9
B-10B-11B-12B-14B-14B-15B-15B-17B-18
SUPPORTING DATA
B-19B-19B-19B-20B-20B-23
B-23B-25B-27
B-28B-29B-30B-30B-30B-31B-32B-33B-34B-35B-37B-49B-50B-52B-53
B-63B-66B-67
B-69
R e t a i l , O f f i c e , a n d L o d g i n g M a r k e t A n a l y s i s
B - 3W a s i l l a C o m p r e h e n s i v e P l a n
Wasilla Trade Area Market Study 1Gibbs Planning Group, Inc. September 28, 2009
INTRODUCTION
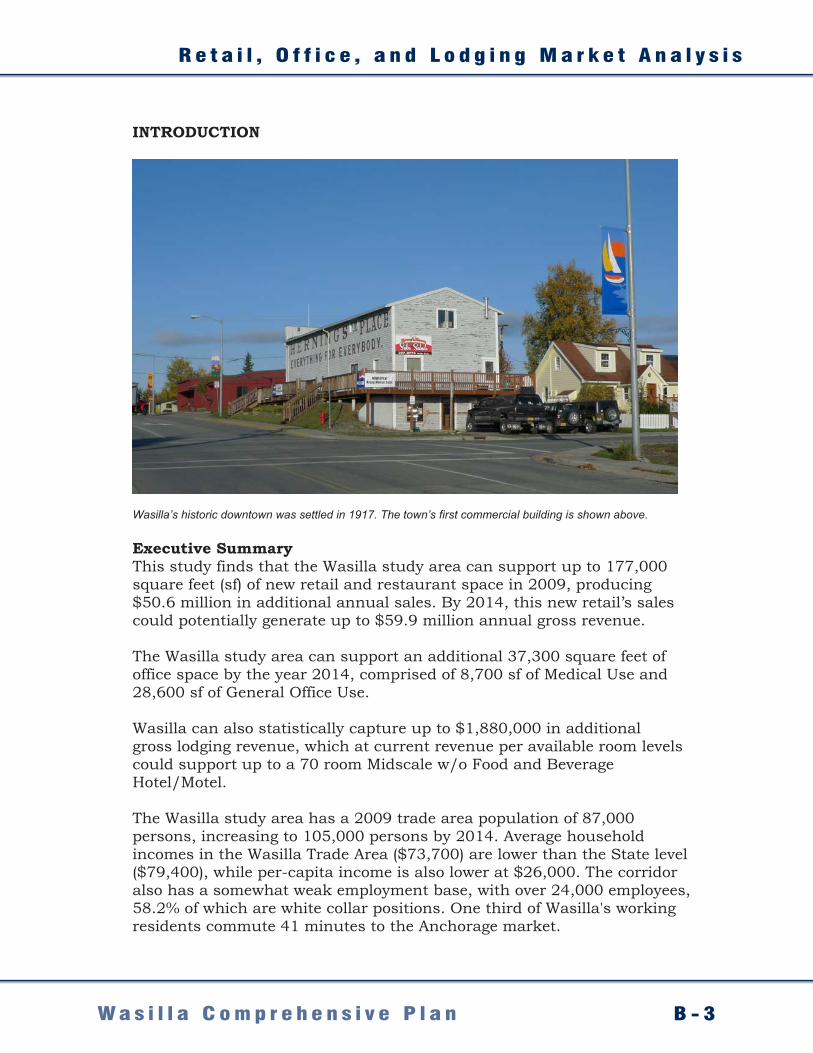
Wasilla’s historic downtown was settled in 1917. The town’s first commercial building is shown above. Executive Summary This study finds that the Wasilla study area can support up to 177,000 square feet (sf) of new retail and restaurant space in 2009, producing $50.6 million in additional annual sales. By 2014, this new retail’s sales could potentially generate up to $59.9 million annual gross revenue. The Wasilla study area can support an additional 37,300 square feet of office space by the year 2014, comprised of 8,700 sf of Medical Use and 28,600 sf of General Office Use. Wasilla can also statistically capture up to $1,880,000 in additional gross lodging revenue, which at current revenue per available room levels could support up to a 70 room Midscale w/o Food and Beverage Hotel/Motel. The Wasilla study area has a 2009 trade area population of 87,000 persons, increasing to 105,000 persons by 2014. Average household incomes in the Wasilla Trade Area ($73,700) are lower than the State level ($79,400), while per-capita income is also lower at $26,000. The corridor also has a somewhat weak employment base, with over 24,000 employees, 58.2% of which are white collar positions. One third of Wasilla's working residents commute 41 minutes to the Anchorage market.
A p p e n d i x B
B - 4 W a s i l l a C o m p r e h e n s i v e P l a n
Wasilla Trade Area Market Study 2Gibbs Planning Group, Inc. September 28, 2009
The new supportable retail includes: 72,600 sf of General Merchandise Stores, 34,600 sf of dine in and carry out Restaurants, 17,000 sf of Apparel & Accessories stores, 14,000 sf of Hardware and Lawn/Garden retail, 9,000 sf of Sporting Goods and Hobby retail, 6,600 sf of Electronic & Appliance retail, 5,900 sf of Home Furnishings, 3,900 sf of Specialty Food stores, 2,500 sf of Health Care and Personal Services, 1,400 sf of Jewelry, Luggage and Leather retail, and 9,500 sf of Miscellaneous Neighborhood Retailers such as Florists, Pet Supplies, Tobacco, Video and Gift Shops. See Table 6 for a detailed breakdown of the corridor’s supportable retail categories and sales potentials.
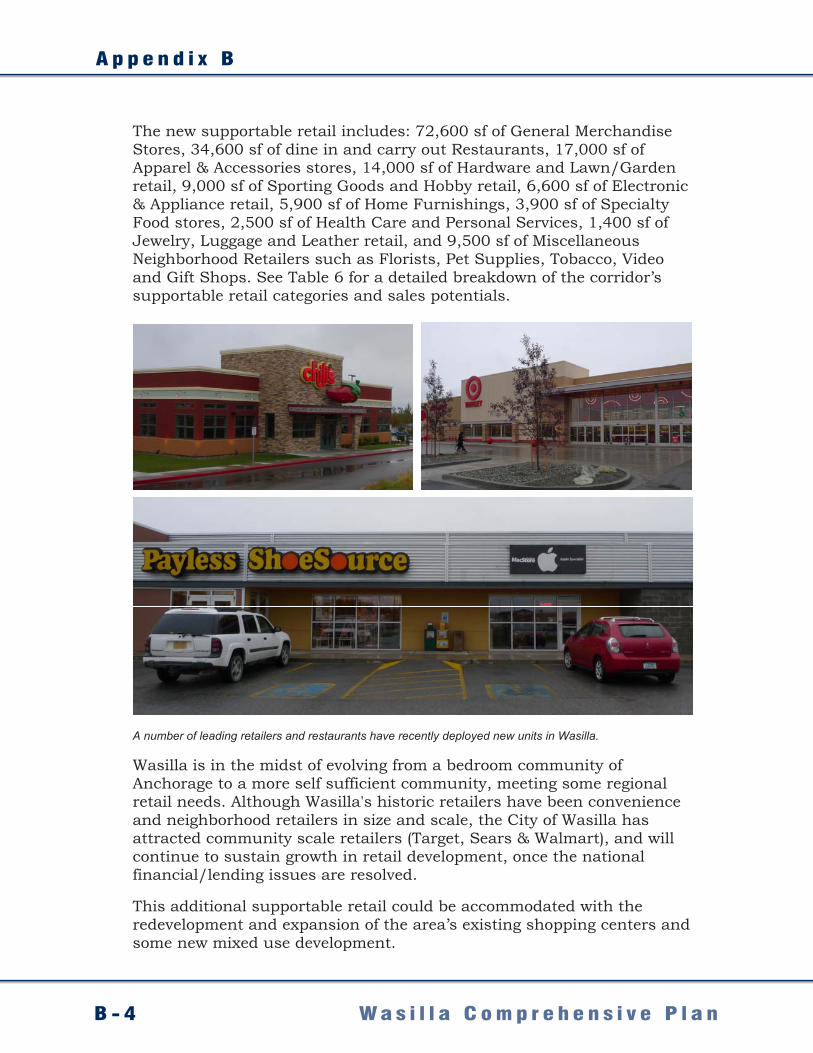
A number of leading retailers and restaurants have recently deployed new units in Wasilla. Wasilla is in the midst of evolving from a bedroom community of Anchorage to a more self sufficient community, meeting some regional retail needs. Although Wasilla's historic retailers have been convenience and neighborhood retailers in size and scale, the City of Wasilla has attracted community scale retailers (Target, Sears & Walmart), and will continue to sustain growth in retail development, once the national financial/lending issues are resolved. This additional supportable retail could be accommodated with the redevelopment and expansion of the area’s existing shopping centers and some new mixed use development.
R e t a i l , O f f i c e , a n d L o d g i n g M a r k e t A n a l y s i s
B - 5W a s i l l a C o m p r e h e n s i v e P l a n
Wasilla Trade Area Market Study 3Gibbs Planning Group, Inc. September 28, 2009
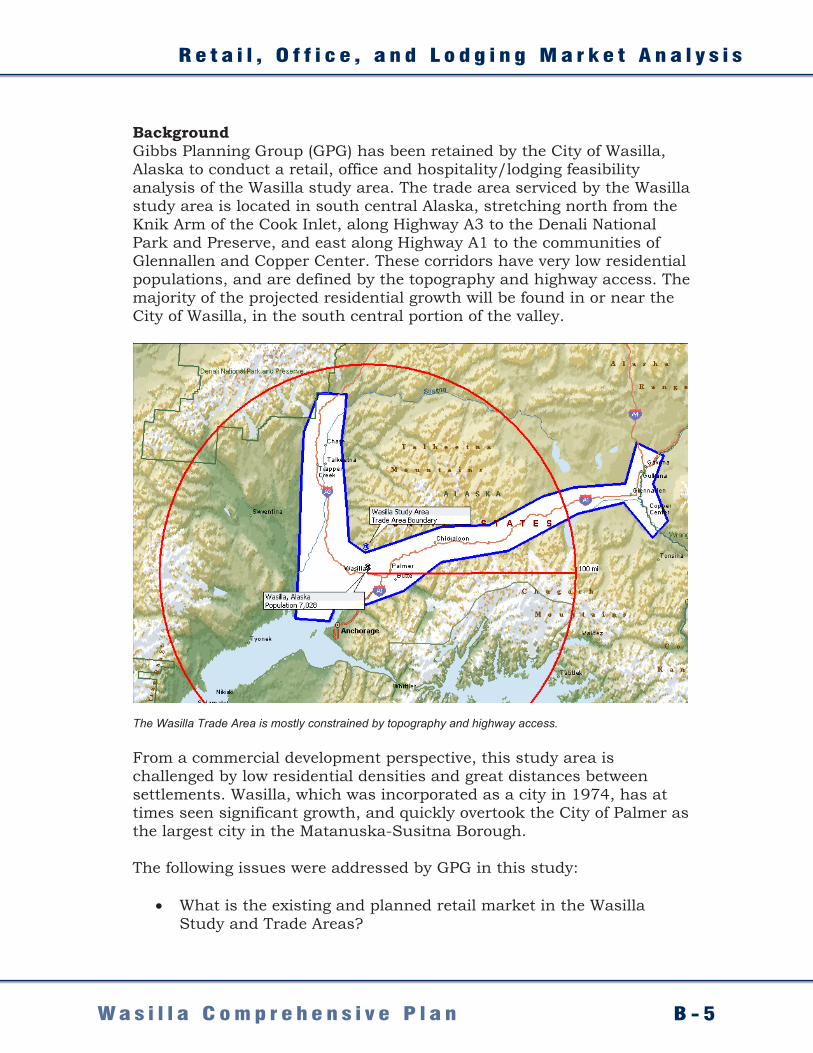
Background Gibbs Planning Group (GPG) has been retained by the City of Wasilla, Alaska to conduct a retail, office and hospitality/lodging feasibility analysis of the Wasilla study area. The trade area serviced by the Wasilla study area is located in south central Alaska, stretching north from the Knik Arm of the Cook Inlet, along Highway A3 to the Denali National Park and Preserve, and east along Highway A1 to the communities of Glennallen and Copper Center. These corridors have very low residential populations, and are defined by the topography and highway access. The majority of the projected residential growth will be found in or near the City of Wasilla, in the south central portion of the valley.
The Wasilla Trade Area is mostly constrained by topography and highway access. From a commercial development perspective, this study area is challenged by low residential densities and great distances between settlements. Wasilla, which was incorporated as a city in 1974, has at times seen significant growth, and quickly overtook the City of Palmer as the largest city in the Matanuska-Susitna Borough. The following issues were addressed by GPG in this study:
• What is the existing and planned retail market in the Wasilla Study and Trade Areas?
A p p e n d i x B
B - 6 W a s i l l a C o m p r e h e n s i v e P l a n
Wasilla Trade Area Market Study 4Gibbs Planning Group, Inc. September 28, 2009
• What is the trade area that would be served by the City of Wasilla?
• What is the potential for growth in the Office Space Market?
• Can the growth in local and regional tourism support additional lodging facilities, and what is the potential tourism expenditure captured by new facilities.
• What are the population, demographic and lifestyle characteristics
in the trade area, currently and projected for 2014? • What is the current and projected growth for retail expenditures,
currently and projected for the next five years? • How much retail square footage is supportable in the Wasilla, and
what retail uses should be encourage? What sales volumes can be achieved by new development in or near the City?
Methodology To address the above issues, GPG conducted a detailed evaluation of most major existing shopping centers and retail concentrations in and surrounding the defined study area. This evaluation was conducted during September, 2009. During this evaluation, GPG thoroughly drove the market and visited and evaluated most major and planned retail concentrations in the area. GPG visited the area during the daytime, as well as the evening, to gain a qualitative understanding of the retail gravitational patterns and traffic patterns throughout the study area. GPG then defined a trade area that would serve the retail in the study area based on the field evaluation, geographical and topographical considerations, traffic access/flow in the area, relative retail strengths and weakness of the competition, concentrations of daytime employment, and the retail gravitation in the market, as well as our experience defining trade areas for similar markets. Population, consumer expenditure and demographic characteristics of trade area residents were collected by census tracts from the US Bureau of the Census, US Bureau of Labor Statistics, InfoUSA, ESRI, CCIM, STDB, Claritas, and COSTAR, and updated based on information gathered from local planning sources. Finally, based on the projected consumer expenditure capture in the Wasilla study area of the gross consumer expenditure by retail category (trade area) less the current existing retail sales by retail category (trade area), GPG projects the potential net consumer expenditure. The projected consumer expenditure capture is based on population and
R e t a i l , O f f i c e , a n d L o d g i n g M a r k e t A n a l y s i s
B - 7W a s i l l a C o m p r e h e n s i v e P l a n
Wasilla Trade Area Market Study 5Gibbs Planning Group, Inc. September 28, 2009
demographic characteristics of the trade area, existing and known planned retail competition, traffic and retail gravitational patterns, and GPG’s qualitative assessment of the Wasilla study area. Net potential captured consumer expenditure is equated to potential retail development square footage with the help of retail sales per square foot data provided by Dollars & Cents of Shopping Centers (Urban Land Institute and International Council of Shopping Centers), qualitatively adjusted to fit the urbanism of the Wasilla study area. For the purposes of this study GPG has assumed the following:
• Although there are future expansions planned for the Creekside Town Square Project, including a possible Warehouse Club location, soil and financing exist for the site, and only the existing retail is considered in the evaluation.
• The existing City of Wasilla sales tax of 2.5% is projected to remain
in place throughout the five year term of this study.
• Other major community retail centers are planned or proposed at this time, but only the existing retail is considered at this time. The quality of the existing retail trade in the study area is projected to remain constant. Gains in future average retail sales per square foot reflect higher sales per square foot in the newly developed retail and selected projected increases in sales per square foot by individual retail categories.
• No other major regional retail centers will be developed within the
trade area of this study until 2014.
• The Wasilla study area is properly zoned to support infill and redevelopment projects with current and innovative standards, and the existing infrastructure (water, sewer, arterial roadways, etc.) can support additional commercial development.
• Annual population growth for the City of Wasilla is estimated to be 3.78% throughout the five year period of this study.
• Employment distribution is considered to remain constant, without a spike or decline in employment by NAICS category.
• Office space required as an ancillary need to a main business
function is not included in the office space market inventory made for this study, nor are the employees who work in that space included in the count of employees who require dedicated office
A p p e n d i x B
B - 8 W a s i l l a C o m p r e h e n s i v e P l a n
Wasilla Trade Area Market Study 6Gibbs Planning Group, Inc. September 28, 2009
space. The main factor in this assumption is that the ancillary office space is often a part of the premises where the primary business operation occurs, such as Agriculture & Mining, Manufacturing, Wholesale Trade, and Retail Trade business.
• No other major office projects will be developed within the submarket during the next five years.
• Projected lease and vacancy rates model based on our proprietary econometric model of the relationship between changes in employment and changes in vacancy and lease rates. Data was gathered from the US Census Bureau, Experian, ESRI, COSTAR Group, Inc., LOOPNET, and local brokerage services.
• The region’s economy will continue at normal or above normal
ranges of employment, inflation, retail demand and growth. • Any new construction in the Wasilla study area will be planned,
designed, built and managed to the best practices of The American Planning Association, The Congress for the New Urbanism, The International Council of Shopping Centers and The Urban Land Institute.
• Parking for new projects will be per the recommendations of this
study, with easy access to the retailers in the development via on street, surface lots, or deck parking. An overall parking ratio of 4.5 cars per 1000 square feet gross, or higher, is anticipated for new commercial development.
• Visibility of any new retail is also assumed to be very good, with
signage as required to assure easy visibility of the retailers.
• Infill or redevelopment projects in the study area will open with sustainable amounts of retail and anchor tenants, at planned intervals and per industry standards.
Limits of Study The findings of this study represent GPG’s best estimates for the amounts and types of retail projects that should be supportable in the study area. Every reasonable effort has been made to ensure that the data contained in this study reflect the most accurate and timely information possible and are believed to be reliable. This study is based on estimates, assumptions, and other information developed by GPG independent research effort, general knowledge of the industry, and consultations with the client and its representatives.
R e t a i l , O f f i c e , a n d L o d g i n g M a r k e t A n a l y s i s
B - 9W a s i l l a C o m p r e h e n s i v e P l a n
Wasilla Trade Area Market Study 7Gibbs Planning Group, Inc. September 28, 2009
No responsibility is assumed for inaccuracies in reporting by the client, its agent and representatives or in any other data source used in preparing or presenting this study. This report is based on information that was current as of September 23rd, 2009, and GPG has not undertaken any update of its research effort since such date. This report may contain prospective financial information, estimates, or opinions that represent GPG’s view of reasonable expectations at a particular time, but such information, estimates, or opinions are not offered as predictions or assurances that a particular level of income or profit will be achieved, that particular events will occur, or that a particular price will be offered or accepted. Actual results achieved during the period covered by our prospective financial analysis may vary from those described in our report, and the variations may be material. Therefore, no warranty or representation is made by GPG that any of the projected values or results contained in this study will be achieved.
This study should not be the sole basis for programming, planning, designing, financing or development of any commercial center. This study is intended for the use of the city of Wasilla for general planning purposes only and is void for other site locations or developers. Trade Area Based on GPG’s field evaluation, the existing retail hubs, population clusters, highway access, and the retail gravitation in the market, as well as our experience defining trade areas for similar rural communities throughout the United States, it was determined that retail in the Wasilla study area is currently evolving from a limited neighborhood appeal. In five to ten years, the study area will grow to have a community appeal, as well as meeting its neighborhood retail requirements. GPG defined a Trade Area by topography, vehicular access and residential growth patterns which will account for 70% to 80% of the total sales of the retailers in the Wasilla study area. The remaining sales in the study will come from consumers passing through, as well as employees working in the study area who live outside of it. The primary trade area is approximately delimited by the following boundaries:
North along Highway A3 to the Denali National Park and Preserve East along Highway A1 to the Wrangell St-Elias National Park South to the Knik Arm of the Cook Inlet West to the Susitna River
A p p e n d i x B
B - 1 0 W a s i l l a C o m p r e h e n s i v e P l a n
Wasilla Trade Area Market Study 8Gibbs Planning Group, Inc. September 28, 2009
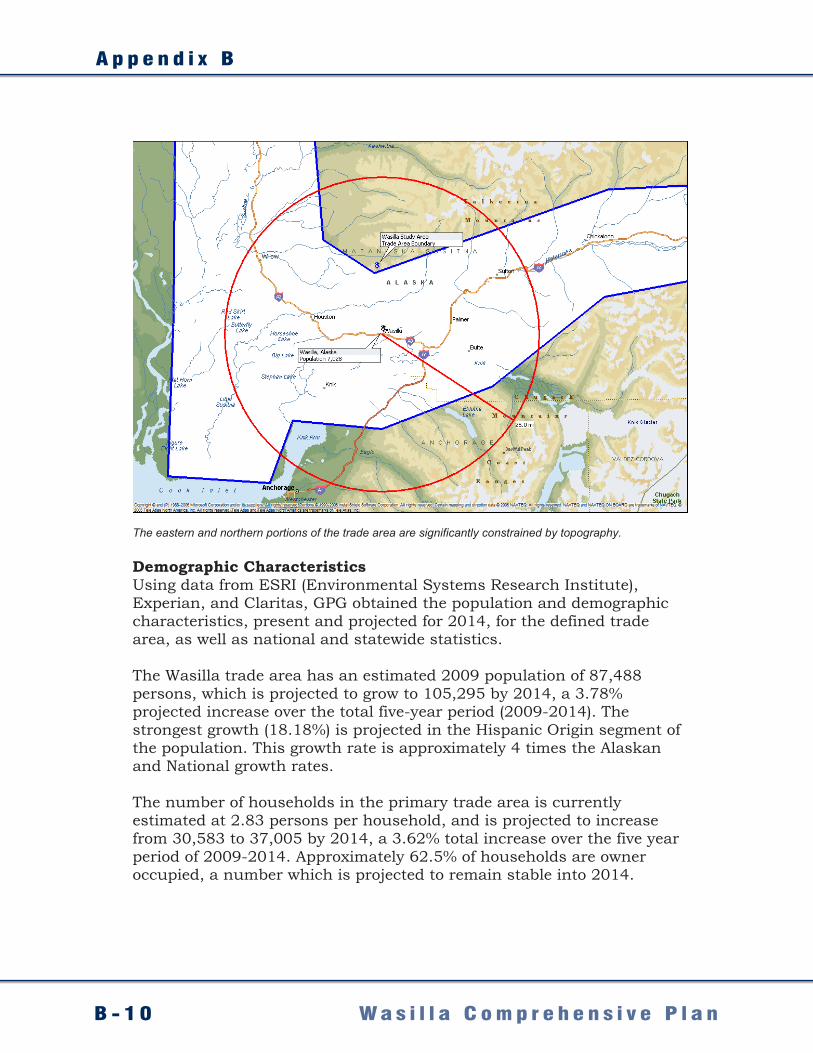
The eastern and northern portions of the trade area are significantly constrained by topography. Demographic Characteristics Using data from ESRI (Environmental Systems Research Institute), Experian, and Claritas, GPG obtained the population and demographic characteristics, present and projected for 2014, for the defined trade area, as well as national and statewide statistics. The Wasilla trade area has an estimated 2009 population of 87,488 persons, which is projected to grow to 105,295 by 2014, a 3.78% projected increase over the total five-year period (2009-2014). The strongest growth (18.18%) is projected in the Hispanic Origin segment of the population. This growth rate is approximately 4 times the Alaskan and National growth rates. The number of households in the primary trade area is currently estimated at 2.83 persons per household, and is projected to increase from 30,583 to 37,005 by 2014, a 3.62% total increase over the five year period of 2009-2014. Approximately 62.5% of households are owner occupied, a number which is projected to remain stable into 2014.
R e t a i l , O f f i c e , a n d L o d g i n g M a r k e t A n a l y s i s
B - 1 1W a s i l l a C o m p r e h e n s i v e P l a n
Wasilla Trade Area Market Study 9Gibbs Planning Group, Inc. September 28, 2009
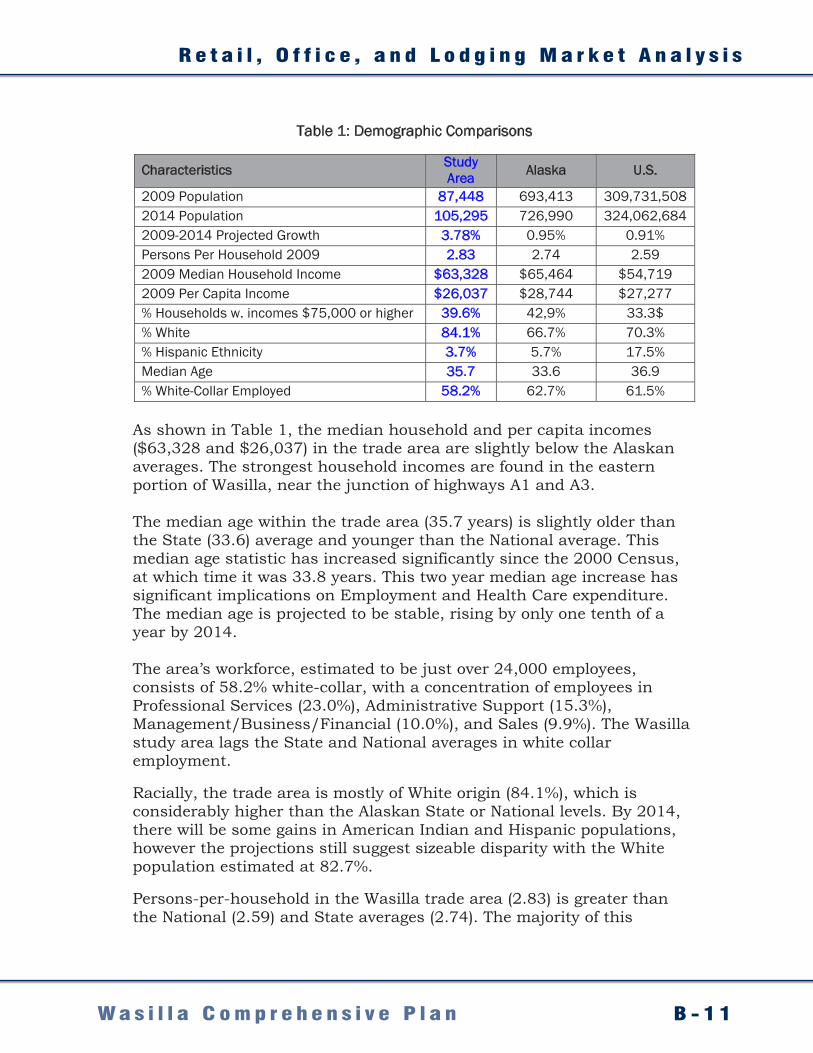
Table 1: Demographic Comparisons
Characteristics Study Area Alaska U.S.
2009 Population 87,448 693,413 309,731,508 2014 Population 105,295 726,990 324,062,684 2009-2014 Projected Growth 3.78% 0.95% 0.91% Persons Per Household 2009 2.83 2.74 2.59 2009 Median Household Income $63,328 $65,464 $54,719 2009 Per Capita Income $26,037 $28,744 $27,277 % Households w. incomes $75,000 or higher 39.6% 42,9% 33.3$ % White 84.1% 66.7% 70.3% % Hispanic Ethnicity 3.7% 5.7% 17.5% Median Age 35.7 33.6 36.9 % White-Collar Employed 58.2% 62.7% 61.5%
As shown in Table 1, the median household and per capita incomes ($63,328 and $26,037) in the trade area are slightly below the Alaskan averages. The strongest household incomes are found in the eastern portion of Wasilla, near the junction of highways A1 and A3. The median age within the trade area (35.7 years) is slightly older than the State (33.6) average and younger than the National average. This median age statistic has increased significantly since the 2000 Census, at which time it was 33.8 years. This two year median age increase has significant implications on Employment and Health Care expenditure. The median age is projected to be stable, rising by only one tenth of a year by 2014. The area’s workforce, estimated to be just over 24,000 employees, consists of 58.2% white-collar, with a concentration of employees in Professional Services (23.0%), Administrative Support (15.3%), Management/Business/Financial (10.0%), and Sales (9.9%). The Wasilla study area lags the State and National averages in white collar employment. Racially, the trade area is mostly of White origin (84.1%), which is considerably higher than the Alaskan State or National levels. By 2014, there will be some gains in American Indian and Hispanic populations, however the projections still suggest sizeable disparity with the White population estimated at 82.7%. Persons-per-household in the Wasilla trade area (2.83) is greater than the National (2.59) and State averages (2.74). The majority of this
A p p e n d i x B
B - 1 2 W a s i l l a C o m p r e h e n s i v e P l a n
Wasilla Trade Area Market Study 10Gibbs Planning Group, Inc. September 28, 2009
difference comes from more households which have children under 18, and fewer non-traditional households made up of non-family members. Tapestry Lifestyles ESRI has developed Tapestry Lifestyles, which is an attempt to create 65 classifications, or lifestyle segments, that help determine purchasing patterns. These segments are broken down to the U.S. Census Block Group level throughout the United States and are used by many national retailers to help determine future potential locations. The following Table 2 details the top Tapestry Lifestyles found in the primary and total trade areas.
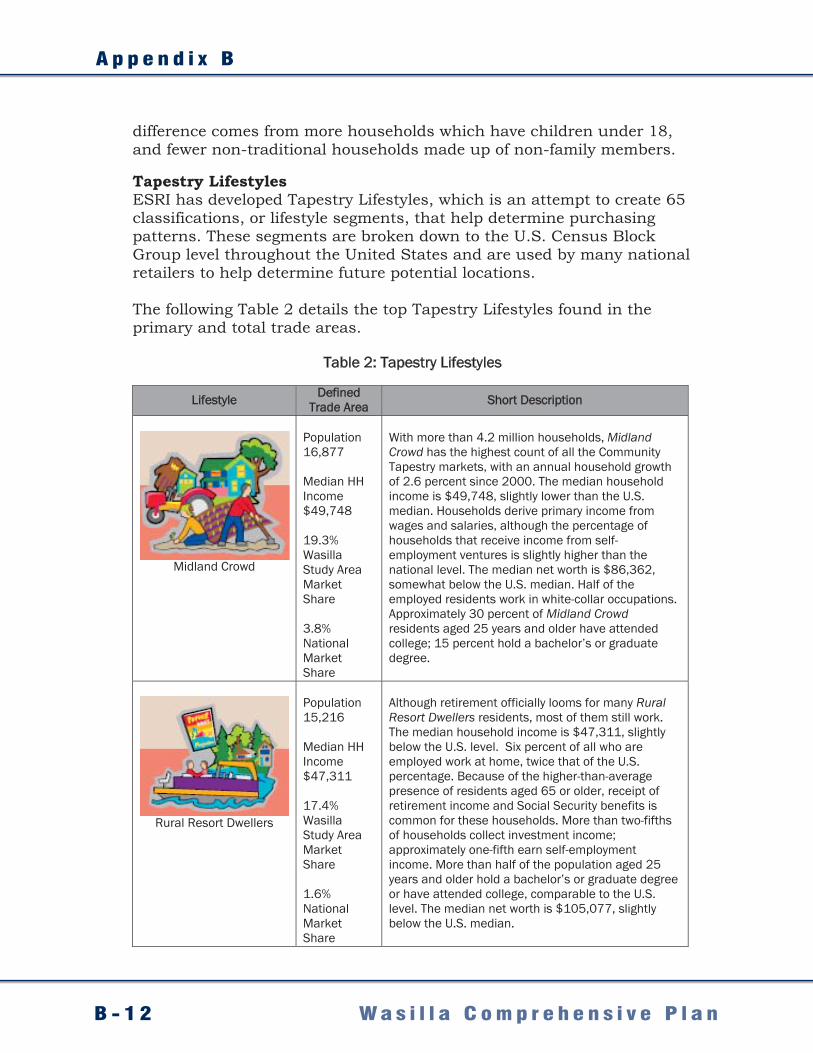
Table 2: Tapestry Lifestyles
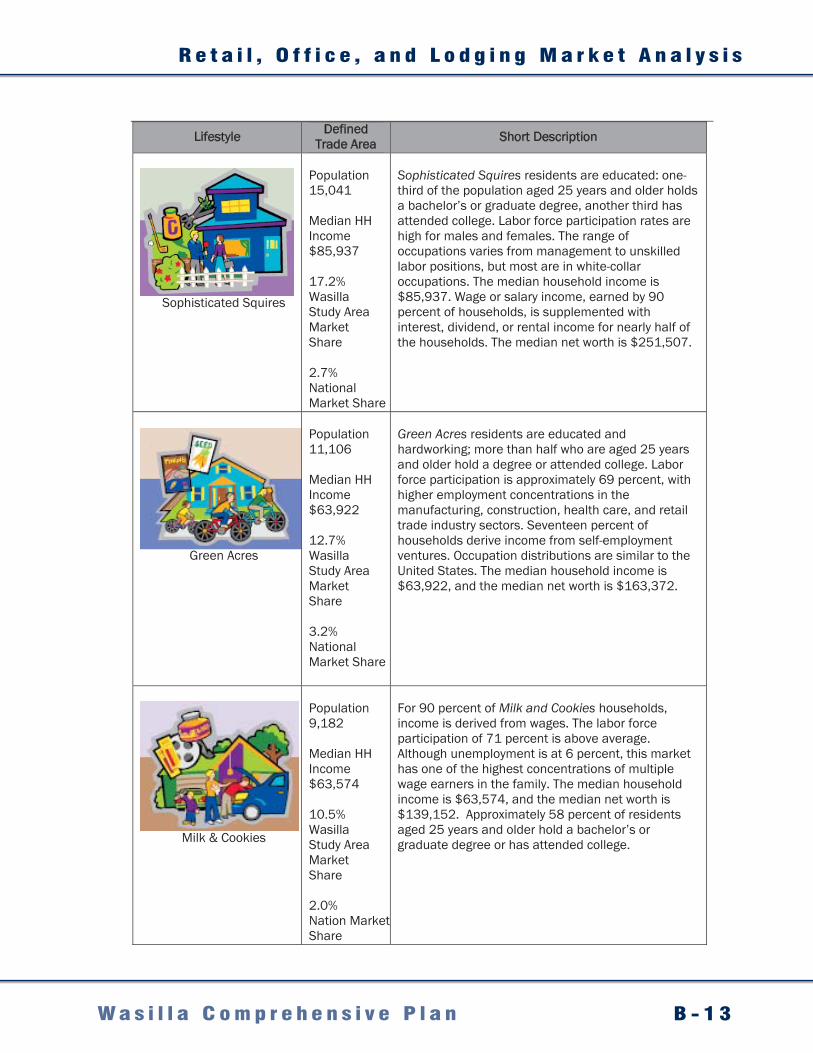
Lifestyle Defined Trade Area Short Description
Midland Crowd
Population 16,877 Median HH Income $49,748 19.3% Wasilla Study Area Market Share 3.8% National Market Share
With more than 4.2 million households, Midland Crowd has the highest count of all the Community Tapestry markets, with an annual household growth of 2.6 percent since 2000. The median household income is $49,748, slightly lower than the U.S. median. Households derive primary income from wages and salaries, although the percentage of households that receive income from self-employment ventures is slightly higher than the national level. The median net worth is $86,362, somewhat below the U.S. median. Half of the employed residents work in white-collar occupations. Approximately 30 percent of Midland Crowd residents aged 25 years and older have attended college; 15 percent hold a bachelor’s or graduate degree.
Rural Resort Dwellers
Population 15,216 Median HH Income $47,311 17.4% Wasilla Study Area Market Share 1.6% National Market Share
Although retirement officially looms for many Rural Resort Dwellers residents, most of them still work. The median household income is $47,311, slightly below the U.S. level. Six percent of all who are employed work at home, twice that of the U.S. percentage. Because of the higher-than-average presence of residents aged 65 or older, receipt of retirement income and Social Security benefits is common for these households. More than two-fifths of households collect investment income; approximately one-fifth earn self-employment income. More than half of the population aged 25 years and older hold a bachelor’s or graduate degree or have attended college, comparable to the U.S. level. The median net worth is $105,077, slightly below the U.S. median.
R e t a i l , O f f i c e , a n d L o d g i n g M a r k e t A n a l y s i s
B - 1 3W a s i l l a C o m p r e h e n s i v e P l a nWasilla Trade Area Market Study 11Gibbs Planning Group, Inc. September 28, 2009
Lifestyle Defined Trade Area Short Description
Sophisticated Squires
Population 15,041 Median HH Income $85,937 17.2% Wasilla Study Area Market Share 2.7% National Market Share
Sophisticated Squires residents are educated: one-third of the population aged 25 years and older holds a bachelor’s or graduate degree, another third has attended college. Labor force participation rates are high for males and females. The range of occupations varies from management to unskilled labor positions, but most are in white-collar occupations. The median household income is $85,937. Wage or salary income, earned by 90 percent of households, is supplemented with interest, dividend, or rental income for nearly half of the households. The median net worth is $251,507.
Green Acres
Population 11,106 Median HH Income $63,922 12.7% Wasilla Study Area Market Share 3.2% National Market Share
Green Acres residents are educated and hardworking; more than half who are aged 25 years and older hold a degree or attended college. Labor force participation is approximately 69 percent, with higher employment concentrations in the manufacturing, construction, health care, and retail trade industry sectors. Seventeen percent of households derive income from self-employment ventures. Occupation distributions are similar to the United States. The median household income is $63,922, and the median net worth is $163,372.
Milk & Cookies
Population 9,182 Median HH Income $63,574 10.5% Wasilla Study Area Market Share 2.0% Nation Market Share
For 90 percent of Milk and Cookies households, income is derived from wages. The labor force participation of 71 percent is above average. Although unemployment is at 6 percent, this market has one of the highest concentrations of multiple wage earners in the family. The median household income is $63,574, and the median net worth is $139,152. Approximately 58 percent of residents aged 25 years and older hold a bachelor’s or graduate degree or has attended college.
A p p e n d i x B
B - 1 4 W a s i l l a C o m p r e h e n s i v e P l a n
Wasilla Trade Area Market Study 12Gibbs Planning Group, Inc. September 28, 2009
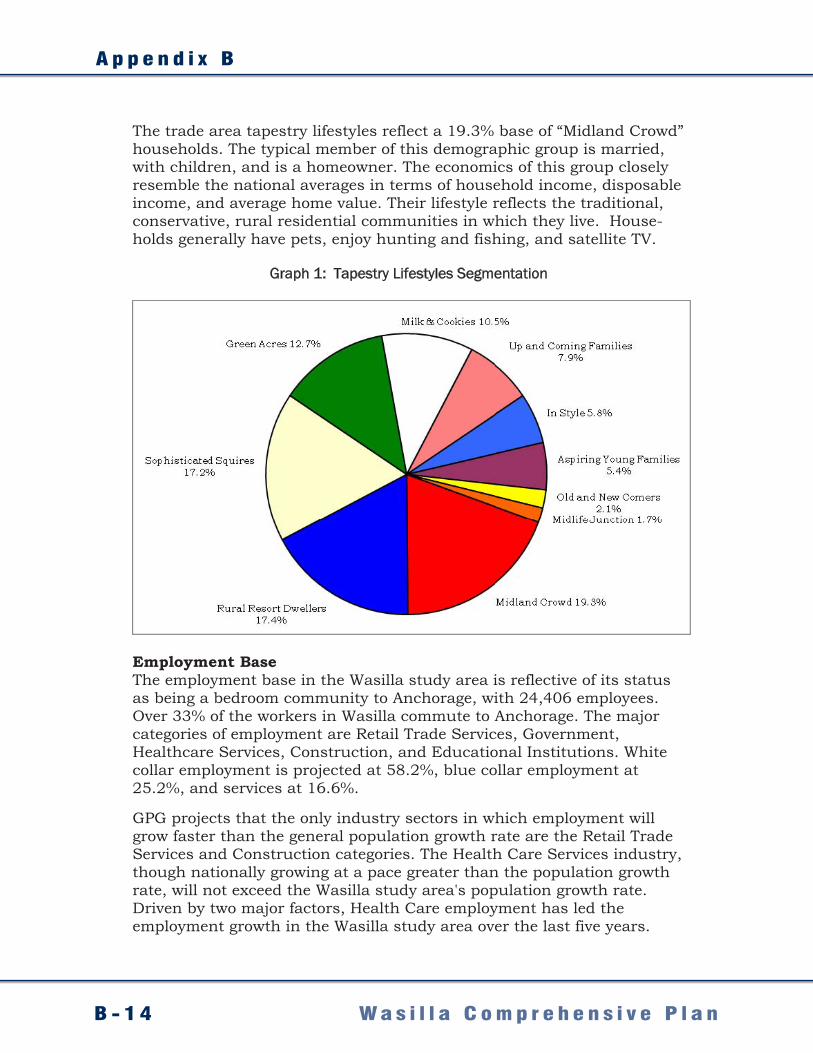
The trade area tapestry lifestyles reflect a 19.3% base of “Midland Crowd” households. The typical member of this demographic group is married, with children, and is a homeowner. The economics of this group closely resemble the national averages in terms of household income, disposable income, and average home value. Their lifestyle reflects the traditional, conservative, rural residential communities in which they live. House-holds generally have pets, enjoy hunting and fishing, and satellite TV.
Graph 1: Tapestry Lifestyles Segmentation
Employment Base The employment base in the Wasilla study area is reflective of its status as being a bedroom community to Anchorage, with 24,406 employees. Over 33% of the workers in Wasilla commute to Anchorage. The major categories of employment are Retail Trade Services, Government, Healthcare Services, Construction, and Educational Institutions. White collar employment is projected at 58.2%, blue collar employment at 25.2%, and services at 16.6%.
GPG projects that the only industry sectors in which employment will grow faster than the general population growth rate are the Retail Trade Services and Construction categories. The Health Care Services industry, though nationally growing at a pace greater than the population growth rate, will not exceed the Wasilla study area's population growth rate. Driven by two major factors, Health Care employment has led the employment growth in the Wasilla study area over the last five years.
R e t a i l , O f f i c e , a n d L o d g i n g M a r k e t A n a l y s i s
B - 1 5W a s i l l a C o m p r e h e n s i v e P l a n
Wasilla Trade Area Market Study 13Gibbs Planning Group, Inc. September 28, 2009
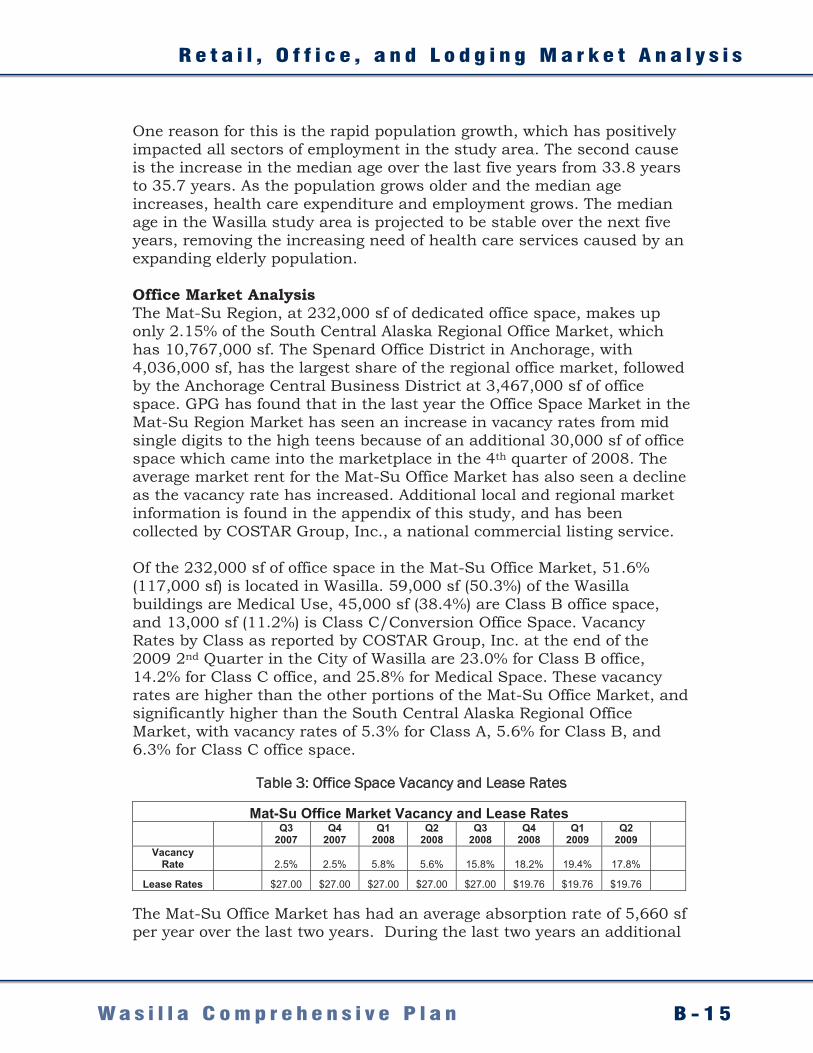
One reason for this is the rapid population growth, which has positively impacted all sectors of employment in the study area. The second cause is the increase in the median age over the last five years from 33.8 years to 35.7 years. As the population grows older and the median age increases, health care expenditure and employment grows. The median age in the Wasilla study area is projected to be stable over the next five years, removing the increasing need of health care services caused by an expanding elderly population. Office Market Analysis The Mat-Su Region, at 232,000 sf of dedicated office space, makes up only 2.15% of the South Central Alaska Regional Office Market, which has 10,767,000 sf. The Spenard Office District in Anchorage, with 4,036,000 sf, has the largest share of the regional office market, followed by the Anchorage Central Business District at 3,467,000 sf of office space. GPG has found that in the last year the Office Space Market in the Mat-Su Region Market has seen an increase in vacancy rates from mid single digits to the high teens because of an additional 30,000 sf of office space which came into the marketplace in the 4th quarter of 2008. The average market rent for the Mat-Su Office Market has also seen a decline as the vacancy rate has increased. Additional local and regional market information is found in the appendix of this study, and has been collected by COSTAR Group, Inc., a national commercial listing service. Of the 232,000 sf of office space in the Mat-Su Office Market, 51.6% (117,000 sf) is located in Wasilla. 59,000 sf (50.3%) of the Wasilla buildings are Medical Use, 45,000 sf (38.4%) are Class B office space, and 13,000 sf (11.2%) is Class C/Conversion Office Space. Vacancy Rates by Class as reported by COSTAR Group, Inc. at the end of the 2009 2nd Quarter in the City of Wasilla are 23.0% for Class B office, 14.2% for Class C office, and 25.8% for Medical Space. These vacancy rates are higher than the other portions of the Mat-Su Office Market, and significantly higher than the South Central Alaska Regional Office Market, with vacancy rates of 5.3% for Class A, 5.6% for Class B, and 6.3% for Class C office space.
Table 3: Office Space Vacancy and Lease Rates
The Mat-Su Office Market has had an average absorption rate of 5,660 sf per year over the last two years. During the last two years an additional
Mat-Su Office Market Vacancy and Lease Rates Q3
2007 Q4
2007 Q1
2008 Q2
2008 Q3
2008 Q4
2008 Q1
2009 Q2
2009 Vacancy
Rate 2.5% 2.5% 5.8% 5.6% 15.8% 18.2% 19.4% 17.8%
Lease Rates $27.00 $27.00 $27.00 $27.00 $27.00 $19.76 $19.76 $19.76
A p p e n d i x B
B - 1 6 W a s i l l a C o m p r e h e n s i v e P l a n
Wasilla Trade Area Market Study 14Gibbs Planning Group, Inc. September 28, 2009
48,000 sf of office space has come on line in the market. Although there have been new office projects discussed and build-to-suit office land for sale, at this time GPG is not projecting any new projects coming on line. Demand for office space is driven by two main components: need for office space for local services such as dental, medical, legal, and financial services, and the need for office space for non-local services, such as management for regional and national companies. Office space demand driven by public sector employment is statistically limited because of the tendency of governmental entities to meet their work place needs on civic campuses, mixing the different government services at one central location. Satellite government offices, like those required by the Department of Motor Vehicles, typically locate in convenient retail locations. Estimation of the office space gap (need or over supply) is based on an inventory of the existing office square footage in a market less the current vacancy rate, quantifying and disaggregating the base employment by category, determining the number of employees who require office space by employment category, and then estimating the market specific existing office space (per square foot) per employee. This statistic is then applied to the estimated job growth, which is a derivative of population growth driving the need for additional local services and businesses. Therefore the demand for office space is indirectly tied to the population growth. The new demand created indirectly by population growth is then added to the existing demand, adjusted by a market specific Stabilized Vacancy Factor, and compared to the office space supply. Office space supply is adjusted by the amount of office space which is added to the market, less the office space which is removed from the market because of functional obsolescence, adaptive reuse, or destruction. For purposes of this study, the existing inventory in the Mat-Su Office Market is 232,000 sf. GPG estimates that during the next five years approximately 15,300 sf (72%) of the Class C office space and 4,000 sf (4%) of Medical space will become functionally obsolescent. The Stabilized Vacancy Factor for the Mat-Su Office Market is estimated to be 8.0%. Based on the “WorkPlace & Employment Summary” found in the appendix of this report, the total number of employees in the Mat-Su Office Market is 24,406, of which 1,203 are estimated to be Dedicated Office Employees. The largest Dedicated Office Employee categories are Health Services, Finance/Insurance/Real Estate Services, and Legal Services. The estimated 2014 office space required per dedicated office worker in the Mat-Su Office Market is 159 sf/worker. The estimated 2014 total market demand is 230,000 sf, adjusted for the Stabilized
R e t a i l , O f f i c e , a n d L o d g i n g M a r k e t A n a l y s i s
B - 1 7W a s i l l a C o m p r e h e n s i v e P l a n
Wasilla Trade Area Market Study 15Gibbs Planning Group, Inc. September 28, 2009
Vacancy Factor is 250,000 sf. The 2014 estimated office space supply is 212,700 sf. GPG finds an 8,700 sf gap in the supply and demand of medical office space in the Mat-Su Office Market in 2014, with a Stabilized Vacancy Factor of 8%. GPG also finds a 28,600 sf gap in the supply and demand of general office space in the Mat-Su Office Market in 2014, with a Stabilized Vacancy Factor of 8%. Total office space gap for the Mat-Su Office Market is 37,300 square feet. Tourist Retail Expenditure Alaska has two distinct tourism seasons, Summer and Fall/Winter. The Summer season accounts for the bulk of tourism to the state, having more than 1.7 million summer tourists during the summer of 2008. On the other hand, the winter of 2007-2008 had 246,500 tourists. Roughly 73% of tourism is for purposes of Vacation/Pleasure. The next most common category is Visiting Friends/Relatives, which accounts for 13% of the aggregated tourism number. Business and Business/Pleasure account for the remaining 14%. While tourism was down slightly in 2008, the number of tourists rose 5% from 2006 to 2007. Looking on at the five year trend, tourism is up a total of 28% since 2003. Tourist expenditure captured in the Wasilla study area amounted to $28.41 million dollars in 2008. According to the State of Alaska, Department of Commerce, Community and Economic Development, in 2006, 14% of the tourists who came to Alaska visited the Wasilla/Palmer Market. The average statewide tourist stay was an average of 8.8 nights. 46% of tourists visiting the state of Alaska stayed in Hotels/Motels, 44% stayed in Private Homes, and the balance in other lodging including Bed & Breakfasts and Campgrounds. Of the tourists visiting the Wasilla/Palmer Market, approximately 40% were there for Vacation/Pleasure, 40% were Visiting Friends/Relatives, and 20% were there for Business. 92% of the tourists were visiting from other US States, 4% from Canada, and the remaining balance from other parts of the world. Of the American tourists, 57% were from Western US states, 18% from Southern States, 10% from the Midwest, and 6% were from the East. 79% of the tourists who visited the Wasilla/Palmer Trade Area had been to Alaska before this visit. The typical tourist in the Wasilla/Palmer Market expends an average total of $783 during the trip to Alaska, however only $171 of that is spent in the Wasilla/Palmer Market. In-Market expenditure is broken down in the follow categories: $34 for Lodging, $20 for Tours/Entertainment, $31 for Gifts/Souvenirs, $65 for Food and Beverages, $18 on Transportation, and $3 for other items. The average tourist uses the Wasilla/Palmer location as a base from which they make day and overnight trips to other parts of the State. The average
A p p e n d i x B
B - 1 8 W a s i l l a C o m p r e h e n s i v e P l a n
Wasilla Trade Area Market Study 16Gibbs Planning Group, Inc. September 28, 2009
expenditure numbers are far below average in the categories of Lodging, Gifts/Souvenirs, and Food & Beverage. The Lodging number is low because of the tourists specifically visiting the Wasilla/Palmer Market, 59.0% stayed in private homes, and only 46.0% stay in Hotels/Motels. Hotel/Hospitality Market Analysis GPG has found that there is unmet demand for the accommodation use in the South Central Alaska Market in general, and in the Wasilla/Palmer submarket in particular. GPG concludes that statistically, up to $1,880,000 in gross lodging revenue could be captured in the Wasilla/Palmer submarket, which at current Revenue per Available Room levels would translate to a 70 room Hotel/Motel. The following points are the rationale for these conclusions:
• There are 501 rooms available in the Wasilla/Palmer Submarket - 54 rooms Midscale w/Food & Beverage Service, the balance being Independent Operators.
• The Wasilla/Palmer submarket stabilized projected average occupancy is 62.62%, with a Revenue per Available Room projected at $68.04
• There is an estimated demand of $20,677,000 (Appendix Chart, Potential Expenditure Capture from Tourism) and supply of $12,441,000, yielding an estimated lodging capture of $1,880,000 of unmet demand.
• Gross Lodging Potential Gross Revenue for the Wasilla/Palmer submarket is $24,398,000 (Appendix Chart, Potential Expenditure Capture from Tourism).
• Revenue per Available Room $79.16, South Central Alaska Market (Appendix Graph #6, Sensitivity Analysis).
• Annual Occupancy for 2009 has decreased slightly from the 2008 level of 66.52% (Appendix Graph #1) for the South Central Alaska Market.
• Average Daily Rate, the amount collected per occupied room per overnight stay, has trended upward for 5 of the last 6 years from $90.07 to $112.94, an average annual increase of 4.57% (Appendix Graph #2), although 2009 looks to be off by approximately 7%.
• Revenue per Available Room, the total collected revenue divided by the total number of available rooms (occupied or unoccupied) has steadily increased for the last five years; however, the 2009 RevPar number is also projected to decline by 7% (Appendix Graph #3).
R e t a i l , O f f i c e , a n d L o d g i n g M a r k e t A n a l y s i s
B - 1 9W a s i l l a C o m p r e h e n s i v e P l a n
Wasilla Trade Area Market Study 17Gibbs Planning Group, Inc. September 28, 2009
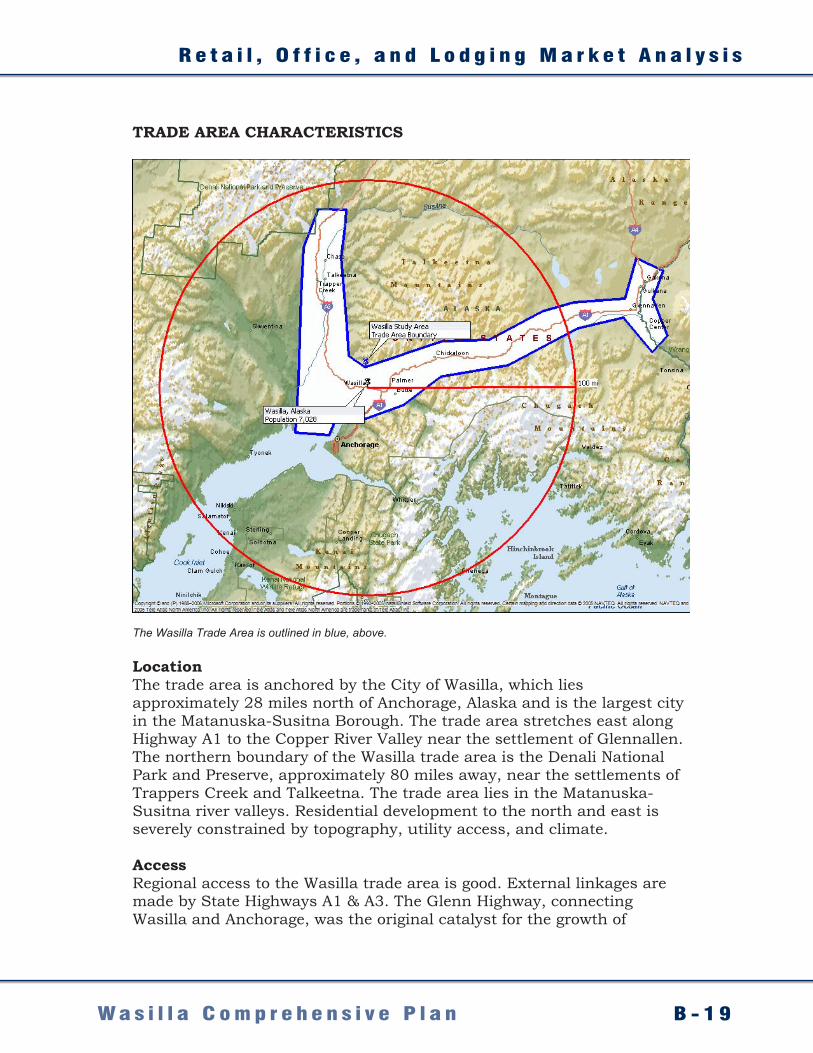
TRADE AREA CHARACTERISTICS
The Wasilla Trade Area is outlined in blue, above. Location The trade area is anchored by the City of Wasilla, which lies approximately 28 miles north of Anchorage, Alaska and is the largest city in the Matanuska-Susitna Borough. The trade area stretches east along Highway A1 to the Copper River Valley near the settlement of Glennallen. The northern boundary of the Wasilla trade area is the Denali National Park and Preserve, approximately 80 miles away, near the settlements of Trappers Creek and Talkeetna. The trade area lies in the Matanuska-Susitna river valleys. Residential development to the north and east is severely constrained by topography, utility access, and climate. Access Regional access to the Wasilla trade area is good. External linkages are made by State Highways A1 & A3. The Glenn Highway, connecting Wasilla and Anchorage, was the original catalyst for the growth of
A p p e n d i x B
B - 2 0 W a s i l l a C o m p r e h e n s i v e P l a n
Wasilla Trade Area Market Study 18Gibbs Planning Group, Inc. September 28, 2009
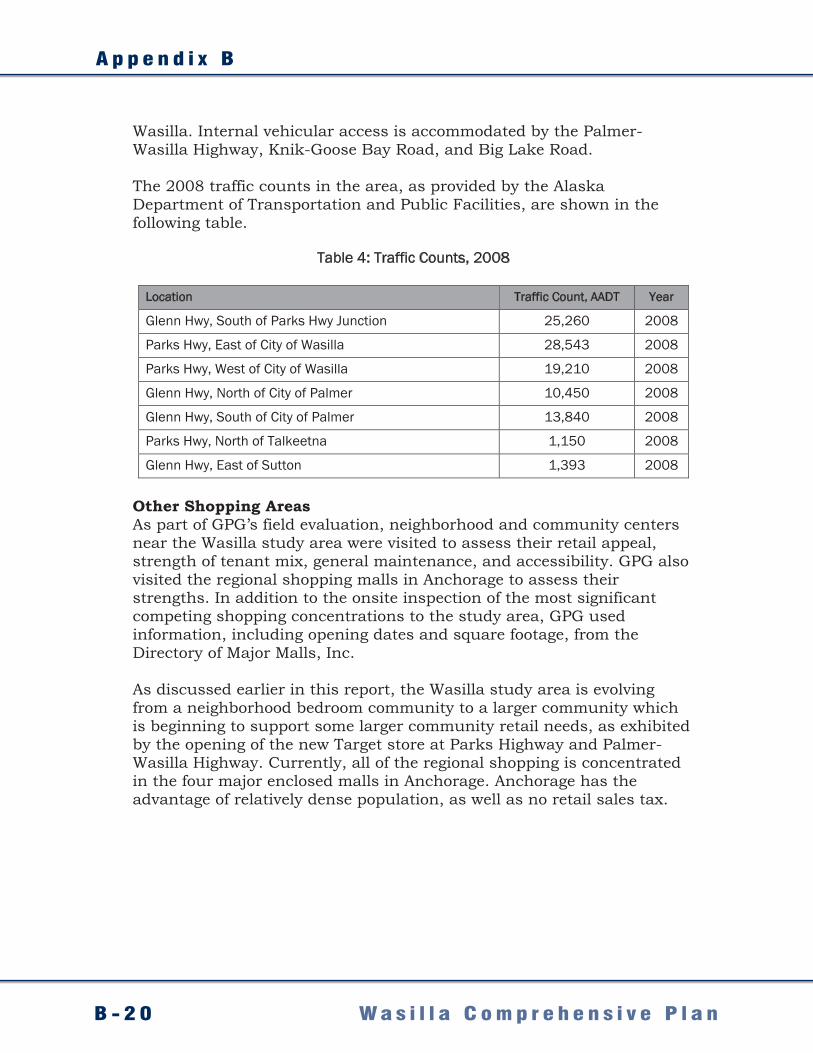
Wasilla. Internal vehicular access is accommodated by the Palmer-Wasilla Highway, Knik-Goose Bay Road, and Big Lake Road. The 2008 traffic counts in the area, as provided by the Alaska Department of Transportation and Public Facilities, are shown in the following table.
Table 4: Traffic Counts, 2008
Location Traffic Count, AADT Year
Glenn Hwy, South of Parks Hwy Junction 25,260 2008
Parks Hwy, East of City of Wasilla 28,543 2008
Parks Hwy, West of City of Wasilla 19,210 2008
Glenn Hwy, North of City of Palmer 10,450 2008
Glenn Hwy, South of City of Palmer 13,840 2008
Parks Hwy, North of Talkeetna 1,150 2008
Glenn Hwy, East of Sutton 1,393 2008
Other Shopping Areas As part of GPG’s field evaluation, neighborhood and community centers near the Wasilla study area were visited to assess their retail appeal, strength of tenant mix, general maintenance, and accessibility. GPG also visited the regional shopping malls in Anchorage to assess their strengths. In addition to the onsite inspection of the most significant competing shopping concentrations to the study area, GPG used information, including opening dates and square footage, from the Directory of Major Malls, Inc. As discussed earlier in this report, the Wasilla study area is evolving from a neighborhood bedroom community to a larger community which is beginning to support some larger community retail needs, as exhibited by the opening of the new Target store at Parks Highway and Palmer-Wasilla Highway. Currently, all of the regional shopping is concentrated in the four major enclosed malls in Anchorage. Anchorage has the advantage of relatively dense population, as well as no retail sales tax.
R e t a i l , O f f i c e , a n d L o d g i n g M a r k e t A n a l y s i s
B - 2 1W a s i l l a C o m p r e h e n s i v e P l a n
Wasilla Trade Area Market Study 19Gibbs Planning Group, Inc. September 28, 2009
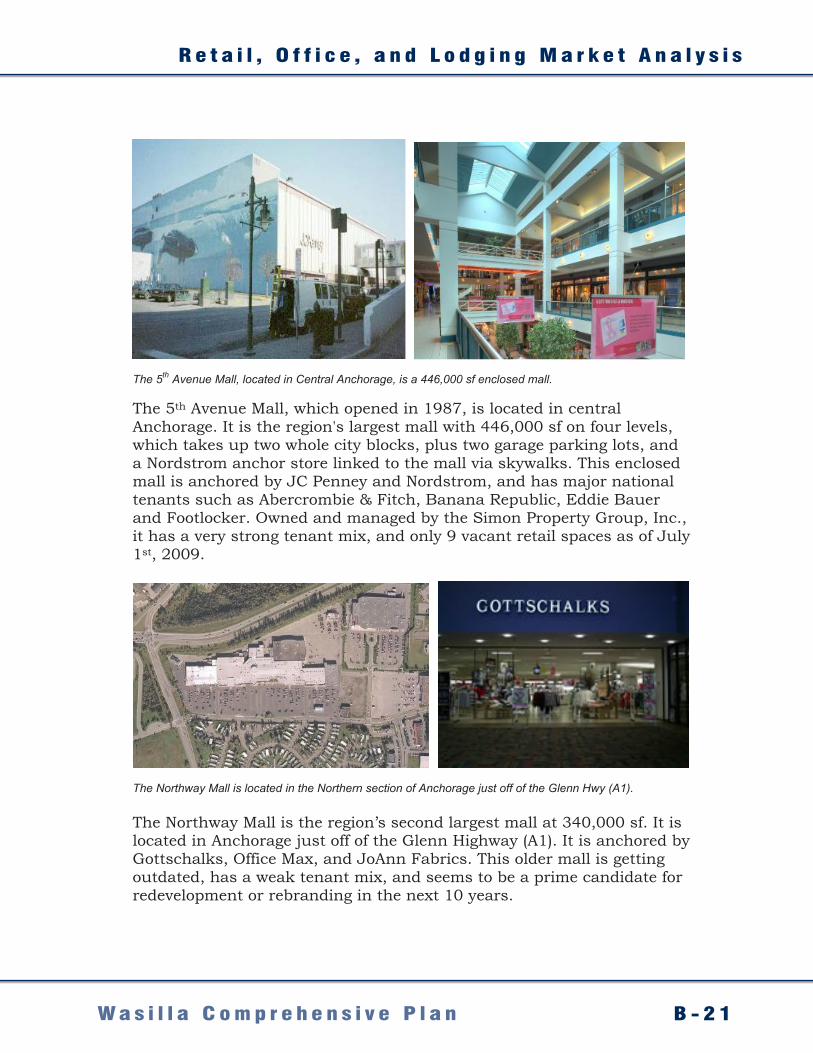
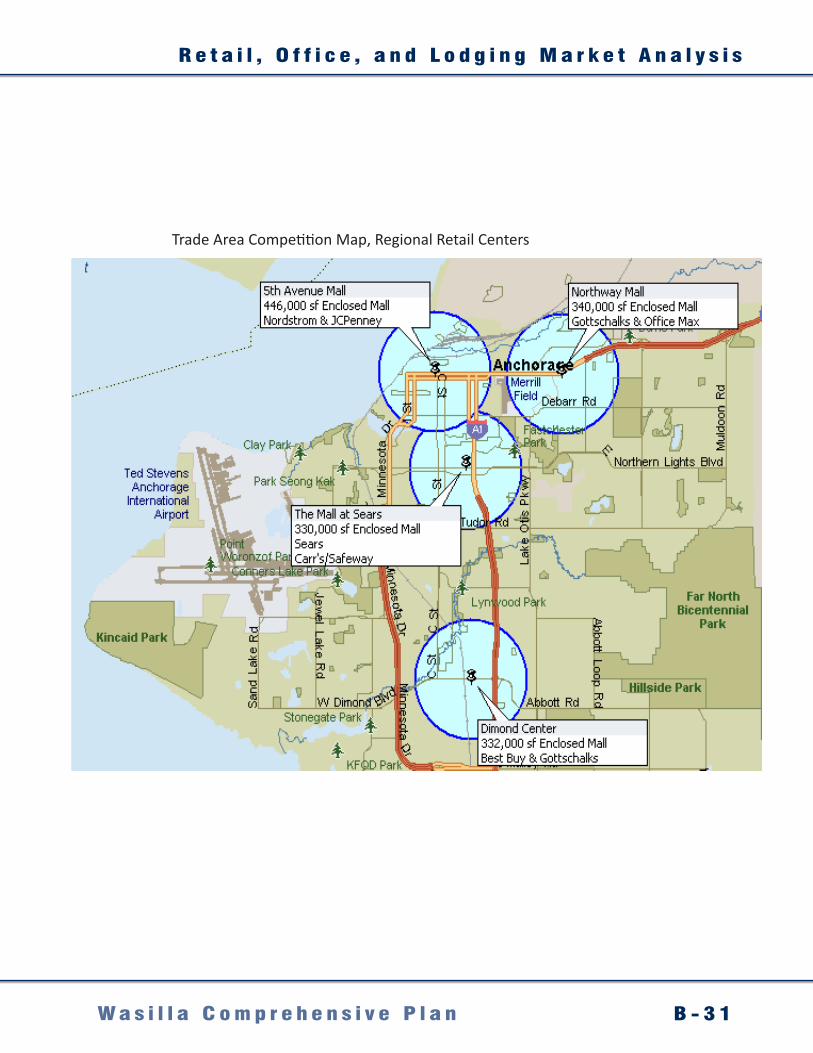
The 5th Avenue Mall, located in Central Anchorage, is a 446,000 sf enclosed mall. The 5th Avenue Mall, which opened in 1987, is located in central Anchorage. It is the region's largest mall with 446,000 sf on four levels, which takes up two whole city blocks, plus two garage parking lots, and a Nordstrom anchor store linked to the mall via skywalks. This enclosed mall is anchored by JC Penney and Nordstrom, and has major national tenants such as Abercrombie & Fitch, Banana Republic, Eddie Bauer and Footlocker. Owned and managed by the Simon Property Group, Inc., it has a very strong tenant mix, and only 9 vacant retail spaces as of July 1st, 2009.
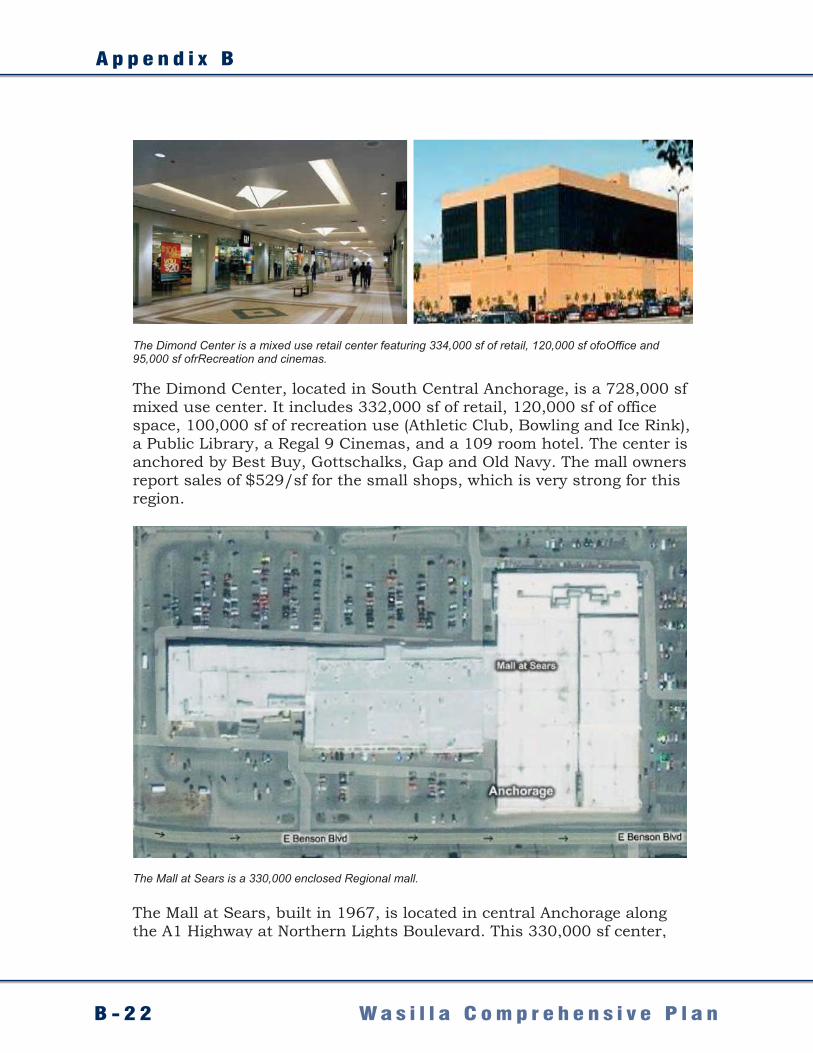
The Northway Mall is located in the Northern section of Anchorage just off of the Glenn Hwy (A1). The Northway Mall is the region’s second largest mall at 340,000 sf. It is located in Anchorage just off of the Glenn Highway (A1). It is anchored by Gottschalks, Office Max, and JoAnn Fabrics. This older mall is getting outdated, has a weak tenant mix, and seems to be a prime candidate for redevelopment or rebranding in the next 10 years.
A p p e n d i x B
B - 2 2 W a s i l l a C o m p r e h e n s i v e P l a n
Wasilla Trade Area Market Study 20Gibbs Planning Group, Inc. September 28, 2009
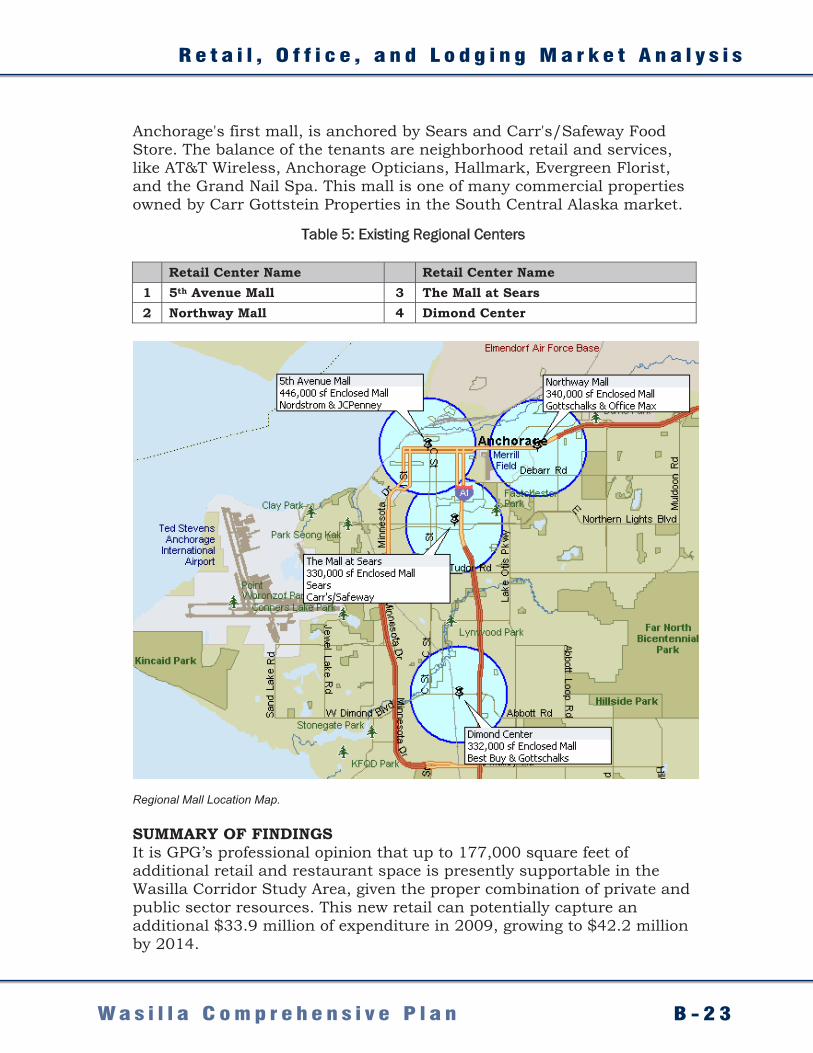
The Dimond Center is a mixed use retail center featuring 334,000 sf of retail, 120,000 sf ofoOffice and 95,000 sf ofrRecreation and cinemas. The Dimond Center, located in South Central Anchorage, is a 728,000 sf mixed use center. It includes 332,000 sf of retail, 120,000 sf of office space, 100,000 sf of recreation use (Athletic Club, Bowling and Ice Rink), a Public Library, a Regal 9 Cinemas, and a 109 room hotel. The center is anchored by Best Buy, Gottschalks, Gap and Old Navy. The mall owners report sales of $529/sf for the small shops, which is very strong for this region.
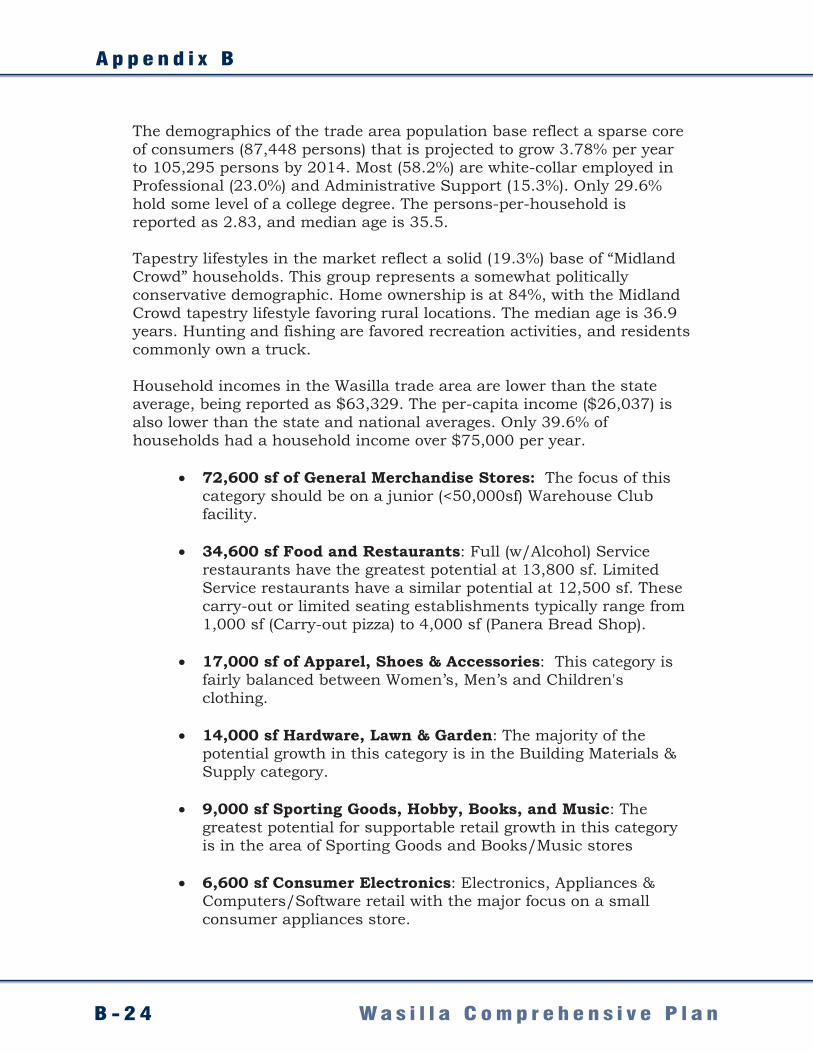
The Mall at Sears is a 330,000 enclosed Regional mall. The Mall at Sears, built in 1967, is located in central Anchorage along the A1 Highway at Northern Lights Boulevard. This 330,000 sf center,
R e t a i l , O f f i c e , a n d L o d g i n g M a r k e t A n a l y s i s
B - 2 3W a s i l l a C o m p r e h e n s i v e P l a n
Wasilla Trade Area Market Study 21Gibbs Planning Group, Inc. September 28, 2009
Anchorage's first mall, is anchored by Sears and Carr's/Safeway Food Store. The balance of the tenants are neighborhood retail and services, like AT&T Wireless, Anchorage Opticians, Hallmark, Evergreen Florist, and the Grand Nail Spa. This mall is one of many commercial properties owned by Carr Gottstein Properties in the South Central Alaska market.
Table 5: Existing Regional Centers
Retail Center Name Retail Center Name 1 5th Avenue Mall 3 The Mall at Sears 2 Northway Mall 4 Dimond Center
Regional Mall Location Map. SUMMARY OF FINDINGS It is GPG’s professional opinion that up to 177,000 square feet of additional retail and restaurant space is presently supportable in the Wasilla Corridor Study Area, given the proper combination of private and public sector resources. This new retail can potentially capture an additional $33.9 million of expenditure in 2009, growing to $42.2 million by 2014.
A p p e n d i x B
B - 2 4 W a s i l l a C o m p r e h e n s i v e P l a n
Wasilla Trade Area Market Study 22Gibbs Planning Group, Inc. September 28, 2009
The demographics of the trade area population base reflect a sparse core of consumers (87,448 persons) that is projected to grow 3.78% per year to 105,295 persons by 2014. Most (58.2%) are white-collar employed in Professional (23.0%) and Administrative Support (15.3%). Only 29.6% hold some level of a college degree. The persons-per-household is reported as 2.83, and median age is 35.5. Tapestry lifestyles in the market reflect a solid (19.3%) base of “Midland Crowd” households. This group represents a somewhat politically conservative demographic. Home ownership is at 84%, with the Midland Crowd tapestry lifestyle favoring rural locations. The median age is 36.9 years. Hunting and fishing are favored recreation activities, and residents commonly own a truck. Household incomes in the Wasilla trade area are lower than the state average, being reported as $63,329. The per-capita income ($26,037) is also lower than the state and national averages. Only 39.6% of households had a household income over $75,000 per year.
• 72,600 sf of General Merchandise Stores: The focus of this category should be on a junior (<50,000sf) Warehouse Club facility.
• 34,600 sf Food and Restaurants: Full (w/Alcohol) Service restaurants have the greatest potential at 13,800 sf. Limited Service restaurants have a similar potential at 12,500 sf. These carry-out or limited seating establishments typically range from 1,000 sf (Carry-out pizza) to 4,000 sf (Panera Bread Shop).
• 17,000 sf of Apparel, Shoes & Accessories: This category is
fairly balanced between Women’s, Men’s and Children's clothing.
• 14,000 sf Hardware, Lawn & Garden: The majority of the
potential growth in this category is in the Building Materials & Supply category.
• 9,000 sf Sporting Goods, Hobby, Books, and Music: The
greatest potential for supportable retail growth in this category is in the area of Sporting Goods and Books/Music stores
• 6,600 sf Consumer Electronics: Electronics, Appliances &
Computers/Software retail with the major focus on a small consumer appliances store.
R e t a i l , O f f i c e , a n d L o d g i n g M a r k e t A n a l y s i s
B - 2 5W a s i l l a C o m p r e h e n s i v e P l a n
Wasilla Trade Area Market Study 23Gibbs Planning Group, Inc. September 28, 2009
• 5,900 sf Home Furnishings: All focus should be on a Furniture store, or a significant furniture department in a larger multiproduct superstore.
• 3,900 sf Food & Beverage Stores: Recommended Specialty
Food stores would include a delicatessen, butcher, seafood market, baked goods store, confectionery store, or other niche specialty food stores retailing products for off site consumption.
• 2,500 sf Health Care & Personal Services: This category
includes the following retail groups: Pharmacies, Cosmetics and Beauty supplies, Nutrition store, Medical Equipment and Supplies, and Optical retailers.
• 1,400 sf Jewelry/Luxury Goods: The projected need focuses
on Jewelry, Luggage and Leather Good Stores. • 9,500 sf of Miscellaneous Retailers: Card/Gift Stores,
Florists, Office Supplies, Pet Supplies, Tobacco, and Video/Entertainment Stores.
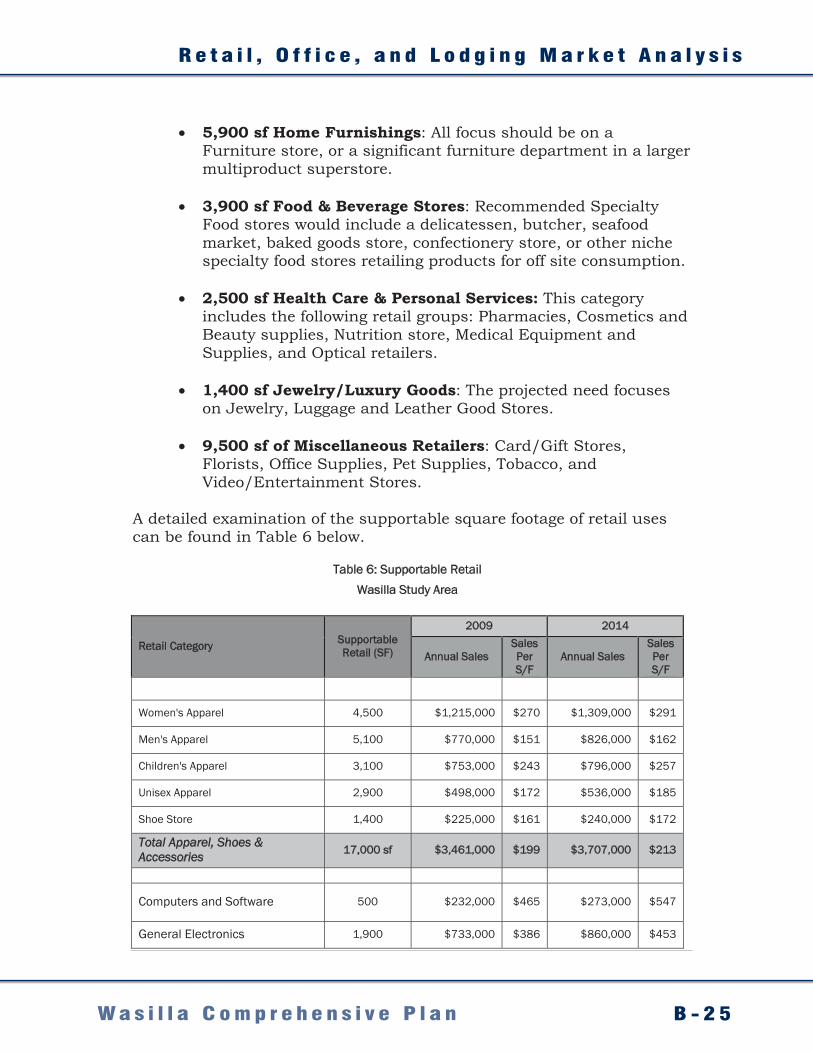
A detailed examination of the supportable square footage of retail uses can be found in Table 6 below.
Table 6: Supportable Retail Wasilla Study Area
Retail Category Supportable Retail (SF)
2009 2014
Annual Sales Sales Per S/F
Annual Sales Sales Per S/F
Women's Apparel 4,500 $1,215,000 $270 $1,309,000 $291
Men's Apparel 5,100 $770,000 $151 $826,000 $162
Children's Apparel 3,100 $753,000 $243 $796,000 $257
Unisex Apparel 2,900 $498,000 $172 $536,000 $185
Shoe Store 1,400 $225,000 $161 $240,000 $172
Total Apparel, Shoes & Accessories 17,000 sf $3,461,000 $199 $3,707,000 $213
Computers and Software 500 $232,000 $465 $273,000 $547
General Electronics 1,900 $733,000 $386 $860,000 $453
A p p e n d i x B
B - 2 6 W a s i l l a C o m p r e h e n s i v e P l a nWasilla Trade Area Market Study 24Gibbs Planning Group, Inc. September 28, 2009
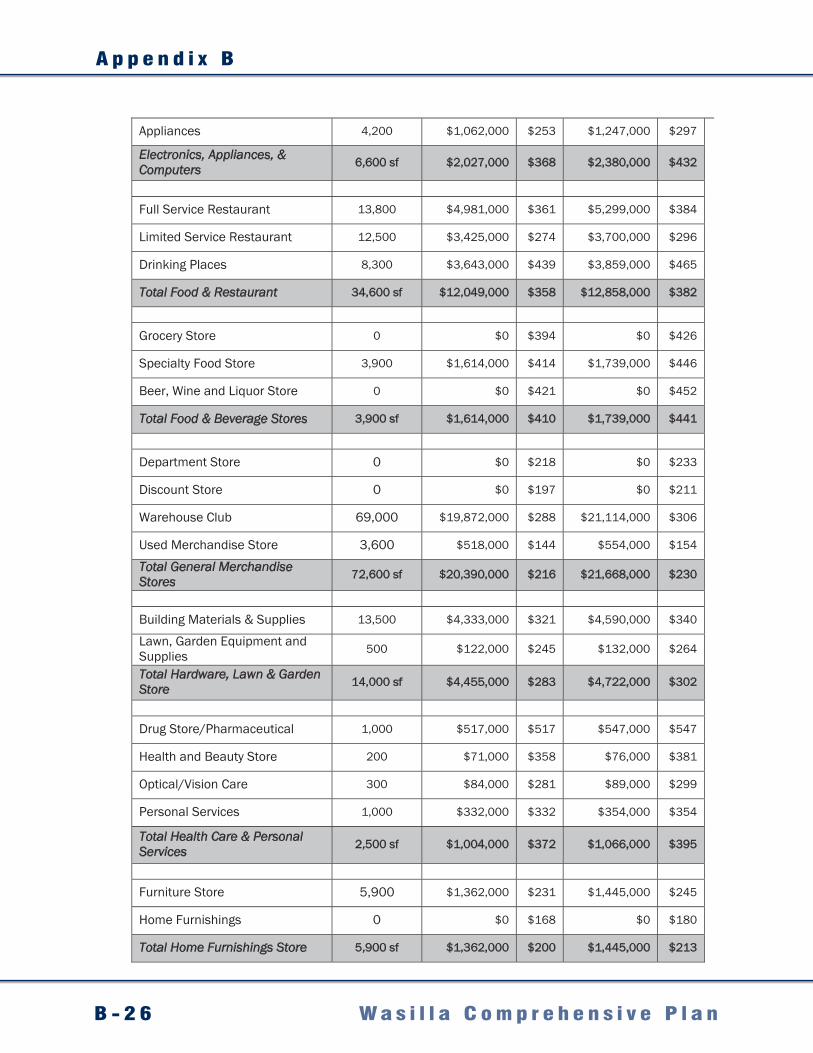
Appliances 4,200 $1,062,000 $253 $1,247,000 $297
Electronics, Appliances, & Computers 6,600 sf $2,027,000 $368 $2,380,000 $432
Full Service Restaurant 13,800 $4,981,000 $361 $5,299,000 $384
Limited Service Restaurant 12,500 $3,425,000 $274 $3,700,000 $296
Drinking Places 8,300 $3,643,000 $439 $3,859,000 $465
Total Food & Restaurant 34,600 sf $12,049,000 $358 $12,858,000 $382
Grocery Store 0 $0 $394 $0 $426
Specialty Food Store 3,900 $1,614,000 $414 $1,739,000 $446
Beer, Wine and Liquor Store 0 $0 $421 $0 $452
Total Food & Beverage Stores 3,900 sf $1,614,000 $410 $1,739,000 $441
Department Store 0 $0 $218 $0 $233
Discount Store 0 $0 $197 $0 $211
Warehouse Club 69,000 $19,872,000 $288 $21,114,000 $306
Used Merchandise Store 3,600 $518,000 $144 $554,000 $154
Total General Merchandise Stores 72,600 sf $20,390,000 $216 $21,668,000 $230
Building Materials & Supplies 13,500 $4,333,000 $321 $4,590,000 $340
Lawn, Garden Equipment and Supplies 500 $122,000 $245 $132,000 $264
Total Hardware, Lawn & Garden Store 14,000 sf $4,455,000 $283 $4,722,000 $302
Drug Store/Pharmaceutical 1,000 $517,000 $517 $547,000 $547
Health and Beauty Store 200 $71,000 $358 $76,000 $381
Optical/Vision Care 300 $84,000 $281 $89,000 $299
Personal Services 1,000 $332,000 $332 $354,000 $354
Total Health Care & Personal Services 2,500 sf $1,004,000 $372 $1,066,000 $395
Furniture Store 5,900 $1,362,000 $231 $1,445,000 $245
Home Furnishings 0 $0 $168 $0 $180
Total Home Furnishings Store 5,900 sf $1,362,000 $200 $1,445,000 $213
R e t a i l , O f f i c e , a n d L o d g i n g M a r k e t A n a l y s i s
B - 2 7W a s i l l a C o m p r e h e n s i v e P l a n
Wasilla Trade Area Market Study 25Gibbs Planning Group, Inc. September 28, 2009
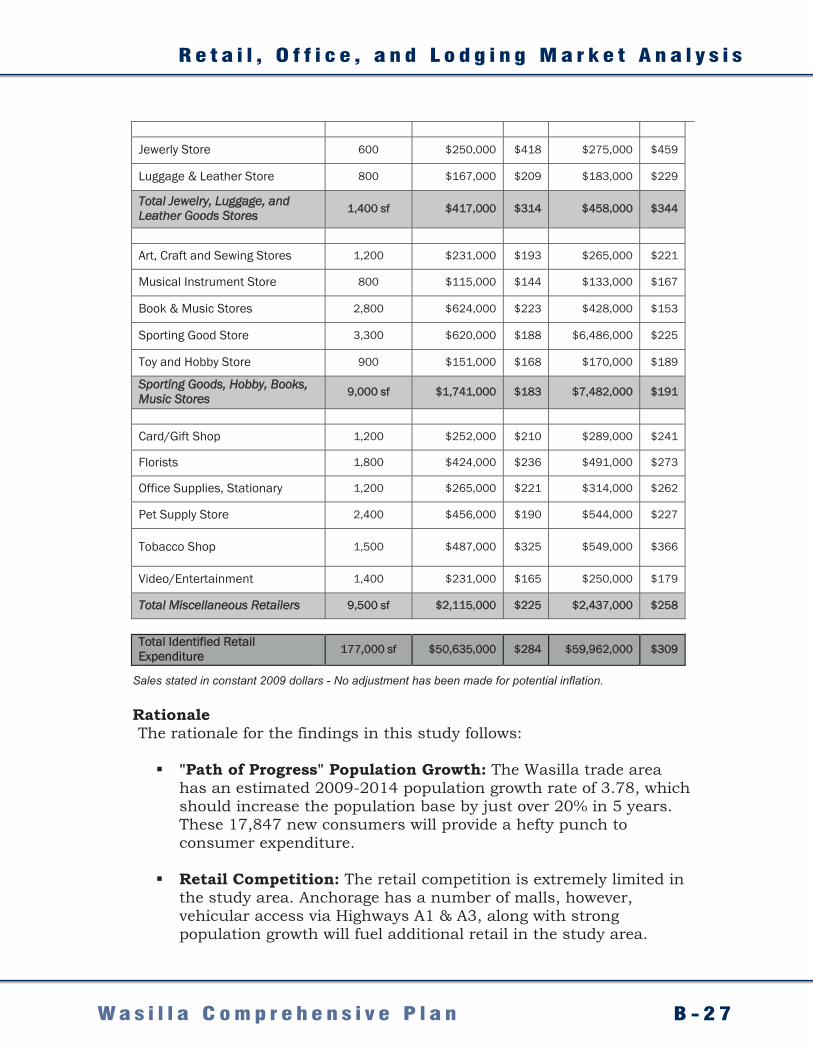
Jewerly Store 600 $250,000 $418 $275,000 $459
Luggage & Leather Store 800 $167,000 $209 $183,000 $229
Total Jewelry, Luggage, and Leather Goods Stores 1,400 sf $417,000 $314 $458,000 $344
Art, Craft and Sewing Stores 1,200 $231,000 $193 $265,000 $221
Musical Instrument Store 800 $115,000 $144 $133,000 $167
Book & Music Stores 2,800 $624,000 $223 $428,000 $153
Sporting Good Store 3,300 $620,000 $188 $6,486,000 $225
Toy and Hobby Store 900 $151,000 $168 $170,000 $189
Sporting Goods, Hobby, Books, Music Stores 9,000 sf $1,741,000 $183 $7,482,000 $191
Card/Gift Shop 1,200 $252,000 $210 $289,000 $241
Florists 1,800 $424,000 $236 $491,000 $273
Office Supplies, Stationary 1,200 $265,000 $221 $314,000 $262
Pet Supply Store 2,400 $456,000 $190 $544,000 $227
Tobacco Shop 1,500 $487,000 $325 $549,000 $366
Video/Entertainment 1,400 $231,000 $165 $250,000 $179
Total Miscellaneous Retailers 9,500 sf $2,115,000 $225 $2,437,000 $258
Total Identified Retail Expenditure 177,000 sf $50,635,000 $284 $59,962,000 $309
Sales stated in constant 2009 dollars - No adjustment has been made for potential inflation. Rationale The rationale for the findings in this study follows:
"Path of Progress" Population Growth: The Wasilla trade area has an estimated 2009-2014 population growth rate of 3.78, which should increase the population base by just over 20% in 5 years. These 17,847 new consumers will provide a hefty punch to consumer expenditure.
Retail Competition: The retail competition is extremely limited in the study area. Anchorage has a number of malls, however, vehicular access via Highways A1 & A3, along with strong population growth will fuel additional retail in the study area.
A p p e n d i x B
B - 2 8 W a s i l l a C o m p r e h e n s i v e P l a n
2009 2014
Trade Area ('000's) Trade Area ('000's) Annual Sales
Sales Per S/F Annual Sales
Sales Per S/F
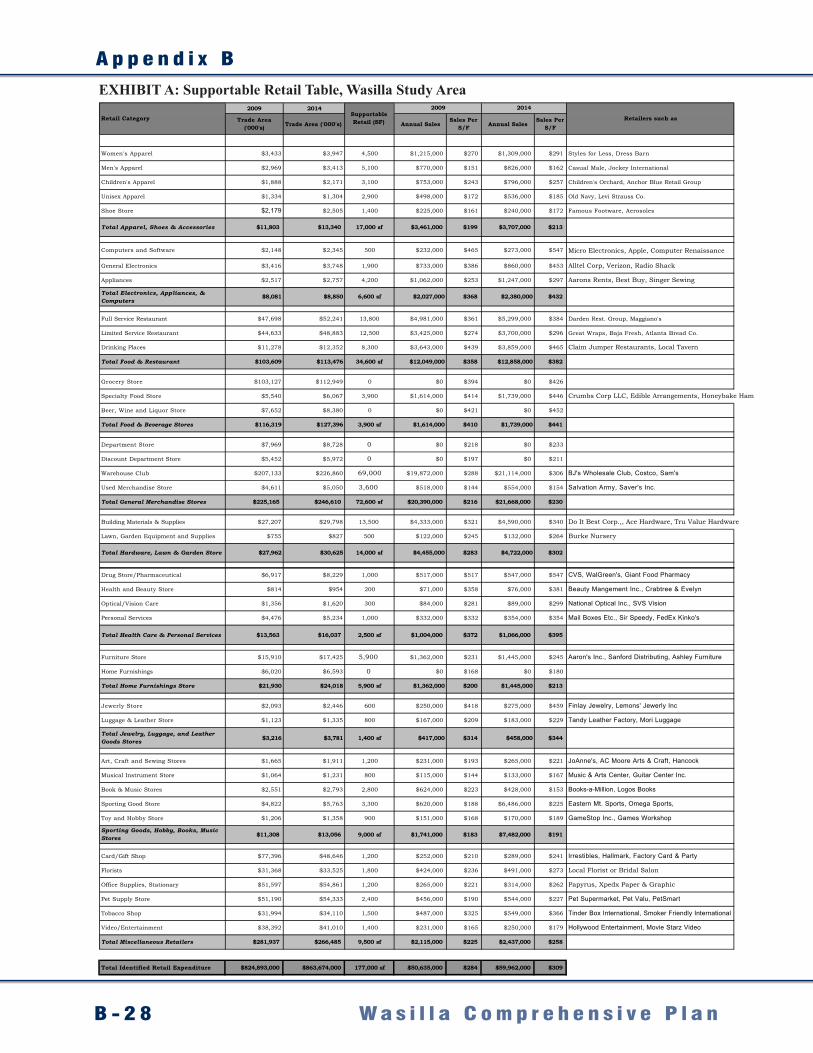
Women's Apparel $3,433 $3,947 4,500 $1,215,000 $270 $1,309,000 $291 Styles for Less, Dress Barn
Men's Apparel $2,969 $3,413 5,100 $770,000 $151 $826,000 $162 Casual Male, Jockey International
Children's Apparel $1,888 $2,171 3,100 $753,000 $243 $796,000 $257 Children's Orchard, Anchor Blue Retail Group
Unisex Apparel $1,334 $1,304 2,900 $498,000 $172 $536,000 $185 Old Navy, Levi Strauss Co.
Shoe Store $2,179 $2,505 1,400 $225,000 $161 $240,000 $172 Famous Footware, Aerosoles
Total Apparel, Shoes & Accessories $11,803 $13,340 17,000 sf $3,461,000 $199 $3,707,000 $213
Computers and Software $2,148 $2,345 500 $232,000 $465 $273,000 $547 Micro Electronics, Apple, Computer Renaissance
General Electronics $3,416 $3,748 1,900 $733,000 $386 $860,000 $453 Alltel Corp, Verizon, Radio Shack
Appliances $2,517 $2,757 4,200 $1,062,000 $253 $1,247,000 $297 Aarons Rents, Best Buy, Singer Sewing
Total Electronics, Appliances, & Computers
$8,081 $8,850 6,600 sf $2,027,000 $368 $2,380,000 $432
Full Service Restaurant $47,698 $52,241 13,800 $4,981,000 $361 $5,299,000 $384 Darden Rest. Group, Maggiano's
Limited Service Restaurant $44,633 $48,883 12,500 $3,425,000 $274 $3,700,000 $296 Great Wraps, Baja Fresh, Atlanta Bread Co.
Drinking Places $11,278 $12,352 8,300 $3,643,000 $439 $3,859,000 $465 Claim Jumper Restaurants, Local Tavern
Total Food & Restaurant $103,609 $113,476 34,600 sf $12,049,000 $358 $12,858,000 $382
Grocery Store $103,127 $112,949 0 $0 $394 $0 $426
Specialty Food Store $5,540 $6,067 3,900 $1,614,000 $414 $1,739,000 $446 Crumbs Corp LLC, Edible Arrangements, Honeybake Ham
Beer, Wine and Liquor Store $7,652 $8,380 0 $0 $421 $0 $452
Total Food & Beverage Stores $116,319 $127,396 3,900 sf $1,614,000 $410 $1,739,000 $441
Department Store $7,969 $8,728 0 $0 $218 $0 $233
Discount Department Store $5,452 $5,972 0 $0 $197 $0 $211
Warehouse Club $207,133 $226,860 69,000 $19,872,000 $288 $21,114,000 $306 BJ's Wholesale Club, Costco, Sam's
Used Merchandise Store $4,611 $5,050 3,600 $518,000 $144 $554,000 $154 Salvation Army, Saver's Inc.
Total General Merchandise Stores $225,165 $246,610 72,600 sf $20,390,000 $216 $21,668,000 $230
Building Materials & Supplies $27,207 $29,798 13,500 $4,333,000 $321 $4,590,000 $340 Do It Best Corp.,, Ace Hardware, Tru Value Hardware
Lawn, Garden Equipment and Supplies $755 $827 500 $122,000 $245 $132,000 $264 Burke Nursery
Total Hardware, Lawn & Garden Store $27,962 $30,625 14,000 sf $4,455,000 $283 $4,722,000 $302
EXHIBIT A: Supportable Retail Table
Retailers such asRetail CategorySupportableRetail (SF)
2009 2014
Wasilla Study Area
Gibbs Planning Group, Inc., Wasilla Alaska Report Appendix Page 27
2009 2014
Trade Area ('000's) Trade Area ('000's) Annual Sales
Sales Per S/F Annual Sales
Sales Per S/F
EXHIBIT A: Supportable Retail Table
Retailers such asRetail CategorySupportableRetail (SF)
2009 2014
Wasilla Study Area
Drug Store/Pharmaceutical $6,917 $8,229 1,000 $517,000 $517 $547,000 $547 CVS, WalGreen's, Giant Food Pharmacy
Health and Beauty Store $814 $954 200 $71,000 $358 $76,000 $381 Beauty Mangement Inc., Crabtree & Evelyn
Optical/Vision Care $1,356 $1,620 300 $84,000 $281 $89,000 $299 National Optical Inc., SVS Vision
Personal Services $4,476 $5,234 1,000 $332,000 $332 $354,000 $354 Mail Boxes Etc., Sir Speedy, FedEx Kinko's
Total Health Care & Personal Services $13,563 $16,037 2,500 sf $1,004,000 $372 $1,066,000 $395
Furniture Store $15,910 $17,425 5,900 $1,362,000 $231 $1,445,000 $245 Aaron's Inc., Sanford Distributing, Ashley Furniture
Home Furnishings $6,020 $6,593 0 $0 $168 $0 $180
Total Home Furnishings Store $21,930 $24,018 5,900 sf $1,362,000 $200 $1,445,000 $213
Jewerly Store $2,093 $2,446 600 $250,000 $418 $275,000 $459 Finlay Jewelry, Lemons' Jewerly Inc
Luggage & Leather Store $1,123 $1,335 800 $167,000 $209 $183,000 $229 Tandy Leather Factory, Mori Luggage
Total Jewelry, Luggage, and Leather Goods Stores $3,216 $3,781 1,400 sf $417,000 $314 $458,000 $344
Art, Craft and Sewing Stores $1,665 $1,911 1,200 $231,000 $193 $265,000 $221 JoAnne's, AC Moore Arts & Craft, Hancock
Musical Instrument Store $1,064 $1,231 800 $115,000 $144 $133,000 $167 Music & Arts Center, Guitar Center Inc.
Book & Music Stores $2,551 $2,793 2,800 $624,000 $223 $428,000 $153 Books-a-Million, Logos Books
Sporting Good Store $4,822 $5,763 3,300 $620,000 $188 $6,486,000 $225 Eastern Mt. Sports, Omega Sports,
Toy and Hobby Store $1,206 $1,358 900 $151,000 $168 $170,000 $189 GameStop Inc., Games Workshop
Sporting Goods, Hobby, Books, Music Stores $11,308 $13,056 9,000 sf $1,741,000 $183 $7,482,000 $191
Card/Gift Shop $77,396 $48,646 1,200 $252,000 $210 $289,000 $241 Irrestibles, Hallmark, Factory Card & Party
Florists $31,368 $33,525 1,800 $424,000 $236 $491,000 $273 Local Florist or Bridal Salon
Office Supplies, Stationary $51,597 $54,861 1,200 $265,000 $221 $314,000 $262 Papyrus, Xpedx Paper & Graphic
Pet Supply Store $51,190 $54,333 2,400 $456,000 $190 $544,000 $227 Pet Supermarket, Pet Valu, PetSmart
Tobacco Shop $31,994 $34,110 1,500 $487,000 $325 $549,000 $366 Tinder Box International, Smoker Friendly International
Video/Entertainment $38,392 $41,010 1,400 $231,000 $165 $250,000 $179 Hollywood Entertainment, Movie Starz Video
Total Miscellaneous Retailers $281,937 $266,485 9,500 sf $2,115,000 $225 $2,437,000 $258
Total Identified Retail Expenditure $824,893,000 $863,674,000 177,000 sf $50,635,000 $284 $59,962,000 $309
Gibbs Planning Group, Inc., Wasilla Alaska Report Appendix Page 28
EXHIBIT A: Supportable Retail Table, Wasilla Study Area
R e t a i l , O f f i c e , a n d L o d g i n g M a r k e t A n a l y s i s
B - 2 9W a s i l l a C o m p r e h e n s i v e P l a n
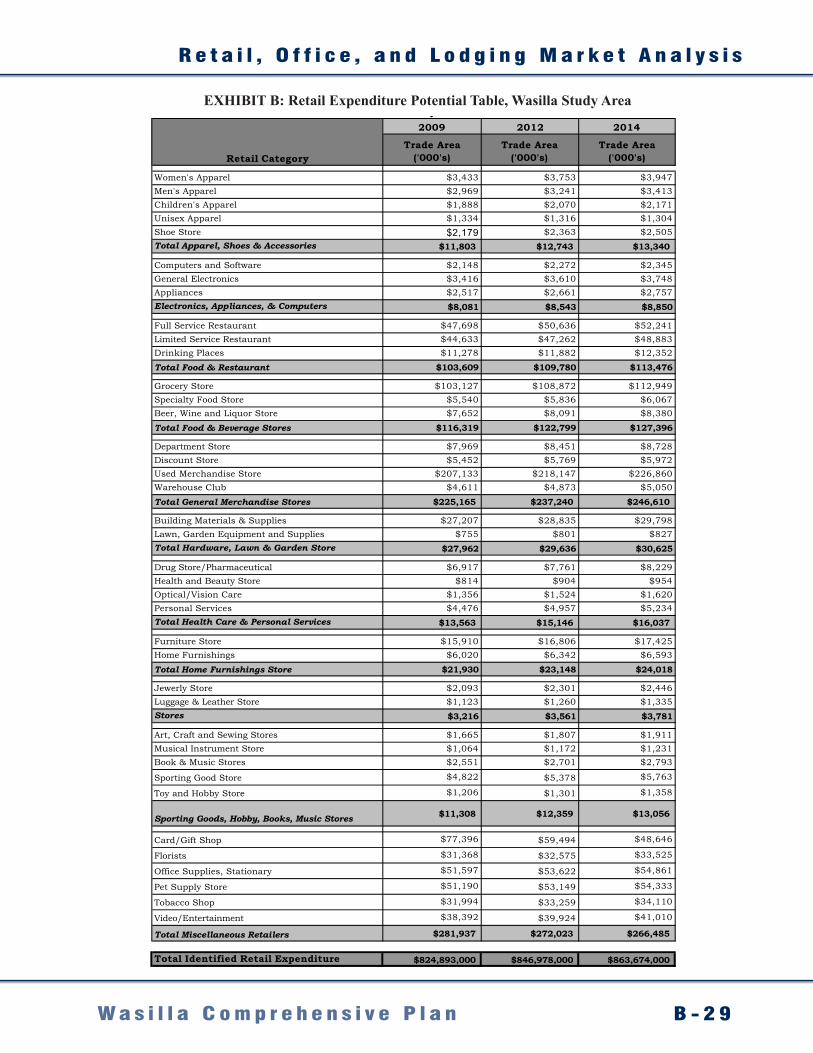
2009 2012 2014
Trade Area ('000's)
Trade Area ('000's)
Trade Area ('000's)
Women's Apparel $3,433 $3,753 $3,947Men's Apparel $2,969 $3,241 $3,413Children's Apparel $1,888 $2,070 $2,171Unisex Apparel $1,334 $1,316 $1,304Shoe Store $2,179 $2,363 $2,505Total Apparel, Shoes & Accessories $11,803 $12,743 $13,340
Computers and Software $2,148 $2,272 $2,345General Electronics $3,416 $3,610 $3,748Appliances $2,517 $2,661 $2,757Electronics, Appliances, & Computers $8,081 $8,543 $8,850
Full Service Restaurant $47,698 $50,636 $52,241Limited Service Restaurant $44,633 $47,262 $48,883Drinking Places $11,278 $11,882 $12,352
Total Food & Restaurant $103,609 $109,780 $113,476
Grocery Store $103,127 $108,872 $112,949Specialty Food Store $5,540 $5,836 $6,067Beer, Wine and Liquor Store $7,652 $8,091 $8,380
Total Food & Beverage Stores $116,319 $122,799 $127,396
Department Store $7,969 $8,451 $8,728Discount Store $5,452 $5,769 $5,972Used Merchandise Store $207,133 $218,147 $226,860Warehouse Club $4,611 $4,873 $5,050
Total General Merchandise Stores $225,165 $237,240 $246,610
Building Materials & Supplies $27,207 $28,835 $29,798Lawn, Garden Equipment and Supplies $755 $801 $827Total Hardware, Lawn & Garden Store $27,962 $29,636 $30,625
Drug Store/Pharmaceutical $6,917 $7,761 $8,229Health and Beauty Store $814 $904 $954Optical/Vision Care $1,356 $1,524 $1,620Personal Services $4,476 $4,957 $5,234Total Health Care & Personal Services $13,563 $15,146 $16,037
Furniture Store $15,910 $16,806 $17,425Home Furnishings $6,020 $6,342 $6,593
Total Home Furnishings Store $21,930 $23,148 $24,018
Jewerly Store $2,093 $2,301 $2,446Luggage & Leather Store $1,123 $1,260 $1,335Stores $3,216 $3,561 $3,781
Art, Craft and Sewing Stores $1,665 $1,807 $1,911Musical Instrument Store $1,064 $1,172 $1,231Book & Music Stores $2,551 $2,701 $2,793
Sporting Good Store $4,822 $5,378 $5,763
Toy and Hobby Store $1,206 $1,301 $1,358
Sporting Goods, Hobby, Books, Music Stores $11,308 $12,359 $13,056
Card/Gift Shop $77,396 $59,494 $48,646
Florists $31,368 $32,575 $33,525
Office Supplies, Stationary $51,597 $53,622 $54,861
Pet Supply Store $51,190 $53,149 $54,333
Tobacco Shop $31,994 $33,259 $34,110
Video/Entertainment $38,392 $39,924 $41,010
Total Miscellaneous Retailers $281,937 $272,023 $266,485
Total Identified Retail Expenditure $824,893,000 $846,978,000 $863,674,000
EXHIBIT B: Retail Expenditure Potential Table
Retail Category
Wasilla Study Area
Gibbs Planning Group, Inc., Wasilla Alaska Report Appendix Page 29
EXHIBIT B: Retail Expenditure Potential Table, Wasilla Study Area
A p p e n d i x B
B - 3 0 W a s i l l a C o m p r e h e n s i v e P l a n
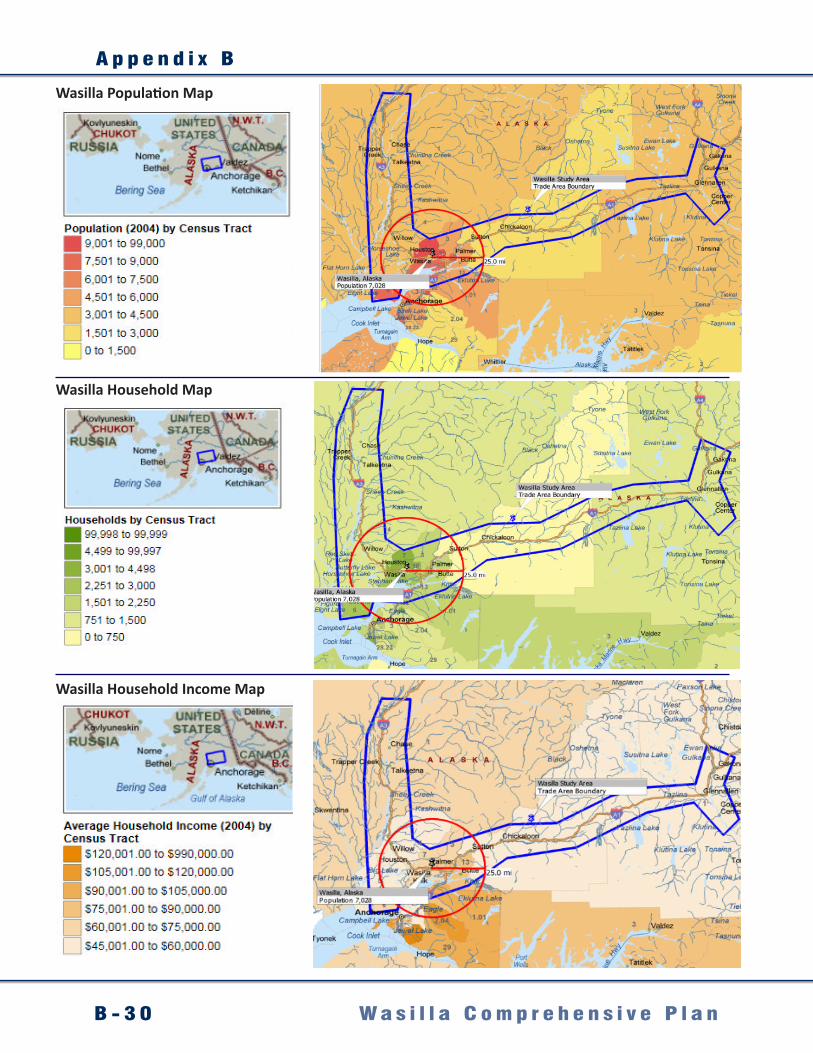
Gibbs Planning Group Inc., Wasilla Alaska Report Appendix Page 30
Gibbs Planning Group Inc., Wasilla Alaska Report Appendix Page 30
Wasilla Population Map
Gibbs Planning Group Inc., Wasilla Alaska Report Appendix Page 31
Gibbs Planning Group Inc., Wasilla Alaska Report Appendix Page 31
Wasilla Household Map
Gibbs Planning Group Inc., Wasilla Alaska Report Appendix Page 32
Gibbs Planning Group Inc., Wasilla Alaska Report Appendix Page 32
Wasilla Household Income Map
R e t a i l , O f f i c e , a n d L o d g i n g M a r k e t A n a l y s i s
B - 3 1W a s i l l a C o m p r e h e n s i v e P l a n
TR
AD
E A
RE
A C
OM
PET
ITIO
N M
AP
RE
GIO
NA
L RE
TA
IL CE
NT
ER
S
Gibbs P
lanning Group, Inc., W
asilla Alaska R
eport Appendix
Page 33
Trade Area Competition Map, Regional Retail Centers
A p p e n d i x B
B - 3 2 W a s i l l a C o m p r e h e n s i v e P l a n
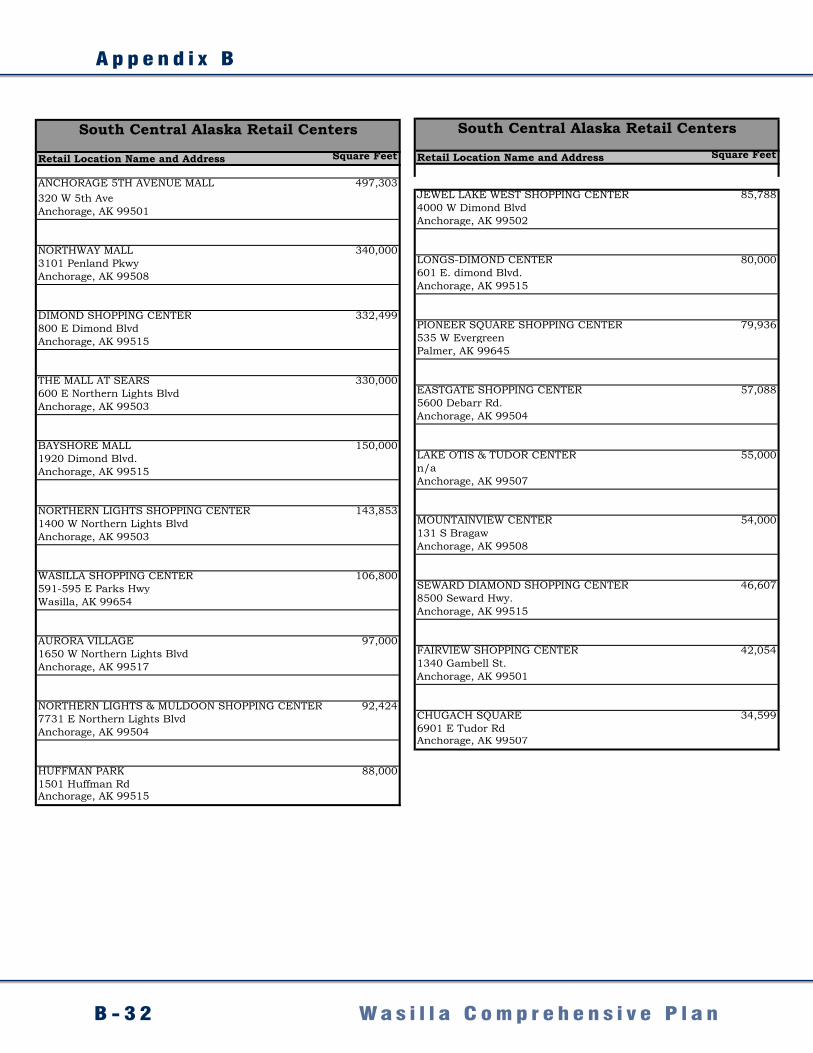
Retail Location Name and Address Square Feet
ANCHORAGE 5TH AVENUE MALL 497,303320 W 5th AveAnchorage, AK 99501
NORTHWAY MALL 340,0003101 Penland PkwyAnchorage, AK 99508
DIMOND SHOPPING CENTER 332,499800 E Dimond BlvdAnchorage, AK 99515
THE MALL AT SEARS 330,000600 E Northern Lights BlvdAnchorage, AK 99503
BAYSHORE MALL 150,0001920 Dimond Blvd.Anchorage, AK 99515
NORTHERN LIGHTS SHOPPING CENTER 143,8531400 W Northern Lights BlvdAnchorage, AK 99503
WASILLA SHOPPING CENTER 106,800591-595 E Parks HwyWasilla, AK 99654
AURORA VILLAGE 97,0001650 W Northern Lights BlvdAnchorage, AK 99517
NORTHERN LIGHTS & MULDOON SHOPPING CENTER 92,4247731 E Northern Lights BlvdAnchorage, AK 99504
HUFFMAN PARK 88,0001501 Huffman RdAnchorage, AK 99515
South Central Alaska Retail Centers
Gibbs Planning Group Inc., Wasilla Alaska Report Appendix Page 34
Retail Location Name and Address Square Feet
South Central Alaska Retail Centers
JEWEL LAKE WEST SHOPPING CENTER 85,7884000 W Dimond BlvdAnchorage, AK 99502
LONGS-DIMOND CENTER 80,000601 E. dimond Blvd.Anchorage, AK 99515
PIONEER SQUARE SHOPPING CENTER 79,936535 W EvergreenPalmer, AK 99645
EASTGATE SHOPPING CENTER 57,0885600 Debarr Rd.Anchorage, AK 99504
LAKE OTIS & TUDOR CENTER 55,000n/aAnchorage, AK 99507
MOUNTAINVIEW CENTER 54,000131 S BragawAnchorage, AK 99508
SEWARD DIAMOND SHOPPING CENTER 46,6078500 Seward Hwy.Anchorage, AK 99515
FAIRVIEW SHOPPING CENTER 42,0541340 Gambell St.Anchorage, AK 99501
CHUGACH SQUARE 34,5996901 E Tudor RdAnchorage, AK 99507
Gibbs Planning Group Inc., Wasilla Alaska Report Appendix Page 35
R e t a i l , O f f i c e , a n d L o d g i n g M a r k e t A n a l y s i s
B - 3 3W a s i l l a C o m p r e h e n s i v e P l a n
CO
MM
UN
ITY
RE
TA
IL CE
NT
ER
S
TR
AD
E A
RE
A C
OM
PET
ITIO
N M
AP
Gibbs P
lanning Group Inc., W
asilla Alaska R
eport Appendix
Page 36
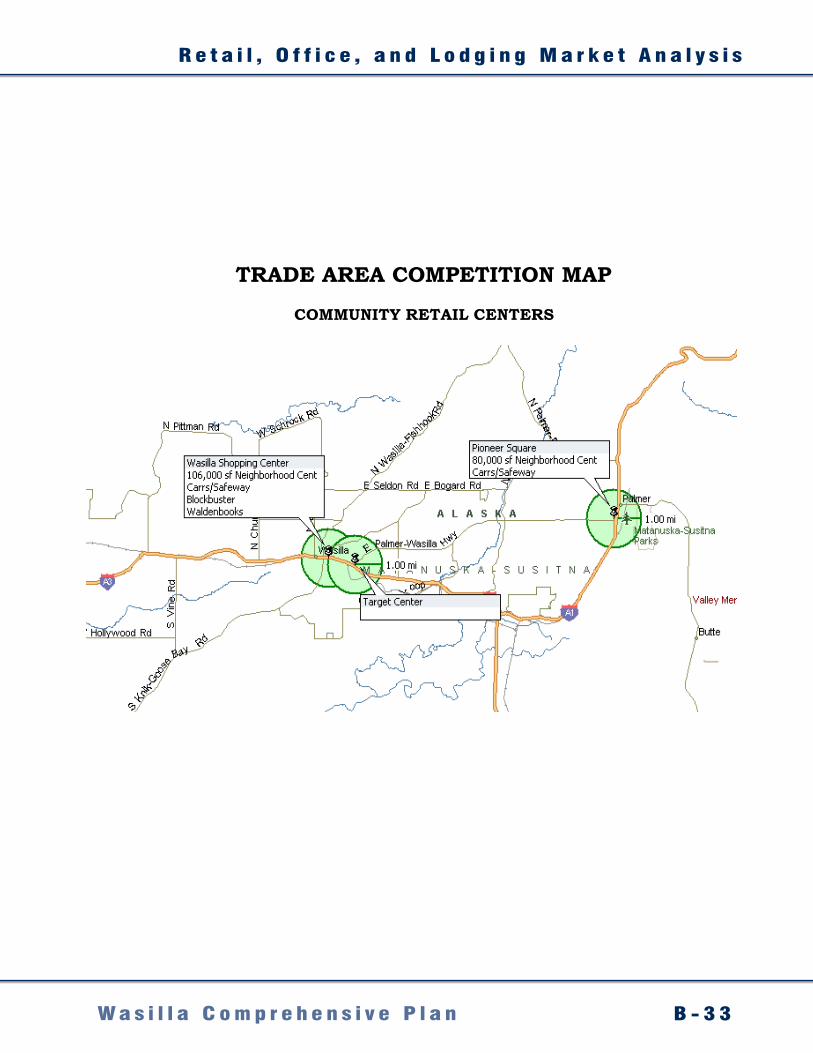
COMMUNITY RETAIL CENTERS
TRADE AREA COMPETITION MAP
Gibbs Planning Group Inc., Wasilla Alaska Report Appendix Page 36
A p p e n d i x B
B - 3 4 W a s i l l a C o m p r e h e n s i v e P l a n
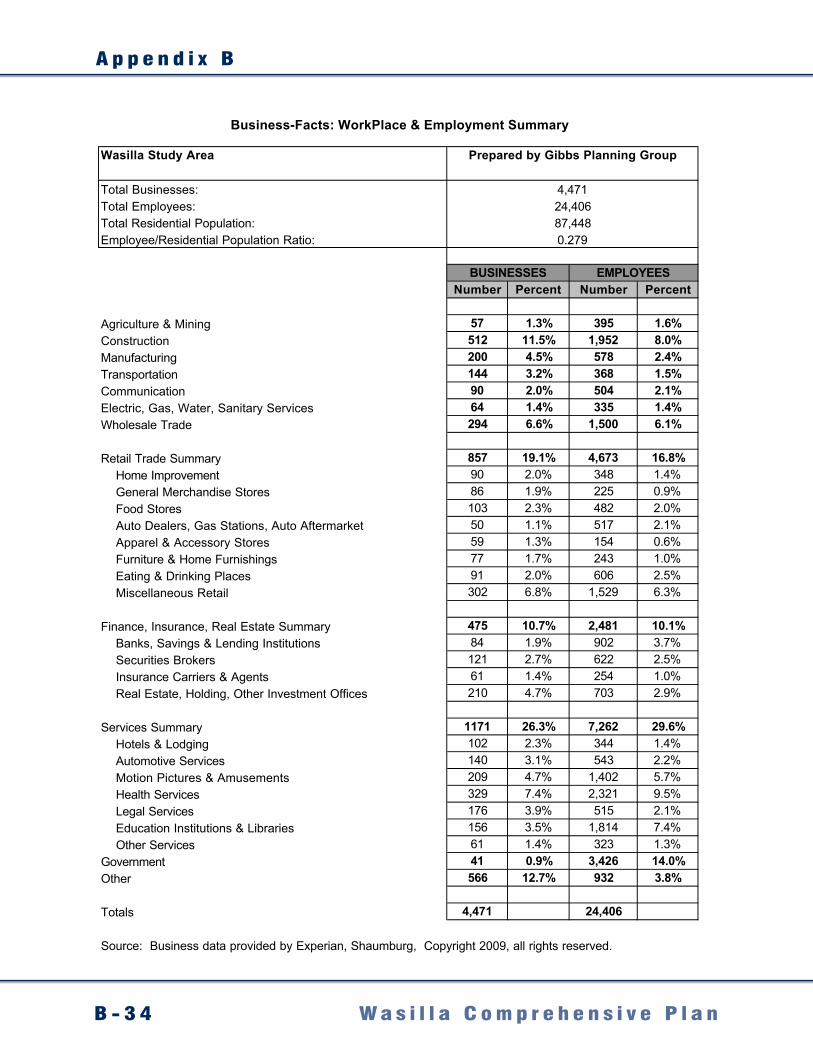
Wasilla Study Area
Total Businesses:Total Employees:Total Residential Population:Employee/Residential Population Ratio:
Number Percent Number Percent
Agriculture & Mining 57 1.3% 395 1.6%Construction 512 11.5% 1,952 8.0%Manufacturing 200 4.5% 578 2.4%Transportation 144 3.2% 368 1.5%Communication 90 2.0% 504 2.1%Electric, Gas, Water, Sanitary Services 64 1.4% 335 1.4%Wholesale Trade 294 6.6% 1,500 6.1%
Retail Trade Summary 857 19.1% 4,673 16.8% Home Improvement 90 2.0% 348 1.4% General Merchandise Stores 86 1.9% 225 0.9% Food Stores 103 2.3% 482 2.0% Auto Dealers, Gas Stations, Auto Aftermarket 50 1.1% 517 2.1% Apparel & Accessory Stores 59 1.3% 154 0.6% Furniture & Home Furnishings 77 1.7% 243 1.0% Eating & Drinking Places 91 2.0% 606 2.5% Miscellaneous Retail 302 6.8% 1,529 6.3%
Finance, Insurance, Real Estate Summary 475 10.7% 2,481 10.1% Banks, Savings & Lending Institutions 84 1.9% 902 3.7% Securities Brokers 121 2.7% 622 2.5% Insurance Carriers & Agents 61 1.4% 254 1.0% Real Estate, Holding, Other Investment Offices 210 4.7% 703 2.9%
Services Summary 1171 26.3% 7,262 29.6% Hotels & Lodging 102 2.3% 344 1.4% Automotive Services 140 3.1% 543 2.2% Motion Pictures & Amusements 209 4.7% 1,402 5.7% Health Services 329 7.4% 2,321 9.5% Legal Services 176 3.9% 515 2.1% Education Institutions & Libraries 156 3.5% 1,814 7.4% Other Services 61 1.4% 323 1.3%Government 41 0.9% 3,426 14.0%Other 566 12.7% 932 3.8%
Totals 4,471 24,406
Source: Business data provided by Experian, Shaumburg, Copyright 2009, all rights reserved.
Gibbs Planning Group Inc., Wasilla Alaska Report Appendix Page 37
Prepared by Gibbs Planning Group
Business-Facts: WorkPlace & Employment Summary
BUSINESSES EMPLOYEES
4,47124,40687,4480.279
R e t a i l , O f f i c e , a n d L o d g i n g M a r k e t A n a l y s i s
B - 3 5W a s i l l a C o m p r e h e n s i v e P l a n
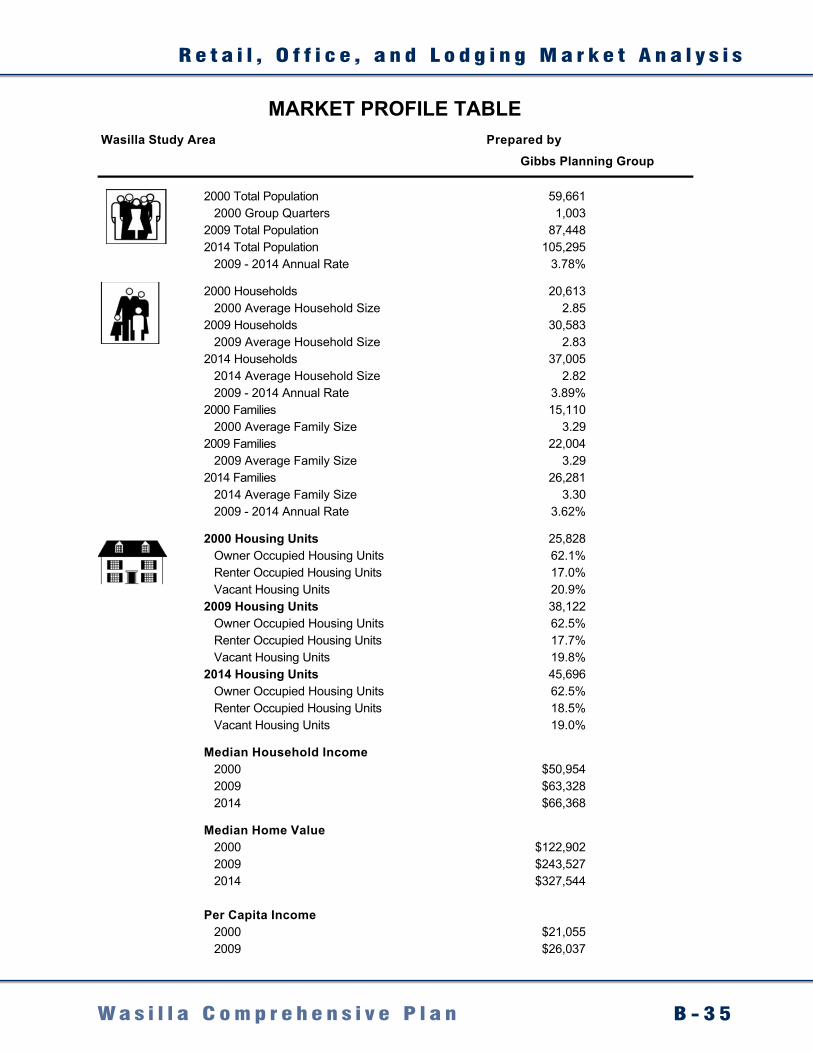
Prepared by
2000 Total Population 59,661 2000 Group Quarters 1,0032009 Total Population 87,4482014 Total Population 105,295 2009 - 2014 Annual Rate 3.78%
2000 Households 20,613 2000 Average Household Size 2.852009 Households 30,583 2009 Average Household Size 2.832014 Households 37,005 2014 Average Household Size 2.82 2009 - 2014 Annual Rate 3.89%2000 Families 15,110 2000 Average Family Size 3.292009 Families 22,004 2009 Average Family Size 3.292014 Families 26,281 2014 Average Family Size 3.30 2009 - 2014 Annual Rate 3.62%
2000 Housing Units 25,828 Owner Occupied Housing Units 62.1% Renter Occupied Housing Units 17.0% Vacant Housing Units 20.9%2009 Housing Units 38,122 Owner Occupied Housing Units 62.5% Renter Occupied Housing Units 17.7% Vacant Housing Units 19.8%2014 Housing Units 45,696 Owner Occupied Housing Units 62.5% Renter Occupied Housing Units 18.5% Vacant Housing Units 19.0%
Median Household Income 2000 $50,954 2009 $63,328 2014 $66,368
Median Home Value 2000 $122,902 2009 $243,527 2014 $327,544
Per Capita Income 2000 $21,055 2009 $26,037 2014 $27,126
Median Age 2000 33.8 2009 35.7 2014 35.8
Gibbs Planning Group Inc., Wasilla Alaska Report Appendix Page 38
MARKET PROFILE TABLE
Data Note: Persons in families include the householder and persons related to the householder by birth,marriage, or adoption. Per Capita Income represents the income received by all persons aged 15 years andover divided by total population.
Source: U.S. Bureau of the Census, 2000 Census of Population and Housing.
Wasilla Study Area
Gibbs Planning Group
A p p e n d i x B
B - 3 6 W a s i l l a C o m p r e h e n s i v e P l a n
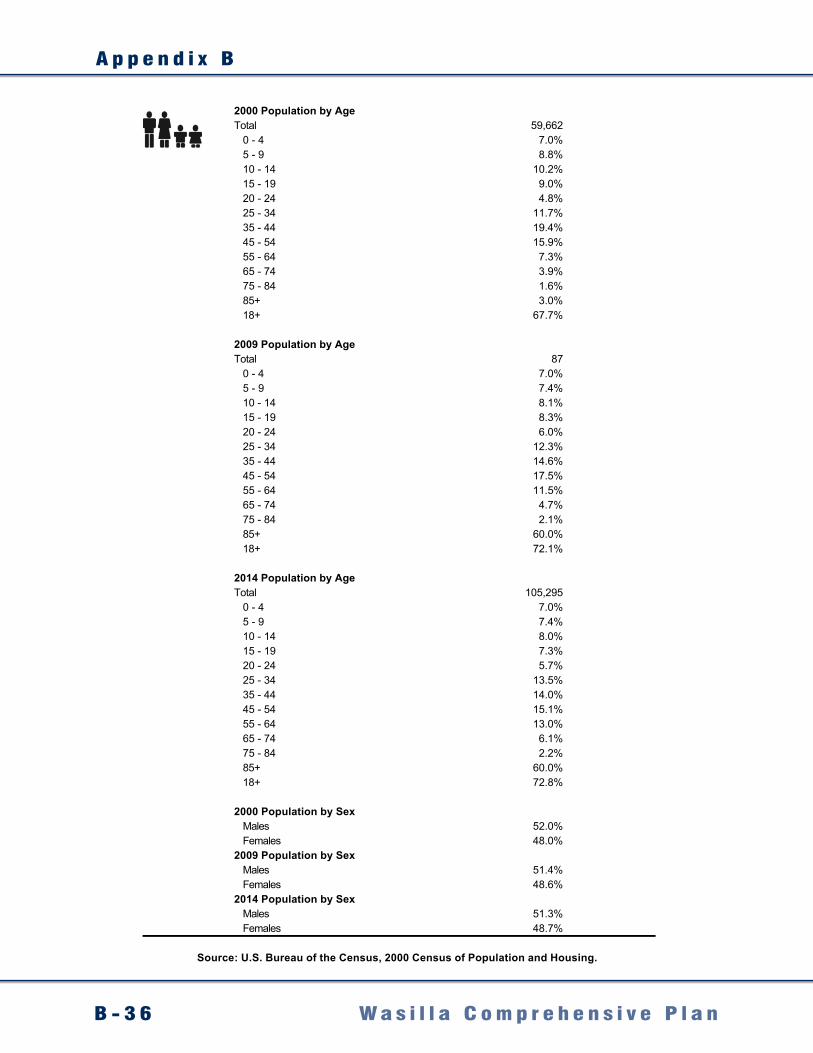
2000 Population by AgeTotal 59,662 0 - 4 7.0% 5 - 9 8.8% 10 - 14 10.2% 15 - 19 9.0% 20 - 24 4.8% 25 - 34 11.7% 35 - 44 19.4% 45 - 54 15.9% 55 - 64 7.3% 65 - 74 3.9% 75 - 84 1.6% 85+ 3.0% 18+ 67.7%
2009 Population by AgeTotal 87 0 - 4 7.0% 5 - 9 7.4% 10 - 14 8.1% 15 - 19 8.3% 20 - 24 6.0% 25 - 34 12.3% 35 - 44 14.6% 45 - 54 17.5% 55 - 64 11.5% 65 - 74 4.7% 75 - 84 2.1% 85+ 60.0% 18+ 72.1%
2014 Population by AgeTotal 105,295 0 - 4 7.0% 5 - 9 7.4% 10 - 14 8.0% 15 - 19 7.3% 20 - 24 5.7% 25 - 34 13.5% 35 - 44 14.0% 45 - 54 15.1% 55 - 64 13.0% 65 - 74 6.1% 75 - 84 2.2% 85+ 60.0% 18+ 72.8%
2000 Population by Sex Males 52.0% Females 48.0%2009 Population by Sex Males 51.4% Females 48.6%2014 Population by Sex Males 51.3% Females 48.7%
Gibbs Planning Group Inc., Wasilla Alaska Report Appendix Page 40
Source: U.S. Bureau of the Census, 2000 Census of Population and Housing.
R e t a i l , O f f i c e , a n d L o d g i n g M a r k e t A n a l y s i s
B - 3 7W a s i l l a C o m p r e h e n s i v e P l a n
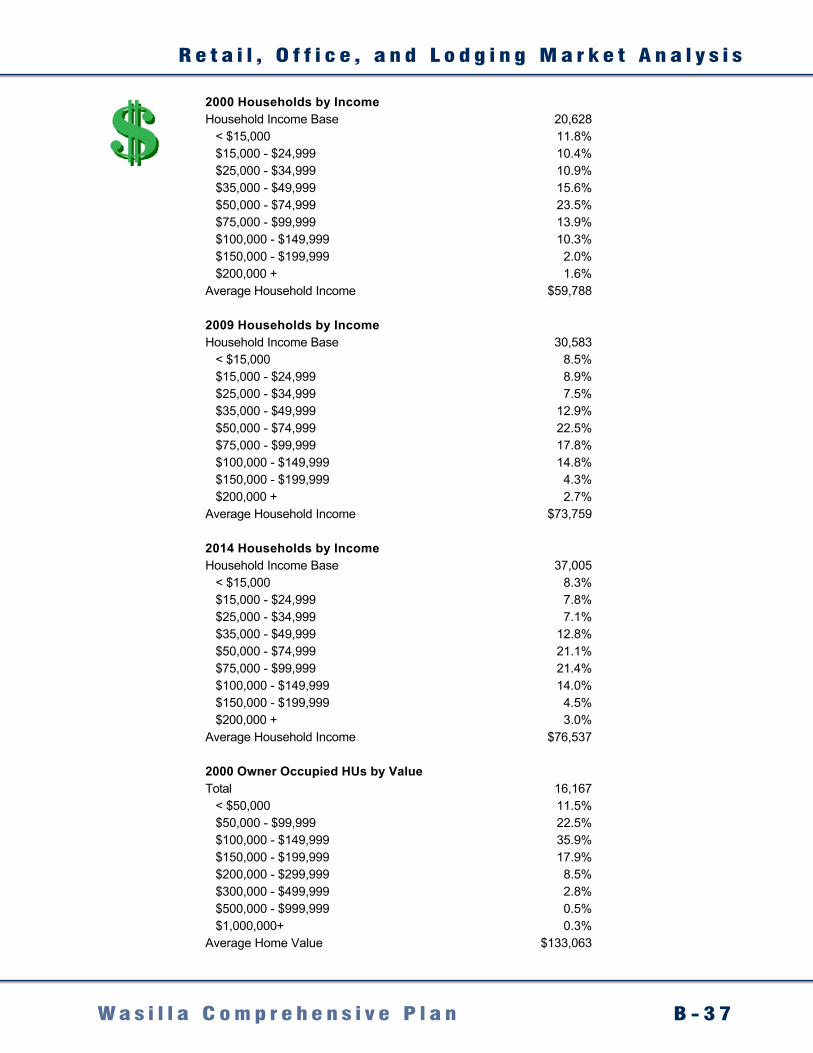
2000 Households by IncomeHousehold Income Base 20,628 < $15,000 11.8% $15,000 - $24,999 10.4% $25,000 - $34,999 10.9% $35,000 - $49,999 15.6% $50,000 - $74,999 23.5% $75,000 - $99,999 13.9% $100,000 - $149,999 10.3% $150,000 - $199,999 2.0% $200,000 + 1.6%Average Household Income $59,788
2009 Households by IncomeHousehold Income Base 30,583 < $15,000 8.5% $15,000 - $24,999 8.9% $25,000 - $34,999 7.5% $35,000 - $49,999 12.9% $50,000 - $74,999 22.5% $75,000 - $99,999 17.8% $100,000 - $149,999 14.8% $150,000 - $199,999 4.3% $200,000 + 2.7%Average Household Income $73,759
2014 Households by IncomeHousehold Income Base 37,005 < $15,000 8.3% $15,000 - $24,999 7.8% $25,000 - $34,999 7.1% $35,000 - $49,999 12.8% $50,000 - $74,999 21.1% $75,000 - $99,999 21.4% $100,000 - $149,999 14.0% $150,000 - $199,999 4.5% $200,000 + 3.0%Average Household Income $76,537
2000 Owner Occupied HUs by ValueTotal 16,167 < $50,000 11.5% $50,000 - $99,999 22.5% $100,000 - $149,999 35.9% $150,000 - $199,999 17.9% $200,000 - $299,999 8.5% $300,000 - $499,999 2.8% $500,000 - $999,999 0.5% $1,000,000+ 0.3%Average Home Value $133,063
2000 Specified Renter Occupied HUs by Contract RentTotal 4,286 With Cash Rent 89.9% No Cash Rent 10.1%Median Rent $632Average Rent $618
Gibbs Planning Group Inc., Wasilla Alaska Report Appendix Page 39
Data Note: Income represents the preceding year, expressed in current dollars. Household income includes wage and salary earnings, interest, dividends, net rents, pensions, SSI and welfare payments, child support and alimony.
Source: U.S. Bureau of the Census, 2000 Census of Population and Housing.
A p p e n d i x B
B - 3 8 W a s i l l a C o m p r e h e n s i v e P l a n
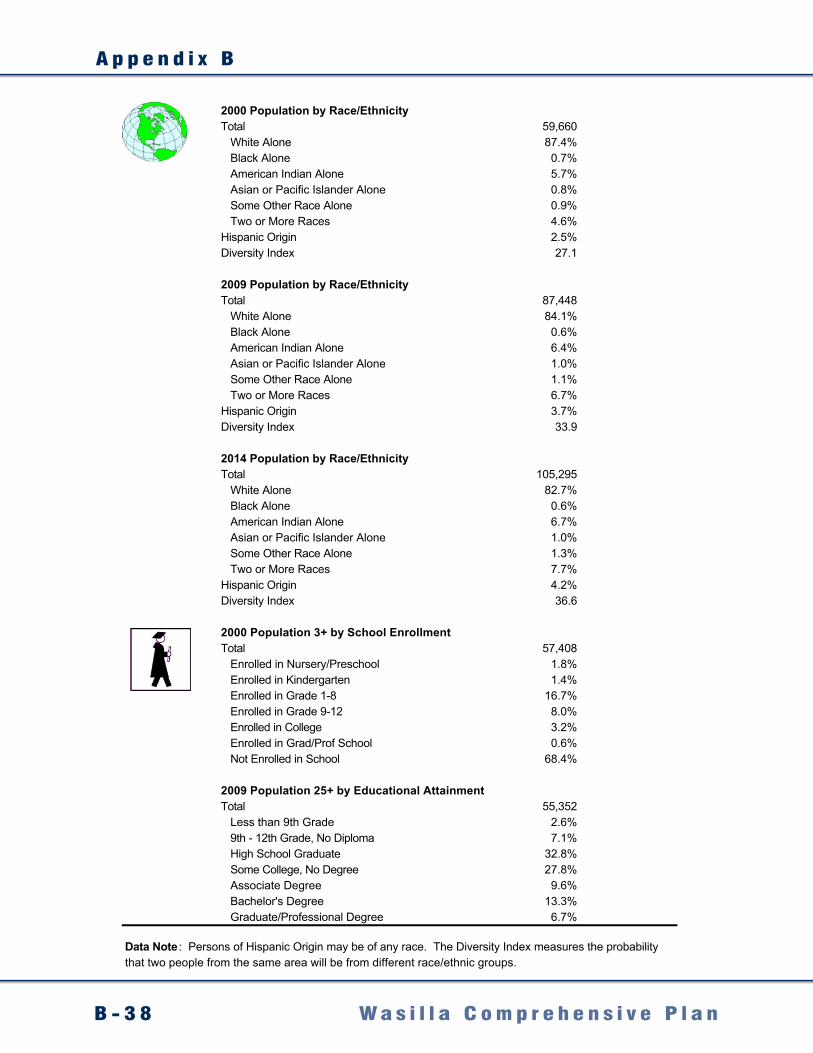
2000 Population by Race/EthnicityTotal 59,660 White Alone 87.4% Black Alone 0.7% American Indian Alone 5.7% Asian or Pacific Islander Alone 0.8% Some Other Race Alone 0.9% Two or More Races 4.6%Hispanic Origin 2.5%Diversity Index 27.1
2009 Population by Race/EthnicityTotal 87,448 White Alone 84.1% Black Alone 0.6% American Indian Alone 6.4% Asian or Pacific Islander Alone 1.0% Some Other Race Alone 1.1% Two or More Races 6.7%Hispanic Origin 3.7%Diversity Index 33.9
2014 Population by Race/EthnicityTotal 105,295 White Alone 82.7% Black Alone 0.6% American Indian Alone 6.7% Asian or Pacific Islander Alone 1.0% Some Other Race Alone 1.3% Two or More Races 7.7%Hispanic Origin 4.2%Diversity Index 36.6
2000 Population 3+ by School EnrollmentTotal 57,408 Enrolled in Nursery/Preschool 1.8% Enrolled in Kindergarten 1.4% Enrolled in Grade 1-8 16.7% Enrolled in Grade 9-12 8.0% Enrolled in College 3.2% Enrolled in Grad/Prof School 0.6% Not Enrolled in School 68.4%
2009 Population 25+ by Educational AttainmentTotal 55,352 Less than 9th Grade 2.6% 9th - 12th Grade, No Diploma 7.1% High School Graduate 32.8% Some College, No Degree 27.8% Associate Degree 9.6% Bachelor's Degree 13.3% Graduate/Professional Degree 6.7%
Gibbs Planning Group Inc., Wasilla Alaska Report Appendix Page 41
Data Note : Persons of Hispanic Origin may be of any race. The Diversity Index measures the probability that two people from the same area will be from different race/ethnic groups.
Source: U.S. Bureau of the Census, 2000 Census of Population and Housing.
R e t a i l , O f f i c e , a n d L o d g i n g M a r k e t A n a l y s i s
B - 3 9W a s i l l a C o m p r e h e n s i v e P l a n
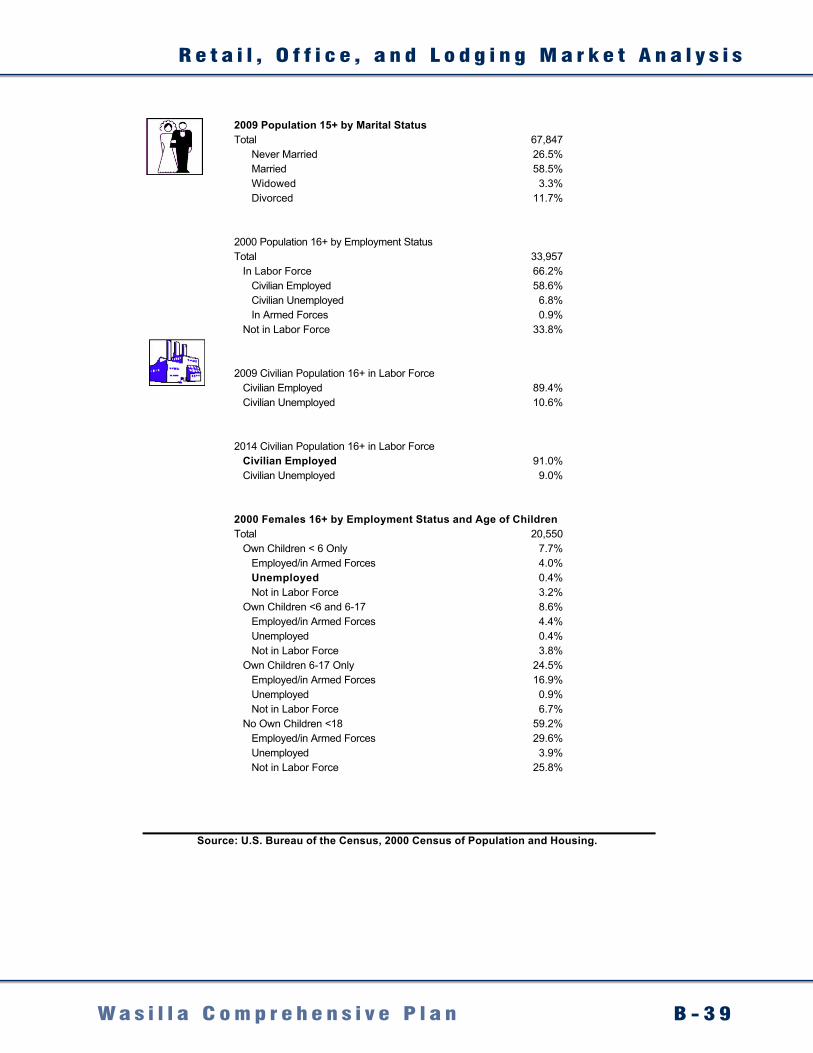
2009 Population 15+ by Marital StatusTotal 67,847 Never Married 26.5% Married 58.5% Widowed 3.3% Divorced 11.7%
2000 Population 16+ by Employment StatusTotal 33,957 In Labor Force 66.2% Civilian Employed 58.6% Civilian Unemployed 6.8% In Armed Forces 0.9% Not in Labor Force 33.8%
2009 Civilian Population 16+ in Labor Force Civilian Employed 89.4% Civilian Unemployed 10.6%
2014 Civilian Population 16+ in Labor Force Civilian Employed 91.0% Civilian Unemployed 9.0%
2000 Females 16+ by Employment Status and Age of ChildrenTotal 20,550 Own Children < 6 Only 7.7% Employed/in Armed Forces 4.0% Unemployed 0.4% Not in Labor Force 3.2% Own Children <6 and 6-17 8.6% Employed/in Armed Forces 4.4% Unemployed 0.4% Not in Labor Force 3.8% Own Children 6-17 Only 24.5% Employed/in Armed Forces 16.9% Unemployed 0.9% Not in Labor Force 6.7% No Own Children <18 59.2% Employed/in Armed Forces 29.6% Unemployed 3.9% Not in Labor Force 25.8%
Gibbs Planning Group Inc., Wasilla Alaska Report Appendix Page 42
Source: U.S. Bureau of the Census, 2000 Census of Population and Housing.
A p p e n d i x B
B - 4 0 W a s i l l a C o m p r e h e n s i v e P l a n
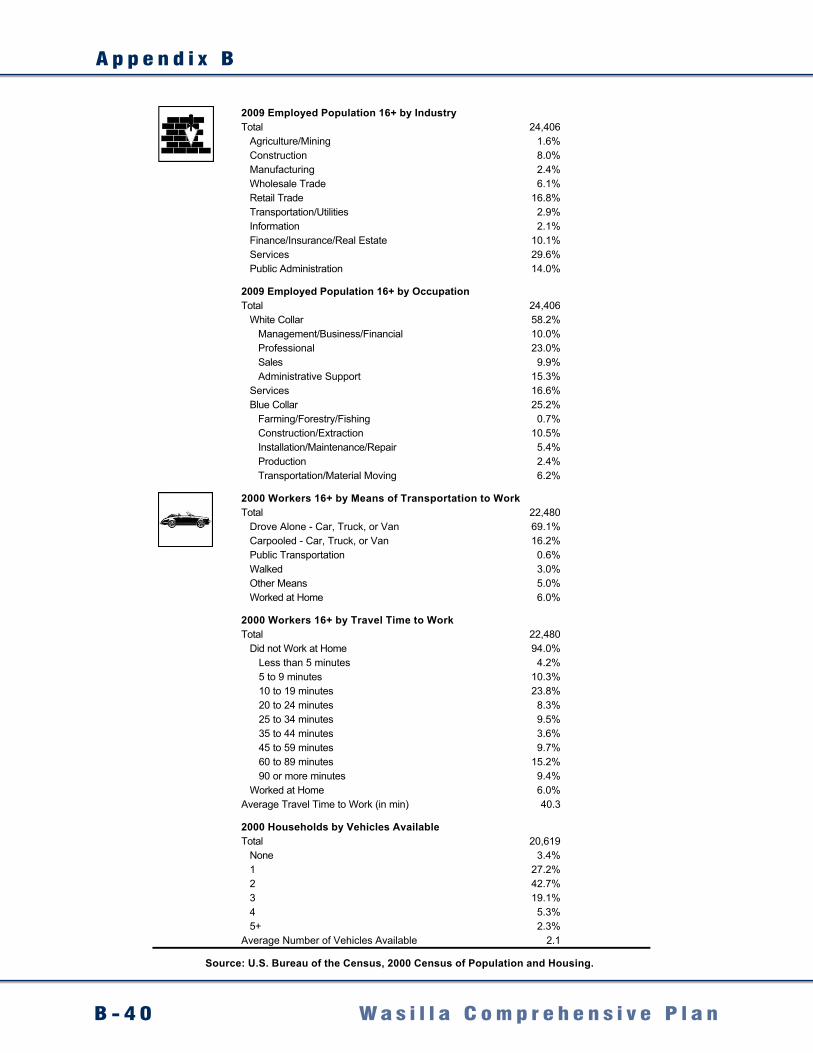
2009 Employed Population 16+ by IndustryTotal 24,406 Agriculture/Mining 1.6% Construction 8.0% Manufacturing 2.4% Wholesale Trade 6.1% Retail Trade 16.8% Transportation/Utilities 2.9% Information 2.1% Finance/Insurance/Real Estate 10.1% Services 29.6% Public Administration 14.0%
2009 Employed Population 16+ by OccupationTotal 24,406 White Collar 58.2% Management/Business/Financial 10.0% Professional 23.0% Sales 9.9% Administrative Support 15.3% Services 16.6% Blue Collar 25.2% Farming/Forestry/Fishing 0.7% Construction/Extraction 10.5% Installation/Maintenance/Repair 5.4% Production 2.4% Transportation/Material Moving 6.2%
2000 Workers 16+ by Means of Transportation to WorkTotal 22,480 Drove Alone - Car, Truck, or Van 69.1% Carpooled - Car, Truck, or Van 16.2% Public Transportation 0.6% Walked 3.0% Other Means 5.0% Worked at Home 6.0%
2000 Workers 16+ by Travel Time to WorkTotal 22,480 Did not Work at Home 94.0% Less than 5 minutes 4.2% 5 to 9 minutes 10.3% 10 to 19 minutes 23.8% 20 to 24 minutes 8.3% 25 to 34 minutes 9.5% 35 to 44 minutes 3.6% 45 to 59 minutes 9.7% 60 to 89 minutes 15.2% 90 or more minutes 9.4% Worked at Home 6.0%Average Travel Time to Work (in min) 40.3
2000 Households by Vehicles AvailableTotal 20,619 None 3.4% 1 27.2% 2 42.7% 3 19.1% 4 5.3% 5+ 2.3%Average Number of Vehicles Available 2.1
Gibbs Planning Group Inc., Wasilla Alaska Report Appendix Page 43
Source: U.S. Bureau of the Census, 2000 Census of Population and Housing.
R e t a i l , O f f i c e , a n d L o d g i n g M a r k e t A n a l y s i s
B - 4 1W a s i l l a C o m p r e h e n s i v e P l a n
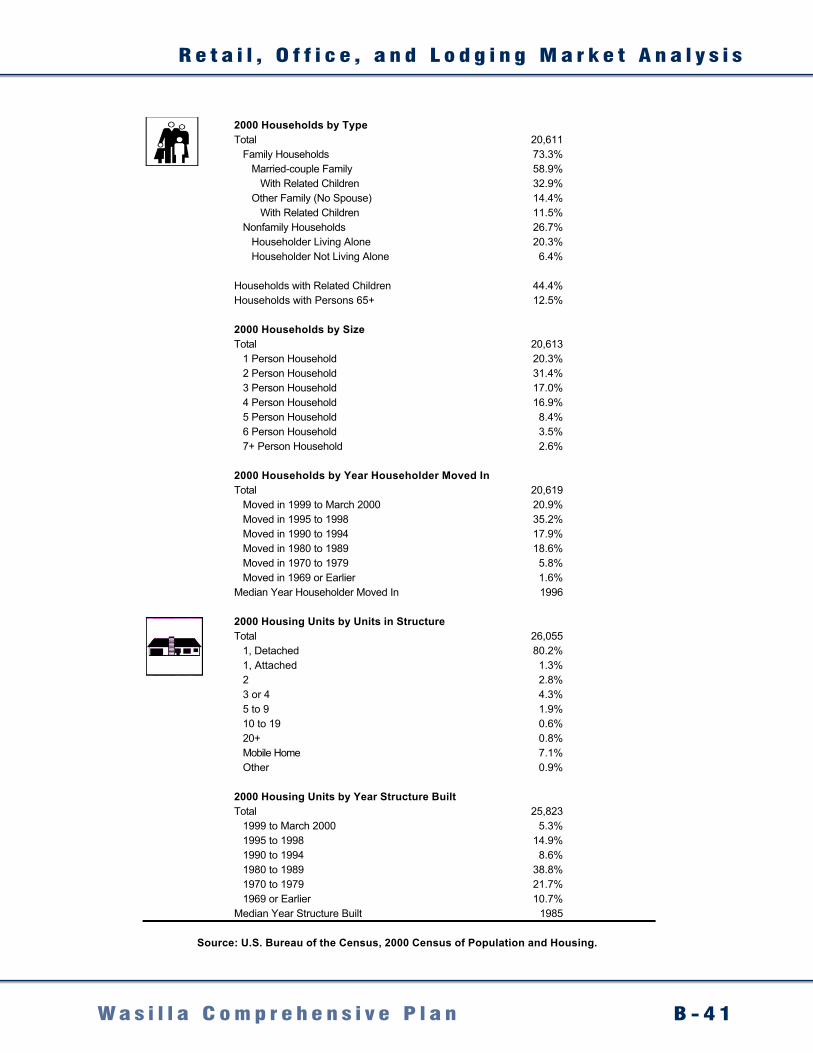
2000 Households by TypeTotal 20,611 Family Households 73.3% Married-couple Family 58.9% With Related Children 32.9% Other Family (No Spouse) 14.4% With Related Children 11.5% Nonfamily Households 26.7% Householder Living Alone 20.3% Householder Not Living Alone 6.4%
Households with Related Children 44.4%Households with Persons 65+ 12.5%
2000 Households by SizeTotal 20,613 1 Person Household 20.3% 2 Person Household 31.4% 3 Person Household 17.0% 4 Person Household 16.9% 5 Person Household 8.4% 6 Person Household 3.5% 7+ Person Household 2.6%
2000 Households by Year Householder Moved InTotal 20,619 Moved in 1999 to March 2000 20.9% Moved in 1995 to 1998 35.2% Moved in 1990 to 1994 17.9% Moved in 1980 to 1989 18.6% Moved in 1970 to 1979 5.8% Moved in 1969 or Earlier 1.6%Median Year Householder Moved In 1996
2000 Housing Units by Units in StructureTotal 26,055 1, Detached 80.2% 1, Attached 1.3% 2 2.8% 3 or 4 4.3% 5 to 9 1.9% 10 to 19 0.6% 20+ 0.8% Mobile Home 7.1% Other 0.9%
2000 Housing Units by Year Structure BuiltTotal 25,823 1999 to March 2000 5.3% 1995 to 1998 14.9% 1990 to 1994 8.6% 1980 to 1989 38.8% 1970 to 1979 21.7% 1969 or Earlier 10.7%Median Year Structure Built 1985
Gibbs Planning Group Inc., Wasilla Alaska Report Appendix Page 44
Source: U.S. Bureau of the Census, 2000 Census of Population and Housing.
A p p e n d i x B
B - 4 2 W a s i l l a C o m p r e h e n s i v e P l a n
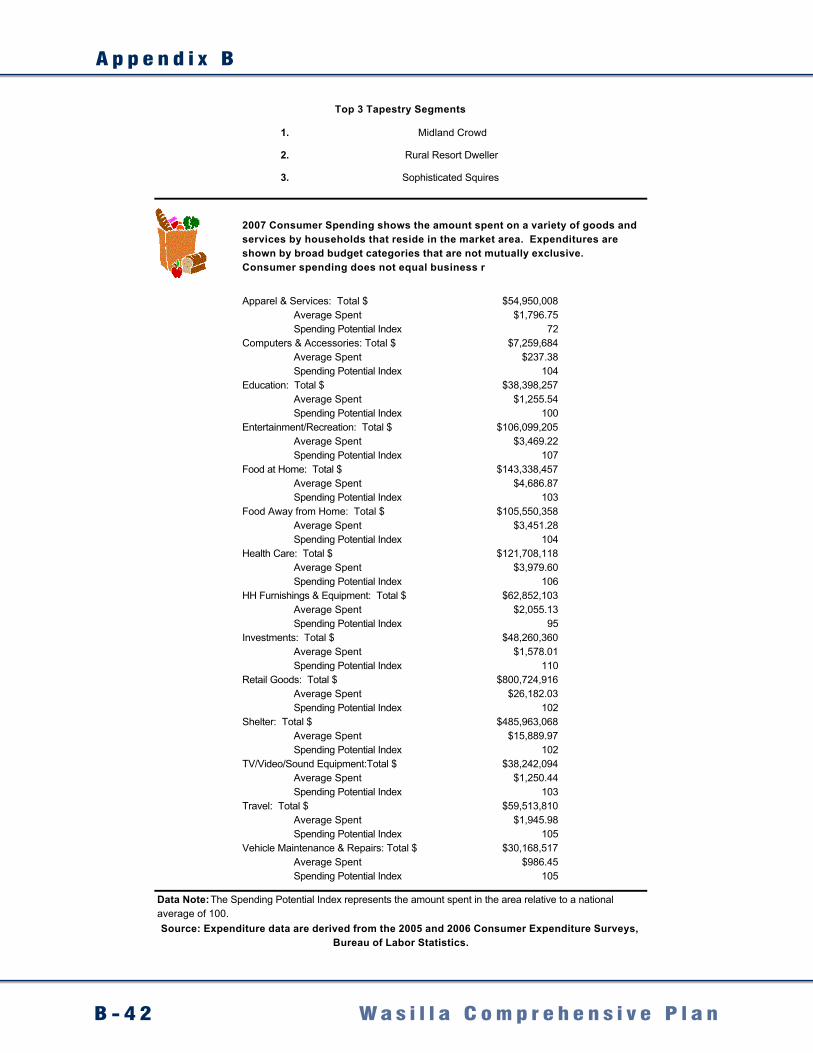
1.
2.
3.
Apparel & Services: Total $ $54,950,008Average Spent $1,796.75Spending Potential Index 72
Computers & Accessories: Total $ $7,259,684Average Spent $237.38Spending Potential Index 104
Education: Total $ $38,398,257Average Spent $1,255.54Spending Potential Index 100
Entertainment/Recreation: Total $ $106,099,205Average Spent $3,469.22Spending Potential Index 107
Food at Home: Total $ $143,338,457Average Spent $4,686.87Spending Potential Index 103
Food Away from Home: Total $ $105,550,358Average Spent $3,451.28Spending Potential Index 104
Health Care: Total $ $121,708,118Average Spent $3,979.60Spending Potential Index 106
HH Furnishings & Equipment: Total $ $62,852,103Average Spent $2,055.13Spending Potential Index 95
Investments: Total $ $48,260,360Average Spent $1,578.01Spending Potential Index 110
Retail Goods: Total $ $800,724,916Average Spent $26,182.03Spending Potential Index 102
Shelter: Total $ $485,963,068Average Spent $15,889.97Spending Potential Index 102
TV/Video/Sound Equipment:Total $ $38,242,094Average Spent $1,250.44Spending Potential Index 103
Travel: Total $ $59,513,810Average Spent $1,945.98Spending Potential Index 105
Vehicle Maintenance & Repairs: Total $ $30,168,517Average Spent $986.45Spending Potential Index 105
Gibbs Planning Group Inc., Wasilla Alaska Report Appendix Page 45
Source: Expenditure data are derived from the 2005 and 2006 Consumer Expenditure Surveys, Bureau of Labor Statistics.
Top 3 Tapestry Segments
2007 Consumer Spending shows the amount spent on a variety of goods and services by households that reside in the market area. Expenditures are shown by broad budget categories that are not mutually exclusive.Consumer spending does not equal business r
Data Note: The Spending Potential Index represents the amount spent in the area relative to a national average of 100.
Sophisticated Squires
Midland Crowd
Rural Resort Dweller
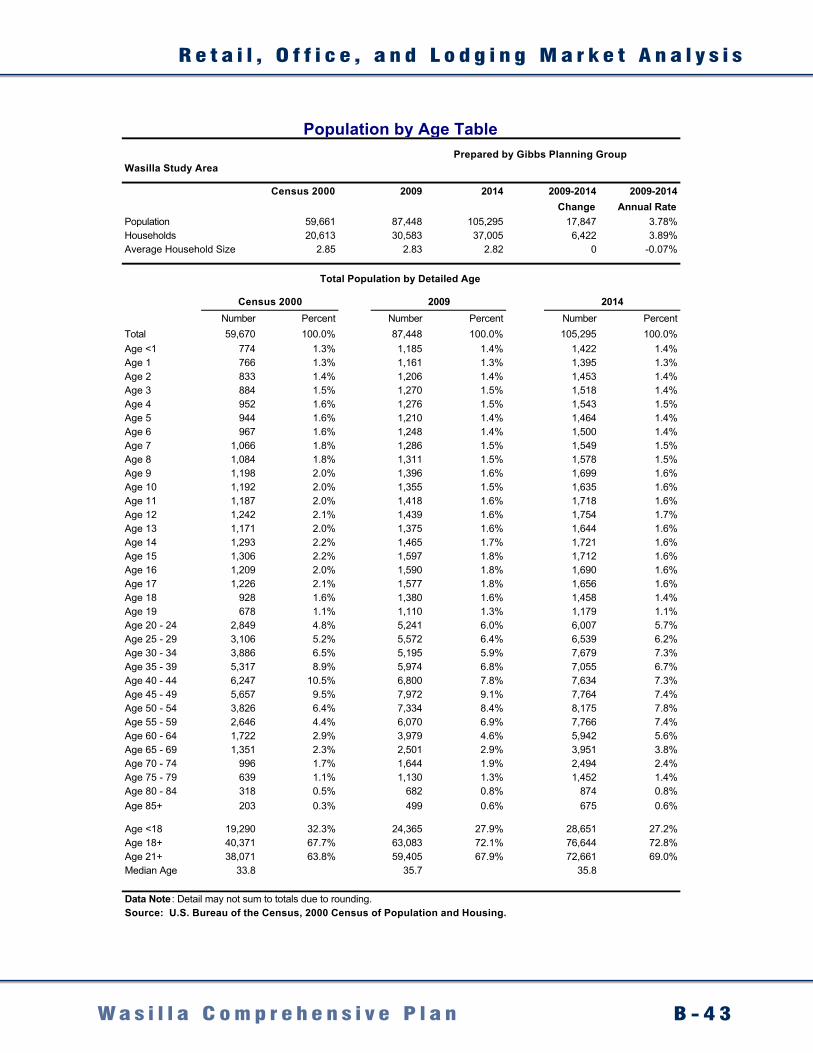
R e t a i l , O f f i c e , a n d L o d g i n g M a r k e t A n a l y s i s
B - 4 3W a s i l l a C o m p r e h e n s i v e P l a n
Prepared by Gibbs Planning GroupWasilla Study Area
Census 2000 2009 2014 2009-2014 2009-2014Change Annual Rate
Population 59,661 87,448 105,295 17,847 3.78%Households 20,613 30,583 37,005 6,422 3.89%Average Household Size 2.85 2.83 2.82 0 -0.07%
Number Percent Number Percent Number PercentTotal 59,670 100.0% 87,448 100.0% 105,295 100.0%Age <1 774 1.3% 1,185 1.4% 1,422 1.4%Age 1 766 1.3% 1,161 1.3% 1,395 1.3%Age 2 833 1.4% 1,206 1.4% 1,453 1.4%Age 3 884 1.5% 1,270 1.5% 1,518 1.4%Age 4 952 1.6% 1,276 1.5% 1,543 1.5%Age 5 944 1.6% 1,210 1.4% 1,464 1.4%Age 6 967 1.6% 1,248 1.4% 1,500 1.4%Age 7 1,066 1.8% 1,286 1.5% 1,549 1.5%Age 8 1,084 1.8% 1,311 1.5% 1,578 1.5%Age 9 1,198 2.0% 1,396 1.6% 1,699 1.6%Age 10 1,192 2.0% 1,355 1.5% 1,635 1.6%Age 11 1,187 2.0% 1,418 1.6% 1,718 1.6%Age 12 1,242 2.1% 1,439 1.6% 1,754 1.7%Age 13 1,171 2.0% 1,375 1.6% 1,644 1.6%Age 14 1,293 2.2% 1,465 1.7% 1,721 1.6%Age 15 1,306 2.2% 1,597 1.8% 1,712 1.6%Age 16 1,209 2.0% 1,590 1.8% 1,690 1.6%Age 17 1,226 2.1% 1,577 1.8% 1,656 1.6%Age 18 928 1.6% 1,380 1.6% 1,458 1.4%Age 19 678 1.1% 1,110 1.3% 1,179 1.1%Age 20 - 24 2,849 4.8% 5,241 6.0% 6,007 5.7%Age 25 - 29 3,106 5.2% 5,572 6.4% 6,539 6.2%Age 30 - 34 3,886 6.5% 5,195 5.9% 7,679 7.3%Age 35 - 39 5,317 8.9% 5,974 6.8% 7,055 6.7%Age 40 - 44 6,247 10.5% 6,800 7.8% 7,634 7.3%Age 45 - 49 5,657 9.5% 7,972 9.1% 7,764 7.4%Age 50 - 54 3,826 6.4% 7,334 8.4% 8,175 7.8%Age 55 - 59 2,646 4.4% 6,070 6.9% 7,766 7.4%Age 60 - 64 1,722 2.9% 3,979 4.6% 5,942 5.6%Age 65 - 69 1,351 2.3% 2,501 2.9% 3,951 3.8%Age 70 - 74 996 1.7% 1,644 1.9% 2,494 2.4%Age 75 - 79 639 1.1% 1,130 1.3% 1,452 1.4%Age 80 - 84 318 0.5% 682 0.8% 874 0.8%Age 85+ 203 0.3% 499 0.6% 675 0.6%
Age <18 19,290 32.3% 24,365 27.9% 28,651 27.2%Age 18+ 40,371 67.7% 63,083 72.1% 76,644 72.8%Age 21+ 38,071 63.8% 59,405 67.9% 72,661 69.0%Median Age 33.8 35.7 35.8
Data Note : Detail may not sum to totals due to rounding.Source: U.S. Bureau of the Census, 2000 Census of Population and Housing.
Census 2000 2009 2014
Population by Age Table
Total Population by Detailed Age
Gibbs Planning Group Inc., Wasilla Alaska Report Appendix Page 46
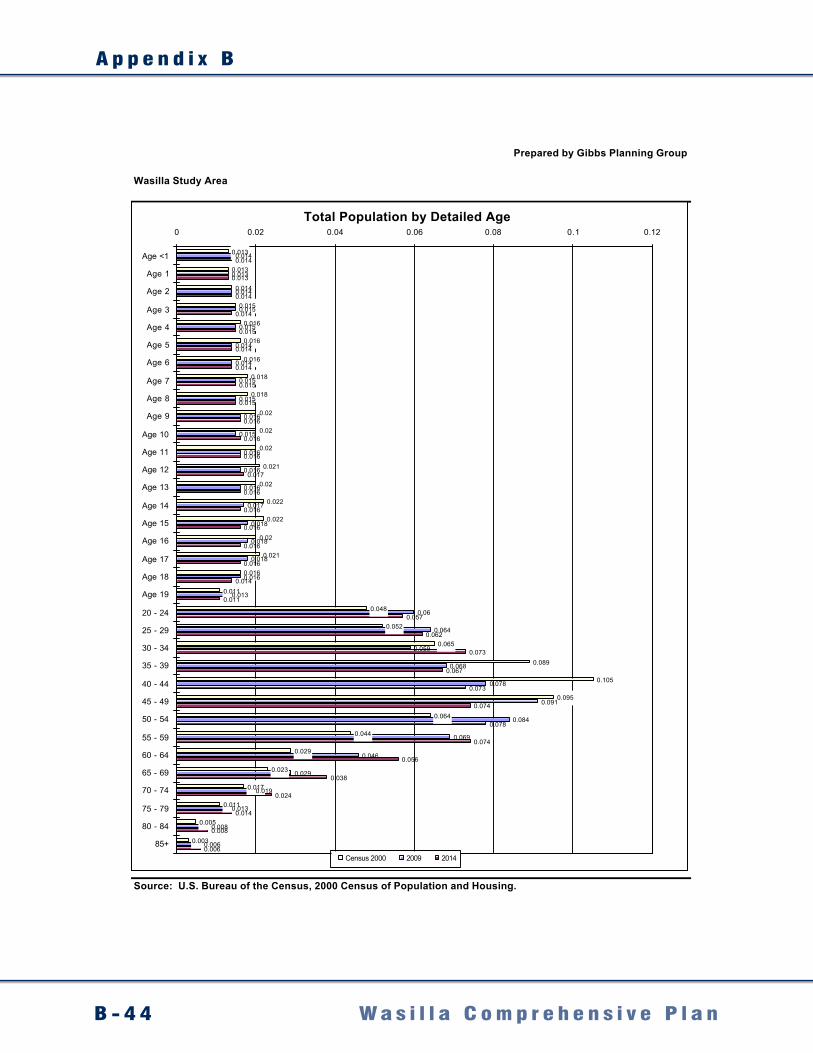
A p p e n d i x B
B - 4 4 W a s i l l a C o m p r e h e n s i v e P l a n
Prepared by Gibbs Planning Group
Wasilla Study Area
Source: U.S. Bureau of the Census, 2000 Census of Population and Housing.
Total Population by Detailed Age
0.013
0.013
0.014
0.015
0.016
0.016
0.016
0.018
0.018
0.02
0.02
0.02
0.021
0.02
0.022
0.022
0.02
0.021
0.016
0.011
0.048
0.052
0.065
0.089
0.105
0.095
0.064
0.044
0.029
0.023
0.017
0.011
0.005
0.003
0.014
0.013
0.014
0.015
0.015
0.014
0.014
0.015
0.015
0.016
0.015
0.016
0.016
0.016
0.017
0.018
0.018
0.018
0.016
0.013
0.06
0.064
0.059
0.068
0.078
0.091
0.084
0.069
0.046
0.029
0.019
0.013
0.008
0.006
0.014
0.013
0.014
0.014
0.015
0.014
0.014
0.015
0.015
0.016
0.016
0.016
0.017
0.016
0.016
0.016
0.016
0.016
0.014
0.011
0.057
0.062
0.073
0.067
0.073
0.074
0.078
0.074
0.056
0.038
0.024
0.014
0.008
0.006
0 0.02 0.04 0.06 0.08 0.1 0.12
Age <1
Age 1
Age 2
Age 3
Age 4
Age 5
Age 6
Age 7
Age 8
Age 9
Age 10
Age 11
Age 12
Age 13
Age 14
Age 15
Age 16
Age 17
Age 18
Age 19
20 - 24
25 - 29
30 - 34
35 - 39
40 - 44
45 - 49
50 - 54
55 - 59
60 - 64
65 - 69
70 - 74
75 - 79
80 - 84
85+
Census 2000 2009 2014
Gibbs Planning Group Inc., Wasilla Alaska Report Appendix Page 47
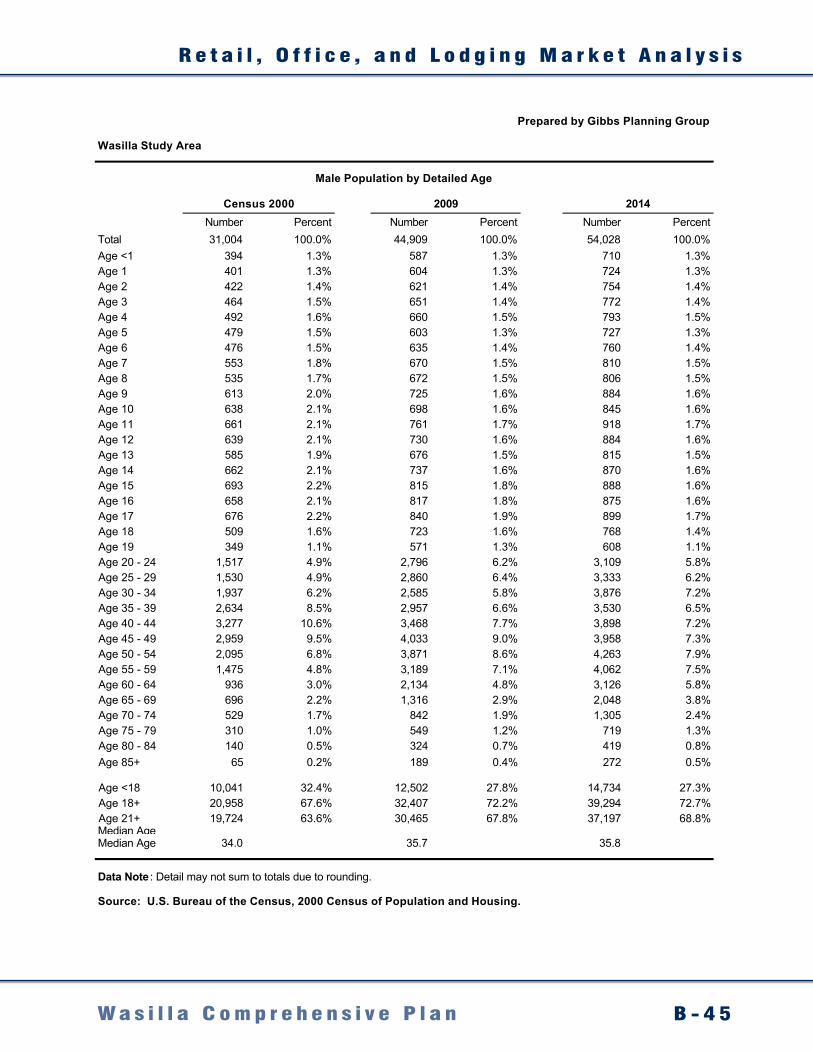
R e t a i l , O f f i c e , a n d L o d g i n g M a r k e t A n a l y s i s
B - 4 5W a s i l l a C o m p r e h e n s i v e P l a n
Prepared by Gibbs Planning Group
Wasilla Study Area
Number Percent Number Percent Number PercentTotal 31,004 100.0% 44,909 100.0% 54,028 100.0%Age <1 394 1.3% 587 1.3% 710 1.3%Age 1 401 1.3% 604 1.3% 724 1.3%Age 2 422 1.4% 621 1.4% 754 1.4%Age 3 464 1.5% 651 1.4% 772 1.4%Age 4 492 1.6% 660 1.5% 793 1.5%Age 5 479 1.5% 603 1.3% 727 1.3%Age 6 476 1.5% 635 1.4% 760 1.4%Age 7 553 1.8% 670 1.5% 810 1.5%Age 8 535 1.7% 672 1.5% 806 1.5%Age 9 613 2.0% 725 1.6% 884 1.6%Age 10 638 2.1% 698 1.6% 845 1.6%Age 11 661 2.1% 761 1.7% 918 1.7%Age 12 639 2.1% 730 1.6% 884 1.6%Age 13 585 1.9% 676 1.5% 815 1.5%Age 14 662 2.1% 737 1.6% 870 1.6%Age 15 693 2.2% 815 1.8% 888 1.6%Age 16 658 2.1% 817 1.8% 875 1.6%Age 17 676 2.2% 840 1.9% 899 1.7%Age 18 509 1.6% 723 1.6% 768 1.4%Age 19 349 1.1% 571 1.3% 608 1.1%Age 20 - 24 1,517 4.9% 2,796 6.2% 3,109 5.8%Age 25 - 29 1,530 4.9% 2,860 6.4% 3,333 6.2%Age 30 - 34 1,937 6.2% 2,585 5.8% 3,876 7.2%Age 35 - 39 2,634 8.5% 2,957 6.6% 3,530 6.5%Age 40 - 44 3,277 10.6% 3,468 7.7% 3,898 7.2%Age 45 - 49 2,959 9.5% 4,033 9.0% 3,958 7.3%Age 50 - 54 2,095 6.8% 3,871 8.6% 4,263 7.9%Age 55 - 59 1,475 4.8% 3,189 7.1% 4,062 7.5%Age 60 - 64 936 3.0% 2,134 4.8% 3,126 5.8%Age 65 - 69 696 2.2% 1,316 2.9% 2,048 3.8%Age 70 - 74 529 1.7% 842 1.9% 1,305 2.4%Age 75 - 79 310 1.0% 549 1.2% 719 1.3%Age 80 - 84 140 0.5% 324 0.7% 419 0.8%Age 85+ 65 0.2% 189 0.4% 272 0.5%
Age <18 10,041 32.4% 12,502 27.8% 14,734 27.3%Age 18+ 20,958 67.6% 32,407 72.2% 39,294 72.7%Age 21+ 19,724 63.6% 30,465 67.8% 37,197 68.8%Median AgeMedian Age 34.0 35.7 35.8
Data Note : Detail may not sum to totals due to rounding.
Source: U.S. Bureau of the Census, 2000 Census of Population and Housing.
Male Population by Detailed Age
Census 2000 2009 2014
Gibbs Planning Group Inc., Wasilla Alaska Report Appendix Page 48
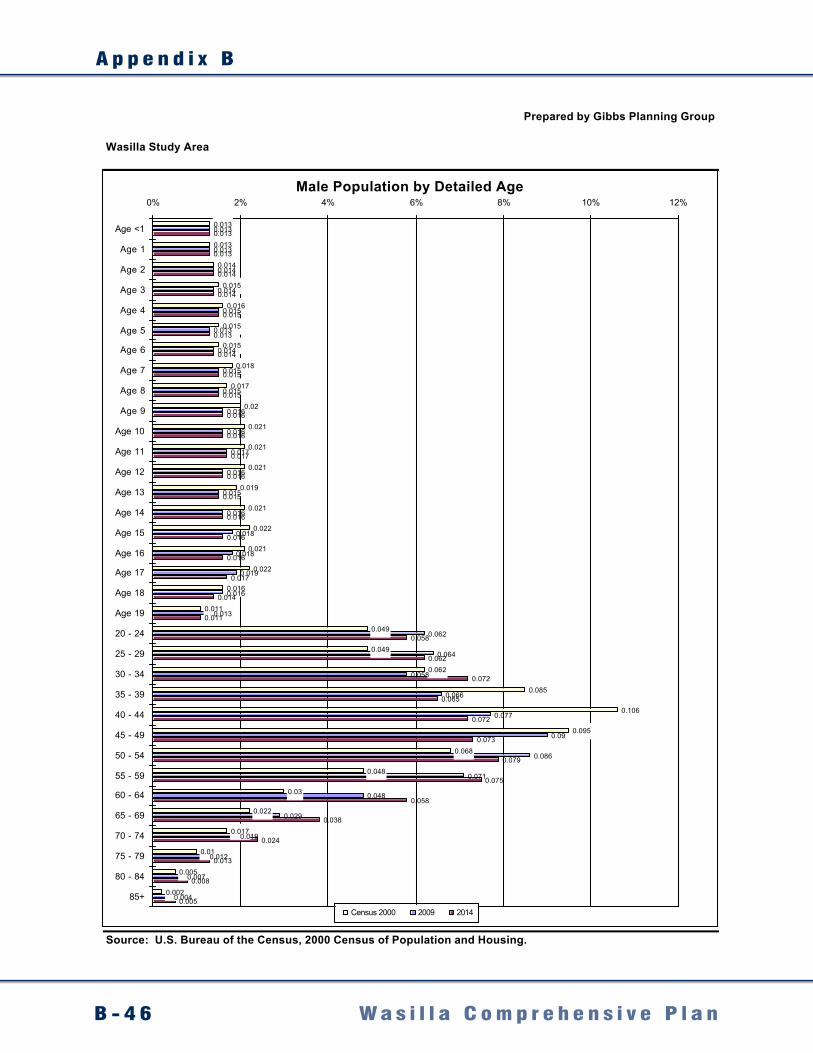
A p p e n d i x B
B - 4 6 W a s i l l a C o m p r e h e n s i v e P l a n
Prepared by Gibbs Planning Group
Wasilla Study Area
Source: U.S. Bureau of the Census, 2000 Census of Population and Housing.
Male Population by Detailed Age
0.013
0.013
0.014
0.015
0.016
0.015
0.015
0.018
0.017
0.02
0.021
0.021
0.021
0.019
0.021
0.022
0.021
0.022
0.016
0.011
0.049
0.049
0.062
0.085
0.106
0.095
0.068
0.048
0.03
0.022
0.017
0.01
0.005
0.002
0.013
0.013
0.014
0.014
0.015
0.013
0.014
0.015
0.015
0.016
0.016
0.017
0.016
0.015
0.016
0.018
0.018
0.019
0.016
0.013
0.062
0.064
0.058
0.066
0.077
0.09
0.086
0.071
0.048
0.029
0.019
0.012
0.007
0.004
0.013
0.013
0.014
0.014
0.015
0.013
0.014
0.015
0.015
0.016
0.016
0.017
0.016
0.015
0.016
0.016
0.016
0.017
0.014
0.011
0.058
0.062
0.072
0.065
0.072
0.073
0.079
0.075
0.058
0.038
0.024
0.013
0.008
0.005
0% 2% 4% 6% 8% 10% 12%
Age <1
Age 1
Age 2
Age 3
Age 4
Age 5
Age 6
Age 7
Age 8
Age 9
Age 10
Age 11
Age 12
Age 13
Age 14
Age 15
Age 16
Age 17
Age 18
Age 19
20 - 24
25 - 29
30 - 34
35 - 39
40 - 44
45 - 49
50 - 54
55 - 59
60 - 64
65 - 69
70 - 74
75 - 79
80 - 84
85+
Census 2000 2009 2014
Gibbs Planning Group Inc., Wasilla Alaska Report Appendix Page 49
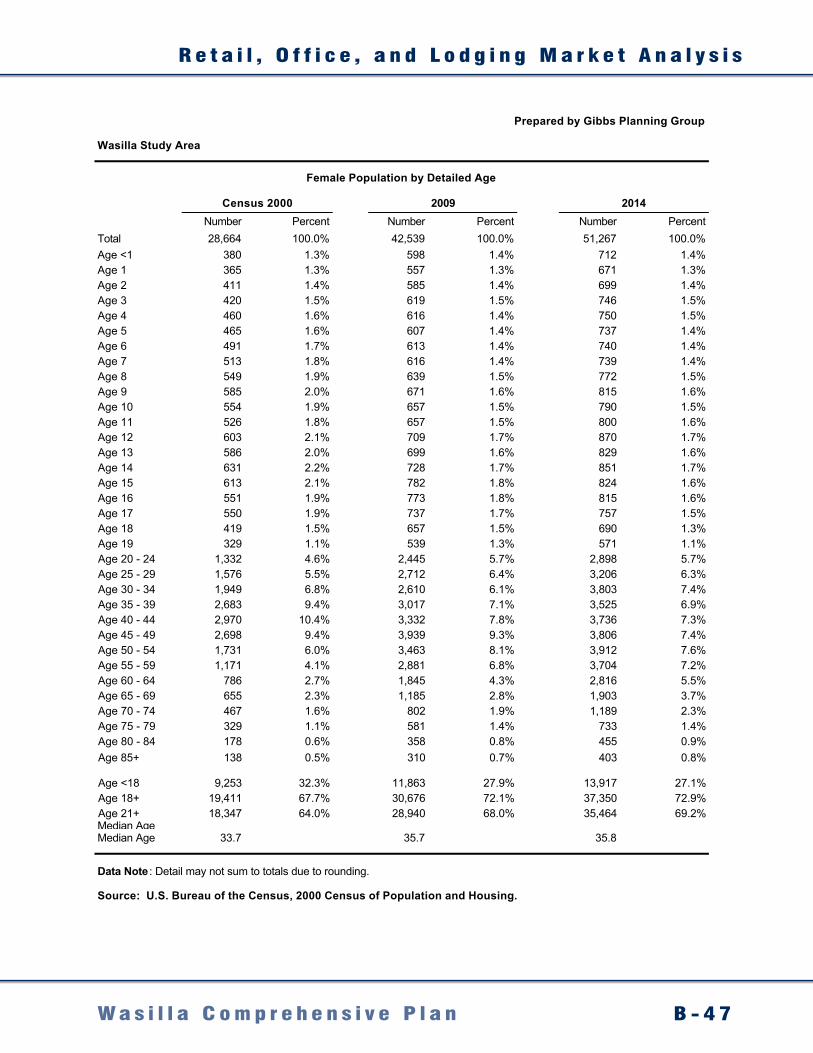
R e t a i l , O f f i c e , a n d L o d g i n g M a r k e t A n a l y s i s
B - 4 7W a s i l l a C o m p r e h e n s i v e P l a n
Prepared by Gibbs Planning Group
Wasilla Study Area
Number Percent Number Percent Number PercentTotal 28,664 100.0% 42,539 100.0% 51,267 100.0%Age <1 380 1.3% 598 1.4% 712 1.4%Age 1 365 1.3% 557 1.3% 671 1.3%Age 2 411 1.4% 585 1.4% 699 1.4%Age 3 420 1.5% 619 1.5% 746 1.5%Age 4 460 1.6% 616 1.4% 750 1.5%Age 5 465 1.6% 607 1.4% 737 1.4%Age 6 491 1.7% 613 1.4% 740 1.4%Age 7 513 1.8% 616 1.4% 739 1.4%Age 8 549 1.9% 639 1.5% 772 1.5%Age 9 585 2.0% 671 1.6% 815 1.6%Age 10 554 1.9% 657 1.5% 790 1.5%Age 11 526 1.8% 657 1.5% 800 1.6%Age 12 603 2.1% 709 1.7% 870 1.7%Age 13 586 2.0% 699 1.6% 829 1.6%Age 14 631 2.2% 728 1.7% 851 1.7%Age 15 613 2.1% 782 1.8% 824 1.6%Age 16 551 1.9% 773 1.8% 815 1.6%Age 17 550 1.9% 737 1.7% 757 1.5%Age 18 419 1.5% 657 1.5% 690 1.3%Age 19 329 1.1% 539 1.3% 571 1.1%Age 20 - 24 1,332 4.6% 2,445 5.7% 2,898 5.7%Age 25 - 29 1,576 5.5% 2,712 6.4% 3,206 6.3%Age 30 - 34 1,949 6.8% 2,610 6.1% 3,803 7.4%Age 35 - 39 2,683 9.4% 3,017 7.1% 3,525 6.9%Age 40 - 44 2,970 10.4% 3,332 7.8% 3,736 7.3%Age 45 - 49 2,698 9.4% 3,939 9.3% 3,806 7.4%Age 50 - 54 1,731 6.0% 3,463 8.1% 3,912 7.6%Age 55 - 59 1,171 4.1% 2,881 6.8% 3,704 7.2%Age 60 - 64 786 2.7% 1,845 4.3% 2,816 5.5%Age 65 - 69 655 2.3% 1,185 2.8% 1,903 3.7%Age 70 - 74 467 1.6% 802 1.9% 1,189 2.3%Age 75 - 79 329 1.1% 581 1.4% 733 1.4%Age 80 - 84 178 0.6% 358 0.8% 455 0.9%Age 85+ 138 0.5% 310 0.7% 403 0.8%
Age <18 9,253 32.3% 11,863 27.9% 13,917 27.1%Age 18+ 19,411 67.7% 30,676 72.1% 37,350 72.9%Age 21+ 18,347 64.0% 28,940 68.0% 35,464 69.2%Median AgeMedian Age 33.7 35.7 35.8
Data Note : Detail may not sum to totals due to rounding.
Source: U.S. Bureau of the Census, 2000 Census of Population and Housing.
Census 2000 2009 2014
Female Population by Detailed Age
Gibbs Planning Group Inc., Wasilla Alaska Report Appendix Page 50
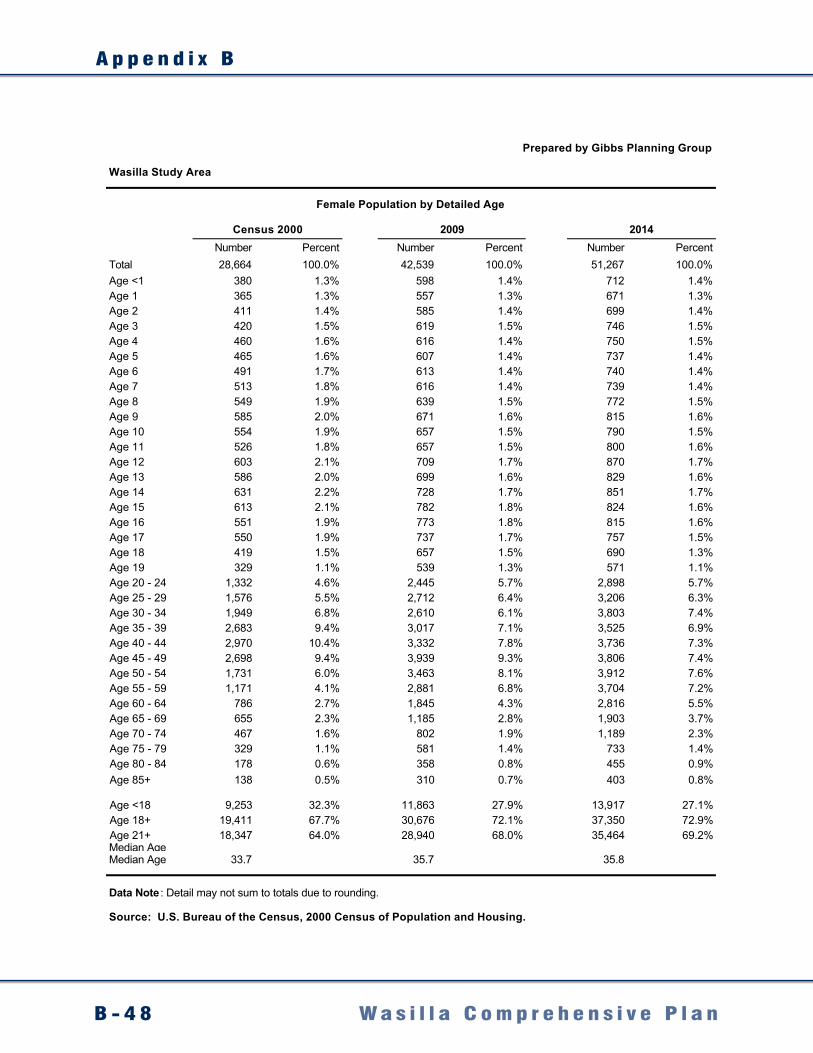
A p p e n d i x B
B - 4 8 W a s i l l a C o m p r e h e n s i v e P l a n
Prepared by Gibbs Planning Group
Wasilla Study Area
Number Percent Number Percent Number PercentTotal 28,664 100.0% 42,539 100.0% 51,267 100.0%Age <1 380 1.3% 598 1.4% 712 1.4%Age 1 365 1.3% 557 1.3% 671 1.3%Age 2 411 1.4% 585 1.4% 699 1.4%Age 3 420 1.5% 619 1.5% 746 1.5%Age 4 460 1.6% 616 1.4% 750 1.5%Age 5 465 1.6% 607 1.4% 737 1.4%Age 6 491 1.7% 613 1.4% 740 1.4%Age 7 513 1.8% 616 1.4% 739 1.4%Age 8 549 1.9% 639 1.5% 772 1.5%Age 9 585 2.0% 671 1.6% 815 1.6%Age 10 554 1.9% 657 1.5% 790 1.5%Age 11 526 1.8% 657 1.5% 800 1.6%Age 12 603 2.1% 709 1.7% 870 1.7%Age 13 586 2.0% 699 1.6% 829 1.6%Age 14 631 2.2% 728 1.7% 851 1.7%Age 15 613 2.1% 782 1.8% 824 1.6%Age 16 551 1.9% 773 1.8% 815 1.6%Age 17 550 1.9% 737 1.7% 757 1.5%Age 18 419 1.5% 657 1.5% 690 1.3%Age 19 329 1.1% 539 1.3% 571 1.1%Age 20 - 24 1,332 4.6% 2,445 5.7% 2,898 5.7%Age 25 - 29 1,576 5.5% 2,712 6.4% 3,206 6.3%Age 30 - 34 1,949 6.8% 2,610 6.1% 3,803 7.4%Age 35 - 39 2,683 9.4% 3,017 7.1% 3,525 6.9%Age 40 - 44 2,970 10.4% 3,332 7.8% 3,736 7.3%Age 45 - 49 2,698 9.4% 3,939 9.3% 3,806 7.4%Age 50 - 54 1,731 6.0% 3,463 8.1% 3,912 7.6%Age 55 - 59 1,171 4.1% 2,881 6.8% 3,704 7.2%Age 60 - 64 786 2.7% 1,845 4.3% 2,816 5.5%Age 65 - 69 655 2.3% 1,185 2.8% 1,903 3.7%Age 70 - 74 467 1.6% 802 1.9% 1,189 2.3%Age 75 - 79 329 1.1% 581 1.4% 733 1.4%Age 80 - 84 178 0.6% 358 0.8% 455 0.9%Age 85+ 138 0.5% 310 0.7% 403 0.8%
Age <18 9,253 32.3% 11,863 27.9% 13,917 27.1%Age 18+ 19,411 67.7% 30,676 72.1% 37,350 72.9%Age 21+ 18,347 64.0% 28,940 68.0% 35,464 69.2%Median AgeMedian Age 33.7 35.7 35.8
Data Note : Detail may not sum to totals due to rounding.
Source: U.S. Bureau of the Census, 2000 Census of Population and Housing.
Census 2000 2009 2014
Female Population by Detailed Age
Gibbs Planning Group Inc., Wasilla Alaska Report Appendix Page 50
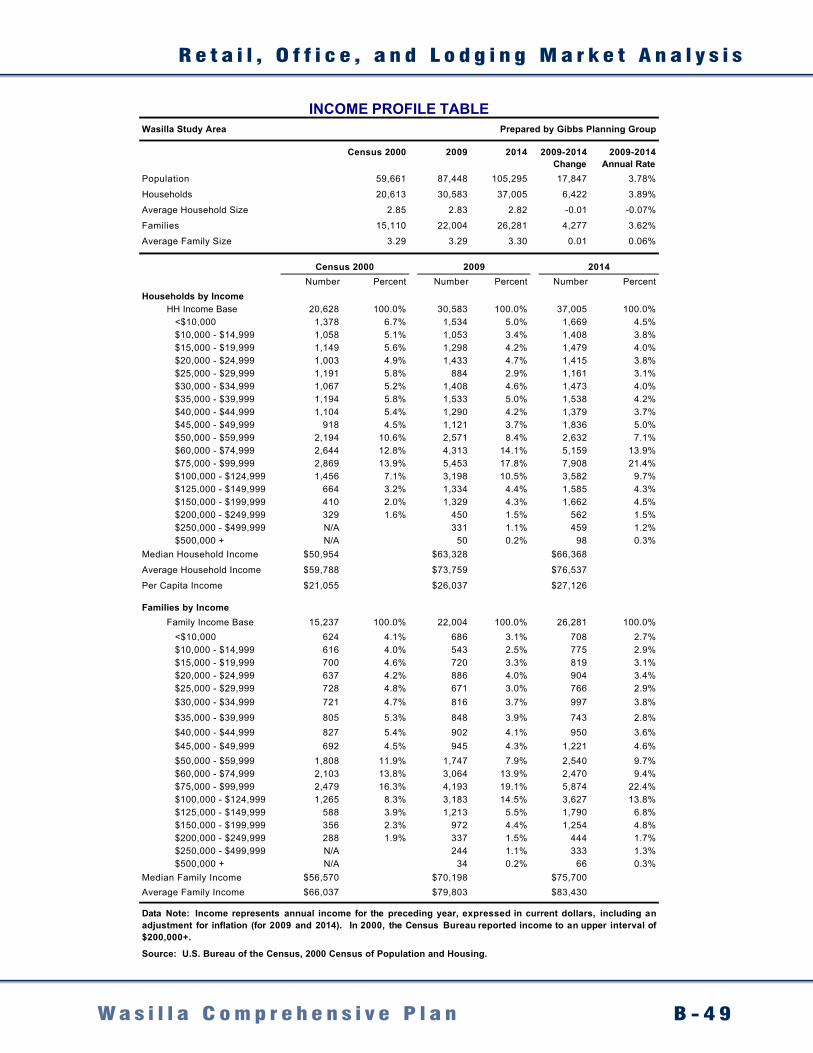
R e t a i l , O f f i c e , a n d L o d g i n g M a r k e t A n a l y s i s
B - 4 9W a s i l l a C o m p r e h e n s i v e P l a n
Wasilla Study Area Prepared by Gibbs Planning Group
Census 2000 2009 2014 2009-2014 2009-2014Change Annual Rate
Population 59,661 87,448 105,295 17,847 3.78%
Households 20,613 30,583 37,005 6,422 3.89%
Average Household Size 2.85 2.83 2.82 -0.01 -0.07%
Families 15,110 22,004 26,281 4,277 3.62%
Average Family Size 3.29 3.29 3.30 0.01 0.06%
Census 2000 2009 2014Number Percent Number Percent Number Percent
Households by IncomeHH Income Base 20,628 100.0% 30,583 100.0% 37,005 100.0% <$10,000 1,378 6.7% 1,534 5.0% 1,669 4.5% $10,000 - $14,999 1,058 5.1% 1,053 3.4% 1,408 3.8% $15,000 - $19,999 1,149 5.6% 1,298 4.2% 1,479 4.0% $20,000 - $24,999 1,003 4.9% 1,433 4.7% 1,415 3.8% $25,000 - $29,999 1,191 5.8% 884 2.9% 1,161 3.1% $30,000 - $34,999 1,067 5.2% 1,408 4.6% 1,473 4.0% $35,000 - $39,999 1,194 5.8% 1,533 5.0% 1,538 4.2% $40,000 - $44,999 1,104 5.4% 1,290 4.2% 1,379 3.7% $45,000 - $49,999 918 4.5% 1,121 3.7% 1,836 5.0% $50,000 - $59,999 2,194 10.6% 2,571 8.4% 2,632 7.1% $60,000 - $74,999 2,644 12.8% 4,313 14.1% 5,159 13.9% $75,000 - $99,999 2,869 13.9% 5,453 17.8% 7,908 21.4% $100,000 - $124,999 1,456 7.1% 3,198 10.5% 3,582 9.7% $125,000 - $149,999 664 3.2% 1,334 4.4% 1,585 4.3% $150,000 - $199,999 410 2.0% 1,329 4.3% 1,662 4.5% $200,000 - $249,999 329 1.6% 450 1.5% 562 1.5% $250,000 - $499,999 N/A 331 1.1% 459 1.2% $500,000 + N/A 50 0.2% 98 0.3%
Median Household Income $50,954 $63,328 $66,368
Average Household Income $59,788 $73,759 $76,537
Per Capita Income $21,055 $26,037 $27,126
Families by IncomeFamily Income Base 15,237 100.0% 22,004 100.0% 26,281 100.0% <$10,000 624 4.1% 686 3.1% 708 2.7% $10,000 - $14,999 616 4.0% 543 2.5% 775 2.9% $15,000 - $19,999 700 4.6% 720 3.3% 819 3.1% $20,000 - $24,999 637 4.2% 886 4.0% 904 3.4% $25,000 - $29,999 728 4.8% 671 3.0% 766 2.9% $30,000 - $34,999 721 4.7% 816 3.7% 997 3.8%
$35,000 - $39,999 805 5.3% 848 3.9% 743 2.8% $40,000 - $44,999 827 5.4% 902 4.1% 950 3.6% $45,000 - $49,999 692 4.5% 945 4.3% 1,221 4.6% $50,000 - $59,999 1,808 11.9% 1,747 7.9% 2,540 9.7% $60,000 - $74,999 2,103 13.8% 3,064 13.9% 2,470 9.4% $75,000 - $99,999 2,479 16.3% 4,193 19.1% 5,874 22.4% $100,000 - $124,999 1,265 8.3% 3,183 14.5% 3,627 13.8% $125,000 - $149,999 588 3.9% 1,213 5.5% 1,790 6.8% $150,000 - $199,999 356 2.3% 972 4.4% 1,254 4.8% $200,000 - $249,999 288 1.9% 337 1.5% 444 1.7% $250,000 - $499,999 N/A 244 1.1% 333 1.3% $500,000 + N/A 34 0.2% 66 0.3%
Median Family Income $56,570 $70,198 $75,700Average Family Income $66,037 $79,803 $83,430
Source: U.S. Bureau of the Census, 2000 Census of Population and Housing.
Data Note: Income represents annual income for the preceding year, expressed in current dollars, including anadjustment for inflation (for 2009 and 2014). In 2000, the Census Bureau reported income to an upper interval of$200,000+.
INCOME PROFILE TABLE
Gibbs Planning Group Inc., Wasilla Alaska Report Appendix Page 52
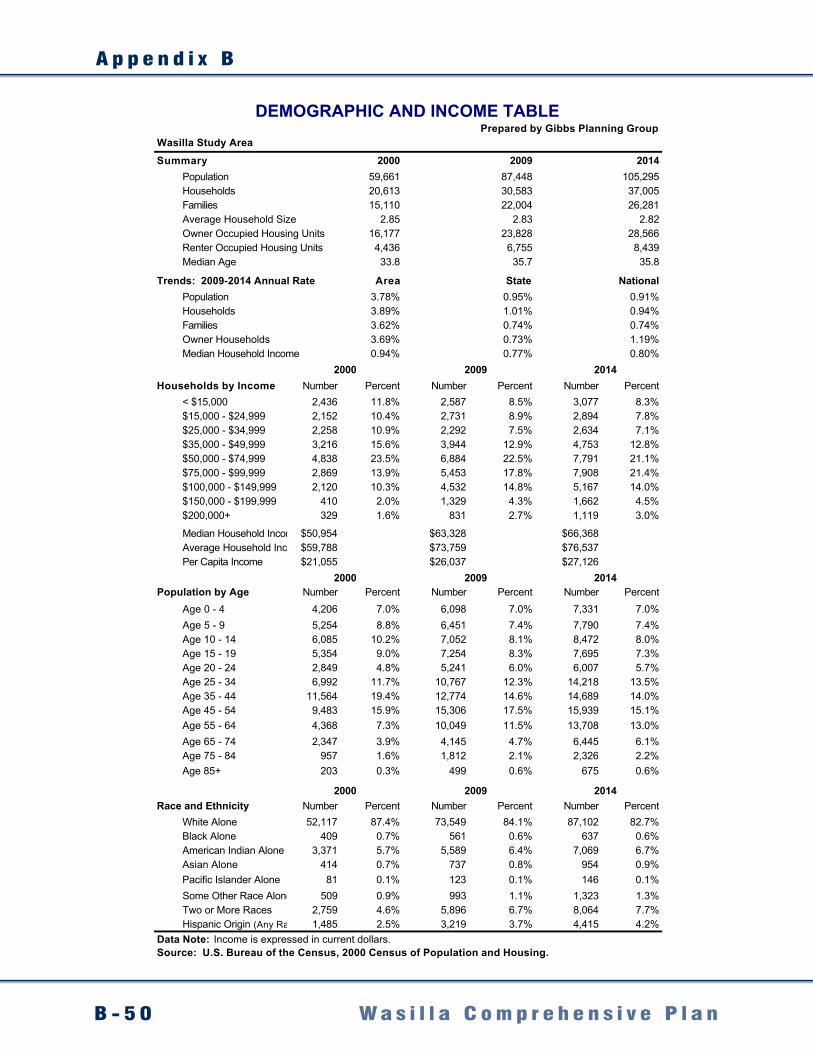
A p p e n d i x B
B - 5 0 W a s i l l a C o m p r e h e n s i v e P l a n
Prepared by Gibbs Planning GroupWasilla Study Area
Summary 2000 2009 2014Population 59,661 87,448 105,295Households 20,613 30,583 37,005Families 15,110 22,004 26,281Average Household Size 2.85 2.83 2.82Owner Occupied Housing Units 16,177 23,828 28,566Renter Occupied Housing Units 4,436 6,755 8,439Median Age 33.8 35.7 35.8
Trends: 2009-2014 Annual Rate Area State NationalPopulation 3.78% 0.95% 0.91%Households 3.89% 1.01% 0.94%Families 3.62% 0.74% 0.74%Owner Households 3.69% 0.73% 1.19%Median Household Income 0.94% 0.77% 0.80%
Households by Income Number Percent Number Percent Number Percent< $15,000 2,436 11.8% 2,587 8.5% 3,077 8.3%$15,000 - $24,999 2,152 10.4% 2,731 8.9% 2,894 7.8%$25,000 - $34,999 2,258 10.9% 2,292 7.5% 2,634 7.1%$35,000 - $49,999 3,216 15.6% 3,944 12.9% 4,753 12.8%$50,000 - $74,999 4,838 23.5% 6,884 22.5% 7,791 21.1%$75,000 - $99,999 2,869 13.9% 5,453 17.8% 7,908 21.4%$100,000 - $149,999 2,120 10.3% 4,532 14.8% 5,167 14.0%$150,000 - $199,999 410 2.0% 1,329 4.3% 1,662 4.5%$200,000+ 329 1.6% 831 2.7% 1,119 3.0%
Median Household Income$50,954 $63,328 $66,368Average Household Income$59,788 $73,759 $76,537Per Capita Income $21,055 $26,037 $27,126
Population by Age Number Percent Number Percent Number PercentAge 0 - 4 4,206 7.0% 6,098 7.0% 7,331 7.0%Age 5 - 9 5,254 8.8% 6,451 7.4% 7,790 7.4%Age 10 - 14 6,085 10.2% 7,052 8.1% 8,472 8.0%Age 15 - 19 5,354 9.0% 7,254 8.3% 7,695 7.3%Age 20 - 24 2,849 4.8% 5,241 6.0% 6,007 5.7%Age 25 - 34 6,992 11.7% 10,767 12.3% 14,218 13.5%Age 35 - 44 11,564 19.4% 12,774 14.6% 14,689 14.0%Age 45 - 54 9,483 15.9% 15,306 17.5% 15,939 15.1%Age 55 - 64 4,368 7.3% 10,049 11.5% 13,708 13.0%Age 65 - 74 2,347 3.9% 4,145 4.7% 6,445 6.1%Age 75 - 84 957 1.6% 1,812 2.1% 2,326 2.2%Age 85+ 203 0.3% 499 0.6% 675 0.6%
Race and Ethnicity Number Percent Number Percent Number PercentWhite Alone 52,117 87.4% 73,549 84.1% 87,102 82.7%Black Alone 409 0.7% 561 0.6% 637 0.6%American Indian Alone 3,371 5.7% 5,589 6.4% 7,069 6.7%Asian Alone 414 0.7% 737 0.8% 954 0.9%Pacific Islander Alone 81 0.1% 123 0.1% 146 0.1%Some Other Race Alone 509 0.9% 993 1.1% 1,323 1.3%Two or More Races 2,759 4.6% 5,896 6.7% 8,064 7.7%Hispanic Origin (Any Race) 1,485 2.5% 3,219 3.7% 4,415 4.2%
2000 2009 2014
Source: U.S. Bureau of the Census, 2000 Census of Population and Housing.Data Note: Income is expressed in current dollars.
DEMOGRAPHIC AND INCOME TABLE
2000 2009 2014
2000 2009 2014
Gibbs Planning Group Inc., Wasilla Alaska Report Appendix Page 53
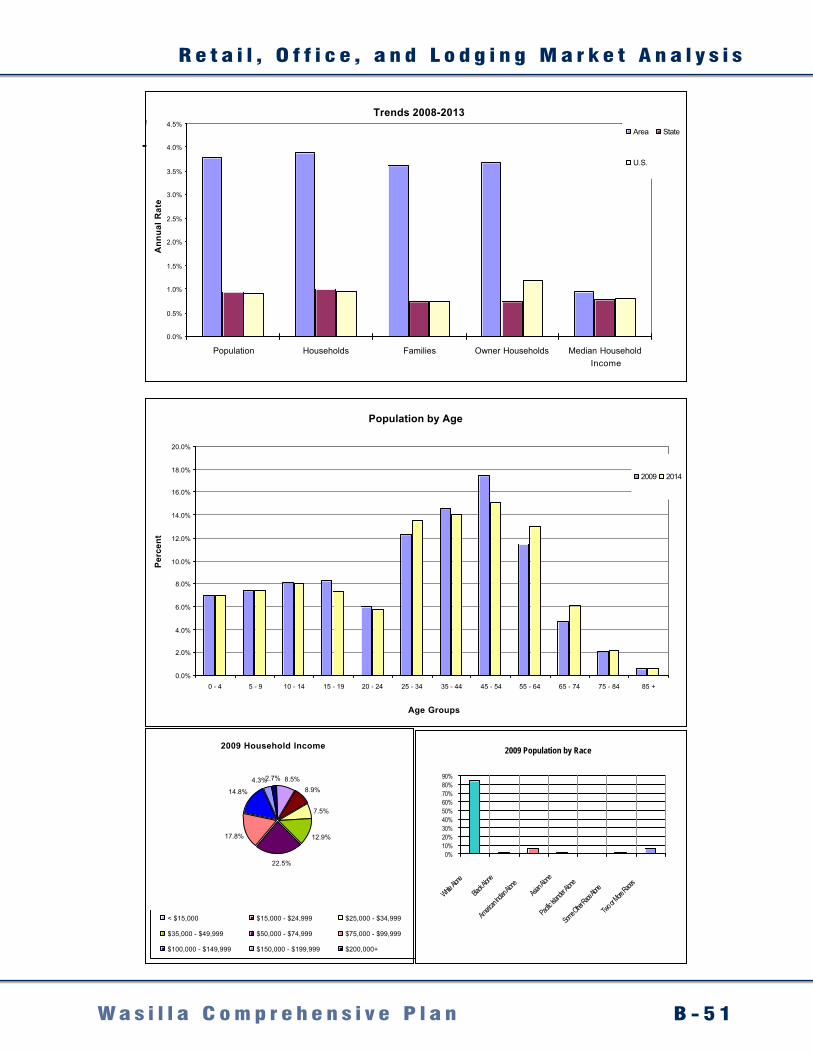
R e t a i l , O f f i c e , a n d L o d g i n g M a r k e t A n a l y s i s
B - 5 1W a s i l l a C o m p r e h e n s i v e P l a n
Wasilla Study AreaTrends 2008-2013
0.0%
0.5%
1.0%
1.5%
2.0%
2.5%
3.0%
3.5%
4.0%
4.5%
Population Households Families Owner Households Median HouseholdIncome
Ann
ual R
ate
Area State
U.S.
Population by Age
0.0%
2.0%
4.0%
6.0%
8.0%
10.0%
12.0%
14.0%
16.0%
18.0%
20.0%
0 - 4 5 - 9 10 - 14 15 - 19 20 - 24 25 - 34 35 - 44 45 - 54 55 - 64 65 - 74 75 - 84 85 +
Age Groups
Perc
ent
2009 2014
2009 Household Income
8.5%8.9%
7.5%
12.9%
22.5%
17.8%
14.8%
4.3%2.7%
< $15,000 $15,000 - $24,999 $25,000 - $34,999
$35,000 - $49,999 $50,000 - $74,999 $75,000 - $99,999
$100,000 - $149,999 $150,000 - $199,999 $200,000+
2009 Population by Race
0%10%20%30%40%50%60%70%80%90%
White Alon
e
Black Al
one
Americ
an India
n Alone
Asian Al
one
Pacific I
slander
Alone
Some O
ther Rac
e Alone
Two or More
Races
Gibbs Planning Group Inc., Wasilla Alaska Report Appendix Page 54
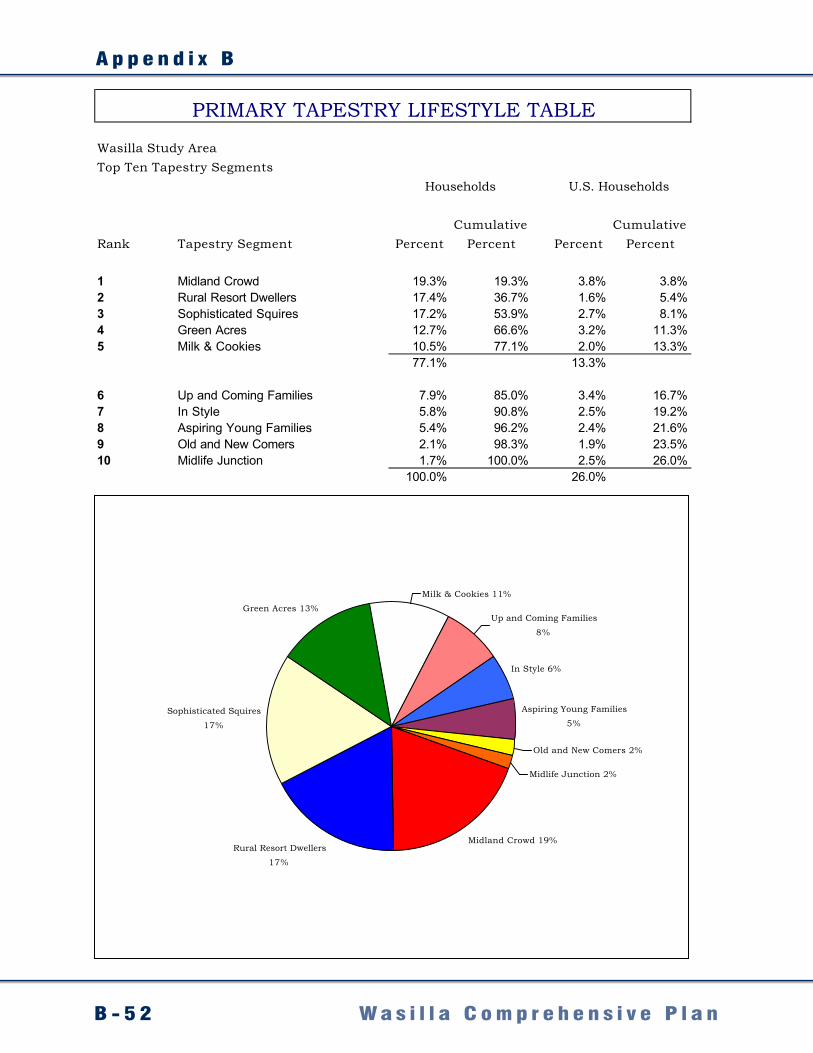
A p p e n d i x B
B - 5 2 W a s i l l a C o m p r e h e n s i v e P l a n
Wasilla Study Area Top Ten Tapestry Segments
Cumulative CumulativeRank Tapestry Segment Percent Percent Percent Percent
1 Midland Crowd 19.3% 19.3% 3.8% 3.8%2 Rural Resort Dwellers 17.4% 36.7% 1.6% 5.4%3 Sophisticated Squires 17.2% 53.9% 2.7% 8.1%4 Green Acres 12.7% 66.6% 3.2% 11.3%5 Milk & Cookies 10.5% 77.1% 2.0% 13.3%
77.1% 13.3%
6 Up and Coming Families 7.9% 85.0% 3.4% 16.7%7 In Style 5.8% 90.8% 2.5% 19.2%8 Aspiring Young Families 5.4% 96.2% 2.4% 21.6%9 Old and New Comers 2.1% 98.3% 1.9% 23.5%10 Midlife Junction 1.7% 100.0% 2.5% 26.0%
100.0% 26.0%
PRIMARY TAPESTRY LIFESTYLE TABLE
U.S. HouseholdsHouseholds
Midland Crowd 19%Rural Resort Dwellers
17%
Sophisticated Squires
17%
Green Acres 13%
Milk & Cookies 11%
Up and Coming Families
8%
In Style 6%
Aspiring Young Families
5%
Old and New Comers 2%
Midlife Junction 2%
Gibbs Planning Group Inc., Wasilla Alaska Report Appendix Page 55
R e t a i l , O f f i c e , a n d L o d g i n g M a r k e t A n a l y s i s
B - 5 3W a s i l l a C o m p r e h e n s i v e P l a nGibbs Planning Group Inc., Wasilla Alaska Report Appendix Page 56
Segment Name: Midland Crowd LifeMode Group: American Quilt
DemographicThe approximately 11.6 million people in Midland Crowd neighborhoods represent the largest market of Community Tapestry, nearly 4 percent of the U.S. population, and it is still growing. Since 2000, the population growth has been 2.34 percent annually. The median age of 36.9 years parallels that of the U.S. median. More than half of the households (62 percent) are composed of married-couple families, half of whom have children. One-fifth of households are occupied by those who live alone. Most residents are white. SocioeconomicWith more than 4.2 million households, Midland Crowd has the highest count of all the Community Tapestry markets, with an annual household growth of 2.6 percent since 2000. The median household income is $49,748, slightly lower than the U.S. median. Households derive primary income from wages and salaries, although the percentage of households that receive income from self-employment ventures is slightly higher than the national level. The median net worth is $86,362, somewhat below the U.S. median. Half of the employed residents work in white -collar occupations. Approximately 30 percent of Midland Crowd residents aged 25 years and older have attended college; 15 percent hold a bachelor’s or graduate degree. ResidentialMidland Crowd residents live in housing developments in rural areas throughout the United States (more village or town than farm), mainly in the South. Three-fourths of the housing was built after 1969. Homeownership is at 84 percent; the median home value is $137,727. Two-thirds of the households are single -family structures; 28 percent are mobile homes. One-fourth of the households own three or more vehicles. PreferencesMidland Crowd is a somewhat politically conservative market. The rural location and their traditional lifestyle dictate the consumer preferences of these residents. How they take care of their homes, lawns, and vehicles demonstrates their do-it-yourself mentality. Households typically own or lease a truck; many own a used motorcycle. Hunting, fishing, and woodworking are favorite pursuits. Generally, households have pets, especially birds and dogs. Recent purchases include used vehicles, household furniture, and giant-screen TVs. Their department store of choice is Belk. When eating takeout, they often choose a fast-food restaurant and use the drive-through window. Many households have a satellite dish. Favorite stations include CMT and Outdoor Life Network. In addition to watching rodeo/bull riding, truck and tractor pulls/mud racing, and fishing programs on TV, residents watch a variety of news programs. Fitting right in with their rural surroundings, they prefer to listen to country music on the radio and read fishing and hunting magazines.
A p p e n d i x B
B - 5 4 W a s i l l a C o m p r e h e n s i v e P l a n
Gibbs Planning Group Inc., Wasilla Alaska Report Appendix Page 57
Segment Name: Rural Resort DwellersLifeMode Group: American Quilt
DemographicPreferring milder climates and pastoral settings, Rural Resort Dwellers residents live in rural non-farm areas throughout the United States. The chief household type (39 percent of households) for this segment is a married couple with no children living at home. Other significant household types include singles who live alone (24 percent) and married couples with children (21 percent). This somewhat older segment has a median age of 46.9 years. Approximately 35 percent of the population and half of the householders are aged 55 years or older. There is little diversity in these communities: most residents are white. SocioeconomicAlthough retirement officially looms for many Rural Resort Dwellers residents, most of them still work. The median household income is $47,311, slightly below the U.S. level. Six percent of all who are employed work at home, twice that of the U.S. percentage. Because of the higher-than-average presence of residents aged 65 or older, receipt of retirement income and Social Security benefits is common for these households. More than two-fifths of households collect investment income; approximately one-fifth earn self-employment income. More than half of the population aged 25 years and older hold a bachelor’s or graduate degree or have attended college, comparable to the U.S. level. The median net worth is $105,077, slightly below the U.S. median. ResidentialAlthough these low-density communities are small, households are growing at 2.1 percent annually. Typical of areas with rustic appeal, the household inventory features single -family structures (78 percent) and mobile homes (15 percent). Homeownership is at 83 percent, and the median home value is $221,645. A significant inventory of seasonal housing exists in these communities; the Rural Resort Dwellers market has the highest percentage of seasonal housing of all the Community Tapestry segments, 18 times higher than the national level. PreferencesModest living and simple consumer tastes describe Rural Resort Dwellers residents. Gardening tools and equipment are an integral part of maintaining their properties. They often work on home remodeling and improvement projects. Their simple lifestyle also includes baking and preparing home-cooked meals. Many households have pets, particularly dogs. The rural setting means higher-than-average numbers of riding lawn mowers and satellite dishes. Many households also own multiple vehicles including a truck. Rural Resort Dwellers residents actively participate in local civic issues. They enjoy boating, hunting, fishing, snorkeling, and canoeing. They listen to country music on the radio. The older population focuses on age-related issues such as general health care, prescription medications, and financial and retirement related matters. Many Rural Resort Dwellers residents actively manage or plan their investments and retirement savings. IRA accounts are more popular than 401(k) plans with this high proportion of self-employed residents.
R e t a i l , O f f i c e , a n d L o d g i n g M a r k e t A n a l y s i s
B - 5 5W a s i l l a C o m p r e h e n s i v e P l a n
Gibbs Planning Group Inc., Wasilla Alaska Report Appendix Page 58
Segment Name: Sophisticated SquiresLifeMode Group: High Society
DemographicSophisticated Squires residents enjoy cultured country living in newer home developments on the fringe of urbanized areas. They now have longer commutes but fewer neighbors. These urban escapees are mostly married-couple families. The median age is 38.3 years. More than 40 percent of the households consist of married couples with children that range from toddlers to young adults. The majority of householders are between 35 and 54 years old; most are baby boomers. This segment is not ethnically diverse; most residents are white. SocioeconomicSophisticated Squires residents are educated: one-third of the population aged 25 years and older holds a bachelor’s or graduate degree, another third has attended college. Labor force participation rates are high for males and females. The range of occupations varies from management to unskilled labor positions, but most are in white -collar occupations. The median household income is $85,937. Wage or salary income, earned by 90 percent of households, is supplemented with interest, dividend, or rental income for nearly half of the households. The median net worth is $251,507. ResidentialSophisticated Squires residents live in less-densely populated areas that are concentrated in states on the Atlantic coast and surrounding the Great Lakes. Approximately 90 percent of the homes are single -family structures; the median home value is $286,622. Approximately 75 percent of the housing units were built before 1990; 55 percent were built between 1970 and 1989. More than 80 percent of households own at least two vehicles. PreferencesSophisticated Squires residents prefer to do their own lawn and landscaping work as well as home improvement and remodeling projects such as installing carpet or hardwood floors, painting home interiors, staining decks, and cleaning carpets with their steam cleaners. They like to barbeque on their gas grills and use their bread-making machines. This is the top market for owning three or more vehicles. They prefer minivans and full-size SUVs; many households own a motorcycle. A typical household owns three or more cell phones. Looking toward the future, many residents own stocks and large life insurance policies. When dieting, Weight Watchers is the favored diet method, and many own a treadmill or stair-stepper to stay fit. Family activities include playing volleyball, bicycling, playing board games and cards, going to the zoo, and attending soccer and baseball games. Adults also enjoy photography, playing golf, and riding their motorcycles. Children use the home personal computer to play games and typically own a Game Boy or Game Boy Advance video game system. Sophisticated Squires residents prefer to read gardening and science/technology magazines and listen to soft adult contemporary music, classic hits, and all-talk radio. Although many households own four or more TVs, residents are light televisi on viewers. When they do watch TV, they prefer news, comedies, and dramas as well as programs on the Golf Channel and Home & Garden Television.
A p p e n d i x B
B - 5 6 W a s i l l a C o m p r e h e n s i v e P l a nGibbs Planning Group Inc., Wasilla Alaska Report Appendix Page 59
Segment Name: Green Acres LifeMode Group: Upscale Avenue
DemographicMarried couples, with and without children, comprise 71 percent of the households in GreenAcres. Many families are comprised of blue-collar baby boomers, many with children aged 6–17 years. With more than 10 million people, Green Acres represents the third largest population of all the Community Tapestry markets, currently more than 3 percent of the U.S. population, and growing by 1.6 percent annually. The median age is 40.6 years. This segment is not ethnically diverse; 93 percent of the residents are white. SocioeconomicGreen Acres residents are educated and hardworking; more than half who are aged 25 years and older hold a degree or attended college. Labor force participation is approximately 69 percent, with higher employment concentrations in the manufacturing, construction, health care, and retail trade industry sectors. Seventeen percent of households derive income from self-employment ventures. Occupation distributions are similar to the United States. The median household income is $63,922, and the median net worth is $163,372.
ResidentialGreen Acres neighborhoods are located throughout the country but mainly in the Midwest and South. The highest state concentrations are found in Michigan, Ohio, and Pennsylvania. A little bit country, Green Acres residents live in pastoral settings of developing suburban fringe areas. Homeownership is at 88 percent. Eighty-seven percent of the household inventory is dominated by single-family dwellings. These newer homes carry a median value of $205,460. Typical of rural residents, Green Acres households own multiple vehicles: 78 percent own two or more vehicles. PreferencesCountry living describes the lifestyle of Green Acres residents. Pet dogs or cats are considered part of the family. These do-it-yourselfers maintain and remodel their homes; projects include painting, installing carpet or insulation, or adding a deck or patio. They own all the necessary power tools, including routers, welders, sanders, and various saws, to finish their projects. Residents maintain their lawns, flower gardens, and vegetable gardens, again with the right tools. They own riding lawn mowers, garden tillers, tractors, and even separate home freezers for the harvest. Fitting in with the do -it yourself mode, it is not surprising that Green Acres is the top market for owning a sewing machine. A favorite pastime is using their ice cream maker to produce homemade ice cream. They prefer motorcycles and full-size pickup trucks. For exercise, Green Acres residents ride their mountain bikes and participate in water sports such as waterskiing, canoeing, and kayaking. Other activities include bird-watching, power boating, target shooting, hunting, and attending auto racing events. They prefer to listen to college football, auto racing, and news-talk programs on the radio and read fishing, hunting, and motorcycle magazines. Accommodating the country lifestyle, many households watch TV by satellite dish instead of cable. Events they enjoy watching on TV include alpine skiing, ski jumping, motorcycle racing, equestrian events, and bicycle racing. A favorite station is the Speed Channel.
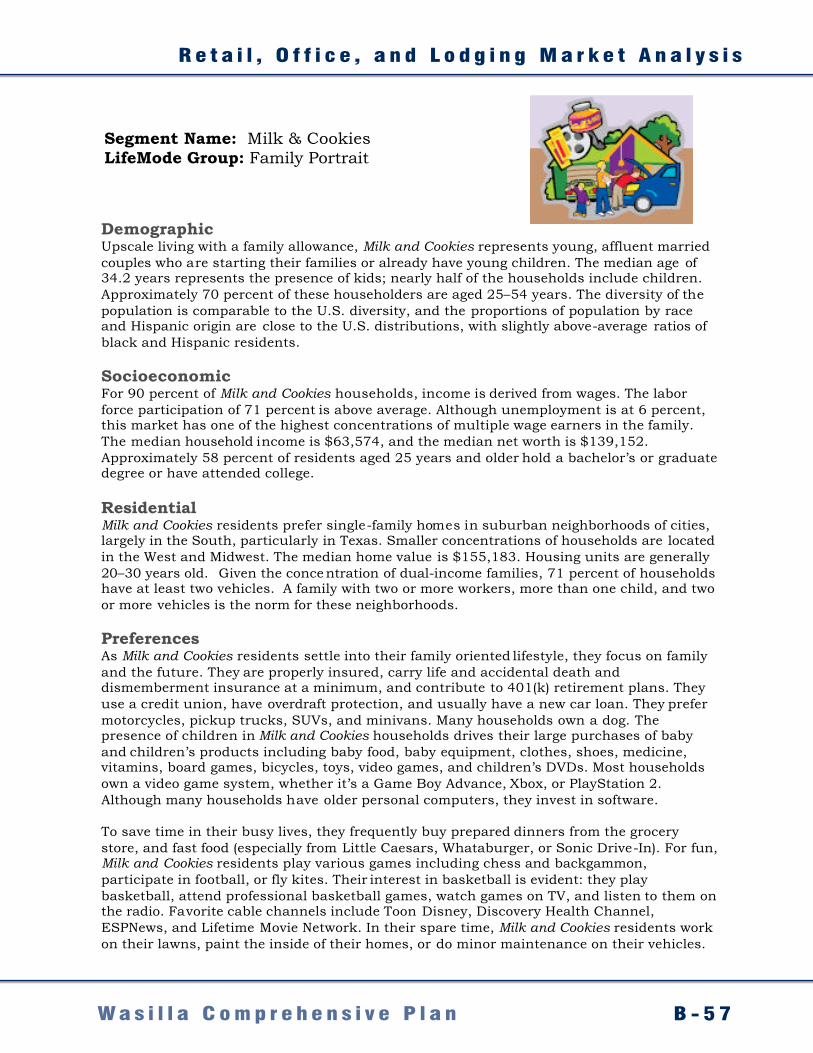
R e t a i l , O f f i c e , a n d L o d g i n g M a r k e t A n a l y s i s
B - 5 7W a s i l l a C o m p r e h e n s i v e P l a n
Gibbs Planning Group Inc., Wasilla Alaska Report Appendix Page 60
Segment Name: Milk & Cookies LifeMode Group: Family Portrait
DemographicUpscale living with a family allowance, Milk and Cookies represents young, affluent married couples who are starting their families or already have young children. The median age of 34.2 years represents the presence of kids; nearly half of the households include children. Approximately 70 percent of these householders are aged 25–54 years. The diversity of the population is comparable to the U.S. diversity, and the proportions of population by race and Hispanic origin are close to the U.S. distributions, with slightly above-average ratios of black and Hispanic residents. SocioeconomicFor 90 percent of Milk and Cookies households, income is derived from wages. The labor force participation of 71 percent is above average. Although unemployment is at 6 percent, this market has one of the highest concentrations of multiple wage earners in the family. The median household income is $63,574, and the median net worth is $139,152. Approximately 58 percent of residents aged 25 years and older hold a bachelor’s or graduate degree or have attended college. ResidentialMilk and Cookies residents prefer single-family homes in suburban neighborhoods of cities, largely in the South, particularly in Texas. Smaller concentrations of households are located in the West and Midwest. The median home value is $155,183. Housing units are generally 20–30 years old. Given the conce ntration of dual-income families, 71 percent of households have at least two vehicles. A family with two or more workers, more than one child, and two or more vehicles is the norm for these neighborhoods. PreferencesAs Milk and Cookies residents settle into their family oriented lifestyle, they focus on family and the future. They are properly insured, carry life and accidental death and dismemberment insurance at a minimum, and contribute to 401(k) retirement plans. They use a credit union, have overdraft protection, and usually have a new car loan. They prefer motorcycles, pickup trucks, SUVs, and minivans. Many households own a dog. The presence of children in Milk and Cookies households drives their large purchases of baby and children’s products including baby food, baby equipment, clothes, shoes, medicine, vitamins, board games, bicycles, toys, video games, and children’s DVDs. Most households own a video game system, whether it’s a Game Boy Advance, Xbox, or PlayStation 2. Although many households have older personal computers, they invest in software. To save time in their busy lives, they frequently buy prepared dinners from the grocery store, and fast food (especially from Little Caesars, Whataburger, or Sonic Drive-In). For fun, Milk and Cookies residents play various games including chess and backgammon, participate in football, or fly kites. Their interest in basketball is evident: they play basketball, attend professional basketball games, watch games on TV, and listen to them on the radio. Favorite cable channels include Toon Disney, Discovery Health Channel, ESPNews, and Lifetime Movie Network. In their spare time, Milk and Cookies residents work on their lawns, paint the inside of their homes, or do minor maintenance on their vehicles.
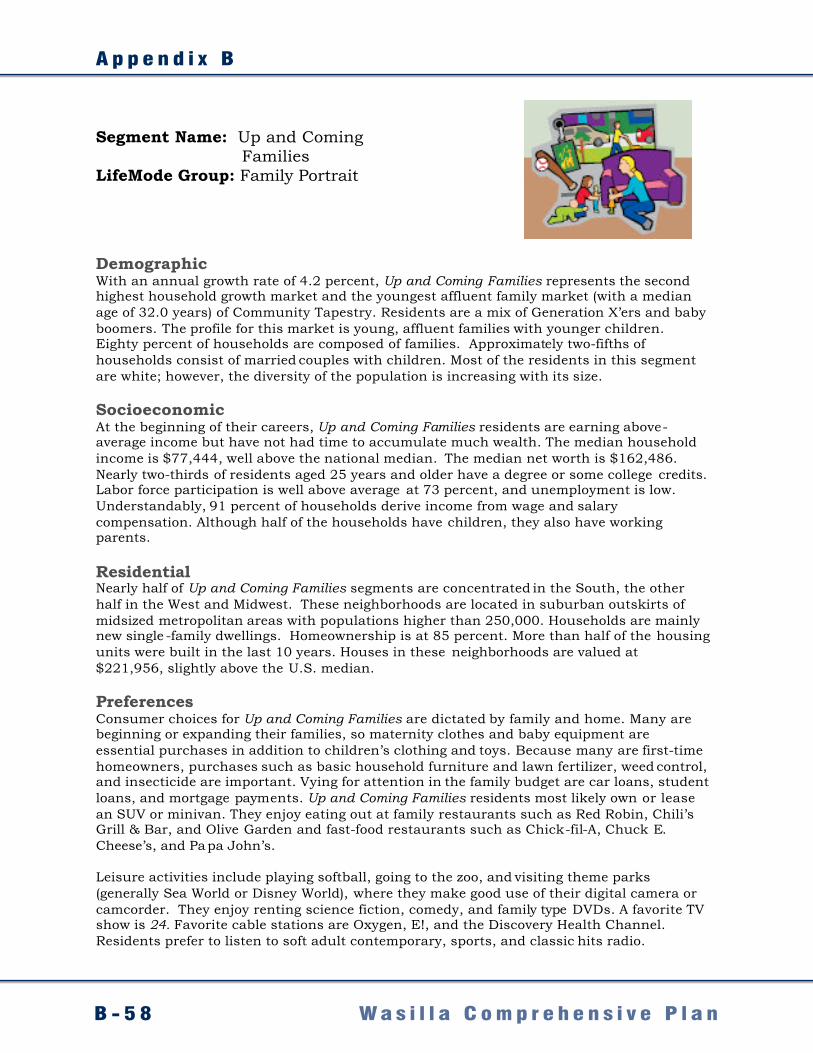
A p p e n d i x B
B - 5 8 W a s i l l a C o m p r e h e n s i v e P l a nGibbs Planning Group Inc., Wasilla Alaska Report Appendix Page 61
Segment Name: Up and Coming
FamiliesLifeMode Group: Family Portrait
DemographicWith an annual growth rate of 4.2 percent, Up and Coming Families represents the second highest household growth market and the youngest affluent family market (with a median age of 32.0 years) of Community Tapestry. Residents are a mix of Generation X’ers and baby boomers. The profile for this market is young, affluent families with younger children. Eighty percent of households are composed of families. Approximately two-fifths of households consist of married couples with children. Most of the residents in this segment are white; however, the diversity of the population is increasing with its size. SocioeconomicAt the beginning of their careers, Up and Coming Families residents are earning above-average income but have not had time to accumulate much wealth. The median household income is $77,444, well above the national median. The median net worth is $162,486. Nearly two-thirds of residents aged 25 years and older have a degree or some college credits. Labor force participation is well above average at 73 percent, and unemployment is low. Understandably, 91 percent of households derive income from wage and salary compensation. Although half of the households have children, they also have working parents. ResidentialNearly half of Up and Coming Families segments are concentrated in the South, the other half in the West and Midwest. These neighborhoods are located in suburban outskirts of midsized metropolitan areas with populations higher than 250,000. Households are mainly new single -family dwellings. Homeownership is at 85 percent. More than half of the housing units were built in the last 10 years. Houses in these neighborhoods are valued at $221,956, slightly above the U.S. median. PreferencesConsumer choices for Up and Coming Families are dictated by family and home. Many are beginning or expanding their families, so maternity clothes and baby equipment are essential purchases in addition to children’s clothing and toys. Because many are first-time homeowners, purchases such as basic household furniture and lawn fertilizer, weed control, and insecticide are important. Vying for attention in the family budget are car loans, student loans, and mortgage payments. Up and Coming Families residents most likely own or lease an SUV or minivan. They enjoy eating out at family restaurants such as Red Robin, Chili’s Grill & Bar, and Olive Garden and fast-food restaurants such as Chick-fil-A, Chuck E. Cheese’s, and Papa John’s. Leisure activities include playing softball, going to the zoo, and visiting theme parks (generally Sea World or Disney World), where they make good use of their digital camera or camcorder. They enjoy renting science fiction, comedy, and family type DVDs. A favorite TV show is 24. Favorite cable stations are Oxygen, E!, and the Discovery Health Channel. Residents prefer to listen to soft adult contemporary, sports, and classic hits radio.
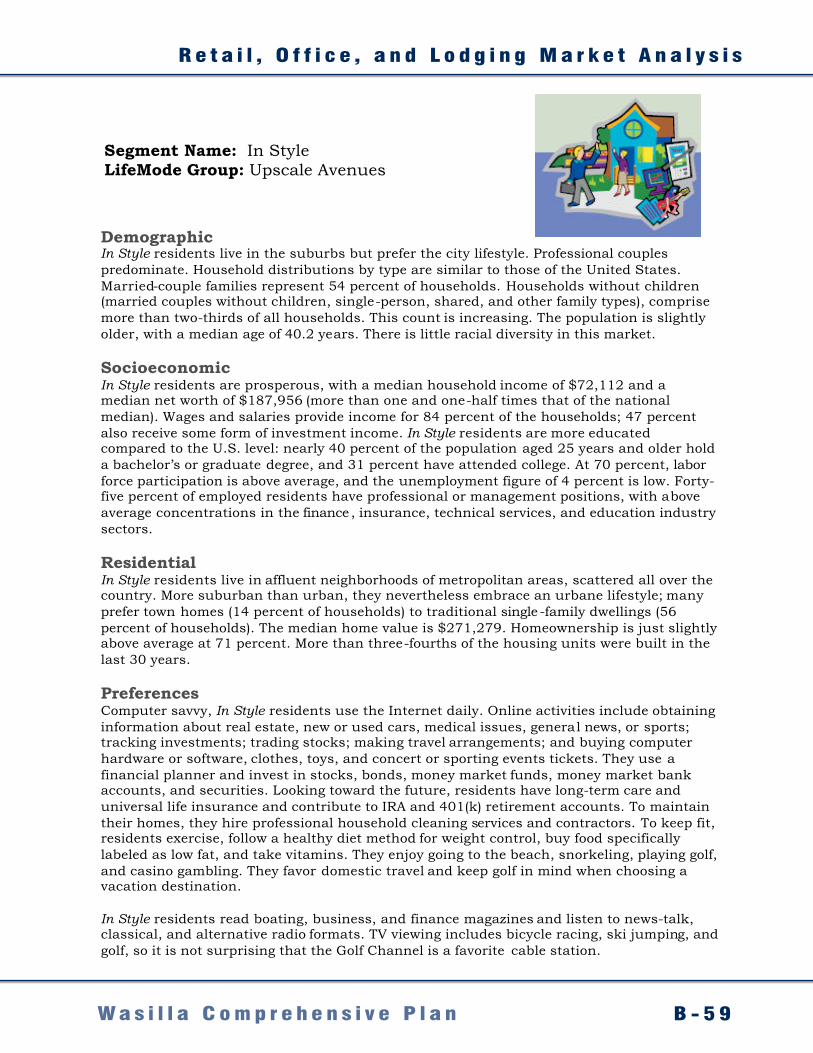
R e t a i l , O f f i c e , a n d L o d g i n g M a r k e t A n a l y s i s
B - 5 9W a s i l l a C o m p r e h e n s i v e P l a nGibbs Planning Group Inc., Wasilla Alaska Report Appendix Page 62
Segment Name: In StyleLifeMode Group: Upscale Avenues
DemographicIn Style residents live in the suburbs but prefer the city lifestyle. Professional couples predominate. Household distributions by type are similar to those of the United States. Married-couple families represent 54 percent of households. Households without children (married couples without children, single-person, shared, and other family types), comprise more than two-thirds of all households. This count is increasing. The population is slightly older, with a median age of 40.2 years. There is little racial diversity in this market. SocioeconomicIn Style residents are prosperous, with a median household income of $72,112 and a median net worth of $187,956 (more than one and one-half times that of the national median). Wages and salaries provide income for 84 percent of the households; 47 percent also receive some form of investment income. In Style residents are more educated compared to the U.S. level: nearly 40 percent of the population aged 25 years and older hold a bachelor’s or graduate degree, and 31 percent have attended college. At 70 percent, labor force participation is above average, and the unemployment figure of 4 percent is low. Forty-five percent of employed residents have professional or management positions, with above average concentrations in the finance , insurance, technical services, and education industry sectors. ResidentialIn Style residents live in affluent neighborhoods of metropolitan areas, scattered all over the country. More suburban than urban, they nevertheless embrace an urbane lifestyle; many prefer town homes (14 percent of households) to traditional single -family dwellings (56 percent of households). The median home value is $271,279. Homeownership is just slightly above average at 71 percent. More than three-fourths of the housing units were built in the last 30 years. PreferencesComputer savvy, In Style residents use the Internet daily. Online activities include obtaining information about real estate, new or used cars, medical issues, general news, or sports; tracking investments; trading stocks; making travel arrangements; and buying computer hardware or software, clothes, toys, and concert or sporting events tickets. They use a financial planner and invest in stocks, bonds, money market funds, money market bank accounts, and securities. Looking toward the future, residents have long-term care and universal life insurance and contribute to IRA and 401(k) retirement accounts. To maintain their homes, they hire professional household cleaning services and contractors. To keep fit, residents exercise, follow a healthy diet method for weight control, buy food specifically labeled as low fat, and take vitamins. They enjoy going to the beach, snorkeling, playing golf, and casino gambling. They favor domestic travel and keep golf in mind when choosing a vacation destination. In Style residents read boating, business, and finance magazines and listen to news-talk, classical, and alternative radio formats. TV viewing includes bicycle racing, ski jumping, and golf, so it is not surprising that the Golf Channel is a favorite cable station.
Gibbs Planning Group Inc., Wasilla Alaska Report Appendix Page 62
Segment Name: In StyleLifeMode Group: Upscale Avenues
DemographicIn Style residents live in the suburbs but prefer the city lifestyle. Professional couples predominate. Household distributions by type are similar to those of the United States. Married-couple families represent 54 percent of households. Households without children (married couples without children, single-person, shared, and other family types), comprise more than two-thirds of all households. This count is increasing. The population is slightly older, with a median age of 40.2 years. There is little racial diversity in this market. SocioeconomicIn Style residents are prosperous, with a median household income of $72,112 and a median net worth of $187,956 (more than one and one-half times that of the national median). Wages and salaries provide income for 84 percent of the households; 47 percent also receive some form of investment income. In Style residents are more educated compared to the U.S. level: nearly 40 percent of the population aged 25 years and older hold a bachelor’s or graduate degree, and 31 percent have attended college. At 70 percent, labor force participation is above average, and the unemployment figure of 4 percent is low. Forty-five percent of employed residents have professional or management positions, with above average concentrations in the finance , insurance, technical services, and education industry sectors. ResidentialIn Style residents live in affluent neighborhoods of metropolitan areas, scattered all over the country. More suburban than urban, they nevertheless embrace an urbane lifestyle; many prefer town homes (14 percent of households) to traditional single -family dwellings (56 percent of households). The median home value is $271,279. Homeownership is just slightly above average at 71 percent. More than three-fourths of the housing units were built in the last 30 years. PreferencesComputer savvy, In Style residents use the Internet daily. Online activities include obtaining information about real estate, new or used cars, medical issues, general news, or sports; tracking investments; trading stocks; making travel arrangements; and buying computer hardware or software, clothes, toys, and concert or sporting events tickets. They use a financial planner and invest in stocks, bonds, money market funds, money market bank accounts, and securities. Looking toward the future, residents have long-term care and universal life insurance and contribute to IRA and 401(k) retirement accounts. To maintain their homes, they hire professional household cleaning services and contractors. To keep fit, residents exercise, follow a healthy diet method for weight control, buy food specifically labeled as low fat, and take vitamins. They enjoy going to the beach, snorkeling, playing golf, and casino gambling. They favor domestic travel and keep golf in mind when choosing a vacation destination. In Style residents read boating, business, and finance magazines and listen to news-talk, classical, and alternative radio formats. TV viewing includes bicycle racing, ski jumping, and golf, so it is not surprising that the Golf Channel is a favorite cable station.
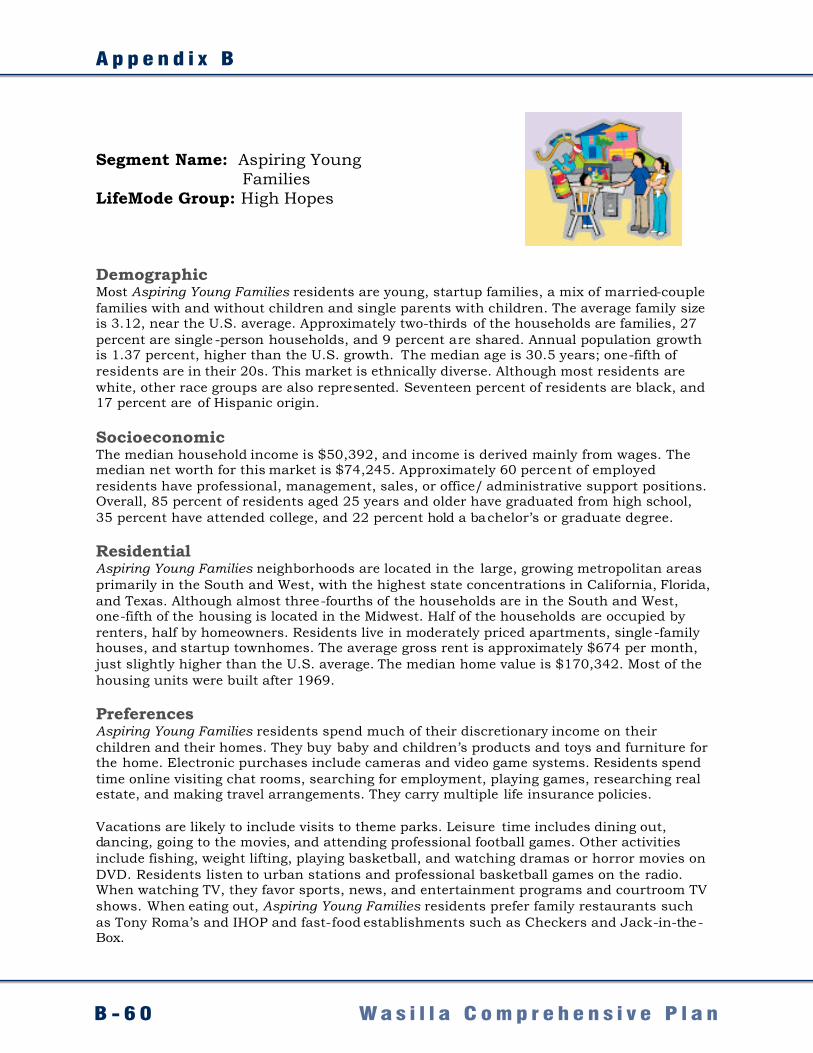
A p p e n d i x B
B - 6 0 W a s i l l a C o m p r e h e n s i v e P l a nGibbs Planning Group Inc., Wasilla Alaska Report Appendix Page 63
Segment Name: Aspiring Young Families
LifeMode Group: High Hopes
DemographicMost Aspiring Young Families residents are young, startup families, a mix of married-couple families with and without children and single parents with children. The average family size is 3.12, near the U.S. average. Approximately two-thirds of the households are families, 27 percent are single -person households, and 9 percent are shared. Annual population growth is 1.37 percent, higher than the U.S. growth. The median age is 30.5 years; one-fifth of residents are in their 20s. This market is ethnically diverse. Although most residents are white, other race groups are also represented. Seventeen percent of residents are black, and 17 percent are of Hispanic origin. SocioeconomicThe median household income is $50,392, and income is derived mainly from wages. The median net worth for this market is $74,245. Approximately 60 percent of employed residents have professional, management, sales, or office/ administrative support positions. Overall, 85 percent of residents aged 25 years and older have graduated from high school, 35 percent have attended college, and 22 percent hold a bachelor’s or graduate degree. ResidentialAspiring Young Families neighborhoods are located in the large, growing metropolitan areas primarily in the South and West, with the highest state concentrations in California, Florida, and Texas. Although almost three-fourths of the households are in the South and West, one-fifth of the housing is located in the Midwest. Half of the households are occupied by renters, half by homeowners. Residents live in moderately priced apartments, single -family houses, and startup townhomes. The average gross rent is approximately $674 per month, just slightly higher than the U.S. average. The median home value is $170,342. Most of the housing units were built after 1969. PreferencesAspiring Young Families residents spend much of their discretionary income on their children and their homes. They buy baby and children’s products and toys and furniture for the home. Electronic purchases include cameras and video game systems. Residents spend time online visiting chat rooms, searching for employment, playing games, researching real estate, and making travel arrangements. They carry multiple life insurance policies. Vacations are likely to include visits to theme parks. Leisure time includes dining out, dancing, going to the movies, and attending professional football games. Other activities include fishing, weight lifting, playing basketball, and watching dramas or horror movies on DVD. Residents listen to urban stations and professional basketball games on the radio. When watching TV, they favor sports, news, and entertainment programs and courtroom TV shows. When eating out, Aspiring Young Families residents prefer family restaurants such as Tony Roma’s and IHOP and fast-food establishments such as Checkers and Jack-in-the-Box.
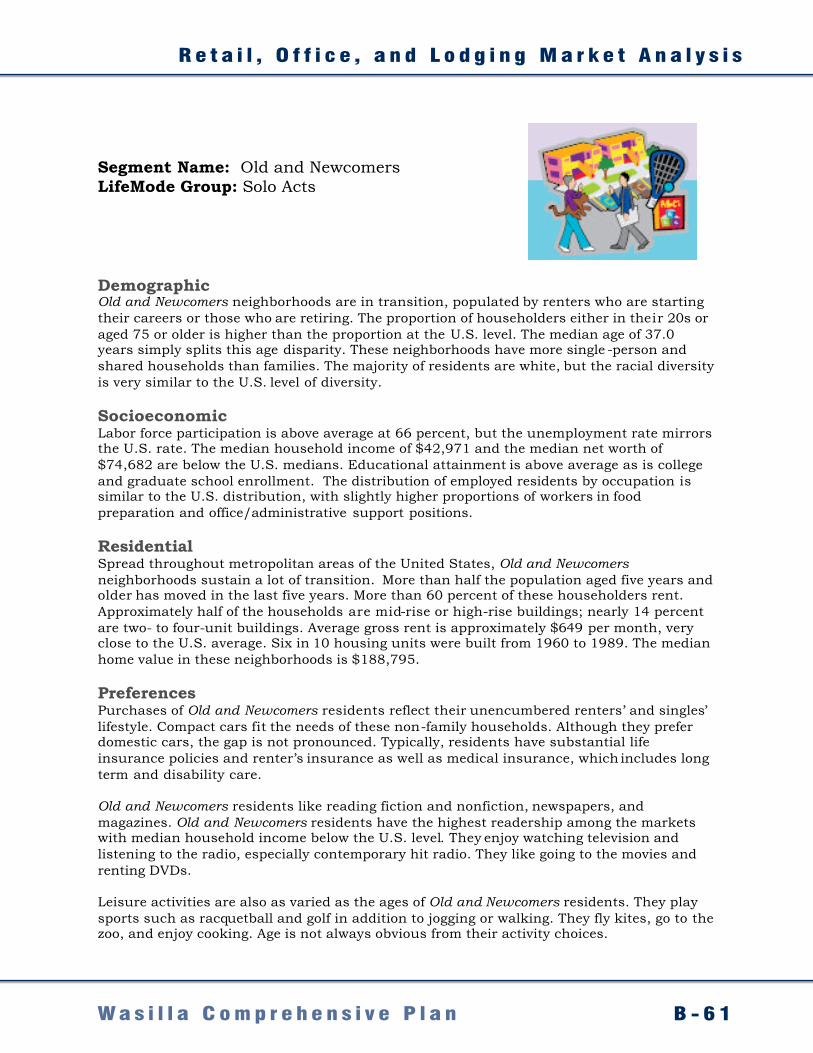
R e t a i l , O f f i c e , a n d L o d g i n g M a r k e t A n a l y s i s
B - 6 1W a s i l l a C o m p r e h e n s i v e P l a nGibbs Planning Group Inc., Wasilla Alaska Report Appendix Page 64
Segment Name: Old and Newcomers LifeMode Group: Solo Acts
DemographicOld and Newcomers neighborhoods are in transition, populated by renters who are starting their careers or those who are retiring. The proportion of householders either in their 20s or aged 75 or older is higher than the proportion at the U.S. level. The median age of 37.0 years simply splits this age disparity. These neighborhoods have more single -person and shared households than families. The majority of residents are white, but the racial diversity is very similar to the U.S. level of diversity. SocioeconomicLabor force participation is above average at 66 percent, but the unemployment rate mirrors the U.S. rate. The median household income of $42,971 and the median net worth of $74,682 are below the U.S. medians. Educational attainment is above average as is college and graduate school enrollment. The distribution of employed residents by occupation is similar to the U.S. distribution, with slightly higher proportions of workers in food preparation and office/administrative support positions. ResidentialSpread throughout metropolitan areas of the United States, Old and Newcomers neighborhoods sustain a lot of transition. More than half the population aged five years and older has moved in the last five years. More than 60 percent of these householders rent. Approximately half of the households are mid-rise or high-rise buildings; nearly 14 percent are two- to four-unit buildings. Average gross rent is approximately $649 per month, very close to the U.S. average. Six in 10 housing units were built from 1960 to 1989. The median home value in these neighborhoods is $188,795. PreferencesPurchases of Old and Newcomers residents reflect their unencumbered renters’ and singles’ lifestyle. Compact cars fit the needs of these non-family households. Although they prefer domestic cars, the gap is not pronounced. Typically, residents have substantial life insurance policies and renter’s insurance as well as medical insurance, which includes long term and disability care. Old and Newcomers residents like reading fiction and nonfiction, newspapers, and magazines. Old and Newcomers residents have the highest readership among the markets with median household income below the U.S. level. They enjoy watching television and listening to the radio, especially contemporary hit radio. They like going to the movies and renting DVDs. Leisure activities are also as varied as the ages of Old and Newcomers residents. They play sports such as racquetball and golf in addition to jogging or walking. They fly kites, go to the zoo, and enjoy cooking. Age is not always obvious from their activity choices.
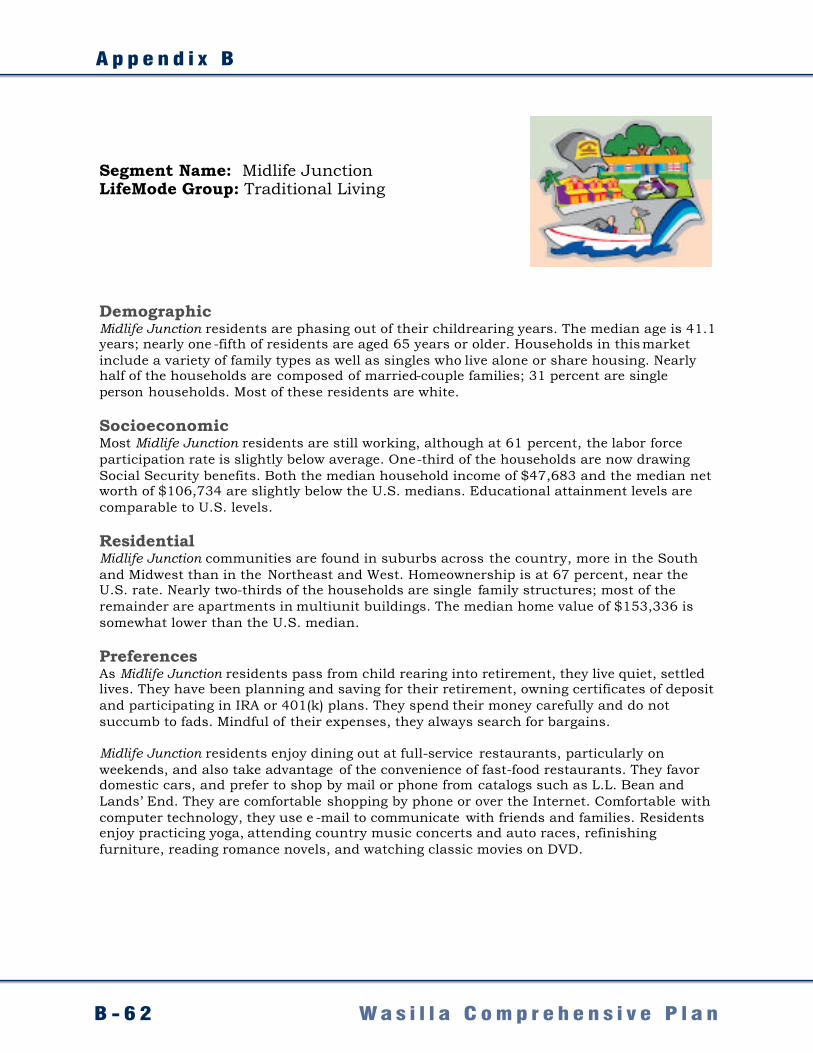
A p p e n d i x B
B - 6 2 W a s i l l a C o m p r e h e n s i v e P l a n
Gibbs Planning Group Inc., Wasilla Alaska Report Appendix Page 65
Segment Name: Midlife JunctionLifeMode Group: Traditional Living
DemographicMidlife Junction residents are phasing out of their childrearing years. The median age is 41.1 years; nearly one -fifth of residents are aged 65 years or older. Households in this market include a variety of family types as well as singles who live alone or share housing. Nearly half of the households are composed of married-couple families; 31 percent are single person households. Most of these residents are white. SocioeconomicMost Midlife Junction residents are still working, although at 61 percent, the labor force participation rate is slightly below average. One-third of the households are now drawing Social Security benefits. Both the median household income of $47,683 and the median net worth of $106,734 are slightly below the U.S. medians. Educational attainment levels are comparable to U.S. levels. ResidentialMidlife Junction communities are found in suburbs across the country, more in the South and Midwest than in the Northeast and West. Homeownership is at 67 percent, near the U.S. rate. Nearly two-thirds of the households are single family structures; most of the remainder are apartments in multiunit buildings. The median home value of $153,336 is somewhat lower than the U.S. median. PreferencesAs Midlife Junction residents pass from child rearing into retirement, they live quiet, settled lives. They have been planning and saving for their retirement, owning certificates of deposit and participating in IRA or 401(k) plans. They spend their money carefully and do not succumb to fads. Mindful of their expenses, they always search for bargains. Midlife Junction residents enjoy dining out at full-service restaurants, particularly on weekends, and also take advantage of the convenience of fast-food restaurants. They favor domestic cars, and prefer to shop by mail or phone from catalogs such as L.L. Bean and Lands’ End. They are comfortable shopping by phone or over the Internet. Comfortable with computer technology, they use e -mail to communicate with friends and families. Residents enjoy practicing yoga, attending country music concerts and auto races, refinishing furniture, reading romance novels, and watching classic movies on DVD.
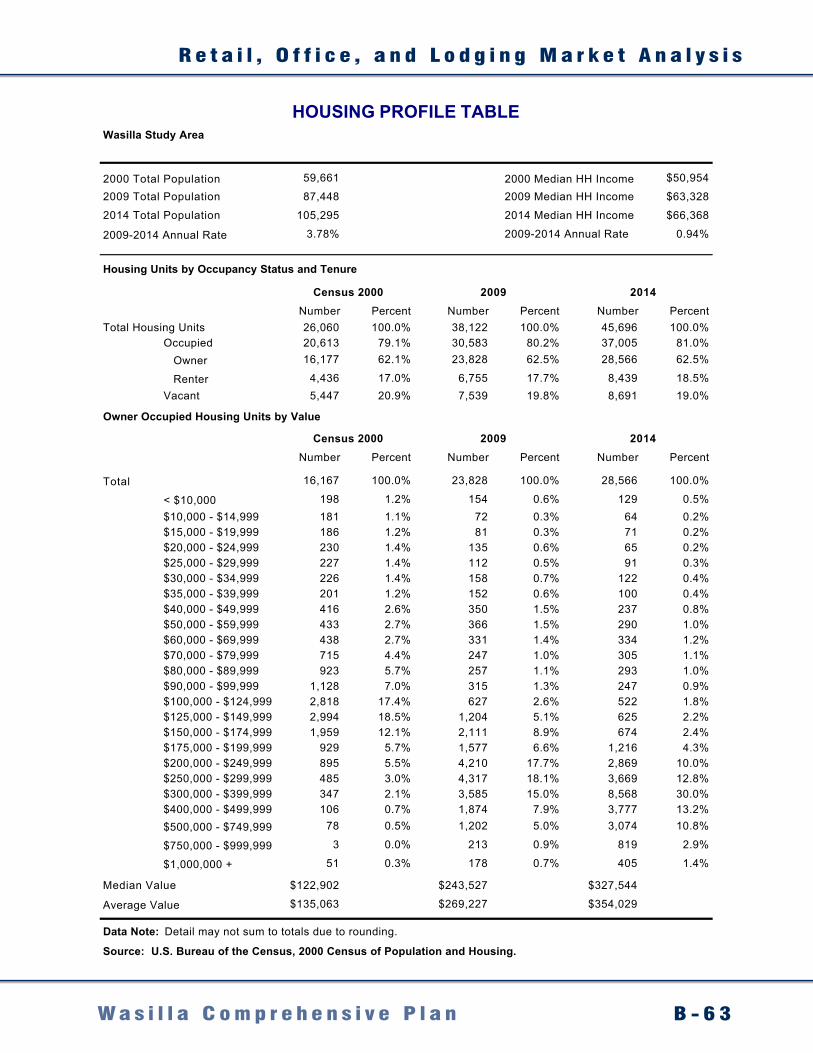
R e t a i l , O f f i c e , a n d L o d g i n g M a r k e t A n a l y s i s
B - 6 3W a s i l l a C o m p r e h e n s i v e P l a n
Wasilla Study Area
2000 Total Population 59,661 2000 Median HH Income $50,954
2009 Total Population 87,448 2009 Median HH Income $63,328
2014 Total Population 105,295 2014 Median HH Income $66,368
2009-2014 Annual Rate 3.78% 2009-2014 Annual Rate 0.94%
Housing Units by Occupancy Status and Tenure
Number Percent Number Percent Number PercentTotal Housing Units 26,060 100.0% 38,122 100.0% 45,696 100.0%
Occupied 20,613 79.1% 30,583 80.2% 37,005 81.0% Owner 16,177 62.1% 23,828 62.5% 28,566 62.5%
Renter 4,436 17.0% 6,755 17.7% 8,439 18.5%Vacant 5,447 20.9% 7,539 19.8% 8,691 19.0%
Owner Occupied Housing Units by Value
Number Percent Number Percent Number Percent
Total 16,167 100.0% 23,828 100.0% 28,566 100.0%
< $10,000 198 1.2% 154 0.6% 129 0.5%$10,000 - $14,999 181 1.1% 72 0.3% 64 0.2%$15,000 - $19,999 186 1.2% 81 0.3% 71 0.2%$20,000 - $24,999 230 1.4% 135 0.6% 65 0.2%$25,000 - $29,999 227 1.4% 112 0.5% 91 0.3%$30,000 - $34,999 226 1.4% 158 0.7% 122 0.4%$35,000 - $39,999 201 1.2% 152 0.6% 100 0.4%$40,000 - $49,999 416 2.6% 350 1.5% 237 0.8%$50,000 - $59,999 433 2.7% 366 1.5% 290 1.0%$60,000 - $69,999 438 2.7% 331 1.4% 334 1.2%$70,000 - $79,999 715 4.4% 247 1.0% 305 1.1%$80,000 - $89,999 923 5.7% 257 1.1% 293 1.0%$90,000 - $99,999 1,128 7.0% 315 1.3% 247 0.9%$100,000 - $124,999 2,818 17.4% 627 2.6% 522 1.8%$125,000 - $149,999 2,994 18.5% 1,204 5.1% 625 2.2%$150,000 - $174,999 1,959 12.1% 2,111 8.9% 674 2.4%$175,000 - $199,999 929 5.7% 1,577 6.6% 1,216 4.3%$200,000 - $249,999 895 5.5% 4,210 17.7% 2,869 10.0%$250,000 - $299,999 485 3.0% 4,317 18.1% 3,669 12.8%$300,000 - $399,999 347 2.1% 3,585 15.0% 8,568 30.0%$400,000 - $499,999 106 0.7% 1,874 7.9% 3,777 13.2%$500,000 - $749,999 78 0.5% 1,202 5.0% 3,074 10.8%
$750,000 - $999,999 3 0.0% 213 0.9% 819 2.9%
$1,000,000 + 51 0.3% 178 0.7% 405 1.4%
Median Value $122,902 $243,527 $327,544
Average Value $135,063 $269,227 $354,029
Source: U.S. Bureau of the Census, 2000 Census of Population and Housing.
Census 2000 2009 2014
HOUSING PROFILE TABLE
Data Note: Detail may not sum to totals due to rounding.
Census 2000 2009 2014
Gibbs Planning Group Inc., Wasilla Alaska Report Appendix Page 66
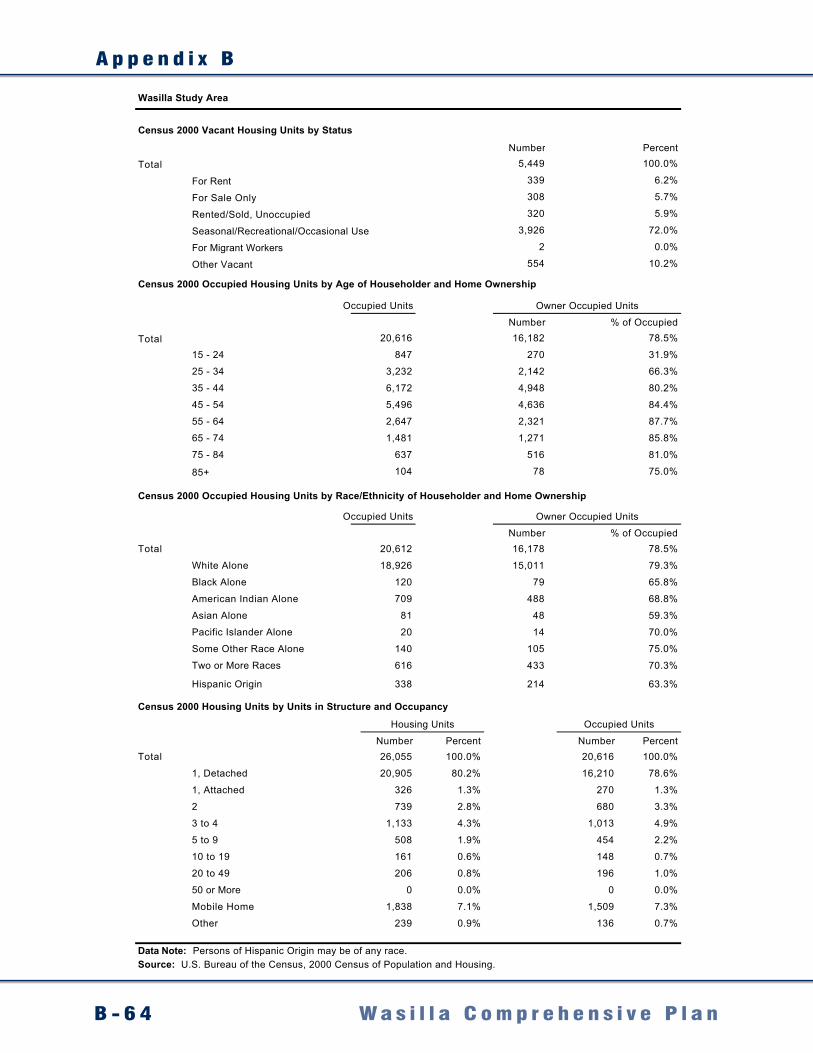
A p p e n d i x B
B - 6 4 W a s i l l a C o m p r e h e n s i v e P l a n
Wasilla Study Area
Census 2000 Vacant Housing Units by Status
Number Percent
Total 5,449 100.0%
For Rent 339 6.2%
For Sale Only 308 5.7%
Rented/Sold, Unoccupied 320 5.9%
Seasonal/Recreational/Occasional Use 3,926 72.0%
For Migrant Workers 2 0.0%
Other Vacant 554 10.2%
Census 2000 Occupied Housing Units by Age of Householder and Home Ownership
Occupied Units
Number % of Occupied
Total 20,616 16,182 78.5%
15 - 24 847 270 31.9%
25 - 34 3,232 2,142 66.3%
35 - 44 6,172 4,948 80.2%
45 - 54 5,496 4,636 84.4%
55 - 64 2,647 2,321 87.7%
65 - 74 1,481 1,271 85.8%
75 - 84 637 516 81.0%
85+ 104 78 75.0%
Census 2000 Occupied Housing Units by Race/Ethnicity of Householder and Home Ownership
Occupied Units
Number % of OccupiedTotal 20,612 16,178 78.5%
White Alone 18,926 15,011 79.3%
Black Alone 120 79 65.8%
American Indian Alone 709 488 68.8%
Asian Alone 81 48 59.3%
Pacific Islander Alone 20 14 70.0%
Some Other Race Alone 140 105 75.0%
Two or More Races 616 433 70.3%
Hispanic Origin 338 214 63.3%
Census 2000 Housing Units by Units in Structure and Occupancy
Number Percent Number PercentTotal 26,055 100.0% 20,616 100.0%
1, Detached 20,905 80.2% 16,210 78.6%
1, Attached 326 1.3% 270 1.3%
2 739 2.8% 680 3.3%
3 to 4 1,133 4.3% 1,013 4.9%
5 to 9 508 1.9% 454 2.2%
10 to 19 161 0.6% 148 0.7%
20 to 49 206 0.8% 196 1.0%
50 or More 0 0.0% 0 0.0%
Mobile Home 1,838 7.1% 1,509 7.3%
Other 239 0.9% 136 0.7%
Data Note: Persons of Hispanic Origin may be of any race.Source: U.S. Bureau of the Census, 2000 Census of Population and Housing.
Housing Units Occupied Units
Owner Occupied Units
Owner Occupied Units
Gibbs Planning Group Inc., Wasilla Alaska Report Appendix Page 66
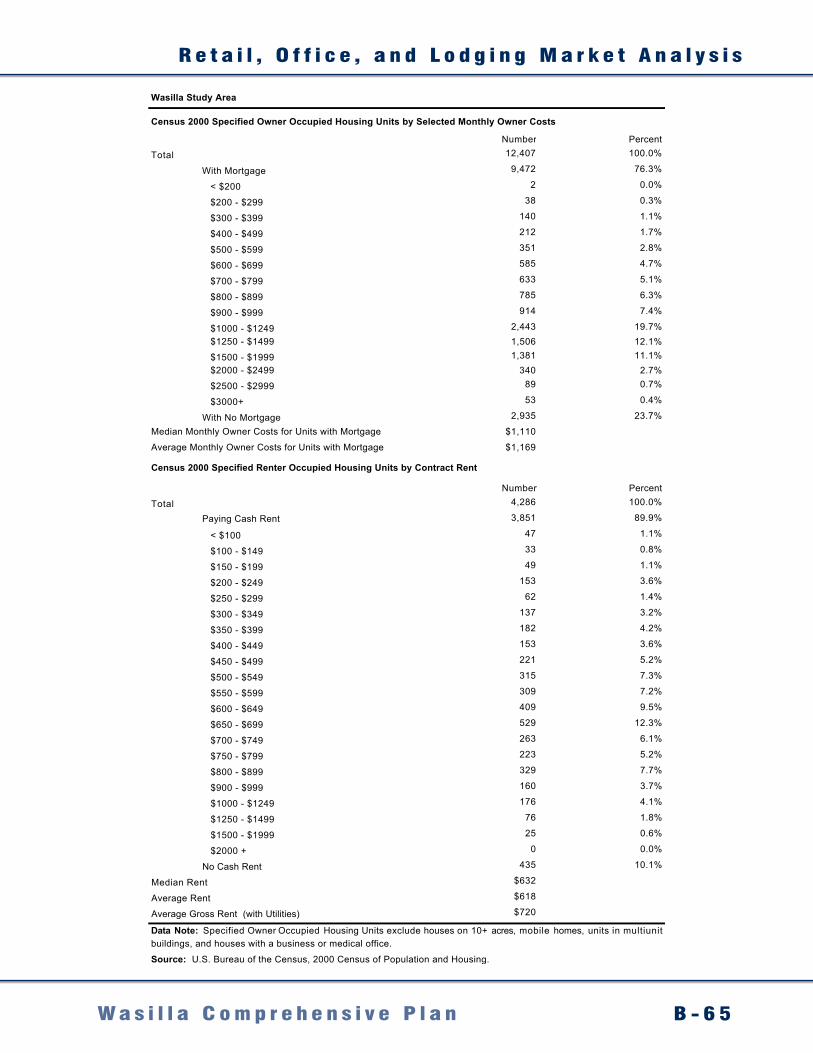
R e t a i l , O f f i c e , a n d L o d g i n g M a r k e t A n a l y s i s
B - 6 5W a s i l l a C o m p r e h e n s i v e P l a n
Wasilla Study Area
Census 2000 Specified Owner Occupied Housing Units by Selected Monthly Owner Costs
Number Percent
Total 12,407 100.0%
With Mortgage 9,472 76.3%
< $200 2 0.0%
$200 - $299 38 0.3%
$300 - $399 140 1.1%
$400 - $499 212 1.7%
$500 - $599 351 2.8%
$600 - $699 585 4.7%
$700 - $799 633 5.1%
$800 - $899 785 6.3%
$900 - $999 914 7.4%
$1000 - $1249 2,443 19.7% $1250 - $1499 1,506 12.1%
$1500 - $1999 1,381 11.1% $2000 - $2499 340 2.7%
$2500 - $2999 89 0.7%
$3000+ 53 0.4%
With No Mortgage 2,935 23.7%
Median Monthly Owner Costs for Units with Mortgage $1,110
Average Monthly Owner Costs for Units with Mortgage $1,169
Census 2000 Specified Renter Occupied Housing Units by Contract Rent
Number Percent
Total 4,286 100.0%
Paying Cash Rent 3,851 89.9%
< $100 47 1.1%
$100 - $149 33 0.8%
$150 - $199 49 1.1%
$200 - $249 153 3.6%
$250 - $299 62 1.4%
$300 - $349 137 3.2%
$350 - $399 182 4.2%
$400 - $449 153 3.6%
$450 - $499 221 5.2%
$500 - $549 315 7.3%
$550 - $599 309 7.2%
$600 - $649 409 9.5%
$650 - $699 529 12.3%
$700 - $749 263 6.1%
$750 - $799 223 5.2%
$800 - $899 329 7.7%
$900 - $999 160 3.7%
$1000 - $1249 176 4.1%
$1250 - $1499 76 1.8%
$1500 - $1999 25 0.6%
$2000 + 0 0.0%
No Cash Rent 435 10.1%
Median Rent $632
Average Rent $618
Average Gross Rent (with Utilities) $720
Source: U.S. Bureau of the Census, 2000 Census of Population and Housing.
Data Note: Specified Owner Occupied Housing Units exclude houses on 10+ acres, mobile homes, units in multiunitbuildings, and houses with a business or medical office.
Gibbs Planning Group Inc., Wasilla Alaska Report Appendix Page 66
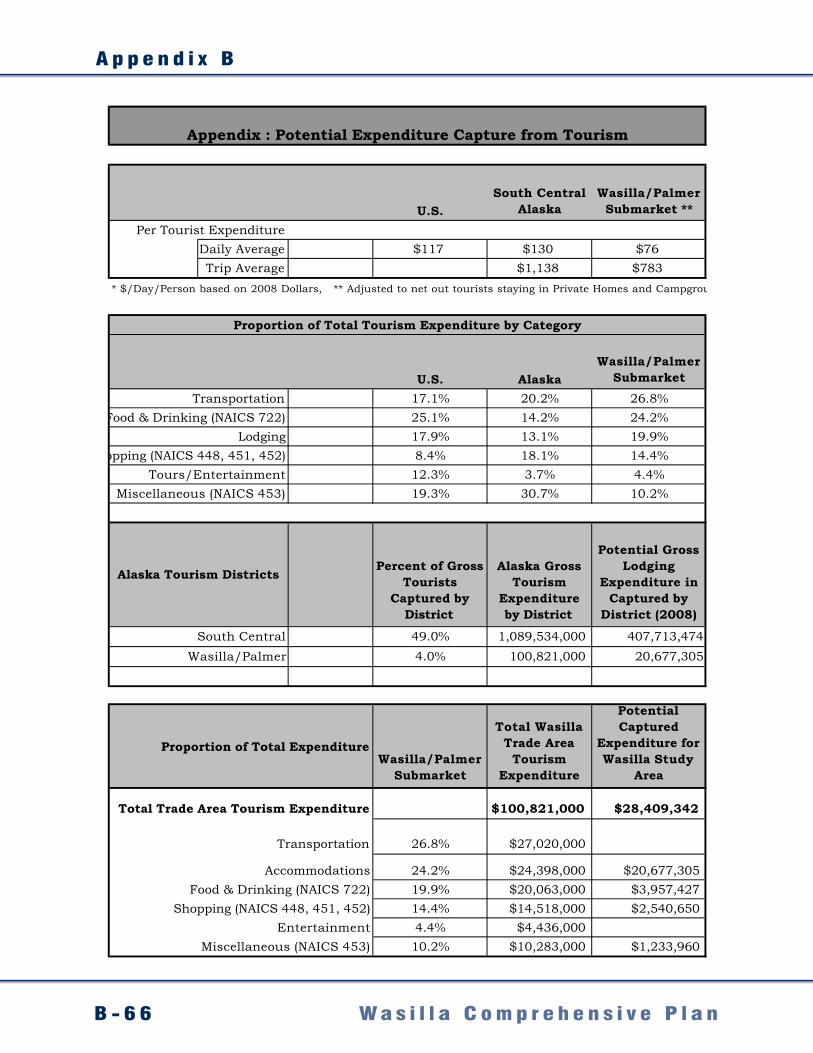
A p p e n d i x B
B - 6 6 W a s i l l a C o m p r e h e n s i v e P l a n
U.S.South Central
AlaskaWasilla/Palmer
Submarket **Per Tourist Expenditure
Daily Average $117 $130 $76Trip Average $1,138 $783
* $/Day/Person based on 2008 Dollars, ** Adjusted to net out tourists staying in Private Homes and Campgrounds
U.S. AlaskaWasilla/Palmer
SubmarketTransportation 17.1% 20.2% 26.8%
Food & Drinking (NAICS 722) 25.1% 14.2% 24.2%Lodging 17.9% 13.1% 19.9%
Shopping (NAICS 448, 451, 452) 8.4% 18.1% 14.4%Tours/Entertainment 12.3% 3.7% 4.4%
Miscellaneous (NAICS 453) 19.3% 30.7% 10.2%
49.0% 1,089,534,000 407,713,4744.0% 100,821,000 20,677,305
Proportion of Total ExpenditureWasilla/Palmer
Submarket
Total Wasilla Trade Area
TourismExpenditure
PotentialCaptured
Expenditure for Wasilla Study
Area
Total Trade Area Tourism Expenditure $100,821,000 $28,409,342
Transportation 26.8% $27,020,000
Accommodations 24.2% $24,398,000 $20,677,305Food & Drinking (NAICS 722) 19.9% $20,063,000 $3,957,427
Shopping (NAICS 448, 451, 452) 14.4% $14,518,000 $2,540,650Entertainment 4.4% $4,436,000
Miscellaneous (NAICS 453) 10.2% $10,283,000 $1,233,960
Gibbs Planning Group Inc., Wasilla Alaska Report Appendix Page 69
South Central
Potential Gross Lodging
Expenditure in Captured by
District (2008)
Appendix : Potential Expenditure Capture from Tourism
Proportion of Total Tourism Expenditure by Category
Alaska Tourism DistrictsPercent of Gross
TouristsCaptured by
District
Alaska Gross Tourism
Expenditureby District
Wasilla/Palmer
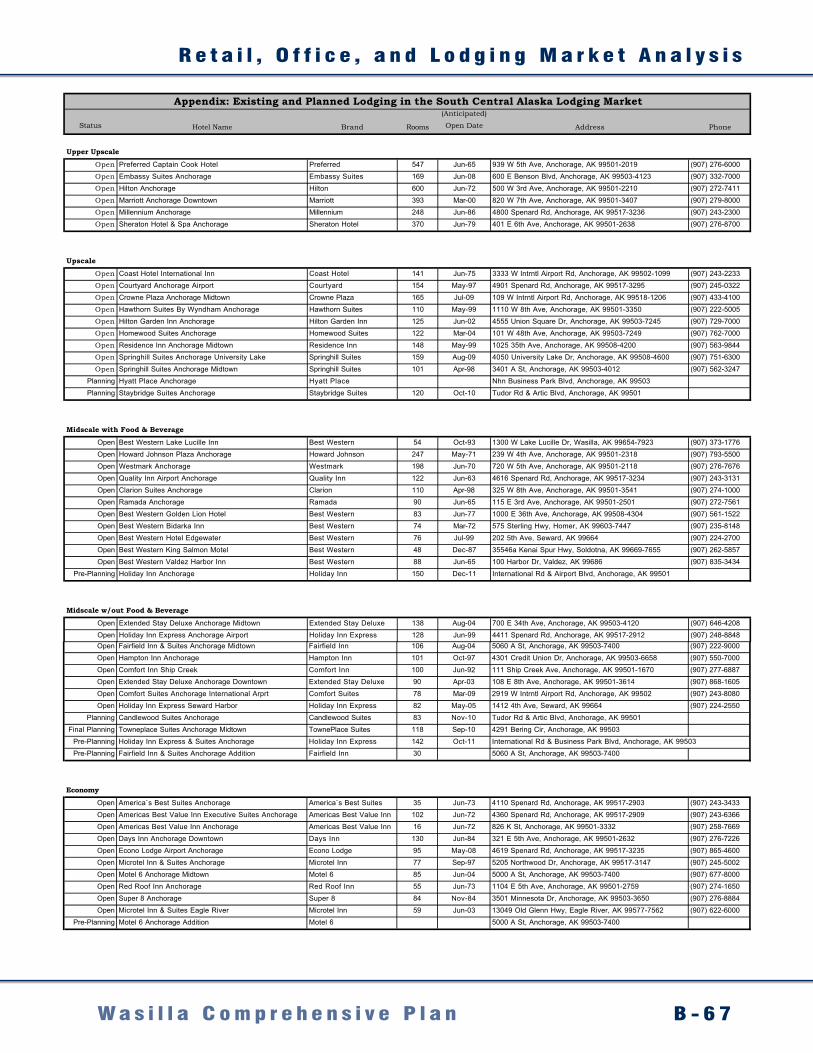
R e t a i l , O f f i c e , a n d L o d g i n g M a r k e t A n a l y s i s
B - 6 7W a s i l l a C o m p r e h e n s i v e P l a n
Status Hotel Name Brand Rooms
(Anticipated)
Open Date Address Phone
Upper Upscale
Open Preferred Captain Cook Hotel Preferred 547 Jun-65 939 W 5th Ave, Anchorage, AK 99501-2019 (907) 276-6000Open Embassy Suites Anchorage Embassy Suites 169 Jun-08 600 E Benson Blvd, Anchorage, AK 99503-4123 (907) 332-7000Open Hilton Anchorage Hilton 600 Jun-72 500 W 3rd Ave, Anchorage, AK 99501-2210 (907) 272-7411Open Marriott Anchorage Downtown Marriott 393 Mar-00 820 W 7th Ave, Anchorage, AK 99501-3407 (907) 279-8000Open Millennium Anchorage Millennium 248 Jun-86 4800 Spenard Rd, Anchorage, AK 99517-3236 (907) 243-2300Open Sheraton Hotel & Spa Anchorage Sheraton Hotel 370 Jun-79 401 E 6th Ave, Anchorage, AK 99501-2638 (907) 276-8700
Upscale
Open Coast Hotel International Inn Coast Hotel 141 Jun-75 3333 W Intrntl Airport Rd, Anchorage, AK 99502-1099 (907) 243-2233Open Courtyard Anchorage Airport Courtyard 154 May-97 4901 Spenard Rd, Anchorage, AK 99517-3295 (907) 245-0322Open Crowne Plaza Anchorage Midtown Crowne Plaza 165 Jul-09 109 W Intrntl Airport Rd, Anchorage, AK 99518-1206 (907) 433-4100Open Hawthorn Suites By Wyndham Anchorage Hawthorn Suites 110 May-99 1110 W 8th Ave, Anchorage, AK 99501-3350 (907) 222-5005Open Hilton Garden Inn Anchorage Hilton Garden Inn 125 Jun-02 4555 Union Square Dr, Anchorage, AK 99503-7245 (907) 729-7000Open Homewood Suites Anchorage Homewood Suites 122 Mar-04 101 W 48th Ave, Anchorage, AK 99503-7249 (907) 762-7000Open Residence Inn Anchorage Midtown Residence Inn 148 May-99 1025 35th Ave, Anchorage, AK 99508-4200 (907) 563-9844Open Springhill Suites Anchorage University Lake Springhill Suites 159 Aug-09 4050 University Lake Dr, Anchorage, AK 99508-4600 (907) 751-6300Open Springhill Suites Anchorage Midtown Springhill Suites 101 Apr-98 3401 A St, Anchorage, AK 99503-4012 (907) 562-3247
Planning Hyatt Place Anchorage Hyatt Place Nhn Business Park Blvd, Anchorage, AK 99503Planning Staybridge Suites Anchorage Staybridge Suites 120 Oct-10 Tudor Rd & Artic Blvd, Anchorage, AK 99501
Midscale with Food & Beverage
Open Best Western Lake Lucille Inn Best Western 54 Oct-93 1300 W Lake Lucille Dr, Wasilla, AK 99654-7923 (907) 373-1776Open Howard Johnson Plaza Anchorage Howard Johnson 247 May-71 239 W 4th Ave, Anchorage, AK 99501-2318 (907) 793-5500Open Westmark Anchorage Westmark 198 Jun-70 720 W 5th Ave, Anchorage, AK 99501-2118 (907) 276-7676Open Quality Inn Airport Anchorage Quality Inn 122 Jun-63 4616 Spenard Rd, Anchorage, AK 99517-3234 (907) 243-3131Open Clarion Suites Anchorage Clarion 110 Apr-98 325 W 8th Ave, Anchorage, AK 99501-3541 (907) 274-1000Open Ramada Anchorage Ramada 90 Jun-65 115 E 3rd Ave, Anchorage, AK 99501-2501 (907) 272-7561Open Best Western Golden Lion Hotel Best Western 83 Jun-77 1000 E 36th Ave, Anchorage, AK 99508-4304 (907) 561-1522Open Best Western Bidarka Inn Best Western 74 Mar-72 575 Sterling Hwy, Homer, AK 99603-7447 (907) 235-8148Open Best Western Hotel Edgewater Best Western 76 Jul-99 202 5th Ave, Seward, AK 99664 (907) 224-2700Open Best Western King Salmon Motel Best Western 48 Dec-87 35546a Kenai Spur Hwy, Soldotna, AK 99669-7655 (907) 262-5857Open Best Western Valdez Harbor Inn Best Western 88 Jun-65 100 Harbor Dr, Valdez, AK 99686 (907) 835-3434
Pre-Planning Holiday Inn Anchorage Holiday Inn 150 Dec-11 International Rd & Airport Blvd, Anchorage, AK 99501
Midscale w/out Food & Beverage
Open Extended Stay Deluxe Anchorage Midtown Extended Stay Deluxe 138 Aug-04 700 E 34th Ave, Anchorage, AK 99503-4120 (907) 646-4208Open Holiday Inn Express Anchorage Airport Holiday Inn Express 128 Jun-99 4411 Spenard Rd, Anchorage, AK 99517-2912 (907) 248-8848
Appendix: Existing and Planned Lodging in the South Central Alaska Lodging Market
Gibbs Planning Group Inc., Wasilla Alaska Report Appendix Page 70
Status Hotel Name Brand Rooms
(Anticipated)
Open Date Address Phone
Appendix: Existing and Planned Lodging in the South Central Alaska Lodging Market
Open Fairfield Inn & Suites Anchorage Midtown Fairfield Inn 106 Aug-04 5060 A St, Anchorage, AK 99503-7400 (907) 222-9000Open Hampton Inn Anchorage Hampton Inn 101 Oct-97 4301 Credit Union Dr, Anchorage, AK 99503-6658 (907) 550-7000Open Comfort Inn Ship Creek Comfort Inn 100 Jun-92 111 Ship Creek Ave, Anchorage, AK 99501-1670 (907) 277-6887Open Extended Stay Deluxe Anchorage Downtown Extended Stay Deluxe 90 Apr-03 108 E 8th Ave, Anchorage, AK 99501-3614 (907) 868-1605Open Comfort Suites Anchorage International Arprt Comfort Suites 78 Mar-09 2919 W Intrntl Airport Rd, Anchorage, AK 99502 (907) 243-8080Open Holiday Inn Express Seward Harbor Holiday Inn Express 82 May-05 1412 4th Ave, Seward, AK 99664 (907) 224-2550
Planning Candlewood Suites Anchorage Candlewood Suites 83 Nov-10 Tudor Rd & Artic Blvd, Anchorage, AK 99501Final Planning Towneplace Suites Anchorage Midtown TownePlace Suites 118 Sep-10 4291 Bering Cir, Anchorage, AK 99503
Pre-Planning Holiday Inn Express & Suites Anchorage Holiday Inn Express 142 Oct-11 International Rd & Business Park Blvd, Anchorage, AK 99503Pre-Planning Fairfield Inn & Suites Anchorage Addition Fairfield Inn 30 5060 A St, Anchorage, AK 99503-7400
Economy
Open America`s Best Suites Anchorage America`s Best Suites 35 Jun-73 4110 Spenard Rd, Anchorage, AK 99517-2903 (907) 243-3433Open Americas Best Value Inn Executive Suites Anchorage Americas Best Value Inn 102 Jun-72 4360 Spenard Rd, Anchorage, AK 99517-2909 (907) 243-6366Open Americas Best Value Inn Anchorage Americas Best Value Inn 16 Jun-72 826 K St, Anchorage, AK 99501-3332 (907) 258-7669Open Days Inn Anchorage Downtown Days Inn 130 Jun-84 321 E 5th Ave, Anchorage, AK 99501-2632 (907) 276-7226Open Econo Lodge Airport Anchorage Econo Lodge 95 May-08 4619 Spenard Rd, Anchorage, AK 99517-3235 (907) 865-4600Open Microtel Inn & Suites Anchorage Microtel Inn 77 Sep-97 5205 Northwood Dr, Anchorage, AK 99517-3147 (907) 245-5002Open Motel 6 Anchorage Midtown Motel 6 85 Jun-04 5000 A St, Anchorage, AK 99503-7400 (907) 677-8000Open Red Roof Inn Anchorage Red Roof Inn 55 Jun-73 1104 E 5th Ave, Anchorage, AK 99501-2759 (907) 274-1650Open Super 8 Anchorage Super 8 84 Nov-84 3501 Minnesota Dr, Anchorage, AK 99503-3650 (907) 276-8884Open Microtel Inn & Suites Eagle River Microtel Inn 59 Jun-03 13049 Old Glenn Hwy, Eagle River, AK 99577-7562 (907) 622-6000
Pre-Planning Motel 6 Anchorage Addition Motel 6 5000 A St, Anchorage, AK 99503-7400
Independents
Open Grand View Inn & Suites N/A 300 Jun-04 2900 E Parks Hwy, Wasilla, AK 99654-7362 (907) 357-7666Open Alaskan View Motel N/A 26 Oct-98 2650 E Parks Hwy, Wasilla, AK 99687-7359 (907) 376-6787Open Mat Su Resort N/A 15 Jun-80 1850 Bogard Rd, Wasilla, AK 99654-6534 (907) 376-3228Open Valley Hotel N/A 33 Jun-48 606 S Alaska St, Palmer, AK 99645-6394 (907) 745-3330Open Alaska Choice Inn N/A 30 1930 Glenn Hwy, Palmer, AK 99645-6769 (907) 745-1505Open Golden Miner`s Hotel N/A 28 Jun-80 918 S Colony Way, Palmer, AK 99645-6928 (907) 745-6160Open Knik River Lodge N/A 15 29979 E Knik River Rd, Palmer, AK 99645-7311 (907) 745-5002Open Anchor River Inn N/A 20 Jun-65 Mile 157 Sterling Hwy, Anchor Point, AK 99556 (907) 235-8531Open Inlet Tower Hotel & Suites N/A 176 Jun-89 1200 L St, Anchorage, AK 99501-4265 (907) 276-0110Open Dimond Center Hotel N/A 109 Jun-02 700 E Dimond Blvd, Anchorage, AK 99515-2003 (907) 770-5000Open Mush Inn Motel N/A 94 Jun-60 333 Concrete St, Anchorage, AK 99501-2822 (907) 277-4554Open Puffin Inn N/A 85 Jun-55 4400 Spenard Rd, Anchorage, AK 99517-2914 (907) 243-4044Open Inlet Inn N/A 83 Jun-68 539 H St, Anchorage, AK 99501-2120 (907) 277-5541Open Travel Inn N/A 70 Jun-65 720 Gambell St, Anchorage, AK 99501-3755 (907) 277-1511
Gibbs Planning Group Inc., Wasilla Alaska Report Appendix Page 71
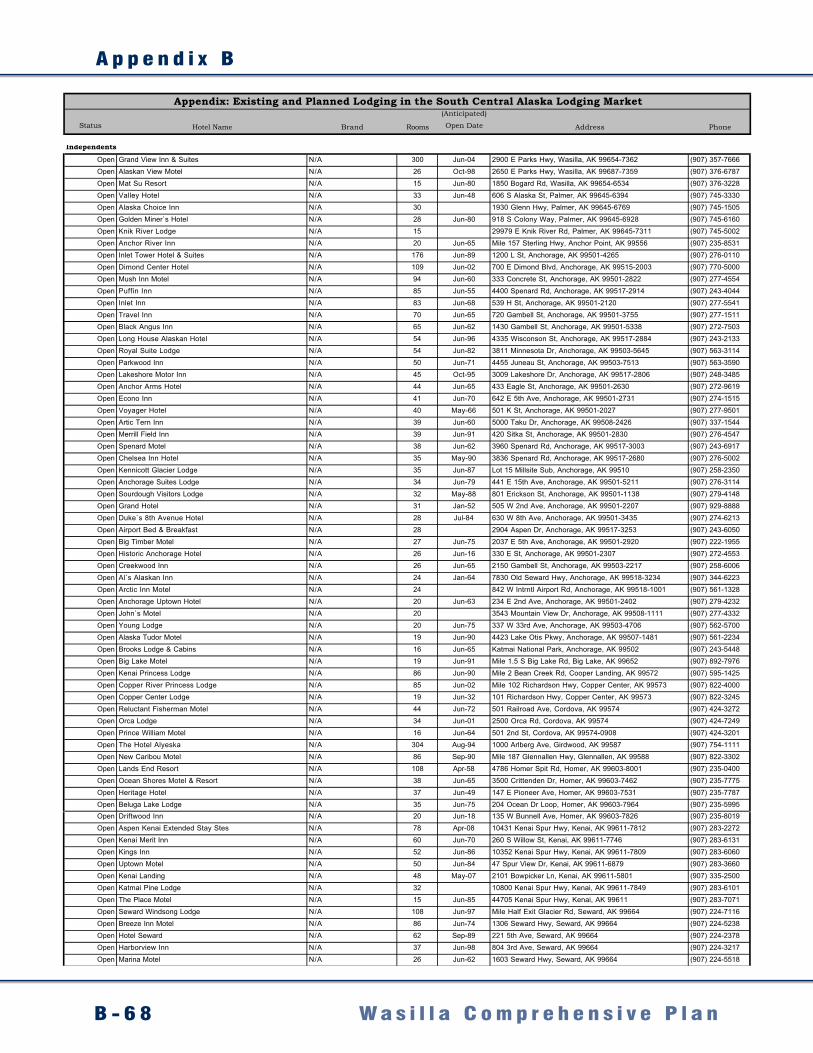
A p p e n d i x B
B - 6 8 W a s i l l a C o m p r e h e n s i v e P l a n
Status Hotel Name Brand Rooms
(Anticipated)
Open Date Address Phone
Upper Upscale
Open Preferred Captain Cook Hotel Preferred 547 Jun-65 939 W 5th Ave, Anchorage, AK 99501-2019 (907) 276-6000Open Embassy Suites Anchorage Embassy Suites 169 Jun-08 600 E Benson Blvd, Anchorage, AK 99503-4123 (907) 332-7000Open Hilton Anchorage Hilton 600 Jun-72 500 W 3rd Ave, Anchorage, AK 99501-2210 (907) 272-7411Open Marriott Anchorage Downtown Marriott 393 Mar-00 820 W 7th Ave, Anchorage, AK 99501-3407 (907) 279-8000Open Millennium Anchorage Millennium 248 Jun-86 4800 Spenard Rd, Anchorage, AK 99517-3236 (907) 243-2300Open Sheraton Hotel & Spa Anchorage Sheraton Hotel 370 Jun-79 401 E 6th Ave, Anchorage, AK 99501-2638 (907) 276-8700
Upscale
Open Coast Hotel International Inn Coast Hotel 141 Jun-75 3333 W Intrntl Airport Rd, Anchorage, AK 99502-1099 (907) 243-2233Open Courtyard Anchorage Airport Courtyard 154 May-97 4901 Spenard Rd, Anchorage, AK 99517-3295 (907) 245-0322Open Crowne Plaza Anchorage Midtown Crowne Plaza 165 Jul-09 109 W Intrntl Airport Rd, Anchorage, AK 99518-1206 (907) 433-4100Open Hawthorn Suites By Wyndham Anchorage Hawthorn Suites 110 May-99 1110 W 8th Ave, Anchorage, AK 99501-3350 (907) 222-5005Open Hilton Garden Inn Anchorage Hilton Garden Inn 125 Jun-02 4555 Union Square Dr, Anchorage, AK 99503-7245 (907) 729-7000Open Homewood Suites Anchorage Homewood Suites 122 Mar-04 101 W 48th Ave, Anchorage, AK 99503-7249 (907) 762-7000Open Residence Inn Anchorage Midtown Residence Inn 148 May-99 1025 35th Ave, Anchorage, AK 99508-4200 (907) 563-9844Open Springhill Suites Anchorage University Lake Springhill Suites 159 Aug-09 4050 University Lake Dr, Anchorage, AK 99508-4600 (907) 751-6300Open Springhill Suites Anchorage Midtown Springhill Suites 101 Apr-98 3401 A St, Anchorage, AK 99503-4012 (907) 562-3247
Planning Hyatt Place Anchorage Hyatt Place Nhn Business Park Blvd, Anchorage, AK 99503Planning Staybridge Suites Anchorage Staybridge Suites 120 Oct-10 Tudor Rd & Artic Blvd, Anchorage, AK 99501
Midscale with Food & Beverage
Open Best Western Lake Lucille Inn Best Western 54 Oct-93 1300 W Lake Lucille Dr, Wasilla, AK 99654-7923 (907) 373-1776Open Howard Johnson Plaza Anchorage Howard Johnson 247 May-71 239 W 4th Ave, Anchorage, AK 99501-2318 (907) 793-5500Open Westmark Anchorage Westmark 198 Jun-70 720 W 5th Ave, Anchorage, AK 99501-2118 (907) 276-7676Open Quality Inn Airport Anchorage Quality Inn 122 Jun-63 4616 Spenard Rd, Anchorage, AK 99517-3234 (907) 243-3131Open Clarion Suites Anchorage Clarion 110 Apr-98 325 W 8th Ave, Anchorage, AK 99501-3541 (907) 274-1000Open Ramada Anchorage Ramada 90 Jun-65 115 E 3rd Ave, Anchorage, AK 99501-2501 (907) 272-7561Open Best Western Golden Lion Hotel Best Western 83 Jun-77 1000 E 36th Ave, Anchorage, AK 99508-4304 (907) 561-1522Open Best Western Bidarka Inn Best Western 74 Mar-72 575 Sterling Hwy, Homer, AK 99603-7447 (907) 235-8148Open Best Western Hotel Edgewater Best Western 76 Jul-99 202 5th Ave, Seward, AK 99664 (907) 224-2700Open Best Western King Salmon Motel Best Western 48 Dec-87 35546a Kenai Spur Hwy, Soldotna, AK 99669-7655 (907) 262-5857Open Best Western Valdez Harbor Inn Best Western 88 Jun-65 100 Harbor Dr, Valdez, AK 99686 (907) 835-3434
Pre-Planning Holiday Inn Anchorage Holiday Inn 150 Dec-11 International Rd & Airport Blvd, Anchorage, AK 99501
Midscale w/out Food & Beverage
Open Extended Stay Deluxe Anchorage Midtown Extended Stay Deluxe 138 Aug-04 700 E 34th Ave, Anchorage, AK 99503-4120 (907) 646-4208Open Holiday Inn Express Anchorage Airport Holiday Inn Express 128 Jun-99 4411 Spenard Rd, Anchorage, AK 99517-2912 (907) 248-8848
Appendix: Existing and Planned Lodging in the South Central Alaska Lodging Market
Gibbs Planning Group Inc., Wasilla Alaska Report Appendix Page 70
Status Hotel Name Brand Rooms
(Anticipated)
Open Date Address Phone
Appendix: Existing and Planned Lodging in the South Central Alaska Lodging Market
Open Fairfield Inn & Suites Anchorage Midtown Fairfield Inn 106 Aug-04 5060 A St, Anchorage, AK 99503-7400 (907) 222-9000Open Hampton Inn Anchorage Hampton Inn 101 Oct-97 4301 Credit Union Dr, Anchorage, AK 99503-6658 (907) 550-7000Open Comfort Inn Ship Creek Comfort Inn 100 Jun-92 111 Ship Creek Ave, Anchorage, AK 99501-1670 (907) 277-6887Open Extended Stay Deluxe Anchorage Downtown Extended Stay Deluxe 90 Apr-03 108 E 8th Ave, Anchorage, AK 99501-3614 (907) 868-1605Open Comfort Suites Anchorage International Arprt Comfort Suites 78 Mar-09 2919 W Intrntl Airport Rd, Anchorage, AK 99502 (907) 243-8080Open Holiday Inn Express Seward Harbor Holiday Inn Express 82 May-05 1412 4th Ave, Seward, AK 99664 (907) 224-2550
Planning Candlewood Suites Anchorage Candlewood Suites 83 Nov-10 Tudor Rd & Artic Blvd, Anchorage, AK 99501Final Planning Towneplace Suites Anchorage Midtown TownePlace Suites 118 Sep-10 4291 Bering Cir, Anchorage, AK 99503
Pre-Planning Holiday Inn Express & Suites Anchorage Holiday Inn Express 142 Oct-11 International Rd & Business Park Blvd, Anchorage, AK 99503Pre-Planning Fairfield Inn & Suites Anchorage Addition Fairfield Inn 30 5060 A St, Anchorage, AK 99503-7400
Economy
Open America`s Best Suites Anchorage America`s Best Suites 35 Jun-73 4110 Spenard Rd, Anchorage, AK 99517-2903 (907) 243-3433Open Americas Best Value Inn Executive Suites Anchorage Americas Best Value Inn 102 Jun-72 4360 Spenard Rd, Anchorage, AK 99517-2909 (907) 243-6366Open Americas Best Value Inn Anchorage Americas Best Value Inn 16 Jun-72 826 K St, Anchorage, AK 99501-3332 (907) 258-7669Open Days Inn Anchorage Downtown Days Inn 130 Jun-84 321 E 5th Ave, Anchorage, AK 99501-2632 (907) 276-7226Open Econo Lodge Airport Anchorage Econo Lodge 95 May-08 4619 Spenard Rd, Anchorage, AK 99517-3235 (907) 865-4600Open Microtel Inn & Suites Anchorage Microtel Inn 77 Sep-97 5205 Northwood Dr, Anchorage, AK 99517-3147 (907) 245-5002Open Motel 6 Anchorage Midtown Motel 6 85 Jun-04 5000 A St, Anchorage, AK 99503-7400 (907) 677-8000Open Red Roof Inn Anchorage Red Roof Inn 55 Jun-73 1104 E 5th Ave, Anchorage, AK 99501-2759 (907) 274-1650Open Super 8 Anchorage Super 8 84 Nov-84 3501 Minnesota Dr, Anchorage, AK 99503-3650 (907) 276-8884Open Microtel Inn & Suites Eagle River Microtel Inn 59 Jun-03 13049 Old Glenn Hwy, Eagle River, AK 99577-7562 (907) 622-6000
Pre-Planning Motel 6 Anchorage Addition Motel 6 5000 A St, Anchorage, AK 99503-7400
Independents
Open Grand View Inn & Suites N/A 300 Jun-04 2900 E Parks Hwy, Wasilla, AK 99654-7362 (907) 357-7666Open Alaskan View Motel N/A 26 Oct-98 2650 E Parks Hwy, Wasilla, AK 99687-7359 (907) 376-6787Open Mat Su Resort N/A 15 Jun-80 1850 Bogard Rd, Wasilla, AK 99654-6534 (907) 376-3228Open Valley Hotel N/A 33 Jun-48 606 S Alaska St, Palmer, AK 99645-6394 (907) 745-3330Open Alaska Choice Inn N/A 30 1930 Glenn Hwy, Palmer, AK 99645-6769 (907) 745-1505Open Golden Miner`s Hotel N/A 28 Jun-80 918 S Colony Way, Palmer, AK 99645-6928 (907) 745-6160Open Knik River Lodge N/A 15 29979 E Knik River Rd, Palmer, AK 99645-7311 (907) 745-5002Open Anchor River Inn N/A 20 Jun-65 Mile 157 Sterling Hwy, Anchor Point, AK 99556 (907) 235-8531Open Inlet Tower Hotel & Suites N/A 176 Jun-89 1200 L St, Anchorage, AK 99501-4265 (907) 276-0110Open Dimond Center Hotel N/A 109 Jun-02 700 E Dimond Blvd, Anchorage, AK 99515-2003 (907) 770-5000Open Mush Inn Motel N/A 94 Jun-60 333 Concrete St, Anchorage, AK 99501-2822 (907) 277-4554Open Puffin Inn N/A 85 Jun-55 4400 Spenard Rd, Anchorage, AK 99517-2914 (907) 243-4044Open Inlet Inn N/A 83 Jun-68 539 H St, Anchorage, AK 99501-2120 (907) 277-5541Open Travel Inn N/A 70 Jun-65 720 Gambell St, Anchorage, AK 99501-3755 (907) 277-1511
Gibbs Planning Group Inc., Wasilla Alaska Report Appendix Page 71
Status Hotel Name Brand Rooms
(Anticipated)
Open Date Address Phone
Appendix: Existing and Planned Lodging in the South Central Alaska Lodging Market
Open Black Angus Inn N/A 65 Jun-62 1430 Gambell St, Anchorage, AK 99501-5338 (907) 272-7503Open Long House Alaskan Hotel N/A 54 Jun-96 4335 Wisconson St, Anchorage, AK 99517-2884 (907) 243-2133Open Royal Suite Lodge N/A 54 Jun-82 3811 Minnesota Dr, Anchorage, AK 99503-5645 (907) 563-3114Open Parkwood Inn N/A 50 Jun-71 4455 Juneau St, Anchorage, AK 99503-7513 (907) 563-3590Open Lakeshore Motor Inn N/A 45 Oct-95 3009 Lakeshore Dr, Anchorage, AK 99517-2806 (907) 248-3485Open Anchor Arms Hotel N/A 44 Jun-65 433 Eagle St, Anchorage, AK 99501-2630 (907) 272-9619Open Econo Inn N/A 41 Jun-70 642 E 5th Ave, Anchorage, AK 99501-2731 (907) 274-1515Open Voyager Hotel N/A 40 May-66 501 K St, Anchorage, AK 99501-2027 (907) 277-9501Open Artic Tern Inn N/A 39 Jun-60 5000 Taku Dr, Anchorage, AK 99508-2426 (907) 337-1544Open Merrill Field Inn N/A 39 Jun-91 420 Sitka St, Anchorage, AK 99501-2830 (907) 276-4547Open Spenard Motel N/A 38 Jun-62 3960 Spenard Rd, Anchorage, AK 99517-3003 (907) 243-6917Open Chelsea Inn Hotel N/A 35 May-90 3836 Spenard Rd, Anchorage, AK 99517-2680 (907) 276-5002Open Kennicott Glacier Lodge N/A 35 Jun-87 Lot 15 Millsite Sub, Anchorage, AK 99510 (907) 258-2350Open Anchorage Suites Lodge N/A 34 Jun-79 441 E 15th Ave, Anchorage, AK 99501-5211 (907) 276-3114Open Sourdough Visitors Lodge N/A 32 May-88 801 Erickson St, Anchorage, AK 99501-1138 (907) 279-4148Open Grand Hotel N/A 31 Jan-52 505 W 2nd Ave, Anchorage, AK 99501-2207 (907) 929-8888Open Duke`s 8th Avenue Hotel N/A 28 Jul-84 630 W 8th Ave, Anchorage, AK 99501-3435 (907) 274-6213Open Airport Bed & Breakfast N/A 28 2904 Aspen Dr, Anchorage, AK 99517-3253 (907) 243-6050Open Big Timber Motel N/A 27 Jun-75 2037 E 5th Ave, Anchorage, AK 99501-2920 (907) 222-1955Open Historic Anchorage Hotel N/A 26 Jun-16 330 E St, Anchorage, AK 99501-2307 (907) 272-4553Open Creekwood Inn N/A 26 Jun-65 2150 Gambell St, Anchorage, AK 99503-2217 (907) 258-6006Open Al`s Alaskan Inn N/A 24 Jan-64 7830 Old Seward Hwy, Anchorage, AK 99518-3234 (907) 344-6223Open Arctic Inn Motel N/A 24 842 W Intrntl Airport Rd, Anchorage, AK 99518-1001 (907) 561-1328Open Anchorage Uptown Hotel N/A 20 Jun-63 234 E 2nd Ave, Anchorage, AK 99501-2402 (907) 279-4232Open John`s Motel N/A 20 3543 Mountain View Dr, Anchorage, AK 99508-1111 (907) 277-4332Open Young Lodge N/A 20 Jun-75 337 W 33rd Ave, Anchorage, AK 99503-4706 (907) 562-5700Open Alaska Tudor Motel N/A 19 Jun-90 4423 Lake Otis Pkwy, Anchorage, AK 99507-1481 (907) 561-2234Open Brooks Lodge & Cabins N/A 16 Jun-65 Katmai National Park, Anchorage, AK 99502 (907) 243-5448Open Big Lake Motel N/A 19 Jun-91 Mile 1.5 S Big Lake Rd, Big Lake, AK 99652 (907) 892-7976Open Kenai Princess Lodge N/A 86 Jun-90 Mile 2 Bean Creek Rd, Cooper Landing, AK 99572 (907) 595-1425Open Copper River Princess Lodge N/A 85 Jun-02 Mile 102 Richardson Hwy, Copper Center, AK 99573 (907) 822-4000Open Copper Center Lodge N/A 19 Jun-32 101 Richardson Hwy, Copper Center, AK 99573 (907) 822-3245Open Reluctant Fisherman Motel N/A 44 Jun-72 501 Railroad Ave, Cordova, AK 99574 (907) 424-3272Open Orca Lodge N/A 34 Jun-01 2500 Orca Rd, Cordova, AK 99574 (907) 424-7249Open Prince William Motel N/A 16 Jun-64 501 2nd St, Cordova, AK 99574-0908 (907) 424-3201Open The Hotel Alyeska N/A 304 Aug-94 1000 Arlberg Ave, Girdwood, AK 99587 (907) 754-1111Open New Caribou Motel N/A 86 Sep-90 Mile 187 Glennallen Hwy, Glennallen, AK 99588 (907) 822-3302Open Lands End Resort N/A 108 Apr-58 4786 Homer Spit Rd, Homer, AK 99603-8001 (907) 235-0400Open Ocean Shores Motel & Resort N/A 38 Jun-65 3500 Crittenden Dr, Homer, AK 99603-7462 (907) 235-7775Open Heritage Hotel N/A 37 Jun-49 147 E Pioneer Ave, Homer, AK 99603-7531 (907) 235-7787Open Beluga Lake Lodge N/A 35 Jun-75 204 Ocean Dr Loop, Homer, AK 99603-7964 (907) 235-5995
Gibbs Planning Group Inc., Wasilla Alaska Report Appendix Page 72
Status Hotel Name Brand Rooms
(Anticipated)
Open Date Address Phone
Appendix: Existing and Planned Lodging in the South Central Alaska Lodging Market
Open Driftwood Inn N/A 20 Jun-18 135 W Bunnell Ave, Homer, AK 99603-7826 (907) 235-8019Open Aspen Kenai Extended Stay Stes N/A 78 Apr-08 10431 Kenai Spur Hwy, Kenai, AK 99611-7812 (907) 283-2272Open Kenai Merit Inn N/A 60 Jun-70 260 S Willow St, Kenai, AK 99611-7746 (907) 283-6131Open Kings Inn N/A 52 Jun-86 10352 Kenai Spur Hwy, Kenai, AK 99611-7809 (907) 283-6060Open Uptown Motel N/A 50 Jun-84 47 Spur View Dr, Kenai, AK 99611-6879 (907) 283-3660Open Kenai Landing N/A 48 May-07 2101 Bowpicker Ln, Kenai, AK 99611-5801 (907) 335-2500Open Katmai Pine Lodge N/A 32 10800 Kenai Spur Hwy, Kenai, AK 99611-7849 (907) 283-6101Open The Place Motel N/A 15 Jun-85 44705 Kenai Spur Hwy, Kenai, AK 99611 (907) 283-7071Open Seward Windsong Lodge N/A 108 Jun-97 Mile Half Exit Glacier Rd, Seward, AK 99664 (907) 224-7116Open Breeze Inn Motel N/A 86 Jun-74 1306 Seward Hwy, Seward, AK 99664 (907) 224-5238Open Hotel Seward N/A 62 Sep-89 221 5th Ave, Seward, AK 99664 (907) 224-2378Open Harborview Inn N/A 37 Jun-98 804 3rd Ave, Seward, AK 99664 (907) 224-3217Open Marina Motel N/A 26 Jun-62 1603 Seward Hwy, Seward, AK 99664 (907) 224-5518Open Van Gilder Hotel N/A 23 Jun-16 308 Adams St, Seward, AK 99664 (907) 224-3079Open Murphey`s Motel N/A 23 Jun-53 911 4th Ave, Seward, AK 99664 (907) 224-8090Open Aspen Hotel Soldotna N/A 63 Nov-02 326 Binkley Cir, Soldotna, AK 99669-8058 (907) 260-7736Open Hooligan`s Lodge N/A 33 44715 Sterling Hwy, Soldotna, AK 99669-7939 (907) 262-9388Open Riverside House N/A 28 Jun-66 44611 Sterling Hwy, Soldotna, AK 99669-7938 (907) 262-0500Open Soldotna Inn N/A 28 Jun-78 35041 Kenai Spur Hwy, Soldotna, AK 99669-7621 (907) 262-9169Open Kenai River Lodge N/A 25 Jun-68 393 Riverside Dr, Soldotna, AK 99669-7846 (907) 262-4292Open Loon Lake Resort N/A 25 43645 Sports Lake Rd, Soldotna, AK 99669-6824 (907) 262-8435Open Duck Inn N/A 20 43187 Kalifonsky Beach Rd, Soldotna, AK 99669-8261 (907) 262-1849Open Soldotna B & B Lodge N/A 16 Jun-85 399 Lovers Ln, Soldotna, AK 99669-7946 (907) 262-4779Open Redfish Lodge N/A 15 Mile Post 81 Anna St, Sterling, AK 99672 (907) 260-6535Open Talkeetna Alaskan Lodge N/A 98 Jun-99 Talkeetna Spur Rd Mile 12, Talkeetna, AK 99676 (907) 733-9500Open Talkeetna Motel N/A 23 B St, Talkeetna, AK 99676 (907) 733-2323Open Keystone Hotel N/A 104 Apr-94 401 W Egan Dr, Valdez, AK 99686 (907) 835-3851Open Aspen Hotel N/A 103 Jun-99 100 Meals Ave, Valdez, AK 99686 (907) 835-4445Open Totem Inn N/A 70 Jun-75 144 E Egan Dr, Valdez, AK 99686 (907) 834-4443Open Glacier Sound Inn N/A 40 210 Egan Dr, Valdez, AK 99686 (907) 835-4485Open Downtown Bed & Breakfast Inn N/A 21 Jun-89 113 Galena Dr, Valdez, AK 99686 (907) 835-2791Open Pipeline Inn N/A 16 Jun-67 112 Eagan Dr, Valdez, AK 99686 (907) 835-4444Open Anchor Inn N/A 27 Jun-78 100 Whittier St, Whittier, AK 99693 (907) 472-2354Open The Inn @ Whittier N/A 25 Horbor Loop Rd, Whittier, AK 99693 (907) 472-7000
Gibbs Planning Group Inc., Wasilla Alaska Report Appendix Page 73
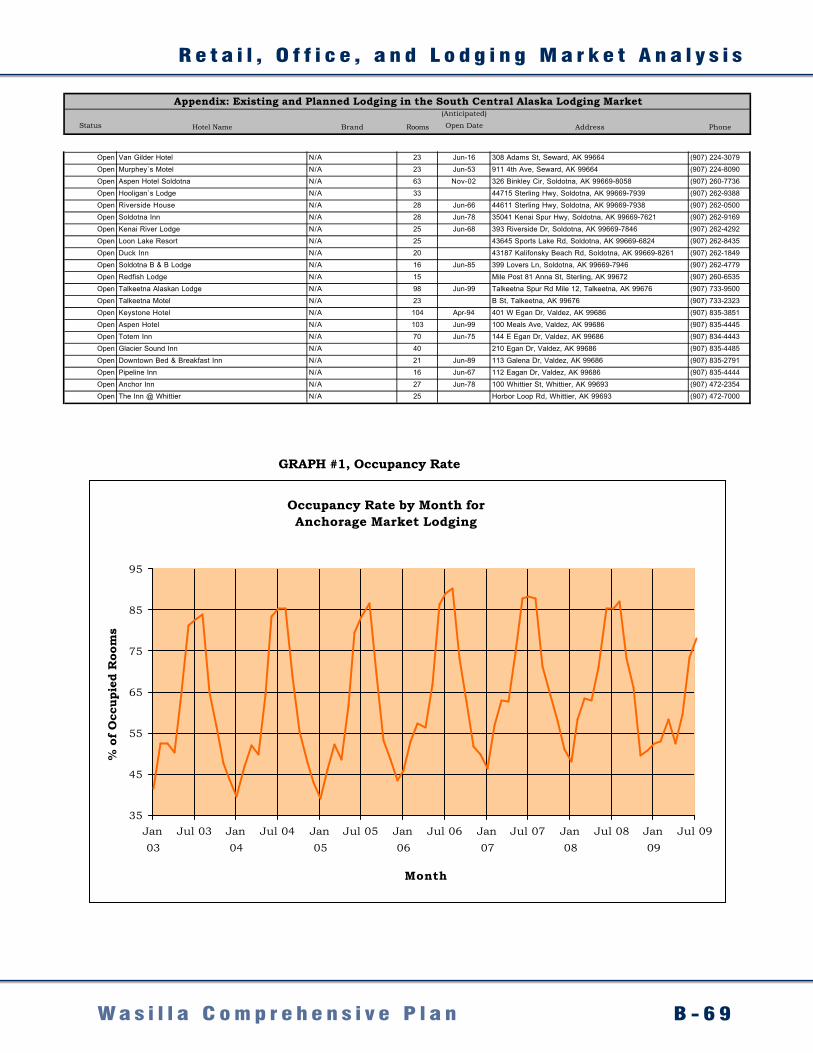
R e t a i l , O f f i c e , a n d L o d g i n g M a r k e t A n a l y s i s
B - 6 9W a s i l l a C o m p r e h e n s i v e P l a n
Status Hotel Name Brand Rooms
(Anticipated)
Open Date Address Phone
Upper Upscale
Open Preferred Captain Cook Hotel Preferred 547 Jun-65 939 W 5th Ave, Anchorage, AK 99501-2019 (907) 276-6000Open Embassy Suites Anchorage Embassy Suites 169 Jun-08 600 E Benson Blvd, Anchorage, AK 99503-4123 (907) 332-7000Open Hilton Anchorage Hilton 600 Jun-72 500 W 3rd Ave, Anchorage, AK 99501-2210 (907) 272-7411Open Marriott Anchorage Downtown Marriott 393 Mar-00 820 W 7th Ave, Anchorage, AK 99501-3407 (907) 279-8000Open Millennium Anchorage Millennium 248 Jun-86 4800 Spenard Rd, Anchorage, AK 99517-3236 (907) 243-2300Open Sheraton Hotel & Spa Anchorage Sheraton Hotel 370 Jun-79 401 E 6th Ave, Anchorage, AK 99501-2638 (907) 276-8700
Upscale
Open Coast Hotel International Inn Coast Hotel 141 Jun-75 3333 W Intrntl Airport Rd, Anchorage, AK 99502-1099 (907) 243-2233Open Courtyard Anchorage Airport Courtyard 154 May-97 4901 Spenard Rd, Anchorage, AK 99517-3295 (907) 245-0322Open Crowne Plaza Anchorage Midtown Crowne Plaza 165 Jul-09 109 W Intrntl Airport Rd, Anchorage, AK 99518-1206 (907) 433-4100Open Hawthorn Suites By Wyndham Anchorage Hawthorn Suites 110 May-99 1110 W 8th Ave, Anchorage, AK 99501-3350 (907) 222-5005Open Hilton Garden Inn Anchorage Hilton Garden Inn 125 Jun-02 4555 Union Square Dr, Anchorage, AK 99503-7245 (907) 729-7000Open Homewood Suites Anchorage Homewood Suites 122 Mar-04 101 W 48th Ave, Anchorage, AK 99503-7249 (907) 762-7000Open Residence Inn Anchorage Midtown Residence Inn 148 May-99 1025 35th Ave, Anchorage, AK 99508-4200 (907) 563-9844Open Springhill Suites Anchorage University Lake Springhill Suites 159 Aug-09 4050 University Lake Dr, Anchorage, AK 99508-4600 (907) 751-6300Open Springhill Suites Anchorage Midtown Springhill Suites 101 Apr-98 3401 A St, Anchorage, AK 99503-4012 (907) 562-3247
Planning Hyatt Place Anchorage Hyatt Place Nhn Business Park Blvd, Anchorage, AK 99503Planning Staybridge Suites Anchorage Staybridge Suites 120 Oct-10 Tudor Rd & Artic Blvd, Anchorage, AK 99501
Midscale with Food & Beverage
Open Best Western Lake Lucille Inn Best Western 54 Oct-93 1300 W Lake Lucille Dr, Wasilla, AK 99654-7923 (907) 373-1776Open Howard Johnson Plaza Anchorage Howard Johnson 247 May-71 239 W 4th Ave, Anchorage, AK 99501-2318 (907) 793-5500Open Westmark Anchorage Westmark 198 Jun-70 720 W 5th Ave, Anchorage, AK 99501-2118 (907) 276-7676Open Quality Inn Airport Anchorage Quality Inn 122 Jun-63 4616 Spenard Rd, Anchorage, AK 99517-3234 (907) 243-3131Open Clarion Suites Anchorage Clarion 110 Apr-98 325 W 8th Ave, Anchorage, AK 99501-3541 (907) 274-1000Open Ramada Anchorage Ramada 90 Jun-65 115 E 3rd Ave, Anchorage, AK 99501-2501 (907) 272-7561Open Best Western Golden Lion Hotel Best Western 83 Jun-77 1000 E 36th Ave, Anchorage, AK 99508-4304 (907) 561-1522Open Best Western Bidarka Inn Best Western 74 Mar-72 575 Sterling Hwy, Homer, AK 99603-7447 (907) 235-8148Open Best Western Hotel Edgewater Best Western 76 Jul-99 202 5th Ave, Seward, AK 99664 (907) 224-2700Open Best Western King Salmon Motel Best Western 48 Dec-87 35546a Kenai Spur Hwy, Soldotna, AK 99669-7655 (907) 262-5857Open Best Western Valdez Harbor Inn Best Western 88 Jun-65 100 Harbor Dr, Valdez, AK 99686 (907) 835-3434
Pre-Planning Holiday Inn Anchorage Holiday Inn 150 Dec-11 International Rd & Airport Blvd, Anchorage, AK 99501
Midscale w/out Food & Beverage
Open Extended Stay Deluxe Anchorage Midtown Extended Stay Deluxe 138 Aug-04 700 E 34th Ave, Anchorage, AK 99503-4120 (907) 646-4208Open Holiday Inn Express Anchorage Airport Holiday Inn Express 128 Jun-99 4411 Spenard Rd, Anchorage, AK 99517-2912 (907) 248-8848
Appendix: Existing and Planned Lodging in the South Central Alaska Lodging Market
Gibbs Planning Group Inc., Wasilla Alaska Report Appendix Page 70
Status Hotel Name Brand Rooms
(Anticipated)
Open Date Address Phone
Appendix: Existing and Planned Lodging in the South Central Alaska Lodging Market
Open Driftwood Inn N/A 20 Jun-18 135 W Bunnell Ave, Homer, AK 99603-7826 (907) 235-8019Open Aspen Kenai Extended Stay Stes N/A 78 Apr-08 10431 Kenai Spur Hwy, Kenai, AK 99611-7812 (907) 283-2272Open Kenai Merit Inn N/A 60 Jun-70 260 S Willow St, Kenai, AK 99611-7746 (907) 283-6131Open Kings Inn N/A 52 Jun-86 10352 Kenai Spur Hwy, Kenai, AK 99611-7809 (907) 283-6060Open Uptown Motel N/A 50 Jun-84 47 Spur View Dr, Kenai, AK 99611-6879 (907) 283-3660Open Kenai Landing N/A 48 May-07 2101 Bowpicker Ln, Kenai, AK 99611-5801 (907) 335-2500Open Katmai Pine Lodge N/A 32 10800 Kenai Spur Hwy, Kenai, AK 99611-7849 (907) 283-6101Open The Place Motel N/A 15 Jun-85 44705 Kenai Spur Hwy, Kenai, AK 99611 (907) 283-7071Open Seward Windsong Lodge N/A 108 Jun-97 Mile Half Exit Glacier Rd, Seward, AK 99664 (907) 224-7116Open Breeze Inn Motel N/A 86 Jun-74 1306 Seward Hwy, Seward, AK 99664 (907) 224-5238Open Hotel Seward N/A 62 Sep-89 221 5th Ave, Seward, AK 99664 (907) 224-2378Open Harborview Inn N/A 37 Jun-98 804 3rd Ave, Seward, AK 99664 (907) 224-3217Open Marina Motel N/A 26 Jun-62 1603 Seward Hwy, Seward, AK 99664 (907) 224-5518Open Van Gilder Hotel N/A 23 Jun-16 308 Adams St, Seward, AK 99664 (907) 224-3079Open Murphey`s Motel N/A 23 Jun-53 911 4th Ave, Seward, AK 99664 (907) 224-8090Open Aspen Hotel Soldotna N/A 63 Nov-02 326 Binkley Cir, Soldotna, AK 99669-8058 (907) 260-7736Open Hooligan`s Lodge N/A 33 44715 Sterling Hwy, Soldotna, AK 99669-7939 (907) 262-9388Open Riverside House N/A 28 Jun-66 44611 Sterling Hwy, Soldotna, AK 99669-7938 (907) 262-0500Open Soldotna Inn N/A 28 Jun-78 35041 Kenai Spur Hwy, Soldotna, AK 99669-7621 (907) 262-9169Open Kenai River Lodge N/A 25 Jun-68 393 Riverside Dr, Soldotna, AK 99669-7846 (907) 262-4292Open Loon Lake Resort N/A 25 43645 Sports Lake Rd, Soldotna, AK 99669-6824 (907) 262-8435Open Duck Inn N/A 20 43187 Kalifonsky Beach Rd, Soldotna, AK 99669-8261 (907) 262-1849Open Soldotna B & B Lodge N/A 16 Jun-85 399 Lovers Ln, Soldotna, AK 99669-7946 (907) 262-4779Open Redfish Lodge N/A 15 Mile Post 81 Anna St, Sterling, AK 99672 (907) 260-6535Open Talkeetna Alaskan Lodge N/A 98 Jun-99 Talkeetna Spur Rd Mile 12, Talkeetna, AK 99676 (907) 733-9500Open Talkeetna Motel N/A 23 B St, Talkeetna, AK 99676 (907) 733-2323Open Keystone Hotel N/A 104 Apr-94 401 W Egan Dr, Valdez, AK 99686 (907) 835-3851Open Aspen Hotel N/A 103 Jun-99 100 Meals Ave, Valdez, AK 99686 (907) 835-4445Open Totem Inn N/A 70 Jun-75 144 E Egan Dr, Valdez, AK 99686 (907) 834-4443Open Glacier Sound Inn N/A 40 210 Egan Dr, Valdez, AK 99686 (907) 835-4485Open Downtown Bed & Breakfast Inn N/A 21 Jun-89 113 Galena Dr, Valdez, AK 99686 (907) 835-2791Open Pipeline Inn N/A 16 Jun-67 112 Eagan Dr, Valdez, AK 99686 (907) 835-4444Open Anchor Inn N/A 27 Jun-78 100 Whittier St, Whittier, AK 99693 (907) 472-2354Open The Inn @ Whittier N/A 25 Horbor Loop Rd, Whittier, AK 99693 (907) 472-7000
Gibbs Planning Group Inc., Wasilla Alaska Report Appendix Page 73
GRAPH #1, Occupancy Rate
GRAPH #2, Average Daily Room Rate
Occupancy Rate by Month forAnchorage Market Lodging
35
45
55
65
75
85
95
Jan03
Jul 03 Jan04
Jul 04 Jan05
Jul 05 Jan06
Jul 06 Jan07
Jul 07 Jan08
Jul 08 Jan09
Jul 09
Month
% o
f O
ccup
ied
Roo
ms
Average Daily Rate by Month forAnchorage Market Lodging
$65
$75
$85
$95
$105
$115
$125
$135
$145
$155
$165
$175
Jan03
Jul 03 Jan04
Jul 04 Jan05
Jul 05 Jan06
Jul 06 Jan07
Jul 07 Jan08
Jul 08 Jan09
Jul 09
Month
Ave
rage
Dai
ly R
ate
Gibbs Planning Group Inc., Wasilla Alaska Report Appendix Page 74
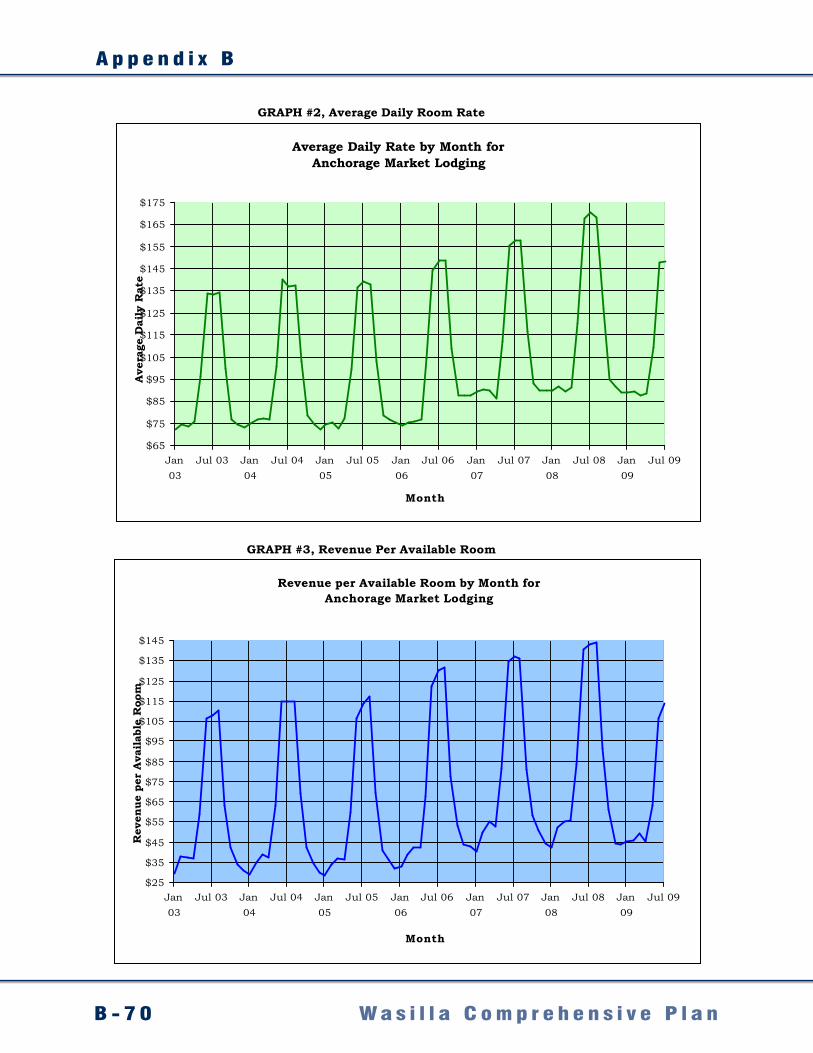
A p p e n d i x B
B - 7 0 W a s i l l a C o m p r e h e n s i v e P l a n
GRAPH #1, Occupancy Rate
GRAPH #2, Average Daily Room Rate
Occupancy Rate by Month forAnchorage Market Lodging
35
45
55
65
75
85
95
Jan03
Jul 03 Jan04
Jul 04 Jan05
Jul 05 Jan06
Jul 06 Jan07
Jul 07 Jan08
Jul 08 Jan09
Jul 09
Month
% o
f O
ccup
ied
Roo
ms
Average Daily Rate by Month forAnchorage Market Lodging
$65
$75
$85
$95
$105
$115
$125
$135
$145
$155
$165
$175
Jan03
Jul 03 Jan04
Jul 04 Jan05
Jul 05 Jan06
Jul 06 Jan07
Jul 07 Jan08
Jul 08 Jan09
Jul 09
Month
Ave
rage
Dai
ly R
ate
Gibbs Planning Group Inc., Wasilla Alaska Report Appendix Page 74
GRAPH #4, DEMAND, Number of Rooms Sold
GRAPH #3, Revenue Per Available Room
Revenue per Available Room by Month forAnchorage Market Lodging
$25
$35
$45
$55
$65
$75
$85
$95
$105
$115
$125
$135
$145
Jan03
Jul 03 Jan04
Jul 04 Jan05
Jul 05 Jan06
Jul 06 Jan07
Jul 07 Jan08
Jul 08 Jan09
Jul 09
Month
Rev
enue
per
Ava
ilab
le R
oom
Number of Rooms Sold by Month forAnchorage Market Lodging
175,000
225,000
275,000
325,000
375,000
425,000
475,000
525,000
575,000
Jan03
Jul03
Jan04
Jul04
Jan05
Jul05
Jan06
Jul06
Jan07
Jul07
Jan08
Jul08
Jan09
Jul09
Month
# of
Roo
ms
Sold
Gibbs Planning Group Inc., Wasilla Alaska Report Appendix Page 75
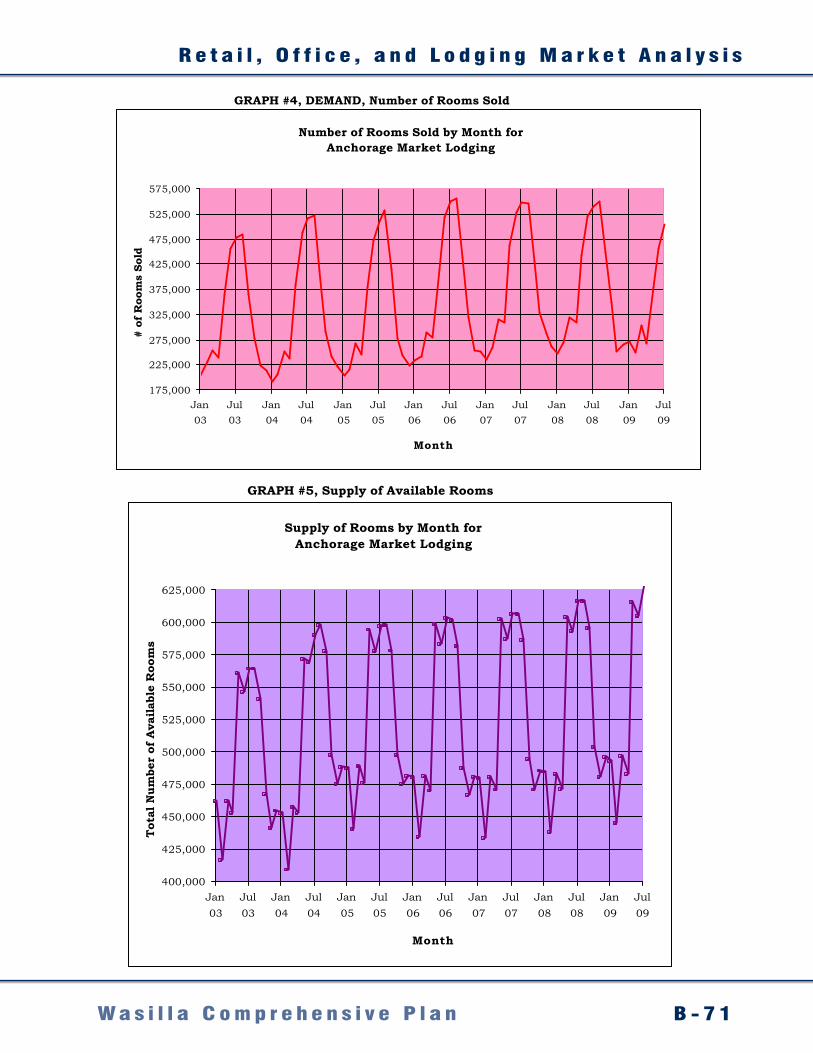
R e t a i l , O f f i c e , a n d L o d g i n g M a r k e t A n a l y s i s
B - 7 1W a s i l l a C o m p r e h e n s i v e P l a n
GRAPH #4, DEMAND, Number of Rooms Sold
GRAPH #3, Revenue Per Available Room
Revenue per Available Room by Month forAnchorage Market Lodging
$25
$35
$45
$55
$65
$75
$85
$95
$105
$115
$125
$135
$145
Jan03
Jul 03 Jan04
Jul 04 Jan05
Jul 05 Jan06
Jul 06 Jan07
Jul 07 Jan08
Jul 08 Jan09
Jul 09
Month
Rev
enue
per
Ava
ilab
le R
oom
Number of Rooms Sold by Month forAnchorage Market Lodging
175,000
225,000
275,000
325,000
375,000
425,000
475,000
525,000
575,000
Jan03
Jul03
Jan04
Jul04
Jan05
Jul05
Jan06
Jul06
Jan07
Jul07
Jan08
Jul08
Jan09
Jul09
Month
# of
Roo
ms
Sold
Gibbs Planning Group Inc., Wasilla Alaska Report Appendix Page 75GRAPH #5, Supply of Available Rooms
Supply of Rooms by Month forAnchorage Market Lodging
400,000
425,000
450,000
475,000
500,000
525,000
550,000
575,000
600,000
625,000
Jan03
Jul03
Jan04
Jul04
Jan05
Jul05
Jan06
Jul06
Jan07
Jul07
Jan08
Jul08
Jan09
Jul09
Month
Tot
al N
umbe
r of
Ava
ilab
le R
oom
s
Gibbs Planning Group Inc., Wasilla Alaska Report Appendix Page 76
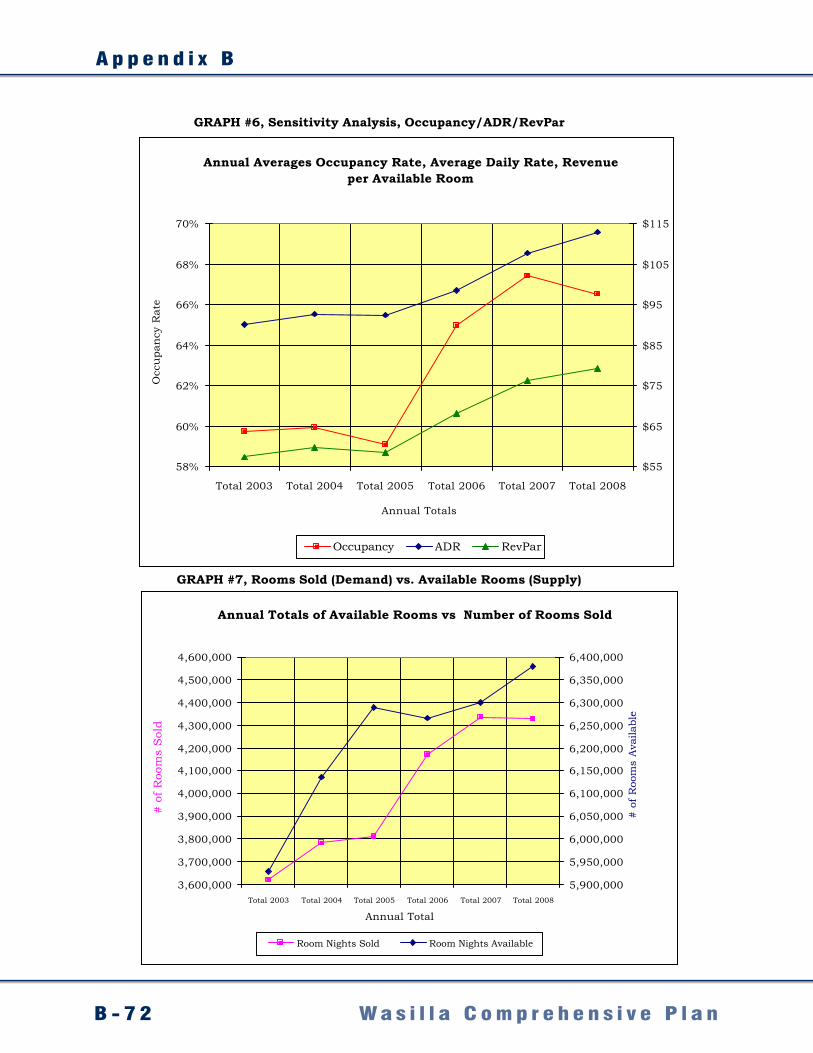
A p p e n d i x B
B - 7 2 W a s i l l a C o m p r e h e n s i v e P l a n
GRAPH #7, Rooms Sold (Demand) vs. Available Rooms (Supply)
GRAPH #6, Sensitivity Analysis, Occupancy/ADR/RevPar
Annual Averages Occupancy Rate, Average Daily Rate, Revenue per Available Room
58%
60%
62%
64%
66%
68%
70%
Total 2003 Total 2004 Total 2005 Total 2006 Total 2007 Total 2008
Annual Totals
Occ
upa
ncy
Rat
e
$55
$65
$75
$85
$95
$105
$115
Occupancy ADR RevPar
Annual Totals of Available Rooms vs Number of Rooms Sold
3,600,000
3,700,000
3,800,000
3,900,000
4,000,000
4,100,000
4,200,000
4,300,000
4,400,000
4,500,000
4,600,000
Total 2003 Total 2004 Total 2005 Total 2006 Total 2007 Total 2008
Annual Total
# of
Roo
ms
Sol
d
5,900,000
5,950,000
6,000,000
6,050,000
6,100,000
6,150,000
6,200,000
6,250,000
6,300,000
6,350,000
6,400,000
# of
Roo
ms
Ava
ilabl
e
Room Nights Sold Room Nights Available
Gibbs Planning Group Inc., Wasilla Alaska Report Appendix Page 77