Embed Size (px)
Citation preview

Bouwinvest Dutch Institutional Retail Fund N.V. | Annual Report 2016 2
Table of contentsManagement company profile 4Bouwinvest Real Estate Investment Management 4
2016 at a glance 5Key information in 2016 5
CSR key data 7
Key information over five years 9
The Retail Fund at a glance 10
The retail portfolio at a glance 10
Message from the chairman 13
Report of the Board of Directors 14Composition of the Board of Directors 14
Market developments and trends 15
The Fund's optimisation strategy 17
Portfolio developments 2016 in perspective 19
Financial performance in 2016 27
Outlook 28
Corporate Social Responsibility 30CSR strategy 30
Sustainable partnerships 31
Environmental performance 32
Benchmarking 34
Corporate governance 35Structure of the Fund 35
Management company 37
External auditor 39
Risk management 40Risk management and compliance 40
Risk management framework 40
Major risk factors and corrective measures 41
AIFMD 43
Monitoring and reporting 43
Financial statements 44Consolidated statement of comprehensive income 44
Consolidated statement of financial position 45
Consolidated statement of changes in equity 46
Consolidated statement of cash flows 47
Notes to the consolidated financial statements 48
Company balance sheet 67
Company profit and loss account 67
Notes to the company financial statements 68
Other information 71Articles of Association related to the appropriation of profit 71
Independent auditor’s report 72
Bouwinvest Dutch Institutional Retail Fund N.V. | Annual Report 2016 3
INREV valuation principles and INREV adjustments 76INREV valuation principles 76
INREV adjustments 77
Notes to the INREV adjustments 78
Independent auditor's report 83
Shareholders’ information & Investor Relations 85Legal and capital structure 85
Shareholders 85
Dividend 85
Shareholders’ calendar 86
Investor relations 86
CSR performance indicators 87
Contact information 89
Glossary 90
Properties overview 92

Bouwinvest Dutch Institutional Retail Fund N.V. | Annual Report 2016 4
Management company profile
Bouwinvest Real Estate Investment Management
Bouwinvest Real Estate Investment Management B.V. (Bouwinvest) is one of the largest Dutch investment
managers specialised in real estate for institutional investors. Bouwinvest's Amsterdam-based team of 136.6 FTEs
manages total assets of € 8.5 billion, in five Dutch property sector funds and international real estate investments.
The Dutch real estate portfolio comprises five sector funds: a Residential Fund, a Retail Fund and an Office Fund –
all open to institutional investors – plus a Hotel Fund and a Healthcare Fund managed for anchor investor
bpfBOUW. Bouwinvest also provides its anchor investor bpfBOUW with tactical asset allocation advice and
investments in listed and unlisted real estate funds in Europe, North America and the Asia-Pacific region.
Bouwinvest is recognised as one of the leading real estate investment managers in the Netherlands. It has a solid
track record of high-performance thanks to its in-depth knowledge of the Dutch and international real estate
markets and best-in-class valuation and risk management policies.
Bouwinvest’s portfolios are constructed to insulate investors against ever rapidly changing market trends and
have strong governance structures. The company’s Supervisory Board, together with a clearly defined system of
checks and balances, provides four levels of governance oversight. Besides dedicated asset management teams
Bouwinvest has in-house experts in Compliance, Legal, Risk Management, Research, Marketing and
Communication, Finance, CSR and Investor Relations. Bouwinvest has an ISAE 3402 type II certification and has an
AIFMD (Alternative Investment Fund Manager Directive) licence by the Dutch Financial Markets Authority (AFM).
In 2016, Bouwinvest’s three main Dutch sector funds were awarded a GRESB Green Star sustainability rating for the
third successive year.
Bouwinvest Dutch Institutional Retail Fund N.V. | Annual Report 2016 5
2016 at a glance
Key information in 2016
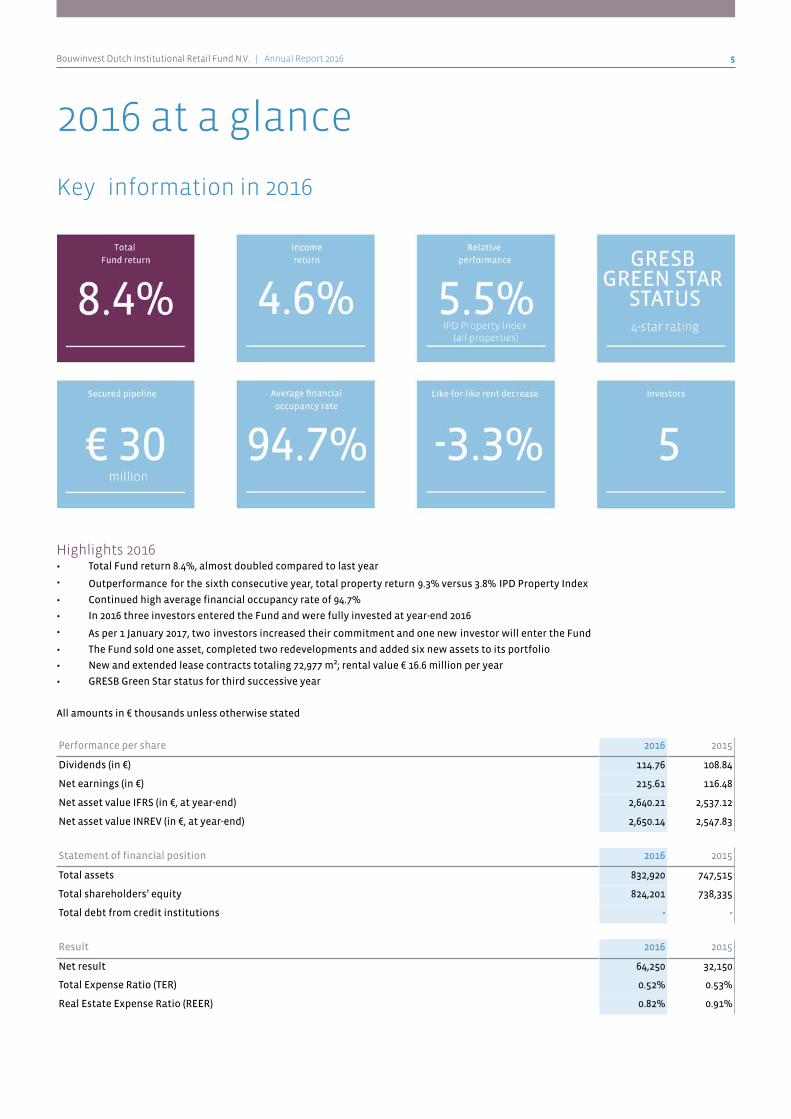
Highlights 2016• Total Fund return 8.4%, almost doubled compared to last year
• Outperformance for the sixth consecutive year, total property return 9.3% versus 3.8% IPD Property Index
• Continued high average financial occupancy rate of 94.7%
• In 2016 three investors entered the Fund and were fully invested at year-end 2016
• As per 1 January 2017, two investors increased their commitment and one new investor will enter the Fund
• The Fund sold one asset, completed two redevelopments and added six new assets to its portfolio
• New and extended lease contracts totaling 72,977 m²; rental value € 16.6 million per year
• GRESB Green Star status for third successive year
All amounts in € thousands unless otherwise stated
Performance per share 2016 2015
Dividends (in €) 114.76 108.84
Net earnings (in €) 215.61 116.48
Net asset value IFRS (in €, at year-end) 2,640.21 2,537.12
Net asset value INREV (in €, at year-end) 2,650.14 2,547.83
Statement of financial position 2016 2015
Total assets 832,920 747,515
Total shareholders’ equity 824,201 738,335
Total debt from credit institutions - -
Result 2016 2015
Net result 64,250 32,150
Total Expense Ratio (TER) 0.52% 0.53%
Real Estate Expense Ratio (REER) 0.82% 0.91%
Bouwinvest Dutch Institutional Retail Fund N.V. | Annual Report 2016 6
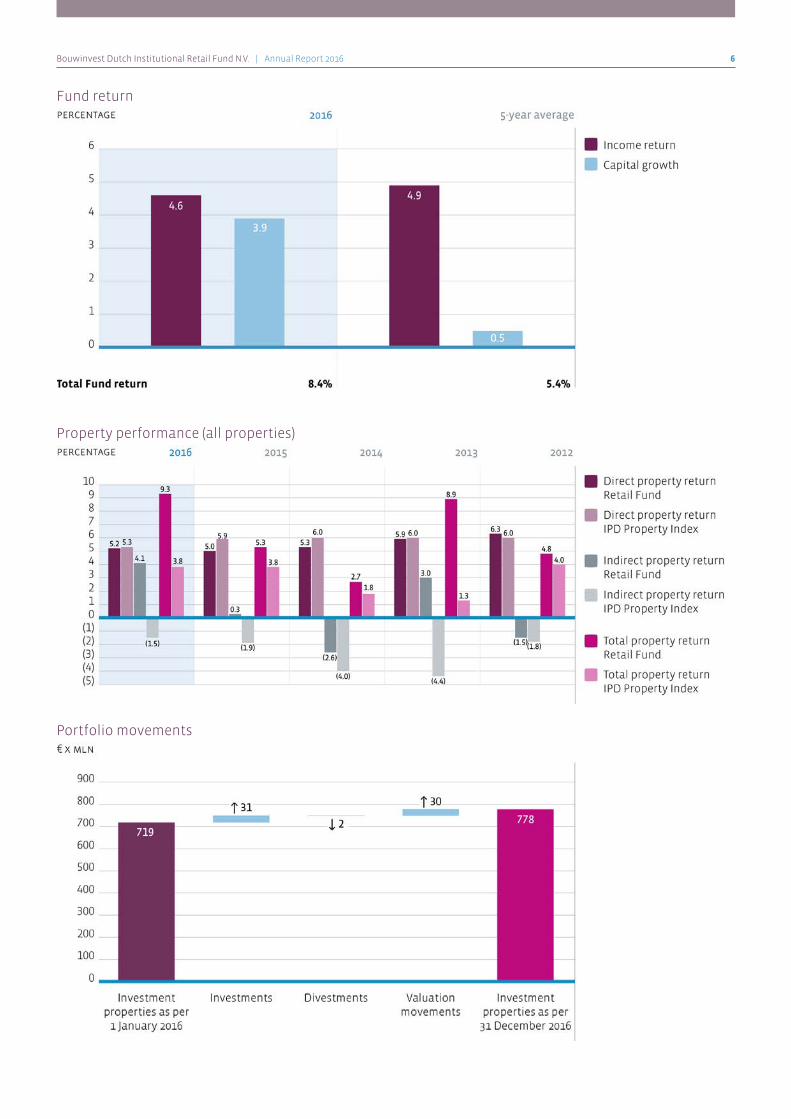
Fund return
Property performance (all properties)
Portfolio movements
Bouwinvest Dutch Institutional Retail Fund N.V. | Annual Report 2016 7
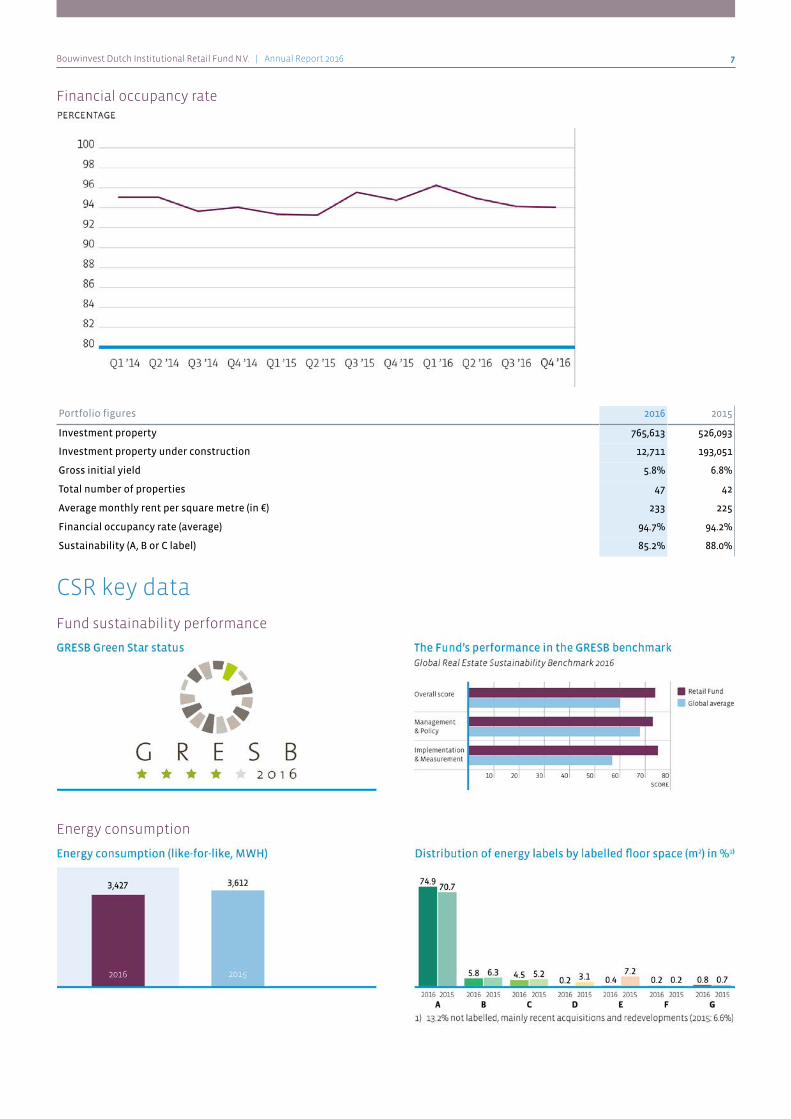
Financial occupancy rate
Portfolio figures 2016 2015
Investment property 765,613 526,093
Investment property under construction 12,711 193,051
Gross initial yield 5.8% 6.8%
Total number of properties 47 42
Average monthly rent per square metre (in €) 233 225
Financial occupancy rate (average) 94.7% 94.2%
Sustainability (A, B or C label) 85.2% 88.0%
CSR key data
Fund sustainability performance
Energy consumption

Bouwinvest Dutch Institutional Retail Fund N.V. | Annual Report 2016 8
Sustainability highlights• GRESB Green Star classification for third successive year
• Two shopping centres BREEAM NL In-Use certified
• Pilot smart real estate management and maintenance
• Reopening of Damrak 70 and the unveiling of the Beurspassage in Amsterdam (hotspot Amsterdam Oersoep)
Key facts• 85.2% awarded a green energy label (A, B or C label)
• Average energy index improved to 0.91 from 0.98
• Energy consumption fell by 5.1%
Bouwinvest Dutch Institutional Retail Fund N.V. | Annual Report 2016 9
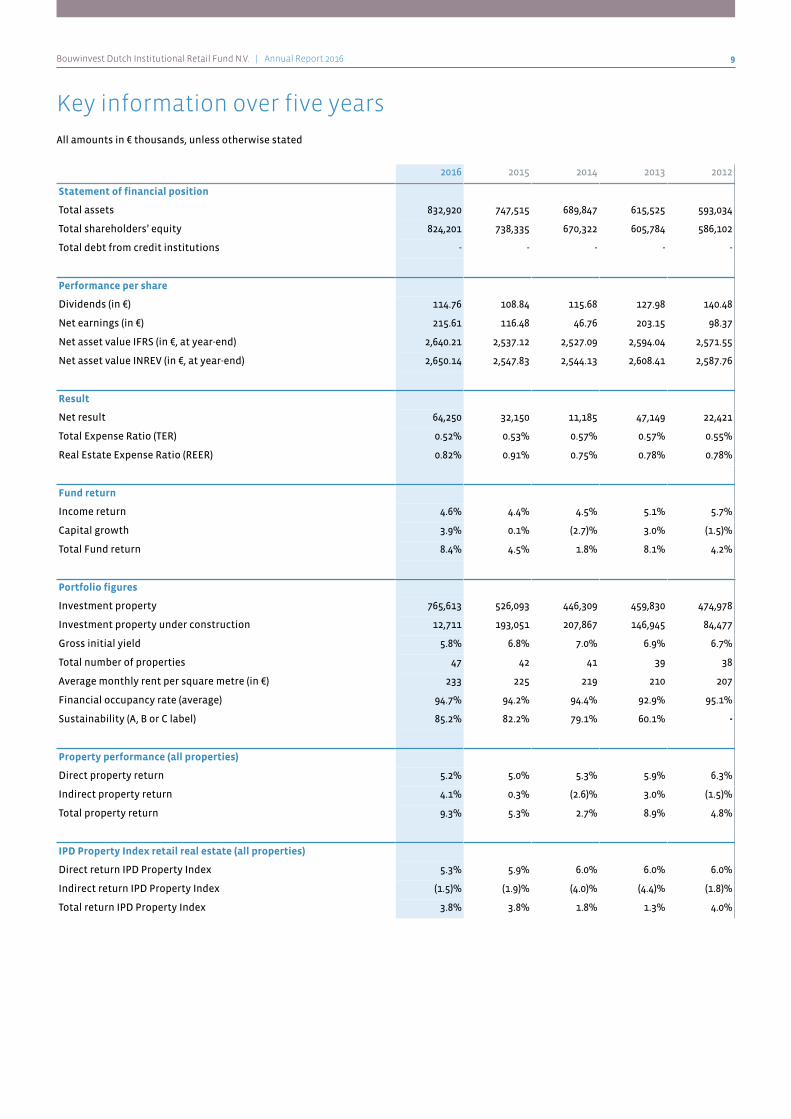
Key information over five years
All amounts in € thousands, unless otherwise stated
2016 2015 2014 2013 2012
Statement of financial position
Total assets 832,920 747,515 689,847 615,525 593,034
Total shareholders’ equity 824,201 738,335 670,322 605,784 586,102
Total debt from credit institutions - - - - -
Performance per share
Dividends (in €) 114.76 108.84 115.68 127.98 140.48
Net earnings (in €) 215.61 116.48 46.76 203.15 98.37
Net asset value IFRS (in €, at year-end) 2,640.21 2,537.12 2,527.09 2,594.04 2,571.55
Net asset value INREV (in €, at year-end) 2,650.14 2,547.83 2,544.13 2,608.41 2,587.76
Result
Net result 64,250 32,150 11,185 47,149 22,421
Total Expense Ratio (TER) 0.52% 0.53% 0.57% 0.57% 0.55%
Real Estate Expense Ratio (REER) 0.82% 0.91% 0.75% 0.78% 0.78%
Fund return
Income return 4.6% 4.4% 4.5% 5.1% 5.7%
Capital growth 3.9% 0.1% (2.7)% 3.0% (1.5)%
Total Fund return 8.4% 4.5% 1.8% 8.1% 4.2%
Portfolio figures
Investment property 765,613 526,093 446,309 459,830 474,978
Investment property under construction 12,711 193,051 207,867 146,945 84,477
Gross initial yield 5.8% 6.8% 7.0% 6.9% 6.7%
Total number of properties 47 42 41 39 38
Average monthly rent per square metre (in €) 233 225 219 210 207
Financial occupancy rate (average) 94.7% 94.2% 94.4% 92.9% 95.1%
Sustainability (A, B or C label) 85.2% 82.2% 79.1% 60.1% -
Property performance (all properties)
Direct property return 5.2% 5.0% 5.3% 5.9% 6.3%
Indirect property return 4.1% 0.3% (2.6)% 3.0% (1.5)%
Total property return 9.3% 5.3% 2.7% 8.9% 4.8%
IPD Property Index retail real estate (all properties)
Direct return IPD Property Index 5.3% 5.9% 6.0% 6.0% 6.0%
Indirect return IPD Property Index (1.5)% (1.9)% (4.0)% (4.4)% (1.8)%
Total return IPD Property Index 3.8% 3.8% 1.8% 1.3% 4.0%

Bouwinvest Dutch Institutional Retail Fund N.V. | Annual Report 2016 10
The Retail Fund at a glance
Fund characteristics• Closed-End Fund
• Core investment style
• No leverage
• 7% long-term average annual Fund return target
• Robust governance structure
• Investment structure for an indefinite period of time
• Reporting in accordance with INREV standards
Fund managementBouwinvest is the manager and Statutory Director of the Retail Fund. The Bouwinvest Board of Directors is
responsible for Bouwinvest’s long-term strategy, as well as the day-to-day management of the organisation itself
and its assets under management. Bouwinvest’s Dutch Investments business unit is responsible for all real estate
investments in the Netherlands. This business unit has a dedicated asset management team specialised in the
retail real estate sector, with experts in acquisition and divestment, property revitalisation and letting.
Our vision on the Dutch Retail market• Retail market for in particular experience based shopping sites continues to polarise
• Consumers seeking greater convenience and enhanced customer experience
• Rapid growth of online sales still remains a challenge to certain sectors of traditional retail
• Major retailers taking multi-channel or omni-channel approach - physical and digital shops converging
• Main city centres in the Randstad and key regional cities outperforming other market segments
• Urbanisation and ageing population key factors in future retail landscape
• Redevelopment, revitalisation and transformation the key to healthy retail market of the future
• Growing need for clear focus – Experience and Convenience
Optimisation strategyThe Fund aims to optimise its portfolio through:
• Targeted acquisitions taking into account current retail trends
• Redevelopment of core assets and the disposal of non-core retail units
• Specialised, well-positioned and future-proof retail assets
• Focus on two decisive elements in the future of retail: Experience and Convenience
• Focus on customising local property and marketing management
• New-build projects and redevelopments are opportunities to improve sustainability of Fund’s portfolio
The retail portfolio at a glance
Portfolio characteristics• 47 Dutch retail properties (€ 778 million; 209,979 m²)
• Focus on Experience and Convenience
• Continuously high occupancy rate
• Continuous outperformance of IPD Property Index
• High percentage of green energy labels (A, B or C label)
• GRESB Green Star
Focus on Experience and ConvenienceVirtually all of the portfolio’s assets qualify as high-quality retail facilities. In line with our strategic focus, the
properties can be divided into two segments:
Bouwinvest Dutch Institutional Retail Fund N.V. | Annual Report 2016 11
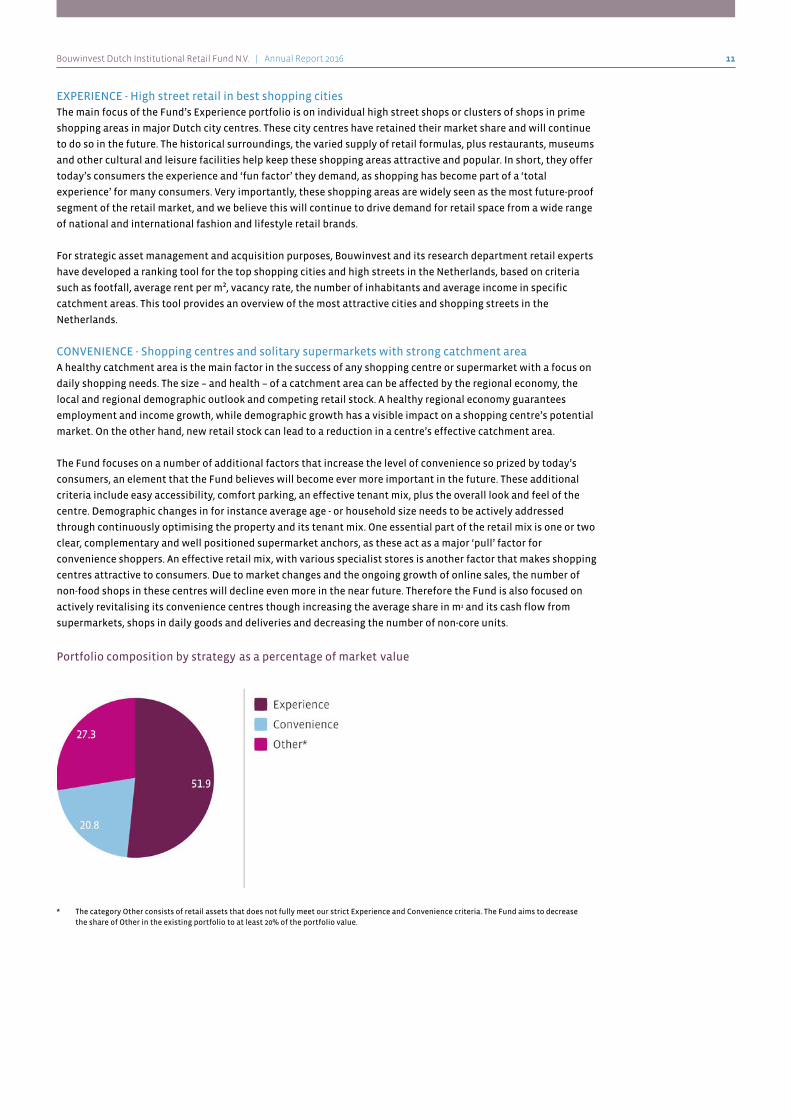
EXPERIENCE - High street retail in best shopping citiesThe main focus of the Fund’s Experience portfolio is on individual high street shops or clusters of shops in prime
shopping areas in major Dutch city centres. These city centres have retained their market share and will continue
to do so in the future. The historical surroundings, the varied supply of retail formulas, plus restaurants, museums
and other cultural and leisure facilities help keep these shopping areas attractive and popular. In short, they offer
today’s consumers the experience and ‘fun factor’ they demand, as shopping has become part of a ‘total
experience’ for many consumers. Very importantly, these shopping areas are widely seen as the most future-proof
segment of the retail market, and we believe this will continue to drive demand for retail space from a wide range
of national and international fashion and lifestyle retail brands.
For strategic asset management and acquisition purposes, Bouwinvest and its research department retail experts
have developed a ranking tool for the top shopping cities and high streets in the Netherlands, based on criteria
such as footfall, average rent per m², vacancy rate, the number of inhabitants and average income in specific
catchment areas. This tool provides an overview of the most attractive cities and shopping streets in the
Netherlands.
CONVENIENCE - Shopping centres and solitary supermarkets with strong catchment areaA healthy catchment area is the main factor in the success of any shopping centre or supermarket with a focus on
daily shopping needs. The size – and health – of a catchment area can be affected by the regional economy, the
local and regional demographic outlook and competing retail stock. A healthy regional economy guarantees
employment and income growth, while demographic growth has a visible impact on a shopping centre’s potential
market. On the other hand, new retail stock can lead to a reduction in a centre’s effective catchment area.
The Fund focuses on a number of additional factors that increase the level of convenience so prized by today’s
consumers, an element that the Fund believes will become ever more important in the future. These additional
criteria include easy accessibility, comfort parking, an effective tenant mix, plus the overall look and feel of the
centre. Demographic changes in for instance average age - or household size needs to be actively addressed
through continuously optimising the property and its tenant mix. One essential part of the retail mix is one or two
clear, complementary and well positioned supermarket anchors, as these act as a major ‘pull’ factor for
convenience shoppers. An effective retail mix, with various specialist stores is another factor that makes shopping
centres attractive to consumers. Due to market changes and the ongoing growth of online sales, the number of
non-food shops in these centres will decline even more in the near future. Therefore the Fund is also focused on
actively revitalising its convenience centres though increasing the average share in m2 and its cash flow from
supermarkets, shops in daily goods and deliveries and decreasing the number of non-core units.
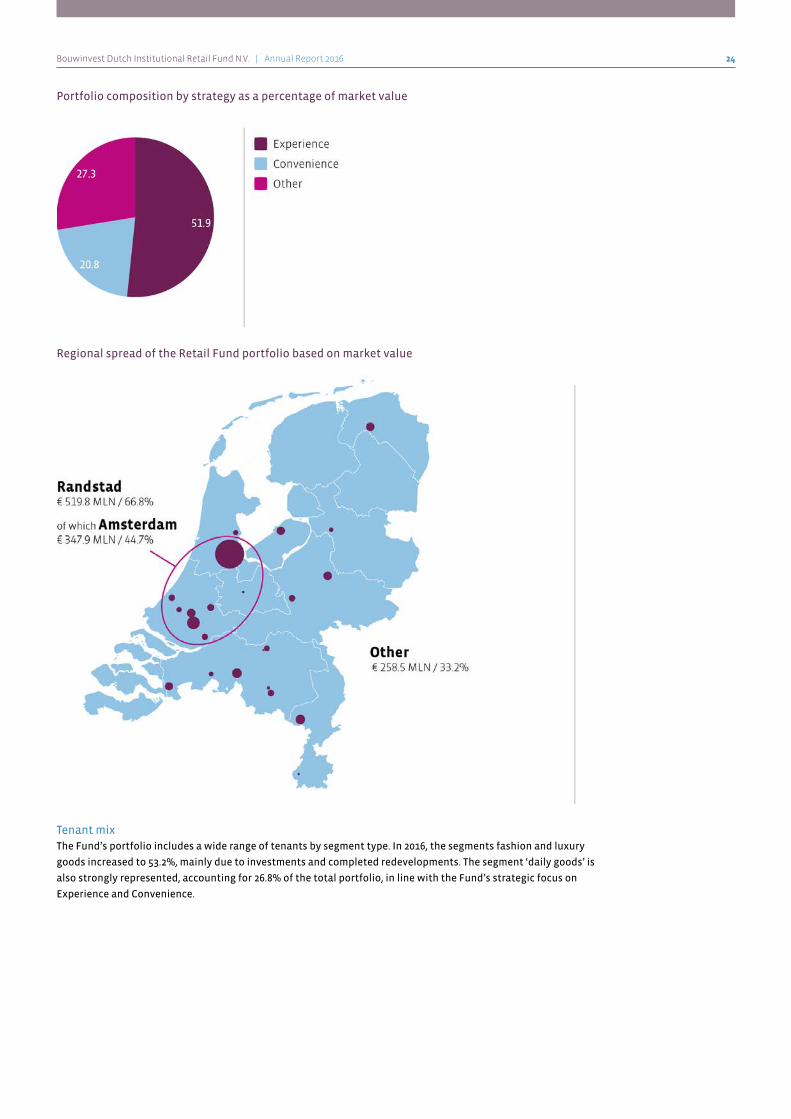
Portfolio composition by strategy as a percentage of market value
* The category Other consists of retail assets that does not fully meet our strict Experience and Convenience criteria. The Fund aims to decrease
the share of Other in the existing portfolio to at least 20% of the portfolio value.

Bouwinvest Dutch Institutional Retail Fund N.V. | Annual Report 2016 12
Selection of principal properties

Bouwinvest Dutch Institutional Retail Fund N.V. | Annual Report 2016 13
Message from the chairman
Dear stakeholders,
The Retail Fund delivered a very strong performance last year, recording a total return of 8.4%, the Fund’s highest
return since 2010 and an outperformance of the IPD Property Index. This was partly driven by the strong rise in
consumer confidence and a clear increase in consumer spending and we saw this improved sentiment reflected in
our valuations last year. It is a clear testament to our strategy of focusing on the segments we believe will be the
growth drivers in the retail sector for many years to come, the Experience and Convenience segments, which was
where we saw the highest revaluations last year. We are already heavily invested in these segments and all our
acquisitions last year qualify as either Experience or Convenience.
The upward revaluations also reflect a number of major redevelopments we have carried out in these segments,
including the Damrak/Nowadays redevelopment in the Experience segment, the largest inner city retail
redevelopment in the capital in many years. This constitutes a huge upgrade for this part of Amsterdam and a
major contribution to Amsterdam city council’s efforts to transform the Damrak in to a fitting gateway into the
capital. It was also a privilege to unveil the wonderful new Beurspassage, complete with the striking Amsterdam
Oersoep artwork. Of course none of this would have been possible without the hard work of all our partners over
the past six years. I’d like to thank all of them for their dedication, creativity and willingness to cooperate.
Of course, we also opened two new assets in the convenience segment in Amsterdam last year, Mosveld and
Stadionplein and we added assets in Breda and Eindhoven. We made steady progress in our strategy of controlled
growth and towards our target of € 1 billion in assets by year-end 2019.
There is still a certain level of volatility in the Retail Fund portfolio, but the balance of Experience and Convenience
and the spread of risks make the portfolio resilient in the face of economic fluctuations. High street retail will
always remain popular in our historical city centres, while the Convenience segment is not very vulnerable to the
growing online shopping trend. And the fact high street retail assets tend to enjoy good indirect returns, while
convenience centres offer good direct returns gives the portfolio a healthy balance on the return front.
There is no denying that the retail market will continue to be challenging in the years ahead. The Netherlands has
one of the most dense retail stocks in Europe and a lot of surplus stock in towns and regions suffering from the
negative impact of urbanisation and population shifts. And yet despite the general acceptance – certainly in the
sector itself – that we need to redevelop existing stock rather than add new retail stock, building permits are still
being issued. And they are primarily being issued for outlet centres, which add little value and actually threaten to
destroy value in the long-term. The potential damage to existing stock from these new centres is something we
monitor very closely when we are looking to acquire new properties.
We believe our strategy and our strong focus on quality and returns have helped us strike a healthy balance in our
portfolio that will stand us in good stead in the years to come. We currently have an occupancy rate of around 95%,
which is high compared with the retail sector as a whole. This is a clear sign that we are getting the balance right,
something borne out by the rapid uptake by retailers of vacant assets last year. We are also building a solid
reputation in the capital market and we managed to attract three new investors last year, which were fully
invested at year-end 2016. For 2017, two investors increased their commitments to the Fund, and one new investor
will be entering the Fund. We look forward to welcoming more new investors in the future.
All that is left is for me to express my gratitude to our investors for their continued trust and all our employees for
their dedication and commitment to Bouwinvest.
Dick van Hal
Chairman of the Board of Directors

Bouwinvest Dutch Institutional Retail Fund N.V. | Annual Report 2016 14
Report of the Board of Directors
Composition of the Board of Directors
Chairman of the Board of Directors and Statutory DirectorD.J. (Dick) van Hal (1958, Dutch)
Dick van Hal has been Chairman of the Board of Directors since his appointment on 1
March 2008. From 1999 until that time, he held several senior positions at Syntrus
Achmea Vastgoed, including Managing Director and CEO. Dick started his career with
Centraal Beheer Beleggingen and Staal Bankiers. He studied Investment Analysis (VBA)
at the University of Amsterdam. Dick is Vice-chairman of IVBN (Dutch Association of
Institutional Investors in Real Estate).
Managing Director FinanceA. (Arno) van Geet (1973, Dutch)
Arno van Geet joined Bouwinvest as Managing Director Finance on 1 October 2014. Prior
to joining Bouwinvest, he spent his entire career in the financial sector, including various management roles at Interpolis and Westland Utrecht Hypotheekbank, most
recently as Chief Financial Officer at Allianz Nederland. Arno is responsible for financial
and risk management, accounting, reporting, corporate control, internal audit,
business process management, IT and research. Arno studied Law and Economics at the
University of Utrecht.
Managing Director Dutch InvestmentsA. (Allard) van Spaandonk (1961, Dutch)
Allard van Spaandonk joined Bouwinvest on 1 November 2008, as Director Asset
Management. As of 1 January 2013, Allard has been Managing Director Dutch
Investments, responsible for investments in Dutch real estate. He was previously the
director of the retail and residential portfolios at Syntrus Achmea Vastgoed, as well as
head of residential mortgages at Achmea Vastgoed. Allard started his real estate career
at ABP Hypotheken in 1986. Allard is a member of the Management Board of the
NEPROM (Dutch association of project development companies).
Managing Director International InvestmentsS.A. (Stephen) Tross (1967, Dutch)
Stephen Tross was appointed as Managing Director International Investments on 1
September 2010. He joined Bouwinvest in 2009 as COO International Investments.
Stephen previously worked in the real estate audit practices at KPMG Accountants NV
and PwC in the Netherlands, New York and London. He studied Business Economics at
the Hogeschool Utrecht and accountancy at NIvRA-Nyenrode. Stephen is a professional
member of the British Institution of Chartered Surveyors and a member of the ANREV
Management Board. Stephen is member of the Supervisory Board of LekkerLeven B.V., a
Dutch Services Company.

Bouwinvest Dutch Institutional Retail Fund N.V. | Annual Report 2016 15
Head of Dutch Retail Investments
C. (Collin) Boelhouwer (1976, Dutch)
Collin Boelhouwer has been Head of Asset Management Retail since 2008. He is
responsible for the performance of the assets of the Bouwinvest Dutch
Institutional Retail Fund. Collin has fourteen years’ experience in real estate
management and gained his retail real estate experience with Fortis Real Estate,
where he was Commercial Real Estate Manager responsible for the asset
management of an office and retail portfolio in the Netherlands. Collin studied
Real Estate Management & Development at the University of Technology
Eindhoven and is a professional member of the RICS since 2010.
Market developments and trends
Economy and demographicsDutch economy shrugs off potential impact of Brexit voteDespite the initial fears triggered by the Brexit vote, the Dutch economy continued its steady recovery in 2016 and
economic growth with a level above 2% actually outpaced earlier projections. This economic growth was driven by
rising business confidence and as a consequence a rise in business investments, on the back of a steady rise in
manufacturing output and continuing export growth. The main negative uncertainties relate to events outside the
Netherlands. The uncertainty triggered by the Brexit vote and the recent U.S. elections, plus a potential economic
slowdown in China, may put a damper on growth and confidence, while geopolitical tensions in various parts of
the world continue to pose a risk to the global economy.
Population growth continuesRecent decades have seen strong population growth and it is expected to continue in the coming years. The total
population and the number of households are expected to continue growing until 2040, stimulating overall
consumer spending. The current population is expected to increase from 16.9 to 17.6 million by 2025, while the
number of households is set to rise by 70,000 each year from the current 7.7 million to 8.3 million by 2025 and 8.6
million by 2040. The largest growth is set to be in single-person households, which are expected to increase from
2.9 million to 3.3 million by 2025.
Trends and developments in the retail marketDutch retail market continues to polarise, sees major shift in demandIn the early part of 2016, the retail sector was still reeling from the bankruptcies of department store V&D, retail
chain Macintosh, Miss Etam, Perry Sport and pharmacist DA, all of whom failed to keep up with changing
consumer preferences and shopping behavior. However, some of these retailers made a restart by restructuring
their business through repelling non-core locations and reopening their best performing and potential healthy
businesses. At the same time, the Dutch retail market has seen a marked upsurge in new leases with (international)
formulas, such as Primark and Zara, who have adapted swiftly and now have a solid position on the Dutch retail
market. In addition, much of the retail space in prime locations left vacant by these bankruptcies is currently being
taken up by retailers entering the Dutch market or existing retailers expanding their floor space. In early 2016,
Canadian retail giant Hudson’s Bay announced plans for 20 new stores in the Netherlands and by October had
sighed 13 lease deals for its Hudson’s Bay and Sax Off 5th formulas in former V&D locations. Polarisation among
retailers and investors is expected to continue in the next few years and like Hudson’s Bay, new and existing
retailers – and investors - are likely to focus on opportunities in the Top cities, with Amsterdam leading the pack.
Major cities will continue to outperformOccupancy rates are expected to remain high in large urban shopping areas and these areas are most likely to see
continued healthy rental growth in the future. Major cities such as Amsterdam, Utrecht, Rotterdam and The Hague
are in the best position to take advantage of technological, demographic and economic developments, with a
number of regional cities with a strong economic and demographic outlook in the following pack. Central
shopping areas that offer the ‘fun-factor’ in the form of cultural and leisure facilities are expected to continue to
deliver strong returns, as are ancillary district shopping centres with a focus on daily shopping needs in strong
catchment areas. Central shopping areas in medium-sized and small cities will generate lower returns, as will
ancillary shopping areas with few square metres devoted to non-daily shopping and peripheral shopping areas.

Bouwinvest Dutch Institutional Retail Fund N.V. | Annual Report 2016 16
Physical and digital shops convergeOnline shopping continued to grow in 2016 and once again saw double digit growth in the first three quarters of
the year, way above the modest growth seen in retail sales through physical stores. Once again, food sales from
supermarkets and other grocery-related shops exceeded the growth in non-food sectors such as fashion and
electronics. It should be noted that while online shopping is having a major impact on the retail sector, it is largely
focused on certain sectors, such as travel, electronics, media and clothes. As a result, it has so far had a limited
impact on the overall retail landscape, as these sectors make up only 7% of the total market. An increasing number
of retailers are also waking up to the potential of multi-channel or omni-channel sales strategies, and many saw
their highest sales increases via online channels in 2016. Large numbers of consumers now see online research as
an essential part of their shopping experience and often combine online and physical shopping. That said,
consumers are becoming ever more demanding and retailers are being forced to meet the high standards with
respect to both online shopping options (delivery or pick-up) and the look and feel of their physical stores. On top
of all this, pure online players are now exploring the possibility of opening physical stores and several major online
retailers have announced plans for bricks and mortar outlets.
Redevelopment the key to healthy future for retail sectorGiven the current overcapacity on the Dutch retail market, most players now agree the future of a healthy and
vibrant retail real estate market will require much greater emphasis on redevelopment, commercial
refurbishment, marketing and branding, rather than the addition of new retail stock. The redevelopment and
modernisation of existing stock will help the sector to avoid a worsening of the supply/demand ratio in the Dutch
retail market. Fortunately, government retail policy introduced this year, is aimed at safeguarding the existing
retail structure and discouraging the realisation of new retail supply. We expect to see an increase in
redevelopment opportunities, especially in prime high street areas where leading retailers are demanding larger
floor plans. On top of this, the Netherlands has a large stock of district shopping centres in need of a qualitative
transformation, from one-dimensional shopping centres (or shopping areas) to multi-dimensional centres. These
represent a major opportunity for investors with a clear vision of the future of the Dutch retail sector and a strong
commitment to ‘convenience’ retail.
District shopping centres offer opportunities for value growthThe strong and stable sales growth in the food segment seen in 2016 continues to boost ancillary shopping areas
with a strong focus on daily shopping and this is expect to continue for the foreseeable future. The best district
shopping centres tend to include a number of complementary specialty shops, such as bakeries and quality
butchers, in addition to their anchor supermarket(s), offering consumers a wider selection, greater service and
higher quality. That said, even in this segment, urbanisation and ageing divide the landscape into locations that
are future-proof and locations that are less viable, as they are located in areas where purchasing power is
expected to decline. District shopping centres attract considerable capital due to their historically high yield gaps.
When location and the retailer mix are well matched, the risk of vacancy is relatively limited. Thanks to the
ongoing recovery in economic growth, there is some chance of value growth in the medium term.
Another development on this front is the growth of new food formulas responding to consumer trends, such as
local sourcing and ecological responsibility, and winning continued repeat business. These are helping the larger
district centres and small district and neighbourhood centres to keep both occupancy and lease rates at a healthy
level.
New leasehold conditions AmsterdamCurrently the municipality of Amsterdam is in a process of renewing the current leasehold conditions. Concept
lease hold conditions have been published, which has led to quite some response and turmoil. The reaction of the
municipality on this turmoil was that the municipality will review and analyse all reactions and that this may lead
to an adjusted concept. At this moment it’s unclear what the final version of the lease hold conditions will
encompass and if and to what extent these possibly adjusted lease hold conditions will affect the value of the
investments of the Fund in Amsterdam. The Fund has € 57 million exposure at year-end 2016 in Amsterdam for in
total 4 properties. Bouwinvest is monitoring this matter closely and possible steps to mitigate any loss of
investment values will depend on the outcome of the new leasehold conditions.

Bouwinvest Dutch Institutional Retail Fund N.V. | Annual Report 2016 17
Implications for retail real estateStrong demand for Dutch real estate investmentsAfter climbing to their highest level since 2007 in 2015, Dutch real estate investment volumes came in at € 13.5
billion in 2016, which is about 9% higher than the level in 2015. Of this figure about 2.1 billion euro was invested in
retail real estate, which is 22% below the total retail investments in 2015 of € 2.7 billion, however still a high level.
Foreign investors now account for around 55% of the total investment volume and are showing continued interest
in the investment market. With interest rates in the U.S. slowly increasing and real estate prices in other key
markets such as London, Paris and Munich having already increased, investment momentum is picking up in
continental Europe, including the Dutch real estate markets. More risk-seeking investors have become more active
on both the buy and sell side. Supported by the economic recovery across the country, prices of secondary
locations are expected to increase. However, the continuing interest of both Dutch and international investors is
quickly pushing up prices. This trend is expected to continue in the coming years. For core investors, it is now
essential to have the right relationships in the market and to be a partner in the early stages of development or
buying processes, as this enables them to select the right assets for an attractive risk-return profile. Compared to
more opportune competitors, investors with in-depth real estate knowledge and active asset management teams
will be the ones that can add value and that will therefore outperform in the long run.
Experience is major advantage for high streets in big citiesThe ongoing growth in online sales will have less of an impact on A1 shopping areas in big cities. And thanks to the
urbanisation trend, larger Dutch cities have by far the best demographic and economic outlook. These cities also
offer the best ‘shopping experience’ for consumers, as they tend to offer a wide range of additional attractions,
such as historical centres, museums, restaurants and other amenities. Location is another major factor in terms of
adding the experience element for both local consumers and visitors. On top of the continuing demand from
traditional high street retailers, new opportunities are emerging from the recent trend of online retailers opening
physical shops to bolster their brand.
Large and top located retail units in prime shopping streets still in demandThe trend of retailers looking for larger retail units or units on top locations continued in 2016 and is gaining pace.
Major national and international fashion chains in particular are demanding more retail space per outlet,
especially in the major urban centres of the Netherlands. Due to the relatively small amount of suitable space
currently available, demand will continue to be strong, particularly in cities like Amsterdam, Utrecht and
Rotterdam. This is helping to compensate for the loss of both large and small retailers in the troubled fashion
sector and 2016 saw the fairly rapid take-up of vacant space created by the bankruptcies of a number of leading
retail groups.
Consumer convenience drives focused shopping centresDistrict shopping centres with a focus on daily groceries are also well positioned to thrive in the online
environment. Food has proven to be a resilient segment of the Dutch retail market and has seen consistent growth
over the past few years. The combination of a local meeting place with supermarkets as strong anchor stores
accompanied by a complete offering of high quality daily products and services also means these centres have felt
little impact from online shopping. This type of retail real estate remains an attractive long-term investment. Good
accessibility and parking facilities are vital.
The Fund’s optimisation strategy
The Retail Fund aims to increase its assets under management to approximately € 1 billion by 2019. The main
drivers of this growth will be acquisitions. The Fund’s strategy focuses on retail real estate that is generating
stable returns now and will continue to do so in the future, taking into account the trends and developments in
the retail market. The Fund’s execution of this strategy is based on the belief that the future of retail real estate
will be determined by two very distinct segments of the market: high street shopping areas that offer consumers a
distinctive Experience and district shopping centres or solitary supermarkets that provide very high levels of
Convenience. To achieve its targets, the Retail Fund aims to optimise its portfolio through targeted acquisitions,
the redevelopment of core assets and the disposal of non-core retail units. We believe that the current competitive
market requires specialised, well-positioned retail assets. Our strategy is to focus on what we believe will be the
two decisive elements in the future of Retail:
• Experience: High street retail units, focus on A1 locations in major shopping cities
• Convenience: District shopping centres and solitary supermarkets, focus on catchment areas, strong tenant
mix and accessibility

Bouwinvest Dutch Institutional Retail Fund N.V. | Annual Report 2016 18
In addition, the key building blocks in the Fund’s strategy are:
• Redevelopment: expansion/redevelopment of well-located shopping centres and retail units to meet the
quality requirements of modern retail
• Active, customised asset management: maintaining high occupancy levels by developing close relationships
with tenants, local authorities and consumers
• Focus on retail tenants less sensitive to economic cycles as well as innovative retailers adding value in
terms of both convenience as experience

Bouwinvest Dutch Institutional Retail Fund N.V. | Annual Report 2016 19
Portfolio developments 2016 in perspective
Portfolio composition at year-end 2016:• 47 Dutch retail properties
• 209,979 m² of lettable floor space
• Total value of investment property of € 778 million
Diversification guidelines and investment restrictionsDuring the financial year, the Fund adhered to its diversification guidelines and investment restrictions.
Diversification guidelines Current portfolio Conclusion
≥ 80% of investments invested in high street retail and district shopping centres95.9% in high street retail and district
shopping centresCompliant
≥ 90% of investments invested in low or medium risk categories 95.9% in low and medium risk Compliant
Investment restrictions when the total investments of the Fund are > € 750 million
< 15% invested in single investment propertyThere is one investment property
exceeding 15%
Compliant
with remark
(*)
< 10% invested in non-core properties (non-retail investment properties) 0% concerns non-core Retail properties Compliant
No investments that will have a material adverse effect on the Fund’s Diversification
Guidelines.
There have been no investments in 2016
that have a material adverse effect on the
Fund's diversification guidelines
Compliant
Restrictions on (re)development activities < 5% of the Fund's total investment
portfolio value
a. only Assets from the Fund's porfolio aualify for (re)development
In 2016 all (re)development activities were
executed only for assets of the Fund's
portfolio
Compliant
b. the activities are exclusively targeted at optimising the quality of the portfolioAll activities were targeted at optimising
the quality of the Fund portfolioCompliant
c. not allowed if it has a negative impact on the Fund’s Diversification GuidelinesThere was no negative impact on the
Fund's diversification guidelinesCompliant
d. signed commitments relating to at least 60% of the rental income of the Asset is
requiredCommitment > 60% Compliant
e. (re)development is undertaken by and for the risk and account of Bouwinvest
Retail Development, a wholly owned subsidiary of the Fund
All (re)development activities are
undertaken by and for the risk and
account of Bouwinvest Retail
Development
Compliant
f. all financial risks in connection with the work to be conducted as part of the
(re)development will be contractually excluded by Bouwinvest Retail Development
and transferred to external developers or contractors. Examples of such risks are:
design and building risks and cost and planning risks
All financial risks in connection with the
work to be conducted as part of the
(re)development are contractually
excluded by Bouwinvest Retail
Development and transferred to external
developers or contractors
Compliant
g. zoning risks remain with the Fund, however starting the building activities in
relation to a (re)development is conditional upon obtaining the relevant zoning
permits
The building activities in relation to a
(re)development were conditional upon
obtaining the relevant zoning permits
Compliant
(*) The management made an exception for the investment property Damrak, because of its unique retail location
and it’s low risk profile
Investments, divestments and (re)developmentsDue to the various ongoing and completed redevelopments, 2016 was once again a year of optimisation. The Fund
invested a total € 31 million in new turn key acquisitions and redevelopments, which helped take the total value of
the portfolio to € 778 million. All the new-delivered and redeveloped assets bolster either the ‘Experience’ or
‘Convenience’ portfolios.

Bouwinvest Dutch Institutional Retail Fund N.V. | Annual Report 2016 20
New assets in the portfolioStadionplein, AmsterdamThe Fund acquired an eye-catching multi-use complex in the historic district of Amsterdam-Zuid, near the 1928
Olympic Stadium. The new development includes approximately 4,500 m² of retail space and is a very distinctive
addition to the neighbourhood, thanks to its much larger shops, especially the Albert Heijn supermarket, and its
superb access by road and public transport. The shopping centre opened in 2016 and focuses primarily on healthy
foods, anticipating the growing demand for this type of product in its high-end catchment area.
Mosveld, AmsterdamThe Fund acquired the Mosveld shopping centre in the revitalised and increasingly popular southern part of
Amsterdam-Noord. This centre has a substantial and growing catchment area, thanks to the ongoing
transformation of this former harbour area, including numerous residential and cultural developments. The 7,700
m² Mosveld shopping centre focuses on shopping for daily goods. Anchored by two modern supermarkets (Albert
Heijn and Deen), a central location in the neighbourhood and its own parking area, the centre offers all the
convenience the Fund demands. Mosveld opened July 2016.
Ginnekenstraat 42, 57 and Ridderstraat 17, BredaThe Fund acquired three high street assets in Breda, a city in the strong urban conurbation known as Brabantstad.
This region includes a number of the top retail cities in the Netherlands outside the Randstad conurbation. The
retail units have been leased to retailer SIX and international retailers Adidas and Tommy Hilfiger. The total surface
area of the three stores is 620 m2. The acquisition is a good fit with the Retail Fund’s ‘Experience’ strategy.

Bouwinvest Dutch Institutional Retail Fund N.V. | Annual Report 2016 21
Rechtestraat 35, EindhovenIn Eindhoven, the Fund acquired a retail property shop in the Rechtestraat, part of historic shopping area and the
busiest shopping street after Demer. The building includes 440 m2 of leasable area and is rented to Dutch fashion
brand Claudia Sträter. The acquisition is a good match with the ‘Experience’ element of the Retail Fund’s strategy.
Eindhoven is the city with the largest retail offering in the province of Noord-Brabant and is among the Top-10
most attractive Dutch cities for shopping.
Completed redevelopments Damrak 70, AmsterdamOne of the highlights of 2016 was the official opening of the new Beurspassage on Amsterdam’s Damrak by Mayor
Eberhard van der Laan. With an impressive ceiling made up of 450 m2 of glass mosaic tiles, a traditionally crafted
terrazzo floor, giant art deco mirrors and gilded chandeliers, the Beurspassage is a splendid new icon in the Dutch
capital. The new Beurspassage is also the crowning glory of the Nowadays redevelopment. Over the past six years,
the Retail Fund has transformed the dated buildings at Damrak 70, 80 and Nieuwendijk 196 into hyper-modern
locations for international retailers such as Zara, JD Sports, C&A and Primark. The project has a total leasable area
of 27,500 m2, making it a very large project in the retail heart of Amsterdam and a major part of the city centre’s
retail offering in this gateway to the city for millions of residents and visitors alike
Westerhaven, GroningenThis large-scale redevelopment has given a major boost to the Westerhaven shopping centre in Groningen. The
current shopping centre offers over 14,000 m² of retail space and a parking garage for 800 cars. Westerhaven
includes a traditional shopping street with tenants such as Hema and Kruidvat, plus a two-floor building with
large-scale retail spaces. In 2015, the Retail Fund signed a long term lease with international retailer Primark for
7,000 m² of retail space in Westerhaven. In May 2016, Primark opened its only store in the northern part of the
Netherlands and has already proven a major draw for both consumers and other retailers. In addition to the new
lease with Primark, the Fund renewed its lease with Media Markt for 3,000 m2 of retail space. In 2017, international
retailer Nike will open a new 1,000-m2 store in the former site of a C&A store.

Bouwinvest Dutch Institutional Retail Fund N.V. | Annual Report 2016 22
Redevelopment investmentsMolenhoekpassage, RosmalenTo maintain the high quality of this successful shopping centre for daily goods and reduce the risk of vacancy, the
Fund is upgrading and updating the look and feel of this centre and adapted the division of retail spaces to the
demands of the current tenants. The Albert Heijn supermarket has added over 500 m² to its current retail space and
the Fund has improved the routing within the centre as well as the accessibility and number of parking spaces to
the new consumer demands. Thanks to these changes, combined with the arrival of a second supermarket (Aldi)
nearby, the Fund expects Molenhoekpassage to retain its strong market position in Rosmalen, part of the city of
‘s-Hertogenbosch. Full completion is expected in Q1 2017.
Goverwelle, GoudaThe Fund is investing in the upgrade and expansion of the Goverwelle shopping centre. The 1,000 m² extension will
create space for the expansion of the Albert Heijn supermarket and for adding a second, complementary discount
supermarket, plus additional parking facilities for 235 cars. Bouwinvest expects to complete this redevelopment in
2018.
Muntpassage WeertThe Fund is currently evaluating a potential upgrade of the Muntpassage shopping centre in combination with the
letting of 3,500 m2 of vacant retail space following the bankruptcy of former tenant V&D. As part of this evaluation,
the Fund is currently in negotiations with several retailers for units in the renovated shopping centre. If these
negotiations turn out to be successful and the investment is in line with the Funds strategy, Bouwinvest expects to
complete this redevelopment in 2018.
Bouwinvest Dutch Institutional Retail Fund N.V. | Annual Report 2016 23
Secured pipelineCentrumplan, RosmalenThe investment Centrumplan in Rosmalen includes the acquisition of 17 retail units with a combined size of
around 6,800 m2, which will form the expansion and completion of the current Rosmalen shopping centre.
Construction is scheduled to start in Q1 2017 and delivery is expected in Q1 of 2018. The expected total annual
rental income for the entire plan is estimated at around € 1.4 million upon delivery.
The main anchors are two supermarkets: Jumbo (around 2,000 m2) and the Lidl (around 1,800 m2), together with a
number of daily grocery units. In addition, national retailers such as Kruidvat and HEMA are set to open stores in
this new city centre area, together with a Brasserie located in a historical building. The average life of the contracts
that have been signed is around 8.3 years from delivery.
This investment is a good fit with the ‘Convenience’ element of the Fund’s strategy, which includes investments in
local shopping centres with a healthy catchment area, anchored by supermarkets, with ample parking facilities
and a retail mix geared towards daily shopping needs
Broerstraat 52 and 52a, Nijmegen
The Fund acquires two high street units in the Broerstraat, the busiest shopping street in Nijmegen. The units are
rented by retailer Men at Work B.V. and Nelson Schoenen B.V. and includes 613 m2 leasable area on the ground
floor and 500 m2 basement area. Nijmegen is among the Top-10 most attractive Dutch cities for shopping, so the
acquisition is a good match with the ‘Experience’ element of the Retail Fund’s strategy.
DivestmentsAssets that do not fit our strategic requirements regarding Experience or Convenience because of their location,
size or economic outlook will be sold. In line with these divestment criteria, we concluded the sale of the 2,100-m2
Kop Van Zuid asset in Rotterdam in early 2016.
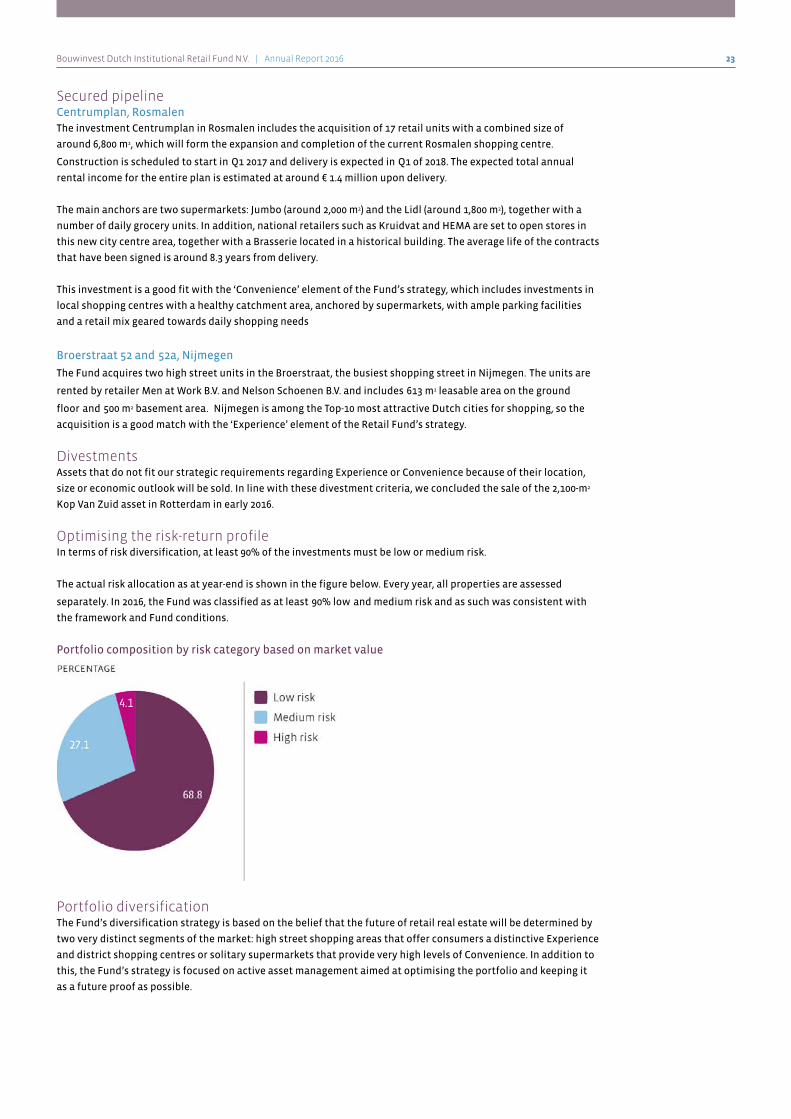
Optimising the risk-return profileIn terms of risk diversification, at least 90% of the investments must be low or medium risk.
The actual risk allocation as at year-end is shown in the figure below. Every year, all properties are assessed
separately. In 2016, the Fund was classified as at least 90% low and medium risk and as such was consistent with
the framework and Fund conditions.
Portfolio composition by risk category based on market value
Portfolio diversificationThe Fund’s diversification strategy is based on the belief that the future of retail real estate will be determined by
two very distinct segments of the market: high street shopping areas that offer consumers a distinctive Experience
and district shopping centres or solitary supermarkets that provide very high levels of Convenience. In addition to
this, the Fund’s strategy is focused on active asset management aimed at optimising the portfolio and keeping it
as a future proof as possible.
Bouwinvest Dutch Institutional Retail Fund N.V. | Annual Report 2016 24
Portfolio composition by strategy as a percentage of market value
Regional spread of the Retail Fund portfolio based on market value
Tenant mixThe Fund’s portfolio includes a wide range of tenants by segment type. In 2016, the segments fashion and luxury
goods increased to 53.2%, mainly due to investments and completed redevelopments. The segment ‘daily goods’ is
also strongly represented, accounting for 26.8% of the total portfolio, in line with the Fund’s strategic focus on
Experience and Convenience.
Bouwinvest Dutch Institutional Retail Fund N.V. | Annual Report 2016 25
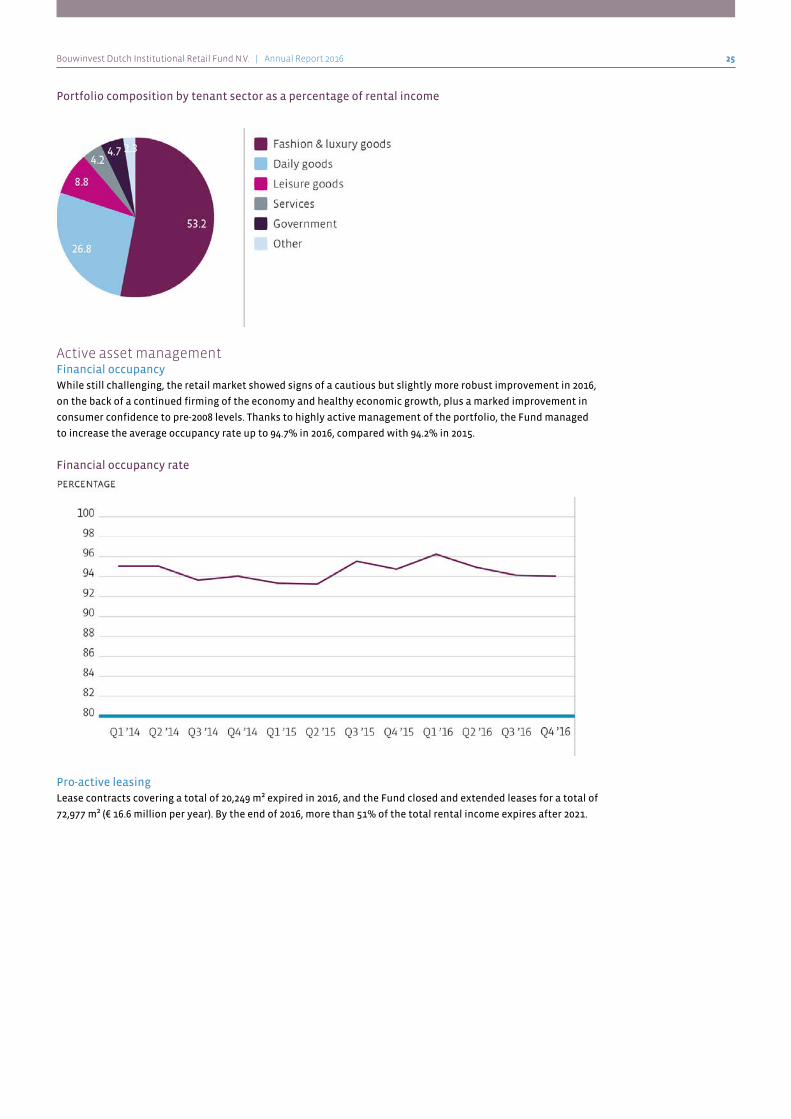
Portfolio composition by tenant sector as a percentage of rental income
Active asset managementFinancial occupancyWhile still challenging, the retail market showed signs of a cautious but slightly more robust improvement in 2016,
on the back of a continued firming of the economy and healthy economic growth, plus a marked improvement in
consumer confidence to pre-2008 levels. Thanks to highly active management of the portfolio, the Fund managed
to increase the average occupancy rate up to 94.7% in 2016, compared with 94.2% in 2015.
Financial occupancy rate
Pro-active leasingLease contracts covering a total of 20,249 m² expired in 2016, and the Fund closed and extended leases for a total of
72,977 m² (€ 16.6 million per year). By the end of 2016, more than 51% of the total rental income expires after 2021.
Bouwinvest Dutch Institutional Retail Fund N.V. | Annual Report 2016 26
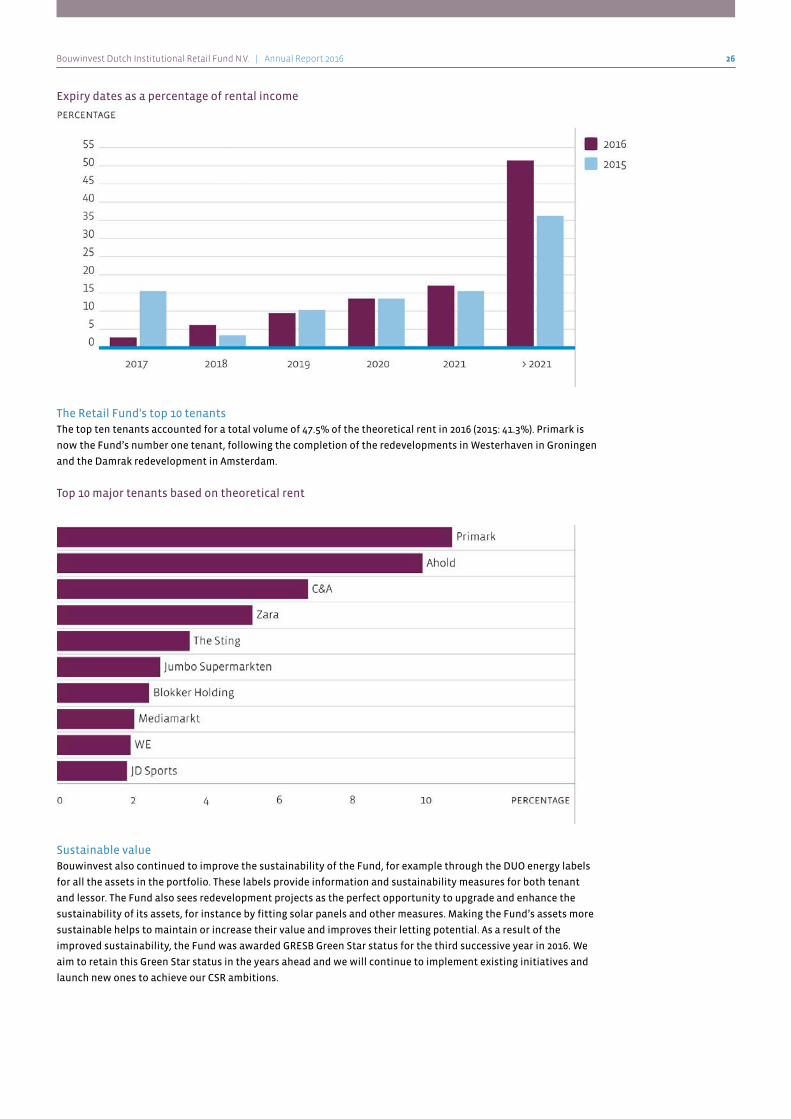
Expiry dates as a percentage of rental income
The Retail Fund's top 10 tenantsThe top ten tenants accounted for a total volume of 47.5% of the theoretical rent in 2016 (2015: 41.3%). Primark is
now the Fund’s number one tenant, following the completion of the redevelopments in Westerhaven in Groningen
and the Damrak redevelopment in Amsterdam.
Top 10 major tenants based on theoretical rent
Sustainable valueBouwinvest also continued to improve the sustainability of the Fund, for example through the DUO energy labels
for all the assets in the portfolio. These labels provide information and sustainability measures for both tenant
and lessor. The Fund also sees redevelopment projects as the perfect opportunity to upgrade and enhance the
sustainability of its assets, for instance by fitting solar panels and other measures. Making the Fund’s assets more
sustainable helps to maintain or increase their value and improves their letting potential. As a result of the
improved sustainability, the Fund was awarded GRESB Green Star status for the third successive year in 2016. We
aim to retain this Green Star status in the years ahead and we will continue to implement existing initiatives and
launch new ones to achieve our CSR ambitions.

Bouwinvest Dutch Institutional Retail Fund N.V. | Annual Report 2016 27
Financial performance in 2016
Total returnThe Fund realised a total fund retun of 8.4% (2015: 4.5%), consisting of a 4.6% income return (2015: 4.4%) and a
3.9% capital growth (2015: 0.1%). The total return in Euro's grew to € 64.3 million in 2016, from € 32.2 million in 2015.
The main driver of the growth in the total return was the increase in capital growth, compared to 2015.
The Fund's NAV grew to € 824 million from € 738 in 2015, a growth of 12%. The main drivers of the NAV growth were
the acquisitions of investment property, the completion of new assets and redevelopments, and the positive
revaluations of the investment properties in the portfolio.
Income returnThe Fund realised an income return of 4.6% in 2016, 0.2%-point higher than in 2015.
The main driver of the increase in the income return for 2016, compared to 2015, is the increase of the net rental
income in 2016. Due to acquisitions, the completion of new assets and redevelopment, the net rental income in
2016 increased with 13.9% compared to 2015. Also the modest result on the disposal of Kop van Zuid shopping
Centre in Rotterdam contributed to a higher income return in 2016.
The secured rent until 2019 (three-year horizon) at year-end 2016 increased to 91% of the 2016 gross rental income
(year-end 2015: 83%). The Fund’s expiration risk is very low since more than half of the total rental income of the
Fund (51.4%) expires after 2021. In 2016, the new and extended lease contracts, totaling a 72,977 m² and a rental
value of € 16.6 million per year, also contributed to the increase of the secured rent and thereby lowering the
expiration risk for The Fund. As a result of the new and extend lease contracts, the average financial occupancy
rate also increased to 94.7% in 2016, compared to 94.2% in 2015.
Capital growthThe Fund realised a capital growth of 3.9% in 2016, 3.8%-point more then in 2015.
Property values continued to show an upward trend in 2016 compared to 2015. We believe that this is due to the
fact that the Fund is largely invested in the Randstad conurbation and the Fund's continued focus on optimising
the portfolio by upgrading and future-proofing the assets.
Property performanceThe total property return for 2016 came in at 9.3% (2015: 5.3%), consisting of a 5.2% direct property return (2015:
5.0%) and a 4.1% indirect property return (2015: 0.3%). The total property return is with 9.3% an outperformance of
5.5% of the the IPD Property Index return 3.8%.
The fund return (INREV) and property return (IPD) are different performance indicators. The fund return is
calculated according to the INREV Guidelines as a percentage of the net asset value (INREV NAV) and the property
return is calculated according to the IPD methodology as a percentage of the value of the investment properties.
INREV e.g. includes cash, the fee costs and administrative costs in the calculation of the income return (INREV).
Furthermore the amortisation of acquisition is threated differently by INREV and IPD.
Capital ManagementLeverageIn accordance with the Information Memorandum, The Fund will be financed solely with equity and will have no
leverage, but may borrow a maximum of 3% of the balance sheet total for liquidity management purposes.
During 2016, the Fund was solely financed with equity and did not use any loan capital for liquidity management
purposes.
Treasury managementFor treasury management the Fund acted accordingly its treasury policy in 2016, in order to manage liquidity and
financial risks for the Fund. The main objectives of the treasury management activities were to secure
shareholders’ dividend pay-out and liquidity by redemptions, as well as managing the Fund’s cash position.

Bouwinvest Dutch Institutional Retail Fund N.V. | Annual Report 2016 28
At year-end 2016, The Fund had € 39.8 million in freely available cash and € 13.5 million in a 30-day deposit as at 31
December 2016. During 2016 the cash position increased by € 25.7 million, as compared to year-end 2015.
During 2016, The Fund paid € 33.4 million as dividend to the shareholders. Also during 2016, two capital calls were
executed at a total amount of € 55 million.
Interest rate and currency exposureDuring 2016 The Fund was subject to the negative interest rate development for its bank balances. In order to
minimalize the costs of the negative interest rate on the bank balances, during 2016 the Fund used 30-day bank
deposits.
As the Fund had no external loans and borrowings during 2016, as well as The Fund did not had any foreign
currency exposure during 2016, The Fund had no exposure to interest rate risks or currency exposure risks.
Dividend and dividend policyThe Board of Directors of Bouwinvest proposes to pay a dividend of € 114.76 per share for 2016 (2015: € 108.84),
which corresponds to a pay-out ratio of 100%. It is proposed that the dividend be paid in cash, within the
constraints imposed by the company’s fiscal investment institution (FII) status. Of this total dividend, 76.4% was
paid out in 2016, with the final quarterly instalment paid out in March 2016. The remainder of the distribution over
2016 will be paid out in a final instalment on 25 April 2017, following approval by the Annual General Meeting of
Shareholders to be held on 12 April 2017.
TaxThe Fund is structured as a fiscal investment institution (FII) under Dutch law and is therefore not subject to
corporate tax. Being an FII, the Fund is obliged by law to maintain a pay-out ratio of 100% of the Fund’s
distributable profit; as stated above, the Fund proposed to pay out 100% of its distributable profit. The Fund met
its obligations related to value added tax, transfer tax and other applicable taxes in their entirety in 2016.
AIFMDBouwinvest is the fund manager of the Retail Fund. In February 2014, Bouwinvest was among the first Dutch
institutions to obtain the AIFMD licence. Under this licence, Intertrust Depositary Services B.V. acts as independent
depositary of the Fund for the benefit of the investors and performs all depositary functions and duties pursuant
to AIFMD regulations.
Outlook
We are cautiously optimistic on the outlook for the Dutch economy, following a marked pick-up in growth in the
course of 2016 as the Dutch economy appeared to shrug off the initial shock of the Brexit vote. Unemployment
continued to fall in 2016 and consumer confidence reached the highest level since the 2008 financial crisis and
these factors will all have a positive impact on the Dutch retail sector in the year(s) ahead. In addition, persistent
low inflation is set to boost consumer spending by some 2% annually for the foreseeable future. All in all, this is
likely to increase demand for retail space in the main shopping areas of the larger Dutch cities, especially the cities
in the Randstad urban conurbation, and in district shopping centres with healthy catchment areas.
Urbanisation and demographics key factorsPopulation growth and urbanisation will continue to be key trends in the coming years. Both the total population
and the total number of households in the Netherlands will continue to grow in the coming decades. However,
demographic growth will be concentrated in the core regions of the country, with the biggest growth forecast for
the cities of the Randstad urban conurbation. Due in part to the aging of the population and the movement of
younger people to the cities, other parts of the country will see a decline in population, which will affect the
qualitative and quantitative demand for retail space in the decades ahead.

Bouwinvest Dutch Institutional Retail Fund N.V. | Annual Report 2016 29
Polarisation set to continueIn view of these trends, the value gap between primary and secondary locations is likely to widen in the years
ahead. This will affect both high street retail and local shopping centres, and there will be both winners and losers
on these fronts. The major cities are still the best positioned to take advantage of demographic, economic and
technological developments. Central shopping areas in these cities will continue to outperform and deliver strong
returns, as will district shopping centres with healthy catchment areas throughout The Netherlands. The losers are
likely to be central shopping areas in medium-sized and smaller cities and ancillary shopping areas without an
adequate supply of non-daily shopping retail outlets.
Physical and digital shops convergeOnline sales are continuing to increase and will be a key factor in the retail market for many years to come.
However, as online sales are largely confined to a small number of retail segments, such as travel, electronics,
media and clothes, the impact on the retail market as a whole will be limited. Also, a number of major online
retailers have now opened or are planning to open physical stores to boost brand engagement and client loyalty.
Competition for investment-grade retail real estate increasingThe demand for high-quality retail real estate is rising steadily, fueled by increased activity among Dutch investors
and an influx of foreign capital from international investors. Dutch retail real estate is still attractively priced
when compared with prices in other key European markets, such as London, Paris or Munich. This is pushing up
prices for prime properties and will make it more challenging to find and acquire new assets at the right price.
Future-proofingWe believe that prime retail locations that excel in our strategic segments of experience and convenience will be
the most future-proof investments in the years ahead. The Fund will therefore continue to optimise its portfolio,
by investing in distinctive and high-quality high street retail units in the major shopping cities (A1 locations) and in
well-positioned daily shopping centres with a clear focus on convenience.
The retail market as a whole is still facing many challenges. However, we made solid progress in terms of portfolio
optimisation and the (re)development of several key assets in 2016. We believe this has put the Fund in an even
stronger position for the future. We will continue these efforts in 2017, again taking delivery of new assets and
reopening redevelopments for business.
Amsterdam, 20 March 2017
Bouwinvest Real Estate Investment Management B.V.Dick van Hal, Chairman of the Board of Directors and Statutory Director
Arno van Geet, Managing Director Finance
Allard van Spaandonk, Managing Director Dutch Investments
Stephen Tross, Managing Director International Investments

Bouwinvest Dutch Institutional Retail Fund N.V. | Annual Report 2016 30
Corporate Social Responsibility
CSR strategy
Bouwinvest aims to provide a solid return on real estate investments for institutional investors and their
beneficiaries and to do this in a responsible manner. What this means is that we take a long-term view and
environmental, social and governance (ESG) criteria play a significant role in our investment strategy. We have
integrated social, environmental, and/or ethical considerations in our core business strategy and operations to
create more value for our stakeholders and generate better risk-adjusted financial returns for our investors.
Sustainable and socially responsible investments and business operations play a key role in booking growth in a
controlled manner, future-proofing our organisation and real estate investments and is part of the role we want to
play in tackling the challenges we all face today and in the future. In other words, we see sustainability as an
inherent part of our corporate mission and our license to operate.
Our sustainability missionCreate and sustain stakeholder value through effective integration of material ESG issues that lower risks and
future proof our real estate investments, enhance the skills and satisfaction of our employees and contribute to
the development of the communities we invest in.
Our strategy to achieve this goal is based on three main pillars:
1. Long term performance; we want to provide stable returns and improve overall performance
2. Building value; we want to create added value for all our stakeholders
3. Sustainable partnerships; we want to develop and maintain sustainable partnerships with our stakeholders
With our Sustainability strategy in place, we can respond to issues such as: investment market changes; shifting
consumer demands; legislation and regulation compliance; climate change; minimising the use of natural
resources. And we can do all this while still creating value for our stakeholders.
Long-term performanceIn line with Bouwinvest's CSR pillars, the Retail Fund’s sustainability strategy is focused on increasing the
sustainability performance and attractiveness of its retail assets. Not only does this boost the long-term
performance of the Retail Fund's assets, it also increases the total value of the Fund’s property portfolio and
creates financial and social value for all the Fund’s stakeholders.
Building valueThe Fund considers investments in sustainability from a business perspective. Energy-efficiency measures improve
the competitive position of the Fund’s retail properties and add value for our stakeholders, both investors and
tenants. However, the Fund’s sustainability strategy extends beyond energy use to the social aspects of
sustainability, such as investments to upgrade local public amenities and facilities, helping to create a pleasant
environment where people can shop and meet.

Bouwinvest Dutch Institutional Retail Fund N.V. | Annual Report 2016 31
We build value by addressing those issues that are important and relevant to our stakeholders, both tenants (such
as comfort, energy use, materials and indoor climate) and investors (such as risk, returns, governance, stability and
transparency). We engage them in constructive dialogues.
Scope Tool Targets
Fund GRESB Outperformance of the benchmark and retain Green Star rating
Asset EPC labels Generate insight into current performance and reduce operational costs, improve
the quality of assets
Tenants DUO label, Green Leases Increase sustainability awareness among tenants, with a focus on energy use;
cooperation with tenants: education and awareness
Property managers Contracts and meetings Active cooperation to achieve CSR targets
Sustainable partnerships
Cooperation and engagement with our tenants and other stakeholders is an essential part of our sustainability
strategy. We firmly believe that we can achieve the most by working with all our clients and other stakeholders,
sharing ideas and devising innovative solutions to the challenges we all face.
Tenant engagementWe conduct a bi-annual tenant satisfaction survey to gather the information we need to promote the interests of
our tenants. As in previous years, we discussed the results with our property managers and agreed targets, all
aimed at further improving tenant satisfaction. The key results of most recent survey (2015) are:
• 180 tenants responded (response rate of 49%)
• Average satisfaction slightly decreased to 5.8 (2013: 6.0)
Tenant satisfaction has dropped slightly as a result of the predominantly negative sentiment among retailers in
general.
Encourage ESG criteriaIn the context of tenant engagement Bouwinvest believes it is important to test our tenants on financial and ESG
criteria and to use our influence as much as we can.
Our nr.1 tenant, Primark, is the retail business line of the London public listed Irish company Associated British
Food. Primark itself is employing 68,000 people and has over 300 store locations. Currently ABF nor Primark haven’t
signed the United Nations Global Impact principles yet. These principles are aimed at CSR in the areas of human
rights, labour environment and anticorruption. ABF and Primark are encouraged by their stakeholders to consider
signing up these principles. Other sources to obtain information are studies of Rank a Brand and Robeco SAM. In
August 2016 Rank a Brand scored the first milestones for Primark. One of the milestones is the Code of Conduct,
designed to ensure that the suppliers Primark works with respect the risks of their workforce. It sets out the core
principles that suppliers and factories must follow to ensure products are made in good working conditions, that
the people making them are of a legal working age, are treated decently and paid a fair wage. Of course ethics
policies need to be done not only by commitment or announcement, but they should be put in practice. Primark
employs a team of 65 audit specialists, supported by external companies, who are based on the ground in nine key
sourcing countries. In November 2016 Robeco SAM published the report: "ESG risks and opportunities in the textile
sector". Their conclusion is that Primark is making progress in implementing the concerning policies, and is taking
her Responsibility.
DUO Labels
In 2016, the Fund continued to increase assessments in it's portfolio using DUO Labels as part of its tenant
engagement programme. By year-end 2016, we had completed the assessment of all suitable units and our main
challenge for the future is to convince our tenants that cooperation makes good business sense, both in terms of
environmental impact and cost savings. The DUO Label system assesses the resource efficiency of tenants’ retail
units and offers practical advice on achieving sustainability goals. An Energy Map provides tenants with a
micro-view of their energy consumption. This map outlines the efficiencies and inefficiencies of areas controlled
by the lessor – such as roof, flooring and wall insulation – but more importantly, it analyses the areas controlled by
the tenant, including the storefront, climate control, ventilation, lighting and escalators.

Bouwinvest Dutch Institutional Retail Fund N.V. | Annual Report 2016 32
The map highlights problem spots, compares the store to the centre average and provides advice on how to reduce
energy consumption. These maps serve as a starting point for discussion with the retailers on their energy
consumption and potential savings.
We are currently preparing for the second phase in this process, which will involve gathering data from our
tenants and setting targets via green leases or sustainable user agreements in lease contracts.
Managing the supply chainThe Retail Fund has Service Level Agreements with its suppliers in the chain. We assess property managers each
quarter on topics related to administrative management, technical management (including sustainability),
commercial management and tenant satisfaction.
The Retail Fund applies ‘Bewuste Bouwers’ criteria to all new-build projects and redevelopments. These criteria
ensure that the contractor deals with the concerns of local residents, and addresses safety and environmental
issues during the construction phase.
To promote and increase sustainable procurement we launched a project with IVBN (Association of Institutional
Property Investors in the Netherlands) and a number of fellow fund managers to engage and assess the Fund’s
suppliers using a sustainability web tool. Current and future suppliers will be assessed on their sustainable
commitments, policies and behaviour.
Pilot smart real estate management and maintenanceIn 2016, the Fund has conducted a successful pilot with an online management concept for the effective
management and maintenance of properties. The tool supports the Fund to register, schedule, manage and
monitor standard inspections and legal inspections, as well as evacuation exercises, certifications and insurance
policies. The tool helps the Fund to reduce its strict liability and total costs of ownership. It can lead to savings of
up to 15% while minimising user costs, maintaining the quality and value of the properties and preventing
unwanted vacancies. The Fund is planning to further implement the tool in 2017.
Partnerships with local government agenciesThe city of Lelystad is a prime example of how we work with private and public parties on initiatives to inject new
life into urban centres. Lelystad is going through a difficult period, with high vacancy rates in its main shopping
area. The Retail Fund has teamed up with its tenants, a number of fellow investors and the business community to
take initiatives together with the local authorities, residents and cultural organisations with the aim to inject new
life into the city centre. These initiatives include public and private investments in the city centre, the set-up of a
Business Improvement Zone, the joint determination of a future vision and the execution of a marketing and
branding programme.
Environmental performance
Focus on material topicsThe focus of the Retail Fund's sustainability strategy is on reducing the environmental footprint of the shopping
centres or retail assets in its portfolio. It does so by exerting a direct influence on the larger (public) areas of the
buildings or complexes, and by investing in improvements that benefit existing and potential tenants. We actively
cooperate with existing tenants on initiatives to optimise comfort and energy efficiency. We continue to work with
our property managers, local authorities and tenants to provide comfortable, safe and convenient shopping areas
in our retail assets. So far, six assets have been assessed or are in the process of being assessed for the ‘Keurmerk
Veilig Ondernemen’ safety certification.
Monitoring performanceMonitoring environmental performance data (energy and water consumption, greenhouse gas emissions and
waste) is an important part of managing sustainability issues. The Fund tracks and aims to improve the
environmental performance of its managed real estate assets; those properties where the Fund is responsible for
purchasing and managing energy consumption. The Fund reports on energy consumption (electricity, heating and
gas: the energy components) for shopping centres which translates to greenhouse gas emissions.

Bouwinvest Dutch Institutional Retail Fund N.V. | Annual Report 2016 33
Smart meters, smart businessTo monitor energy consumption closely the Fund continued to expand active monitoring in 2016 by installing
smart metering systems. All common areas and connections for which the Fund is responsible for purchasing
energy are now covered. It also started a pilot of web-based energy monitoring and management for two assets. In
addition, the Fund plans to install smart meters at all new developments, acquisitions and at individual tenant
level. Once again, this will require close cooperation with tenants, as they have to agree to install the smart
meters. This still remains a challenge.
Energy efficiency improvements through sustainable upgradesThe Fund sees redevelopment projects as the perfect opportunity to upgrade and enhance the sustainability of its
assets, for instance by fitting solar panels, insulation, efficient lighting and other measures. Making the Fund’s
assets more sustainable helps us to maintain or increase their value and improves their letting potential. In 2016,
the Fund carried out measures to increase the sustainability of its assets at the following shopping centres: • Molenhoekpassage, Rosmalen - To maintain the high quality of this successful shopping centre for daily
goods and reduce the risk of vacancy, the Fund is upgrading and updating the look and feel of this centre
and adapting the division of retail spaces to the demands of the current tenants. During the highly
sustainable redevelopment, the Fund increased energy efficiency by adding insulation to the outer facade
of concrete plates. The Fund also renewed the roof area and added more insulation, which helped to
improve the centre’s energy label to B from G.
• Goverwelle, Gouda - The Fund used the opportunity of a major renovation project to completely replace the
roof covering, replace the old insulation with modern and much more efficient insulation system that also
improved water drainage from the roof.
• Maasplaza, Dordrecht - In this centre, the Fund replaced the old lighting with LED spotlights. This increased
light levels while reducing energy consumption and energy bills.
• Prinsenland, Rotterdam - The fund replaced the central heating boiler with a new, more efficient boiler,
helping to cut gas and electricity use.
• De Promesse, Lelystad - The Fund took a number of radical noise-reduction measures at his centre, to reduce
the nuisance of the noise generated by cooling systems, with the aim of improving the living environment
for local residents.
Following technical improvements and joint initiatives with tenants, the average Energy Index improved to 0.91 in
2016 (2015: 0.98). The majority of the portfolio’s properties have now been awarded an energy label A, B or C (85.2%),
indicating a good overall level of energy efficiency for the portfolio.
Clear targets, practical measuresThe Fund has set clear targets to reduce energy consumption in the assets over which it has ‘operational control’,
mostly shopping centres. In 2016, the Fund managed to cut energy consumption by 5.1% (2015: 2.7%) contributing
to a total cut in energy consumption of 18.2% in the period 2012-2016 on a like-for-like basis and achieved its target.
The Fund has set clear targets for the period 2016-2018 to decrease its environmental impact:
• Energy: average annual reduction 2%
• GHG emissions: average annual reduction 2%
• Water: average annual reduction 2%
• Waste: increase recycling percentage
• Renewable energy: increase percentage renewable energy
The implementation of an Environmental Management System (EMS) will help us to achieve these targets.
Furthermore, we aim to increase the use of renewable energy. Following the Climate Agreement in Paris (COP21),
plus the United Nations 2030 agenda for sustainable development and the Dutch Energy Agreement, we expect to
see stronger external demand to reduce GHG emissions and commitments to actively contribute to sustainable
cities and communities. We actively support and contribute to these initiatives where possible.
The Fund’s ambition to increase the coverage and therefore the transparency of its environmental impact
according to INREV sustainability guidelines is reflected in the summary of key CSR data. For more detailed
information please see the CSR performance indicators at the end of this annual report.
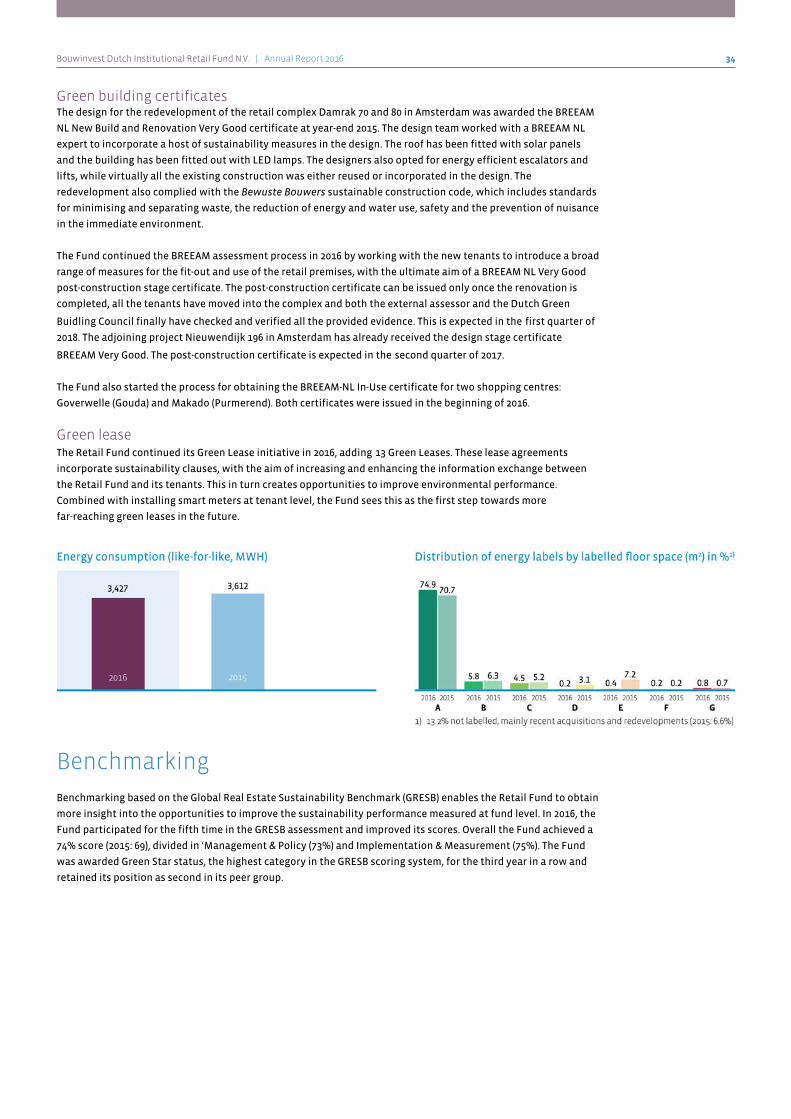
Bouwinvest Dutch Institutional Retail Fund N.V. | Annual Report 2016 34
Green building certificatesThe design for the redevelopment of the retail complex Damrak 70 and 80 in Amsterdam was awarded the BREEAM
NL New Build and Renovation Very Good certificate at year-end 2015. The design team worked with a BREEAM NL
expert to incorporate a host of sustainability measures in the design. The roof has been fitted with solar panels
and the building has been fitted out with LED lamps. The designers also opted for energy efficient escalators and
lifts, while virtually all the existing construction was either reused or incorporated in the design. The
redevelopment also complied with the Bewuste Bouwers sustainable construction code, which includes standards
for minimising and separating waste, the reduction of energy and water use, safety and the prevention of nuisance
in the immediate environment.
The Fund continued the BREEAM assessment process in 2016 by working with the new tenants to introduce a broad
range of measures for the fit-out and use of the retail premises, with the ultimate aim of a BREEAM NL Very Good
post-construction stage certificate. The post-construction certificate can be issued only once the renovation is
completed, all the tenants have moved into the complex and both the external assessor and the Dutch Green
Buidling Council finally have checked and verified all the provided evidence. This is expected in the first quarter of
2018. The adjoining project Nieuwendijk 196 in Amsterdam has already received the design stage certificate
BREEAM Very Good. The post-construction certificate is expected in the second quarter of 2017.
The Fund also started the process for obtaining the BREEAM-NL In-Use certificate for two shopping centres:
Goverwelle (Gouda) and Makado (Purmerend). Both certificates were issued in the beginning of 2016.
Green leaseThe Retail Fund continued its Green Lease initiative in 2016, adding 13 Green Leases. These lease agreements
incorporate sustainability clauses, with the aim of increasing and enhancing the information exchange between
the Retail Fund and its tenants. This in turn creates opportunities to improve environmental performance.
Combined with installing smart meters at tenant level, the Fund sees this as the first step towards more
far-reaching green leases in the future.
Benchmarking
Benchmarking based on the Global Real Estate Sustainability Benchmark (GRESB) enables the Retail Fund to obtain
more insight into the opportunities to improve the sustainability performance measured at fund level. In 2016, the
Fund participated for the fifth time in the GRESB assessment and improved its scores. Overall the Fund achieved a
74% score (2015: 69), divided in ‘Management & Policy (73%) and Implementation & Measurement (75%). The Fund
was awarded Green Star status, the highest category in the GRESB scoring system, for the third year in a row and
retained its position as second in its peer group.

Bouwinvest Dutch Institutional Retail Fund N.V. | Annual Report 2016 35
Corporate governance
Bouwinvest Dutch Institutional Retail Fund N.V. (the Retail Fund) was established in 2010. Stichting
Bedrijfstakpensioenfonds voor de Bouwnijverheid (bpfBOUW, the pension fund for the construction industry) is
the Retail Fund’s anchor investor. The Fund has a transparent governance structure, which ensures effective and
efficient management, combined with proper checks and balances. The Fund’s governance structure consists of a
General Meeting of Shareholders, a Shareholders’ Committee and a Board of Directors.
Fund governanceThe Retail Fund is governed in a robust framework with systems and processes to manage risks appropriately.
Safeguarding the interests of our investors, integrity and transparency play a key role in the Fund’s governance
principles:
• Independent compliance function
• Conflicts of interests policy
• ‘Checks and balances’ framework with four lines of defence
• Robust process management: ISAE 3402 type II certified
• AIFMD compliant
• Independent depositary appointed
Rules and principles governing day-to-day business
• Best-in-class system for valuation of assets
• ‘4-eyes-principle’ on all real estate investments
• Transparency and integrity in daily business conduct
• Code of conduct
• Shareholder communications
Structure of the Fund
The Retail Fund is structured as an investment company with variable capital, as defined in article 2:76a of the
Dutch Civil Code, with its corporate seat in Amsterdam, the Netherlands. It is a fiscal investment institution (FII)
within the meaning of Article 28 of the Dutch Corporate Income Tax Act 1969. Bouwinvest Real Estate Investment
Management B.V. (Bouwinvest) is the Fund's Statutory Director and management company, subject to the terms of
the management agreement. The management company has a licence within the meaning of Article 2:65 of the
Dutch Financial Supervision Act and is subject to supervision of the Dutch Financial Markets Authority (AFM) and
by the Dutch Central Bank (DNB).
The Fund owns two taxable subsidiaries, Bouwinvest Retail Development B.V. and Bouwinvest Dutch Institutional
Retail Fund Services B.V. These subsidiaries perform activities that might go beyond mere ‘investing’. By having
these activities performed by these subsidiaries the Fund remains compliant with the investment criteria of the
FII-regime. Bouwinvest Retail Development B.V. performs development activities for the investment portfolio of
the Fund while Bouwinvest Dutch Institutional Retail Fund Services B.V. renders services that are ancillary to
renting activities of the Fund.
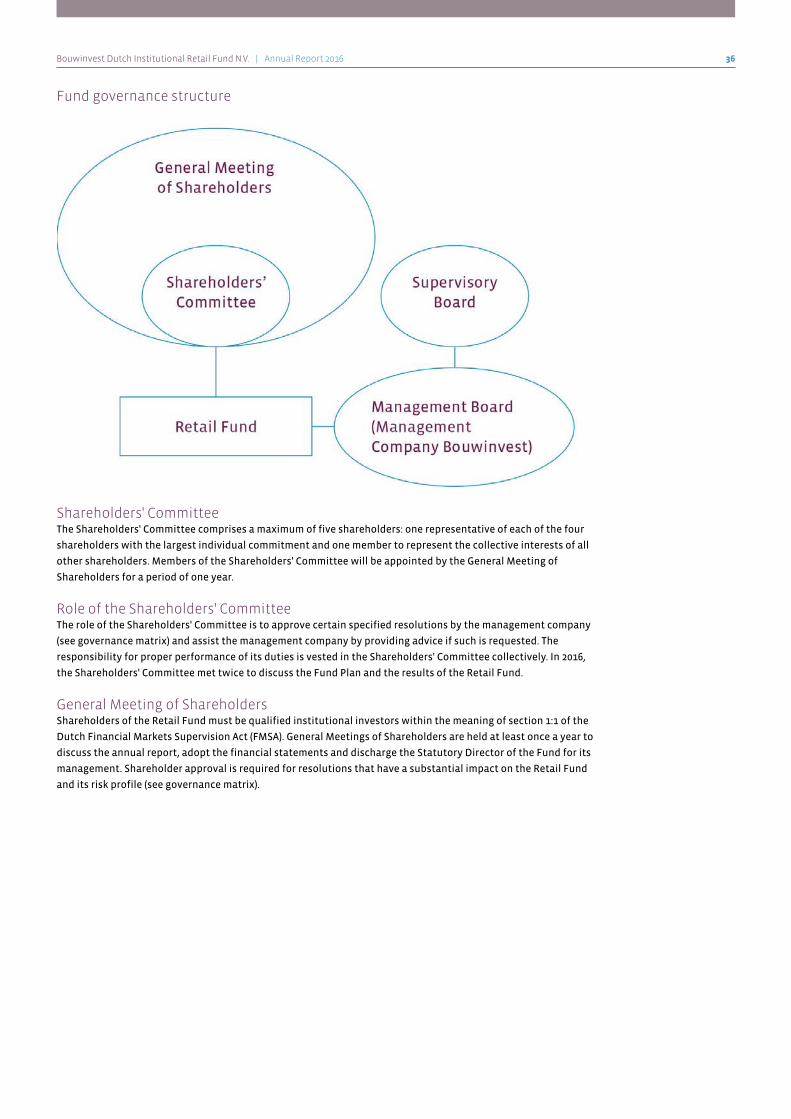
Bouwinvest Dutch Institutional Retail Fund N.V. | Annual Report 2016 36
Fund governance structure
Shareholders' CommitteeThe Shareholders' Committee comprises a maximum of five shareholders: one representative of each of the four
shareholders with the largest individual commitment and one member to represent the collective interests of all
other shareholders. Members of the Shareholders' Committee will be appointed by the General Meeting of
Shareholders for a period of one year.
Role of the Shareholders' CommitteeThe role of the Shareholders' Committee is to approve certain specified resolutions by the management company
(see governance matrix) and assist the management company by providing advice if such is requested. The
responsibility for proper performance of its duties is vested in the Shareholders' Committee collectively. In 2016,
the Shareholders' Committee met twice to discuss the Fund Plan and the results of the Retail Fund.
General Meeting of ShareholdersShareholders of the Retail Fund must be qualified institutional investors within the meaning of section 1:1 of the
Dutch Financial Markets Supervision Act (FMSA). General Meetings of Shareholders are held at least once a year to
discuss the annual report, adopt the financial statements and discharge the Statutory Director of the Fund for its
management. Shareholder approval is required for resolutions that have a substantial impact on the Retail Fund
and its risk profile (see governance matrix).
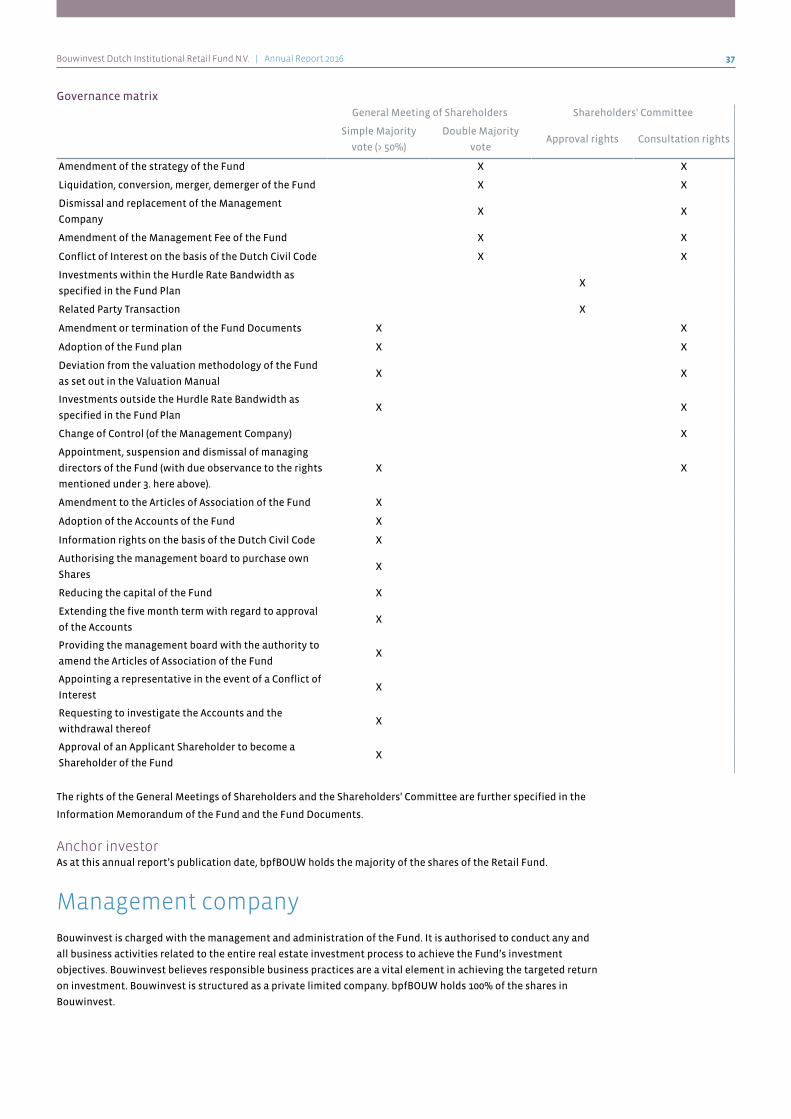
Bouwinvest Dutch Institutional Retail Fund N.V. | Annual Report 2016 37
Governance matrix
General Meeting of Shareholders Shareholders' Committee
Simple Majority
vote (> 50%)
Double Majority
voteApproval rights Consultation rights
Amendment of the strategy of the Fund X X
Liquidation, conversion, merger, demerger of the Fund X X
Dismissal and replacement of the Management
CompanyX X
Amendment of the Management Fee of the Fund X X
Conflict of Interest on the basis of the Dutch Civil Code X X
Investments within the Hurdle Rate Bandwidth as
specified in the Fund PlanX
Related Party Transaction X
Amendment or termination of the Fund Documents X X
Adoption of the Fund plan X X
Deviation from the valuation methodology of the Fund
as set out in the Valuation ManualX X
Investments outside the Hurdle Rate Bandwidth as
specified in the Fund PlanX X
Change of Control (of the Management Company) X
Appointment, suspension and dismissal of managing
directors of the Fund (with due observance to the rights
mentioned under 3. here above).
X X
Amendment to the Articles of Association of the Fund X
Adoption of the Accounts of the Fund X
Information rights on the basis of the Dutch Civil Code X
Authorising the management board to purchase own
SharesX
Reducing the capital of the Fund X
Extending the five month term with regard to approval
of the AccountsX
Providing the management board with the authority to
amend the Articles of Association of the FundX
Appointing a representative in the event of a Conflict of
InterestX
Requesting to investigate the Accounts and the
withdrawal thereofX
Approval of an Applicant Shareholder to become a
Shareholder of the FundX
The rights of the General Meetings of Shareholders and the Shareholders' Committee are further specified in the
Information Memorandum of the Fund and the Fund Documents.
Anchor investorAs at this annual report’s publication date, bpfBOUW holds the majority of the shares of the Retail Fund.
Management company
Bouwinvest is charged with the management and administration of the Fund. It is authorised to conduct any and
all business activities related to the entire real estate investment process to achieve the Fund’s investment
objectives. Bouwinvest believes responsible business practices are a vital element in achieving the targeted return
on investment. Bouwinvest is structured as a private limited company. bpfBOUW holds 100% of the shares in
Bouwinvest.

Bouwinvest Dutch Institutional Retail Fund N.V. | Annual Report 2016 38
Board of DirectorsBouwinvest has a Board of Directors, consisting of one Statutory Director, also Chairman of the Board, and three
managing directors: the Managing Director Finance, the Managing Director Dutch Investments and the Managing
Director International Investments. The Statutory Director is appointed by the General Meeting of Shareholders of
Bouwinvest following nomination by Bouwinvest’s Supervisory Board. The Board of Directors is governed by a set
of regulations that also outline its tasks and responsibilities.
Supervisory BoardBouwinvest has an independent Supervisory Board with a minimum of three and a maximum of five members. The
Supervisory Board currently has four members. The maximum term of office is four years, with the possibility of
reappointment for an additional four years. The role of the Supervisory Board is to supervise the policies of the
Board of Directors and the general affairs of the company and its related business. The Supervisory Board is
responsible for the quality of its own performance. The members of the Supervisory Board are appointed by the
General Meeting of Shareholders of Bouwinvest. In carrying out its duties, the Supervisory Board is guided by the
interests of the company and its related business.
Policies, rules and regulationsCorporate Governance CodeAlthough the Dutch Corporate Governance Code does not directly apply to Bouwinvest as it is an unlisted
company, the Board of Directors endorses the best practices of the Code as far as applicable to Bouwinvest.
Code of ConductBouwinvest has drawn up a Code of Conduct that applies to all its employees and which includes additional rules
that specifically apply to the Board of Directors and Supervisory Board with respect to conflicts of interest and
investments. The Code of Conduct deals with issues such as ethical behaviour, conflicts of interest, compliance
with laws and (internal and external) regulations, CSR, health and safety, as well as our business partners.
Bouwinvest has also instituted a whistleblower policy dealing with the reporting and investigation of unethical
behaviour. All employees receive code of conduct training.
ComplianceBouwinvest has a dedicated Compliance function that identifies, assesses, advises on, monitors and reports on the
company’s compliance risks. For the planning, execution and reporting of all compliance activities, the compliance
function employs the Bouwinvest Compliance Cycle. This cycle contains ten groups of activities that are key for the
compliance function. The compliance risks include the risk of legal or regulatory sanctions, financial loss, or loss of
reputation that the management company may suffer as a result of any failure to comply with applicable financial
regulations, codes of conduct and standards of good practice. The compliance officer reports to the Statutory
Director on a monthly basis, as well as to the chairman of the Supervisory Board on issues related to the Board of
Directors.
Compliance cycle

Bouwinvest Dutch Institutional Retail Fund N.V. | Annual Report 2016 39
Conflicts of Interest policyBouwinvest has a Conflicts of Interest policy. The purpose of this policy is to ensure that no material conflicts of
interest occur that are damaging for investors in the fund, the fund or Bouwinvest. The policy also describes how
Bouwinvest should act with respect to the allocation of different investment opportunities over the respective
funds and clients. The policy is intended to supplement but not replace any applicable Dutch laws governing
conflicts of interest.
In 2016, there were no conflicts of interest as referred to in the Bouwinvest Conflicts of Interest Policy, either
between the members of the Board of Directors, the management company, the Fund and/or other funds managed
by the management company.
Funds managed by BouwinvestBouwinvest manages the following funds:
• Bouwinvest Dutch Institutional Residential Fund N.V.
• Bouwinvest Dutch Institutional Retail Fund N.V.
• Bouwinvest Dutch Institutional Office Fund N.V.
Bouwinvest has a separate mandate from bpfBOUW for the management of international real estate investments,
Bouwinvest Dutch Institutional Hotel Fund N.V. and Bouwinvest Dutch Institutional Healthcare Fund N.V.
External auditor
The Fund’s external auditor is Deloitte Accountants B.V. Deloitte audits the financial statements of the Fund.
Deloitte also audits the financial statements of Bouwinvest and of the other funds managed by Bouwinvest.

Bouwinvest Dutch Institutional Retail Fund N.V. | Annual Report 2016 40
Risk management
Risk management and compliance
Risk management and compliance are independent functions within Bouwinvest. Their role is to identify, assess,
advise on, monitor and report on financial, operational and compliance risks faced by the Fund. In 2016,
Bouwinvest continued to refine and enhance its risk and compliance capabilities. It also introduced new policies
and renewed quarterly risk reporting formats for the Fund.
Risk management framework
Bouwinvest has implemented a risk management framework based upon the principles of The Committee of
Sponsoring Organizations of the Treadway Commission (COSO). It is an Enterprise Risk Management Framework
(ERMF), covering all activities of the Fund at all levels. To ensure that its risk management framework is
operational and effective, Bouwinvest has established an Accountability and Monitoring policy, consisting of the
‘Four lines of defence’. This policy puts risk management into practice by using Management (1st line),
Risk-compliance-control (2nd line), Internal audit (3rd line) and External audit - Supervisory Board (4th line) as
defence functions.
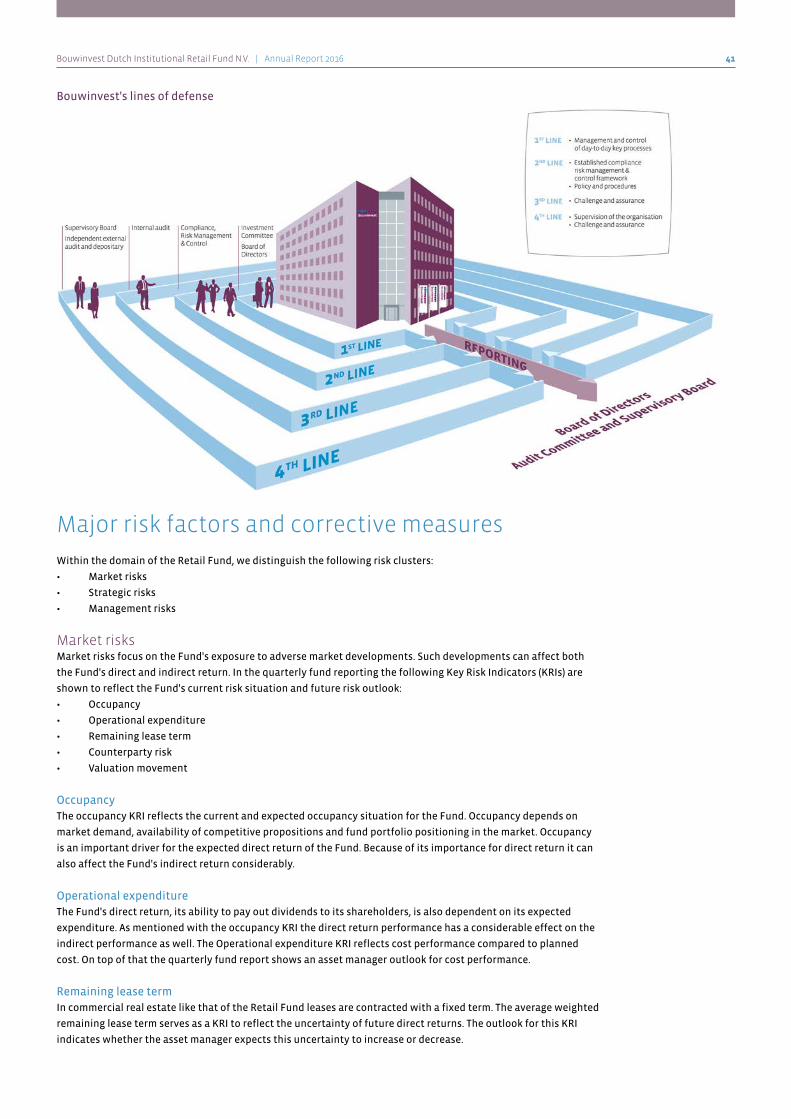
Bouwinvest Dutch Institutional Retail Fund N.V. | Annual Report 2016 41
Bouwinvest's lines of defense
Major risk factors and corrective measures
Within the domain of the Retail Fund, we distinguish the following risk clusters:
• Market risks
• Strategic risks
• Management risks
Market risksMarket risks focus on the Fund's exposure to adverse market developments. Such developments can affect both
the Fund's direct and indirect return. In the quarterly fund reporting the following Key Risk Indicators (KRIs) are
shown to reflect the Fund's current risk situation and future risk outlook:
• Occupancy
• Operational expenditure
• Remaining lease term
• Counterparty risk
• Valuation movement
OccupancyThe occupancy KRI reflects the current and expected occupancy situation for the Fund. Occupancy depends on
market demand, availability of competitive propositions and fund portfolio positioning in the market. Occupancy
is an important driver for the expected direct return of the Fund. Because of its importance for direct return it can
also affect the Fund's indirect return considerably.
Operational expenditureThe Fund's direct return, its ability to pay out dividends to its shareholders, is also dependent on its expected
expenditure. As mentioned with the occupancy KRI the direct return performance has a considerable effect on the
indirect performance as well. The Operational expenditure KRI reflects cost performance compared to planned
cost. On top of that the quarterly fund report shows an asset manager outlook for cost performance.
Remaining lease termIn commercial real estate like that of the Retail Fund leases are contracted with a fixed term. The average weighted
remaining lease term serves as a KRI to reflect the uncertainty of future direct returns. The outlook for this KRI
indicates whether the asset manager expects this uncertainty to increase or decrease.

Bouwinvest Dutch Institutional Retail Fund N.V. | Annual Report 2016 42
Counterparty riskCounterparty risk is the risk that parties the Fund has agreements with will default. This risk is largely determined
by the ability of its tenants to fulfil their contractual obligations. For the Retail Fund, this risk is mitigated by
active credit management and critical tenant selection.
Valuation movementThe valuation movement KRI indicates the fund return driven by revaluations and it reflects the outlook for this
indicator. All properties owned by the Fund are revaluated by external appraisers either on a quarterly (standing
properties) or on an annual (non-standing properties) basis. This revaluation is the most important driver for the
Fund's indirect return.
Strategic risksStrategic risks focus on the Fund's ability to fulfill its strategic goals. These goals focus primarily on sustainable
long term fund performance. In the quarterly fund reporting the following Key Risk Indicators (KRIs) are shown to
reflect the Fund’s current risk situation and future risk outlook:
• Asset risk mix
• Segment fulfillment
• Sustainability
• Acquisition and disposition
Asset risk mixDifferent assets in the Fund’s portfolio provide propositions differing in riskiness. Each property is scored in a risk
return assessment model and appointed a risk category accordingly. In order to optimise fund return while
considering the Fund’s risk appetite fund goals are set for each of the three risk categories. The KRI for asset risk
mix shows whether or not the Fund is able to match its portfolio to the risk appetite it is aiming for.
Segment fulfillmentBased on analysis and investment beliefs the Retail Fund has specific strategic goals regarding the type of assets it
aims to own. More specifically the Fund is focusing its investment activities on high street retail and shopping
centres. The Segment fulfillment KRI focuses on the ability of the Fund to attain the segment distribution it is
aiming for.
SustainabilityTo ensure the Fund will be a future proof fund which is able to provide long-term stable returns goals are set for
the sustainability of the Fund. This KRI will show whether or not the Fund is currently able to meet its
sustainability goals.
Acquisition and dispositionIn order to meet investor demand the Fund aims for a portfolio of a certain size. The acquisition and disposition
KRIs show the Fund’s (expected) ability to meet its portfolio size targets.
Management risksThis refers to the risk that Bouwinvest’s management of the Retail Fund, including its management and control of
the risks it faces, may in some way be inadequate or ineffective. This would affect the Fund’s direct and indirect
returns. This risk is subdivided into the following risk elements:
• Fund specific legal or regulatory risk
• Fund manager continuity and reputation
Fund specific legal or regulatory riskThis KRI is meant for fund management to be able to notify investors of any large regulatory or legal
circumstances that may affect or are already affecting fund performance. To prevent as much legal or regulatory
irregularities as possible Bouwinvest has an experienced legal staff.
Fund manager continuity and reputationThe fund management organisation is a responsibility of Bouwinvest. If Bouwinvest sees any threats to its
functioning as a fund manager, for instance in damaged reputation or threatened continuity, this KRI will be used
to inform investors. In 2015 the subject of integrity has attracted extra attention within Bouwinvest. This has
resulted in a companywide training program and the completion of an elaborate Integrity Risk Analysis. Going
forward Bouwinvest as a manager will continue to aim for having the highest possible integrity standard.

Bouwinvest Dutch Institutional Retail Fund N.V. | Annual Report 2016 43
To control operational and integrity risks, there is a management agreement in place that determines the
responsibilities of Bouwinvest as the Retail Fund’s management company. Bouwinvest’s ISAE 3402 certification
provides investors with reassurance on the risk management, including risk definition and control measures, of all
key processes of a company’s day-to-day operations.
Alternative Investment Fund Managers Directive
(AIFMD)
Since 2014, Bouwinvest has an AFM licence as required by the AIFMD. This licence allows Bouwinvest's real estate
funds to manage funds that are open for institutional investors other than bpfBOUW. The AIFMD specifies certain
transparency and integrity-related requirements for Alternative Investment Funds. In 2016, Bouwinvest continued
to optimise its reporting processes and streamlined its cooperation with depositary Intertrust Depositary Services
B.V.
Monitoring and reporting
Monitoring the risks is embedded in the daily activities of the responsible line manager and is an integral part of
the planning and control cycle. Bouwinvest monitors all the defined risks via key risk indicators, supported by the
performance reporting and business incidents reporting processes. Each quarter, the Board of Directors is
provided with a risk report, including the risk indicators indicated above and actions necessary to limit or mitigate
risk, if there is a deviation between the outcome and the pre-determined norm. The Fund continued to enhance its
system for reporting and monitoring risk in 2016. These improvements enable management to act in a timely
manner to counteract or mitigate risk.
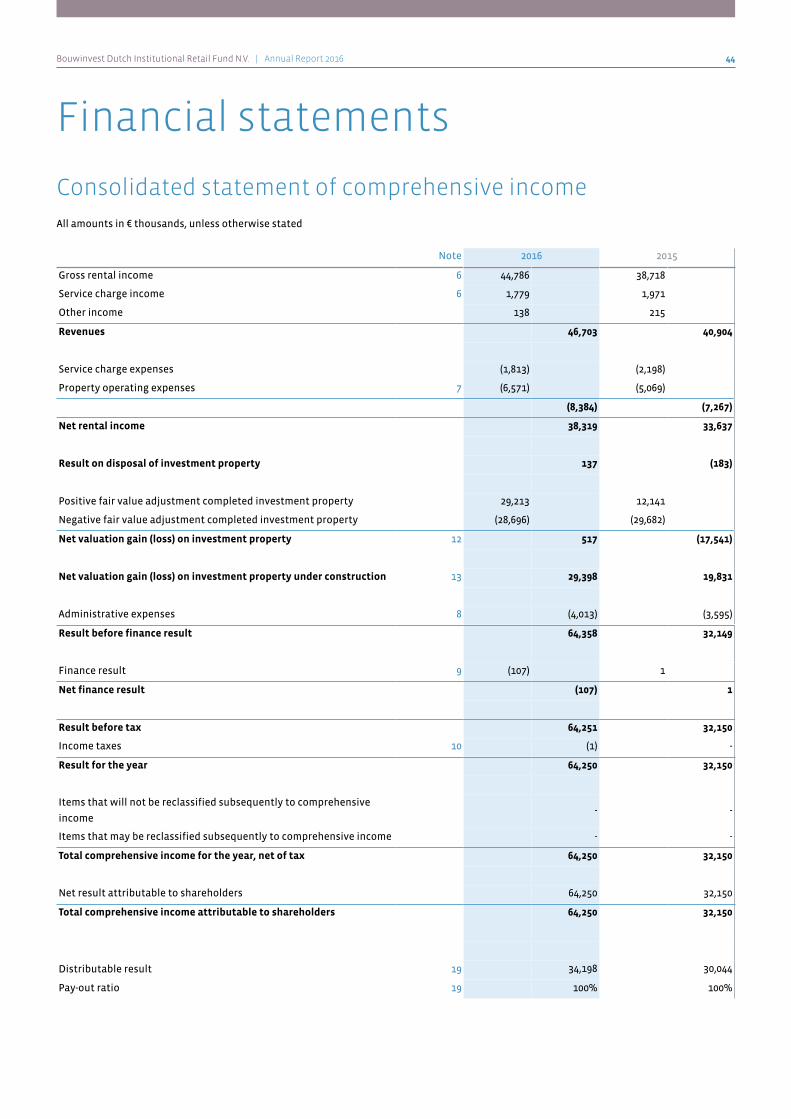
Bouwinvest Dutch Institutional Retail Fund N.V. | Annual Report 2016 44
Financial statements
Consolidated statement of comprehensive income
All amounts in € thousands, unless otherwise stated
Note 2016 2015
Gross rental income 6 44,786 38,718
Service charge income 6 1,779 1,971
Other income 138 215
Revenues 46,703 40,904
Service charge expenses (1,813) (2,198)
Property operating expenses 7 (6,571) (5,069)
(8,384) (7,267)
Net rental income 38,319 33,637
Result on disposal of investment property 137 (183)
Positive fair value adjustment completed investment property 29,213 12,141
Negative fair value adjustment completed investment property (28,696) (29,682)
Net valuation gain (loss) on investment property 12 517 (17,541)
Net valuation gain (loss) on investment property under construction 13 29,398 19,831
Administrative expenses 8 (4,013) (3,595)
Result before finance result 64,358 32,149
Finance result 9 (107) 1
Net finance result (107) 1
Result before tax 64,251 32,150
Income taxes 10 (1) -
Result for the year 64,250 32,150
Items that will not be reclassified subsequently to comprehensive
income- -
Items that may be reclassified subsequently to comprehensive income - -
Total comprehensive income for the year, net of tax 64,250 32,150
Net result attributable to shareholders 64,250 32,150
Total comprehensive income attributable to shareholders 64,250 32,150
Distributable result 19 34,198 30,044
Pay-out ratio 19 100% 100%
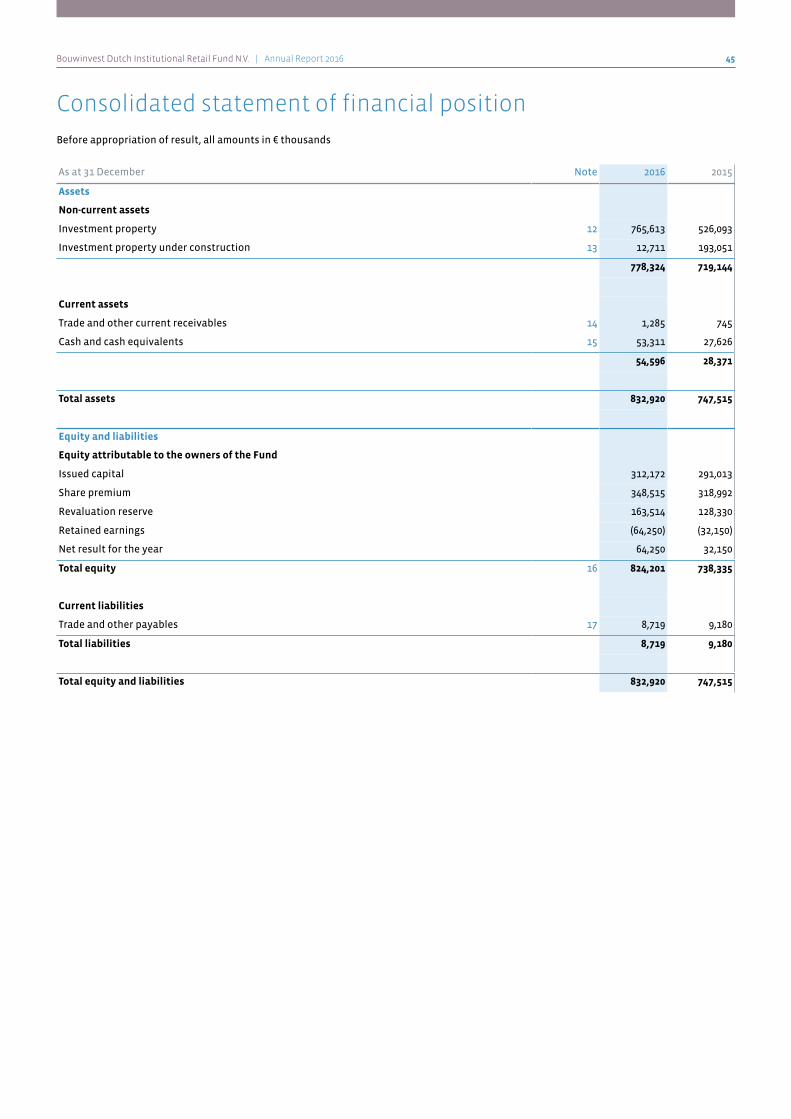
Bouwinvest Dutch Institutional Retail Fund N.V. | Annual Report 2016 45
Consolidated statement of financial position
Before appropriation of result, all amounts in € thousands
As at 31 December Note 2016 2015
Assets
Non-current assets
Investment property 12 765,613 526,093
Investment property under construction 13 12,711 193,051
778,324 719,144
Current assets
Trade and other current receivables 14 1,285 745
Cash and cash equivalents 15 53,311 27,626
54,596 28,371
Total assets 832,920 747,515
Equity and liabilities
Equity attributable to the owners of the Fund
Issued capital 312,172 291,013
Share premium 348,515 318,992
Revaluation reserve 163,514 128,330
Retained earnings (64,250) (32,150)
Net result for the year 64,250 32,150
Total equity 16 824,201 738,335
Current liabilities
Trade and other payables 17 8,719 9,180
Total liabilities 8,719 9,180
Total equity and liabilities 832,920 747,515
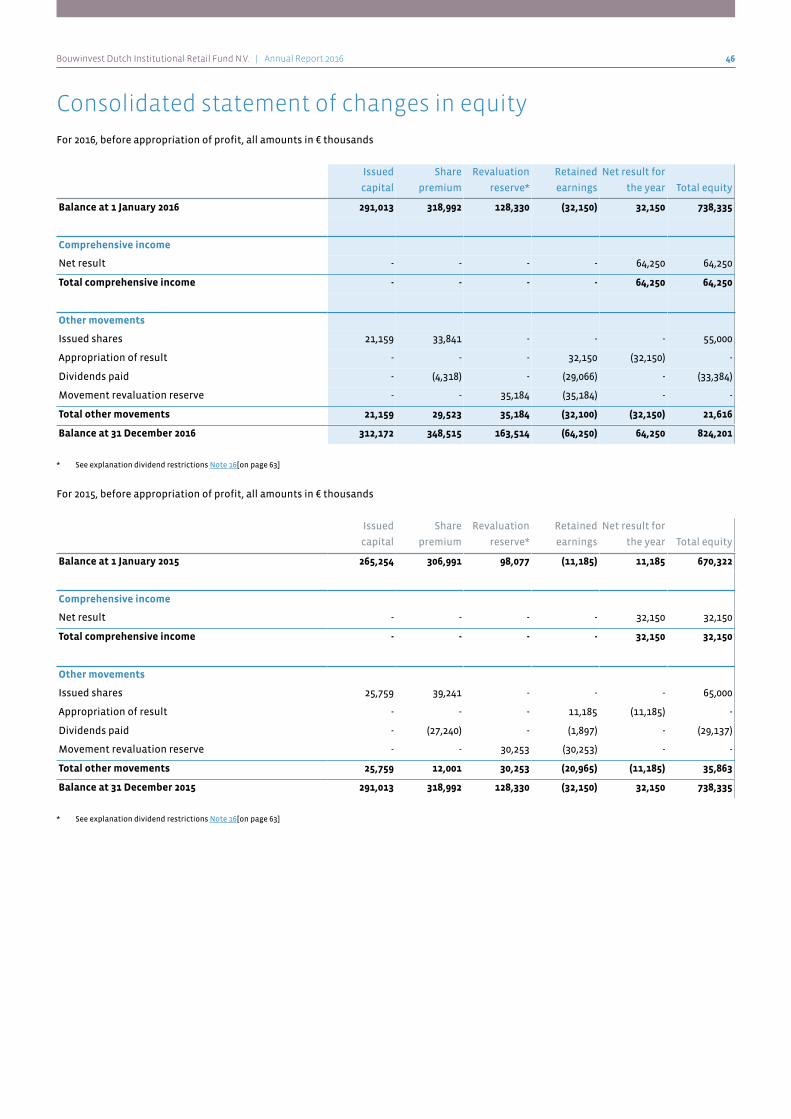
Bouwinvest Dutch Institutional Retail Fund N.V. | Annual Report 2016 46
Consolidated statement of changes in equity
For 2016, before appropriation of profit, all amounts in € thousands
Issued
capital
Share
premium
Revaluation
reserve*
Retained
earnings
Net result for
the year Total equity
Balance at 1 January 2016 291,013 318,992 128,330 (32,150) 32,150 738,335
Comprehensive income
Net result - - - - 64,250 64,250
Total comprehensive income - - - - 64,250 64,250
Other movements
Issued shares 21,159 33,841 - - - 55,000
Appropriation of result - - - 32,150 (32,150) -
Dividends paid - (4,318) - (29,066) - (33,384)
Movement revaluation reserve - - 35,184 (35,184) - -
Total other movements 21,159 29,523 35,184 (32,100) (32,150) 21,616
Balance at 31 December 2016 312,172 348,515 163,514 (64,250) 64,250 824,201
* See explanation dividend restrictions Note 16[on page 63]
For 2015, before appropriation of profit, all amounts in € thousands
Issued
capital
Share
premium
Revaluation
reserve*
Retained
earnings
Net result for
the year Total equity
Balance at 1 January 2015 265,254 306,991 98,077 (11,185) 11,185 670,322
Comprehensive income
Net result - - - - 32,150 32,150
Total comprehensive income - - - - 32,150 32,150
Other movements
Issued shares 25,759 39,241 - - - 65,000
Appropriation of result - - - 11,185 (11,185) -
Dividends paid - (27,240) - (1,897) - (29,137)
Movement revaluation reserve - - 30,253 (30,253) - -
Total other movements 25,759 12,001 30,253 (20,965) (11,185) 35,863
Balance at 31 December 2015 291,013 318,992 128,330 (32,150) 32,150 738,335
* See explanation dividend restrictions Note 16[on page 63]
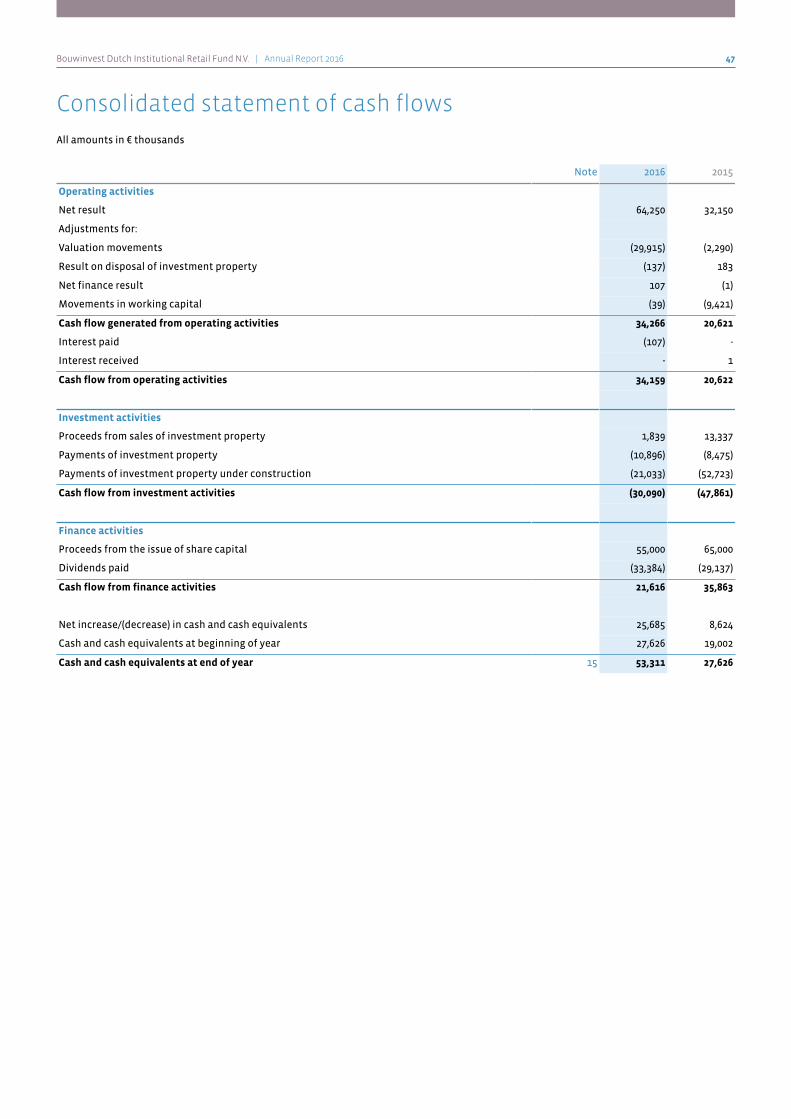
Bouwinvest Dutch Institutional Retail Fund N.V. | Annual Report 2016 47
Consolidated statement of cash flows
All amounts in € thousands
Note 2016 2015
Operating activities
Net result 64,250 32,150
Adjustments for:
Valuation movements (29,915) (2,290)
Result on disposal of investment property (137) 183
Net finance result 107 (1)
Movements in working capital (39) (9,421)
Cash flow generated from operating activities 34,266 20,621
Interest paid (107) -
Interest received - 1
Cash flow from operating activities 34,159 20,622
Investment activities
Proceeds from sales of investment property 1,839 13,337
Payments of investment property (10,896) (8,475)
Payments of investment property under construction (21,033) (52,723)
Cash flow from investment activities (30,090) (47,861)
Finance activities
Proceeds from the issue of share capital 55,000 65,000
Dividends paid (33,384) (29,137)
Cash flow from finance activities 21,616 35,863
Net increase/(decrease) in cash and cash equivalents 25,685 8,624
Cash and cash equivalents at beginning of year 27,626 19,002
Cash and cash equivalents at end of year 15 53,311 27,626

Bouwinvest Dutch Institutional Retail Fund N.V. | Annual Report 2016 48
Notes to the consolidated financial statements
All amounts in € thousands, unless otherwise stated
1 General informationThe Retail Fund (Chamber of Commerce number 34366471) is a public limited liability company incorporated under
the laws of the Netherlands, with its corporate seat in Amsterdam, the Netherlands. The Fund was formed for the
purpose of providing shareholders with a rate of return by acquiring, managing, adding value to and disposing of a
diversified real estate portfolio through investments in retail real estate in the Netherlands. The anchor
shareholder is Stichting Bedrijfstakpensioenfonds voor de Bouwnijverheid (93.0%) and Bouwinvest (0.3%), manager
of the Fund, is aligned with the main shareholder of the Fund. As of 2016 we have welcomed three new
shareholders to the Fund.
The Fund owns two taxable subsidiaries, Bouwinvest Retail Development B.V. (Chamber of Commerce number
66245060) and Bouwinvest Dutch Institutional Retail Fund Services B.V. (Chamber of Commerce number 67492665).
These subsidiaries perform activities that might go beyond mere ‘investing’. By having these activities performed
by these subsidiaries the Fund remains compliant with the investment criteria of the FII-regime. Bouwinvest Retail
Development B.V. performs development activities for the investment portfolio of the Fund while Bouwinvest
Dutch Institutional Retail Fund Services B.V. renders services that are ancillary to renting activities of the Fund.
The Fund’s active portfolio management is supported by the supply of (re)developed properties by Bouwinvest
Development B.V., Bouwinvest Retail Development B.V. and third parties.
The Statutory Director will present the annual report to the Annual General Meeting of shareholders on 12 April
2017, and will request the approval of the financial statements.
2 Summary of significant accounting policiesThe principal accounting policies applied in the preparation of these financial statements are set out below. These
policies have been consistently applied unless otherwise stated.
The Fund’s functional and presentation currency is the euro. All amounts are in thousands of euros, unless
otherwise stated. The financial year 2016 was a normal calendar year from 1 January to 31 December 2016.
2.1 Basis of preparationStatement of complianceThe consolidated financial statements of the Office Fund have been prepared in accordance with International
Financial Reporting Standards (IFRS) as adopted by the European Union.
The Company financial statements of the Fund are included in the consolidated financial statements and are
prepared in accordance with the legal requirements of Part 9, Book 2, of the Dutch Civil Code. These financial
statements have been prepared in accordance with the provision of Article 2:362 subsection 8 and 9, of the Civil
Code, under which the Company financial statements may be prepared in accordance with accounting policies as
adopted in the consolidated financial statements.
Statement of comprehensive incomeThe Fund presents its statement of comprehensive income by nature of expenses.
Change in accounting policies
In 2016, the Fund changed the 'Statement of cash flows' to the indirect method whereas in prior years the
'Statement of cash flows' was reported according to the direct method. The fund changed the preparation to
the indirect method, whereby the net result of the statement of comprehensive income is adjusted for the effects
of:
• non-cash items such as valuation movements
• changes during the period in inventories and operating receivables and payables
• cash effects relating to investment activities

Bouwinvest Dutch Institutional Retail Fund N.V. | Annual Report 2016 49
• cash effects relating to finance activities
The changes to the indirect 'Statement of cash flows' is retrospectively adjusted so the comparative figures 2015
are adjusted. The Fund decided to report according to the indirect 'Statement of cash flows' whereas it reconciles
directly with the accounting records of the Fund. There is no impact on the equity or the net result for the year
2016 and 2015.
Application of new and revised International Financial Reporting Standards (IFRS)In 2016, the Fund did not adopt any new or amended standards and does not plan the early adoption of any of the
standards issued but not yet effective.
Below is a list of the amendments to IFRSs and the new Interpretations that are mandatorily effective for
accounting periods that begin on or after 1 January 2016.
• Amendments to IFRS 10, IFRS 12 and IAS 28: Investment Entities – Applying the Consolidation Exception;
• Amendments to IAS 27: Equity Method in Separate Financial Statements;
• Amendments to IAS 1: Disclosure Initiative;
• Annual Improvements to IFRSs 2012–2014 Cycle;
• Amendments to IAS 16 and IAS 38: Clarification of Acceptable Methods of Depreciation and Amortisation;
• Amendments to IFRS 11: Accounting for Acquisitions of Interests in Joint Operations; and
• Amendments to IAS 16 and IAS 41: Bearer Plants.
The application of these amendments has had no material impact on the disclosures in the Fund’s financial
statements.
New and amended standards and interpretations, effective for financial years beginning on or after 1 January 2017
Standards issued but not yet effectiveStandards issued but not yet effective up to the date of the issuance of the Fund’s financial statements are listed
below:
• IFRS 15 Revenue from Contracts with Customers including amendments to IFRS 15, effective 1 January 2018;
• IFRS 9 Financial Instruments, effective 1 January 2018.
The Fund has studied the improvements and is currently assessing their impact.
New and amended standards and interpretations not yet adopted by the European UnionThe standards, amended standards and interpretations that have not yet been adopted by the European Union are
not yet being applied by the Fund.
• IFRS 16 Leases;
• Amendments to IAS 12: Recognition of Deferred Tax Assets for Unrealised Losses;
• Amendments to IAS 7: Disclosure Initiative;
• Clarifications to IFRS 15 Revenue from Contracts with Customers;
• Amendments to IFRS 2: Classification and Measurement of Share-based Payment Transactions;
• Amendments to IFRS 4: Applying IFRS 9 Financial Instruments with IFRS 4 Insurance Contracts;
• Annual Improvements to IFRS Standards 2014-2016 Cycle;
• IFRIC Interpretation 22 Foreign Currency Transactions and Advance Consideration; and
• Amendments to IAS 40: Transfers of Investmenty Property.
The Fund has studied the improvements and is currently assessing their impact.
Preparation of the financial statementsThe consolidated financial statements have been prepared on the historical cost basis except for investment
property and investment property under construction, which are measured at fair value as explained in the
accounting policies below. Historical cost is generally based on the fair value of the consideration given in
exchange for assets. The principal accounting policies are set out below.
The preparation of financial statements in conformity with IFRS requires the use of certain critical accounting
estimates. It also requires management to exercise its judgement in the process of applying the Fund’s accounting
policies. Changes in assumptions may have a significant impact on the financial statements in the period the
assumptions changed. Management believes that the underlying assumptions are appropriate. The areas involving
a higher degree of judgement or complexity, or areas where assumptions and estimates are significant to the
financial statements, are disclosed in Note 4.

Bouwinvest Dutch Institutional Retail Fund N.V. | Annual Report 2016 50
Basis of consolidationThe consolidated financial statements incorporate the financial statements of the Company and entities
(including structured entities) controlled by the Company and its subsidiaries. Control is achieved when the
Company: has power over the investee; is exposed, or has rights, to variable returns from its involvement with the
investee; and has the ability to use its power to affect its returns.
The following entities are included in the consolidated financial statements:
• Bouwinvest Office Development B.V. (100%), established 15 June 2016
• Bouwinvest Dutch Institutional Retail Fund Services B.V. (100%), established 15 December 2016
The Company reassesses whether or not it controls an investee if facts and circumstances indicate that there are
changes to one or more of the three elements of control listed above.
When the Company has less than a majority of the voting rights of an investee, it has power over the investee
when the voting rights are sufficient to give it the practical ability to direct the relevant activities of the investee
unilaterally. The Company considers all relevant facts and circumstances in assessing whether or not the
Company's voting rights in an investee are sufficient to give it power, including:
• the size of the Company's holding of voting rights relative to the size and dispersion of holdings of the other
vote holders;
• potential voting rights held by the Company, other vote holders or other parties;
• rights arising from other contractual arrangements; and
• any additional facts and circumstances that indicate that the Company has, or does not have, the current
ability to direct the relevant activities at the time that decisions need to be made, including voting patterns
at previous shareholders' meetings.
Consolidation of a subsidiary begins when the Company obtains control over the subsidiary and ceases when the
Company loses control of the subsidiary. Specifically, income and expenses of a subsidiary acquired or disposed of
during the year are included in the consolidated statement of profit or loss and other comprehensive income from
the date the Company gains control until the date when the Company ceases to control the subsidiary.
Profit or loss and each component of other comprehensive income are attributed to the owners of the Company
and to the non-controlling interests. Total comprehensive income of subsidiaries is attributed to the owners of the
Company and to the non-controlling interests even if this results in the non-controlling interests having a deficit
balance.
When necessary, adjustments are made to the financial statements of subsidiaries to bring their accounting
policies into line with the Group's accounting policies.
All intragroup assets and liabilities, equity, income, expenses and cash flows relating to transactions between
members of the Group are eliminated in full on consolidation.
2.3 Investment propertyInvestment property under construction or being developed for future use as investment property is presented
under ‘Investment property under construction’.
Land held under operating leases is classified and accounted for by the Fund as investment property when it
meets the rest of the definition of investment property and is accounted for as a finance lease.
Investment property is measured initially at its cost, including related transaction costs such as advisory costs,
notary costs, transfer taxes and borrowing costs. Borrowing costs incurred for the purpose of acquiring,
constructing or producing a qualifying investment property are capitalised as part of its cost. Borrowing costs are
capitalised while acquisition or construction is actively underway and cease once the asset is substantially
complete, or suspended if the development of the asset is suspended.
After initial recognition, investment property is stated at fair value. Fair value is based on active market prices,
adjusted, if necessary, for any difference in the nature, location or condition of the specific asset.

Bouwinvest Dutch Institutional Retail Fund N.V. | Annual Report 2016 51
In line with the Practice Statements, as incorporated in the Royal Institute of Chartered Surveyors Appraisal and
Valuation Standards (‘the Red Book’), valuations are performed as of the financial position date by professional
valuation experts who hold recognised and relevant professional qualifications and have recent experience in the
location and category of the investment property being valued. These valuations form the basis for the carrying
amounts in the financial statements. Investment property that is being redeveloped for continuing use as an
investment property or for which the market has become less active continues to be measured at fair value.
The fair value of investment property reflects, among other things, rental income from current leases and
assumptions about rental income from future leases in the light of current market conditions. including vacancy
and rental incentives. The fair value also reflects, on a similar basis, any cash outflows that could be expected in
respect of the property. Some of those outflows are recognised as a liability, including finance lease liabilities in
respect of leasehold land classified as investment property; others, including contingent rent payments, are not
recognised in the financial statements.
Subsequent expenditure is capitalised to the asset’s carrying amount only when it is probable that future
economic benefits associated with the expenditure will flow to the Fund and the cost of the item can be measured
reliably. All other repairs and maintenance costs are expensed when incurred. When part of an investment
property is replaced, the carrying amount of the replaced part is derecognised.
If a valuation obtained for a property held under a lease is net of all payments expected to be made, any related
lease liability recognised separately in the statement of financial position is added back to arrive at the carrying
value of the investment property for accounting purposes.
The fair value of investment property does not reflect future capital expenditure that will improve or enhance the
property and does not reflect the related future benefits from this future expenditure other than those a rational
market participant would take into account when determining the value of the property.
Gains and losses arising from changes in fair values are included in the statement of comprehensive income in the
year in which they arise. Investment properties are derecognised either when they have been disposed of or when
the investment property is permanently withdrawn from use and no future economic benefit is expected from its
disposal. Gains and losses on disposal of investment properties are recognised in the statement of comprehensive
income in the year of disposal.
In the fair value assessment of the investment property the potential effect on future cash flow in respect to
granted lease incentives are taken into consideration.
2.4 Investment property under constructionInvestment property under construction for future use as investment property is stated at fair value.
Fair value measurement on investment property under construction is only applied if the fair value is considered
to be reliably measurable. If the Fund determines that the fair value of an investment property under construction
is not reliably determinable when construction is incomplete, it shall measure that investment under construction
at cost until either its fair value becomes reliably determinable or construction is completed.
It may sometimes be difficult to determine the fair value of the investment property under construction reliably. In
order to evaluate whether the fair value of an investment under construction can be determined reliably,
management considers, among others, the following factors:
• The provisions of the construction contract
• The stage of completion
• Whether the project/property is standard (typical for the market) or non-standard
• The level of reliability of cash inflows after completion
• The development risk specific to the property
• Past experience with similar construction projects
• Pre-let percentage
• Status of construction permits
After the first instalment for the project under construction, an external valuation expert values the project each
quarter. Gains and losses arising from changes in fair values are included in the statement of comprehensive
income in the year in which they arise.

Bouwinvest Dutch Institutional Retail Fund N.V. | Annual Report 2016 52
Investment property is not developed within the Retail Fund but via external parties or within Bouwinvest
Development B.V. or Bouwinvest Retail Development B.V.. When entering into the contract, the rental risk is
transferred to the Fund; the remaining risks remain with the developer. The paid instalments are therefore
recognised as investment property under construction.
2.5 Financial instrumentsFinancial assetsFinancial assets are classified as financial assets at fair value through profit or loss, loans and receivables,
held-to-maturity financial assets, and available-for-sale financial assets, as appropriate. The Fund determines the
classification of its financial assets at initial recognition. When financial assets are initially recognised, they are
measured at fair value, plus, in the case of investments not at fair value through profit or loss, directly attributable
transaction costs.
Financial assets are derecognised only when the contractual rights to the cash flows from the financial asset
expire or the Fund transfers substantially all risks and rewards of ownership. The Fund’s financial assets consist of
loans and receivables.
Financial assets recognised in the statement of financial position as trade and other receivables are classified as
loans and receivables. They are recognised initially at fair value and subsequently measured at amortised cost
using the effective interest method, less provision for impairment.
The Fund assesses at each financial position date whether there is objective evidence that a financial asset or
group of financial assets is impaired. If there is objective evidence (such as significant financial difficulty of the
obligor, breach of contract, or it becomes probable that the debtor will enter bankruptcy), the asset is tested for
impairment. The amount of the loss is measured as the difference between the asset’s carrying amount and the
present value of estimated future cash flows (excluding future expected credit losses that have not been incurred)
discounted at the financial asset’s original effective interest rate (that is, the effective interest rate computed at
initial recognition). The carrying amount of the asset is reduced through use of an allowance account. The amount
of the loss is recognised in the statement of comprehensive income.
With respect to trade receivables, a provision for impairment is made when there is objective evidence (such as the
probability of insolvency or significant financial difficulties of the debtor) that the Fund will not be able to collect
all of the amounts due under the original terms of the invoice. Impaired debts are derecognised when they are
assessed as uncollectible.
If in a subsequent period the amount of the impairment loss decreases and the decrease can be related objectively
to an event occurring after the impairment was recognised, the previously recognised impairment loss is reversed,
to the extent that the carrying value of the asset does not exceed its amortised cost at the reversal date. Any
subsequent reversal of an impairment loss is recognised in the statement of comprehensive income.
Financial liabilitiesFinancial liabilities are classified as financial liabilities at fair value through the statement of comprehensive
income, loans, held-to-maturity financial liabilities, and available-for-sale financial liabilities, as appropriate. The
Fund determines the classification of its financial liabilities at initial recognition. When financial liabilities are
initially recognised, they are measured at fair value, plus, in the case of investments not at fair value through the
statement of comprehensive income, directly attributable transaction costs.
A financial liability is derecognised when the obligation under the liability is discharged or cancelled or expired.
Financial liabilities included in trade and other payables are initially recognised at fair value and subsequently at
amortised cost. The fair value of a non-interest bearing liability is its discounted repayment amount. If the due
date of the liability is less than one year, discounting is omitted.
2.6 PrepaymentsPrepayments are stated at cost less any accumulated impairment losses.
2.7 Cash and cash equivalentsCash and cash equivalents include cash in hand, deposits held at call with banks, other short-term highly liquid
investments with original maturities of three months or less, and bank overdrafts.

Bouwinvest Dutch Institutional Retail Fund N.V. | Annual Report 2016 53
2.8 Issued capitalShares are classified as equity when there is no obligation to transfer cash or other assets. Incremental costs
directly attributable to the issue of new shares are shown in equity as a deduction, net of tax, from the proceeds.
2.9 Trade and other payablesTrade and other payables are recognised initially at fair value and subsequently measured at amortised cost using
the effective interest method.
Tenant depositsThe Retail Fund obtains deposits from tenants as a guarantee for the return of the property at the end of the lease
term in a specified good condition or for the lease payments for a period ranging from 1 to 12 months. Such
deposits are treated as financial assets in accordance with IAS 39 and they are initially recognised at fair value. The
deposit is subsequently measured at amortised cost.
Tenant deposits are classified as current liabilities unless the Fund has an unconditional right to defer settlement
of the deposit for at least 12 months after the date of the statement of financial position.
2.10 Dividend distributionAn FII is obliged to distribute its distributable profit annually within eight (8) months after the end of the relevant
fiscal year (doorstootverplichting). The distributable profit generally only includes current income (dividends,
interest and rental income). The (realised and unrealised) gains on securities and the realised gains on all
other investments (including real estate), which are added to a so-called reinvestment reserve
(herbeleggingsreserve), are not included in the distributable profit.
2.11 Rental incomeRental income from investment property leased out under operating leases is recognised in the statement of
comprehensive income on a straight-line basis over the term of the lease. Rent incentives granted by the Fund to
its tenants are recognised as an integral part of the total rental income. The rent incentives are included in
investment property.
Incentives to enter into rental agreements are spread evenly over the rental term, even if the payments are not
made on such a basis. The rental term is the non-cancellable period of the rental agreement, together with any
further term for which the tenant has the option to continue the rental agreement, when, at the inception of the
rental agreement it is reasonably certain that the tenant will exercise this option.
Premiums received to terminate rental agreement are recognised in the statement of comprehensive income
when they arise.
2.12 Service charges, property operating expenses and administrative expensesIn the case of service contracts with third parties, service charges are recovered from tenants. Service charges in
respect of vacant property are expensed. These mainly relate to gas, water, electricity, cleaning and security.
Property operating expenses comprise those costs that are directly attributable to the operation of properties, net
of costs charged to tenants. These mainly relate to tax, insurance, leasehold, maintenance and professional fees.
These are expensed as incurred. Administrative expenses are expenses that are not directly attributable to the
operation of properties (including charged management costs not directly related to properties, office overheads,
advice, valuation and audit fees, listing costs and marketing and promotion costs).
Service charges for which the Fund acts as a principal are presented in the statement of comprehensive income.
Therefore, for those property investments for which the Fund is in full control of the service charges, the service
charges invoiced to tenants and the corresponding expenses are shown separately on an accrual basis.
2.13 Other incomeIncome attributable to the year that cannot be classified under any of the other income categories.
2.14 Finance income and expensesFinance income consists of interest income and is recognised in the statement of comprehensive income. Interest
income is recognised in the statement of comprehensive income as it accrues.

Bouwinvest Dutch Institutional Retail Fund N.V. | Annual Report 2016 54
2.15 Cash flow statementCash flows are stated according to the indirect method.
The acquisitions of investment properties are disclosed as cash flows from investment activities, as this reflects
the Fund’s business activities most appropriately.
Cash and cash equivalents comprise cash on hand, demand deposits, short-term deposits in banks with original
maturities of three months or less and short-term, highly liquid investments that are readily convertible to known
amounts of cash and which are subject to an insignificant risk of changes in value.
2.16 Earnings per shareThe Fund presents basic and diluted earnings per share (EPS) for its ordinary share capital. The earnings per
ordinary share are calculated by dividing the profit or loss attributable to the Fund’s shareholders by the weighted
average number of issued ordinary shares during the reporting period. In calculating the diluted earnings per
share, the profit or loss attributable to the Fund’s shareholders and the weighted average number of issued
ordinary shares during the reporting period are adjusted for all potential dilutive effects on the ordinary shares.
2.17 Income taxesBased on its status as an FII, the Fund is subject to Dutch corporate income tax at a rate of 0%. See Note 10.
3 Financial risk management
3.1 Financial risk factorsThe risk management function within the Fund is carried out with respect to financial risks. Financial risks are
risks arising from financial instruments to which the Fund is exposed during or at the end of the reporting period.
Financial risk comprises market risk (including interest rate risk and other price risk), credit risk and liquidity risk.
Risk management is carried out by the risk manager under policies approved by the Statutory Director of the Fund.
The treasury manager identifies and evaluates financial risks in close cooperation with the Fund’s business units
and the risk manager. The Statutory Director of the Fund provides written principles for overall risk management,
as well as written policies covering specific areas, such as interest rate risk, credit risk, and the investment of
excess liquidity.
Market riskThe market risk of financial instruments relates to foreign exchange risk, price risk and interest rate risk. For more
information, we refer you to the Risk Management section.
(I) Foreign exchange risk The Fund has no exposure to foreign exchange risk as it operates in a euro country only.
(II) Price risk The Fund has no significant exposure to price risk as it does not hold any equity securities or commodities. The
Fund is not exposed to price risk other than in respect of financial instruments, such as property price risk,
including property rental risk.
(III) Interest rate risk As the Fund has no external loans and borrowings, it has no exposure to related interest rate risks. The interest
rate risk related to bank balances is mitigated by bank deposits.
(IV) Hedging risk The Fund has no hedging instruments in use.
Credit riskCredit risk is defined as the unforeseen losses on assets if counterparties should fail to meet their obligations. The
creditworthiness of tenants is closely monitored by checking their credit rating and keeping a close watch on the
accounts receivable. Rents are in general also payable in advance and part of the rent payable is secured by means
of bank guarantees or guarantee deposits. There are no significant credit risk concentrations.
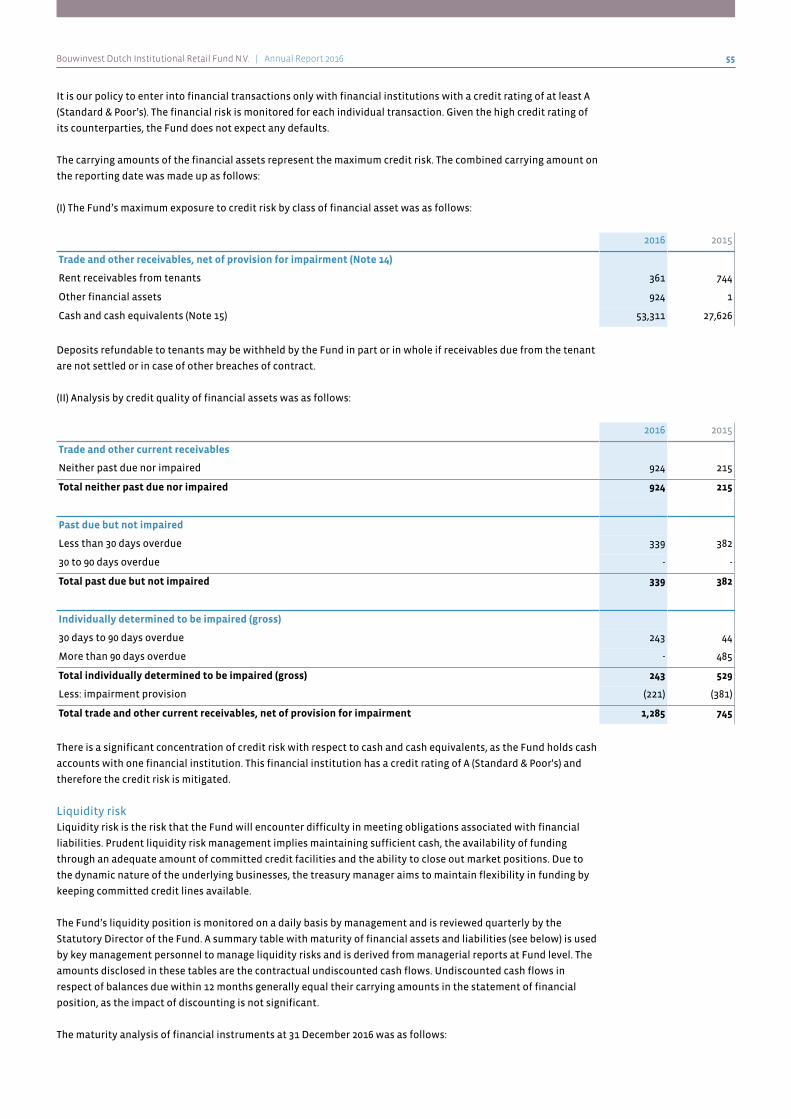
Bouwinvest Dutch Institutional Retail Fund N.V. | Annual Report 2016 55
It is our policy to enter into financial transactions only with financial institutions with a credit rating of at least A
(Standard & Poor’s). The financial risk is monitored for each individual transaction. Given the high credit rating of
its counterparties, the Fund does not expect any defaults.
The carrying amounts of the financial assets represent the maximum credit risk. The combined carrying amount on
the reporting date was made up as follows:
(I) The Fund’s maximum exposure to credit risk by class of financial asset was as follows:
2016 2015
Trade and other receivables, net of provision for impairment (Note 14)
Rent receivables from tenants 361 744
Other financial assets 924 1
Cash and cash equivalents (Note 15) 53,311 27,626
Deposits refundable to tenants may be withheld by the Fund in part or in whole if receivables due from the tenant
are not settled or in case of other breaches of contract.
(II) Analysis by credit quality of financial assets was as follows:
2016 2015
Trade and other current receivables
Neither past due nor impaired 924 215
Total neither past due nor impaired 924 215
Past due but not impaired
Less than 30 days overdue 339 382
30 to 90 days overdue - -
Total past due but not impaired 339 382
Individually determined to be impaired (gross)
30 days to 90 days overdue 243 44
More than 90 days overdue - 485
Total individually determined to be impaired (gross) 243 529
Less: impairment provision (221) (381)
Total trade and other current receivables, net of provision for impairment 1,285 745
There is a significant concentration of credit risk with respect to cash and cash equivalents, as the Fund holds cash
accounts with one financial institution. This financial institution has a credit rating of A (Standard & Poor's) and
therefore the credit risk is mitigated.
Liquidity riskLiquidity risk is the risk that the Fund will encounter difficulty in meeting obligations associated with financial
liabilities. Prudent liquidity risk management implies maintaining sufficient cash, the availability of funding
through an adequate amount of committed credit facilities and the ability to close out market positions. Due to
the dynamic nature of the underlying businesses, the treasury manager aims to maintain flexibility in funding by
keeping committed credit lines available.
The Fund’s liquidity position is monitored on a daily basis by management and is reviewed quarterly by the
Statutory Director of the Fund. A summary table with maturity of financial assets and liabilities (see below) is used
by key management personnel to manage liquidity risks and is derived from managerial reports at Fund level. The
amounts disclosed in these tables are the contractual undiscounted cash flows. Undiscounted cash flows in
respect of balances due within 12 months generally equal their carrying amounts in the statement of financial
position, as the impact of discounting is not significant.
The maturity analysis of financial instruments at 31 December 2016 was as follows:
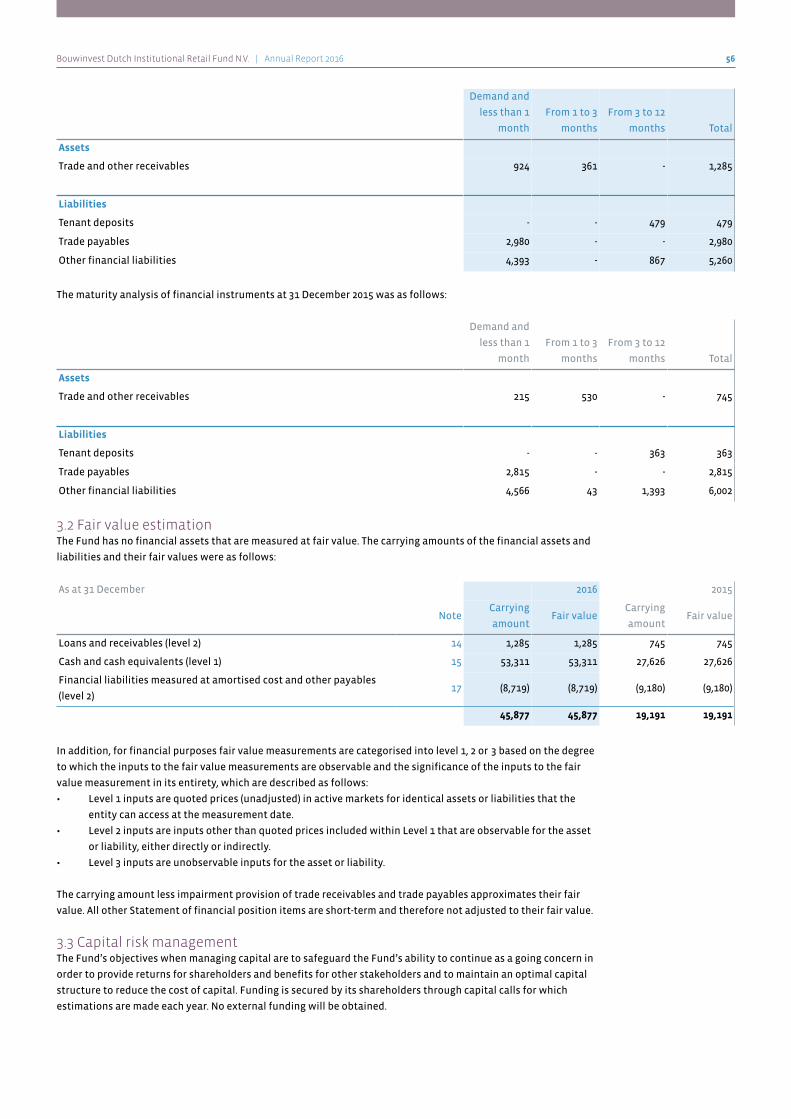
Bouwinvest Dutch Institutional Retail Fund N.V. | Annual Report 2016 56
Demand and
less than 1
month
From 1 to 3
months
From 3 to 12
months Total
Assets
Trade and other receivables 924 361 - 1,285
Liabilities
Tenant deposits - - 479 479
Trade payables 2,980 - - 2,980
Other financial liabilities 4,393 - 867 5,260
The maturity analysis of financial instruments at 31 December 2015 was as follows:
Demand and
less than 1
month
From 1 to 3
months
From 3 to 12
months Total
Assets
Trade and other receivables 215 530 - 745
Liabilities
Tenant deposits - - 363 363
Trade payables 2,815 - - 2,815
Other financial liabilities 4,566 43 1,393 6,002
3.2 Fair value estimationThe Fund has no financial assets that are measured at fair value. The carrying amounts of the financial assets and
liabilities and their fair values were as follows:
As at 31 December 2016 2015
NoteCarrying
amountFair value
Carrying
amountFair value
Loans and receivables (level 2) 14 1,285 1,285 745 745
Cash and cash equivalents (level 1) 15 53,311 53,311 27,626 27,626
Financial liabilities measured at amortised cost and other payables
(level 2)17 (8,719) (8,719) (9,180) (9,180)
45,877 45,877 19,191 19,191
In addition, for financial purposes fair value measurements are categorised into level 1, 2 or 3 based on the degree
to which the inputs to the fair value measurements are observable and the significance of the inputs to the fair
value measurement in its entirety, which are described as follows:
• Level 1 inputs are quoted prices (unadjusted) in active markets for identical assets or liabilities that the
entity can access at the measurement date.
• Level 2 inputs are inputs other than quoted prices included within Level 1 that are observable for the asset
or liability, either directly or indirectly.
• Level 3 inputs are unobservable inputs for the asset or liability.
The carrying amount less impairment provision of trade receivables and trade payables approximates their fair
value. All other Statement of financial position items are short-term and therefore not adjusted to their fair value.
3.3 Capital risk managementThe Fund’s objectives when managing capital are to safeguard the Fund’s ability to continue as a going concern in
order to provide returns for shareholders and benefits for other stakeholders and to maintain an optimal capital
structure to reduce the cost of capital. Funding is secured by its shareholders through capital calls for which
estimations are made each year. No external funding will be obtained.
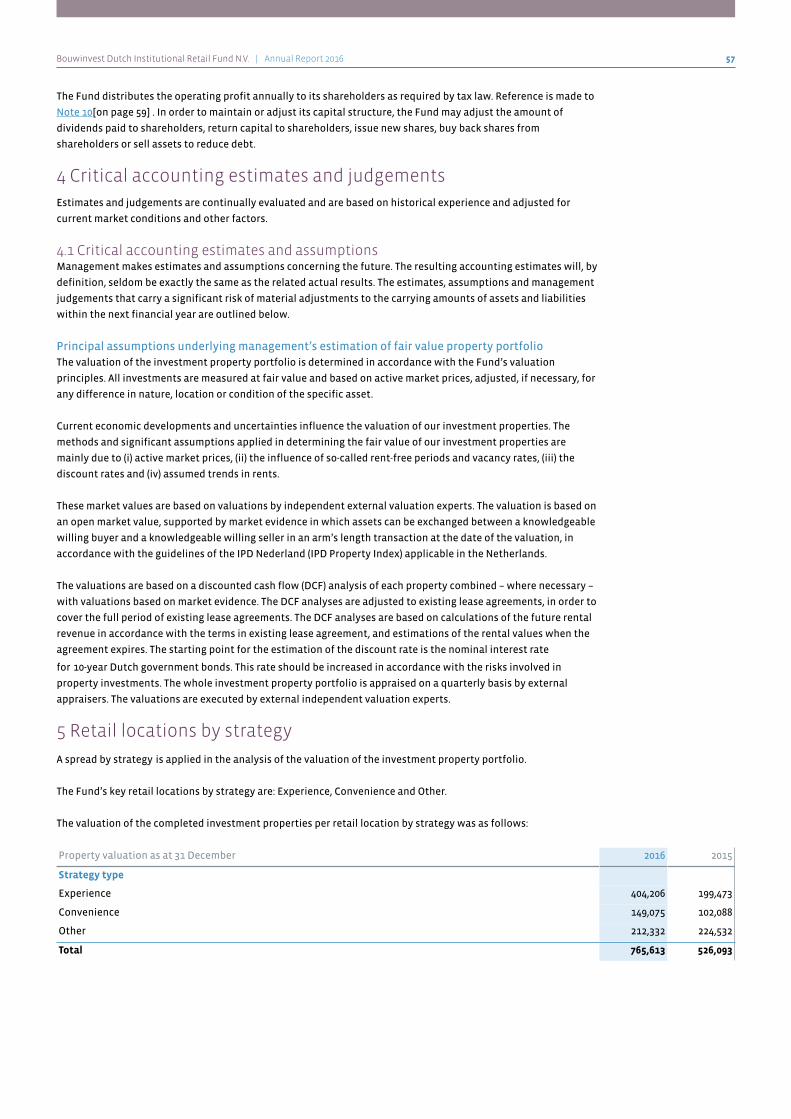
Bouwinvest Dutch Institutional Retail Fund N.V. | Annual Report 2016 57
The Fund distributes the operating profit annually to its shareholders as required by tax law. Reference is made to
Note 10[on page 59] . In order to maintain or adjust its capital structure, the Fund may adjust the amount of
dividends paid to shareholders, return capital to shareholders, issue new shares, buy back shares from
shareholders or sell assets to reduce debt.
4 Critical accounting estimates and judgementsEstimates and judgements are continually evaluated and are based on historical experience and adjusted for
current market conditions and other factors.
4.1 Critical accounting estimates and assumptionsManagement makes estimates and assumptions concerning the future. The resulting accounting estimates will, by
definition, seldom be exactly the same as the related actual results. The estimates, assumptions and management
judgements that carry a significant risk of material adjustments to the carrying amounts of assets and liabilities
within the next financial year are outlined below.
Principal assumptions underlying management’s estimation of fair value property portfolioThe valuation of the investment property portfolio is determined in accordance with the Fund’s valuation
principles. All investments are measured at fair value and based on active market prices, adjusted, if necessary, for
any difference in nature, location or condition of the specific asset.
Current economic developments and uncertainties influence the valuation of our investment properties. The
methods and significant assumptions applied in determining the fair value of our investment properties are
mainly due to (i) active market prices, (ii) the influence of so-called rent-free periods and vacancy rates, (iii) the
discount rates and (iv) assumed trends in rents.
These market values are based on valuations by independent external valuation experts. The valuation is based on
an open market value, supported by market evidence in which assets can be exchanged between a knowledgeable
willing buyer and a knowledgeable willing seller in an arm’s length transaction at the date of the valuation, in
accordance with the guidelines of the IPD Nederland (IPD Property Index) applicable in the Netherlands.
The valuations are based on a discounted cash flow (DCF) analysis of each property combined – where necessary –
with valuations based on market evidence. The DCF analyses are adjusted to existing lease agreements, in order to
cover the full period of existing lease agreements. The DCF analyses are based on calculations of the future rental
revenue in accordance with the terms in existing lease agreement, and estimations of the rental values when the
agreement expires. The starting point for the estimation of the discount rate is the nominal interest rate
for 10-year Dutch government bonds. This rate should be increased in accordance with the risks involved in
property investments. The whole investment property portfolio is appraised on a quarterly basis by external
appraisers. The valuations are executed by external independent valuation experts.
5 Retail locations by strategy
A spread by strategy is applied in the analysis of the valuation of the investment property portfolio.
The Fund’s key retail locations by strategy are: Experience, Convenience and Other.
The valuation of the completed investment properties per retail location by strategy was as follows:
Property valuation as at 31 December 2016 2015
Strategy type
Experience 404,206 199,473
Convenience 149,075 102,088
Other 212,332 224,532
Total 765,613 526,093
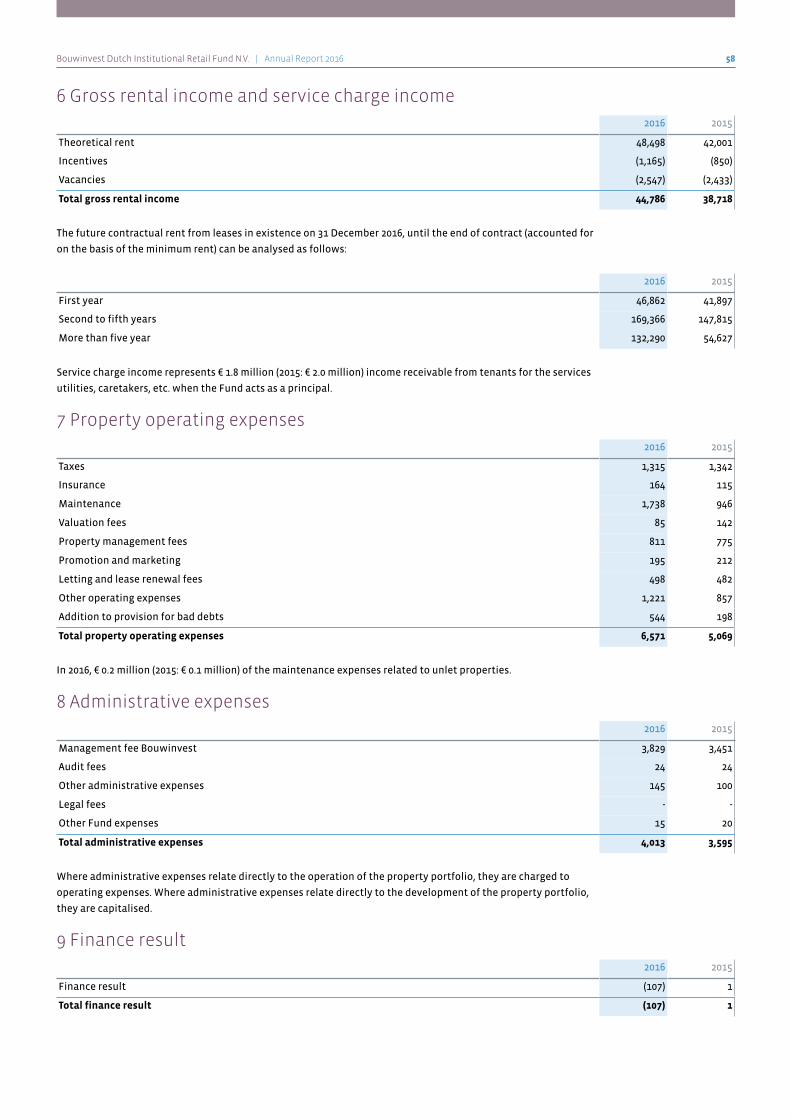
Bouwinvest Dutch Institutional Retail Fund N.V. | Annual Report 2016 58
6 Gross rental income and service charge income2016 2015
Theoretical rent 48,498 42,001
Incentives (1,165) (850)
Vacancies (2,547) (2,433)
Total gross rental income 44,786 38,718
The future contractual rent from leases in existence on 31 December 2016, until the end of contract (accounted for
on the basis of the minimum rent) can be analysed as follows:
2016 2015
First year 46,862 41,897
Second to fifth years 169,366 147,815
More than five year 132,290 54,627
Service charge income represents € 1.8 million (2015: € 2.0 million) income receivable from tenants for the services
utilities, caretakers, etc. when the Fund acts as a principal.
7 Property operating expenses2016 2015
Taxes 1,315 1,342
Insurance 164 115
Maintenance 1,738 946
Valuation fees 85 142
Property management fees 811 775
Promotion and marketing 195 212
Letting and lease renewal fees 498 482
Other operating expenses 1,221 857
Addition to provision for bad debts 544 198
Total property operating expenses 6,571 5,069
In 2016, € 0.2 million (2015: € 0.1 million) of the maintenance expenses related to unlet properties.
8 Administrative expenses2016 2015
Management fee Bouwinvest 3,829 3,451
Audit fees 24 24
Other administrative expenses 145 100
Legal fees - -
Other Fund expenses 15 20
Total administrative expenses 4,013 3,595
Where administrative expenses relate directly to the operation of the property portfolio, they are charged to
operating expenses. Where administrative expenses relate directly to the development of the property portfolio,
they are capitalised.
9 Finance result2016 2015
Finance result (107) 1
Total finance result (107) 1

Bouwinvest Dutch Institutional Retail Fund N.V. | Annual Report 2016 59
The Fund had no external loans and borrowings during 2016. The Fund was subject to the negative interest rate
development for its bank balances.
10 Income taxesThe Fund is structured as a fiscal investment institution (fiscale beleggingsinstelling, or ‘FII’) within the meaning of
Article 28 of the Dutch Corporate Income Tax Act 1969 (Wet op de vennootschapsbelasting 1969). An FII is subject to
Dutch corporate income tax at a rate of 0%, provided that certain requirements are met regarding the Fund’s
distribution of profits, its activities, leverage and shareholders.
An FII is obliged to distribute its distributable profit annually within eight (8) months after the end of the relevant
fiscal year (doorstootverplichting). The distributable profit generally only includes current income (dividends,
interest and rental income). The (realised and unrealised) gains on securities and the realised gains on all other
investments (including real estate), which are added to a so-called reinvestment reserve (herbeleggingsreserve),
are not included in the distributable profit.
An FII is obliged to be engaged exclusively in portfolio investment activities, i.e. it may not (partly) conduct an
active trade or business. Whether an activity is characterised as a portfolio investment activity or as a business
activity for Dutch tax purposes depends on all the relevant facts and circumstances. Additional rules apply for real
estate development activities related to the FII’s own real estate portfolio. In this respect, an FII may engage in
development activities for its own real estate portfolio, provided that the property development is carried out
within a taxable subsidiary that carries out the development activities on behalf of the FII. Improvements to
existing properties do not qualify as development activities provided that the capital expenditure is less than 30%
of the value of the property as determined by the Dutch Valuation of Immovable Property Act (Wet waardering
onroerende zaken) prior to the improvements.
An FII may finance its investments with debt up to a maximum of 60% of the fiscal book value of the real estate
property, plus 20% of the fiscal book value of all other investments.
To qualify as an FII, at least 75% of the Fund must be owned by:
• Individuals
• Entities that are not liable for profit tax and the profits of which are not taxed at the level of the
beneficiaries
• Entities that are exempt from profit tax and the profits of which are not taxed at the level of the
beneficiaries
• Listed/regulated FIIs
It is also prohibited for entities resident in the Netherlands to collectively own an interest of 25% or more in the
Fund through one or more mutual funds or corporate entities not resident in the Netherlands with a capital
divided into shares; and no single individual may own an interest of 5% or more.
Retail Development is the taxable subsidiary that carries out development activities for the Retail Fund.
The profit before tax of Retail Development is € 5,000 and therefore the income tax amount to € 1,000.
In December 2016 the Fund established a taxable subsidiary, Bouwinvest Dutch Institutional Retail Fund Services
B.V., which renders services that are ancillary to renting activities of the Fund. Since no services were recognised in
2016, the taxable profit was nihil.
The Retail Fund met the requirements of an FII in 2016. The effective tax rate was 0% (2015: 0%).
11 Employee benefits expenseThe Retail Fund has no employees.
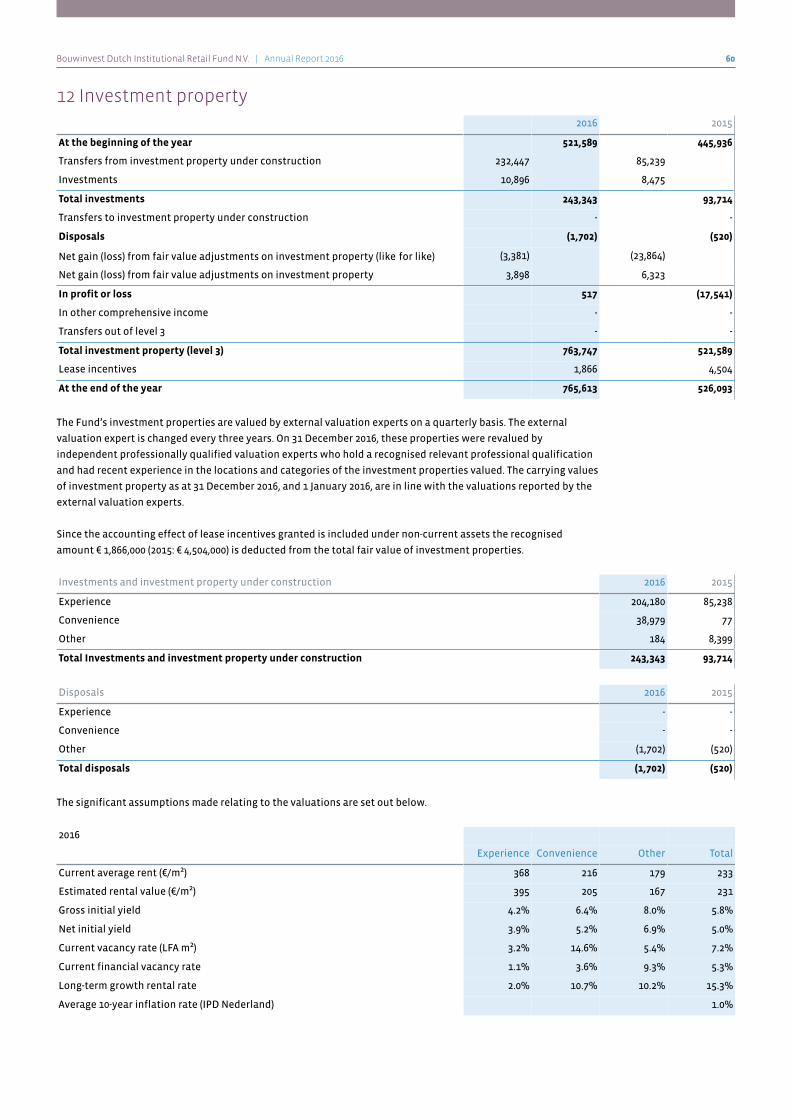
Bouwinvest Dutch Institutional Retail Fund N.V. | Annual Report 2016 60
12 Investment property2016 2015
At the beginning of the year 521,589 445,936
Transfers from investment property under construction 232,447 85,239
Investments 10,896 8,475
Total investments 243,343 93,714
Transfers to investment property under construction - -
Disposals (1,702) (520)
Net gain (loss) from fair value adjustments on investment property (like for like) (3,381) (23,864)
Net gain (loss) from fair value adjustments on investment property 3,898 6,323
In profit or loss 517 (17,541)
In other comprehensive income - -
Transfers out of level 3 - -
Total investment property (level 3) 763,747 521,589
Lease incentives 1,866 4,504
At the end of the year 765,613 526,093
The Fund’s investment properties are valued by external valuation experts on a quarterly basis. The external
valuation expert is changed every three years. On 31 December 2016, these properties were revalued by
independent professionally qualified valuation experts who hold a recognised relevant professional qualification
and had recent experience in the locations and categories of the investment properties valued. The carrying values
of investment property as at 31 December 2016, and 1 January 2016, are in line with the valuations reported by the
external valuation experts.
Since the accounting effect of lease incentives granted is included under non-current assets the recognised
amount € 1,866,000 (2015: € 4,504,000) is deducted from the total fair value of investment properties.
Investments and investment property under construction 2016 2015
Experience 204,180 85,238
Convenience 38,979 77
Other 184 8,399
Total Investments and investment property under construction 243,343 93,714
Disposals 2016 2015
Experience - -
Convenience - -
Other (1,702) (520)
Total disposals (1,702) (520)
The significant assumptions made relating to the valuations are set out below.
2016
Experience Convenience Other Total
Current average rent (€/m²) 368 216 179 233
Estimated rental value (€/m²) 395 205 167 231
Gross initial yield 4.2% 6.4% 8.0% 5.8%
Net initial yield 3.9% 5.2% 6.9% 5.0%
Current vacancy rate (LFA m²) 3.2% 14.6% 5.4% 7.2%
Current financial vacancy rate 1.1% 3.6% 9.3% 5.3%
Long-term growth rental rate 2.0% 10.7% 10.2% 15.3%
Average 10-year inflation rate (IPD Nederland) 1.0%
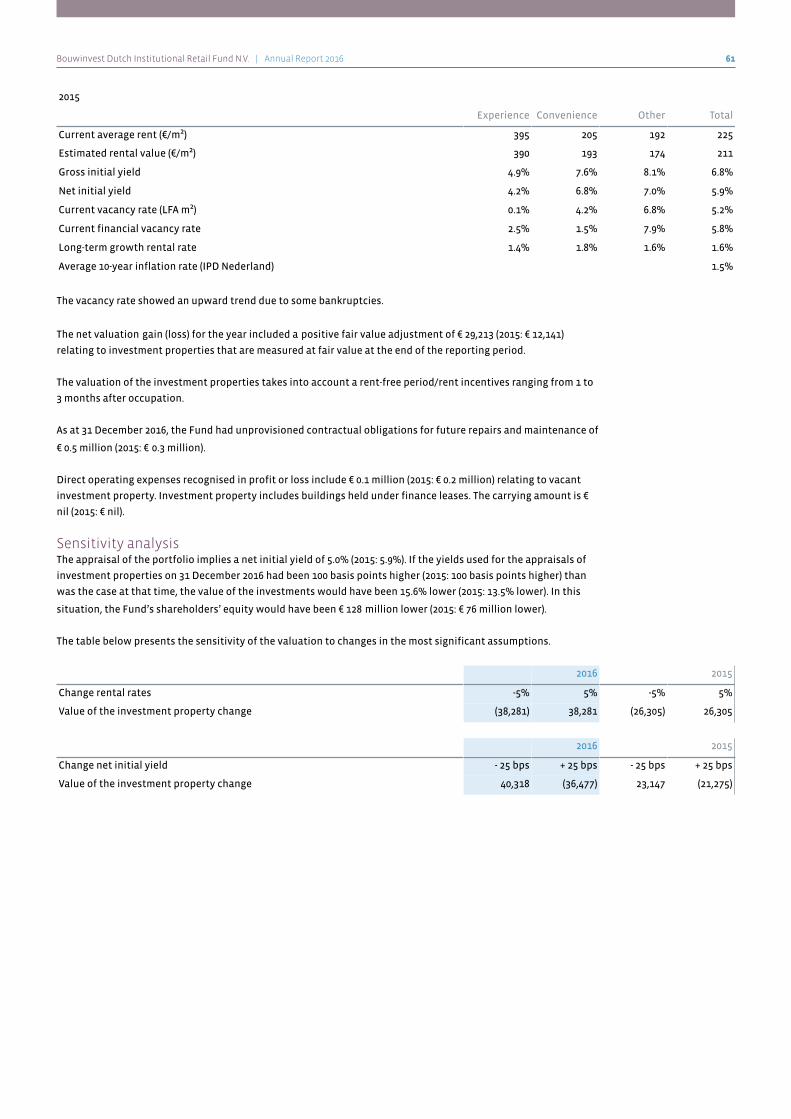
Bouwinvest Dutch Institutional Retail Fund N.V. | Annual Report 2016 61
2015
Experience Convenience Other Total
Current average rent (€/m²) 395 205 192 225
Estimated rental value (€/m²) 390 193 174 211
Gross initial yield 4.9% 7.6% 8.1% 6.8%
Net initial yield 4.2% 6.8% 7.0% 5.9%
Current vacancy rate (LFA m²) 0.1% 4.2% 6.8% 5.2%
Current financial vacancy rate 2.5% 1.5% 7.9% 5.8%
Long-term growth rental rate 1.4% 1.8% 1.6% 1.6%
Average 10-year inflation rate (IPD Nederland) 1.5%
The vacancy rate showed an upward trend due to some bankruptcies.
The net valuation gain (loss) for the year included a positive fair value adjustment of € 29,213 (2015: € 12,141)
relating to investment properties that are measured at fair value at the end of the reporting period.
The valuation of the investment properties takes into account a rent-free period/rent incentives ranging from 1 to
3 months after occupation.
As at 31 December 2016, the Fund had unprovisioned contractual obligations for future repairs and maintenance of
€ 0.5 million (2015: € 0.3 million).
Direct operating expenses recognised in profit or loss include € 0.1 million (2015: € 0.2 million) relating to vacant
investment property. Investment property includes buildings held under finance leases. The carrying amount is €
nil (2015: € nil).
Sensitivity analysisThe appraisal of the portfolio implies a net initial yield of 5.0% (2015: 5.9%). If the yields used for the appraisals of
investment properties on 31 December 2016 had been 100 basis points higher (2015: 100 basis points higher) than
was the case at that time, the value of the investments would have been 15.6% lower (2015: 13.5% lower). In this
situation, the Fund’s shareholders’ equity would have been € 128 million lower (2015: € 76 million lower).
The table below presents the sensitivity of the valuation to changes in the most significant assumptions.
2016 2015
Change rental rates -5% 5% -5% 5%
Value of the investment property change (38,281) 38,281 (26,305) 26,305
2016 2015
Change net initial yield - 25 bps + 25 bps - 25 bps + 25 bps
Value of the investment property change 40,318 (36,477) 23,147 (21,275)
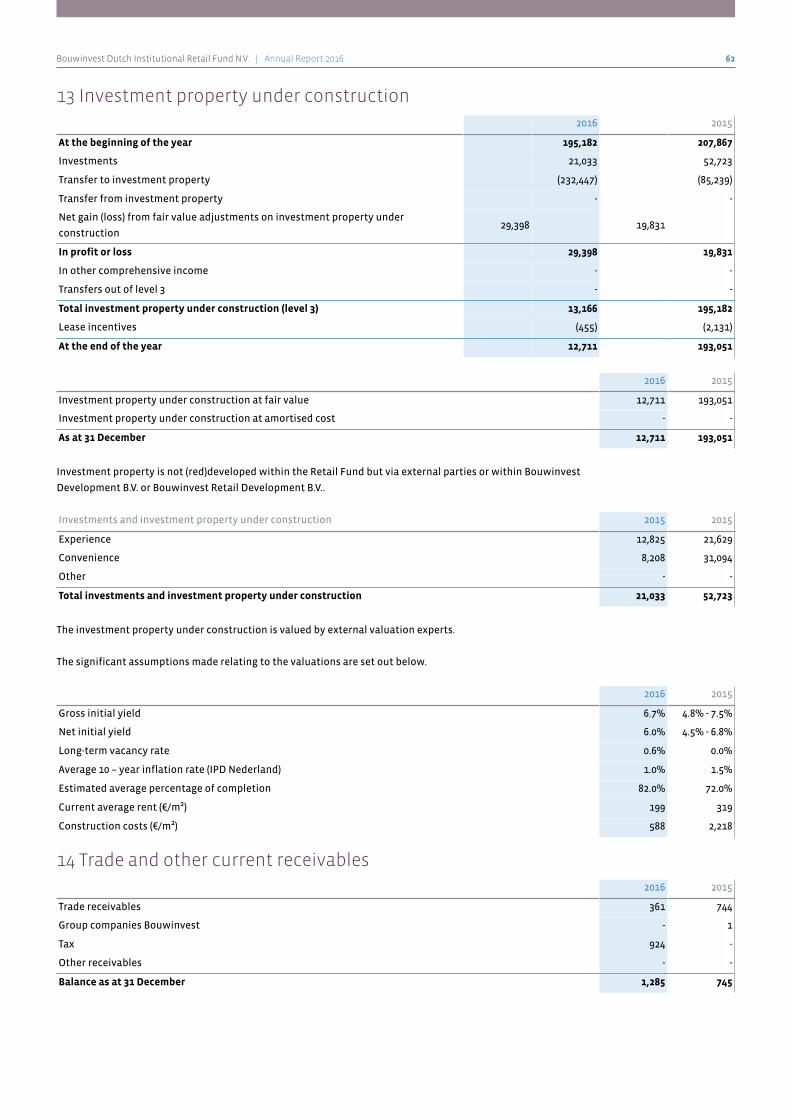
Bouwinvest Dutch Institutional Retail Fund N.V. | Annual Report 2016 62
13 Investment property under construction2016 2015
At the beginning of the year 195,182 207,867
Investments 21,033 52,723
Transfer to investment property (232,447) (85,239)
Transfer from investment property - -
Net gain (loss) from fair value adjustments on investment property under
construction29,398 19,831
In profit or loss 29,398 19,831
In other comprehensive income - -
Transfers out of level 3 - -
Total investment property under construction (level 3) 13,166 195,182
Lease incentives (455) (2,131)
At the end of the year 12,711 193,051
2016 2015
Investment property under construction at fair value 12,711 193,051
Investment property under construction at amortised cost - -
As at 31 December 12,711 193,051
Investment property is not (red)developed within the Retail Fund but via external parties or within Bouwinvest
Development B.V. or Bouwinvest Retail Development B.V..
Investments and investment property under construction 2015 2015
Experience 12,825 21,629
Convenience 8,208 31,094
Other - -
Total investments and investment property under construction 21,033 52,723
The investment property under construction is valued by external valuation experts.
The significant assumptions made relating to the valuations are set out below.
2016 2015
Gross initial yield 6.7% 4.8% - 7.5%
Net initial yield 6.0% 4.5% - 6.8%
Long-term vacancy rate 0.6% 0.0%
Average 10 – year inflation rate (IPD Nederland) 1.0% 1.5%
Estimated average percentage of completion 82.0% 72.0%
Current average rent (€/m²) 199 319
Construction costs (€/m²) 588 2,218
14 Trade and other current receivables2016 2015
Trade receivables 361 744
Group companies Bouwinvest - 1
Tax 924 -
Other receivables - -
Balance as at 31 December 1,285 745
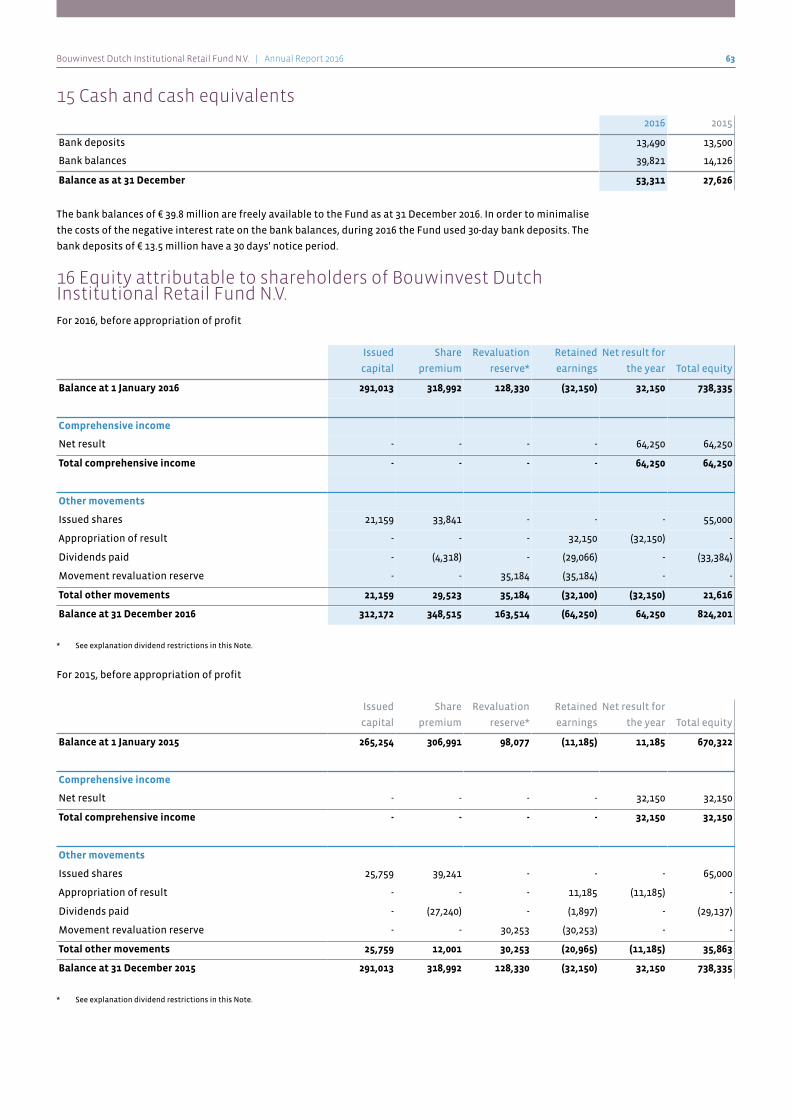
Bouwinvest Dutch Institutional Retail Fund N.V. | Annual Report 2016 63
15 Cash and cash equivalents2016 2015
Bank deposits 13,490 13,500
Bank balances 39,821 14,126
Balance as at 31 December 53,311 27,626
The bank balances of € 39.8 million are freely available to the Fund as at 31 December 2016. In order to minimalise
the costs of the negative interest rate on the bank balances, during 2016 the Fund used 30-day bank deposits. The
bank deposits of € 13.5 million have a 30 days' notice period.
16 Equity attributable to shareholders of Bouwinvest DutchInstitutional Retail Fund N.V.For 2016, before appropriation of profit
Issued
capital
Share
premium
Revaluation
reserve*
Retained
earnings
Net result for
the year Total equity
Balance at 1 January 2016 291,013 318,992 128,330 (32,150) 32,150 738,335
Comprehensive income
Net result - - - - 64,250 64,250
Total comprehensive income - - - - 64,250 64,250
Other movements
Issued shares 21,159 33,841 - - - 55,000
Appropriation of result - - - 32,150 (32,150) -
Dividends paid - (4,318) - (29,066) - (33,384)
Movement revaluation reserve - - 35,184 (35,184) - -
Total other movements 21,159 29,523 35,184 (32,100) (32,150) 21,616
Balance at 31 December 2016 312,172 348,515 163,514 (64,250) 64,250 824,201
* See explanation dividend restrictions in this Note.
For 2015, before appropriation of profit
Issued
capital
Share
premium
Revaluation
reserve*
Retained
earnings
Net result for
the year Total equity
Balance at 1 January 2015 265,254 306,991 98,077 (11,185) 11,185 670,322
Comprehensive income
Net result - - - - 32,150 32,150
Total comprehensive income - - - - 32,150 32,150
Other movements
Issued shares 25,759 39,241 - - - 65,000
Appropriation of result - - - 11,185 (11,185) -
Dividends paid - (27,240) - (1,897) - (29,137)
Movement revaluation reserve - - 30,253 (30,253) - -
Total other movements 25,759 12,001 30,253 (20,965) (11,185) 35,863
Balance at 31 December 2015 291,013 318,992 128,330 (32,150) 32,150 738,335
* See explanation dividend restrictions in this Note.
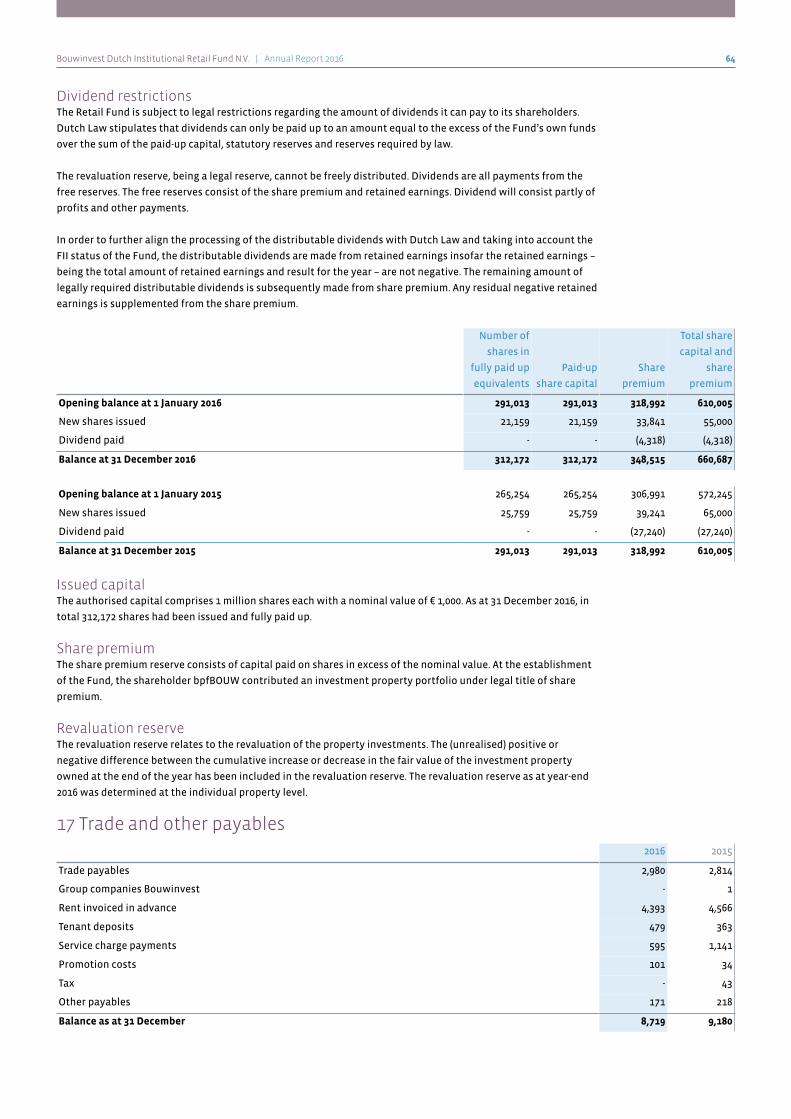
Bouwinvest Dutch Institutional Retail Fund N.V. | Annual Report 2016 64
Dividend restrictionsThe Retail Fund is subject to legal restrictions regarding the amount of dividends it can pay to its shareholders.
Dutch Law stipulates that dividends can only be paid up to an amount equal to the excess of the Fund’s own funds
over the sum of the paid-up capital, statutory reserves and reserves required by law.
The revaluation reserve, being a legal reserve, cannot be freely distributed. Dividends are all payments from the
free reserves. The free reserves consist of the share premium and retained earnings. Dividend will consist partly of
profits and other payments.
In order to further align the processing of the distributable dividends with Dutch Law and taking into account the
FII status of the Fund, the distributable dividends are made from retained earnings insofar the retained earnings –
being the total amount of retained earnings and result for the year – are not negative. The remaining amount of
legally required distributable dividends is subsequently made from share premium. Any residual negative retained
earnings is supplemented from the share premium.
Number of
shares in
fully paid up
equivalents
Paid-up
share capital
Share
premium
Total share
capital and
share
premium
Opening balance at 1 January 2016 291,013 291,013 318,992 610,005
New shares issued 21,159 21,159 33,841 55,000
Dividend paid - - (4,318) (4,318)
Balance at 31 December 2016 312,172 312,172 348,515 660,687
Opening balance at 1 January 2015 265,254 265,254 306,991 572,245
New shares issued 25,759 25,759 39,241 65,000
Dividend paid - - (27,240) (27,240)
Balance at 31 December 2015 291,013 291,013 318,992 610,005
Issued capitalThe authorised capital comprises 1 million shares each with a nominal value of € 1,000. As at 31 December 2016, in
total 312,172 shares had been issued and fully paid up.
Share premiumThe share premium reserve consists of capital paid on shares in excess of the nominal value. At the establishment
of the Fund, the shareholder bpfBOUW contributed an investment property portfolio under legal title of share
premium.
Revaluation reserveThe revaluation reserve relates to the revaluation of the property investments. The (unrealised) positive or
negative difference between the cumulative increase or decrease in the fair value of the investment property
owned at the end of the year has been included in the revaluation reserve. The revaluation reserve as at year-end
2016 was determined at the individual property level.
17 Trade and other payables2016 2015
Trade payables 2,980 2,814
Group companies Bouwinvest - 1
Rent invoiced in advance 4,393 4,566
Tenant deposits 479 363
Service charge payments 595 1,141
Promotion costs 101 34
Tax - 43
Other payables 171 218
Balance as at 31 December 8,719 9,180
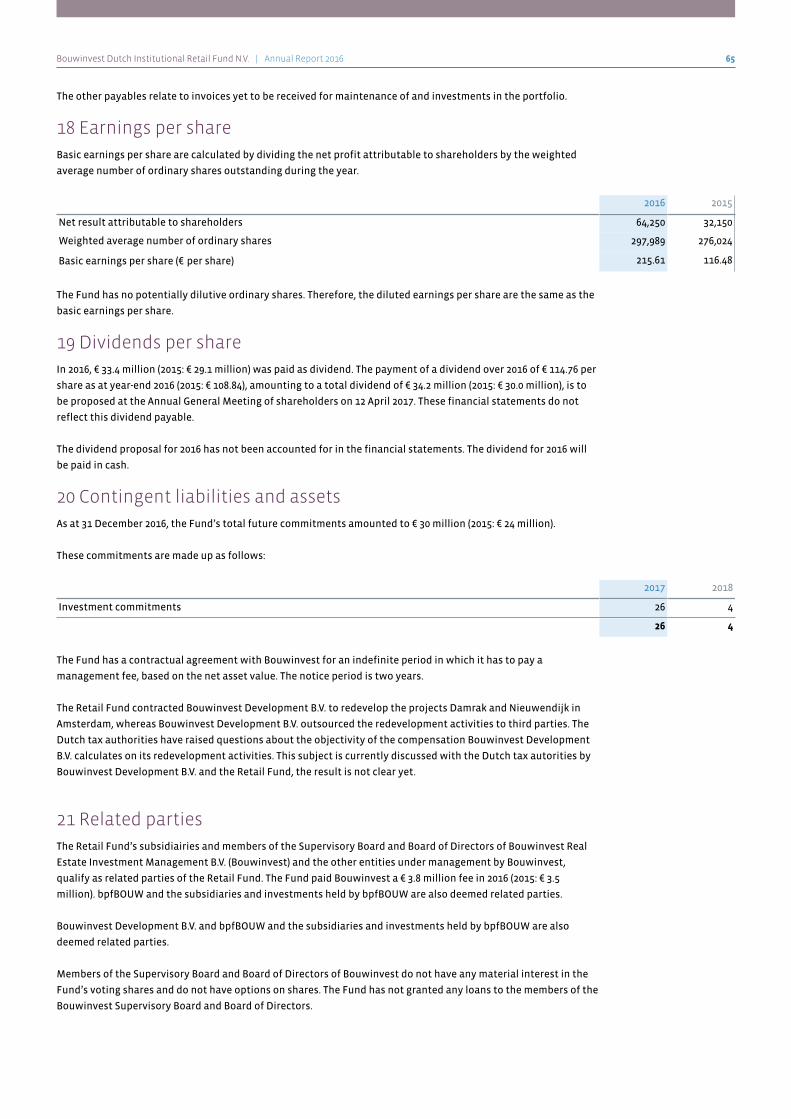
Bouwinvest Dutch Institutional Retail Fund N.V. | Annual Report 2016 65
The other payables relate to invoices yet to be received for maintenance of and investments in the portfolio.
18 Earnings per shareBasic earnings per share are calculated by dividing the net profit attributable to shareholders by the weighted
average number of ordinary shares outstanding during the year.
2016 2015
Net result attributable to shareholders 64,250 32,150
Weighted average number of ordinary shares 297,989 276,024
Basic earnings per share (€ per share) 215.61 116.48
The Fund has no potentially dilutive ordinary shares. Therefore, the diluted earnings per share are the same as the
basic earnings per share.
19 Dividends per shareIn 2016, € 33.4 million (2015: € 29.1 million) was paid as dividend. The payment of a dividend over 2016 of € 114.76 per
share as at year-end 2016 (2015: € 108.84), amounting to a total dividend of € 34.2 million (2015: € 30.0 million), is to
be proposed at the Annual General Meeting of shareholders on 12 April 2017. These financial statements do not
reflect this dividend payable.
The dividend proposal for 2016 has not been accounted for in the financial statements. The dividend for 2016 will
be paid in cash.
20 Contingent liabilities and assetsAs at 31 December 2016, the Fund’s total future commitments amounted to € 30 million (2015: € 24 million).
These commitments are made up as follows:
2017 2018
Investment commitments 26 4
26 4
The Fund has a contractual agreement with Bouwinvest for an indefinite period in which it has to pay a
management fee, based on the net asset value. The notice period is two years.
The Retail Fund contracted Bouwinvest Development B.V. to redevelop the projects Damrak and Nieuwendijk in
Amsterdam, whereas Bouwinvest Development B.V. outsourced the redevelopment activities to third parties. The
Dutch tax authorities have raised questions about the objectivity of the compensation Bouwinvest Development
B.V. calculates on its redevelopment activities. This subject is currently discussed with the Dutch tax autorities by
Bouwinvest Development B.V. and the Retail Fund, the result is not clear yet.
21 Related partiesThe Retail Fund’s subsidiairies and members of the Supervisory Board and Board of Directors of Bouwinvest Real
Estate Investment Management B.V. (Bouwinvest) and the other entities under management by Bouwinvest,
qualify as related parties of the Retail Fund. The Fund paid Bouwinvest a € 3.8 million fee in 2016 (2015: € 3.5
million). bpfBOUW and the subsidiaries and investments held by bpfBOUW are also deemed related parties.
Bouwinvest Development B.V. and bpfBOUW and the subsidiaries and investments held by bpfBOUW are also
deemed related parties.
Members of the Supervisory Board and Board of Directors of Bouwinvest do not have any material interest in the
Fund’s voting shares and do not have options on shares. The Fund has not granted any loans to the members of the
Bouwinvest Supervisory Board and Board of Directors.

Bouwinvest Dutch Institutional Retail Fund N.V. | Annual Report 2016 66
The members of the Bouwinvest Supervisory Board and Board of Directors held no personal interest in the Fund’s
investments in 2016.
Bouwinvest Development B.V. and Bouwinvest Retail Development B.V. (re)develops part of the investment
property for the Fund. In 2016, € 17.2 million (2015: € 30.1 million) was paid to Bouwinvest Development B.V. with
regard to the projects Nieuwendijk 196 (Amsterdam), Damrak 70 (Amsterdam), Molenhoekpassage (Rosmalen),
Goverwelle (Gouda) and Westerhaven (Groningen).
22 Management feeBouwinvest is the manager and the Statutory Director of the Fund. The management fee paid for the year 2016
amounted to € 3.8 million (2015: € 3.5 million).
In consideration of the management activities with respect to the Fund, Bouwinvest receives an annual
management fee equal to 0.50% (exclusive of VAT) of the Fund’s net asset value in accordance with the valuation
methods of the Fund. The management fee is payable quarterly in advance.
The remuneration of the members of the Supervisory Board is included in the management fee paid to Bouwinvest.
During the reporting period, the manager, Bouwinvest, is responsible for five funds of which the Residential Fund,
Office Fund and Retail Fund are under supervision of the Dutch Financial Markets Authority (AFM). Bouwinvest
also has a separate mandate from bpfBOUW for the management of international real estate investments and
manages Bouwinvest Development B.V. The remuneration cannot be explicitly allocated per fund and is therefore
not available. The remuneration, in line with the AIMFD Article 107, is disclosed in the annual report 2016 of
Bouwinvest Real Estate Investment Management B.V., which is filed and public.
23 Audit feesThe table below shows the fees charged over the year 2016 by Deloitte Accountants B.V. and the Deloitte Network
in respect of activities for the Retail Fund.
2016 2015
Audit of the financial statements 24 24
Other audit engagements - -
Tax advisory services - -
Other non-audit services - -
Total fees 24 24
24 Subsequent events
As of January 2017, three Dutch pension funds committed for a total of € 55 million.
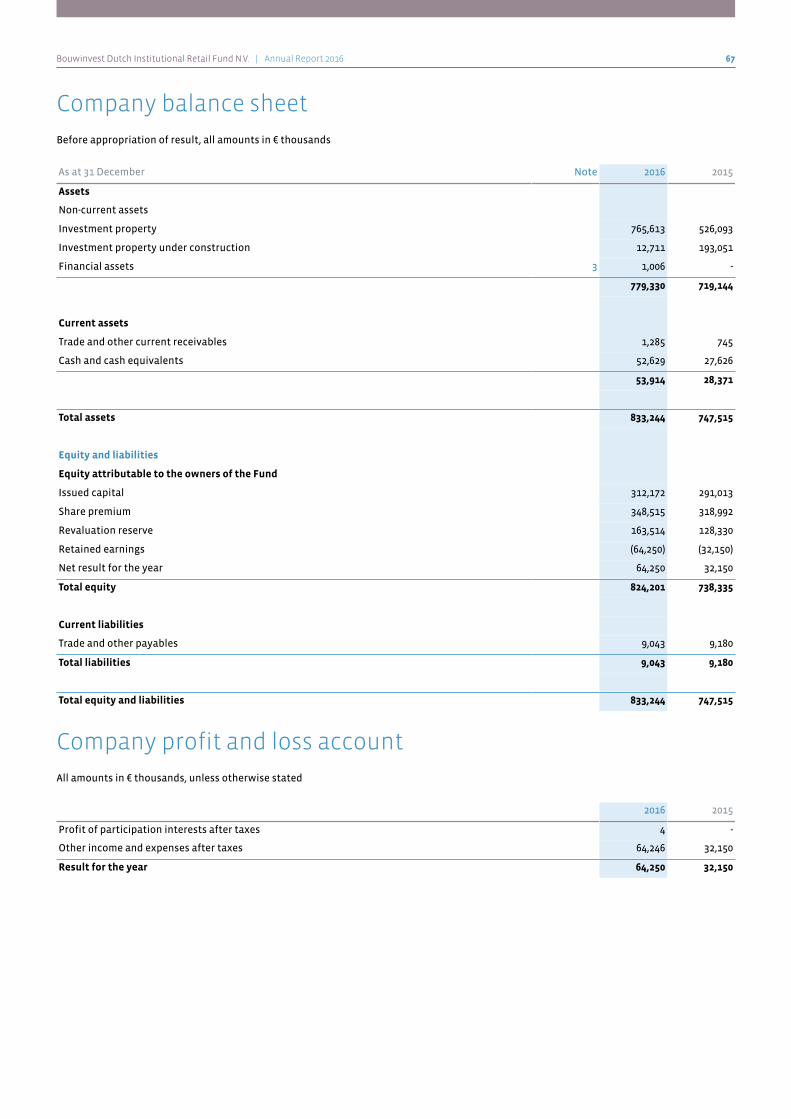
Bouwinvest Dutch Institutional Retail Fund N.V. | Annual Report 2016 67
Company balance sheet
Before appropriation of result, all amounts in € thousands
As at 31 December Note 2016 2015
Assets
Non-current assets
Investment property 765,613 526,093
Investment property under construction 12,711 193,051
Financial assets 3 1,006 -
779,330 719,144
Current assets
Trade and other current receivables 1,285 745
Cash and cash equivalents 52,629 27,626
53,914 28,371
Total assets 833,244 747,515
Equity and liabilities
Equity attributable to the owners of the Fund
Issued capital 312,172 291,013
Share premium 348,515 318,992
Revaluation reserve 163,514 128,330
Retained earnings (64,250) (32,150)
Net result for the year 64,250 32,150
Total equity 824,201 738,335
Current liabilities
Trade and other payables 9,043 9,180
Total liabilities 9,043 9,180
Total equity and liabilities 833,244 747,515
Company profit and loss account
All amounts in € thousands, unless otherwise stated
2016 2015
Profit of participation interests after taxes 4 -
Other income and expenses after taxes 64,246 32,150
Result for the year 64,250 32,150

Bouwinvest Dutch Institutional Retail Fund N.V. | Annual Report 2016 68
Notes to the company financial statements
All amounts in € thousands, unless otherwise stated
1 Summary of significant accounting policies
1.1 GeneralThe Company financial statements of Bouwinvest Dutch Institutional Retail Fund N.V. (the Retail Fund) are
included in the consolidated financial statements and are prepared in accordance with the legal requirements of
Part 9, Book 2 of the Dutch Civil Code. These financial statements have been prepared in accordance with provision
of Article 2:362 subsection 8 and 9, of the Dutch Civil Code, under which the Company financial statements may be
prepared in accordance with accounting policies as adopted in the consolidated financial statements.
If no other policies are mentioned, the applicable policies are those of the consolidated financial statements. The
consolidated financial statements should be consulted for an appropriate interpretation of the Company financial
statements.
The notes in the consolidated financial statements also apply to the Company accounts. If Company amounts are
not directly traceable to the consolidated notes, additional notes are included in the Company notes.
The consolidated financial statements are prepared in accordance with International Financial Reporting
Standards (IFRS) as endorsed by the European Union.
The exemption laid down in Article 402 Book 2 of the Dutch Civil Code has been applied to the Company profit and
loss account of the Fund.
1.2 Financial assetsSubsidiariesSubsidiaries include all entities over which the Fund has the power – directly or indirectly – to control financial
and operational policies. Subsidiaries are valued under the net equity method, but not lower than zero.
The equity value is measured by valuation of assets, provisions and liabilities and determination of results based
on the accounting policies of the consolidated financial statements.
Recognition of lossesIf the share in losses attributable to the Fund exceeds the carrying amount of the net investment (investment and
other unsecured receivables), further losses will not be recognised, unless the Fund has provided securities to the
associate, committed to liabilities or paid on behalf of the associate. In that case, a provision will be set aside for
the excess.
2 Financial risk managementReference is made to Note 3 of the consolidated financial statements.
3 Financial assets2016 2015
As per 1 January - -
Acquisitions 1,002 -
Net result for the year 4 -
As per 31 December 1,006 -
The Fund acquired the shares (100%) of the following subsidiaries:
• Bouwinvest Retail Development B.V., Amsterdam
• Bouwinvest Dutch Institutional Retail Fund Services B.V., Amsterdam
Bouwinvest Retail Development B.V. redevelops investment properties for Bouwinvest Dutch Institutional
Retail Fund N.V.
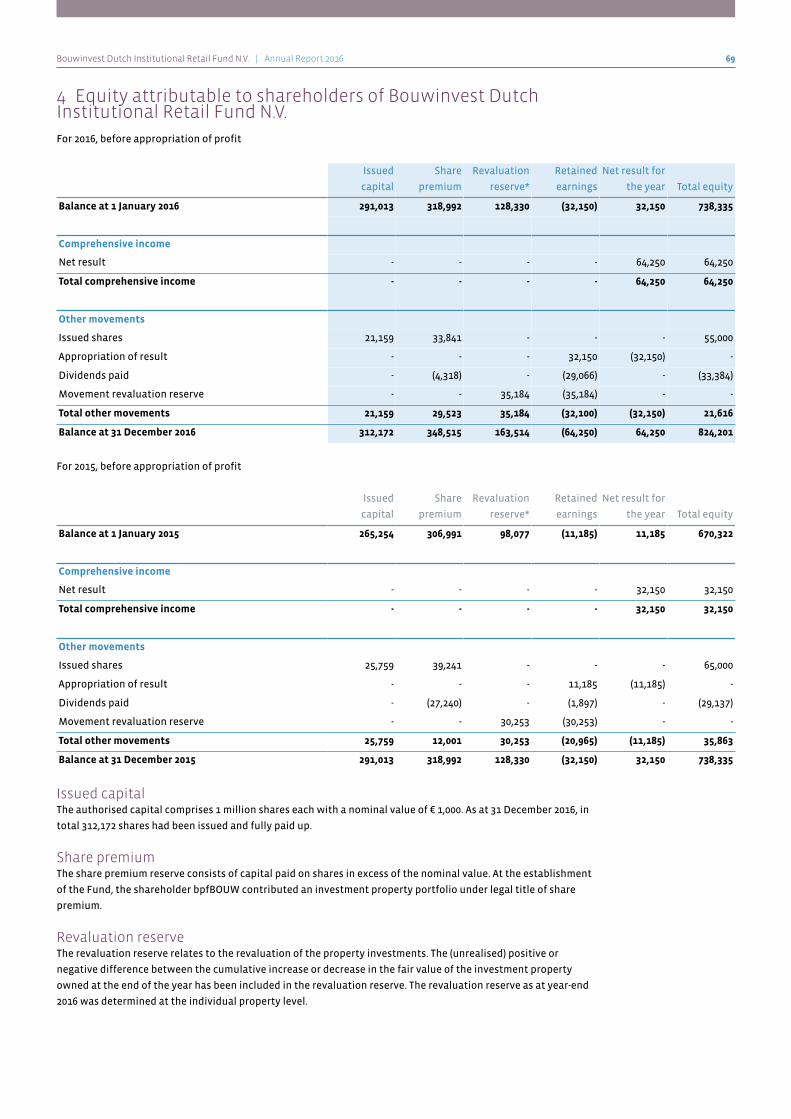
Bouwinvest Dutch Institutional Retail Fund N.V. | Annual Report 2016 69
4 Equity attributable to shareholders of Bouwinvest DutchInstitutional Retail Fund N.V.For 2016, before appropriation of profit
Issued
capital
Share
premium
Revaluation
reserve*
Retained
earnings
Net result for
the year Total equity
Balance at 1 January 2016 291,013 318,992 128,330 (32,150) 32,150 738,335
Comprehensive income
Net result - - - - 64,250 64,250
Total comprehensive income - - - - 64,250 64,250
Other movements
Issued shares 21,159 33,841 - - - 55,000
Appropriation of result - - - 32,150 (32,150) -
Dividends paid - (4,318) - (29,066) - (33,384)
Movement revaluation reserve - - 35,184 (35,184) - -
Total other movements 21,159 29,523 35,184 (32,100) (32,150) 21,616
Balance at 31 December 2016 312,172 348,515 163,514 (64,250) 64,250 824,201
For 2015, before appropriation of profit
Issued
capital
Share
premium
Revaluation
reserve*
Retained
earnings
Net result for
the year Total equity
Balance at 1 January 2015 265,254 306,991 98,077 (11,185) 11,185 670,322
Comprehensive income
Net result - - - - 32,150 32,150
Total comprehensive income - - - - 32,150 32,150
Other movements
Issued shares 25,759 39,241 - - - 65,000
Appropriation of result - - - 11,185 (11,185) -
Dividends paid - (27,240) - (1,897) - (29,137)
Movement revaluation reserve - - 30,253 (30,253) - -
Total other movements 25,759 12,001 30,253 (20,965) (11,185) 35,863
Balance at 31 December 2015 291,013 318,992 128,330 (32,150) 32,150 738,335
Issued capitalThe authorised capital comprises 1 million shares each with a nominal value of € 1,000. As at 31 December 2016, in
total 312,172 shares had been issued and fully paid up.
Share premiumThe share premium reserve consists of capital paid on shares in excess of the nominal value. At the establishment
of the Fund, the shareholder bpfBOUW contributed an investment property portfolio under legal title of share
premium.
Revaluation reserveThe revaluation reserve relates to the revaluation of the property investments. The (unrealised) positive or
negative difference between the cumulative increase or decrease in the fair value of the investment property
owned at the end of the year has been included in the revaluation reserve. The revaluation reserve as at year-end
2016 was determined at the individual property level.

Bouwinvest Dutch Institutional Retail Fund N.V. | Annual Report 2016 70
Appropriation of profit 2015The Annual General Meeting of shareholders on 18 April 2016 adopted and approved the 2015 financial statements
of the Retail Fund. A dividend of € 108.84 (in cash) per share has been paid. Of the profit for 2015 amounting to € 32.2
million, € 32.2 million was incorporated in the retained earnings.
Proposal for profit appropriation 2016The management of the Fund proposes to the General Meeting of shareholders that a dividend of € 114.76 (in cash)
per share be paid. Of the profit for 2016 amounting to € 64.3 million, € 64.3 million will be incorporated in the
retained earnings.
5 Employee benefits expenseThe Retail Fund has no employees.
6 RemunerationReference is made to Note 22 of the consolidated financial statements.
Signing of the Financial Statements
Amsterdam, 20 March 2017
Bouwinvest Real Estate Investment Management B.V.Dick van Hal, Chairman of the Board of Directors and Statutory Director
Arno van Geet, Managing Director Finance
Allard van Spaandonk, Managing Director Dutch Investments
Stephen Tross, Managing Director International Investments

Bouwinvest Dutch Institutional Retail Fund N.V. | Annual Report 2016 71
Other information
Articles of Association related to the appropriation
of profit
Appropriation of profit is provided for in Article 20 of the Articles of Association. This specific article is quoted
below.
20.1The distributable profit shall be at the disposal of the General Meeting for distribution of dividend or to be added
to the reserves. If the General Meeting has made a decision about profit distribution not later than immediately
prior to or after the adoption of the financial statements, the distributable profit will be added to the reserves.
20.2Distribution of profits shall take place after the adoption of the financial statements which show that the
distribution is permitted.
20.3The General Meeting may resolve to distribute one or more interim dividends and/or other interim distributions.
The Board of Directors may also resolve to distribute one or more interim dividends.
20.4Dividends shall be payable immediately after they have been declared, unless the General Meeting provides
otherwise.
20.5Distribution to shareholders may be made only to the extent of distributable equity and if an interim dividend is
paid, that requirement is met according to an interim financial statement as referred to in Article 2:105 Section 4 of
the Dutch Civil Code. The Fund shall deposit the interim financial statements at the offices of the Chamber of
Commerce (Commercial Register) within eight days after the date of the decision to make an interim distribution.
20.6In calculating the appropriation of profits, the shares held by the Fund in its own share capital shall not be taken
into account.

Bouwinvest Dutch Institutional Retail Fund N.V. | Annual Report 2016 72
Independent auditor’s report
To the shareholders of Bouwinvest Dutch Institutional Retail Fund N.V.
Report on the financial statements 2016 included in the annual reportOur OpinionWe have audited the financial statements 2016 of Bouwinvest Dutch Institutional Retail Fund N.V., based in
Amsterdam. The financial statements include the consolidated financial statements and the company financial
statements.
In our opinion:
• The consolidated financial statements included in this annual report give a true and fair view of the
financial position of Bouwinvest Dutch Institutional Retail Fund N.V. as at 31 December 2016, and of its
result and its cash flows for 2016 in accordance with International Financial Reporting Standards as
adopted by the European Union (EU-IFRS) and with Part 9 of Book 2 of the Dutch Civil Code.
• The company financial statements included in this annual report give a true and fair view of the financial
position of Bouwinvest Dutch Institutional Retail Fund N.V. as at 31 December 2016, and of its result for 2016
in accordance with Part 9 of Book 2 of the Dutch Civil Code.
The consolidated financial statements comprise:
1. The consolidated statement of financial position as at 31 December 2016.
2. The following statements for 2016: the consolidated statements of comprehensive income, changes in equity
and cash flows.
3. The notes comprising a summary of the significant accounting policies and other explanatory information.
The company financial statements comprise:
1. The company balance sheet as at 31 December 2016.
2. The company profit and loss account for 2016.
3. The notes comprising a summary of the accounting policies and other explanatory information.
Basis for our opinionWe conducted our audit in accordance with Dutch law, including the Dutch Standards on Auditing. Our
responsibilities under those standards are further described in the “Our responsibilities for the audit of the
financial statements” section of our report.
We are independent of Bouwinvest Dutch Institutional Retail Fund N.V. in accordance with the Verordening inzake
de onafhankelijkheid van accountants bij assurance-opdrachten (ViO) and other relevant independence
regulations in the Netherlands. Furthermore we have complied with the Verordening gedrags- en beroepsregels
accountants (VGBA).
We believe the audit evidence we have obtained is sufficient and appropriate to provide a basis for our opinion.
MaterialityBased on our professional judgement we determined the materiality for the financial statements as a whole at
€ 8.2 million. The materiality is based on 1% of total equity. We have also taken into account misstatements and/or
possible misstatements that in our opinion are material for the users of the financial statements for qualitative
reasons.
Materiality overview
Materiality level € 8.2 million
Basis for group materiality level 1% of total equity
Threshold for reporting misstatements € 410 thousand
We agreed with the Board of Directors that misstatements in excess of € 410 thousand, which are identified during
the audit, would be reported to them, as well as smaller misstatements that in our view must be reported on
qualitative grounds.

Bouwinvest Dutch Institutional Retail Fund N.V. | Annual Report 2016 73
Scope of the group auditBouwinvest Dutch Institutional Retail Fund N.V. is at the head of a group of entities. The financial information of
this group is included in the consolidated financial statements of Bouwinvest Dutch Institutional Retail Fund N.V.
Our group audit mainly focused on significant group entities.
We have performed all audit procedures ourselves for all group entities.
By performing the procedures mentioned above at group entities, together with additional procedures at group
level, we have been able to obtain sufficient and appropriate audit evidence about the group’s financial
information to provide an opinion about the consolidated financial statements.
Our key audit mattersKey audit matters are those matters that, in our professional judgement, were of most significance in our audit of
the financial statements. We have communicated the key audit matters to the Board of Directors.
The key audit matters are not a comprehensive reflection of all matters discussed.
Key audit matter How the key audit matter was addressed in the audit
Valuation of investment property
Investment property and investment property
under construction are important accounts
balances in the statement of financial position
and are valued at fair value. The valuations of
these investment properties are based on
external valuations.
The valuation of investment property contains
an inherent estimation uncertainty (see also
notes 4.1, 12 and 13 of the notes to the financial
statements).
We have obtained an understanding of the key controls, including the involvement of the
external valuation experts by management, surrounding the valuation process.
Using the underlying external appraisal reports we have verified the value of the
investment property. We have likewise reconciled the rental data applied with the financial
accounting records. On the basis of IAS 40, we have reviewed the Fair Value concept as
applied by the appraisers.
Likewise, we have critically reviewed the relevant factors influencing the appraisal value of
an object and discussed these with the external appraisers and the responsible client
personnel.
We have additionally engaged internal property experts to review a selection of the
property.
We have performed an additional test on the reliability of the estimation by comparing the
valuation with the revenues effectively realized upon sale.
Report on the other information included in the annual reportIn addition to the financial statements and our auditor’s report, the annual report contain other information that
consists of:
• The Report of the Board of Directors
• Other Information as required by Part 9 of Book 2 of the Dutch Civil Code
• Other additional information, among others: Corporate Social Responsibility, Corporate goverance and Risk
management.
Based on the following procedures performed, we conclude that the other information:
• Is consistent with the financial statements and does not contain material misstatements.
• Contains the information as required by Part 9 of Book 2 of the Dutch Civil Code.
We have read the other information. Based on our knowledge and understanding obtained through our audit of
the financial statements or otherwise, we have considered whether the other information contains material
misstatements.
By performing these procedures, we comply with the requirements of Part 9 of Book 2 of the Dutch Civil Code and
the Dutch Standard 720. The scope of the procedures performed is substantially less than the scope of those
performed in our audit of the financial statements.

Bouwinvest Dutch Institutional Retail Fund N.V. | Annual Report 2016 74
Management is responsible for the preparation of other information, including the Report of the Board of
Directors in accordance with Part 9 of Book 2 of the Dutch Civil Code, and the other information as required by Part
9 of Book 2 of the Dutch Civil Code.
Report on other legal and regulatory requirementsEngagementWe were engaged by the Board of Directors as auditor of Bouwinvest Dutch Institutional Retail Fund N.V. as of the
audit for year 2012 and have operated as statutory auditor ever since that date.
Description of responsibilities for the financial statementsResponsibilities of management for the financial statementsManagement is responsible for the preparation and fair presentation of the financial statements in accordance
with EU-IFRS and Part 9 of Book 2 of the Dutch Civil Code. Furthermore, management is responsible for such
internal control as management determines is necessary to enable the preparation of the financial statements
that are free from material misstatement, whether due to fraud or error.
As part of the preparation of the financial statements, management is responsible for assessing the company’s
ability to continue as a going concern. Based on the financial reporting framework mentioned, management
should prepare the financial statements using the going concern basis of accounting unless management either
intends to liquidate the company or to cease operations, or has no realistic alternative but to do so.
Management should disclose events and circumstances that may cast significant doubt on the company’s ability
to continue as a going concern in the financial statements.
Our responsibilities for the audit of the financial statementsOur objective is to plan and perform the audit assignment in a manner that allows us to obtain sufficient and
appropriate audit evidence for our opinion.
Our audit has been performed with a high, but not absolute, level of assurance, which means we may not have
detected all material errors and fraud.
Misstatements can arise from fraud or error and are considered material if, individually or in the aggregate, they
could reasonably be expected to influence the economic decisions of users taken on the basis of these financial
statements. The materiality affects the nature, timing and extent of our audit procedures and the evaluation of the
effect of identified misstatements on our opinion.
We have exercised professional judgment and have maintained professional skepticism throughout the audit, in
accordance with Dutch Standards on Auditing, ethical requirements and independence requirements. Our audit
included e.g.:
• Identifying and assessing the risks of material misstatement of the financial statements, whether due to
fraud or error, designing and performing audit procedures responsive to those risks, and obtaining audit
evidence that is sufficient and appropriate to provide a basis for our opinion. The risk of not detecting a
material misstatement resulting from fraud is higher than for one resulting from error, as fraud may involve
collusion, forgery, intentional omissions, misrepresentations, or the override of internal control.
• Obtaining an understanding of internal control relevant to the audit in order to design audit procedures
that are appropriate in the circumstances, but not for the purpose of expressing an opinion on the
effectiveness of the company’s internal control.
• Evaluating the appropriateness of accounting policies used and the reasonableness of accounting
estimates and related disclosures made by management.
• Concluding on the appropriateness of management’s use of the going concern basis of accounting, and
based on the audit evidence obtained, whether a material uncertainty exists related to events or conditions
that may cast significant doubt on the company’s ability to continue as a going concern. If we conclude that
a material uncertainty exists, we are required to draw attention in our auditor’s report to the related
disclosures in the financial statements or, if such disclosures are inadequate, to modify our opinion. Our
conclusions are based on the audit evidence obtained up to the date of our auditor’s report. However,
future events or conditions may cause the company to cease to continue as a going concern.
• Evaluating the overall presentation, structure and content of the financial statements, including the
disclosures.
• Evaluating whether the financial statements represent the underlying transactions and events in a manner
that achieves fair presentation.

Bouwinvest Dutch Institutional Retail Fund N.V. | Annual Report 2016 75
Because we are ultimately responsible for the opinion, we are also responsible for directing, supervising and
performing the group audit. In this respect we have determined the nature and extent of the audit procedures to
be carried out for group entities. Decisive were the size and/or the risk profile of the group entities or operations.
On this basis, we selected group entities for which an audit or review had to be carried out on the complete set of
financial information or specific items.
We communicate with the Board of Directors regarding, among other matters, the planned scope and timing of the
audit and significant audit findings, including any significant findings in internal control that we identify during
our audit.
From the matters communicated with the Board of Directors, we determine those matters that were of most
significance in the audit of the financial statements of the current period and are therefore the key audit matters.
We describe these matters in our auditor’s report unless law or regulation precludes public disclosure about the
matter or when, in extremely rare circumstances, not communicating the matter is in the public interest.
Amsterdam, 20 March 2017
Deloitte Accountants B.V.
Signed on the original: J. Holland
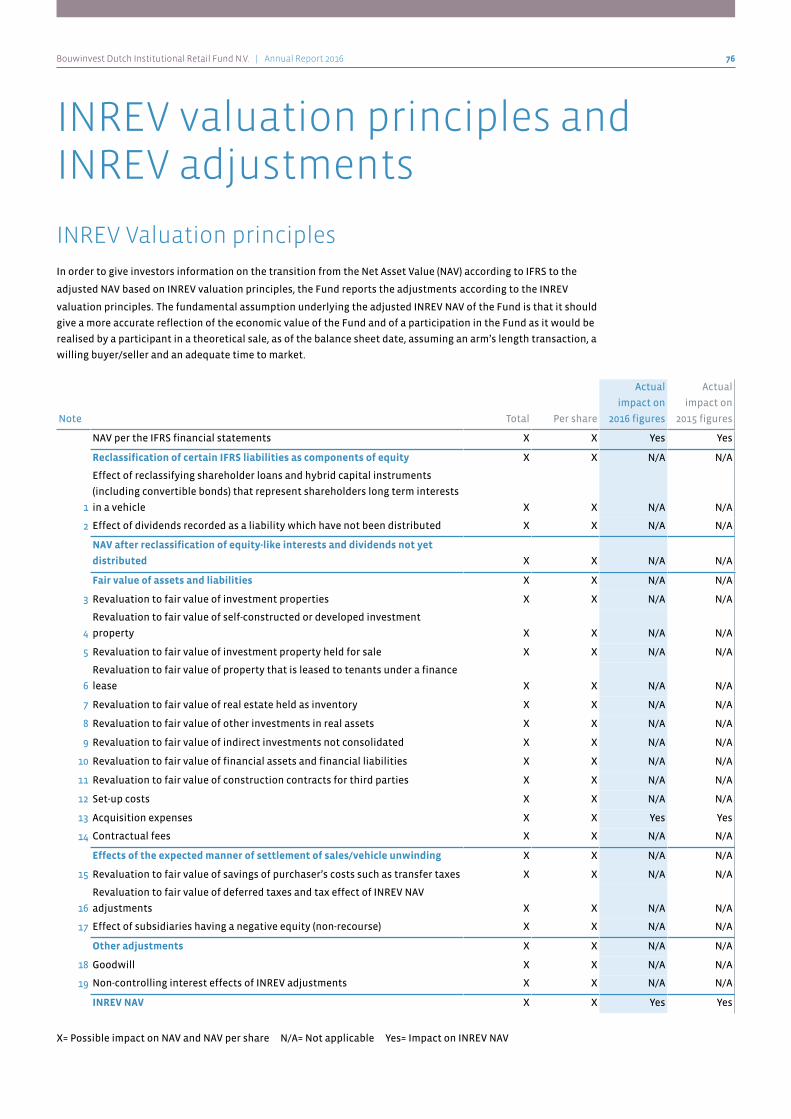
Bouwinvest Dutch Institutional Retail Fund N.V. | Annual Report 2016 76
INREV valuation principles andINREV adjustments
INREV Valuation principles
In order to give investors information on the transition from the Net Asset Value (NAV) according to IFRS to the
adjusted NAV based on INREV valuation principles, the Fund reports the adjustments according to the INREV
valuation principles. The fundamental assumption underlying the adjusted INREV NAV of the Fund is that it should
give a more accurate reflection of the economic value of the Fund and of a participation in the Fund as it would be
realised by a participant in a theoretical sale, as of the balance sheet date, assuming an arm’s length transaction, a
willing buyer/seller and an adequate time to market.
Note Total Per share
Actual
impact on
2016 figures
Actual
impact on
2015 figures
NAV per the IFRS financial statements X X Yes Yes
Reclassification of certain IFRS liabilities as components of equity X X N/A N/A
1
Effect of reclassifying shareholder loans and hybrid capital instruments
(including convertible bonds) that represent shareholders long term interests
in a vehicle X X N/A N/A
2 Effect of dividends recorded as a liability which have not been distributed X X N/A N/A
NAV after reclassification of equity-like interests and dividends not yet
distributed X X N/A N/A
Fair value of assets and liabilities X X N/A N/A
3 Revaluation to fair value of investment properties X X N/A N/A
4
Revaluation to fair value of self-constructed or developed investment
property X X N/A N/A
5 Revaluation to fair value of investment property held for sale X X N/A N/A
6
Revaluation to fair value of property that is leased to tenants under a finance
lease X X N/A N/A
7 Revaluation to fair value of real estate held as inventory X X N/A N/A
8 Revaluation to fair value of other investments in real assets X X N/A N/A
9 Revaluation to fair value of indirect investments not consolidated X X N/A N/A
10 Revaluation to fair value of financial assets and financial liabilities X X N/A N/A
11 Revaluation to fair value of construction contracts for third parties X X N/A N/A
12 Set-up costs X X N/A N/A
13 Acquisition expenses X X Yes Yes
14 Contractual fees X X N/A N/A
Effects of the expected manner of settlement of sales/vehicle unwinding X X N/A N/A
15 Revaluation to fair value of savings of purchaser’s costs such as transfer taxes X X N/A N/A
16
Revaluation to fair value of deferred taxes and tax effect of INREV NAV
adjustments X X N/A N/A
17 Effect of subsidiaries having a negative equity (non-recourse) X X N/A N/A
Other adjustments X X N/A N/A
18 Goodwill X X N/A N/A
19 Non-controlling interest effects of INREV adjustments X X N/A N/A
INREV NAV X X Yes Yes
X= Possible impact on NAV and NAV per share N/A= Not applicable Yes= Impact on INREV NAV
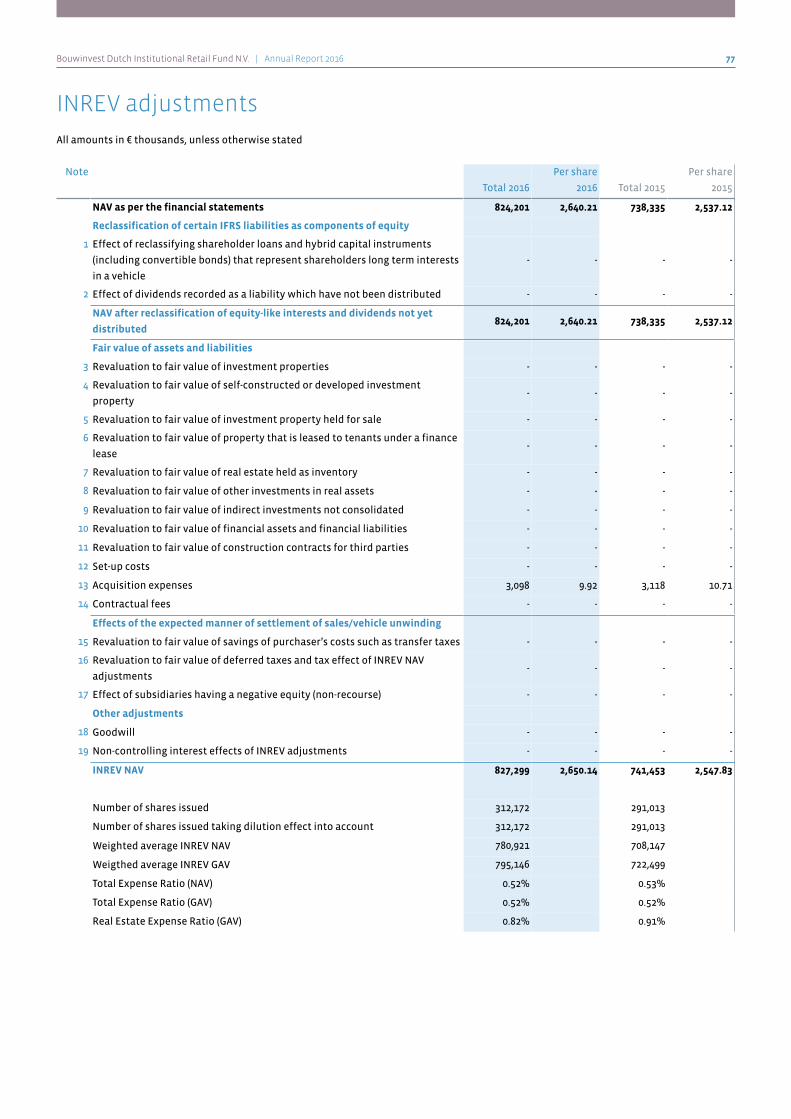
Bouwinvest Dutch Institutional Retail Fund N.V. | Annual Report 2016 77
INREV adjustments
All amounts in € thousands, unless otherwise stated
Note
Total 2016
Per share
2016 Total 2015
Per share
2015
NAV as per the financial statements 824,201 2,640.21 738,335 2,537.12
Reclassification of certain IFRS liabilities as components of equity
1 Effect of reclassifying shareholder loans and hybrid capital instruments
(including convertible bonds) that represent shareholders long term interests
in a vehicle
- - - -
2 Effect of dividends recorded as a liability which have not been distributed - - - -
NAV after reclassification of equity-like interests and dividends not yet
distributed824,201 2,640.21 738,335 2,537.12
Fair value of assets and liabilities
3 Revaluation to fair value of investment properties - - - -
4 Revaluation to fair value of self-constructed or developed investment
property- - - -
5 Revaluation to fair value of investment property held for sale - - - -
6 Revaluation to fair value of property that is leased to tenants under a finance
lease- - - -
7 Revaluation to fair value of real estate held as inventory - - - -
8 Revaluation to fair value of other investments in real assets - - - -
9 Revaluation to fair value of indirect investments not consolidated - - - -
10 Revaluation to fair value of financial assets and financial liabilities - - - -
11 Revaluation to fair value of construction contracts for third parties - - - -
12 Set-up costs - - - -
13 Acquisition expenses 3,098 9.92 3,118 10.71
14 Contractual fees - - - -
Effects of the expected manner of settlement of sales/vehicle unwinding
15 Revaluation to fair value of savings of purchaser’s costs such as transfer taxes - - - -
16 Revaluation to fair value of deferred taxes and tax effect of INREV NAV
adjustments- - - -
17 Effect of subsidiaries having a negative equity (non-recourse) - - - -
Other adjustments
18 Goodwill - - - -
19 Non-controlling interest effects of INREV adjustments - - - -
INREV NAV 827,299 2,650.14 741,453 2,547.83
Number of shares issued 312,172 291,013
Number of shares issued taking dilution effect into account 312,172 291,013
Weighted average INREV NAV 780,921 708,147
Weigthed average INREV GAV 795,146 722,499
Total Expense Ratio (NAV) 0.52% 0.53%
Total Expense Ratio (GAV) 0.52% 0.52%
Real Estate Expense Ratio (GAV) 0.82% 0.91%

Bouwinvest Dutch Institutional Retail Fund N.V. | Annual Report 2016 78
Notes to the INREV adjustments
All amounts in € thousands, unless otherwise stated
1 Effect of reclassifying shareholder loans and hybrid capitalinstruments (including convertible bonds) that representshareholders’ long term interest in a vehicleInvestors’ capital can take various forms aside from equity – examples include shareholder loans and hybrid
capital instruments such as convertible bonds. Some vehicles are structured via a combination of equity
participations and shareholder loans.
Shareholder loans and hybrid capital instruments are generally seen as part of the investors’ overall interest in the
vehicle.
Since investors in the Fund only invest via shares, no adjustment is included.
2 Effect of dividends recorded as a liability which have not beendistributedUnder certain circumstances dividends are recorded as a liability but have not yet been legally distributed. For the
determination of INREV NAV, these accrued dividends should be reversed to the NAV.
As per 31 December 2016, no dividends are recorded as a liability, no adjustment is included.
3 Revaluation to fair value of investment propertyAfter initial recognition, investment property is valued at fair value under the fair value option of IAS 40. Therefore
no adjustment had to be made as per 31 December 2016.
4 Revaluation to fair value of self-constructed or developedinvestment propertyDevelopment property is investment property under construction and valued at fair value under the fair value
option of IAS 40. Therefore no adjustment had to be made as per 31 December 2016.
5 Revaluation to fair value of investment property held for saleAssets in this category are measured under IFRS at the lower of cost or net realisable value in the financial
statements. The adjustment represents the impact on NAV of the revaluation of the property intended for sale,
measured at cost, to fair value.
As per 31 December 2016, no properties intended for sale had been presented that are not included in the fair value
of investment property.
6 Revaluation to fair value of property that is leased to tenantsunder a finance leaseProperty that is leased to tenants under a finance lease is initially measured on a net investment basis and
subsequently re-measured based on an amortisation pattern reflecting a constant rate of return. The adjustment
represents the impact on NAV of the revaluation of the finance lease receivable to fair value.
As per 31 December 2016, no adjustment had been made since no property is held that is leased to tenants under a
finance lease.
Bouwinvest Dutch Institutional Retail Fund N.V. | Annual Report 2016 79
7 Revaluation to fair value of real estate held as inventoryProperties intended for sale and accounted for under IAS 2 (Inventory) are measured at the lower of cost or net
realisable value in the financial statements. This adjustment represents the impact on the NAV of the revaluation
of such properties to net realisable value (fair value less disposal costs). This adjustment should be included under
the caption ‘revaluation to fair value of real estate held as inventory’.
As per 31 December 2016, no adjustment had been made since no property is accounted for under IAS 2 (Inventory).
8 Revaluation to fair value of other investments in real assetsUnder IAS16 other investments in real assets are normally accounted for at cost. The adjustment represents the
impact on NAV of the revaluation of other investments in real assets to fair value in accordance with the fair value
assumptions under IFRS 13.
As per 31 December 2016, no adjustment had been made since the Fund has no investments in real assets.
9 Revaluation to fair value of indirect investments notconsolidatedIndirect investments in real estate, such as investments in associations and joint ventures, have different
accounting treatments and carrying values under IFRS. Such investments can be valued at cost, fair value or NAV.
The adjustment represents the impact on NAV of the revaluation of indirect investments to fair value if not yet
accounted for at fair value.
As per 31 December 2016, no adjustment had been made since the Fund has no indirect investments in real estate.
10 Revaluation to fair value of financial assets and liabilities(including revaluation to fair value of debt obligations)Financial assets and liabilities such as debt obligations are generally measured at amortised cost, taking into
account any impairment when applicable. The adjustment represents the impact on NAV of the revaluation of
financial assets and financial liabilities to fair value as determined in accordance with IFRS.
As per 31 December 2016, no adjustment had been made since the financial assets and liabilities accounted for in
the Statement of financial position are not materially different with the fair value of the financial assets and
liabilities in accordance with the fair value principles of IFRS 13.
11 Revaluation to fair value of construction contracts for thirdpartiesUnder IAS11, construction contracts for third parties are normally accounted for based on the stage of completion.
The adjustment represents the impact on NAV of the revaluation of construction contracts for third parties to fair
value in accordance with the fair value principles of IFRS 13.
As per 31 December 2016, no adjustment had been made since the Fund has no construction contracts of third
parties.

Bouwinvest Dutch Institutional Retail Fund N.V. | Annual Report 2016 80
Adjustments to reflect the spreading of one-off costsAs described in further detail below, set-up costs and acquisition expenses should be capitalised and
amortised. The rationale for these adjustments is to spread these costs over a defined period of time to
smooth the effect of the write-off of costs on the vehicle’s performance. Furthermore, it is a simple mechanism
to spread costs between different investor groups entering or leaving the vehicle’s equity at different times.
In practice, there are many other ways in which vehicles address such issues for pricing, valuation, or other
purposes. Since the INREV NAV is primarily intended to facilitate comparability between different vehicles, the
INREV approach is a simple but fixed methodology. Please note that these capitalised costs are subject to an
impairment test each time the NAV is calculated and therefore should always be recoverable over time.
As the adjustments with respect to set-up costs are separately disclosed in the calculation of a vehicle’s INREV
NAV, investors can choose how these are taken into account when valuing their holding.
12 Set-up costsSet-up costs (i.e. establishment expenses) are charged immediately to income after the initial closing date. This
adjustment represents the impact on NAV of the capitalisation and amortisation of set-up costs over the first five
years of the terms of the Fund. When capitalising and amortising set-up costs, a possible impairment test should
be taken into account every time the adjusted NAV is calculated when market circumstances change and it is not
to be expected that the capitalised set-up costs can be recovered.
As per 31 December 2016, the set-up costs of the Fund have been amortised, so no adjustment had been made per
31 December 2016.
13 Acquisition expensesUnder the Fair Value model, acquisition expenses of investments under the fair value assumptions according to
IFRS may be partly charged to income or equity as fair value changes at the first subsequent measurement date
after acquisition. This is when the fair value at the moment of measurement is less than the total amount of the
purchase value of the assets and the acquisition expenses.
This adjustment represents the impact on NAV of the capitalisation and amortisation of acquisition expenses over
the period from acquisition of the specific asset to five years after initial closing.
When an asset is sold during the amortisation period, the balance of capitalised acquisition expenses is charged to
the income statement in the period of sale.
When capitalising and amortising acquisition costs, a possible impairment test should be taken into account every
time the adjusted NAV is calculated (when market circumstances change) and it is not expected that the
capitalised acquisition costs can be recovered with the sale of units of the Fund.
Most of the acquisitions are realised via a turn-key agreement with a development company. Since these
acquisitions can be purchased free of transfer-tax normally the acquisition price is higher than if transfer-taxes
should be paid separately. The valuation methodology is the net valuation after deduction of acquisition cost for a
potential buyer. At initial recognition and during the instalments a part in the revaluation result will include the
effect of the difference of the purchase price and the net valuation after deduction of acquisition cost for a
potential buyer. This difference is taken into account in the INREV NAV as a separate item in the INREV adjustment
in respect to Acquisition expenses.
Capitalised acquisition costs as per 31 December 2015 4,074
Acquisition costs 2016 682
Amortisation acquisition costs in 2016 (1,658)
Adjustment NAV (excluding tax) 3,098
Bouwinvest Dutch Institutional Retail Fund N.V. | Annual Report 2016 81
14 Contractual feesA liability represents a present obligation. A fee payable at the end of the lifetime of the Fund or at any other
moment during the lifetime of the Fund may not meet the criteria for recognition of a provision or liability in
accordance with IFRS at the moment the accounts are prepared.
As per the balance sheet date, all contractual fees and contingent liabilities are recognised in accordance with
IFRS. The Fund did not enter into any other contractual fees or contingent liabilities that are not presented in the
accounts as per the balance sheet date.
15 Revaluation to fair value of savings of purchaser’s costs such astransfer taxesThis adjustment represents the positive impact on NAV of the possible reduction of transfer taxes and purchaser’s
costs for the seller based on the expected sale via the sale of shares. Transfer taxes and purchaser’s costs which
would be incurred in an asset sale are generally deducted when determining the fair value of the properties. The
effect of a possible sale of shares in a property vehicle might be taken into account when determining the
deduction of transfer taxes and purchaser’s costs (if this lowers the actual transfer tax and/or purchaser’s costs to
be paid upon sale by the seller).
The Fund has no investment property structured in special vehicles. As per 31 December 2016, no adjustment had
been made due to the fact that it is impossible to sell investment property via a share deal. Therefore, there is no
possibility of an additional reduction of the transfer tax or purchaser’s costs that might lead to a higher sales
price.
16 Revaluation to fair value of deferred taxes and tax effect ofINREV NAV adjustmentsUnder IFRS, deferred tax (assets and liabilities) is measured at the nominal statutory tax rate. How the Fund
expects to settle deferred tax is not taken into consideration. This adjustment represents the impact on NAV of the
deferred tax for assets and liabilities or financial instruments based on the expected settlement. This should be
taken into consideration when tax structures have been applied to reduce tax on capital gains or allowances.
Where goodwill is included in the Statement of financial position as a result of a deferred tax liability that is
eliminated as a result of the above-mentioned adjustment, the goodwill related to this deferred tax will be
excluded from NAV.
The Fund has the status of a fiscal investment institution (0% corporate tax rate). Therefore, no adjustment has
been made, as the Fund is exempt from corporate tax payments.
17 Effect of subsidiaries having a negative equity (non-recourse)The adjustment represents the positive impact on the NAV of the partial or full reversal of the negative equity of
the specific subsidiary. If the vehicle has granted shareholder loans to the subsidiary, these should be taken into
account.
As per 31 December 2016, no adjustment had been made since the Fund has no subsidiaries.
18 GoodwillAt acquisition of an entity which is determined to be a business combination, goodwill may arise as a result of a
purchase price allocation exercise. Often a major component of such goodwill in property vehicles reflects the
difference between the full recognition of deferred tax, purchaser’s costs or similar items in the IFRS accounts
(which does not generally take account of the likely or intended method of subsequent exit), and the economic
value attributed to such items in the actual purchase price. Except where such components of goodwill have
already been written off in the NAV as determined under IFRS, they should be written off in the INREV NAV.
As per 31 December 2016, no adjustment had been made since the Fund has no goodwill recognised in the
Statement of financial position.

Bouwinvest Dutch Institutional Retail Fund N.V. | Annual Report 2016 82
19 Non-controlling interest effects of INREV adjustmentsThis adjustment represents the impact on the NAV of the recognition of non-controlling interests on all of the
above adjustments.
As per 31 December 2016, no adjustment had been made since the Fund holds no minority interests.

Bouwinvest Dutch Institutional Retail Fund N.V. | Annual Report 2016 83
Independent auditor’s report
To the shareholders of Bouwinvest Dutch Institutional Retail Fund N.V.
Report on the INREV adjustments Our OpinionWe have audited the accompanying INREV adjustments 2016 of Bouwinvest Dutch Institutional Retail Fund N.V.,
based in Amsterdam.
In our opinion the INREV adjustments are prepared, in all material respects, in accordance with the accounting
policies selected and disclosed by the fund, i.e. INREV valuation principles, as set out on page 76 up to and
including page 82.
Basis for our opinionWe conducted our audit in accordance with Dutch law, including the Dutch Standards on Auditing. Our
responsibilities under those standards are further described in the “Our responsibilities for the audit of the INREV
adjustments” section of our report.
We are independent of Bouwinvest Dutch Institutional Retail Fund N.V. in accordance with the Verordening inzake
de onafhankelijkheid van accountants bij assurance-opdrachten (ViO) and other relevant independence
regulations in the Netherlands. Furthermore we have complied with the Verordening gedrags- en beroepsregels
accountants (VGBA).
We believe the audit evidence we have obtained is sufficient and appropriate to provide a basis for our opinion.
Description of responsibilities for the INREV adjustmentsResponsibilities of management for the INREV adjustmentsManagement is responsible for the preparation of the INREV adjustments in accordance with the accounting
policies selected and disclosed by the fund (INREV valuation principles) as set out on page 76 up to and including
page 82.
Furthermore, management is responsible for such internal control as management determines is necessary to
enable the preparation of the INREV adjustments that are free from material misstatement, whether due to fraud
or error.
Our responsibilities for the audit of the INREV adjustmentsOur objective is to plan and perform the audit assignment in a manner that allows us to obtain sufficient and
appropriate audit evidence for our opinion.
Our audit has been performed with a high, but not absolute, level of assurance, which means we may not have
detected all material errors and fraud.
Misstatements can arise from fraud or error and are considered material if, individually or in the aggregate, they
could reasonably be expected to influence the economic decisions of users taken on the basis of these INREV
adjustments. The materiality affects the nature, timing and extent of our audit procedures and the evaluation of
the effect of identified misstatements on our opinion.
We have exercised professional judgment and have maintained professional skepticism throughout the audit, in
accordance with Dutch Standards on Auditing, ethical requirements and independence requirements. Our audit
included e.g.:
• Identifying and assessing the risks of material misstatement of the INREV adjustments, whether due to
fraud or error, designing and performing audit procedures responsive to those risks, and obtaining audit
evidence that is sufficient and appropriate to provide a basis for our opinion. The risk of not detecting a
material misstatement resulting from fraud is higher than for one resulting from error, as fraud may involve
collusion, forgery, intentional omissions, misrepresentations, or the override of internal control.
• Obtaining an understanding of internal control relevant to the audit in order to design audit procedures
that are appropriate in the circumstances, but not for the purpose of expressing an opinion on the
effectiveness of the company’s internal control.
• Evaluating the appropriateness of accounting policies used and the reasonableness of accounting
estimates and related disclosures made by management.

Bouwinvest Dutch Institutional Retail Fund N.V. | Annual Report 2016 84
• Evaluating the overall presentation, structure and content of the INREV adjustments, including the
disclosures.
Amsterdam, 20 March 2017
Deloitte Accountants B.V.
Signed on the original: J. Holland
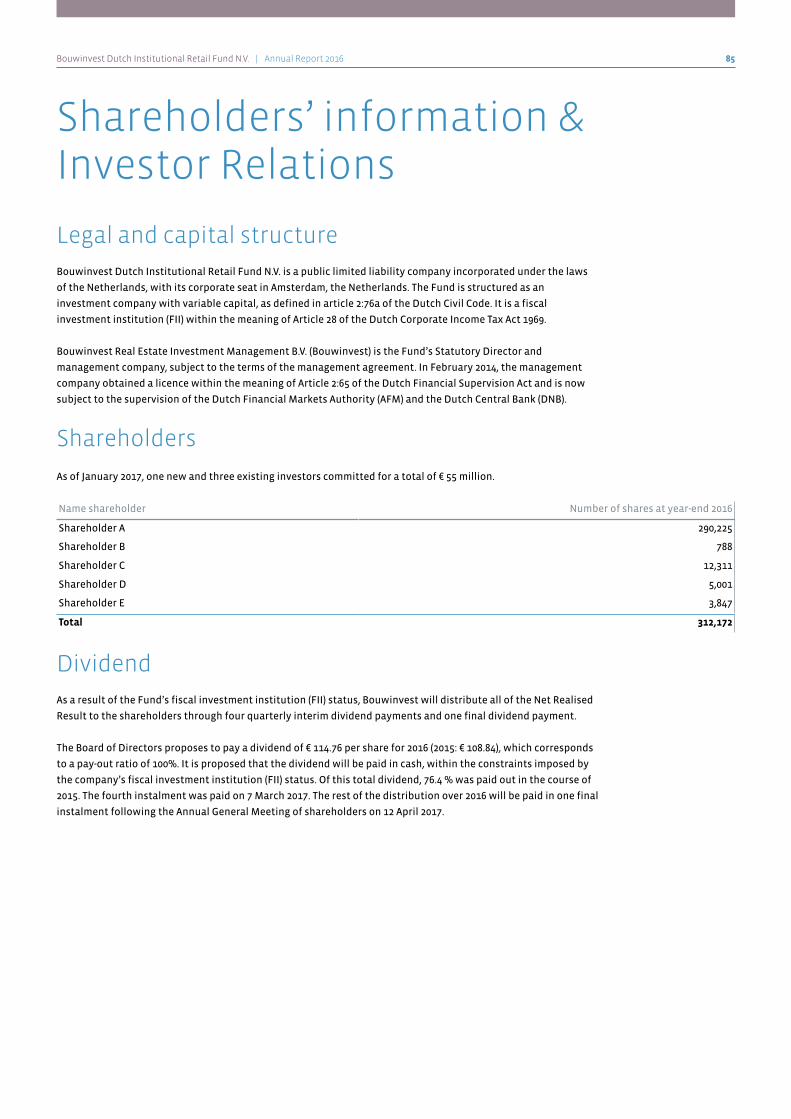
Bouwinvest Dutch Institutional Retail Fund N.V. | Annual Report 2016 85
Shareholders’ information &Investor Relations
Legal and capital structure
Bouwinvest Dutch Institutional Retail Fund N.V. is a public limited liability company incorporated under the laws
of the Netherlands, with its corporate seat in Amsterdam, the Netherlands. The Fund is structured as an
investment company with variable capital, as defined in article 2:76a of the Dutch Civil Code. It is a fiscal
investment institution (FII) within the meaning of Article 28 of the Dutch Corporate Income Tax Act 1969.
Bouwinvest Real Estate Investment Management B.V. (Bouwinvest) is the Fund’s Statutory Director and
management company, subject to the terms of the management agreement. In February 2014, the management
company obtained a licence within the meaning of Article 2:65 of the Dutch Financial Supervision Act and is now
subject to the supervision of the Dutch Financial Markets Authority (AFM) and the Dutch Central Bank (DNB).
Shareholders
As of January 2017, one new and three existing investors committed for a total of € 55 million.
Name shareholder Number of shares at year-end 2016
Shareholder A 290,225
Shareholder B 788
Shareholder C 12,311
Shareholder D 5,001
Shareholder E 3,847
Total 312,172
Dividend
As a result of the Fund’s fiscal investment institution (FII) status, Bouwinvest will distribute all of the Net Realised
Result to the shareholders through four quarterly interim dividend payments and one final dividend payment.
The Board of Directors proposes to pay a dividend of € 114.76 per share for 2016 (2015: € 108.84), which corresponds
to a pay-out ratio of 100%. It is proposed that the dividend will be paid in cash, within the constraints imposed by
the company’s fiscal investment institution (FII) status. Of this total dividend, 76.4 % was paid out in the course of
2015. The fourth instalment was paid on 7 March 2017. The rest of the distribution over 2016 will be paid in one final
instalment following the Annual General Meeting of shareholders on 12 April 2017.

Bouwinvest Dutch Institutional Retail Fund N.V. | Annual Report 2016 86
Shareholders' calendar
31 May 2016 Payment interim dividend first quarter 2016, € 27.64 per share
30 August 2016 Payment interim dividend second quarter 2016, € 29.78 per share
8 December 2016 Payment interim dividend third quarter 2016, € 30.36 per share
7 March 2017 Payment interim dividend fourth quarter 2016, € 21.45 per share
12 April 2017 Annual General Meeting of Shareholders
25 April 2017 Payment of final dividend 2016, € 5.36 per share
6 June 2017 Payment interim dividend first quarter 2017
5 September 2017 Payment interim dividend second quarter 2017
5 December 2017 Payment interim dividend third quarter 2017
6 December 2017 General Meeting of Shareholders
6 March 2018 Payment interim dividend fourth quarter 2017
Investor relations
Bouwinvest aims for the highest level of transparency in its communications on the financial situation, strategy,
plans and other information relevant to its existing and potential investors and other stakeholders. All the
information Bouwinvest publishes via various channels is also available on the Bouwinvest Investor Web.
In addition to the regular information outlined above, Bouwinvest organised a number of investor relations
activities in 2016, including road shows, property tours and one-on-one meetings with (potential) investors, plus
we attended several high-profile real estate conferences to present the management organisation, its strategy and
its vision on real estate to (potential) investors.
For further information on Bouwinvest’s investor relations activities, please visit our corporate website at
Bouwinvest.nl. You can also contact our Investor Relations department at [email protected] or Karen Huizer,
Investor Relations manager: +31 (0)20 677 1598.
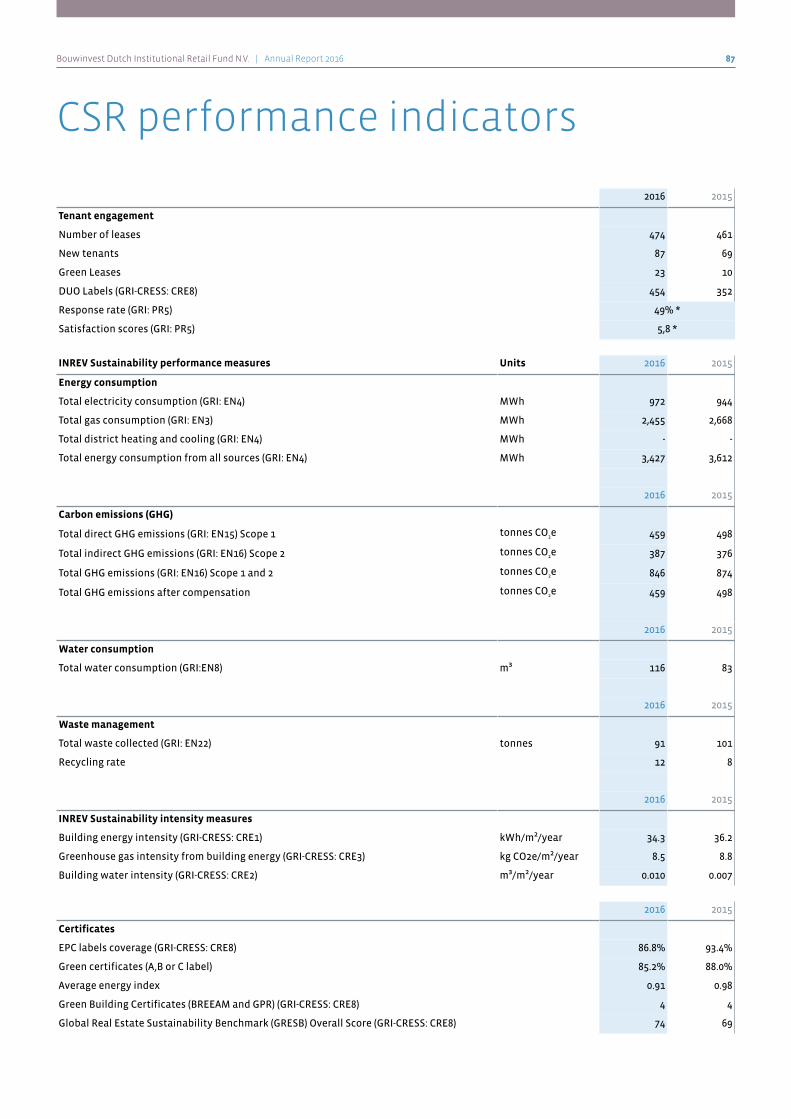
Bouwinvest Dutch Institutional Retail Fund N.V. | Annual Report 2016 87
CSR performance indicators
2016 2015
Tenant engagement
Number of leases 474 461
New tenants 87 69
Green Leases 23 10
DUO Labels (GRI-CRESS: CRE8) 454 352
Response rate (GRI: PR5) 49% *
Satisfaction scores (GRI: PR5) 5,8 *
INREV Sustainability performance measures Units 2016 2015
Energy consumption
Total electricity consumption (GRI: EN4) MWh 972 944
Total gas consumption (GRI: EN3) MWh 2,455 2,668
Total district heating and cooling (GRI: EN4) MWh - -
Total energy consumption from all sources (GRI: EN4) MWh 3,427 3,612
2016 2015
Carbon emissions (GHG)
Total direct GHG emissions (GRI: EN15) Scope 1 tonnes CO2e 459 498
Total indirect GHG emissions (GRI: EN16) Scope 2 tonnes CO2e 387 376
Total GHG emissions (GRI: EN16) Scope 1 and 2 tonnes CO2e 846 874
Total GHG emissions after compensation tonnes CO2e 459 498
2016 2015
Water consumption
Total water consumption (GRI:EN8) m³ 116 83
2016 2015
Waste management
Total waste collected (GRI: EN22) tonnes 91 101
Recycling rate 12 8
2016 2015
INREV Sustainability intensity measures
Building energy intensity (GRI-CRESS: CRE1) kWh/m²/year 34.3 36.2
Greenhouse gas intensity from building energy (GRI-CRESS: CRE3) kg CO2e/m²/year 8.5 8.8
Building water intensity (GRI-CRESS: CRE2) m³/m²/year 0.010 0.007
2016 2015
Certificates
EPC labels coverage (GRI-CRESS: CRE8) 86.8% 93.4%
Green certificates (A,B or C label) 85.2% 88.0%
Average energy index 0.91 0.98
Green Building Certificates (BREEAM and GPR) (GRI-CRESS: CRE8) 4 4
Global Real Estate Sustainability Benchmark (GRESB) Overall Score (GRI-CRESS: CRE8) 74 69

Bouwinvest Dutch Institutional Retail Fund N.V. | Annual Report 2016 88
Reporting of performance indicatorsBouwinvest reports environmental data of those assets where there is management control possible (operational
control approach). Data is provided for those assets where we have authority to introduce and implement
operating policies and are responsible for purchasing energy and water and handling waste. Our management
control differs greatly by asset type (e.g. residential and office); these differences affect the level of influence we
have over the sustainability performance of our assets.
Like for like data and changes represents assets which have been fully owned and operational for the full 24 month
period in our investment portfolio. It provides insight in the performance of an indicator over time at a constant
portfolio scope. The reduction in GHG emissions can be explained by the compensation of carbon emissions
through purchase of carbon certificates. This follows the commitment of Bouwinvest to reduce the impact its
operations has on climate change.
Energy, Emission and Water intensities are reported using “shared services” as the numerator and lettable floor
area (LFA) as the denominator. “Shared services” refer to landlord-obtained consumption for common parts and
any services provided to tenant areas that have not been sub-metered.

Bouwinvest Dutch Institutional Retail Fund N.V. | Annual Report 2016 89
Contact information
BouwinvestLa Guardiaweg 4
1043 DG, Amsterdam
The Netherlands
External auditorDeloitte Accountants B.V.
Gustav Mahlerlaan 2970
1081 LA Amsterdam
The Netherlands
DepositaryIntertrust Depositary Services B.V.
Prins Bernhardplein 200
1097 JB Amsterdam
The Netherlands
Tax adviserKPMG Meijburg & Co
Laan van Langerhuize 9
1186 DS Amstelveen
The Netherlands
Legal adviser and Fund notaryDLA Piper Nederland B.V.
Amstelveenseweg 638
1081 JJ Amsterdam
The Netherlands
Real estate notaryDe Brauw Blackstone Westbroek
Claude Debussylaan 80
1082 MD Amsterdam
The Netherlands
ValuersKroesePaternotte
Koningin Wilhelminaplein 2-4
1062 HK Amsterdam
The Netherlands
Cushman & Wakefield
Strawinskylaan 3125
1077 ZX Amsterdam
The Netherlands

Bouwinvest Dutch Institutional Retail Fund N.V. | Annual Report 2016 90
Glossary
Assets under managementAssets under management is defined as the net asset value of the funds, as per the chosen valuation principles of
the funds, that Bouwinvest manages as investment manager.
Capital growthCapital growth as a percentage is equal to the net result (INREV) minus the distributable result, divided by the
INREV NAV at the beginning of the period, plus any capital calls (time-weighted) and less any distributed
dividends/capital distributions (time-weighted).
Direct property returnDirect property return as a percentage is equal to the net rental income of investment properties divided by the
value of the investment properties including purchaser’s transaction costs, on a monthly basis (IPD methodology).
Distributable resultDistributable result is the total rental income and other income net of all expenses, costs, fees (including
management fee), financing costs and taxes borne by the Fund available for distribution to the shareholders.
Estimated rental valueThe estimated rent at which space within a property could reasonably be expected to be let given current market
conditions.
Financial occupancy rateThis is the average occupancy rate of the portfolio over the year calculated on the basis of rental revenue
according to contracts as at the reporting date, as a percentage of the theoretical rent.
Gross Asset Value (GAV)The total property portfolio plus the value of any further assets at market value as per the chosen valuation
principles.
Gross initial yield (passing)Passing rent divided by the gross capital value of the investment property including purchaser's transaction costs
as per end of period.
Gross initial yield (market)Theoretical rent (market) divided by the gross capital value of the investment property including purchaser's
transaction costs as per end of period.
Gross rental incomeThe gross rental income is the total contractual rental income over the reporting period from let properties
reported under IFRS, including the net effects of straight-lining for lease incentives, including rent free periods.
Income returnIncome return as a percentage is equal to the distributable result, divided by the INREV NAV at the beginning of the
period, plus any capital calls (time-weighted) and less any distributed dividends/capital distributions
(time-weighted).
Indirect property returnIndirect property return as a percentage is equal the increase/decrease in the value of a property or group of
properties net of capital expenditure divided by the value of the investment properties including purchaser’s
transaction costs, on a monthly basis (IPD methodology).
INREV NAVINREV NAV is based on the fair value of the underlying assets and liabilities, as at the balance sheet date, and
adjusted for the spreading of costs that will benefit different generations of investors.

Bouwinvest Dutch Institutional Retail Fund N.V. | Annual Report 2016 91
Investment propertyProperty that is fully operational on the reporting date
Investment property under constructionProperty that is being constructed or developed for future use as investment property.
Lease incentiveAny consideration or expense borne by the property company, in order to secure a lease.
Like-for-like gross rental incomeLike-for-like gross rental income compares the increase/decrease of the gross rental income of the portfolio that
has been consistently in operation, during two full preceding periods that are described.
Net asset value (NAV)The net asset value is equal to the shareholders’ equity of the Fund.
Net initial yieldNet rental income divided by the gross capital value of the investment property including purchaser's transaction
costs as per end of period.
Net rental incomeNet rental income is gross rental income for the period less ground rents payable, service charge expenses and
other non-recoverable property operating expenses such as insurance, real estate taxes, marketing and other
vacant property costs.
Passing rentThe annualised cash rental income being received as at a certain date, excluding the net effects of straight-lining
for lease incentives. For the avoidance of doubt, where no rent is currently being paid due to operation of a
rent-free period, the passing rent will be shown as zero.
Payout ratio of distributable earningsThis is the distributed dividend in the reporting period divided by the distributable result in the reporting period.
Real Estate Expense Ratio (REER)Annual vehicle-level and property-specific costs over a 12 month period as a proportion of average vehicle assets
(average GAV and average NAV).
Theoretical rentPassing rent over the reporting period plus estimated rental value of vacant units.
Total Expense Ratio (TER)The total expense ratio reflects the total fund expenses of the current reporting period as a percentage of the
weighted average Net Asset Value (NAV) over the period. The TER is backwardlooking and includes the
management fee, administrative expenses and valuation fees.
Total fund return (INREV)Total fund return (INREV) as a percentage is equal to the net result (INREV) divided by the INREV NAV at the
beginning of the period, plus any capital calls (time-weighted) and less any distributed dividends/capital
distributions (time-weighted).
TransactionsTransactions are contractual obligations for the purchase of investment properties, where such property is not
generating income for the benefit of the Fund as of the reporting date.
WALT (average remaining lease time)Weighted average duration of lease contracts based on rent to the shorter of the first tenant break or lease expiry.
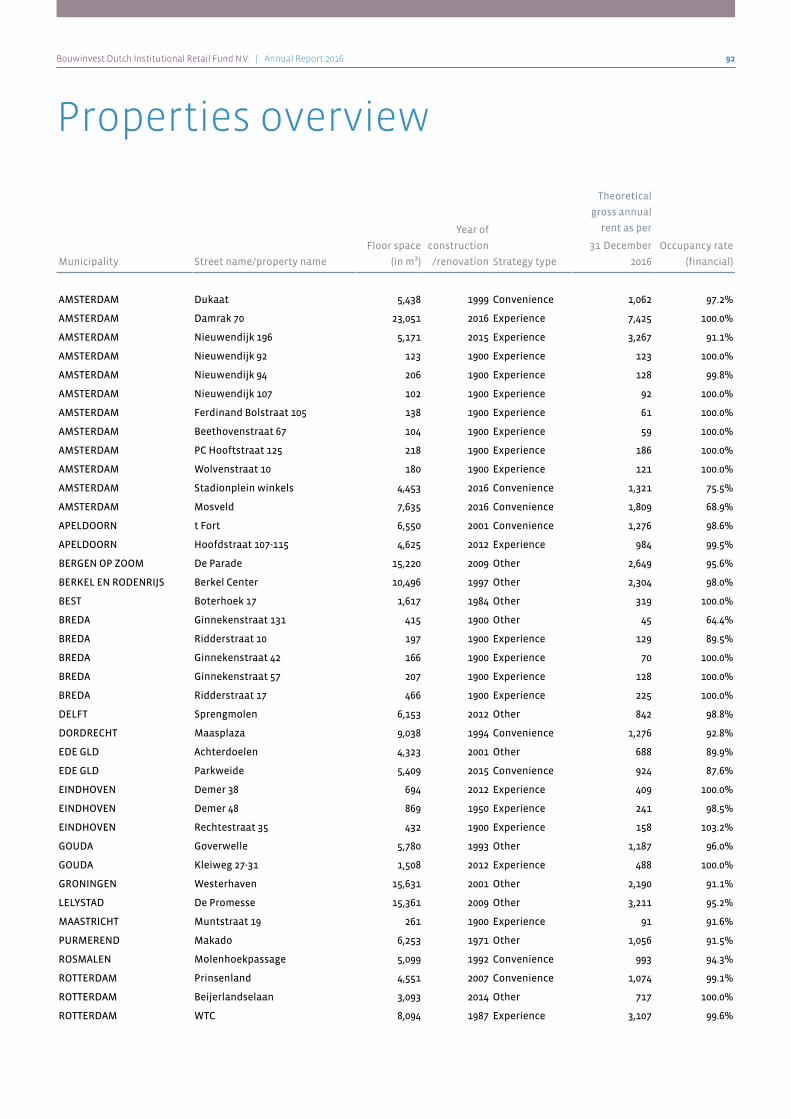
Bouwinvest Dutch Institutional Retail Fund N.V. | Annual Report 2016 92
Properties overview
Municipality Street name/property name
Floor space
(in m²)
Year of
construction
/renovation Strategy type
Theoretical
gross annual
rent as per
31 December
2016
Occupancy rate
(financial)
AMSTERDAM Dukaat 5,438 1999 Convenience 1,062 97.2%
AMSTERDAM Damrak 70 23,051 2016 Experience 7,425 100.0%
AMSTERDAM Nieuwendijk 196 5,171 2015 Experience 3,267 91.1%
AMSTERDAM Nieuwendijk 92 123 1900 Experience 123 100.0%
AMSTERDAM Nieuwendijk 94 206 1900 Experience 128 99.8%
AMSTERDAM Nieuwendijk 107 102 1900 Experience 92 100.0%
AMSTERDAM Ferdinand Bolstraat 105 138 1900 Experience 61 100.0%
AMSTERDAM Beethovenstraat 67 104 1900 Experience 59 100.0%
AMSTERDAM PC Hooftstraat 125 218 1900 Experience 186 100.0%
AMSTERDAM Wolvenstraat 10 180 1900 Experience 121 100.0%
AMSTERDAM Stadionplein winkels 4,453 2016 Convenience 1,321 75.5%
AMSTERDAM Mosveld 7,635 2016 Convenience 1,809 68.9%
APELDOORN t Fort 6,550 2001 Convenience 1,276 98.6%
APELDOORN Hoofdstraat 107-115 4,625 2012 Experience 984 99.5%
BERGEN OP ZOOM De Parade 15,220 2009 Other 2,649 95.6%
BERKEL EN RODENRIJS Berkel Center 10,496 1997 Other 2,304 98.0%
BEST Boterhoek 17 1,617 1984 Other 319 100.0%
BREDA Ginnekenstraat 131 415 1900 Other 45 64.4%
BREDA Ridderstraat 10 197 1900 Experience 129 89.5%
BREDA Ginnekenstraat 42 166 1900 Experience 70 100.0%
BREDA Ginnekenstraat 57 207 1900 Experience 128 100.0%
BREDA Ridderstraat 17 466 1900 Experience 225 100.0%
DELFT Sprengmolen 6,153 2012 Other 842 98.8%
DORDRECHT Maasplaza 9,038 1994 Convenience 1,276 92.8%
EDE GLD Achterdoelen 4,323 2001 Other 688 89.9%
EDE GLD Parkweide 5,409 2015 Convenience 924 87.6%
EINDHOVEN Demer 38 694 2012 Experience 409 100.0%
EINDHOVEN Demer 48 869 1950 Experience 241 98.5%
EINDHOVEN Rechtestraat 35 432 1900 Experience 158 103.2%
GOUDA Goverwelle 5,780 1993 Other 1,187 96.0%
GOUDA Kleiweg 27-31 1,508 2012 Experience 488 100.0%
GRONINGEN Westerhaven 15,631 2001 Other 2,190 91.1%
LELYSTAD De Promesse 15,361 2009 Other 3,211 95.2%
MAASTRICHT Muntstraat 19 261 1900 Experience 91 91.6%
PURMEREND Makado 6,253 1971 Other 1,056 91.5%
ROSMALEN Molenhoekpassage 5,099 1992 Convenience 993 94.3%
ROTTERDAM Prinsenland 4,551 2007 Convenience 1,074 99.1%
ROTTERDAM Beijerlandselaan 3,093 2014 Other 717 100.0%
ROTTERDAM WTC 8,094 1987 Experience 3,107 99.6%

Bouwinvest Dutch Institutional Retail Fund N.V. | Annual Report 2016 93
's-HERTOGENBOSCH Vughterstraat 2 57 1900 Other 48 100.0%
's-HERTOGENBOSCH Vughterstraat 4 58 1900 Other 36 100.0%
THE HAGUE Spui - Grote Marktstraat 3,256 1997 Experience 904 95.6%
THE HAGUE Spuistraat 70 131 1900 Experience 70 85.1%
TILBURG Heyhoef 10,800 1997 Convenience 2,877 99.8%
UTRECHT Steenweg 43 275 1900 Experience 120 92.3%
WEERT De Munt 16,209 1996 Other 3,277 96.6%
ZWOLLE Het Eiland 6,931 2001 Other 681 78.2%
Total 217,044 50,448 94.7%