Embed Size (px)
Citation preview
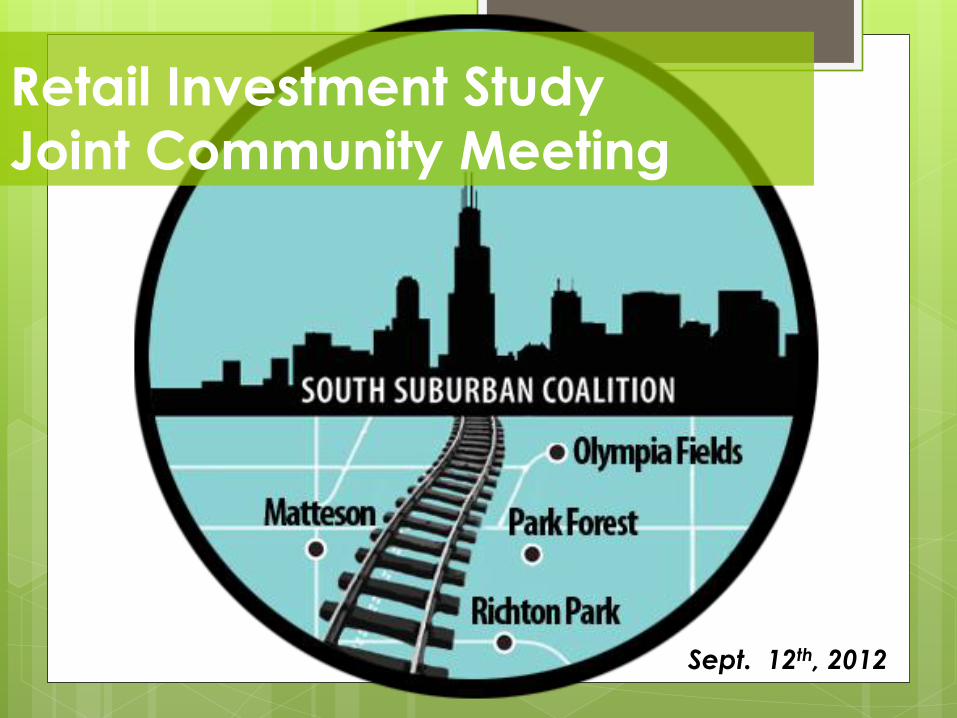
Retail Investment Study
Joint Community Meeting
Sept. 12th, 2012
Thank You!
Thank You!
Thank You!
Congressman Jesse Jackson Jr. and his staff for securing funding and participating in this important research and planning effort!
The many residents, business and property owners, developers, and Boards and Commissions that volunteered their time in serving on the project Steering Committee
Resident’s who participated in surveys and focus groups
Village Staff’s of Olympia Fields, Matteson, Park Forest and Richton Park

Key Consultant Roles and
Responsibilities Mike Hoffman, AICP/RLA – Project
Manager, Principal Planner Planning and Design Issues
Bridget Lane
Market Analysis and Strategy
Michael O. Brown
Business Opportunity Profiles Property Owner Perspective
Janet Smith Retail Investment Analysis
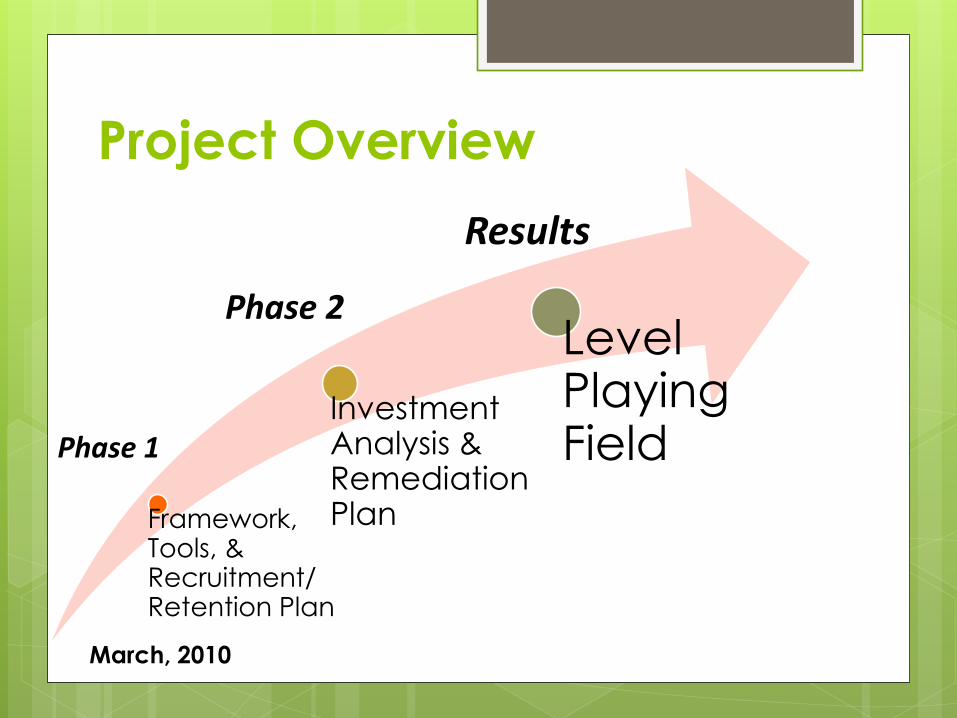
Project Overview
Framework, Tools, & Recruitment/ Retention Plan
Investment Analysis & Remediation Plan
Level Playing Field Phase 1
Phase 2
Results
March, 2010

What do people want? The
Survey Says……
All dining options except fast food! Casual = Spend more 86%
White tablecloth = 76%
Counter = 63%
Home furnishings = 74%
Shoes = 73%
Health food =63%
Hardware =58%
Greeting cards = 57%
Craft supplies = 53%
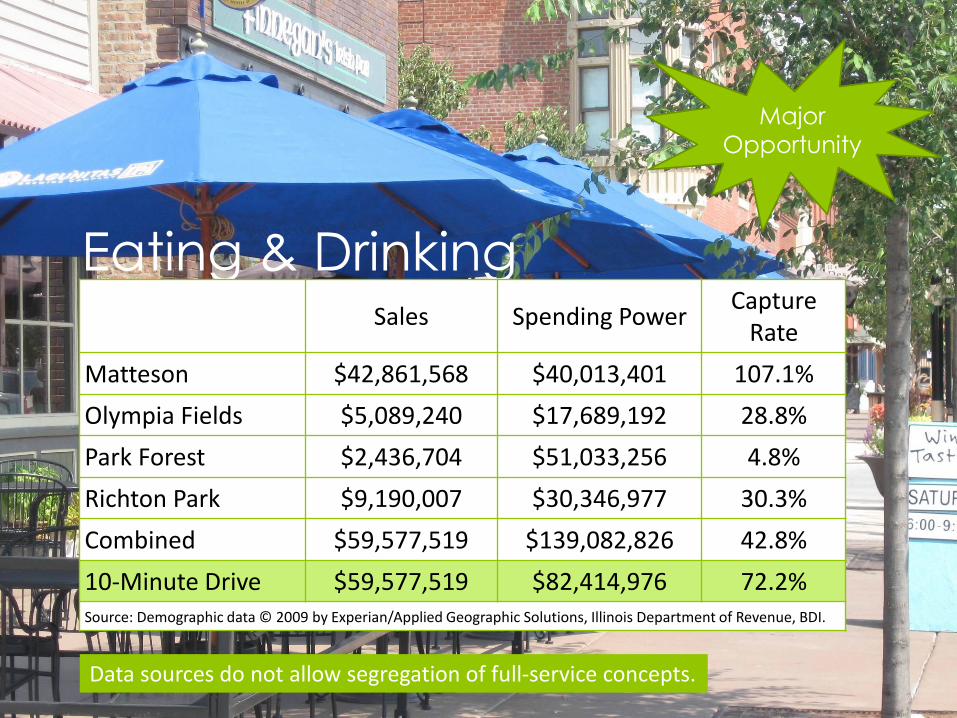
Eating & Drinking Sales Spending Power
Capture Rate
Matteson $42,861,568 $40,013,401 107.1%
Olympia Fields $5,089,240 $17,689,192 28.8%
Park Forest $2,436,704 $51,033,256 4.8%
Richton Park $9,190,007 $30,346,977 30.3%
Combined $59,577,519 $139,082,826 42.8%
10-Minute Drive $59,577,519 $82,414,976 72.2% Source: Demographic data © 2009 by Experian/Applied Geographic Solutions, Illinois Department of Revenue, BDI.
Data sources do not allow segregation of full-service concepts.
Major
Opportunity
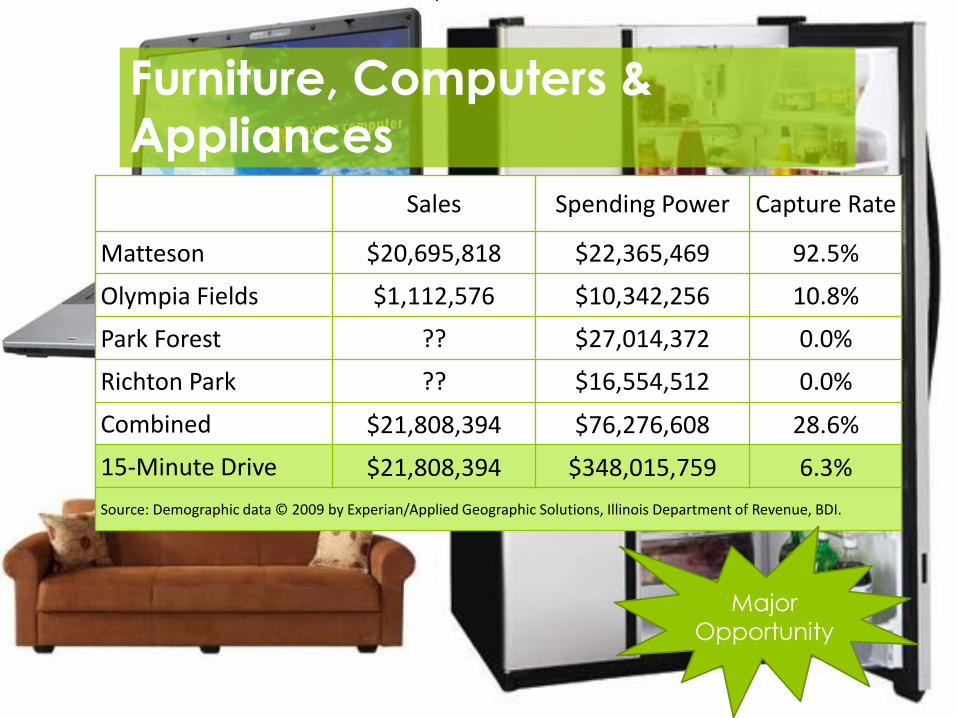
Furniture, Computers &
Appliances
Sales Spending Power Capture Rate
Matteson $20,695,818 $22,365,469 92.5%
Olympia Fields $1,112,576 $10,342,256 10.8%
Park Forest ?? $27,014,372 0.0%
Richton Park ?? $16,554,512 0.0%
Combined $21,808,394 $76,276,608 28.6%
15-Minute Drive $21,808,394 $348,015,759 6.3%
Source: Demographic data © 2009 by Experian/Applied Geographic Solutions, Illinois Department of Revenue, BDI.
Major
Opportunity

Marketing
Sheets

Focus Groups
Definition Focus Groups are small group interviews
conducted in an unstructured and natural way where respondents are free to give views on topics introduced by a moderator.
Project Focus Groups 2 consumer groups composed of people who
volunteered when responding to the survey
A developer/realty group composed of individuals active in the Chicago Metro area.
Approximately 90 minutes
Tape recorded Anonymity guaranteed
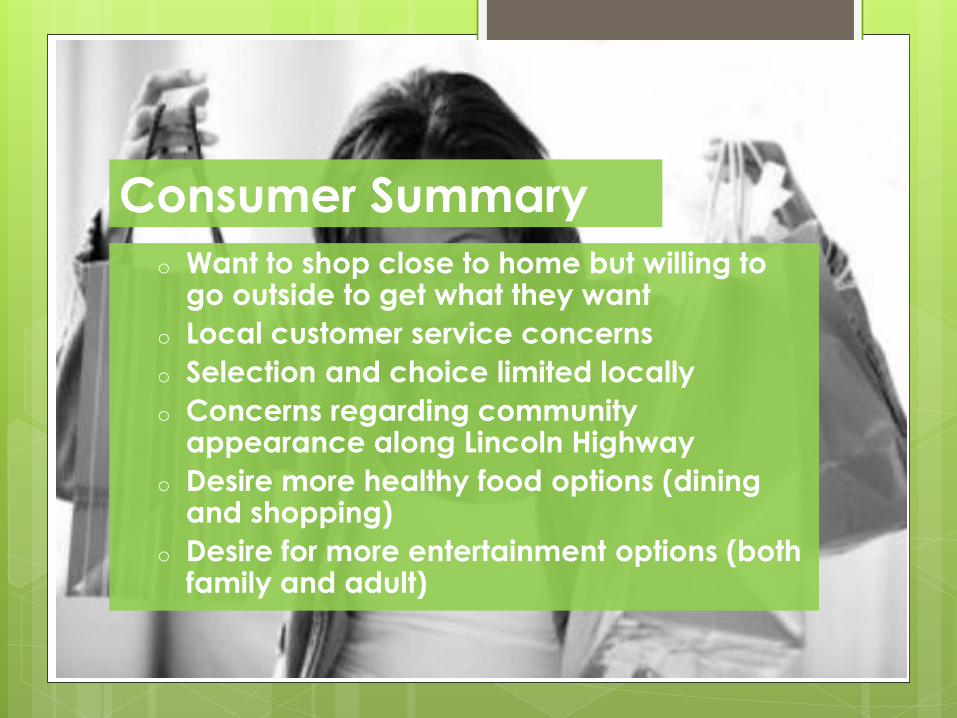
Consumer Summary
o Want to shop close to home but willing to go outside to get what they want
o Local customer service concerns
o Selection and choice limited locally
o Concerns regarding community appearance along Lincoln Highway
o Desire more healthy food options (dining and shopping)
o Desire for more entertainment options (both family and adult)

Developer/Realtor Summary
Lump our communities in with inner-ring suburbs
Concerned about capacity of small suburbs
Build on what is working now (like new 5 Guys/Chipotle)
Consider focus on I-57 corridor
Work on property tax issue
Don’t just “maintain”…think strategically about growth

Redlining Issue Findings
Retail redlining is a spatially discriminatory
practice among retailers, of not serving
certain areas, based on their ethnic-minority
composition, rather than on economic
criteria, such as the potential profitability of
operating in those areas.
Denver D’Rozario and Jerome D. Williams,
2005

Redlining or Greenlining Looked at retail conditions through lens of
retailer first Why did a store close?
What is not here that should be?
How does merchandise quality in a chain compare to other locations outside the area
For each question, we had multiple cases of chain restaurants and retail. Retail data
Field work
Focus groups Consumer survey
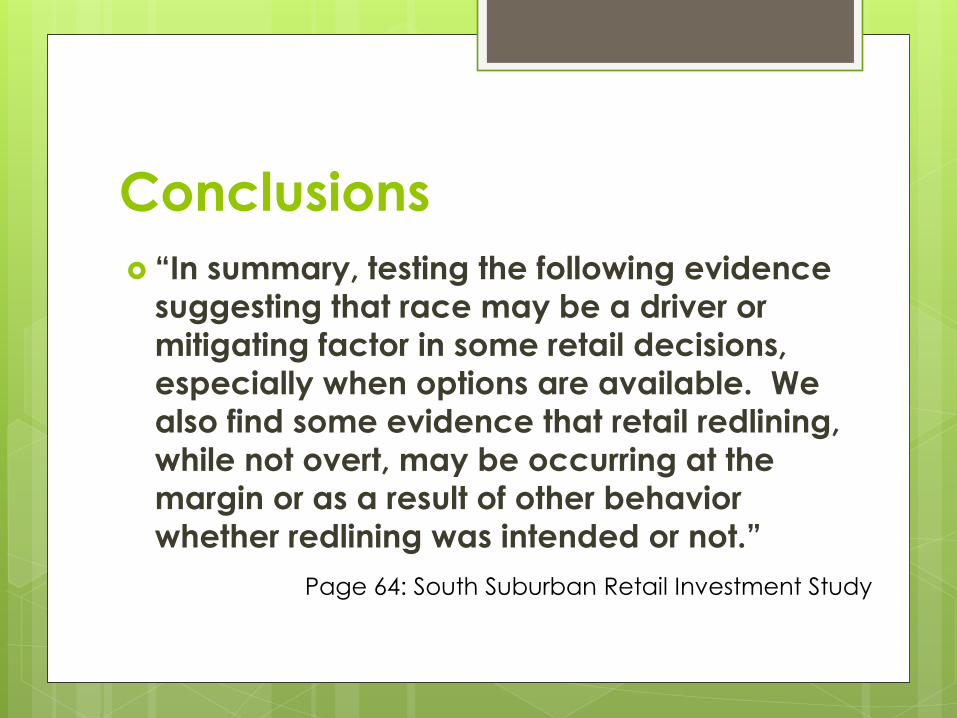
Conclusions
“In summary, testing the following evidence
suggesting that race may be a driver or
mitigating factor in some retail decisions,
especially when options are available. We
also find some evidence that retail redlining,
while not overt, may be occurring at the
margin or as a result of other behavior
whether redlining was intended or not.”
Page 64: South Suburban Retail Investment Study

Analysis
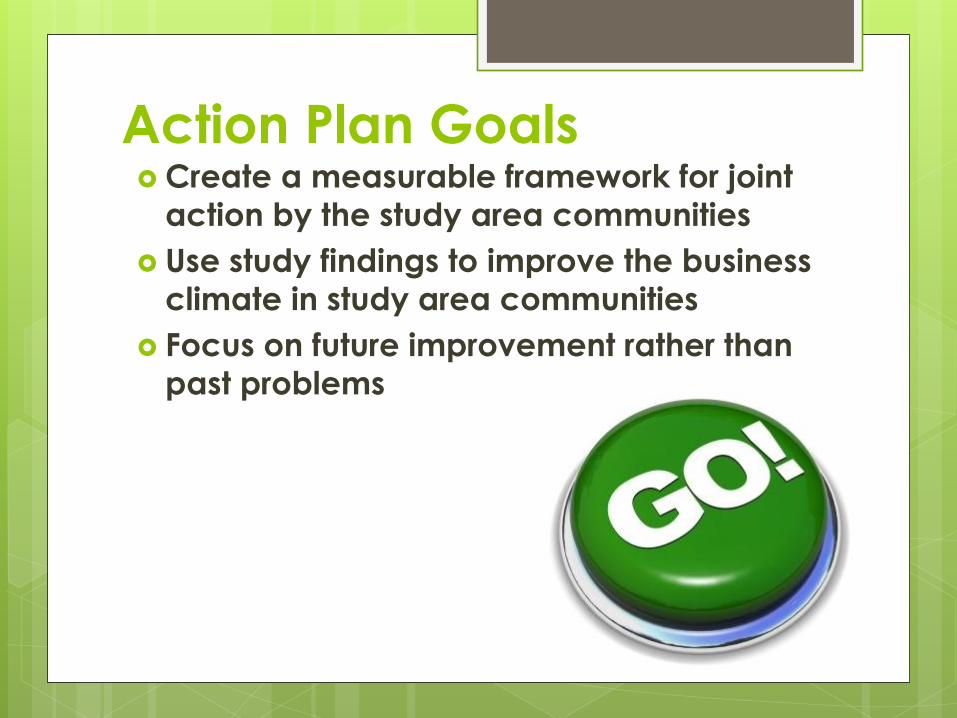
Action Plan Goals Create a measurable framework for joint
action by the study area communities
Use study findings to improve the business
climate in study area communities
Focus on future improvement rather than
past problems
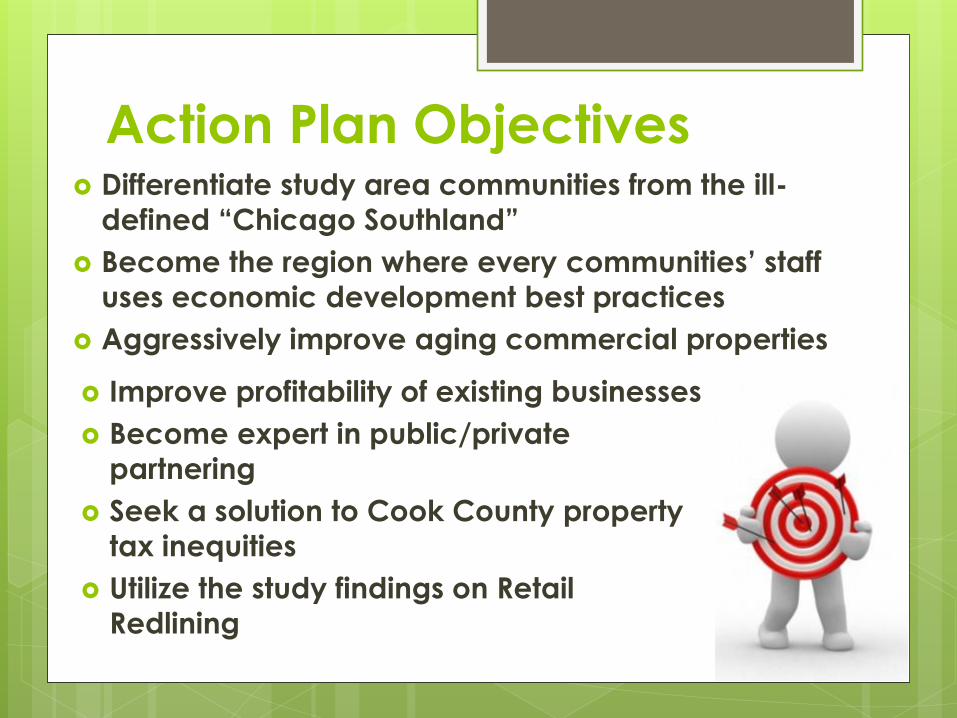
Action Plan Objectives Differentiate study area communities from the ill-
defined “Chicago Southland”
Become the region where every communities’ staff
uses economic development best practices
Aggressively improve aging commercial properties
Improve profitability of existing businesses
Become expert in public/private
partnering
Seek a solution to Cook County property
tax inequities
Utilize the study findings on Retail
Redlining


Next Steps
Publicity News Interviews??
ICSC State Panel
Follow-up on Action Plan
Continue the Dialog - Phase 3?
Recruitment – possible Crowdsourcing?
Restructuring – focus on physical appearance
Reporting – additional publicity through professional articles, presentations, etc.