Embed Size (px)
Citation preview

6th November 2017
Well-diversified product portfolio The company boasts of a broad-based product portfolio that straddles across different price-points to capture customers across the value chain ranging from low-end tiles to premium glazed tiles. In the polished vitrified tiles, the company offers value tiles of soluble salts (commodity products) to high end double-charge tiles for premium customers. Likewise, apart from manufacturing regular ceramic wall & floor tiles the company also caters to hi-definition polished digital ceramic tiles. The company’s continuous focus on developing new and innovative products has aided the company in augmenting market share (~10%) and strengthening its brand equity. Strong brand recall Kajaria enjoys strong brand recall given its broad-based product portfolio, well-entrenched distributor network and significant investment in brand building over the years translating into a dominant market share. Further the company has expanded its business from tiles to manufacturing of sanitaryware and faucets under the brand Kerovit. This has helped the company to position itself as a holistic bathroom solutions provider. Positive macro policies to drive growth The government’s focus on affordable housing and building of smart cities coupled with thrust on Housing for All by 2022 bodes well for the growth of the domestic tile industry. Besides, the implementation of GST will prove to be a game changer for the ceramic tile industry as majority of the domestic tile industry is dominated by regional brands/unbranded players. Given Kajaria’s dominant market position, pan-India presence, strong distribution network and adequate capacity, we believe the company is set to benefit from this transition from unorganised to organized. Capacity expansion to help sustain growth momentum Kajaria is adding 3.5 MSM ceramic wall and floor tile manufacturing capacity at its Gailpur (Rajasthan) plant which has commenced operations in September 2017. Additionally, it is also setting up a 5 MSM GVT manufacturing unit through its joint venture partner Floera Ceramic in South India which is expected to be commissioned by September 2018. Apart from this, it has set a target of reaching 100 MSM of tiles capacity by 2020 through greenfield, brownfield and inorganic initiatives. We believe the capacity expansion drive will not only help Kajaria in fortifying its leadership strength but will also aid in capturing any incremental demand revival. Hence, we factor volumes CAGR of 11% over FY17-19E.
Valuations: Kajaria’s dominant position coupled with impressive brand stregth, exapnding product portfolio, sustained market share gains and sound balalnce sheet strength will drive growth going ahead. Consequently, we estimate consolidated revenue/PAT to grow at a CAGR of 15%/22% over FY17-19E. The stock currently trades at ~38x/28.5x FY18E/19E EPS. We value the stock at 32x FY19E EPS arriving at a target price (TP) of Rs. 755.
RETAIL EQUITY RESEARCH
Kajaria Ceramics Ltd. Rating as per Mid Cap 12 month investment period Tiles
BSE CODE: 500233 NSE CODE: KAJARIACER CMP Rs. 672 TARGET Rs. 755 RETURN 12%
Bloomberg CODE: KJC:IN SENSEX: 33,686
Company Data
Market Cap (cr) Rs. 10,676
Enterprise Value (cr) Rs. 10,906
Outstanding Shares (cr) 15.9
Free Float 53%
Dividend Yield 0.4%
52 week high Rs. 788
52 week low Rs. 437
6m average volume (lacs) 3.7
Beta 0.9
Face value Rs. 1
Shareholding % Q4 FY17 Q1 FY18 Q2 FY18
Promoters 47.4 47.4 47.6
FII’s 23.4 24.0 27.6
MFs/Insti 5.7 5.3 6.2
Public 11.5 11.6 11.8
Others 12.0 11.7 6.8
Total 100.0 100.0 100.0
Price Performance 3mth 6mth 1 Year
Absolute Return 3% 3% 8%
Absolute Sensex 5% 13% 21%
Relative Return* (2%) (10%) (13%) *over or under performance to benchmark index
Y.E Mar (Rs cr) FY17 FY18E FY19E
Sales 2,550 2,821 3,343
Growth (%) 5.6% 10.6% 18.5%
EBITDA 496 524 664
EBITDA Margins % 19.5 18.6 19.8
PAT Adj. 253 281 375
Growth (%) 9.3% 11.3% 33.1%
Adj.EPS 15.9 17.7 23.6
Growth (%) 9.3% 11.3% 33.1%
P/E 42.2 37.9 28.5
P/B 9.1 7.7 6.3
EV/EBITDA 21.9 20.6 16.0
ROE (%) 23.6 21.9 24.4
D/E 0.1 0.1 0.0
COMPANY INITIATING REPORT
ACCUMULATE
Moving up the value chain Kajaria Ceramics (Kajaria) is the largest manufacturer of ceramic/vitrified tiles in India. It has an annual aggregate capacity of 63.90 mn. sq. meters (MSM).
• Constant product innovation and expansion of product range has made Kajaria a dominant player in the ceramic & vitrified tiles industry with a market share of ~10%.
• To further scale up its business, Kajaria has moved up the value-chain to emerge as a holistic bathroom solutions provider through manufacturing of sanitaryware and faucets.
• The company is on an expansion spree and expects to touch 100 MSM of tiles capacity by 2020 through greenfield, brownfield and inorganic initiatives.
• Given the capacity expansion and sustained focus on developing innovative products, we expect market share gains for Kajaria to continue. Hence, we estimate revenue to grow at 15% CAGR over FY17-19E.
• With consumer preference shifting towards premium vitrified tiles, we expect the company’s EBITDA margin to stay healthy going ahead. Hence, we factor EBITDA margin of 18.6%/19.8% for FY18E/19E.
• We recommend ACCUMULATE rating on the stock with a target price of Rs. 755, based on 32x FY19E EPS, an upside of 12%

Valuations Currently, Kajaria is trading at a PE multiple of ~38x FY18E and ~28x FY19E earnings, which is above its historical average (last 5yr Avg. 1yr Fwd. P/E 22x). Our target multiple (32x) is at a slight premium to Kajaria’s past three-year average PE multiple owing to several factors viz; a) sound fundamentals b) strong brand recall c) robust balance sheet with high cash flow from operations and d) healthy return ratios with average ROE/ROCE levels of ~32%/41% over FY14-17. Further positive macro policies like building of smart cities, housing for all, among others will augur well for the company given its dominant market position. Hence, we initiate Kajaria with an ACCUMULATE rating with a TP of Rs. 755 based on 32x FY19E EPS of Rs. 23.6.
1 Yr fwd P/E band
Peer comparison
Company Sales (cr) EBITDA Margin %
FY17 FY18E FY19E FY17 FY18E FY19E
Kajaria 2,550 2,821 3,343 19.5 18.6 19.8
Somany 1,811 1,928 2,275 10.8 10.5 11.5
Asian Granito 1,063 1,185 1,345 15.2 13.3 14.3
Company P/E ROE%
FY17 FY18E FY19E FY17 FY18E FY19E
Kajaria 42.2 37.9 28.5 23.6 21.9 24.4
Somany 36.7 35.1 24.7 19.6 17.4 20.9 Asian Granito 37.4 27.8 20.7 10.2 12.0 13.7 Source: Bloomberg, Geojit Research
Investment Rationale Well-diversified product portfolio The company boasts of a broad-based product portfolio raging from ceramic wall & floor tiles, polished vitrified tiles, glazed vitrified tiles, sanitaryware & faucets and tiles adhesive & grout. Kajaria offers the widest product range with more than 2,600 varieties of ceramic and vitrified tiles, thus making the company the largest tile manufacturer in India. The tiles straddles across different price-points to capture customers across the
value chain ranging from low-end tiles to premium glazed tiles. In the polished vitrified tiles, the company offers value tiles of soluble salts (commodity products) to high end double-charge tiles for premium customers. Likewise, apart from manufacturing regular ceramic wall & floor tiles the company also caters to hi-definition polished digital ceramic tiles. Given the industry demand gradually shifting towards premium products (vitrified tiles), this is clearly visible from significant uptick in volumes of vitrified tiles (grown at a CAGR of 16% over FY13-17) as against ceramic sales volume of 7% CAGR. The company’s continuous focus on developing new and innovative products has aided the company in augmenting market share and strengthening its brand equity.
Strong brand equity
Kajaria enjoys a strong brand recall given its broad-based product portfolio, well-entrenched distributor network and significant investment in brand building over the years translating into a dominant market share. Over the last few years the company has significantly increased its ad spends to create consumer awareness in order to gain market share. Its advertisement spend has increased sharply from 1.8% of revenue in FY14 to 3.1% in FY17. Notably, it is the only ceramic tile company in India conferred with “Superbrand” for eighth consecutive years. The company’s continuous focus on developing new and innovative products (developed and launched more than 500 designs across existing product verticals) will further aid in augmenting market share and strengthening its brand equity.
Diversification to provide scale
In order to de-risk its business model and to further scale-up its business, the company has forayed into manufacturing of sanitaryware and faucets under the brand Kerovit. This has helped the company to transform from a tile manufacturer into a holistic bathroom solutions provider. While, Kajaria commissioned the sanitaryware facility in 2014 with a capacity of 7 lac pieces per annum at Morbi (Gujarat), its 1 million pieces faucet facility at Gailpur (Rajasthan) commenced commercial production in July 2015. The company operates this business through its subsidiary Kajaria Bathware Pvt Ltd (KBL). The company has already developed 12 different product ranges and 100+ SKUs under this business. 60% of the sanitaryware dealers are its existing tile dealers leading to faster scale up of business. Kajaria is witnessing strong traction in the business as the revenue grew by more than 50% in

FY17 albeit on a lower base, reflecting its brand strength and focus on quality as it sources key components from global brand leaders in the trade.
Apart from launching four new faucet ranges in FY17, it has also introduced various new products in the sanitaryware space. To grow this business further, the company plans to launch new product ranges, expand dealer network especially in Tier I – II towns & cities and work towards creating brand awareness among consumer through branding and advertisement initiatives. It is planning to launch three new faucet ranges (incl. two premium ranges) apart from introducing sensor faucets. In the sanitaryware segment, the company is increasing its capacity through brownfield expansion by adding another 1.20 lac pcs per annum to cater to growing demand.
Foray into sanitaryware and bathware fittings under Kerovit brand
Source: Company, Geojit Research
Robust dealer network
The company’s focused approach towards gradually increasing the dealer network and strong brand recall has translated into a dominant market share in the domestic market. Currently, the company operates through a robust pan-India dealer network of 1,200 (up from 750 in FY12) who operate through various outlets like Galaxy, Star, Kajaria Eternity World, Prima Plus, Prima and Studio. These dealers cater to around 5000 associate dealers across the country. Kajaria is focusing on expanding its reach in the Tier 1, 2 & 3 cities & towns. A well thought out dealer expansion strategy has enabled the company to provide a wide variety of options to customers while also allowing it to periodically renew the product displays and refurbish the look of the stores in order to increase footfalls. Moreover, the company provides training to the sales staff and masons of its dealers on product attributes and customer management. It also periodically takes its dealers to international tile exhibitions which allows them stay abreast with global trends and products.
On an expansion spree… Started in 1988 with an initial capacity of 1 MSM per annum at Sikandrabad Uttar Pradesh, the company over the years has significantly increased its tile manufacturing capacity through both organic and inorganic route to 68.6 MSM in FY17. However, with the company selling its entire stake in the subsidiary - Taurus Tiles in June 2017, the installed capacity of the company stood at 63.9 MSM. With the company operating at capacity utilisation of ~90%, it is further expanding its capacity to cater to burgeoning demand. It is adding a line of 3.50 MSM per annum to manufacture high value ceramic wall and floor tiles at its Gailpur (Rajasthan) plant which has commenced operations in September 2017. Additionally, one of its subsidiary- Floera Ceramics is setting up a 5 MSM p.a manufacturing facility of glazed vitrified tiles which is expected to be commissioned by September 18. Post this, the capacity of the company will increase to ~72 MSM. Besides, the company has a long-term target of reaching 100 MSM capacity by 2020 through a combination of greenfield, brownfield and inorganic initiatives to scale up its multi-region manufacturing capability.
Kajaria’s tile capacity more than doubled over the last few years
Source: Company, Geojit Research
…Growing through the inorganic route
In order to reduce its capital intensity and quickly gain access to new capacities, the company in the recent years has entered into various joint ventures (JVs). Kajaria has formed JVs with 5 companies namely; Soriso Ceramics (Morbi, Gujarat), Jaxx Vetrified (Morbi, Gujarat), Vennar Ceramics (Vijayawada, Andhra Pradesh), Cosa Ceramics (Morbi, Gujarat) and Taurus Tiles (Morbi, Gujarat) by acquiring majority stake in such companies. Of the overall capacity, Kajaria's in-house capacity stood at 41.5 MSM and capacity from joint ventures was ~27 MSM. However, post the divestment of 46% stake in Taurus JV, the capacity from

joint venture stood at ~22 MSM. While the company’s overall tiles production has grown at a CAGR of ~12% over FY13-17, production from JVs grew at a rapid pace of 44% CAGR during the same period. As a result, tiles sales from the JVs witnessed a tremendous growth of 28% CAGR over FY13-17, leading to significant increase in the contribution from JVs in the overall mix to 33% in FY17 from 18% in FY13. We believe the company’s focus on asset light business model to increase its capacity will aid it in sustaining heathy return ratios going forward.
Plant-Product summary (MSM per annum) Plant
Type
Ceramic
Wall
and
Floor
tiles
Polished
Vitrified
tiles
Glazed
Vitrified
tiles
Total
(MSM)
Sikandrabad
(UP) Own - - 8.40 8.40
Gailpur
(Rajasthan) Own 18.90 - 7.70 26.60
Malutana
(Rajasthan) Own - 6.50 - 6.50
Jaxx (Morbi,
Gujarat)
JV
(61%) - 10.20 - 10.20
Cosa (Morbi,
Gujarat)
JV
(51%) - 5.70 - 5.70
Soriso
(Morbi,
Gujarat)
JV
(51%) 3.60 - - 3.60
Vennar
(Vijaywada,
AP)
JV
(51%) 2.90 - - 2.90
Total 25.40 22.40 16.10 63.90
Source: Company, Geojit Research
Domestic tile industry - strong growth prospects
India is the third largest producer & consumer of tiles in the world. India is also the 5th largest exporter of tiles globally. While ceramic tiles are mostly used for wall applications, vitrified tiles are increasingly finding application in flooring solutions due to its longer usable life. Morbi (Gujarat) is India’s largest destination for ceramic tile manufacturing accounting for ~60% of India’s total tile production. Indian tile industry has grown at a CAGR of 8-9% over the last 4-5 years and is worth Rs. 27,000 cr as of March 2017. In terms of volume, production stood at 780 MSM.
We expect the domestic tile industry to grow at 10-11% CAGR over the next five years, given the government’s focus on affordable housing and building of smart cities. Further the thrust of the government on Housing for All by 2022, Swachh Bharat Abhiyaan (Sanitation for All by 2019), Atal Mission for Rejuvenation and Urban
Transformation (AMRUT) initiatives coupled with increased disposable incomes and urbanisation are expected to drive strong demand for tiles in India.
…….GST a boon for the organised players in the industry
Since majority of the domestic tile industry is dominated by regional brands/unbranded players present in Morbi/ Himmatnagar (Gujarat), the implementation of Goods and Service Tax (GST) will prove to be a game changer for the ceramic tile industry. The GST will provide a level playing field to the organised/branded players in the industry. We believe, Kajaria being the largest manufacturer of tiles in India with a market share of ~10%, pan-India presence, strong distribution network and adequate capacity, is set to benefit from this transition from unorganised to organized. Notably, the management is targeting to increase its market share to 14% over the next three to five years.
How Kajaria is catering to all the segment of the 785 MSM tile Industry (Rs. 27,000 Crore)
Source: Company, Geojit Research
Financials
Revenue to grow at 15% CAGR
Kajaria’s revenue has grown at a decent CAGR of 12% over FY14-17 primarily driven by healthy growth in volumes. The company has clocked volume growth of ~10% CAGR during the period driven by consistent new product launches and market share gains. Going ahead, we expect volume growth to remain steady (11% CAGR over FY17-19E) on the back of its sustained focus on developing innovative products, increasing market share, capacity expansion and aggressive brand spending. Moreover, the company’s focus on improving its product mix through development of value‐added products will also drive realisation. Hence, we have modelled revenue CAGR of 15% over FY17-19E.
Overall revenue to grow at 15% CAGR during FY17-19E
Source: Company, Geojit Research
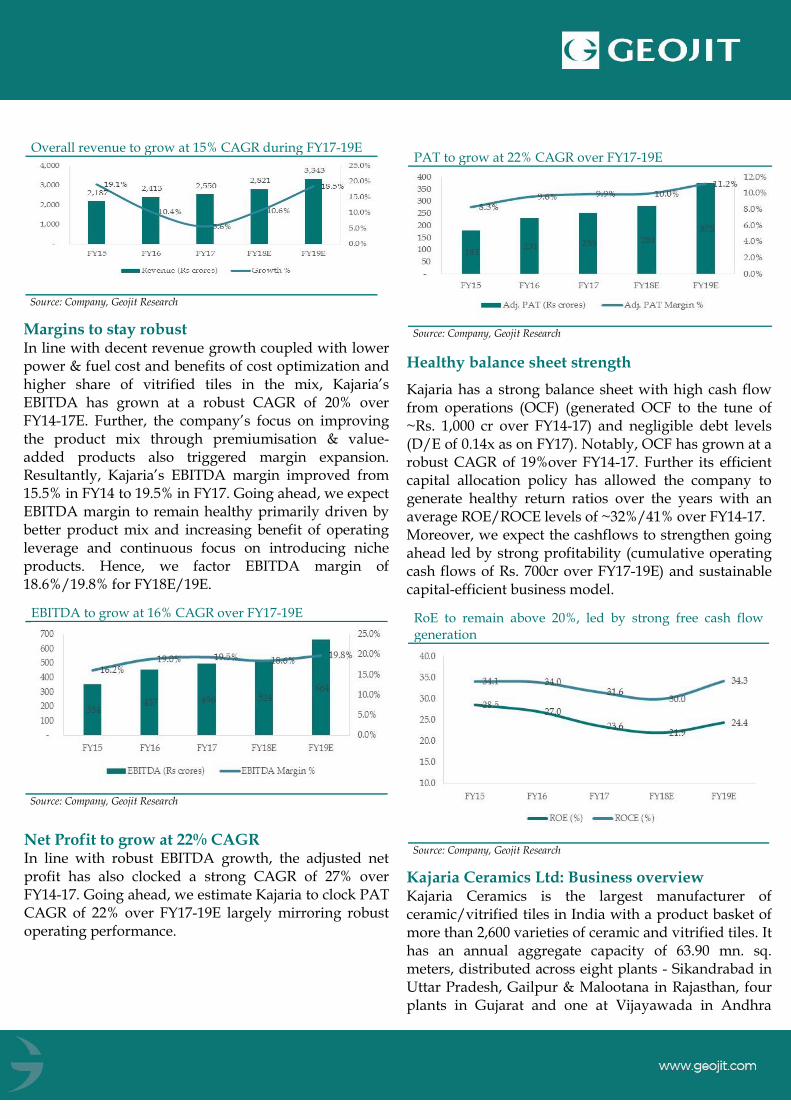
Margins to stay robust In line with decent revenue growth coupled with lower power & fuel cost and benefits of cost optimization and higher share of vitrified tiles in the mix, Kajaria’s EBITDA has grown at a robust CAGR of 20% over FY14-17E. Further, the company’s focus on improving the product mix through premiumisation & value-added products also triggered margin expansion. Resultantly, Kajaria’s EBITDA margin improved from 15.5% in FY14 to 19.5% in FY17. Going ahead, we expect EBITDA margin to remain healthy primarily driven by better product mix and increasing benefit of operating leverage and continuous focus on introducing niche products. Hence, we factor EBITDA margin of 18.6%/19.8% for FY18E/19E.
EBITDA to grow at 16% CAGR over FY17-19E
Source: Company, Geojit Research
Net Profit to grow at 22% CAGR In line with robust EBITDA growth, the adjusted net profit has also clocked a strong CAGR of 27% over FY14-17. Going ahead, we estimate Kajaria to clock PAT CAGR of 22% over FY17-19E largely mirroring robust operating performance.
PAT to grow at 22% CAGR over FY17-19E
Source: Company, Geojit Research
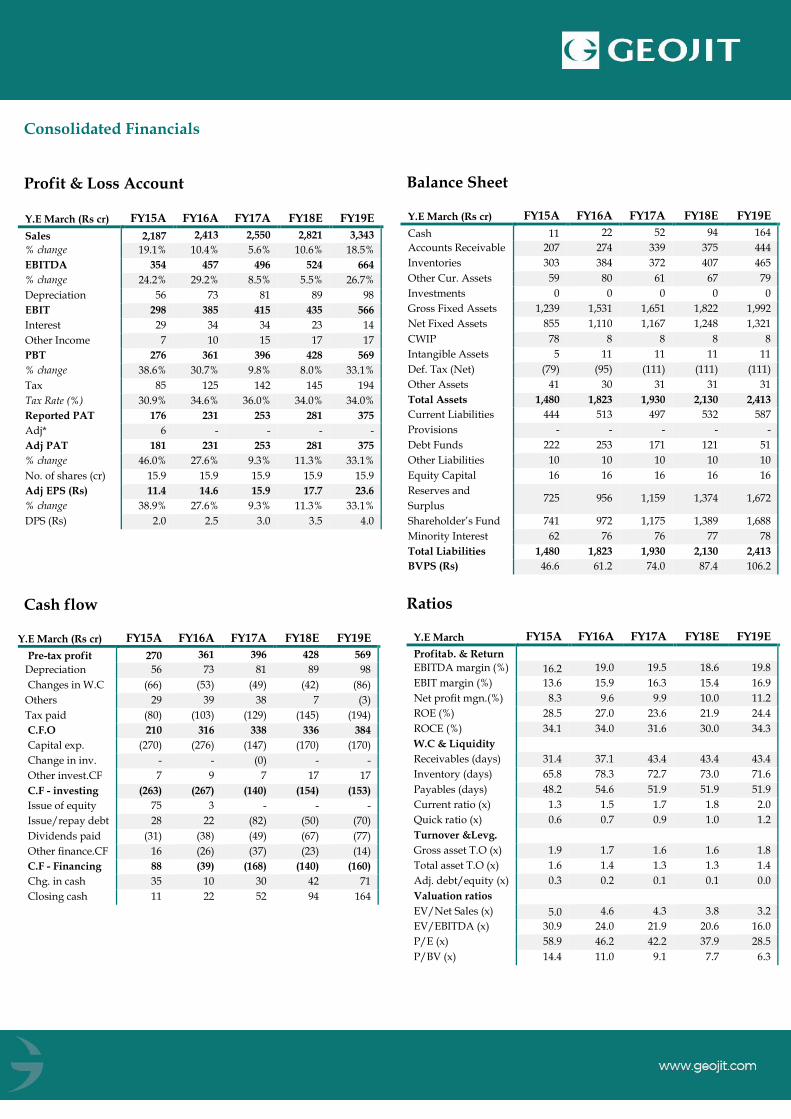
Healthy balance sheet strength
Kajaria has a strong balance sheet with high cash flow from operations (OCF) (generated OCF to the tune of ~Rs. 1,000 cr over FY14-17) and negligible debt levels (D/E of 0.14x as on FY17). Notably, OCF has grown at a robust CAGR of 19%over FY14-17. Further its efficient capital allocation policy has allowed the company to generate healthy return ratios over the years with an average ROE/ROCE levels of ~32%/41% over FY14-17. Moreover, we expect the cashflows to strengthen going ahead led by strong profitability (cumulative operating cash flows of Rs. 700cr over FY17-19E) and sustainable capital-efficient business model.
RoE to remain above 20%, led by strong free cash flow generation
Source: Company, Geojit Research
Kajaria Ceramics Ltd: Business overview Kajaria Ceramics is the largest manufacturer of ceramic/vitrified tiles in India with a product basket of more than 2,600 varieties of ceramic and vitrified tiles. It has an annual aggregate capacity of 63.90 mn. sq. meters, distributed across eight plants - Sikandrabad in Uttar Pradesh, Gailpur & Malootana in Rajasthan, four plants in Gujarat and one at Vijayawada in Andhra

Pradesh. It offers more than 2000 options in ceramic wall & floor tiles, vitrified tiles, designer tiles, among others used across bathrooms, living rooms, corridors, study rooms & kitchen. Kajaria Ceramics exports to more than 30 countries globally. So far, the company has launched more than 500 designs across existing product verticals (ceramic wall and floor tiles, polished and glazed vitrified tiles).
Kajaria’s products across categories
Source: Company, Geojit Research
Revenue mix
Source: Company, Geojit Research
Key Risks: • Slowdown in real estate sector could have a
bearing on tiles demand.
• Increasing competition.
• Increase in natural gas prices could impact margins.
Consolidated Financials
Profit & Loss Account
Y.E March (Rs cr) FY15A FY16A FY17A FY18E FY19E
Sales 2,187 2,413 2,550 2,821 3,343
% change 19.1% 10.4% 5.6% 10.6% 18.5%
EBITDA 354 457 496 524 664
% change 24.2% 29.2% 8.5% 5.5% 26.7%
Depreciation 56 73 81 89 98
EBIT 298 385 415 435 566
Interest 29 34 34 23 14
Other Income 7 10 15 17 17
PBT 276 361 396 428 569
% change 38.6% 30.7% 9.8% 8.0% 33.1%
Tax 85 125 142 145 194
Tax Rate (%) 30.9% 34.6% 36.0% 34.0% 34.0%
Reported PAT 176 231 253 281 375
Adj* 6 - - - -
Adj PAT 181 231 253 281 375
% change 46.0% 27.6% 9.3% 11.3% 33.1%
No. of shares (cr) 15.9 15.9 15.9 15.9 15.9
Adj EPS (Rs) 11.4 14.6 15.9 17.7 23.6
% change 38.9% 27.6% 9.3% 11.3% 33.1%
DPS (Rs) 2.0 2.5 3.0 3.5 4.0
Cash flow
Y.E March (Rs cr) FY15A FY16A FY17A FY18E FY19E
Pre-tax profit 270 361 396 428 569
Depreciation 56 73 81 89 98
Changes in W.C (66) (53) (49) (42) (86)
Others 29 39 38 7 (3)
Tax paid (80) (103) (129) (145) (194)
C.F.O 210 316 338 336 384
Capital exp. (270) (276) (147) (170) (170)
Change in inv. - - (0) - -
Other invest.CF 7 9 7 17 17
C.F - investing (263) (267) (140) (154) (153)
Issue of equity 75 3 - - -
Issue/repay debt 28 22 (82) (50) (70)
Dividends paid (31) (38) (49) (67) (77)
Other finance.CF 16 (26) (37) (23) (14)
C.F - Financing 88 (39) (168) (140) (160)
Chg. in cash 35 10 30 42 71
Closing cash 11 22 52 94 164
Balance Sheet Y.E March (Rs cr) FY15A FY16A FY17A FY18E FY19E
Cash 11 22 52 94 164
Accounts Receivable 207 274 339 375 444
Inventories 303 384 372 407 465
Other Cur. Assets 59 80 61 67 79
Investments 0 0 0 0 0
Gross Fixed Assets 1,239 1,531 1,651 1,822 1,992
Net Fixed Assets 855 1,110 1,167 1,248 1,321
CWIP 78 8 8 8 8
Intangible Assets 5 11 11 11 11
Def. Tax (Net) (79) (95) (111) (111) (111)
Other Assets 41 30 31 31 31
Total Assets 1,480 1,823 1,930 2,130 2,413
Current Liabilities 444 513 497 532 587
Provisions - - - - -
Debt Funds 222 253 171 121 51
Other Liabilities 10 10 10 10 10
Equity Capital 16 16 16 16 16
Reserves and
Surplus 725 956 1,159 1,374 1,672
Shareholder’s Fund 741 972 1,175 1,389 1,688
Minority Interest 62 76 76 77 78
Total Liabilities 1,480 1,823 1,930 2,130 2,413
BVPS (Rs) 46.6 61.2 74.0 87.4 106.2
Ratios
Y.E March FY15A FY16A FY17A FY18E FY19E
Profitab. & Return EBITDA margin (%) 16.2 19.0 19.5 18.6 19.8
EBIT margin (%) 13.6 15.9 16.3 15.4 16.9
Net profit mgn.(%) 8.3 9.6 9.9 10.0 11.2
ROE (%) 28.5 27.0 23.6 21.9 24.4
ROCE (%) 34.1 34.0 31.6 30.0 34.3
W.C & Liquidity
Receivables (days) 31.4 37.1 43.4 43.4 43.4
Inventory (days) 65.8 78.3 72.7 73.0 71.6
Payables (days) 48.2 54.6 51.9 51.9 51.9
Current ratio (x) 1.3 1.5 1.7 1.8 2.0
Quick ratio (x) 0.6 0.7 0.9 1.0 1.2
Turnover &Levg.
Gross asset T.O (x) 1.9 1.7 1.6 1.6 1.8
Total asset T.O (x) 1.6 1.4 1.3 1.3 1.4
Adj. debt/equity (x) 0.3 0.2 0.1 0.1 0.0
Valuation ratios
EV/Net Sales (x) 5.0 4.6 4.3 3.8 3.2
EV/EBITDA (x) 30.9 24.0 21.9 20.6 16.0
P/E (x) 58.9 46.2 42.2 37.9 28.5
P/BV (x) 14.4 11.0 9.1 7.7 6.3

Recommendation Summary
Dates Rating Target
6-November-2017 ACCUMULATE 755
Source: Bloomberg, Geojit BNP Paribas Research
Large Cap Stocks; Mid Cap and Small Cap;
Buy - Upside is above 10%. Hold - Upside is between 0% - 10%. Reduce - Downside is more than 0%.
Buy - Upside is above 15%. Accumulate - Upside is between 10% - 15%. Hold - Upside is between 0% - 10%. Reduce/Sell - Downside is more than 0%. To satisfy regulatory requirements, we attribute ‘Accumulate’ as Buy and ‘Reduce’ as Sell.
The recommendations are based on 12 month horizon, unless otherwise specified. The investment ratings are on absolute positive/negative return basis. It is possible that due to volatile price fluctuation in the near to medium term, there could be a temporary mismatch to rating. For reasons of valuations/return/lack of clarity/event we may revisit rating at appropriate time. Please note that the stock always carries the risk of being upgraded to BUY or downgraded to a HOLD, REDUCE or SELL.
Geojit Financial Services Limited has outsourced the preparation of this research report to DION Global Solutions Limited whose relevant disclosures are
available hereunder. However, Geojit’s research desk has reviewed this report for any untrue statement of material fact or any false or misleading
information.
General Disclosures and Disclaimers
CERTIFICATION
I, Abhijit Kumar Das, employee of Dion Global Solutions Limited (Dion) is engaged in preparation of this report and hereby certify that all the views
expressed in this research report (report) reflect my personal views about any or all of the subject issuer or securities.
Disclaimer
This report has been prepared by Dion and the report & its contents are the exclusive property of the Dion and the client cannot tamper with the report or
its contents in any manner and the said report, shall in no case, be further distributed to any third party for commercial use, with or without consideration.
Geojit Financial Services Limited has outsourced the assignment of preparation of this report to Dion.
Recipient shall not further distribute the report to a third party for a commercial consideration as this report is being furnished to the recipient solely for the
purpose of information.
Dion has taken steps to ensure that facts in this report are based on reliable information but cannot testify, nor make any representation or warranty, express
or implied, to the accuracy, contents or data contained within this report. It is hereby confirmed that wherever Dion has employed a rating system in this
report, the rating system has been clearly defined including the time horizon and benchmarks on which the rating is based.
Descriptions of any company or companies or their securities mentioned herein are not intended to be complete and this report is not, and should not be
construed as an offer or solicitation of an offer, to buy or sell any securities or other financial instruments. Dion has not taken any steps to ensure that the
securities referred to in this report are suitable for any particular investor. This report is not to be relied upon in substitution for the exercise of independent
judgment. Opinions or estimates expressed are current opinions as of the original publication date appearing on this report and the information, including
the opinions and estimates contained herein, are subject to change without notice. Dion is under no duty to update this report from time to time.
Dion or its associates including employees engaged in preparation of this report and its directors do not take any responsibility, financial or otherwise, of
the losses or the damages sustained due to the investments made or any action taken on basis of this report, including but not restricted to, fluctuation in the
prices of securities, changes in the currency rates, diminution in the NAVs, reduction in the dividend or income, etc.
The investments or services contained or referred to in this report may not be suitable for all equally and it is recommended that an independent investment
advisor be consulted. In addition, nothing in this report constitutes investment, legal, accounting or tax advice or a representation that any investment or
strategy is suitable or appropriate to individual circumstances or otherwise constitutes a personal recommendation of Dion.

Geojit Financial Services Ltd. (formerly known as Geojit BNP Paribas Financial Services Ltd.), Registered Office: 34/659-P, Civil Line Road, Padivattom, Kochi-682024, Kerala, India. Phone: +91 484-2901000, Fax: +91 484-2979695, Website: geojit.com. For investor queries: [email protected], For grievances: [email protected], For compliance officer: [email protected].
Corporate Identity Number: L67120KL1994PLC008403, SEBI Regn.Nos.: NSE: INB/INF/INE231337230 I BSE:INB011337236 & INF011337237 | MSEI: INE261337230, INB261337233 & INF261337233, Research Entity SEBI Reg No: INH200000345, Investment Adviser SEBI Reg No: INA200002817, Portfolio Manager:INP000003203, NSDL: IN-DP-NSDL-24-97, CDSL: IN-DP-CDSL-648-2012, ARN Regn.Nos:0098, IRDA Corporate Agent (Composite) No.: CA0226. Research Entity SEBI Registration Number: INH200000345
REGULATORY DISCLOSURES:
Dion is engaged in the business of developing software solutions for the global financial services industry across the entire transaction lifecycle and inter-
alia provides research and information services essential for business intelligence to global companies and financial institutions. Dion is listed on BSE
Limited (BSE) and is also registered under the SEBI (Research Analyst) Regulations, 2014 (SEBI Regulations) as a Research Analyst vide Registration No.
INH100002771. Dion’s activities were neither suspended nor has it defaulted with requirements under the Listing Agreement and / or SEBI (Listing
Obligations and Disclosure Requirements) Regulations, 2015 with the BSE in the last five years. Dion has not been debarred from doing business by BSE /
SEBI or any other authority.
In the context of the SEBI Regulations, we affirm that we are a SEBI registered Research Analyst and in the course of our business, we issue research reports
/research analysis etc that are prepared by our Research Analysts. We also affirm and undertake that no disciplinary action has been taken against us or our
Analysts in connection with our business activities.
In compliance with the above mentioned SEBI Regulations, the following additional disclosures are also provided which may be considered by the reader
before making an investment decision:
1. Disclosures regarding Ownership
Dion confirms that:
(i) It/its associates have no financial interest or any other material conflict in relation to the subject company (ies) covered herein at the time of
publication of this report.
(ii) It/its associates have no actual / beneficial ownership of 1% or more securities of the subject company (ies) covered herein at the end of the
month immediately preceding the date of publication of this report.
Further, the Research Analyst confirms that:
(i) He, his associates and his relatives have no financial interest in the subject company (ies) covered herein, and they have no other material conflict
in the subject company at the time of publication of this report.
(ii) He, his associates and his relatives have no actual/beneficial ownership of 1% or more securities of the subject company (ies) covered herein at the
end of the month immediately preceding the date of publication of this report.
2. Disclosures regarding Compensation:
During the past 12 months, Dion or its Associates:
(a) Have not managed or co-managed public offering of securities for the subject company (b) Have not received any compensation for investment banking
or merchant banking or brokerage services from the subject company (c) Have not received any compensation for products or services other than
investment banking or merchant banking or brokerage services from the subject. (d) Have not received any compensation or other benefits from the subject
company or third party in connection with this report
3. Disclosure regarding the Research Analyst’s connection with the subject company:
It is affirmed that I, Abhijit Kumar Das employed as Research Analyst by Dion and engaged in the preparation of this report have not served as an officer,
director or employee of the subject company
4. Disclosure regarding Market Making activity:
Neither Dion /its Research Analysts have engaged in market making activities for the subject company.
Copyright in this report vests exclusively with Dion.