Embed Size (px)
Citation preview

3
23rd July, 2020 Q1FY21 RESULT UPDATE
Retail Equity Research
HDFC Bank Banking
BSE CODE: 500180 NSE CODE: HDFCBANK
Bloomberg CODE: HDFCB:IN SENSEX: 37,872
12M Investment Period Rating as per Large cap
CMP Rs. 1,126 TARGET Rs. 1,403 RETURN 25% (Closing: 22-07-20)
KEY CHANGES: TARGET RATING EARNINGS
BUY
www.geojit.com
Better-than-expected growth across top-line and bottom-line
Q1FY21 Net interest income rose 17.8% YoY to Rs. 15,665cr, backed by further strong growth in loans and advances amounting to Rs. 1,003,299cr (+20.9% YoY). On the other hand, customer deposits also grew 24.6% YoY to Rs. 1,189,387cr, with time deposits witnessing a 23.7% YoY growth, and CASA growing by 26.0% YoY. The bank’s contribution from other income was impacted by the slowdown in economic activity as there was a decline in retail loan origination, sale of third party products, use of credit/debit cards, collections and waivers of certain fees. However, this was partially offset by the decline in operating expenses, as cost to income ratio stood at 35.0% compared to 39.4% in Q1FY20. PAT grew 19.6% YoY to Rs. 6,659cr despite a hefty increase in provisions (Rs. 3,892cr, +48.9% YoY) made during the quarter.
Key concall highlights
• Having conducted an investigation into alleged malpractices, management said to have found no conflict of interest issues, nor does it expect any impact on the Bank’s loan portfolio.
• During Q1FY21, Loan moratorium granted stood at just 9% of the loan book. • Domestic loan mix as per Basel II norms for Retail – Wholesale stood at 48:52. • Provision coverage ratio (ex. Contingent provisions) stood at 76% as against 72%
in the prior quarter and 70% in the same period previous year. • 95% of HDFC Bank’s branches remain operational currently. • As of June 30, Bank’s total branch count stood at 5,326 along with 14,996 ATMs
(vs. 4,990 branches and 13,727 ATMs in the prior year period).
Bank finalises list of names of successors to Mr. Puri - sent to RBI
Bank has put forward names of three eligible candidates to RBI for the position of MD & CEO post retirement of Mr. Aditya Puri in October. Included among the names are two of Bank’s veterans - Mr. Sashidhar Jagdishan and Mr. Kaizad Bharucha - both of whom have spent over 25 years with the bank, while the third, external candidate being Citi Commercial Bank’s current CEO, Mr. Sunil Garg.
Outlook & valuation
Strong governance and equally strong asset quality has always been the hallmark of HDFC Bank setting it apart from its peers. Bank is expected to build up further on its growth momentum from current levels. We value the stock at 3.5x FY22E BVPS (equivalent to 3-year average forward P/BV multiple) with a revised target price of Rs. 1,403 and reiterate our BUY rating on the stock.
Company Data
Market Cap (cr) Rs. 627,121
Outstanding Shares (cr) 550
Free Float 74.0%
Dividend Yield 0.0%
52 week high Rs. 1,304
52 week low Rs. 739
6m average volume (lacs) 8.5
Beta 0.9
Face value Rs. 1
Shareholding % Q3FY20 Q4FY20 Q1FY21
Promoters 26.2 26.1 26.1
FII’s 37.9 36.7 37.0
MFs/Insti 21.1 22.0 22.1
Public 11.2 11.3 11.0
Others 3.7 3.9 3.8
Total 100.0 100.0 100.0
Promoters’ pledge 0.0 0.0 0.0
Price Performance 3 Month 6 Month 1 Year
Absolute Return 23.8% -8.4% -3.9%
Absolute Sensex 23.8% -8.2% -1.1%
Relative Return* 0.0% -0.2% -2.8%
*over or under performance to benchmark index
Standalone (cr) FY20A FY21E FY22E
Net Interest Income 56,186 62,974 74,224
Growth (%) 16.5 12.1 17.9
NIM (%) 4.5 4.2 4.2
Pre-Provision Profit 48,750 54,273 63,300
Net Profit 26,257 27,424 34,598
Growth (%) 24.6 4.4 26.2
Adj. EPS 47.7 49.8 62.9
Growth (%) 22.3 4.4 26.2
BVPS 310.6 350.5 400.8
P/E 18.1 22.9 18.1
P/B 2.8 3.3 2.8
ROE (%) 16.4 15.1 16.7
ROA (%) 1.9 1.7 1.8
500
750
1,000
1,250
1,500
Jul-19 Oct-19 Jan-20 Apr-20 Jul-20
HDFCB Sensex Rebased
Strong quarter; Unhindered by pandemic HDFC Bank was incorporated in August 1994. It provides corporate banking
and custodial services and is also involved in treasury and capital markets.
In addition, it offers project advisory services and capital market products,
including GDR and currency bonds.
• During Q1FY21, loans and advances grew 20.9% YoY, while deposits
also increased 24.6% YoY. Operating profit before provisions rose
15.1% YoY to Rs. 12,829cr. Net interest margin (NIM) stood at 4.3%.
• Capital Adequacy Ratio improved to 18.9% (vs. 16.9% in Q1FY20).
• GNPA/NNPA ratio stood at 1.36%/0.33% during the quarter as against
1.26%/0.36% in Q4FY20.
• HDFC Bank continues to deliver strong results even in tough times. We
reiterate our BUY on the stock with an upgraded target price of Rs. 1,403
based on 3.5x FY22E BVPS.

www.geojit.com
Quarterly Financials (Standalone)
Profit & Loss Account
Q1FY21 Q1FY20 YoY Growth % Q4FY20 QoQ Growth %
Interest Income 30,378 27,392 10.9 29,885 1.6
Interest Expense 14,713 14,097 4.4 14,681 0.2
Net Interest Income (NII) 15,665 13,294 17.8 15,204 3.0
Non-Interest Income 4,075 4,970 (18.0) 6,033 (32.4)
Total Income 34,453 32,362 6.5 35,918 (4.1)
Operating Expenses 6,911 7,117 (2.9) 8,278 (16.5)
Total Expenditure 21,624 21,215 1.9 22,959 (5.8)
Pre-Provision profit 12,829 11,147 15.1 12,959 (1.0)
Provisions 3,892 2,614 48.9 3,784 2.8
Profit Before Tax 8,938 8,534 4.7 9,174 (2.6)
Tax 2,279 2,965 (23.1) 2,247 1.4
Net Profit 6,659 5,568 19.6 6,928 (3.9)
Adj. EPS - Diluted (Rs.) 12.1 10.1 19.8 12.6 (4.0)
Change in Estimates
Old estimates New estimates Change %
Year / Rs. cr FY21E FY22E FY21E FY22E FY21E FY22E
Net Int. Inc. (NII) 69,598 82,016 62,974 74,224 (9.5) (9.5)
Pre-Provision Profit 58,114 69,009 54,273 63,300 (6.6) (8.3)
Net Profit 33,382 40,683 27,424 34,598 (17.8) (15.0)
Adj. EPS (Rs.) 61.0 74.4 49.8 62.9 (18.3) (15.5)

www.geojit.com
PROFIT & LOSS
Y.E March (Rs. cr) FY18A FY19A FY20A FY21E FY22E
Interest Income 80,241 98,972 114,813 130,924 156,309
Interest Exp. 40,146 50,729 58,626 67,950 82,085
Net Int. Income 40,095 48,243 56,186 62,974 74,224
% Change 21.0 20.3 16.5 12.1 17.9
Non-Int. Income 15,220 17,626 23,261 26,750 30,762
Net Income 55,315 65,869 79,447 89,724 104,986
Total Income 95,462 116,598 138,073 157,674 187,072
Operating Exp. 22,690 26,119 30,698 35,451 41,687
Total Exp. 62,837 76,848 89,324 103,401 123,772
Pre-Prov. Profit 32,625 39,750 48,750 54,273 63,300
Provisions 5,927 7,550 12,142 17,462 16,860
PBT 26,697 32,200 36,607 36,811 46,440
Tax 9,211 11,122 10,350 9,387 11,842
Tax Rate (%) 34.5 34.5 28.3 25.5 25.5
Net Profit 17,487 21,078 26,257 27,424 34,598
% Change 20.2 20.5 24.6 4.4 26.2
No. of Shares (cr) 523 540 550 550 550
Adj. EPS (Rs.) 33.4 39.0 47.7 49.8 62.9
% Change 18.5 16.7 22.3 4.4 26.2
DPS (Rs.) 6.5 7.5 0.0 10.0 12.6
BALANCE SHEET
Y.E March (Rs. cr) FY18A FY19A FY20A FY21E FY22E
Cash & Balances 122,915 81,348 86,619 101,706 122,498
Investments 242,200 293,116 391,827 493,474 609,351
Advances 658,333 819,401 993,703 1,122,884 1,285,702
Fixed Assets 3,607 4,030 4,432 4,885 5,397
Other Assets 36,879 46,646 53,931 62,489 72,561
Total Assets 1,063,934 1,244,541 1,530,511 1,785,438 2,095,510
Capital 519 545 548 548 548
Reserves & Surplus 105,776 148,662 170,438 192,377 220,055
Deposits 788,771 923,141 1,147,502 1,319,628 1,530,768
Borrowings 123,105 117,085 144,629 190,297 242,724
Other Liabilities 45,764 55,108 67,394 82,588 101,414
Total Liabilities 1,063,934 1,244,541 1,530,511 1,785,438 2,095,510
BVPS (Rs.) 203.2 276.1 310.6 350.5 400.8
% Change 17.1 35.9 12.5 12.8 14.3
RATIOS
Y.E March FY18A FY19A FY20A FY21E FY22E
Valuation
P/E (x) 27.9 29.2 18.1 22.9 18.1
P/BV (x) 4.6 4.1 2.8 3.3 2.8
Div. Yield (%) 0.7 0.7 0.0 0.9 1.1
Profitab. & Return (%)
Yield on Advances 10.3 10.5 10.1 9.9 10.1
Cost of Deposits 4.9 5.2 5.0 4.9 5.0
Spread 5.4 5.3 5.1 5.0 5.1
NIM 4.3 4.3 4.3 4.2 4.2
ROE 17.9 16.5 16.4 15.1 16.7
ROA 1.8 1.8 1.9 1.7 1.8
Capital Adequacy (%)
CAR 14.8 17.1 18.5 17.9 18.0
Tier I 13.2 15.8 17.2 16.8 16.9
Tier II 1.6 1.3 1.3 1.1 1.1
Asset Quality (%)
GNPA 1.3 1.4 1.3 1.5 1.6
NNPA 0.4 0.4 0.4 0.4 0.5
Operating Ratios (%)
Credit/ Deposit 83.5 88.8 86.6 85.1 84.0
Cost/ Income 41.0 39.7 38.6 39.5 39.7
CASA 43.5 42.4 42.2 40.5 40.5
www.geojit.com
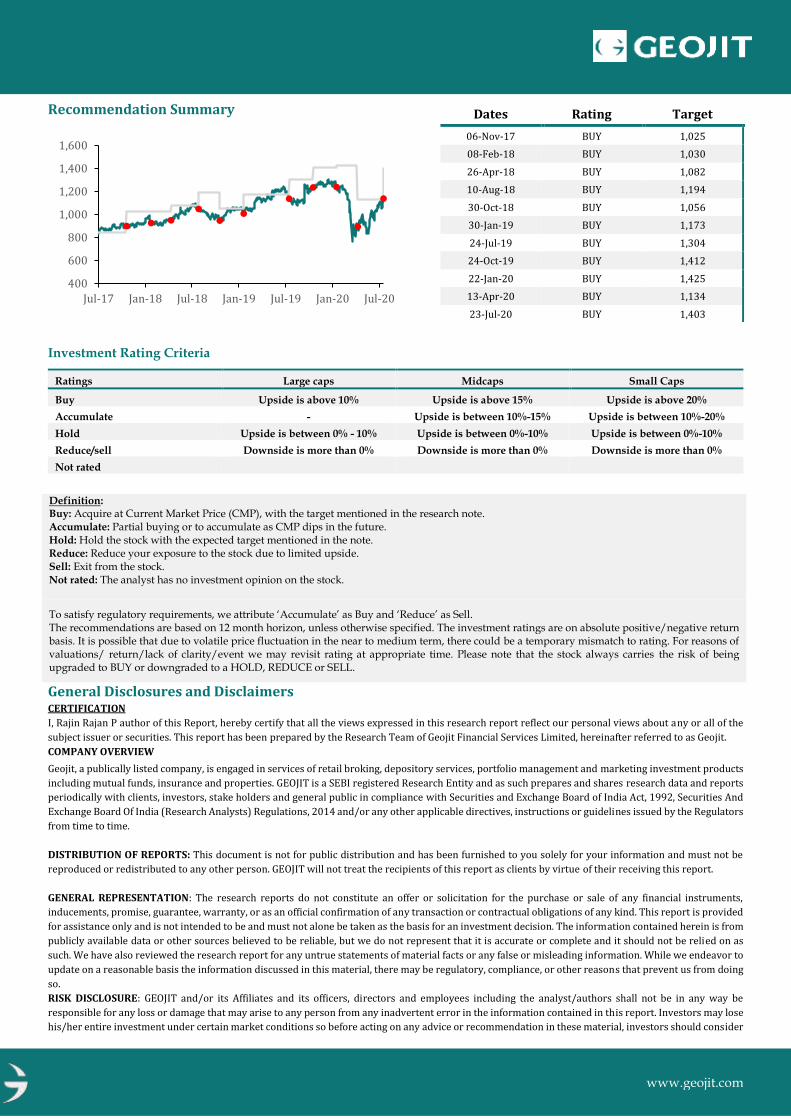
Recommendation Summary
Investment Rating Criteria
Ratings Large caps Midcaps Small Caps
Buy Upside is above 10% Upside is above 15% Upside is above 20%
Accumulate - Upside is between 10%-15% Upside is between 10%-20%
Hold Upside is between 0% - 10% Upside is between 0%-10% Upside is between 0%-10%
Reduce/sell Downside is more than 0% Downside is more than 0% Downside is more than 0%
Not rated
Definition: Buy: Acquire at Current Market Price (CMP), with the target mentioned in the research note. Accumulate: Partial buying or to accumulate as CMP dips in the future. Hold: Hold the stock with the expected target mentioned in the note. Reduce: Reduce your exposure to the stock due to limited upside. Sell: Exit from the stock. Not rated: The analyst has no investment opinion on the stock.
To satisfy regulatory requirements, we attribute ‘Accumulate’ as Buy and ‘Reduce’ as Sell. The recommendations are based on 12 month horizon, unless otherwise specified. The investment ratings are on absolute positive/negative return basis. It is possible that due to volatile price fluctuation in the near to medium term, there could be a temporary mismatch to rating. For reasons of valuations/ return/lack of clarity/event we may revisit rating at appropriate time. Please note that the stock always carries the risk of being upgraded to BUY or downgraded to a HOLD, REDUCE or SELL.
General Disclosures and Disclaimers CERTIFICATION I, Rajin Rajan P author of this Report, hereby certify that all the views expressed in this research report reflect our personal views about any or all of the
subject issuer or securities. This report has been prepared by the Research Team of Geojit Financial Services Limited, hereinafter referred to as Geojit.
COMPANY OVERVIEW
Geojit, a publically listed company, is engaged in services of retail broking, depository services, portfolio management and marketing investment products
including mutual funds, insurance and properties. GEOJIT is a SEBI registered Research Entity and as such prepares and shares research data and reports
periodically with clients, investors, stake holders and general public in compliance with Securities and Exchange Board of India Act, 1992, Securities And
Exchange Board Of India (Research Analysts) Regulations, 2014 and/or any other applicable directives, instructions or guidelines issued by the Regulators
from time to time.
DISTRIBUTION OF REPORTS: This document is not for public distribution and has been furnished to you solely for your information and must not be
reproduced or redistributed to any other person. GEOJIT will not treat the recipients of this report as clients by virtue of their receiving this report.
GENERAL REPRESENTATION: The research reports do not constitute an offer or solicitation for the purchase or sale of any financial instruments,
inducements, promise, guarantee, warranty, or as an official confirmation of any transaction or contractual obligations of any kind. This report is provided
for assistance only and is not intended to be and must not alone be taken as the basis for an investment decision. The information contained herein is from
publicly available data or other sources believed to be reliable, but we do not represent that it is accurate or complete and it should not be relied on as
such. We have also reviewed the research report for any untrue statements of material facts or any false or misleading information. While we endeavor to
update on a reasonable basis the information discussed in this material, there may be regulatory, compliance, or other reasons that prevent us from doing
so.
RISK DISCLOSURE: GEOJIT and/or its Affiliates and its officers, directors and employees including the analyst/authors shall not be in any way be
responsible for any loss or damage that may arise to any person from any inadvertent error in the information contained in this report. Investors may lose
his/her entire investment under certain market conditions so before acting on any advice or recommendation in these material, investors should consider
400
600
800
1,000
1,200
1,400
1,600
Jul-17 Jan-18 Jul-18 Jan-19 Jul-19 Jan-20 Jul-20
Dates Rating Target
06-Nov-17 BUY 1,025
08-Feb-18 BUY 1,030
26-Apr-18 BUY 1,082
10-Aug-18 BUY 1,194
30-Oct-18 BUY 1,056
30-Jan-19 BUY 1,173
24-Jul-19 BUY 1,304
24-Oct-19 BUY 1,412
22-Jan-20 BUY 1,425
13-Apr-20 BUY 1,134
23-Jul-20 BUY 1,403

www.geojit.com
whether it is suitable for their particular circumstances and, if necessary, seek professional advice. This report does not take into account the specific
investment objectives, financial situation/circumstances and the particular needs of any specific person who may receive this document. The user assumes
the entire risk of any use made of this information. Each recipient of this report should make such investigation as it deems necessary to arrive at an
independent evaluation of an investment in the securities of companies referred to in this report (including the merits and risks involved). The price,
volume and income of the investments referred to in this report may fluctuate and investors may realize losses that may exceed their original capital.
FUNDAMENTAL DISCLAIMER: We have prepared this report based on information believed to be reliable. The recommendations herein are based on 12 month horizon, unless otherwise specified. The investment ratings are on absolute positive/negative return basis. It is possible that due to volatile price fluctuation in the near to medium term, there could be a temporary mismatch to rating. For reasons of valuations/return/lack of clarity/event we may revisit rating at appropriate time. The stocks always carry the risk of being upgraded to buy or downgraded to a hold, reduce or sell. The opinions expressed are subject to change but we have no obligation to tell our clients when our opinions or recommendations change. This report is non-inclusive and does not consider all the information that the recipients may consider material to investments. This report is issued by GEOJIT without any liability/undertaking/commitment on the part of itself or any of its entities. We may have issued or may issue on the companies covered herein, reports, recommendations or information which is contrary to those contained in this report. The projections and forecasts described in this report should be evaluated keeping in mind the fact that these are based on estimates and assumptions and will vary from actual results over a period of time. The actual performance of the companies represented in the report may vary from those projected. These are not scientifically proven to guarantee certain intended results and hence, are not published as a warranty and do not carry any evidentiary value whatsoever. These are not to be relied on in or as contractual, legal or tax advice. Prospective investors and others are cautioned that any forward-looking statements are not predictions and may be subject to change without notice. CRISIL has provided research support in preparation of this research report and the investment rational contained herein along with financial forecast. The target price and recommendation provided in the report are strictly Geojit’s views and are NOT PROVIDED by CRISIL. Further, CRISIL expresses no opinion on valuation and the associated recommendations. CRISIL has no financial liability whatsoever, to the subscribers / users of this report. JURISDICTION: The securities described herein may not be eligible for sale in all jurisdictions or to all categories of investors. The countries in which the companies mentioned in this report are organized may have restrictions on investments, voting rights or dealings in securities by nationals of other countries. Distributing/taking/sending/dispatching/transmitting this document in certain foreign jurisdictions may be restricted by law, and persons into whose possession this document comes should inform themselves about, and observe any such restrictions. Failure to comply with this restriction may constitute a violation of any foreign jurisdiction laws. Foreign currencies denominated securities are subject to fluctuations in exchange rates that could have an adverse effect on the value or price of or income derived from the investment. Investors in securities such as ADRs, the value of which are influenced by foreign currencies effectively assume currency risk. REGULATORY DISCLOSURES: GEOJIT’s Associates consists of privately held companies such as Geojit Technologies Private Limited (GTPL- Software Solutions provider), Geojit Credits Private Limited (GCPL- NBFC Services provider), Geojit Investment Services Limited (GISL- Corporate Agent for Insurance products), Geojit Financial Management Services Private Limited (GFMSL) & Geojit Financial Distribution Private Limited (GFDPL), (Distributors of Insurance and MF Units).In the context of the SEBI Regulations on Research Analysts (2014), GEOJIT affirms that we are a SEBI registered Research Entity and in the course of our business as a stock market intermediary, we issue research reports /research analysis etc that are prepared by our Research Analysts. We also affirm and undertake that no disciplinary action has been taken against us or our Analysts in connection with our business activities. In compliance with the above mentioned SEBI Regulations, the following additional disclosures are also provided which may be considered by the reader before making an investment decision: 1. Disclosures regarding Ownership*: GEOJIT confirms that: It/its associates have no financial interest or any other material conflict in relation to the subject company (ies) covered herein. It/its associates have no actual beneficial ownership greater than 1% in relation to the subject company (ies) covered herein. Further, the Analyst confirms that: He, his associates and his relatives have financial interest in the subject company (ies) covered herein, and they have no other material conflict in the subject company. He, his associates and his relatives have no actual/beneficial ownership greater than 1% in the subject company covered 2. Disclosures regarding Compensation: During the past 12 months, GEOJIT or its Associates: (a) Have not received any compensation from the subject company; (b) Have not managed or co-managed public offering of securities for the subject company (c) Have not received any compensation for investment banking or merchant banking or brokerage services from the subject company (d) Have not received any compensation for products or services other than investment banking or merchant banking or brokerage services from the subject company and is in receipt of compensation from the subject company.” (e) Have not received any compensation or other benefits from the subject company or third party in connection with the research report (f) The subject company is / was not a client during twelve months preceding the date of distribution of the research report. 3. Disclosure by GEOJIT regarding the compensation paid to its Research Analyst: GEOJIT hereby confirms that no part of the compensation paid to the persons employed by it as Research Analysts is based on any specific brokerage services or transactions pertaining to trading in securities of companies contained in the Research Reports. 4. Disclosure regarding the Research Analyst’s connection with the subject company: It is affirmed that I,Rajin Rajan P, Research Analyst(s) of GEOJIT have not served as an officer, director or employee of the subject company 5. Disclosure regarding Market Making activity: Neither GEOJIT/its Analysts have engaged in market making activities for the subject company. Please ensure that you have read the “Risk Disclosure Documents for Capital Market and Derivatives Segments” as prescribed by the Securities and Exchange Board of India before investing.
Geojit Financial Services Ltd. (formerly known as Geojit BNP Paribas Financial Services Ltd.), Registered Office: 34/659-P, Civil Line Road, Padivattom,
Kochi-682024, Kerala, India. Phone: +91 484-2901000, Website: www.geojit.com. For investor queries: [email protected], For grievances:
[email protected], For compliance officer: [email protected].
Corporate Identity Number: L67120KL1994PLC008403, SEBI Stock Broker Registration No INZ000104737, Research Entity SEBI Reg No:
INH200000345, Investment Adviser SEBI Reg No: INA200002817, Portfolio Manager: INP000003203, Depository Participant: IN-DP-325-2017, ARN
Regn.Nos:0098, IRDA Corporate Agent (Composite) No.: CA0226