Embed Size (px)
Citation preview
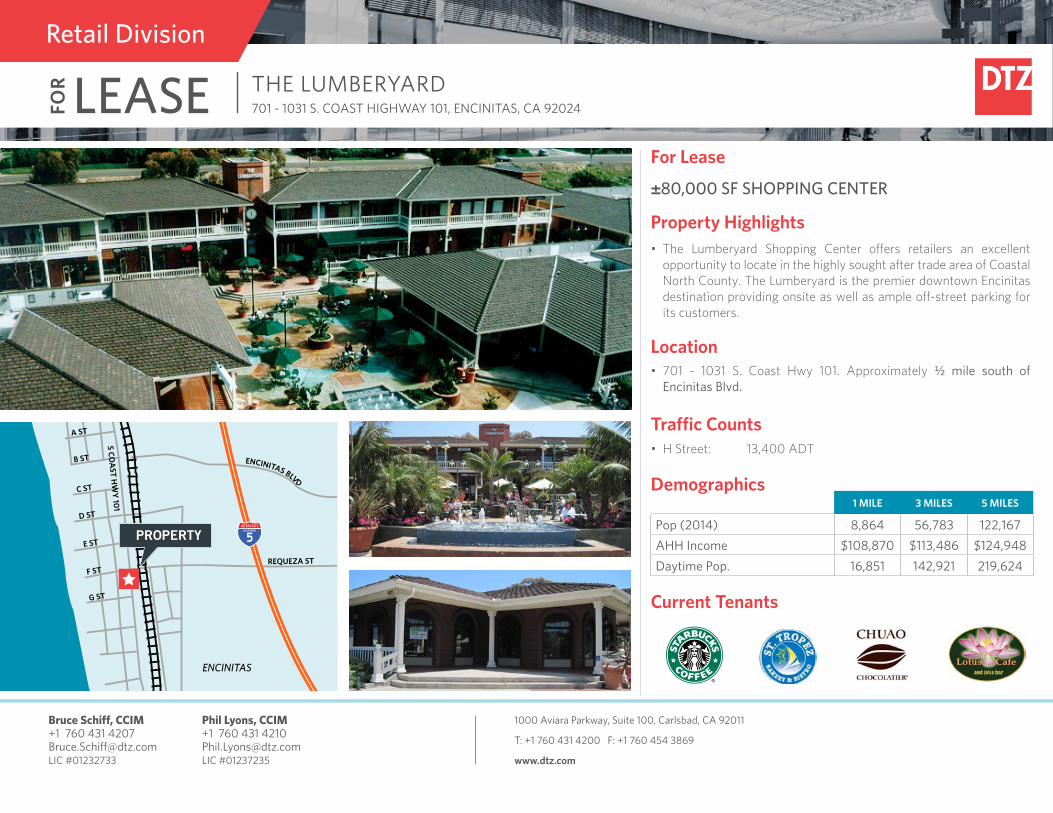
FOR LEASE THE LUMBERYARD
701 - 1031 S. COAST HIGHWAY 101, ENCINITAS, CA 92024
Retail Division
Bruce Schiff, CCIM +1 760 431 4207 [email protected] LIC #01232733
1000 Aviara Parkway, Suite 100, Carlsbad, CA 92011
T: +1 760 431 4200 F: +1 760 454 3869
www.dtz.com
Phil Lyons, CCIM +1 760 431 4210 [email protected] LIC #01237235
For Lease
• The Lumberyard Shopping Center offers retailers an excellent opportunity to locate in the highly sought after trade area of Coastal North County. The Lumberyard is the premier downtown Encinitas destination providing onsite as well as ample off-street parking for its customers.
Property Highlights
• 701 - 1031 S. Coast Hwy 101. Approximately ½ mile south of Encinitas Blvd.
Location
Traffic Counts• H Street: 13,400 ADT
±80,000 SF SHOPPING CENTER
1 MILE 3 MILES 5 MILES
Pop (2014) 8,864 56,783 122,167AHH Income $108,870 $113,486 $124,948Daytime Pop. 16,851 142,921 219,624
Demographics
ENCINITAS
ENCINITAS BLVD
REQUEZA ST
S COA
ST HW
Y 101
A ST
B ST
C ST
D ST
E ST
F ST
G ST Current Tenants
PROPERTY
FOR LEASE THE LUMBERYARD
701 - 1031 S. COAST HIGHWAY 101, ENCINITAS, CA 92024
Retail Division
Bruce Schiff, CCIM +1 760 431 4207 [email protected] LIC #01232733
1000 Aviara Parkway, Suite 100, Carlsbad, CA 92011
T: +1 760 431 4200 F: +1 760 454 3869
www.dtz.com
Phil Lyons, CCIM +1 760 431 4210 [email protected] LIC #01237235
DISCLAIMER: This drawing is for general information purposes only. Any and all features, matters and other information depicted hereon or contained herein are for illustrative marketing purposes only, are subject to modification without notice, are not intended to be relied upon by any party and are not intended to constitute representations and warranties as to the size and nature of improvements to be constructed (or that any improvements will be constructed) or as to the identity or nature of any occupants thereof.
The information contained herein has been given to us by the owner of the property or other sources we deem reliable. We have no reason to doubt its accuracy, but we do not guarantee it. All information should be verified prior to purchase or lease. K:\_Retail Packages\Lumberyard\Flyers\Lumberyard-DTZ.indd
C10
3
C10
2
C10
0
J104
J103
J101
H10
6
H10
4H
101
F103
-F1
04
F101
F102
E10
0C
110
C10
9C
108
C10
7C
106
C20
9
C20
8
C20
6
C20
2
C20
5
C20
1
B10
9B
108
B10
7
B10
4
B10
1
B103
A10
1
A102
Upper Level
S. COAST HWY. 101
N
B10
5
J102K
100
Cou
rt-
Yard
D101
D10
2
D10
3
K10
3
Not
a
part
F105 C
101
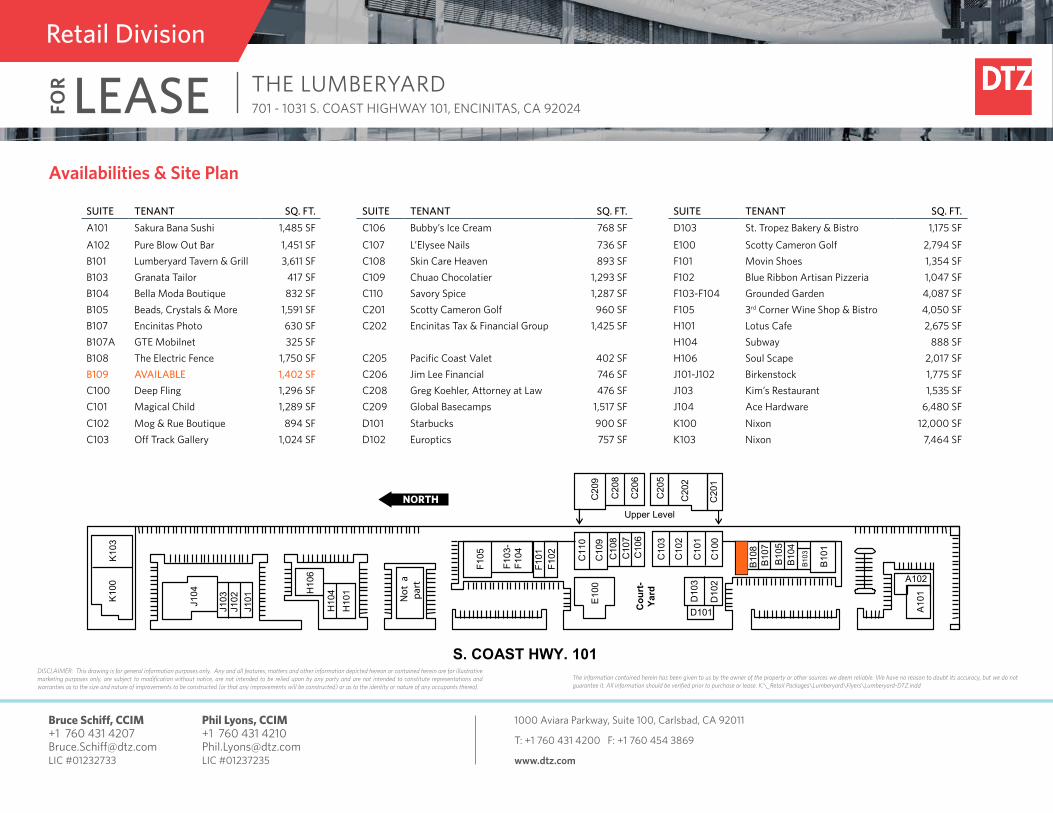
SUITE TENANT SQ. FT. SUITE TENANT SQ. FT. SUITE TENANT SQ. FT.A101 Sakura Bana Sushi 1,485 SF C106 Bubby’s Ice Cream 768 SF D103 St. Tropez Bakery & Bistro 1,175 SF
A102 Pure Blow Out Bar 1,451 SF C107 L’Elysee Nails 736 SF E100 Scotty Cameron Golf 2,794 SFB101 Lumberyard Tavern & Grill 3,611 SF C108 Skin Care Heaven 893 SF F101 Movin Shoes 1,354 SFB103 Granata Tailor 417 SF C109 Chuao Chocolatier 1,293 SF F102 Blue Ribbon Artisan Pizzeria 1,047 SFB104 Bella Moda Boutique 832 SF C110 Savory Spice 1,287 SF F103-F104 Grounded Garden 4,087 SFB105 Beads, Crystals & More 1,591 SF C201 Scotty Cameron Golf 960 SF F105 3rd Corner Wine Shop & Bistro 4,050 SFB107 Encinitas Photo 630 SF C202 Encinitas Tax & Financial Group 1,425 SF H101 Lotus Cafe 2,675 SFB107A GTE Mobilnet 325 SF H104 Subway 888 SFB108 The Electric Fence 1,750 SF C205 Pacific Coast Valet 402 SF H106 Soul Scape 2,017 SFB109 AVAILABLE 1,402 SF C206 Jim Lee Financial 746 SF J101-J102 Birkenstock 1,775 SFC100 Deep Fling 1,296 SF C208 Greg Koehler, Attorney at Law 476 SF J103 Kim’s Restaurant 1,535 SFC101 Magical Child 1,289 SF C209 Global Basecamps 1,517 SF J104 Ace Hardware 6,480 SFC102 Mog & Rue Boutique 894 SF D101 Starbucks 900 SF K100 Nixon 12,000 SFC103 Off Track Gallery 1,024 SF D102 Europtics 757 SF K103 Nixon 7,464 SF
Availabilities & Site Plan
NORTH
FOR LEASE THE LUMBERYARD
701 - 1031 S. COAST HIGHWAY 101, ENCINITAS, CA 92024
Retail Division
Bruce Schiff, CCIM +1 760 431 4207 [email protected] LIC #01232733
1000 Aviara Parkway, Suite 100, Carlsbad, CA 92011
T: +1 760 431 4200 F: +1 760 454 3869
www.dtz.com
Phil Lyons, CCIM +1 760 431 4210 [email protected] LIC #01237235
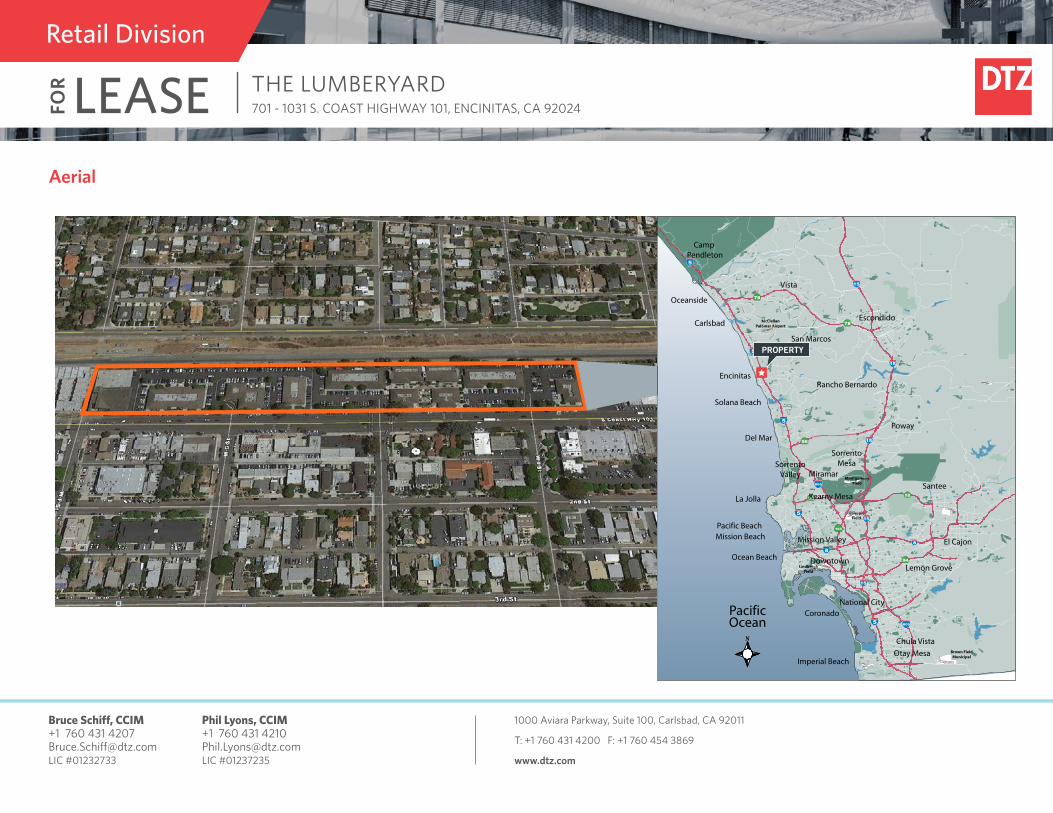
Aerial
MontgomeryField
GillespieField
McClellanPalomar Airport
Brown FieldMunicipal
LindberghField
Cloel ge
dvlB
Adnol
r Waya
E aCl mRoni
eal
P la om Ara irport Rd
Pio
sn ettiaLn
aClEm
inR
oeal
EluF
rete
St
La Costa Ave
Pase
Doe
Nlorte
Tamarack A ev
El Cani
mo
eR al
Elm Ave
Marron Rd
Ran
aSohc
ntaeF
dR
W Washingto Anev
iMWssion evA
E Vlla ey Pkwy
9Wt Ah
ev
BeVraal
yelkPw
y
aSP
nas
uqal
Rd
E lEroNte P wk y
EarG
nvAd
e
ES
soc ndid
Bo
vl d
SM
els
ore
Dr
Syca om r vAee
suB
ien ss
Parkr
D
Palo am r Airport Rd
naRS
hco
Sant
aeF
Rd
Qhtseu
aveRn
d
Elfin Ferost Rd
Shadr
woid
De
gr
S naS ta eF Ave
Lake Blvd
Clol
gee
Bvl
d
Sunset Dr
Snu
ste
Dr
Mar V tsiDa
r
Se
Morl
Desr
S
tnaSa Fe Ave
Buena CreekdR
Poin
sett
iaAv
e.
5
5
5
5
5
78
78
15
15
15
15
15
805
805
94
8
8
5252
56
163
Oceanside
CampPendleton
Carlsbad
Encinitas
Solana Beach
Del Mar
La Jolla
Pacific BeachMission Beach
Ocean Beach
Coronado
Imperial BeachOtay Mesa
Chula Vista
National City
Downtown
Mission Valley
Kearny Mesa
Miramar
SorrentoMesaSorrento
Valley
Poway
Rancho Bernardo
Escondido
Vista
San Marcos
El Cajon
Santee
Lemon Grove
PacificOcean
PROPERTY
FOR LEASE THE LUMBERYARD
701 - 1031 S. COAST HIGHWAY 101, ENCINITAS, CA 92024
Retail Division
Bruce Schiff, CCIM +1 760 431 4207 [email protected] LIC #01232733
1000 Aviara Parkway, Suite 100, Carlsbad, CA 92011
T: +1 760 431 4200 F: +1 760 454 3869
www.dtz.com
Phil Lyons, CCIM +1 760 431 4210 [email protected] LIC #01237235
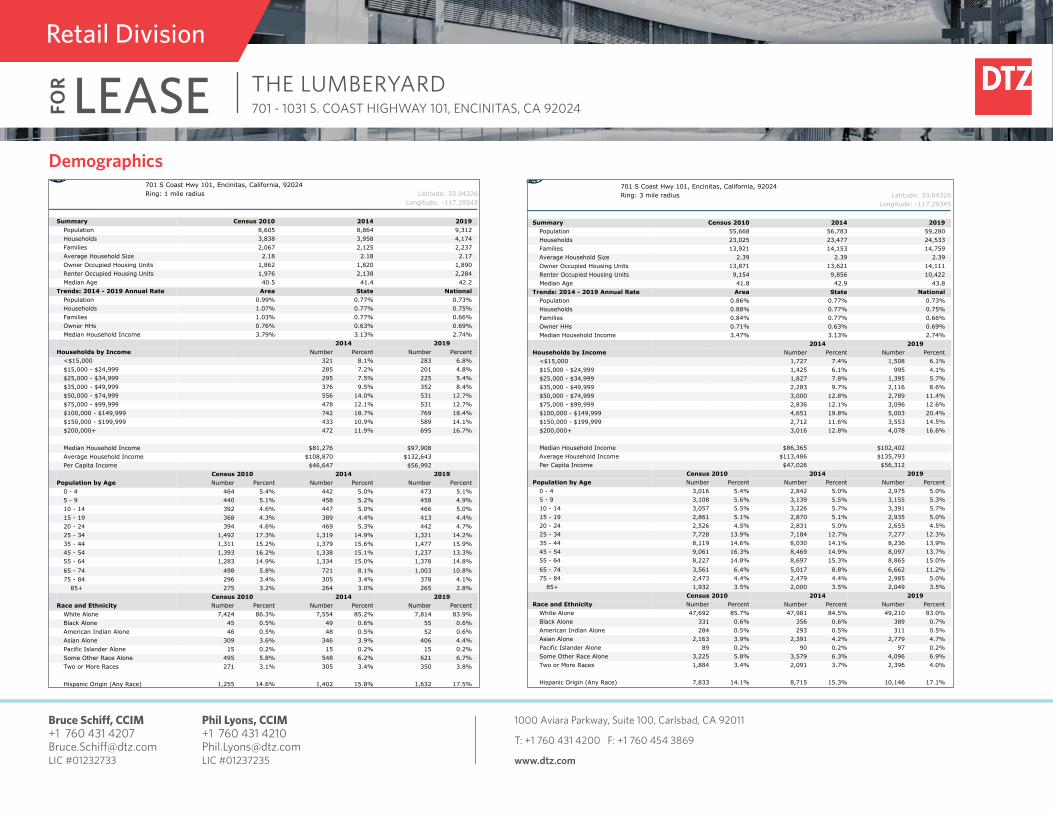
Demographic and Income Profile701 S Coast Hwy 101, Encinitas, California, 92024Ring: 1 mile radius Latitude: 33.04326
Longitude: -117.29345
Summary Census 2010 2014 2019Population 8,605 8,864 9,312Households 3,838 3,958 4,174Families 2,067 2,125 2,237Average Household Size 2.18 2.18 2.17Owner Occupied Housing Units 1,862 1,820 1,890Renter Occupied Housing Units 1,976 2,138 2,284Median Age 40.5 41.4 42.2
Trends: 2014 - 2019 Annual Rate Area State NationalPopulation 0.99% 0.77% 0.73%Households 1.07% 0.77% 0.75%Families 1.03% 0.77% 0.66%Owner HHs 0.76% 0.63% 0.69%Median Household Income 3.79% 3.13% 2.74%
2014 2019 Households by Income Number Percent Number Percent
<$15,000 321 8.1% 283 6.8%$15,000 - $24,999 285 7.2% 201 4.8%$25,000 - $34,999 295 7.5% 225 5.4%$35,000 - $49,999 376 9.5% 352 8.4%$50,000 - $74,999 556 14.0% 531 12.7%$75,000 - $99,999 478 12.1% 531 12.7%$100,000 - $149,999 742 18.7% 769 18.4%$150,000 - $199,999 433 10.9% 589 14.1%$200,000+ 472 11.9% 695 16.7%
Median Household Income $81,276 $97,908Average Household Income $108,870 $132,643Per Capita Income $46,647 $56,992
Census 2010 2014 2019 Population by Age Number Percent Number Percent Number Percent
0 - 4 464 5.4% 442 5.0% 473 5.1%5 - 9 440 5.1% 458 5.2% 458 4.9%10 - 14 392 4.6% 447 5.0% 466 5.0%15 - 19 368 4.3% 389 4.4% 413 4.4%20 - 24 394 4.6% 469 5.3% 442 4.7%25 - 34 1,492 17.3% 1,319 14.9% 1,321 14.2%35 - 44 1,311 15.2% 1,379 15.6% 1,477 15.9%45 - 54 1,393 16.2% 1,338 15.1% 1,237 13.3%55 - 64 1,283 14.9% 1,334 15.0% 1,378 14.8%65 - 74 498 5.8% 721 8.1% 1,003 10.8%75 - 84 296 3.4% 305 3.4% 378 4.1%
85+ 275 3.2% 264 3.0% 265 2.8%Census 2010 2014 2019
Race and Ethnicity Number Percent Number Percent Number PercentWhite Alone 7,424 86.3% 7,554 85.2% 7,814 83.9%Black Alone 45 0.5% 49 0.6% 55 0.6%American Indian Alone 46 0.5% 48 0.5% 52 0.6%Asian Alone 309 3.6% 346 3.9% 406 4.4%Pacific Islander Alone 15 0.2% 15 0.2% 15 0.2%Some Other Race Alone 495 5.8% 548 6.2% 621 6.7%Two or More Races 271 3.1% 305 3.4% 350 3.8%
Hispanic Origin (Any Race) 1,255 14.6% 1,402 15.8% 1,632 17.5%Data Note: Income is expressed in current dollars.
Source: U.S. Census Bureau, Census 2010 Summary File 1. Esri forecasts for 2014 and 2019.
August 19, 2014
©2014 Esri Page 1 of 6
Demographic and Income Profile701 S Coast Hwy 101, Encinitas, California, 92024Ring: 3 mile radius Latitude: 33.04326
Longitude: -117.29345
Summary Census 2010 2014 2019Population 55,668 56,783 59,280Households 23,025 23,477 24,533Families 13,921 14,153 14,759Average Household Size 2.39 2.39 2.39Owner Occupied Housing Units 13,871 13,621 14,111Renter Occupied Housing Units 9,154 9,856 10,422Median Age 41.8 42.9 43.8
Trends: 2014 - 2019 Annual Rate Area State NationalPopulation 0.86% 0.77% 0.73%Households 0.88% 0.77% 0.75%Families 0.84% 0.77% 0.66%Owner HHs 0.71% 0.63% 0.69%Median Household Income 3.47% 3.13% 2.74%
2014 2019 Households by Income Number Percent Number Percent
<$15,000 1,727 7.4% 1,508 6.1%$15,000 - $24,999 1,425 6.1% 995 4.1%$25,000 - $34,999 1,827 7.8% 1,395 5.7%$35,000 - $49,999 2,283 9.7% 2,116 8.6%$50,000 - $74,999 3,000 12.8% 2,789 11.4%$75,000 - $99,999 2,836 12.1% 3,096 12.6%$100,000 - $149,999 4,651 19.8% 5,003 20.4%$150,000 - $199,999 2,712 11.6% 3,553 14.5%$200,000+ 3,016 12.8% 4,078 16.6%
Median Household Income $86,365 $102,402Average Household Income $113,486 $135,793Per Capita Income $47,026 $56,312
Census 2010 2014 2019 Population by Age Number Percent Number Percent Number Percent
0 - 4 3,016 5.4% 2,842 5.0% 2,975 5.0%5 - 9 3,108 5.6% 3,139 5.5% 3,155 5.3%10 - 14 3,057 5.5% 3,226 5.7% 3,391 5.7%15 - 19 2,861 5.1% 2,870 5.1% 2,935 5.0%20 - 24 2,526 4.5% 2,831 5.0% 2,655 4.5%25 - 34 7,728 13.9% 7,184 12.7% 7,277 12.3%35 - 44 8,119 14.6% 8,030 14.1% 8,236 13.9%45 - 54 9,061 16.3% 8,469 14.9% 8,097 13.7%55 - 64 8,227 14.8% 8,697 15.3% 8,865 15.0%65 - 74 3,561 6.4% 5,017 8.8% 6,662 11.2%75 - 84 2,473 4.4% 2,479 4.4% 2,985 5.0%
85+ 1,932 3.5% 2,000 3.5% 2,049 3.5%Census 2010 2014 2019
Race and Ethnicity Number Percent Number Percent Number PercentWhite Alone 47,692 85.7% 47,981 84.5% 49,210 83.0%Black Alone 331 0.6% 356 0.6% 389 0.7%American Indian Alone 284 0.5% 293 0.5% 311 0.5%Asian Alone 2,163 3.9% 2,391 4.2% 2,779 4.7%Pacific Islander Alone 89 0.2% 90 0.2% 97 0.2%Some Other Race Alone 3,225 5.8% 3,579 6.3% 4,096 6.9%Two or More Races 1,884 3.4% 2,091 3.7% 2,396 4.0%
Hispanic Origin (Any Race) 7,833 14.1% 8,715 15.3% 10,146 17.1%Data Note: Income is expressed in current dollars.
Source: U.S. Census Bureau, Census 2010 Summary File 1. Esri forecasts for 2014 and 2019.
August 19, 2014
©2014 Esri Page 3 of 6
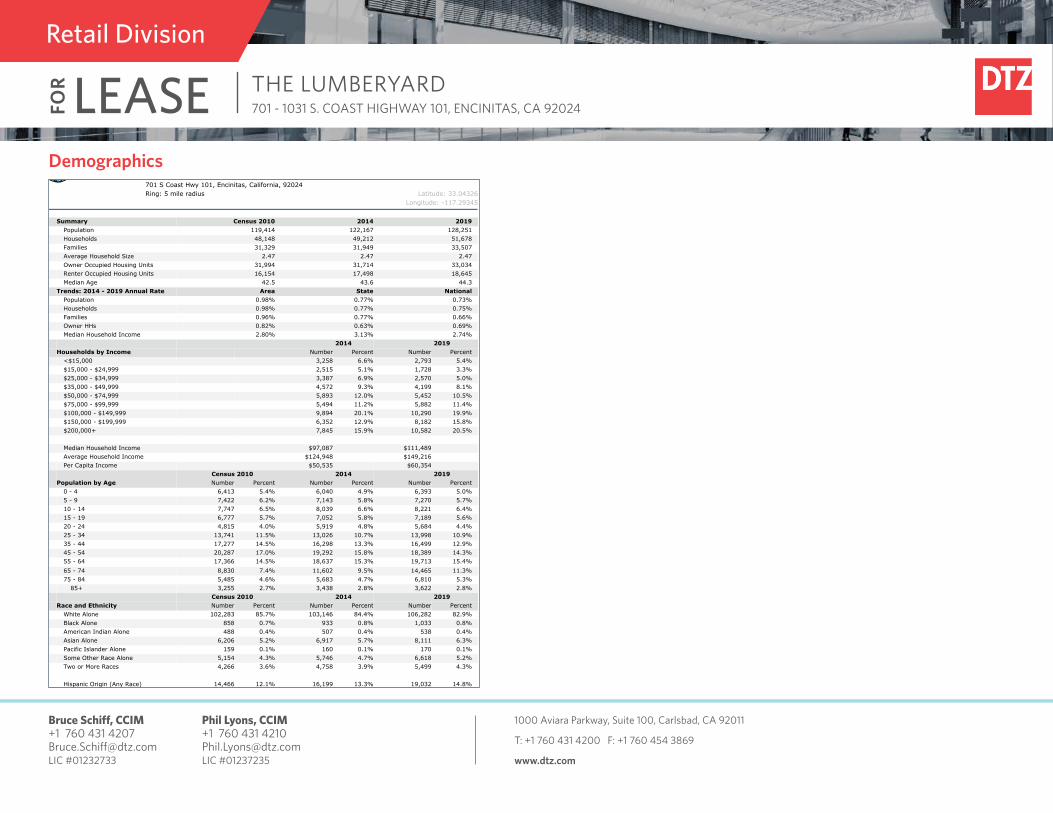
Demographics
FOR LEASE THE LUMBERYARD
701 - 1031 S. COAST HIGHWAY 101, ENCINITAS, CA 92024
Retail Division
Bruce Schiff, CCIM +1 760 431 4207 [email protected] LIC #01232733
1000 Aviara Parkway, Suite 100, Carlsbad, CA 92011
T: +1 760 431 4200 F: +1 760 454 3869
www.dtz.com
Phil Lyons, CCIM +1 760 431 4210 [email protected] LIC #01237235
DemographicsDemographic and Income Profile701 S Coast Hwy 101, Encinitas, California, 92024Ring: 5 mile radius Latitude: 33.04326
Longitude: -117.29345
Summary Census 2010 2014 2019Population 119,414 122,167 128,251Households 48,148 49,212 51,678Families 31,329 31,949 33,507Average Household Size 2.47 2.47 2.47Owner Occupied Housing Units 31,994 31,714 33,034Renter Occupied Housing Units 16,154 17,498 18,645Median Age 42.5 43.6 44.3
Trends: 2014 - 2019 Annual Rate Area State NationalPopulation 0.98% 0.77% 0.73%Households 0.98% 0.77% 0.75%Families 0.96% 0.77% 0.66%Owner HHs 0.82% 0.63% 0.69%Median Household Income 2.80% 3.13% 2.74%
2014 2019 Households by Income Number Percent Number Percent
<$15,000 3,258 6.6% 2,793 5.4%$15,000 - $24,999 2,515 5.1% 1,728 3.3%$25,000 - $34,999 3,387 6.9% 2,570 5.0%$35,000 - $49,999 4,572 9.3% 4,199 8.1%$50,000 - $74,999 5,893 12.0% 5,452 10.5%$75,000 - $99,999 5,494 11.2% 5,882 11.4%$100,000 - $149,999 9,894 20.1% 10,290 19.9%$150,000 - $199,999 6,352 12.9% 8,182 15.8%$200,000+ 7,845 15.9% 10,582 20.5%
Median Household Income $97,087 $111,489Average Household Income $124,948 $149,216Per Capita Income $50,535 $60,354
Census 2010 2014 2019 Population by Age Number Percent Number Percent Number Percent
0 - 4 6,413 5.4% 6,040 4.9% 6,393 5.0%5 - 9 7,422 6.2% 7,143 5.8% 7,270 5.7%10 - 14 7,747 6.5% 8,039 6.6% 8,221 6.4%15 - 19 6,777 5.7% 7,052 5.8% 7,189 5.6%20 - 24 4,815 4.0% 5,919 4.8% 5,684 4.4%25 - 34 13,741 11.5% 13,026 10.7% 13,998 10.9%35 - 44 17,277 14.5% 16,298 13.3% 16,499 12.9%45 - 54 20,287 17.0% 19,292 15.8% 18,389 14.3%55 - 64 17,366 14.5% 18,637 15.3% 19,713 15.4%65 - 74 8,830 7.4% 11,602 9.5% 14,465 11.3%75 - 84 5,485 4.6% 5,683 4.7% 6,810 5.3%
85+ 3,255 2.7% 3,438 2.8% 3,622 2.8%Census 2010 2014 2019
Race and Ethnicity Number Percent Number Percent Number PercentWhite Alone 102,283 85.7% 103,146 84.4% 106,282 82.9%Black Alone 858 0.7% 933 0.8% 1,033 0.8%American Indian Alone 488 0.4% 507 0.4% 538 0.4%Asian Alone 6,206 5.2% 6,917 5.7% 8,111 6.3%Pacific Islander Alone 159 0.1% 160 0.1% 170 0.1%Some Other Race Alone 5,154 4.3% 5,746 4.7% 6,618 5.2%Two or More Races 4,266 3.6% 4,758 3.9% 5,499 4.3%
Hispanic Origin (Any Race) 14,466 12.1% 16,199 13.3% 19,032 14.8%Data Note: Income is expressed in current dollars.
Source: U.S. Census Bureau, Census 2010 Summary File 1. Esri forecasts for 2014 and 2019.
August 19, 2014
©2014 Esri Page 5 of 6


![LEASE AGREEMENT [LEASE] - Connecticut](https://img.pdfslide.us/doc/110x75/620739c849d709492c2f377a/lease-agreement-lease-connecticut.jpg)