Embed Size (px)
Citation preview

International Journal of Economics, Commerce and Management United Kingdom Vol. V, Issue 12, December 2017
Licensed under Creative Common Page 527
http://ijecm.co.uk/ ISSN 2348 0386
RETAIL CHAIN STORE: PRESENT SCENARIO IN
SYLHET DISTRICT OF BANGLADESH
Md. Shaikh Farid
Lecturer, Dept. of Agricultural Marketing and Business Management
Sylhet Agricultural University, Sylhet, Bangladesh
Mohammad Jahangir Alam
Professor, Dept. of Agribusiness and Marketing
Bangladesh Agricultural University, Mymensingh, Bangladesh
Md. Mostafizur Rahman
Assistant Professor, Dept. of Agricultural Marketing and Business Management
Sylhet Agricultural University, Sylhet, Bangladesh
Swarup Barua
Lecturer, Dept. of Agricultural Marketing and Business Management
Sylhet Agricultural University, Sylhet, Bangladesh
Subrata Koiry
Lecturer, Dept. of Agricultural Finace and Banking
Sylhet Agricultural University, Sylhet, Bangladesh

© Farid, Alam, Rahman, Barua & Koiry
Licensed under Creative Common Page 528
Abstract
It was an attempt to examine the present scenario of retail chain store in Sylhet district of
Bangladesh. Secondary data were collected from published books, various published articles,
websites of different superstores etc. Primary data were collected from 100 customers during
the months of September to October, 2016. Simple descriptive statistics and inferential statistics
were used to analyze the data. The study depicts that most of the customers have positive
perception. Highest discriminating power (DP) obtained for the second statement (located near
to your residents) and lowest for the first statement (offer a wide variety of products). In case of
favourableness and un- favourableness, 89 percent showed favoured attitude while 11 percent
have disfavoured attitude. The correlation coefficient between age, income and distance were
statistically significant at 10 percent and 1 percent level of significance. The KII identified six
most prominent channels. Based on KII the most important channel identified is Farmer –
Collectors – Supermarket - Consumers.
Keywords: Retail chain store, Present Scenario, Likert Scale, KII (Key informant interview),
Sylhet-Bangladesh
INTRODUCTION
The rapid rise of supermarkets in the developing countries has been documented in various
studies (Trail 2006, Dries et al. 2004, Reardon and Berdegue 2002, Reardon et al. 2003, Hu et
al. 2004, Reardon and Hopkins 2006, Godron et al. 2004). In Bangladesh supermarkets have
successfully made a breakthrough in the urban lifestyle with the idea of all essential
commodities under one roof. From the concept of global retailers such as Wal-Mart, Safeway
and Sears, some private organizations have established the retail chain store services in
Bangladesh. Rahimafrooz Superstores Ltd. (RSL) was the first one to launch the first ever retail
chain in Bangladesh in the year 2001.Retail trade is a traditional business in Bangladesh. Its
expansion is keeping pace with the country’s population growth and changes in consumption
patterns which promote economic growth in Bangladesh. This expansion has not been
structurally organized. Until recently, retail had never been perceived as an industry, but rather
as an individual or family business with a very limited scope for organized expansion. Little to no
market information is available on the retail sector, though industry sources indicate that the
size of the food retail sector in Bangladesh could have been $16 billion in 2010, and the number
of retail grocery shops could number more than 1 million. Retail chain store is a large source of
employment in Bangladesh (12 percent), and together with wholesaling it contributed a
International Journal of Economics, Commerce and Management, United Kingdom
Licensed under Creative Common Page 529
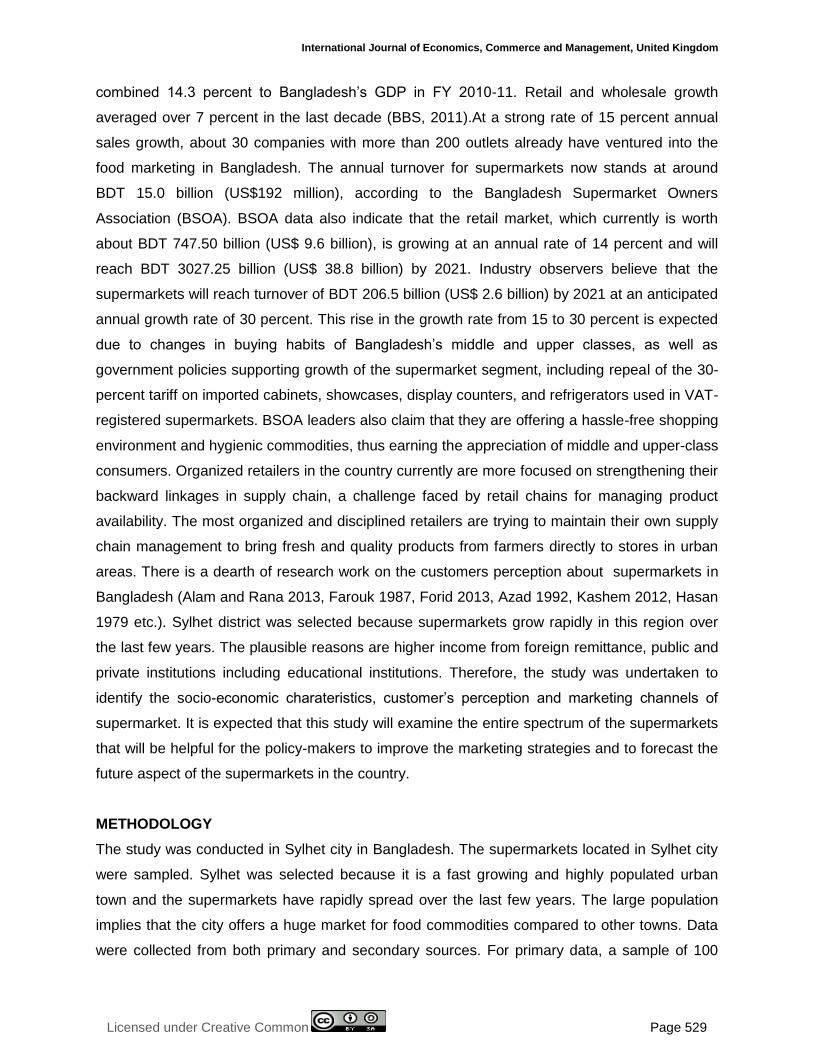
combined 14.3 percent to Bangladesh’s GDP in FY 2010-11. Retail and wholesale growth
averaged over 7 percent in the last decade (BBS, 2011).At a strong rate of 15 percent annual
sales growth, about 30 companies with more than 200 outlets already have ventured into the
food marketing in Bangladesh. The annual turnover for supermarkets now stands at around
BDT 15.0 billion (US$192 million), according to the Bangladesh Supermarket Owners
Association (BSOA). BSOA data also indicate that the retail market, which currently is worth
about BDT 747.50 billion (US$ 9.6 billion), is growing at an annual rate of 14 percent and will
reach BDT 3027.25 billion (US$ 38.8 billion) by 2021. Industry observers believe that the
supermarkets will reach turnover of BDT 206.5 billion (US$ 2.6 billion) by 2021 at an anticipated
annual growth rate of 30 percent. This rise in the growth rate from 15 to 30 percent is expected
due to changes in buying habits of Bangladesh’s middle and upper classes, as well as
government policies supporting growth of the supermarket segment, including repeal of the 30-
percent tariff on imported cabinets, showcases, display counters, and refrigerators used in VAT-
registered supermarkets. BSOA leaders also claim that they are offering a hassle-free shopping
environment and hygienic commodities, thus earning the appreciation of middle and upper-class
consumers. Organized retailers in the country currently are more focused on strengthening their
backward linkages in supply chain, a challenge faced by retail chains for managing product
availability. The most organized and disciplined retailers are trying to maintain their own supply
chain management to bring fresh and quality products from farmers directly to stores in urban
areas. There is a dearth of research work on the customers perception about supermarkets in
Bangladesh (Alam and Rana 2013, Farouk 1987, Forid 2013, Azad 1992, Kashem 2012, Hasan
1979 etc.). Sylhet district was selected because supermarkets grow rapidly in this region over
the last few years. The plausible reasons are higher income from foreign remittance, public and
private institutions including educational institutions. Therefore, the study was undertaken to
identify the socio-economic charateristics, customer’s perception and marketing channels of
supermarket. It is expected that this study will examine the entire spectrum of the supermarkets
that will be helpful for the policy-makers to improve the marketing strategies and to forecast the
future aspect of the supermarkets in the country.
METHODOLOGY
The study was conducted in Sylhet city in Bangladesh. The supermarkets located in Sylhet city
were sampled. Sylhet was selected because it is a fast growing and highly populated urban
town and the supermarkets have rapidly spread over the last few years. The large population
implies that the city offers a huge market for food commodities compared to other towns. Data
were collected from both primary and secondary sources. For primary data, a sample of 100

© Farid, Alam, Rahman, Barua & Koiry
Licensed under Creative Common Page 530
customers was selected by using mall intercept sampling technique through direct personal
interview from the respondents during the month of September to October, 2016. Secondary
data and other relevant information were collected from supermarkets reports, Journals,
publications, Bangladesh Supermarket Owners Association (BSOA) and others. In order to
achieve the objectives, descriptive statisticsand inferential statistics were used.
Likert scale was used to examine perception of the customers about supermarkets.
Predetermined opinions were presented to the respondents and the Likert scaling technique
was used to rate the opinions. Each opinion was given a scale of one to five such as strongly
agree takes a scale of 5, agree a scale of 4, neutral 3, disagree a scale of 2, and strongly
disagree a scale of 1. For determining discriminating power (Ataur, 2015) the following formula
was used:
DP=Q3-Q1
Where,
DP= Discriminating Power
Weighted total, (Q3) =Score × Number who check that score
Weighted mean, (Q1) = Weighted total/ Number in group
RESULTS AND DISCUSSION
Socio-economic Characteristics of customers
In this section, information about age, education, occupation, family size, income was
considered to examine the socioeconomic characteristics. These aspects are important for the
readers because it relevant to understand about the customer level of living, socio-economic
environment in which they live and the nature and the content of their participation in economic
activities. Some of the criteria of these socio-economic characteristics are discussed below:
Table 1. Socio-economic Characteristics of customers
Items Percent of total
Age group 18-25 21
26-35 50
36-45 16
Above 45 13
Household Size Up to 2 13
3 to 4 48
5 to 6 24
Above 6 15

International Journal of Economics, Commerce and Management, United Kingdom
Licensed under Creative Common Page 531
Education level Secondary 7
Higher Secondary 16
Graduate 36
Post Graduate 38
No Education 2
Occupation Student 12
Housewife 10
Govt. Employee 33
Business 20
Others 25
Income Above 15000 16
16000-30000 12
31000-45000 28
Above 45000 44
Age group of customers
The selected customers were grouped into four categories according to their ages. The different
age groups of the customers are presented in Table 1. The highest number of customers (50
percent) came from the age group 26-35 and the lowest customers (13 percent) came from the
group above 45 years. It indicates that most of the sampled customer belonged to active age
range in human life cycle. They always try to accept different taste and fashion throughout their
life cycle. There might be close relation for the growth of supermarket with the age of the
customers. Since 26-35 age group is considered more active and innovative in the life cycle
stage. They prefer to accept the taste of supermarket. They think purchasing daily necessaries
from traditional market is more time consuming and at the same time it is quite difficult from
them to judge the quality of product from traditional market. So this age group finds it accessible
and profitable to go to supermarket.
Family size of customers
A family in the present study was revealed as a group of individuals living together, taking
united and living under the control of one as its head. The family includes respondent himself or
herself, husband, wife, sons, unmarried daughters, father and mother, brothers and unmarried
sisters. The family size of supermarket customer was 13 percent for up to 2, 48 percent for 3 to
4, 24 percent for 5 to 6 and 15 percent for above 6 respectively. The larger the family size, the
more pressing need to buy essential commodities for maintaining minimum social standard. In
Table 1...

© Farid, Alam, Rahman, Barua & Koiry
Licensed under Creative Common Page 532
that case the head of household find it more profitable to go to market where all the necessary
are available under a single roof.
Education level of supermarket customer
Education plays a crucial role in development acceleration of a country. Table 1 shows different
categories of customer according to the level of education. It is clear from the table that most of
the customer completed their minimum level of education. The table 1 shows that 7 percent
customer completed secondary level, 16 percent customer completed higher secondary level,
36 percent completed graduation, 38 percent are post graduate and 2 percent have no
education. Educated people are highly time and health conscious. The educated people have to
engage in diversified activities and remain busy all time. So they try to shop their necessities in
a place which is hassle free and the same time prices of the essential are displayed like super
shop.
Occupation of supermarket customers
The customers were engaged in various occupations. The major occupation of the customer
was categorized into five groups. Most of the customers are government employee. The table 1
shows that 12 percent are student, 10 percent are housewife, 33 percent are government
employee, 20 percent are business man and 25 percent are engaged in other works.
Occupation indicates the social status of a person. There might be a positive relation between
occupation and perception of supermarket growth. The people who work in higher class society
have the status problem to shop in a place where bargaining exist. To avoid this problem they
find it more comfortable to shop supermarket rather than traditional market.
Income level of supermarket customers
The table 1 shows the different income level of different customers. Table shows that most of
the customer’s income is greater than 45000 and it was 44 percent from the total respondents.
The second higher income level is 31000-45000 which constitute the 28 percent of the
respondents. In general the higher the income of the customer the higher the standard of living.
In our country most of the people spent their income (about 40 percent of total income) mainly
consumption purposes. Income has a positive relation with employment. In supermarket all
kinds of essential are available than wet market. So the people prefer the supermarket to visit
and purchase their daily necessities, which in turn accelerate the growth of supermarket.
International Journal of Economics, Commerce and Management, United Kingdom
Licensed under Creative Common Page 533
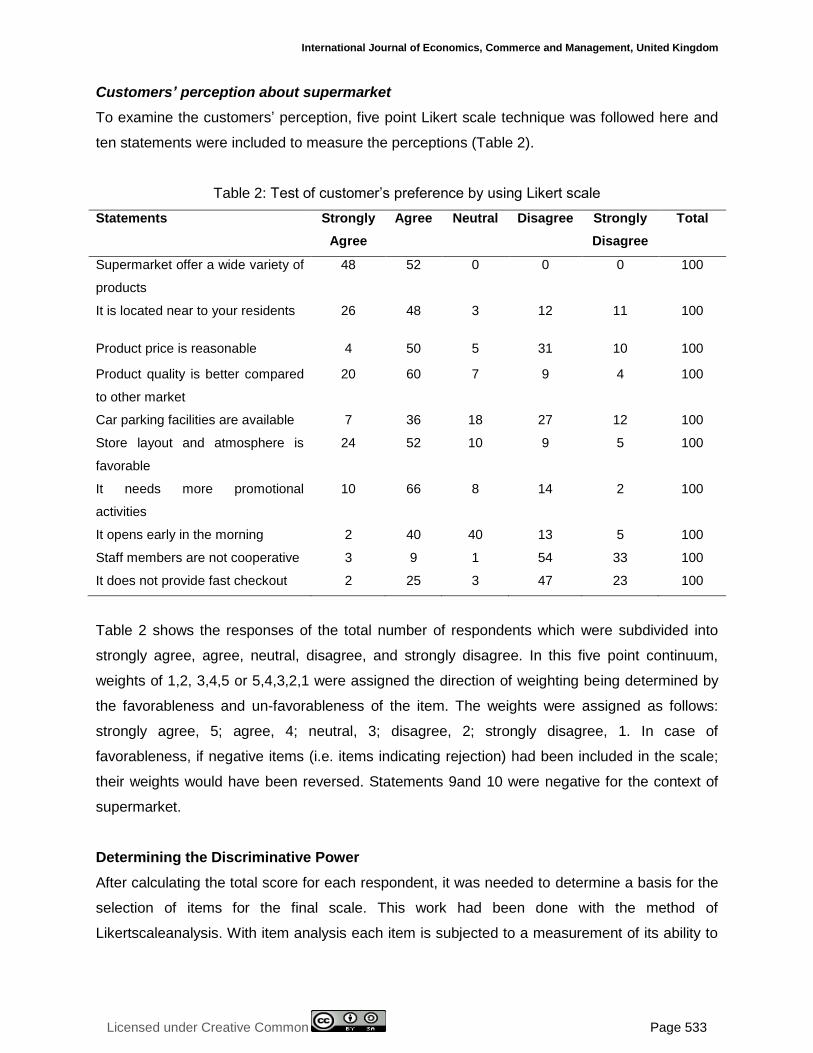
Customers’ perception about supermarket
To examine the customers’ perception, five point Likert scale technique was followed here and
ten statements were included to measure the perceptions (Table 2).
Table 2: Test of customer’s preference by using Likert scale
Statements Strongly
Agree
Agree Neutral Disagree Strongly
Disagree
Total
Supermarket offer a wide variety of
products
48 52 0 0 0 100
It is located near to your residents 26 48 3 12 11 100
Product price is reasonable 4 50 5 31 10 100
Product quality is better compared
to other market
20 60 7 9 4 100
Car parking facilities are available 7 36 18 27 12 100
Store layout and atmosphere is
favorable
24 52 10 9 5 100
It needs more promotional
activities
10 66 8 14 2 100
It opens early in the morning 2 40 40 13 5 100
Staff members are not cooperative 3 9 1 54 33 100
It does not provide fast checkout 2 25 3 47 23 100
Table 2 shows the responses of the total number of respondents which were subdivided into
strongly agree, agree, neutral, disagree, and strongly disagree. In this five point continuum,
weights of 1,2, 3,4,5 or 5,4,3,2,1 were assigned the direction of weighting being determined by
the favorableness and un-favorableness of the item. The weights were assigned as follows:
strongly agree, 5; agree, 4; neutral, 3; disagree, 2; strongly disagree, 1. In case of
favorableness, if negative items (i.e. items indicating rejection) had been included in the scale;
their weights would have been reversed. Statements 9and 10 were negative for the context of
supermarket.
Determining the Discriminative Power
After calculating the total score for each respondent, it was needed to determine a basis for the
selection of items for the final scale. This work had been done with the method of
Likertscaleanalysis. With item analysis each item is subjected to a measurement of its ability to

© Farid, Alam, Rahman, Barua & Koiry
Licensed under Creative Common Page 534
separate the highs from the lows. This is called discriminative power (DP) of the item
(http://psychologydictionary.org).
Table 3: Computation of DP value
Group [[[ Numbe
r
5 4 3 2 1 Weighted
total
Weighted
mean
DP(Q3-Q1)
High 25 percent 25 17 8 0 0 0 117 4.68 0.40
Low 25 percent 25 7 18 0 0 0 107 4.28
High 25 percent 25 14 11 0 0 0 117 4.68 1.92
Low 25 percent 25 1 10 1 5 8 66 2.64
High 25 percent 25 3 15 2 3 2 89 3.56 1.20
Low 25 percent 25 0 6 2 12 5 59 3.26
High 25 percent 25 12 12 1 0 0 111 4.44 1.16
Low 25 percent 25 1 15 2 4 3 82 3.28
High 25 percent 25 6 11 4 4 0 94 3.76 1.36
Low 25 percent 25 1 5 4 8 7 60 2.4
High 25 percent 25 13 11 1 0 0 112 4.48 1.64
Low 25 percent 25 1 10 6 3 5 71 2.82
High 25 percent 25 3 20 0 2 0 99 3.96 0.84
Low 25 percent 25 1 13 1 8 2 78 3.12
High 25 percent 25 2 9 12 1 1 85 3.4 0.60
Low 25 percent 25 0 7 10 4 4 70 2.8
High 25 percent 25 1 0 0 10 14 111 4.44 0.92
Low 25 percent 25 1 6 1 12 5 88 3.52
High 25 percent 25 0 3 0 15 7 101 4.04 1.28
Low 25 percent 25 1 12 0 7 5 78 3.12
Supermarket offer a wide variety of Products
The most important factor constituting customer satisfaction is the variety of goods and services
sold at retail chain stores. Customers are highly satisfied in a store where products of different
brands are available. It is considered to be one of the important determinants of satisfaction.
From table 3 it is seen that, weighted total and weighted mean for the high (25 percent) were
117 and 4.68, respectively. For low (25 percent) weighted total and weighted mean were 107
and 4.28, respectively. After calculation it was depicted that DP value was 0.4 meaning that
customers shows less variation with the statements. Now a days almost all the necessary
products are available in supermarket.
It is located near to your residents
Customers think deliberately when they want to purchase something from a particular store.
They prefer shopping from convenient places where sufficient car parking facilities and other
amnesties are available. In the context of Sylhet city in Bangladesh location is a very vital factor

International Journal of Economics, Commerce and Management, United Kingdom
Licensed under Creative Common Page 535
because there exists a large number of people. Huge traffic is a common scenario of this city
now a day. So people want to buy goods and services from those stores where they can easily
go and have their desired items with limited efforts. From table 3 it is seen that, weighted total
and weighted mean for the high (25 percent) were 117 and 4.68, respectively. For low (25
percent) weighted total and weighted mean were 66 and 2.64, respectively. The table 3 shows
that DP value for store location is 1.92, implies that super shop are not available at near to
door.
Product price is reasonable
The pricing policy of retail chain stores can also greatly influence customers because price has
the capability of attracting or repelling them (Krishna et al. 1998), especially since price
functions as an indicator of quality (Lewis and Shoemaker, 1997). If the price is high, customers
are likely to expect high quality, or it can induce a sense of being ripped off, (Carolyn and Saad,
2006). Likewise, if the price is low, customers may question the ability of the stores to deliver
product and service quality. Moreover, due to the competitiveness of retail industry in
Bangladesh, customers are able to establish internal reference prices. When establishing prices
for products and services, an internal reference price is defined as a price (or price scale) in
buyers’ memory that serves as a basis for judging or comparing actual prices (Krishna et al.
1998).This indicates that the price offering for the item needs to be in accord with what the
market expects to pay by avoiding negative deviation (i.e. when actual price is higher than the
expected price). From table 3 it is seen that, weighted total and weighted mean for the high (25
percent) were 89 and 3.56, respectively. For low (25 percent) weighted total and weighted mean
were 59 and 3.26, respectively. DP value for the product price is 1.2, meaning that the price
charged by supermarket is reasonable and not conflicting to traditional market.
Product quality is better compared to other market
An important factor constituting customer satisfaction is the quality of goods and services sold at
retail chain stores. Quality is the capacity of a product to satisfy some specific wants of the
customers. Quality of products is normally measured by product features, benefits and ability to
satisfy required needs and so on. It is considered to be one of the important determinants of
satisfaction. From table 3 it is seen that, weighted total and weighted mean for the high (25
percent) were 111 and 4.44, respectively. For low (25 percent) weighted total and weighted
mean were 82 and 3.28, respectively. The table 3 shows that DP value for the product quality is
1.16, meaning that supermarket offer better quality products compared to wet market especially
fresh vegetables, meat, fruits, fish etc.

© Farid, Alam, Rahman, Barua & Koiry
Licensed under Creative Common Page 536
Car parking facilities are available
Car parking facilities is important for the customer satisfaction. In case of traditional market car
parking facilities is quite insufficient. From table 3 it is seen that, weighted total and weighted
mean for the high (25 percent) were 94 and 3.76, respectively. For low (25 percent) weighted
total and weighted mean were 60 and 2.4, respectively. The table 3 shows that DP value for the
car parking is 1.36. This is good indicator for customer satisfaction. Most of the supermarkets
have their own parking zone in front of the shop. Customer can use these free facilities.
Store layout and atmosphere is favorable
The general appearance of the stores and the staff provides to some extent tangible cues about
the quality of services that customers can expect. Such physical evidence reflecting the overall
condition of a retail chain store and its facilities is deemed important by customers during the
qualitative interviews. Eye catchy appearance of the stores can easily grab the attention of
people. On the other hand stores can easily be identified by distinctive physical appearance. It
takes little time for the customers to find out the stores if its design is unique. From table 3 it is
seen that, weighted total and weighted mean for the high (25 percent) were112 and 4.48,
respectively. For low (25 percent) weighted total and weighted mean were 71 and 2.82 ,
respectively. The table 3 shows that DP value for the store layout and atmosphere is 1.64,
meaning that interior and exterior design and atmosphere is somewhat comfortable compared
to traditional market.
It needs more promotional activities
Promotional activities is the another important factors for the growth and acceptance of
supermarket product. In our country promotional activities related to supermarket is not
sufficient. As a result people are not fully concern about supermarket. From table3 it is seen
that, weighted total and weighted mean for the high (25 percent) were 99 and 3.96, respectively.
For low (25 percent) weighted total and weighted mean were 78 and 3.12 , respectively. The
table 3 shows that DP value for the promotional activities is 0.84, meaning that more initiatives
need to undertake for familiarization of supermarket to the mass people.
It opens early in the morning
It is also an important factor for knowing about the customer perceptionof supermarket growth.
Customer generally purchases their daily essential commodities early in the morning. From
table 3 it is seen that, weighted total and weighted mean for the high (25 percent) were 85 and
3.4, respectively. For low (25 percent) weighted total and weighted mean were 70 and 2.8 ,

International Journal of Economics, Commerce and Management, United Kingdom
Licensed under Creative Common Page 537
respectively. The table 3 shows that DP value for this statement is 0.6 that means most of the
customers are aware of the opening time.
Staff members is not cooperative
It is identified as the willingness of the staff to be helpful, to provide prompt services to the
customers and availability of all required items. Customers expect the stores to understand their
needs and address them in a timely manner with the availability of necessary items all the time.
When staff members are more responsive, attending to clients’ needs quickly and with care and
courtesy, it should result in improved customer satisfaction. From table 3 it is seen that,
weighted total and weighted mean for the high (25 percent) were 111 and 4.44, respectively.
For low (25 percent) weighted total and weighted mean were 88 and 3.52 , respectively. The
table 3 shows that DP value for the statement is 0.92, meaning that staff members are much
cooperative and friendly.
It does not provide fast checkout
Generally the customers who buy from supermarkets have no enough time to spend due work
pressure. They want to quick service in any aspect of life. As the supermarket is to establish to
reduce the hasssle of life the staff members are willing to response promptly. . From table 3 it is
seen that, weighted total and weighted mean for the high (25 percent) were 101 and 4.04,
respectively. For low (25 percent) weighted total and weighted mean were 78 and 3.12 ,
respectively. The table 3 shows that DP value for the statement is 1.28, meaning that staff
members provide fast check out after completing purchasing.
Favorableness and un-favorableness of consumers
From the calculation of the total score value of individuals, favorableness and un-favorableness
of supermarket visit can be presented. The consumers were categorized into three groups: i.
highly favored of supermarket (range value: 41-50), ii. Favored of supermarket (range value: 31-
40) and iii. Un-favored of supermarket (range value: (20-23). Here, highest value of individual
score can be 50 and lowest can be10 because the number of items is 10. Table 4 presents that,
11percent respondents were in un-favorer of supermarket. Though the percentage of highly
favored of supermarket were low (17percent), but maximum (72percent) were in favor of
supermarket.

© Farid, Alam, Rahman, Barua & Koiry
Licensed under Creative Common Page 538
Table 4: Percentage of favorableness and un-favorableness of
supermarket on the basis of individual score
Score Particulars No. of respondents Percentage
41-50 Highly favored of supermarket 17 17
31-40 Favored of supermarket 72 72
20-30 Disfavored of supermarket 11 11
Total 100 100
Test of correlation coefficient
On the basis of collected data of the customers, a correlation was tried to found out among the
socio economic variables such as age, sex, income, and distance and customer perception.
Pearson correlation coefficient was estimated to measure the correlation and t test was
performed by using the following formula to see whether the null hypothesis was rejected or
accepted.
Test statistic, t=𝑟 (𝑛−2)
(1−𝑟2)with (n-2) df.
Table 5: Correlation coefficient analysis
Variables Correlation coefficient Level of significance
Customer perception and age 0.99 0.01***
Customer perception and sex 0.013 0.894
Customer perception and income 0.189 0.060*
Customer perception and distance -0.258 0.01***
*, *** indicates significant at the level of 10 percent and 1 percent respectively
Correlation coefficient of customer’s perception with age
The null hypothesis of the study was that, there is no correlation of attitude with the age of the
respondents. Here the null hypothesis was rejected. Finally it was concluded that, age is
statistically significant with the customer’s attitude perception.
Correlation coefficient of customers perception with sex
The null hypothesis of the study was that, there is no correlation of perception with the sex of
the respondents. Here the null hypothesis was accepted. Finally it was concluded that, age is
statistically insignificant with the customer’s perception.
International Journal of Economics, Commerce and Management, United Kingdom
Licensed under Creative Common Page 539
Correlation coefficient of customer’s perception with income
The null hypothesis of the study was that, there is no correlation of perception with the income
of the respondents. Here the null hypothesis was rejected. Finally it was concluded that, income
is statistically significant with the customer’s perception on supermarket. Generally the higher
the level of income of consumers the higher the positive perception.
Correlation coefficient of customer’s perception with distance
The null hypothesis of the study was that, there is no correlation of perception with the distance
of supermarket Here the null hypothesis was accepted. Finally it was concluded that, distance is
statistically significant with the customer’s perception on supermarket.
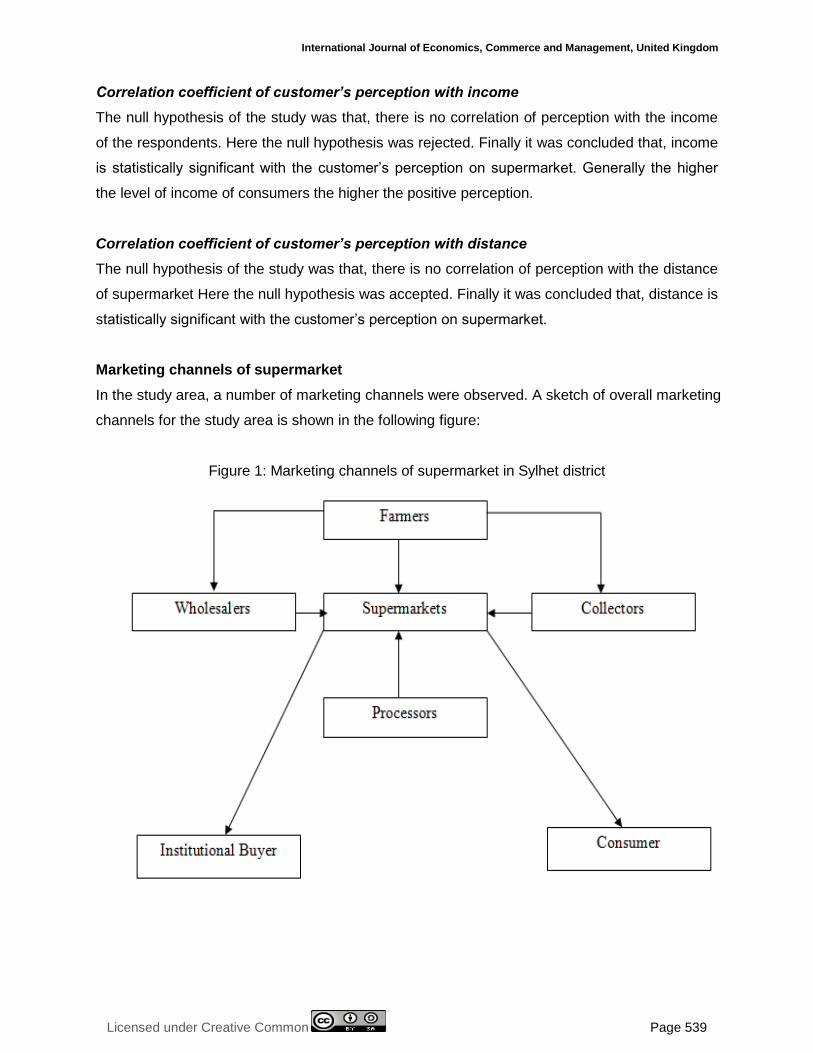
Marketing channels of supermarket
In the study area, a number of marketing channels were observed. A sketch of overall marketing
channels for the study area is shown in the following figure:
Figure 1: Marketing channels of supermarket in Sylhet district

© Farid, Alam, Rahman, Barua & Koiry
Licensed under Creative Common Page 540
The marketing channels existed in the study area are as follows:
Market Intermediaries
A brief description of intermediaries participating in the marketing channels in the study area is
given below.
Farmer
The farmer constituted the primary link of marketing channel. The farmers and various
intermediaries formed linkages in the channels. Most of the farmers sold their product by using
middlemen. Farmers sold cent percent of their produce directly to the supermarket.
Processors
Processors carry on their business on their own or on custom basis. Some processors employ
agents to buy for them in the producing areas, store the produce and process it throughout the
year on continuous basis. They also engage in advertising activity to create a demand for their
processed products. Supermarket collect processed food such as chips, noodles, juice, butter,
jelly, sauce etc. from different processors and agrobased industry in the study area.
Wholesalers
Wholesalers are those merchant middlemen who buy and sell food-grains in large quantities.
They may buy either directly from farmers or from other wholesalers. They sell food-grains
either in the super market or in other markets. They do not sell significant quantities to ultimate

International Journal of Economics, Commerce and Management, United Kingdom
Licensed under Creative Common Page 541
consumers. They own godowns for the storage of the produce. In the study area supermarket
collect their products from different wholesalers through their skilled collectors.
Collectors
Collectors are the employed specialized personnel. Collectors are responsible to supply the
products into the supermarket on demand basis. The manager made the demand of necessary
commodities day to day basis. The collectors collect the product from wholesaler, retailer,
farmers and processors. Sometimes the collector frequently visits the different markets and also
supplies fresh produce to the supermarket.
Consumer and institutional buyer
This is the last link of supermarket channels. Consumer visits the supermarket and buys their
necessities from the supermarket. Supermarket also sold their products directly to different
institutional buyers.
CONCLUSION
Supermarkets are newly established market phenomenon in the country. These provide a
variety of goods and services under one roof. As the people are becoming time conscious and
they do not have enough time for shopping, urban and semi-urban consumers prefer to buy all
kinds of goods from the superstores. Moreover due to high level of awareness most of the
educated customers now want to purchase the goods from a place where they find hassle free
shopping environment. All these facilities are being offered by the supermarkets. Thus there is a
need to understand the increasing trend of food retailing under supermarkets. Most of the
sampled customers were in an active age group (50 percent within the age group of 26-35 years
and 21 percent within the age group of 18-25 years). On an average the highest literacy rate of
sampled consumer’s was 38 percent. Whereas the national and Sylhet district`s literacy rates
are 51.8 and 45.59 percent, respectively (8). 33 percent sampled customers were involved in
government job and 44 percent customer’s income level is above 45000. Customers are highly
satisfied about product assortments, staff members and opening time . On an average 89
percent customers shows the favoured attitude towards supermarket. Age and income is
statistically significant with customers perception meaning that they had great influence on
visiting the supermarket. As retail chain store business is gaining popularity very quickly, people
engaged in this sector should pay special attention to the growth of this sector.

© Farid, Alam, Rahman, Barua & Koiry
Licensed under Creative Common Page 542
LIMITATIONS OF THE STUDY
The main limitation of this study is that the retailers are spread all over the country but only
Sylhet city has been taken into consideration. For collecting data from all over the country, a
large amount of financial resources and huge time are required. The findings of the current
study may be applicable only to the retailers (Supermarkets). Another limitation is that
responses could be biased because the research is conducted in open market place where
respondents’ answers can be influenced by numerous variables such as mood, feelings and so
on.
REFERENCES
Alam Z., and Rana, S.M.S. (2013). Customer’s attitudes towards retail chain store services in Bangladesh – A comparative study between retail chain store and small retail store. Journal of Business Studies.Volume-5.
Ataur(2015). Consumer’s Preference towards Rice Bran Oil, MS Thesis, Department of Agribusiness and Marketing, Bangladesh Agricultural University, Mymensingh.
Azad, S.A.K., and Bhuiyan, M.Z.H. (1992). Retail Marketing of Grocery Products in Dhaka City.Research Monograph, Bureau of Business Research, Dhaka University, p.2.
Bachnann and Dieter. (2010). Supermarkets on the rise.The Daily Star, December 26, 2008.
Bangladesh Bureau of Statistics (2011). Year Book of Agricultural Statistics of Banglades.Ministry of Planning, Government of the People’s Republic of Bangladesh, Dhaka.
Carolyn, C. and Syed Saad,A. (2006) .Customer satisfaction in the restaurant industry: An examination of the transaction-specific model. Journal of Services Marketing, vol. 20:3–11.
Dries, L., Reardon, T., and Swinnen, J.F.M. (2004).The Rapid Rise of Supermarkets in Central and Eastern Europe Implications for the Agrifood Sector and Rural Development. Development Policy Review, 22 (5): 525-556.
Farouk, A. (1987). Some Aspects of Retail Marketing in Dhaka City. Research Monograph, Bureau of Business Research, Dhaka University, Dhaka, pp. 1–64.
Forid, S. M. (2013). Measuring Retail Service Quality from the Perspective of Bangladesh: A Case Study on Aarong.Journal of science and technology, ISSN 2072-0149, vol.3, no. 2.
Godron, J.M.,Bouhsina,Z., Fort, F., Coudel, E., and Puech, A. (2004). Supermarkets inLow-Income Mediterranean Countries: Impacts on Horticulture Systems. Development olicy Review, 22 (5): 587-602.
Hasan, S. R.(1974). Consumer Response to Advertising and Attitude towards Products, Bureau of Business Research, Research Monograph Series-No. 3, Dhaka University, Dhaka,34.
Hu, D., Reardon,T.,Rozzelle, S., TimmerI, C.P., and Wang, H. (2004). The Emergence of Supermarkets with Chinese Characteristics: Challenges and Opportunities for China’s Agricultural Development. Development Policy Review, 22(5): 557-586.
Kashem, M. A. (2012). The Bangladeshi consumer behavior and attitude toward superstores.European Journal of Business and Management, vol. 4, pp. 85 – 96.
Lewis, R. C., and Shoemaker, S. (1997). Price-sensitivity measurement: A tool for the hospitality industry, Cornell Hotel and Restaurant Administration Quarterly,38:44-47.
Monroe, K. B.,Grewal, D.,and Krishna, R.(1998). The effects of price-comparison advertising on buyers perceptions of acquisitions value, transaction value, and behavioral intentions,Journal of Marketing,vol. 62, 46-59.

International Journal of Economics, Commerce and Management, United Kingdom
Licensed under Creative Common Page 543
Reardon, T. and Hopkins, R. (2006). The Supermarket Revolution in Developing Countries: Policies to address emerging Tensions among Supermarkets, Suppliers and Traditional Retailers. European Journal of Development Research. 18 (4): 522-545.
Reardon, T., and Berdegue, J. (2002). The Rapid Rise of Supermarkets in Latin America: Challenges and Opportunities for Development. Development Policy Review, 20 (4): 371-388.
Reardon, T., TimmerI,C. P.,Barret,C., and Berdegue, J. (2003).The Rise of Supermarkets in Africa, Asia and Latin America. American Journal of Agricultural Economics. 85(5): 1140-1146.
TrailL, W.B.(2006). The rapid Rise of Supermarkets? Development Policy Review, 24 (2): 163-174.