Embed Size (px)
Citation preview
235
11Results, Targets and Measures to Drive Collaboration: Lessons from the New Zealand Better
Public Services reformsRodney Scott and Ross Boyd
IntroductionPerformance measurement is a hotly contested topic in government (Brignal and Modell 2000) and the not-for-profit (NFP) sector (Kaplan 2001) and in interaction between the two (Macpherson 2001). This chapter presents lessons from the use of impact measures in the New Zealand Government as examples to be applied in other contexts. The use of impact measures is complicated by problems of control and attribution (Smith 2009). Many organisations have instead resorted to output measures, or even input and activity measures, which may promote efficiency but do not address the effectiveness of interventions (de Lancer-Julnes and Holzer 2001).
The history of performance measurement in the New Zealand Government has gone through several stages. Until the new public management (NPM) reforms of the late 1980s and early 1990s, reporting focused on inputs. Government departments and the managers therein
THE THREE SECTOR SOLUTION
236
would diligently record how money was spent and how department staff used their time (Boston et al. 1996). This contributed to a public service that was seen as overly bureaucratic and process oriented.
The NPM reforms introduced management concepts from the corporate centre: decentralisation, managerialism, contractualism and accountability. Departments planned to deliver a range of goods and services and reported their achievement to parliament (Scott 2001). This was seen as improving the efficiency and responsiveness of the public service, but the focus on outputs meant that the services provided were not necessarily the most effective.
The ‘Managing for Outcomes’ reforms required departments to describe how the outputs they produced contributed to outcomes through an outcomes framework or intervention logic. Starting in 2002, departments produced Statements of Intent that replaced the Departmental Forecast. Statements of Intent described the intent behind the outputs produced. This was seen as contributing to increased effectiveness in cases where responsibility for the outcome fell to a single department (SSC 2011). Where responsibility for outcomes crossed departmental boundaries, departments were encouraged to coordinate with each other under the ‘Managing for Shared Outcomes’ initiative (SSC 2004); however, this was seen as less successful. Agencies were grouped into ‘sectors’, but interdepartmental groups at a sectoral level were seen as lacking focus and direction (SSC 2011).
In 2011, the New Zealand Government created the Better Public Services (BPS) Advisory Group to provide advice on how to improve the performance of government. One area of attention was improving government effectiveness in addressing persistent crosscutting social harms. The resulting ‘Better Public Services’ reforms included the selection of 10 ‘Results’ to improve the lives of New Zealanders, which relied on collective accountability between multiple departments for achieving a specified social impact (SSC 2015a). While individual departments did not operate a sufficiently broad array of levers to effect change in crosscutting problems, groups of departments had greater control. The ‘Results Approach’ could therefore be described as collaborating for outcomes. These four stages are necessarily a simplification of a large number of complex changes and describe the
237
11 . RESULTS, TARGETS AND MEASURES TO DRIvE COLLABORATION
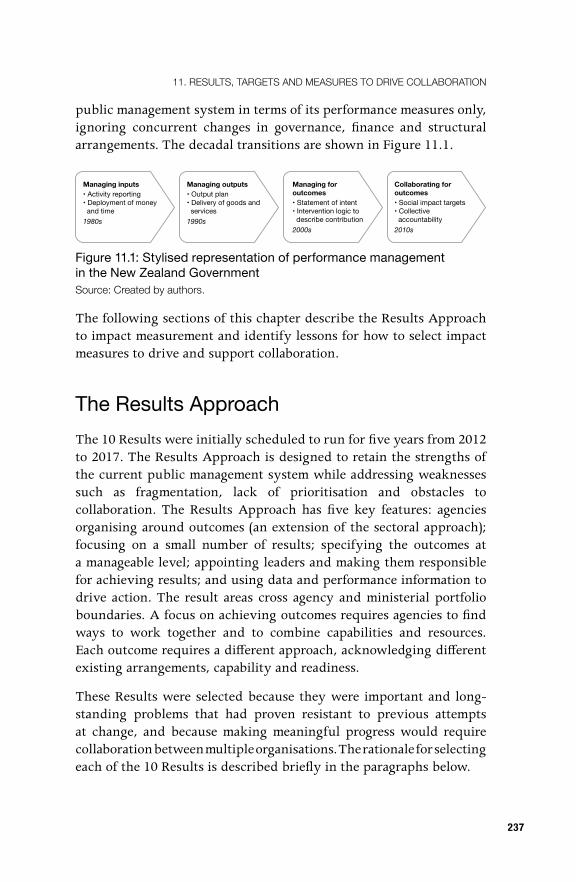
public management system in terms of its performance measures only, ignoring concurrent changes in governance, finance and structural arrangements. The decadal transitions are shown in Figure 11.1.
Managing inputs• Activity reporting• Deployment of money and time
1980s
Collaborating for outcomes• Social impact targets • Collective accountability
2010s
Managing for outcomes• Statement of intent • Intervention logic to describe contribution
2000s
Managing outputs• Output plan • Delivery of goods and services
1990s
Figure 11.1: Stylised representation of performance management in the New Zealand GovernmentSource: Created by authors .
The following sections of this chapter describe the Results Approach to impact measurement and identify lessons for how to select impact measures to drive and support collaboration.
The Results ApproachThe 10 Results were initially scheduled to run for five years from 2012 to 2017. The Results Approach is designed to retain the strengths of the current public management system while addressing weaknesses such as fragmentation, lack of prioritisation and obstacles to collaboration. The Results Approach has five key features: agencies organising around outcomes (an extension of the sectoral approach); focusing on a small number of results; specifying the outcomes at a manageable level; appointing leaders and making them responsible for achieving results; and using data and performance information to drive action. The result areas cross agency and ministerial portfolio boundaries. A focus on achieving outcomes requires agencies to find ways to work together and to combine capabilities and resources. Each outcome requires a different approach, acknowledging different existing arrangements, capability and readiness.
These Results were selected because they were important and long-standing problems that had proven resistant to previous attempts at change, and because making meaningful progress would require collaboration between multiple organisations. The rationale for selecting each of the 10 Results is described briefly in the paragraphs below.
THE THREE SECTOR SOLUTION
238
Result 1 aims to reduce long-term welfare dependence. Being out of paid work and on a benefit for extended periods increase the risk of poverty, social dislocation and deteriorating overall health. It can also have negative effects on the children of people on a benefit long term. The cost of paying benefits to working-age people is now more than NZ$8 billion (A$7.15 billion) a year, with much higher lifetime costs. Reducing long-term welfare dependence is about supporting people to better their lives, managing the government’s future financial liability and supporting the New Zealand economy by ensuring it has a skilled and productive workforce.
Results 2–4 aim to better support vulnerable children. Early childhood experiences are linked with adult mental health issues, drug and alcohol abuse, poor educational outcomes and unemployment. Many children are at risk of poor outcomes because they do not get the early support they need. Remedial spending is thought to be less effective and more costly than preventative action. For example, treating rheumatic fever alone costs NZ$40 million (A$35.7 million) per year in New Zealand.
Results 5–6 aim to boost skills and employment. Success in education is essential for the government’s goal of building a productive and competitive economy. It also helps New Zealanders develop the skills needed to reach their full potential and contribute to the economy and society.
Results 7 and 8 aim to reduce crime in New Zealand. Crime is associated with substantial economic and social costs. Crime is a complex, multifactorial social problem that requires different agencies to work together; previous attempts to address crime through the actions of a single agency have been largely unsuccessful.
Results 9 and 10 target improved interaction with government. Interacting with government is harder than it should be for both businesses and individuals. Businesses report that they find government services complex and fragmented, and that interacting with government takes more cost and effort than it should. The time and cost of dealing with government affect businesses’ competitiveness and productivity and thereby have a negative impact on economic growth. Individuals want to deal with government in new and different ways
239
11 . RESULTS, TARGETS AND MEASURES TO DRIvE COLLABORATION
and government needs to respond to that. New Zealanders increasingly expect service delivery from the government that is digital, responsive and personalised.
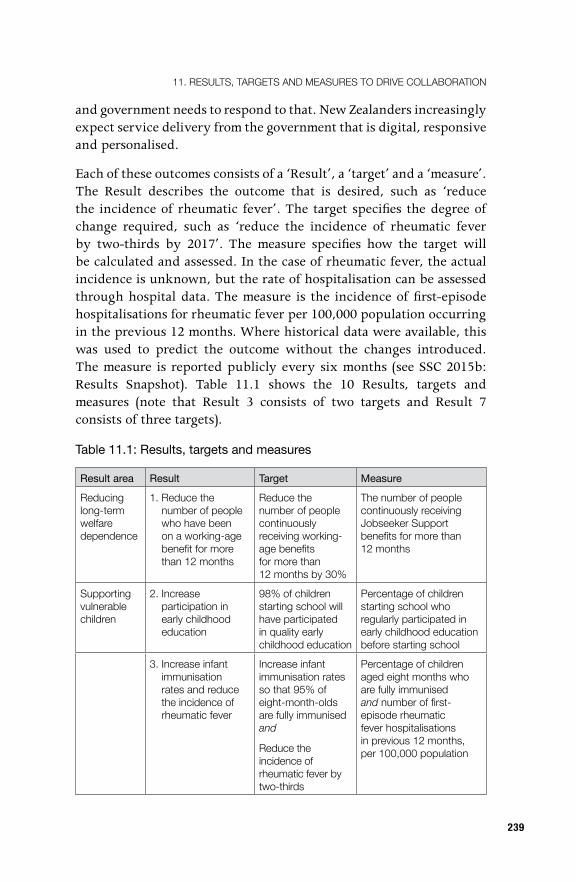
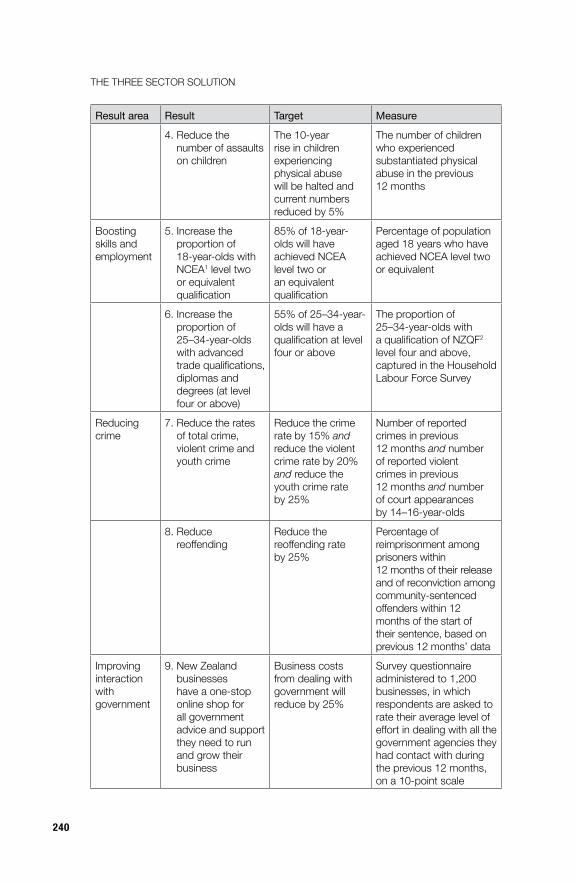
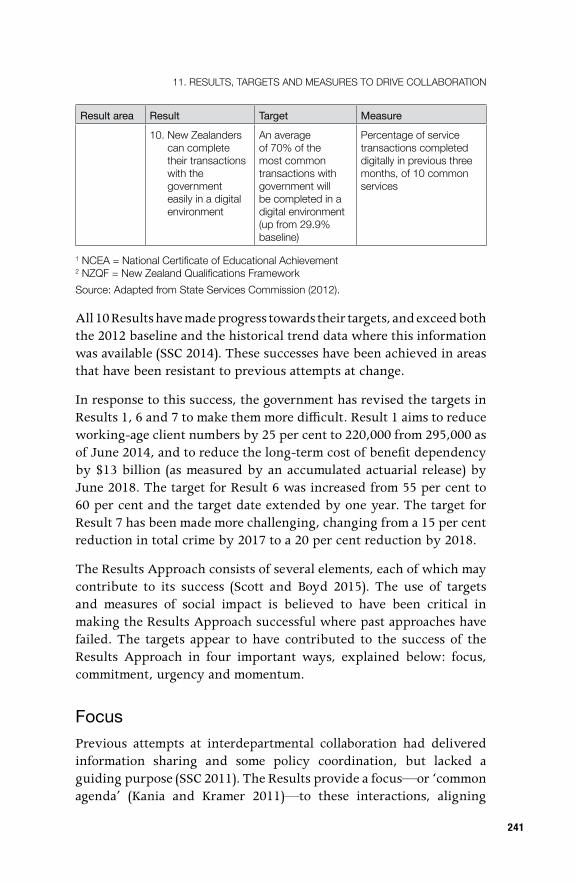
Each of these outcomes consists of a ‘Result’, a ‘target’ and a ‘measure’. The Result describes the outcome that is desired, such as ‘reduce the incidence of rheumatic fever’. The target specifies the degree of change required, such as ‘reduce the incidence of rheumatic fever by two-thirds by 2017’. The measure specifies how the target will be calculated and assessed. In the case of rheumatic fever, the actual incidence is unknown, but the rate of hospitalisation can be assessed through hospital data. The measure is the incidence of first-episode hospitalisations for rheumatic fever per 100,000 population occurring in the previous 12 months. Where historical data were available, this was used to predict the outcome without the changes introduced. The measure is reported publicly every six months (see SSC 2015b: Results Snapshot). Table 11.1 shows the 10 Results, targets and measures (note that Result 3 consists of two targets and Result 7 consists of three targets).
Table 11.1: Results, targets and measures
Result area Result Target Measure
Reducing long-term welfare dependence
1 . Reduce the number of people who have been on a working-age benefit for more than 12 months
Reduce the number of people continuously receiving working-age benefits for more than 12 months by 30%
The number of people continuously receiving Jobseeker Support benefits for more than 12 months
Supporting vulnerable children
2 . Increase participation in early childhood education
98% of children starting school will have participated in quality early childhood education
Percentage of children starting school who regularly participated in early childhood education before starting school
3 . Increase infant immunisation rates and reduce the incidence of rheumatic fever
Increase infant immunisation rates so that 95% of eight-month-olds are fully immunised and
Reduce the incidence of rheumatic fever by two-thirds
Percentage of children aged eight months who are fully immunised and number of first-episode rheumatic fever hospitalisations in previous 12 months, per 100,000 population
THE THREE SECTOR SOLUTION
240
Result area Result Target Measure
4 . Reduce the number of assaults on children
The 10-year rise in children experiencing physical abuse will be halted and current numbers reduced by 5%
The number of children who experienced substantiated physical abuse in the previous 12 months
Boosting skills and employment
5 . Increase the proportion of 18-year-olds with NCEA1 level two or equivalent qualification
85% of 18-year-olds will have achieved NCEA level two or an equivalent qualification
Percentage of population aged 18 years who have achieved NCEA level two or equivalent
6 . Increase the proportion of 25–34-year-olds with advanced trade qualifications, diplomas and degrees (at level four or above)
55% of 25–34-year-olds will have a qualification at level four or above
The proportion of 25–34-year-olds with a qualification of NZQF2 level four and above, captured in the Household Labour Force Survey
Reducing crime
7 . Reduce the rates of total crime, violent crime and youth crime
Reduce the crime rate by 15% and reduce the violent crime rate by 20% and reduce the youth crime rate by 25%
Number of reported crimes in previous 12 months and number of reported violent crimes in previous 12 months and number of court appearances by 14–16-year-olds
8 . Reduce reoffending
Reduce the reoffending rate by 25%
Percentage of reimprisonment among prisoners within 12 months of their release and of reconviction among community-sentenced offenders within 12 months of the start of their sentence, based on previous 12 months’ data
Improving interaction with government
9 . New Zealand businesses have a one-stop online shop for all government advice and support they need to run and grow their business
Business costs from dealing with government will reduce by 25%
Survey questionnaire administered to 1,200 businesses, in which respondents are asked to rate their average level of effort in dealing with all the government agencies they had contact with during the previous 12 months, on a 10-point scale
241
11 . RESULTS, TARGETS AND MEASURES TO DRIvE COLLABORATION
Result area Result Target Measure
10 . New Zealanders can complete their transactions with the government easily in a digital environment
An average of 70% of the most common transactions with government will be completed in a digital environment (up from 29 .9% baseline)
Percentage of service transactions completed digitally in previous three months, of 10 common services
1 NCEA = National Certificate of Educational Achievement2 NZQF = New Zealand Qualifications Framework Source: Adapted from State Services Commission (2012) .
All 10 Results have made progress towards their targets, and exceed both the 2012 baseline and the historical trend data where this information was available (SSC 2014). These successes have been achieved in areas that have been resistant to previous attempts at change.
In response to this success, the government has revised the targets in Results 1, 6 and 7 to make them more difficult. Result 1 aims to reduce working-age client numbers by 25 per cent to 220,000 from 295,000 as of June 2014, and to reduce the long-term cost of benefit dependency by $13 billion (as measured by an accumulated actuarial release) by June 2018. The target for Result 6 was increased from 55 per cent to 60 per cent and the target date extended by one year. The target for Result 7 has been made more challenging, changing from a 15 per cent reduction in total crime by 2017 to a 20 per cent reduction by 2018.
The Results Approach consists of several elements, each of which may contribute to its success (Scott and Boyd 2015). The use of targets and measures of social impact is believed to have been critical in making the Results Approach successful where past approaches have failed. The targets appear to have contributed to the success of the Results Approach in four important ways, explained below: focus, commitment, urgency and momentum.
FocusPrevious attempts at interdepartmental collaboration had delivered information sharing and some policy coordination, but lacked a guiding purpose (SSC 2011). The Results provide a focus—or ‘common agenda’ (Kania and Kramer 2011)—to these interactions, aligning
THE THREE SECTOR SOLUTION
242
the perspectives of participating departments towards a common goal. The Results Approach encouraged a kind of action-learning perspective (Revans 1980), where participating departments would constantly ask themselves and one another whether any particular action brought them closer to the goal. For this purpose, the targets had to be simple, intuitive and memorable.
CommitmentThe New Zealand public management system is focused particularly on accountability (Schick 1996; Vitalis and Scott 2015). By communicating to chief executives that they would be held collectively accountable for progress towards a measurable target, the Results Approach built commitment to the successful achievement of the desired outcomes. Accountability is felt through relationships with ministers, performance assessment by the State Services Commission (SSC) and public scrutiny. The six-monthly reporting of progress towards the targets attracts some media attention (see, for example, Kirk 2015).
UrgencyThe Results provide a direction of travel, but the targets quantify the required change. The targets were carefully chosen with the intention that they would be very challenging, but not so hard to achieve that participating departments would give up hope. When the target provided the right degree of challenge, this created a sense of urgency and encouraged participating departments to think at scale. Where Results have slipped behind their progress goals, this has stimulated challenging conversations among responsible chief executives and ministers.
MomentumFinally, the six-monthly reporting provided a tangible sense of progress. Collaboration seems to benefit from a kind of positive feedback loop, where success breeds commitment to further working together (Black and Andersen 2012; Scott et al. 2014). This was more effective in the Results where there was only a short delay between actions and results. Despite these generally observed benefits, some Results, targets and measures have been more successful than others.
243
11 . RESULTS, TARGETS AND MEASURES TO DRIvE COLLABORATION
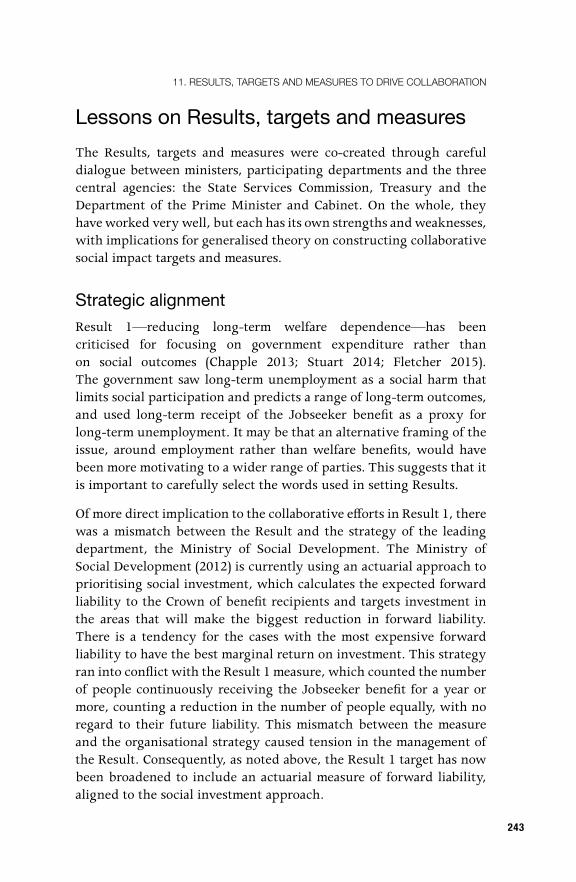
Lessons on Results, targets and measuresThe Results, targets and measures were co-created through careful dialogue between ministers, participating departments and the three central agencies: the State Services Commission, Treasury and the Department of the Prime Minister and Cabinet. On the whole, they have worked very well, but each has its own strengths and weaknesses, with implications for generalised theory on constructing collaborative social impact targets and measures.
Strategic alignmentResult 1—reducing long-term welfare dependence—has been criticised for focusing on government expenditure rather than on social outcomes (Chapple 2013; Stuart 2014; Fletcher 2015). The government saw long-term unemployment as a social harm that limits social participation and predicts a range of long-term outcomes, and used long-term receipt of the Jobseeker benefit as a proxy for long-term unemployment. It may be that an alternative framing of the issue, around employment rather than welfare benefits, would have been more motivating to a wider range of parties. This suggests that it is important to carefully select the words used in setting Results.
Of more direct implication to the collaborative efforts in Result 1, there was a mismatch between the Result and the strategy of the leading department, the Ministry of Social Development. The Ministry of Social Development (2012) is currently using an actuarial approach to prioritising social investment, which calculates the expected forward liability to the Crown of benefit recipients and targets investment in the areas that will make the biggest reduction in forward liability. There is a tendency for the cases with the most expensive forward liability to have the best marginal return on investment. This strategy ran into conflict with the Result 1 measure, which counted the number of people continuously receiving the Jobseeker benefit for a year or more, counting a reduction in the number of people equally, with no regard to their future liability. This mismatch between the measure and the organisational strategy caused tension in the management of the Result. Consequently, as noted above, the Result 1 target has now been broadened to include an actuarial measure of forward liability, aligned to the social investment approach.
THE THREE SECTOR SOLUTION
244
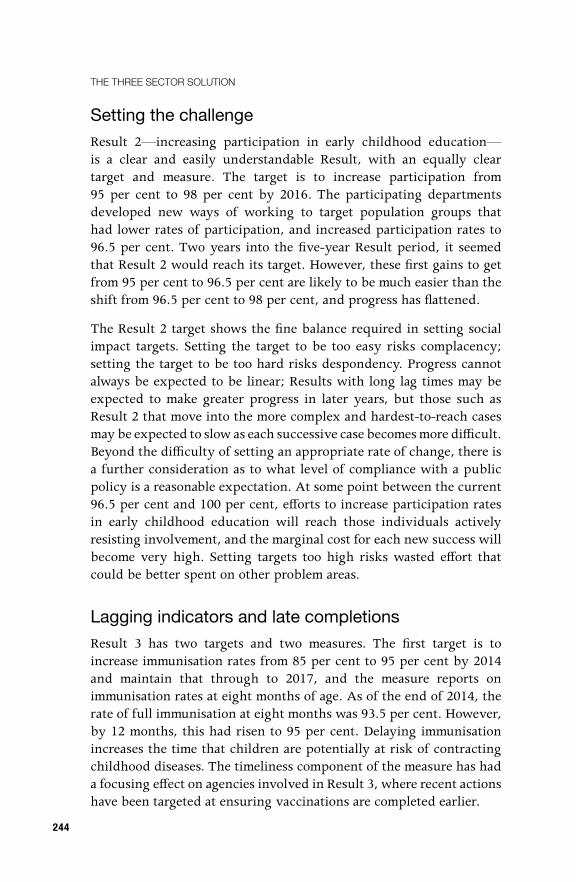
Setting the challengeResult 2—increasing participation in early childhood education—is a clear and easily understandable Result, with an equally clear target and measure. The target is to increase participation from 95 per cent to 98 per cent by 2016. The participating departments developed new ways of working to target population groups that had lower rates of participation, and increased participation rates to 96.5 per cent. Two years into the five-year Result period, it seemed that Result 2 would reach its target. However, these first gains to get from 95 per cent to 96.5 per cent are likely to be much easier than the shift from 96.5 per cent to 98 per cent, and progress has flattened.
The Result 2 target shows the fine balance required in setting social impact targets. Setting the target to be too easy risks complacency; setting the target to be too hard risks despondency. Progress cannot always be expected to be linear; Results with long lag times may be expected to make greater progress in later years, but those such as Result 2 that move into the more complex and hardest-to-reach cases may be expected to slow as each successive case becomes more difficult. Beyond the difficulty of setting an appropriate rate of change, there is a further consideration as to what level of compliance with a public policy is a reasonable expectation. At some point between the current 96.5 per cent and 100 per cent, efforts to increase participation rates in early childhood education will reach those individuals actively resisting involvement, and the marginal cost for each new success will become very high. Setting targets too high risks wasted effort that could be better spent on other problem areas.
Lagging indicators and late completionsResult 3 has two targets and two measures. The first target is to increase immunisation rates from 85 per cent to 95 per cent by 2014 and maintain that through to 2017, and the measure reports on immunisation rates at eight months of age. As of the end of 2014, the rate of full immunisation at eight months was 93.5 per cent. However, by 12 months, this had risen to 95 per cent. Delaying immunisation increases the time that children are potentially at risk of contracting childhood diseases. The timeliness component of the measure has had a focusing effect on agencies involved in Result 3, where recent actions have been targeted at ensuring vaccinations are completed earlier.
245
11 . RESULTS, TARGETS AND MEASURES TO DRIvE COLLABORATION
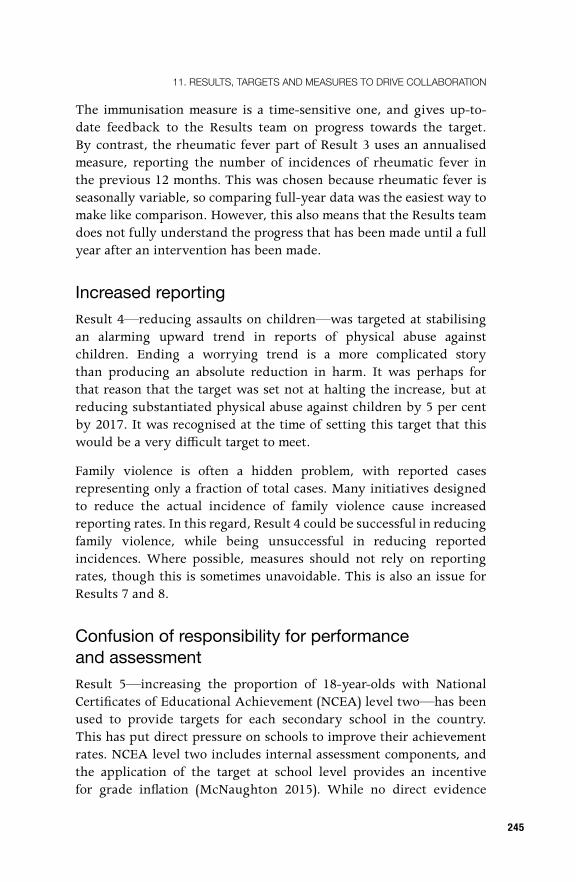
The immunisation measure is a time-sensitive one, and gives up-to-date feedback to the Results team on progress towards the target. By contrast, the rheumatic fever part of Result 3 uses an annualised measure, reporting the number of incidences of rheumatic fever in the previous 12 months. This was chosen because rheumatic fever is seasonally variable, so comparing full-year data was the easiest way to make like comparison. However, this also means that the Results team does not fully understand the progress that has been made until a full year after an intervention has been made.
Increased reportingResult 4—reducing assaults on children—was targeted at stabilising an alarming upward trend in reports of physical abuse against children. Ending a worrying trend is a more complicated story than producing an absolute reduction in harm. It was perhaps for that reason that the target was set not at halting the increase, but at reducing substantiated physical abuse against children by 5 per cent by 2017. It was recognised at the time of setting this target that this would be a very difficult target to meet.
Family violence is often a hidden problem, with reported cases representing only a fraction of total cases. Many initiatives designed to reduce the actual incidence of family violence cause increased reporting rates. In this regard, Result 4 could be successful in reducing family violence, while being unsuccessful in reducing reported incidences. Where possible, measures should not rely on reporting rates, though this is sometimes unavoidable. This is also an issue for Results 7 and 8.
Confusion of responsibility for performance and assessmentResult 5—increasing the proportion of 18-year-olds with National Certificates of Educational Achievement (NCEA) level two—has been used to provide targets for each secondary school in the country. This has put direct pressure on schools to improve their achievement rates. NCEA level two includes internal assessment components, and the application of the target at school level provides an incentive for grade inflation (McNaughton 2015). While no direct evidence
THE THREE SECTOR SOLUTION
246
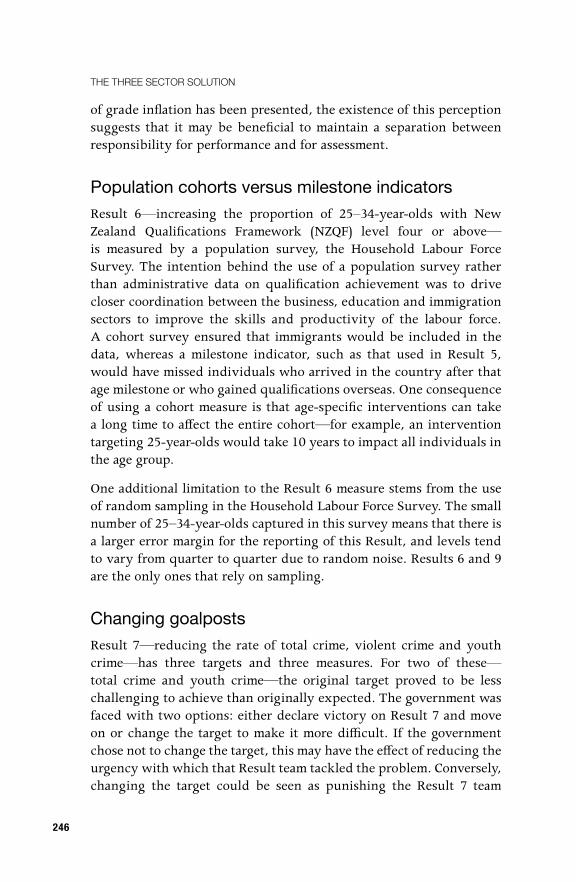
of grade inflation has been presented, the existence of this perception suggests that it may be beneficial to maintain a separation between responsibility for performance and for assessment.
Population cohorts versus milestone indicatorsResult 6—increasing the proportion of 25–34-year-olds with New Zealand Qualifications Framework (NZQF) level four or above—is measured by a population survey, the Household Labour Force Survey. The intention behind the use of a population survey rather than administrative data on qualification achievement was to drive closer coordination between the business, education and immigration sectors to improve the skills and productivity of the labour force. A cohort survey ensured that immigrants would be included in the data, whereas a milestone indicator, such as that used in Result 5, would have missed individuals who arrived in the country after that age milestone or who gained qualifications overseas. One consequence of using a cohort measure is that age-specific interventions can take a long time to affect the entire cohort—for example, an intervention targeting 25-year-olds would take 10 years to impact all individuals in the age group.
One additional limitation to the Result 6 measure stems from the use of random sampling in the Household Labour Force Survey. The small number of 25–34-year-olds captured in this survey means that there is a larger error margin for the reporting of this Result, and levels tend to vary from quarter to quarter due to random noise. Results 6 and 9 are the only ones that rely on sampling.
Changing goalpostsResult 7—reducing the rate of total crime, violent crime and youth crime—has three targets and three measures. For two of these—total crime and youth crime—the original target proved to be less challenging to achieve than originally expected. The government was faced with two options: either declare victory on Result 7 and move on or change the target to make it more difficult. If the government chose not to change the target, this may have the effect of reducing the urgency with which that Result team tackled the problem. Conversely, changing the target could be seen as punishing the Result 7 team
247
11 . RESULTS, TARGETS AND MEASURES TO DRIvE COLLABORATION
for their early success (though the team did not see it this way). The government ultimately decided to introduce revised and more challenging targets for Results 1, 6 and 7, as discussed above.
Perverse incentivesResult 8—reducing reoffending—is a simple statement of the desired change. However, the two-word title hides a more nuanced picture. The measure takes into account the rate of re-imprisonment among prisoners within 12 months of their release and the rate of reconviction among community-sentenced offenders within 12 months of the start of their sentence. Community-sentenced offenders have typically committed crimes with lesser social harm than those facing imprisonment, and also represent an easier target for rehabilitation intervention. By combining the measure for re-imprisonment with reconviction of community-sentenced offenders, this may provide an incentive to target interventions towards the cases that are associated with the least social harm.
This incentive may not be merely theoretical. The reduction in reoffending in Result 8 has come largely from community-sentenced offenders, and this has received some media attention (Brooking 2014).
Organise around outcomes rather than solutionsResult 9—New Zealand businesses will have a one-stop online shop for all government advice and support they need to run and grow their business—describes a proposed solution to make it easier for businesses to interact with government. Collaboration is a complex social problem and addressing complex problems typically requires adaptive solutions (Kurtz and Snowden 2003). The use of social impact measures provides feedback to collaborators to allow them to adapt their practice. By specifying a solution rather than a problem, the Result 9 team is more restricted in what practices it can consider.
In response, the Result 9 team has focused instead on the target and measure. The target is to reduce costs to business from dealing with government by 25 per cent by 2017. The measure is that businesses will perceive that their effort has reduced (as measured in a perception survey). Therefore, the Result, target and measure each describe different things: an online hub, reduced costs and increased ease,
THE THREE SECTOR SOLUTION
248
respectively. This mismatch between Result, target and measure has caused some distraction and debate within Result 9. Collaboration to achieve social impact is a challenging proposition at the best of times; where there is confusion about the objective, this difficulty is magnified.
Result, target and measure mismatchResult 10—that New Zealanders can complete their transactions with government easily in a digital environment—also suffered from a mismatch between the Result, the target and its measure. There was not a convenient measure for ease of interaction with government, so Result 10 developed a volume target instead, setting a target that 70 per cent of New Zealanders’ most common transactions with government will be completed in a digital environment by 2017. It was not cost-effective to measure all government transactions, so Result 10 then selected a basket of transaction types to use as indicators.
Focusing on ease of interaction (the result) can lead to different actions compared with focusing on the channel of interaction (the measure). In many cases, a transactional service can be delivered more easily in person, or automatically, compared with having to complete the service through a digital channel. Result 10 has recently started to target life events for which interaction with government is particularly difficult, such as the birth of a child. This difficulty is caused by a person having to deal with multiple agencies, which can be confusing and often involves providing the same information multiple times. In many cases, the best solution for customers is integration of services to reduce complexity and redundancy, rather than simply transferring services to a digital environment. Making it easier for New Zealanders to complete transactions with government may not affect the Result 10 measure at all, and therefore the measure is not serving its purpose as a focusing or rallying call to participating agencies.
Additionally, there has been some internal discussion about whether Results 9 and 10 are comparable to the other eight, and whether they are suitable for the Results Approach. Results 1–8 describe a social impact. Results 9 and 10 describe a measure of service quality. Additionally, while Results 1–8 can often be addressed by two to four agencies working together, Results 9 and 10 involve many agencies. The experiences of those working on Results 9 and 10 have been
249
11 . RESULTS, TARGETS AND MEASURES TO DRIvE COLLABORATION
significantly different to those working with Results 1–8, and it is not yet clear how this should be managed or resolved. The experiences for Results 9 and 10 are providing valuable lessons for implementing government-wide change, but these have not yet been fully explored and are beyond the scope of this chapter.
ConclusionsOutcomes measures often break down at an individual organisation level, because outcomes are beyond the control of that organisation and because change is difficult to attribute to any given action. However, when several organisations combine their efforts, their combined effect may be easier to see.
The Results Approach has helped New Zealand make progress on 10 previously intractable problems, where numerous previous attempts have failed. The use of publicly reported measurable social impact data has been important in driving focus, commitment, momentum and urgency to support interdepartmental collaboration. When compared with previous New Zealand attempts at using measurement to drive performance, the Results Approach uses more explicit targets, simpler measures and greater public accountability.
While each Result has been successful, no measure is perfect. The experience of the Results Approach has provided many lessons for the New Zealand Government on how to design impact measures to drive collaboration. With the benefit of hindsight, we remain pleasantly surprised with how well the Results, targets and measures have fared. However, each has its own challenges, and it is the intention of this chapter to highlight the strengths and weaknesses of the Results to help others to design effective impact measures that improve performance.
In using shared targets for driving collaboration, the Results Approach demonstrates the importance of carefully choosing a Result (the outcome you want to achieve), a target (the degree of change) and a measure (how progress will be calculated). These need to be closely aligned, otherwise there is the opportunity for perverse incentives or
THE THREE SECTOR SOLUTION
250
distraction and debate between conflicting goals. It appears important to select outcomes, rather than solutions, to allow the collaboration to develop their own innovative practice.
If targets are going to change behaviours, they need to be sufficiently challenging to disrupt complacency. Publicly setting challenging targets is risky, because failing to achieve those targets causes reputational damage. The Results Approach benefited from the government being willing to take a portfolio approach to 10 areas, accepting from the beginning that it was unlikely the target would be achieved in all 10 areas. If organisations are going to replicate aspects of the Results Approach, it will be important to establish conditions where it is acceptable to set difficult targets and risk failure. The inverse is targets that are too ambitious and that act to decrease motivation because they appear unachievable. This does not appear to have been a problem in the Results Approach so far, but it may be a risk as the target dates draw nearer.
Most social outcomes are the product of complex interrelationships between social conditions, arising over time. Targets appear more effective in driving performance if they can measure more immediate impacts: educational achievement instead of subsequent employment outcomes or immunisation rates rather than incidence of vaccine-preventable disease. However, this is not always the case, as shown in Results 7 and 8. Crime is a complex multi-factorial problem, often representing the culmination of a lifetime of social disadvantage and negative environmental factors. Results 7 and 8 show that significant changes to crime and criminal reoffending rates are possible in only two years.
Applicability to other sectors Any case study research must consider the extent to which the findings may be generalised. The Results Approach uses impact measures to drive performance in the public sector. We assume that the lessons are most directly transferable to other government settings, particularly those jurisdictions with a strong focus on accountability. Some of the benefits and drawbacks of this approach are likely to apply equally to other sectors, and some are not. The following paragraphs provide some suggestions for how impact measures may work differently in
251
11 . RESULTS, TARGETS AND MEASURES TO DRIvE COLLABORATION
different types of organisations, and then justify why collaborators from all sectors should be cognisant of the lessons from the Results Approach.
Targets are likely to work differently in mission-driven versus performance-driven organisations (Osborne 1993). Organisations within the public sector are often driven by a mix of personal commitment to the mission and managerial accountability for performance. Within upper management levels, performance accountability tends to be a strong driver (Schick 1996).
Public policy targets usually function as a combination of symbolic signalling and management accountability (Boswell 2014). The Results are important symbolically in that they signal the importance of particular issues and indicate a sense of commitment to addressing them. The targets set the degree of aspiration to that goal. These factors are likely to be important for mission-driven organisations, such as those in the community and NFP sectors.
The management accountability functions may appear more foreign to the community and NFP sectors. As discussed in this chapter, the New Zealand public sector has a strong focus on accountability. Departments could not be held responsible for the actions of other departments, so no one was responsible for problems that spanned multiple departments. Collective accountability for the achievement of crosscutting targets provided a means to drive performance in these areas. In archetypal mission-driven organisations, things get done because individuals see them as important and worthwhile, not because someone is being held responsible (Osborne 1993). In these settings, collective accountability for achieving targets may be a less useful concept. By extension, these mission-driven organisations may not face the same risks of gaming or perverse incentives that come with the use of targets.
There are at least two reasons why even the most pure mission-driven organisation should still be thinking about the management accountability functions of targets. First, community and NFP organisations usually rely on some sort of external funding, such as philanthropic donations or government service contracts. Both philanthropists (Leadbeater 1997) and governments (Fox and Albertson 2011) are increasingly looking for evidence of impact.
THE THREE SECTOR SOLUTION
252
These external funders will bring the assumptions of behaviour from their own performance-driven backgrounds, and community and NFP organisations will need to be able to navigate the same challenges of accountability and transparency attributed to performance-driven organisations above.
There is a second and perhaps more immediate reason that other sectors need to understand how collective accountability for impact measures can drive performance in the public sector. Significant attention in recent years has been dedicated to the collective impact (Kania and Kramer 2011) that can occur when different sectors work together (Selsky and Parker 2005; Bryson et al. 2006). In cross-sectoral collaboration it is important to understand motivations and anticipate the behaviour of collaboration partners. By understanding the benefits and potential pitfalls in public sector targets, other sectors can help design successful impact measures for use in cross-sectoral collaboration.
Where to next?The 10 Results were initially designed for target achievement in 2017 (three have been revised, with additional and more challenging targets set for 2018). At the end of this period, the government will need to decide what to do with the 10 Results. These will be decisions for the elected government of the day, and the following paragraphs are purely speculative.
The Results appear very successful to date. Assuming this remains the case until 2017, one option would be to continue with the approach, largely unchanged. The government would need to consider which small number of problems were important priorities and amenable to the Results Approach. Some of the existing Results could be retained with new targets or some could be retired and replaced with other important problems.
The Results Approach has benefited from its tight focus on only 10 Results and, while there is no reason to suspect that 10 is a magic number, it is likely that the Results Approach would be less effective if extended to a much larger number. Chief executive and ministerial attention is a finite resource, which can only be extended to a few key priorities at any one time.
253
11 . RESULTS, TARGETS AND MEASURES TO DRIvE COLLABORATION
Some consideration has been given to how the Results Approach could be applied to problems in other contexts. One possibility is to apply it regionally. New Zealand is facing particular challenges in two of its largest metropolitan areas. Christchurch was severely damaged by earthquakes in 2010 and 2011 and efforts to rebuild and revitalise the city are ongoing. Auckland is New Zealand’s largest city, is rapidly expanding, faces housing and transport challenges and has areas with persistent social harms. It is possible that the use of impact targets could be used to drive collaboration and performance in Christchurch and Auckland.
Another possibility would be to apply the Results Approach in other outcome areas. When the government set the 10 Results, they intentionally excluded economic targets as these were included in a separate program, the Business Growth Agenda (Ministry of Business, Innovation and Employment 2015). It may be possible to use a small number of impact targets to improve performance in addressing several economic problems. Natural resource problems were originally excluded from the Results Approach, in part because many natural resource management challenges were captured in the Business Growth Agenda, and in part because of the nature of natural resource problems. Many of the most important resource management issues in New Zealand have long lag times and require a consistent focus that extends well beyond five years. Measurement in the natural resource sector remains an important area of ongoing debate, and a new measurement and report regime has just been introduced (Ministry for the Environment 2015). How the Results Approach could be adapted for the natural resources sector is a possible area for future exploration.
The Results Approach has left the government with a predicament: it appears to be a very successful tool for improving performance and driving meaningful collaboration; however, part of its success appears to be linked to keeping the number of Results small. The temptation to use it everywhere must be balanced with careful consideration of how to keep it tightly focused. This consideration likely applies to the use of impact measures everywhere: the best measurement regimes consist of a small number of simple measures.
This chapter is based on one component of a broader evaluation program that explores and triangulates the effectiveness of the Results Approach from several angles (Scott and Boyd 2016).
THE THREE SECTOR SOLUTION
254
ReferencesBlack, L. J. and D. F. Andersen. 2012. ‘Using visual representations
as boundary objects to resolve conflict in collaborative model-building approaches.’ Systems Research and Behavioral Science 29(2): 194–208.
Boston, J., J. Martin, J. Pallot and P. Walsh. 1996. Public Management: The New Zealand model. Auckland: Oxford University Press.
Boswell, C. 2014. ‘The double life of targets in public policy: Disciplining and signalling in UK asylum policy.’ Public Administration 93(2): 490–505. DOI: 10.1111/padm.12134.
Brignall, S. and S. Modell. 2000. ‘An institutional perspective on performance measurement and management in the “new public sector”.’ Management Accounting Research 11(3): 281–306.
Brooking, R. 2014. Corrections cuts crime with selective use of statistics. Blog. Available from: brookingblog.com/2014/08/03/corrections-cuts- crime-with-the-selective-use-of-statistics/ (accessed 21 July 2015).
Bryson, J. M., B. C. Crosby and M. M. Stone. 2006. ‘The design and implementation of cross-sector collaborations: Propositions from the literature.’ Public Administration Review 66(s.1): 44–55.
Chapple, S. 2013. ‘Forward liability and welfare reform in New Zealand.’ Policy Quarterly 9(2): 56–62.
de Lancer-Julnes, P. and M. Holzer. 2001. ‘Promoting the utilization of performance measures in public organizations: An empirical study of factors affecting adoption and implementation.’ Public Administration Review 61(6): 693–708.
Fletcher, M. 2015. ‘Australia should think twice before adopting NZ welfare model.’ The Conversation, 9 March.
Fox, C. and K. Albertson. 2011. ‘Payment by results and social impact bonds in the criminal justice sector: New challenges for the concept of evidence-based policy?’ Criminology and Criminal Justice 11(5): 395–413.
255
11 . RESULTS, TARGETS AND MEASURES TO DRIvE COLLABORATION
Kania, J. and M. Kramer. 2011. ‘Collective impact.’ Stanford Social Innovation Review 9(1): 36–41.
Kaplan, R. S. 2001. ‘Strategic performance measurement and management in nonprofit organizations.’ Nonprofit Management and Leadership 11(3): 353–70.
Kirk, S. 2015. ‘Crime and welfare-dependency down – Government report card.’ Stuff.co.nz, 6 July. Available from: stuff.co.nz/national/politics/70005112/crime-and-welfare-dependency-down-government-report-card (accessed 21 July 2015).
Kurtz, C. F. and D. J. Snowden. 2003. ‘The new dynamics of strategy: Sense-making in a complex and complicated world.’ IBM Systems Journal 42(3): 462–83.
Leadbeater, C. 1997. The Rise of the Social Entrepreneur. No. 25. London: Demos.
McNaughton, S. 2015. Broader issues of RCTs. Address to the Institute for Government and Policy Studies Symposium: Using Randomised Control Trials in Public Policy. Institute for Government and Policy Studies, Wellington.
Macpherson, M. 2001. ‘Performance measurement in not-for-profit and public-sector organisations.’ Measuring Business Excellence 5(2): 13–17.
Ministry for the Environment. 2015. About Environmental Reporting in New Zealand. Wellington: New Zealand Government. Available from: mfe.govt.nz/more/environmental-reporting/about-environmental-reporting-nz (accessed 17 July 2015).
Ministry of Business, Innovation and Employment. 2015. Business Growth Agenda. Wellington: New Zealand Government. Available from: mbie.govt.nz/what-we-do/business-growth-agenda (accessed 21 July 2015).
Ministry of Social Development. 2012. Investment approach refocuses entire welfare system. Media Release. New Zealand Government, Wellington. Available from: msd.govt.nz/documents/about-msd-and-our-work/newsroom/media-releases/2012/welfare-reform-paper-e-social-obligations.pdf (accessed 21 July 2015).
THE THREE SECTOR SOLUTION
256
O’Leary, R. 2014. Collaborative Governance in New Zealand: Important choices ahead. Wellington: Fullbright New Zealand.
Osborne, D. 1993. ‘Reinventing government.’ Public Productivity & Management Review 16: 349–56.
Revans, R. 1980. Action Learning: New techniques for management. London: Blond & Briggs.
Schick, A. 1996. The Spirit of Reform: Managing the New Zealand state sector in a time of change. Wellington: State Services Commission of New Zealand.
Scott, G. 2001. Public Sector Management in New Zealand: Lessons and challenges. Wellington: The Australian National University.
Scott, R. J. and R. Boyd. 2015. ‘The New Zealand Better Public Services results: A comparative analysis linking inter-agency collaboration with outcome performance.’ In Proceedings of the 2015 Australia and New Zealand Academy of Management Conference. Brisbane: Australia and New Zealand Academy of Management. Available from: anzam.org/conference-material/past-event-material/ (accessed April 2016).
Scott, R. J. and R. Boyd. 2016. ‘Collaborating for results in New Zealand: Evaluation using mixed methods and triangulation.’ In Proceedings of the 2016 International Public Management Network Conference. St Gallen, Switzerland: International Public Management Network.
Scott, R. J., R. Y. Cavana and D. Cameron. 2014. ‘Mechanisms for understanding mental model change in group model building.’ Systems Research and Behavioral Science 33(1): 100–18. DOI: 10.1002/sres.2303.
Selsky, J. W. and B. Parker. 2005. ‘Cross-sector partnerships to address social issues: Challenges to theory and practice.’ Journal of Management 31(6): 849–73.
Smith, P. C. 2009. Performance Measurement for Health System Improvement: Experiences, challenges and prospects. Cambridge: Cambridge University Press.
State Services Commission (SSC). 2001. Report of the Advisory Group on the Review of the Centre. Wellington: State Services Commission. Available from: ssc.govt.nz/roc (accessed 17 July 2015).
257
11 . RESULTS, TARGETS AND MEASURES TO DRIvE COLLABORATION
State Services Commission (SSC). 2003. Managing for Outcomes: Guidance for departments. Wellington: State Services Commission.
State Services Commission (SSC). 2004. Getting Better at Managing for Shared Outcomes: A resource for agency leaders. Wellington: State Services Commission.
State Services Commission (SSC). 2011. Better Public Services Advisory Group Report. Wellington: State Services Commission. Available from: ssc.govt.nz/bps-background-material (accessed 17 July 2015).
State Services Commission (SSC). 2012. Better Public Services: Results. Cabinet Paper CAB (12)19. New Zealand Government, Wellington.
State Services Commission (SSC). 2014. Better public service results: 2014 end-year progress report (with annexes). Cabinet Paper SEC (15)2. New Zealand Government, Wellington.
State Services Commission (SSC). 2015a. Better Public Services: Results for New Zealanders. Wellington: State Services Commission. Available from: ssc.govt.nz/bps-results-for-nzers (accessed 17 July 2015).
State Services Commission (SSC). 2015b. Better Public Services: Snapshot of results at 19 Feb 2015. Wellington: State Services Commission. Available from: ssc.govt.nz/bps-snapshot (accessed 17 July 2015).
Stuart, M. 2014. ‘Future liabilities: Solutions to the “problem of welfare”?’ Open Review of Educational Research 1(1): 183–92.
Vitalis, H. and R. J. Scott. 2015. ‘Joint ventures in the public sector: Translating lessons from the private sector to New Zealand government departments.’ In Proceedings of the 2015 Australia and New Zealand Academy of Management Conference. Brisbane: Australia and New Zealand Academy of Management. Available from: anzam.org/conference-material/past-event-material/ (accessed April 2016).

This text is taken from The Three Sector Solution: Delivering public policy in collaboration with not-for-profits and business, edited by John Butcher
and David Gilchrist, published 2016 by ANU Press, The Australian National University, Canberra, Australia.