Embed Size (px)
Citation preview

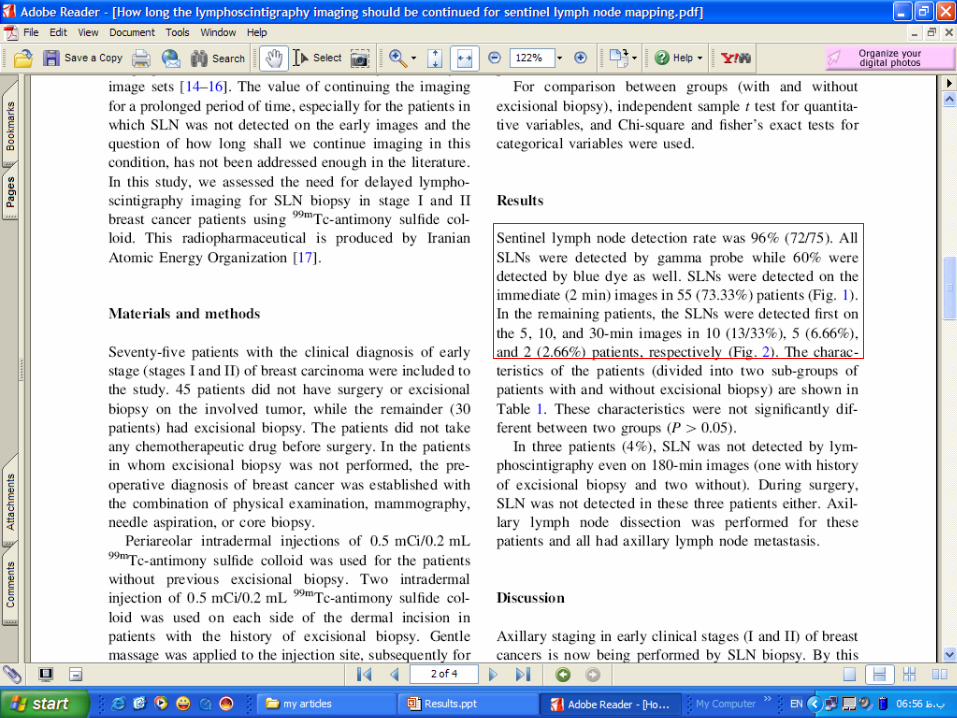
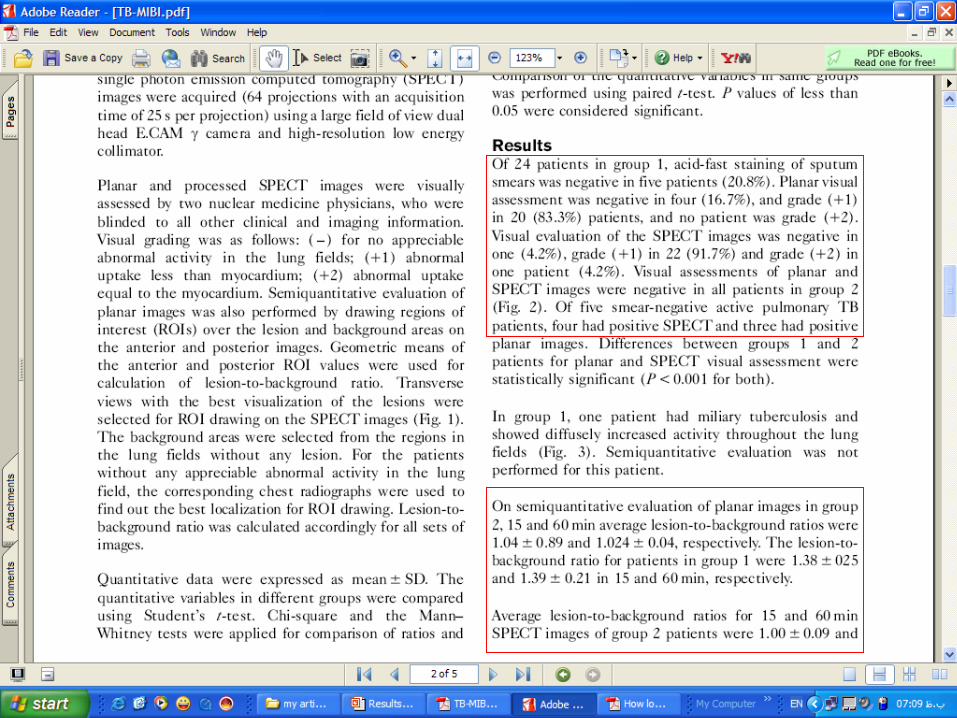
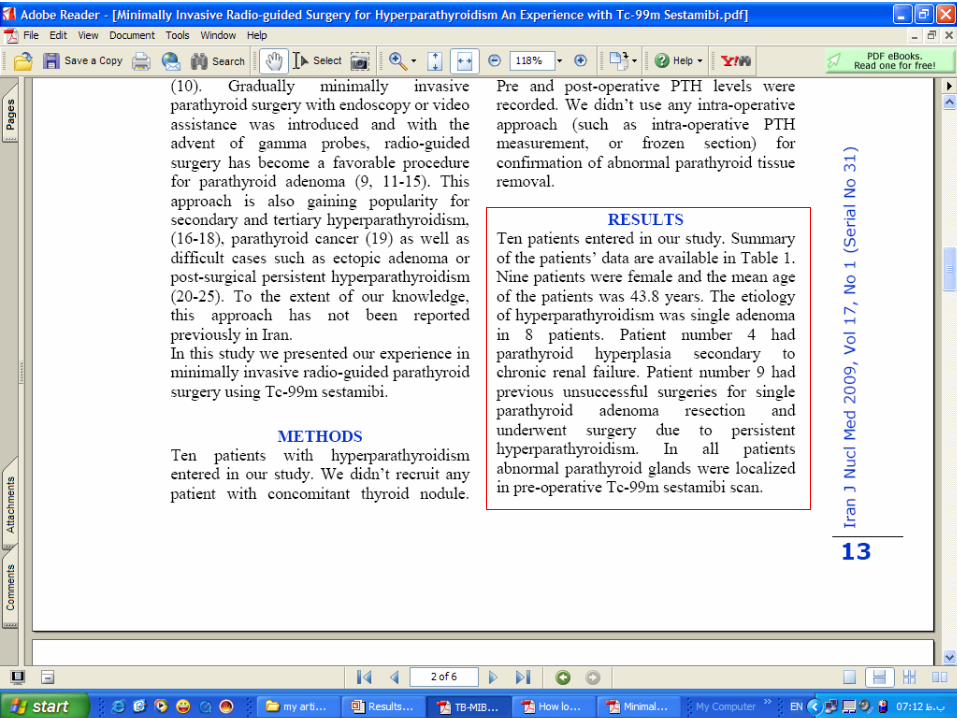
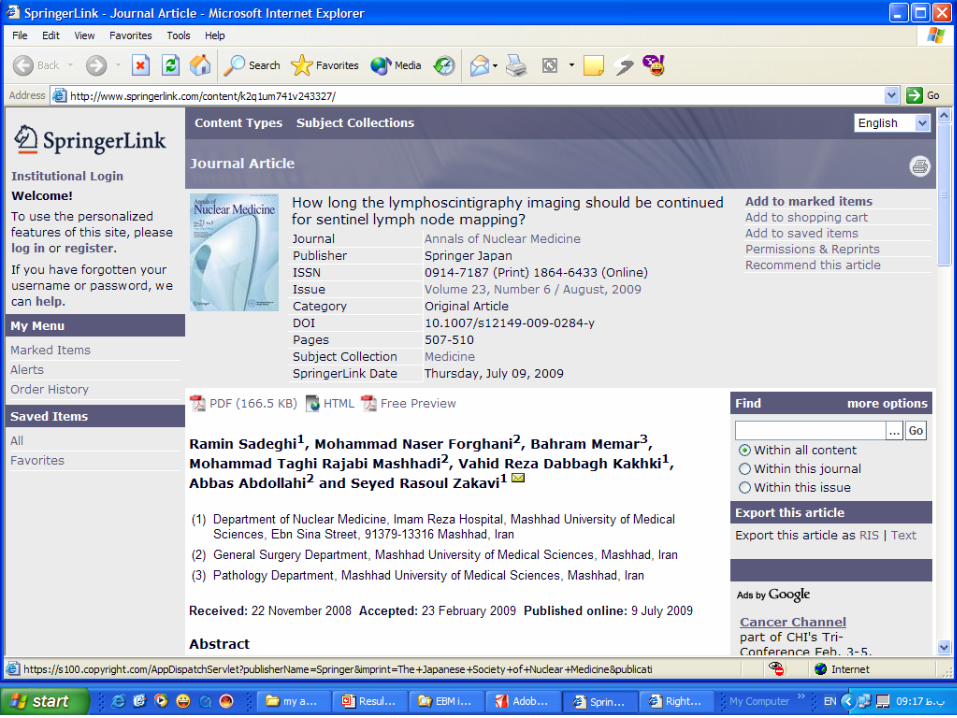
Results
Sadeghi Ramin, MDNuclear Medicine Research
Center,Mashhad University of Medical
Sciences
Results
This is the easiest part to prepare Use Figures and Tables as much as
you can
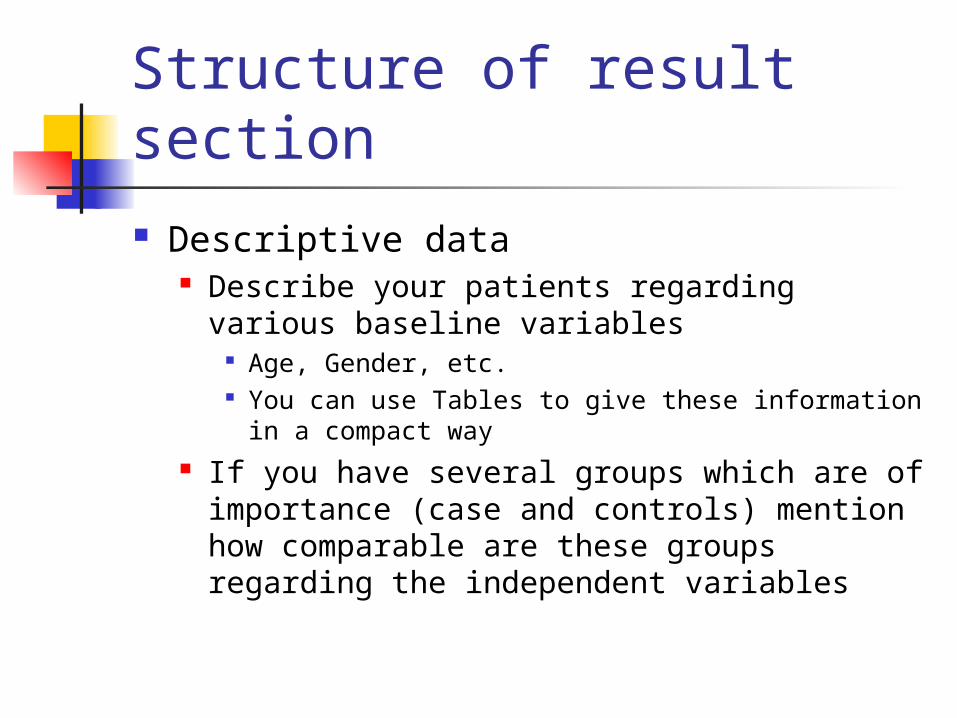
Structure of result section Descriptive data
Describe your patients regarding various baseline variables
Age, Gender, etc. You can use Tables to give these information in a
compact way If you have several groups which are of
importance (case and controls) mention how comparable are these groups regarding the independent variables

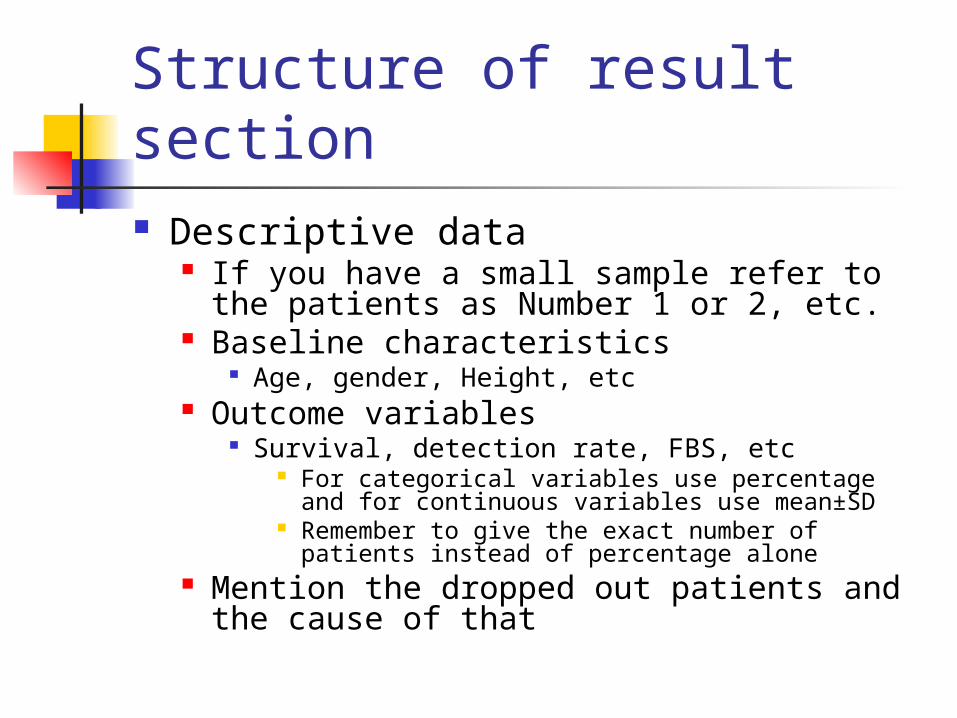
Structure of result section Descriptive data
If you have a small sample refer to the patients as Number 1 or 2, etc.
Baseline characteristics Age, gender, Height, etc
Outcome variables Survival, detection rate, FBS, etc
For categorical variables use percentage and for continuous variables use mean±SD
Remember to give the exact number of patients instead of percentage alone
Mention the dropped out patients and the cause of that

Structure of results section
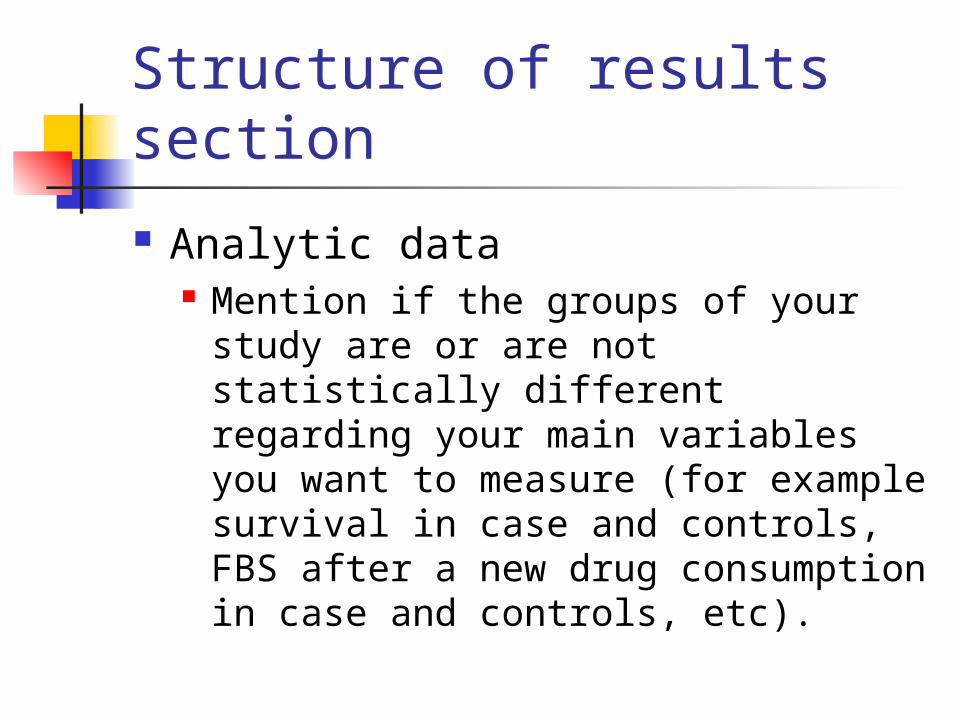
Analytic data Mention if the groups of your study
are or are not statistically different regarding your main variables you want to measure (for example survival in case and controls, FBS after a new drug consumption in case and controls, etc).


Structure of results section Analytic data
Start with simple univariate analysis an go on to multivariate one
If the variables are too many use Tables and figure
Tables if you want to give exact values Figures if the exact values are not that important
Do not duplicate the tables data in the text Text, tables, and figures should complement
each other


Tables
Always refer to the information for authors section of the journal
Use them for Summarizing the data Instead of text
For case series
Tables
Title Should be interpretable by its own The reader should not be required to
refer to text for understanding the table.
Give the unnecessary details (such as dose, abbreviations, etc in the footnote of the table)
Tables
Usually the first column has the heading of each row
The first row has the heading for each column
Identify the groups completely do not use group A, B, etc
Tables Always cite the table in the text Do not use vertical lines Identify statistically significant p-
values by * Use enough distance between
columns and rows Sometimes percentage can also be
used in the tables

Tables
No empty cell should be present Use – or some other symbol for these
cells and give the reason why they are empty in the footnote
Identify the order of footnotes by *,†,‡,§,║,¶ Use the insert symbol command of the word
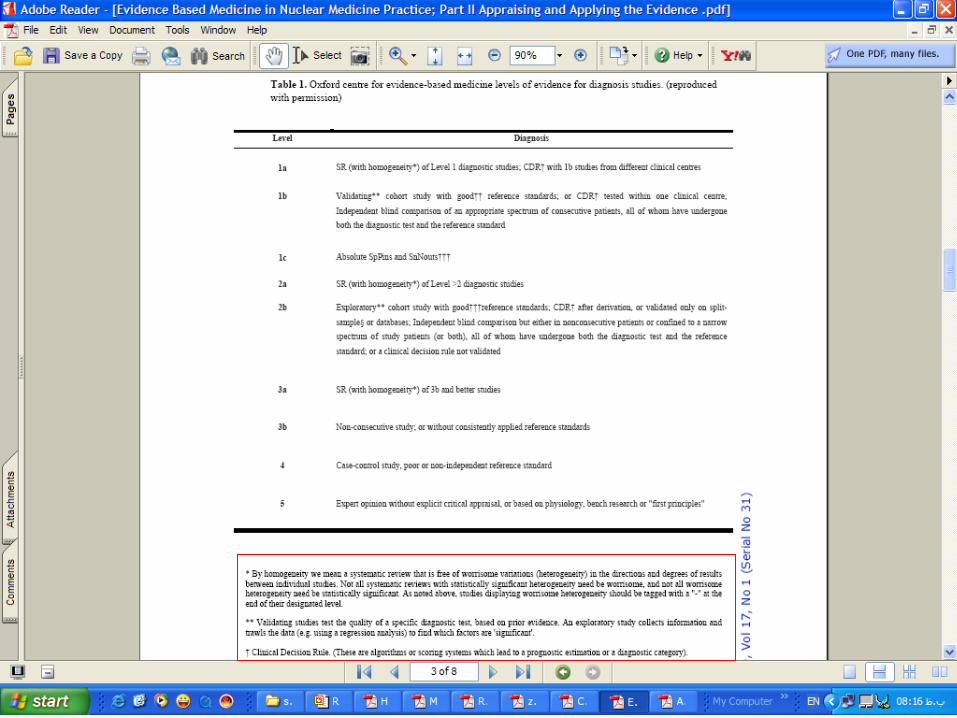
Types of tables
Tables listing some information For example the inclusion and
exclusion criteria
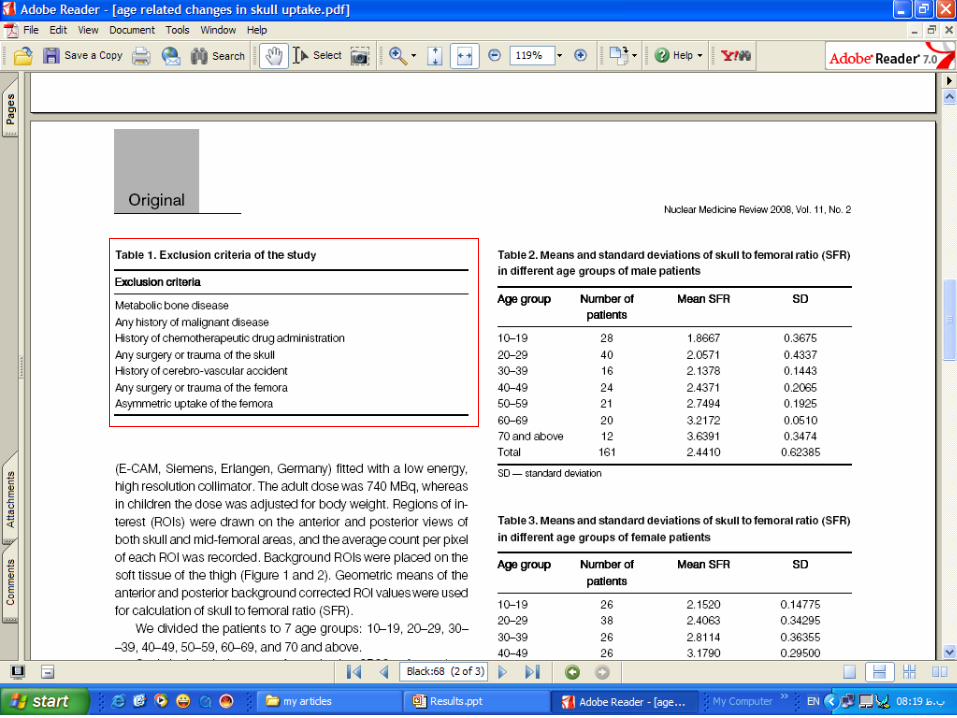

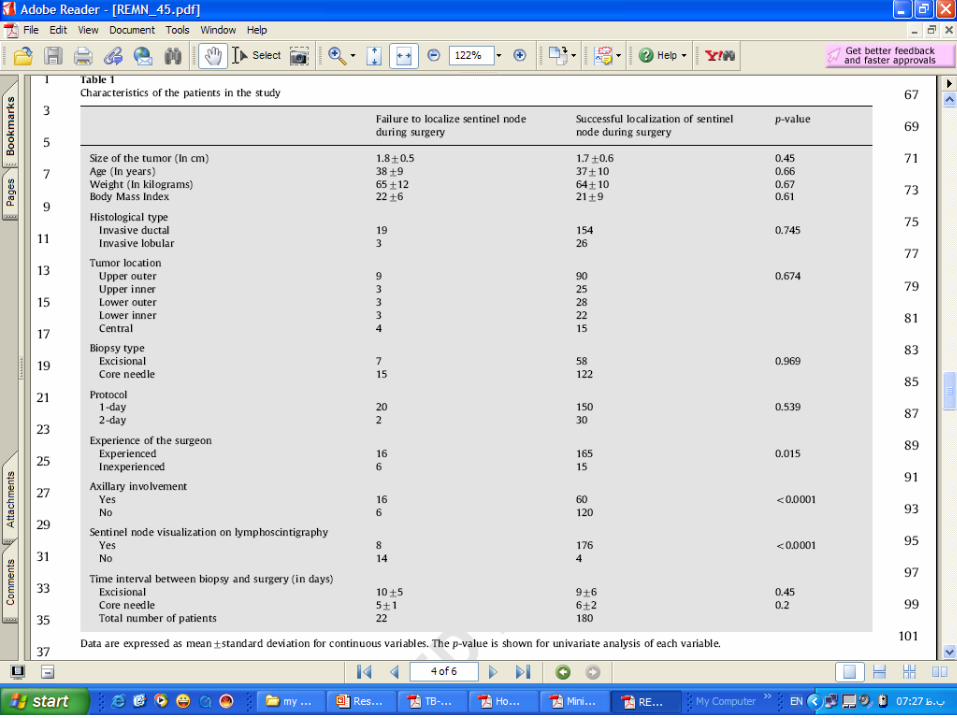
Types of tables
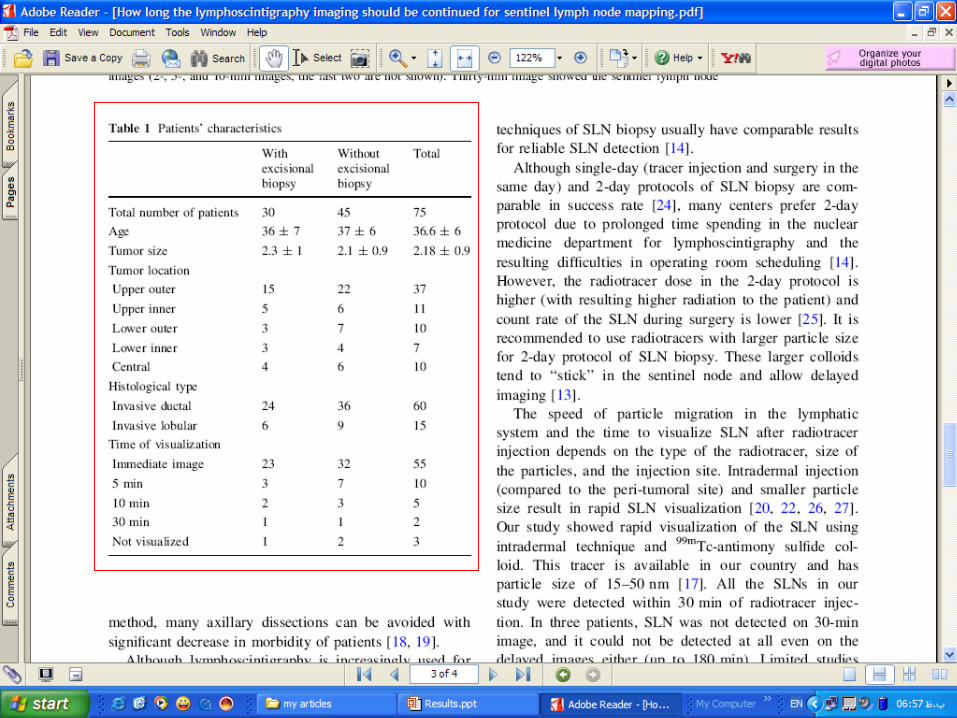
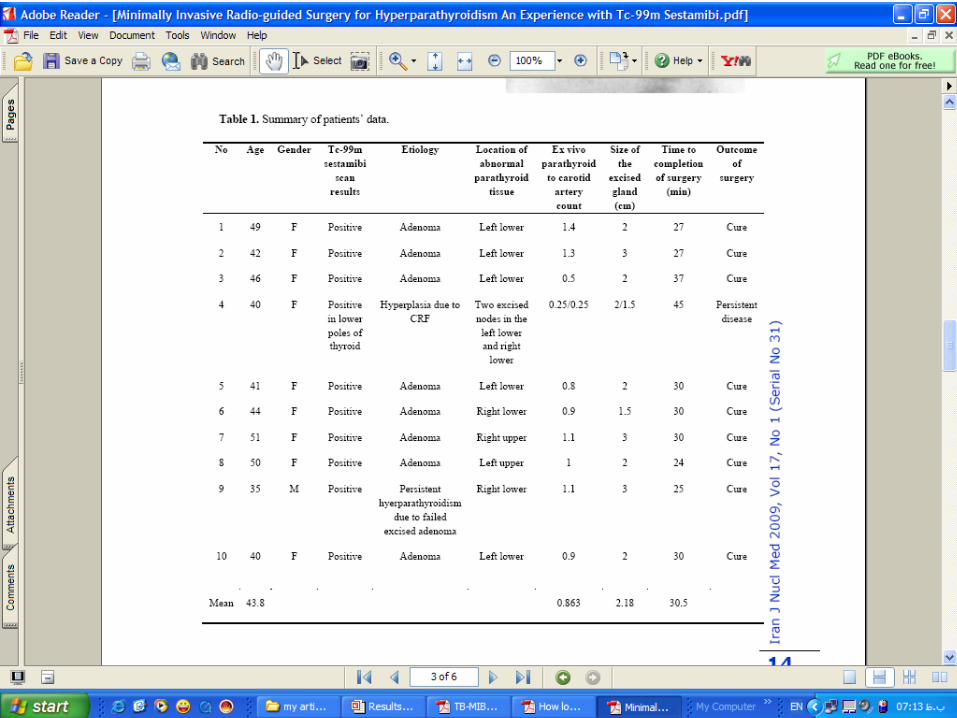
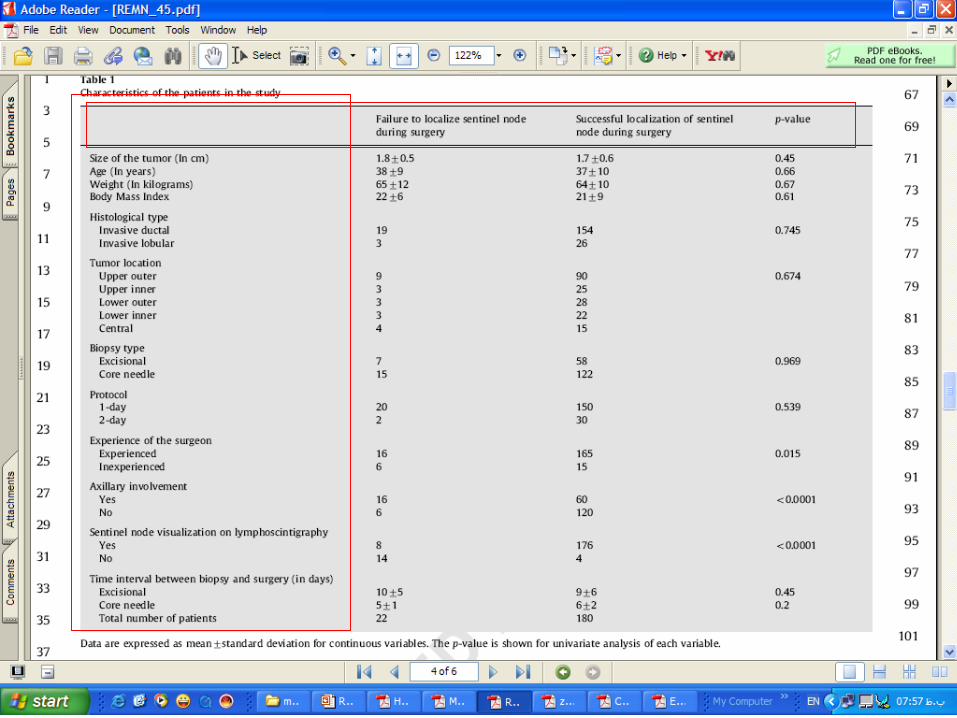
Tables giving the characteristics of the patients

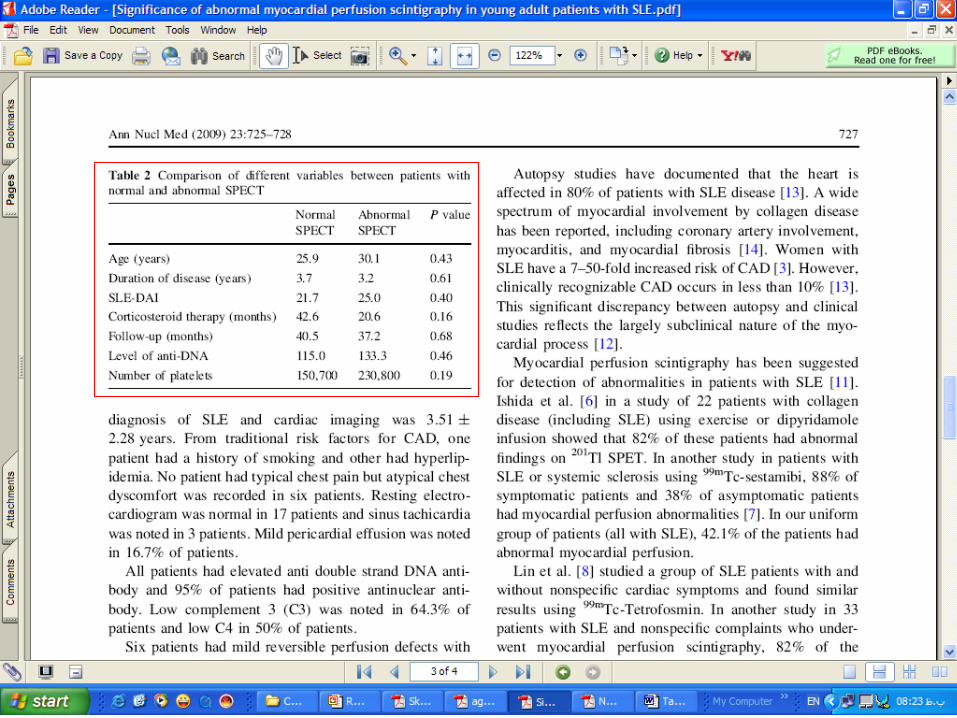
Types of tables
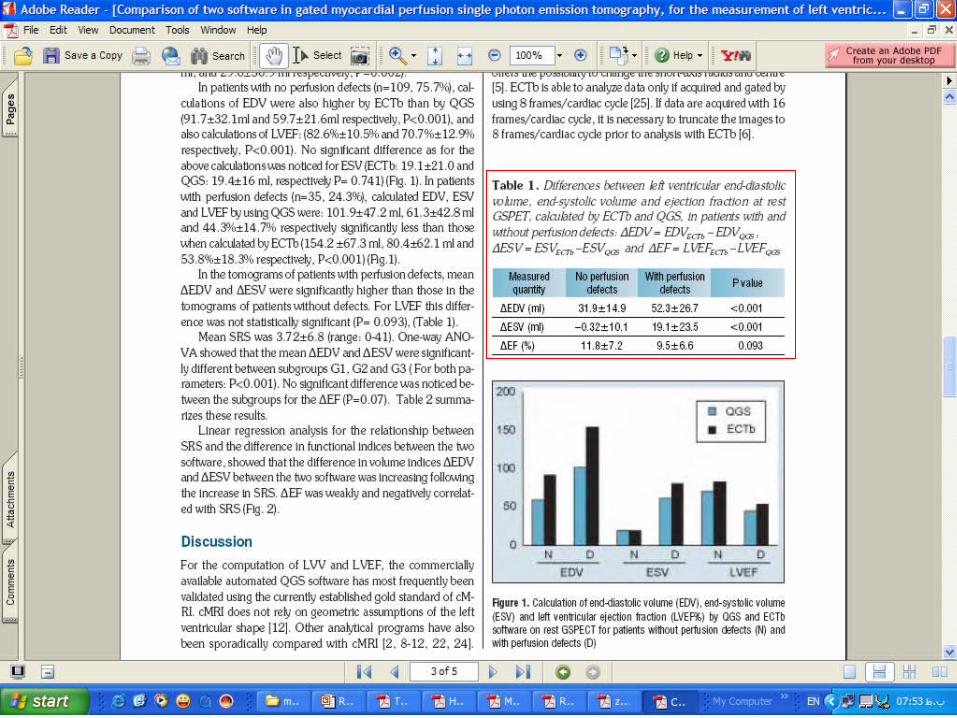
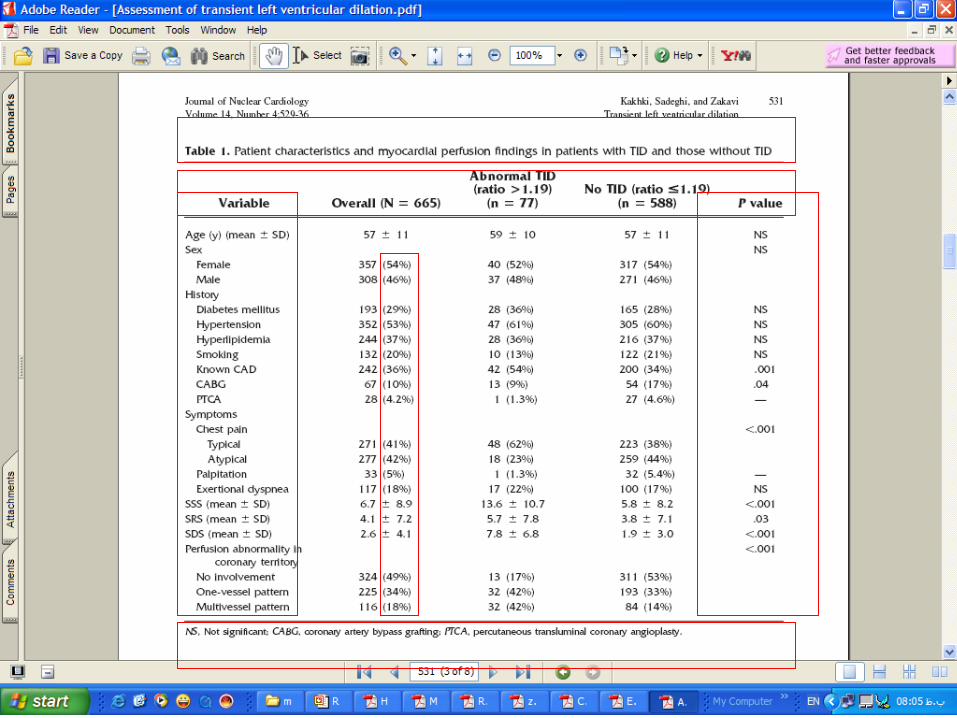
Tables giving comparisons between some groups

Group work
• Design the table shown on the wall yourself using your computer
Figures
Very useful for conveying some notions
Very time consuming Refer to the information for
authors of the journal
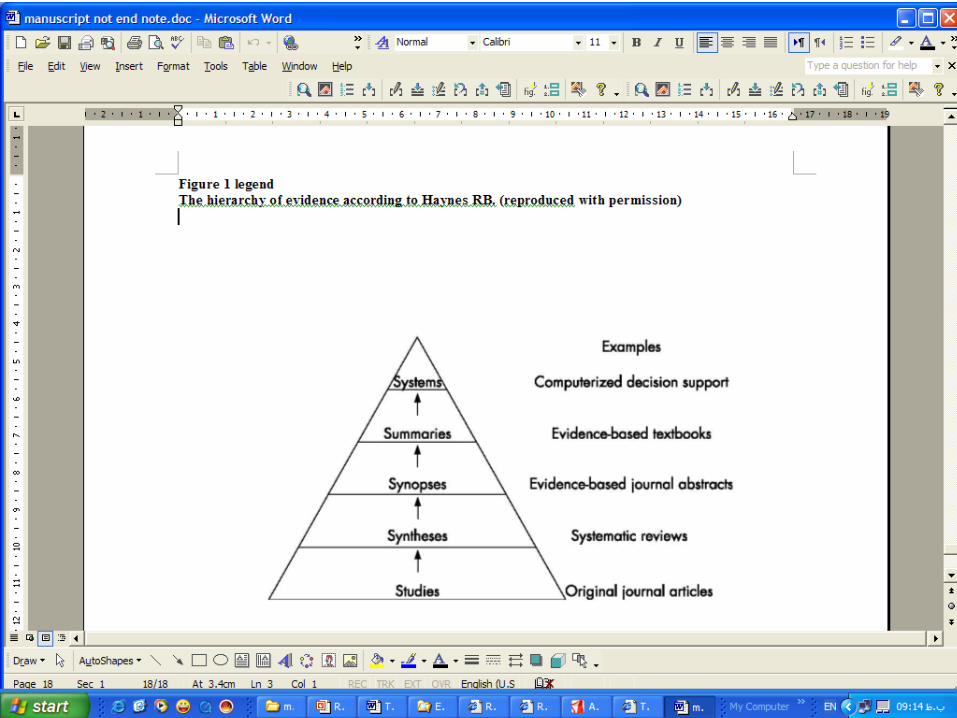
Figure
Figure legends Number the figures consequently and
always cite them in the text Explain the different parts of the figure
(top, bottom, arrows, hollow arrows, etc) You should have informed consent from
a patient if you want to use his/her name Cover the eyes or blur them
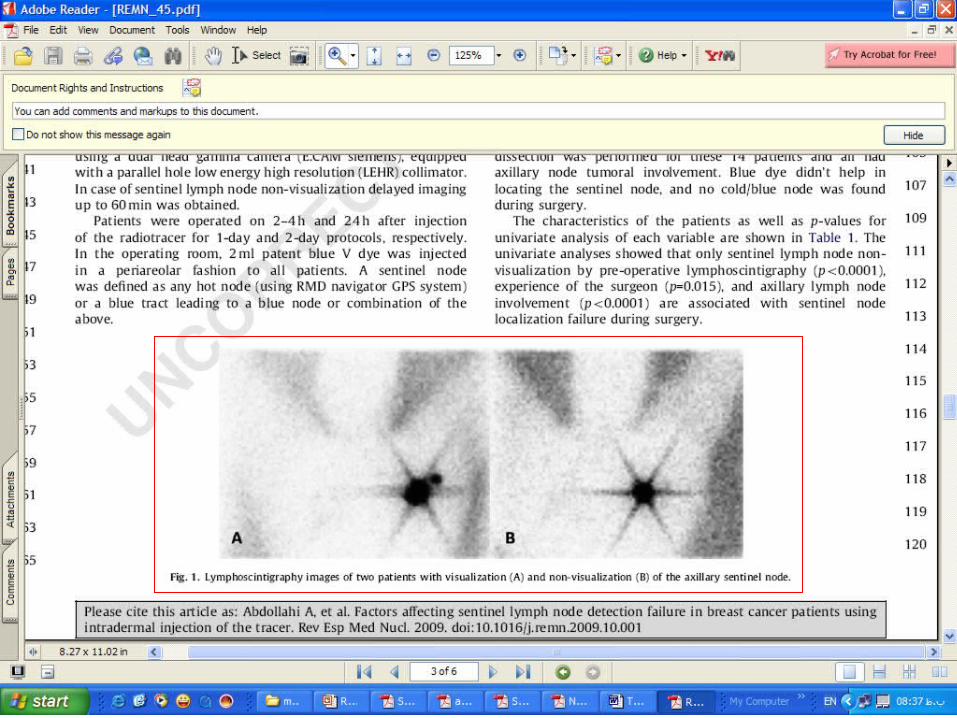
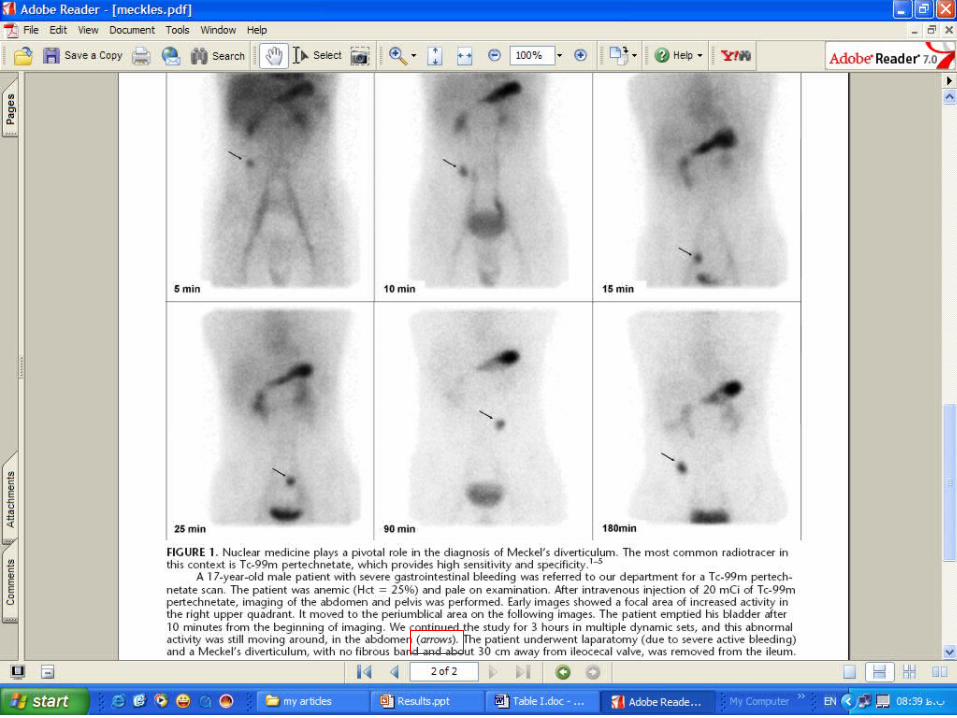
Types of figures
Photos Patients, radiographies, etc. Some radiographies are digital such
as nuclear medicine images, CT, MRI, etc
Use these digital photos
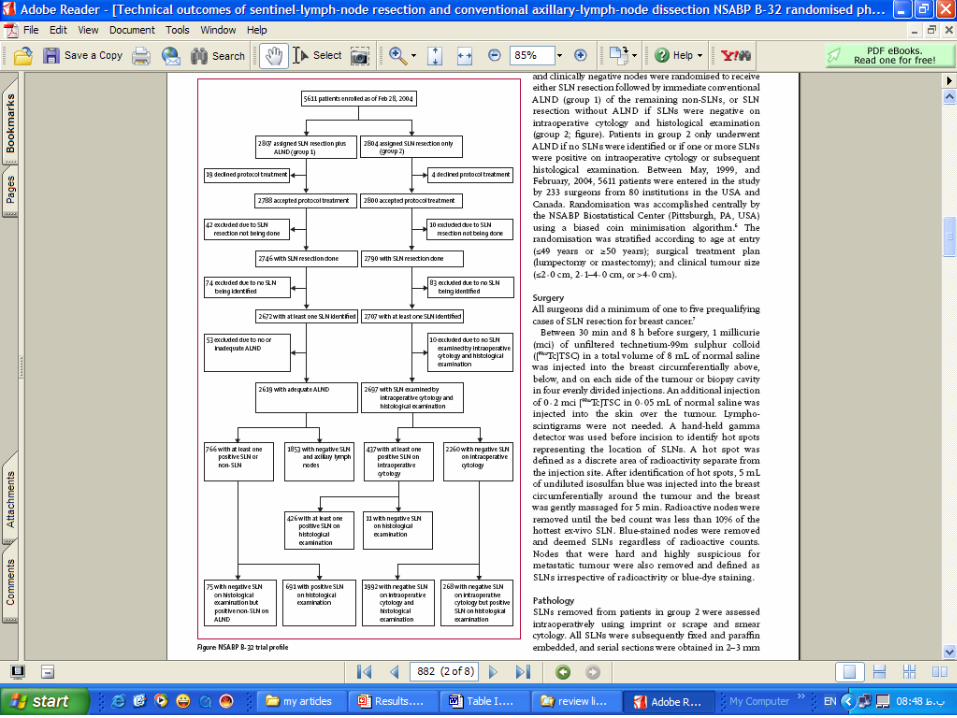
Types of figures
Diagrams To show sampling, patients follow up,
pedigree, etc. Can be designed by word or
powerpoint
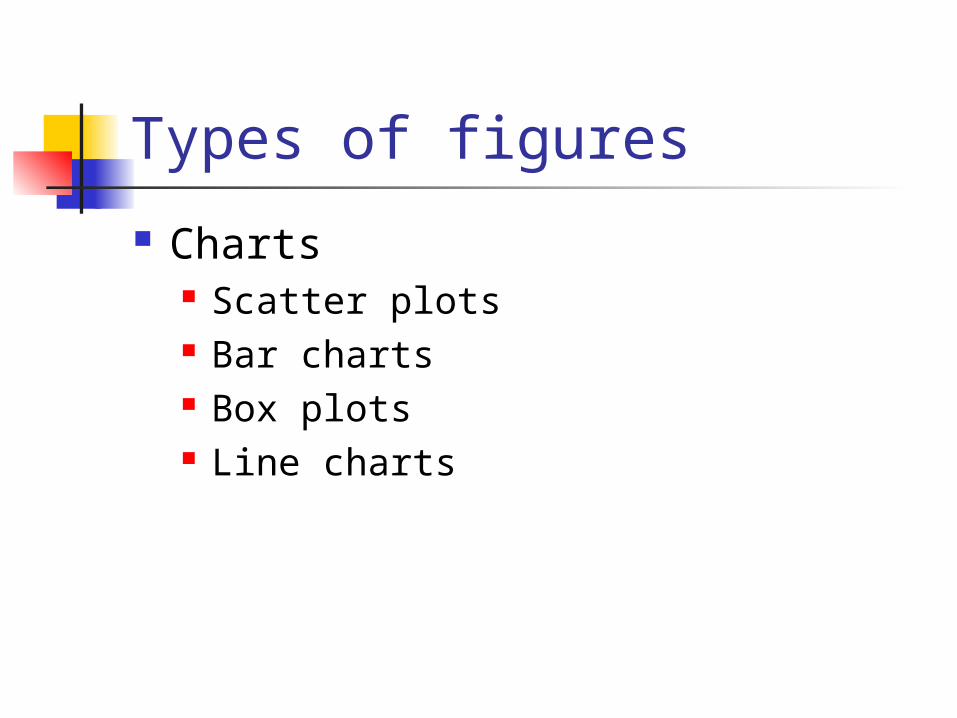
Types of figures
Charts Scatter plots Bar charts Box plots Line charts
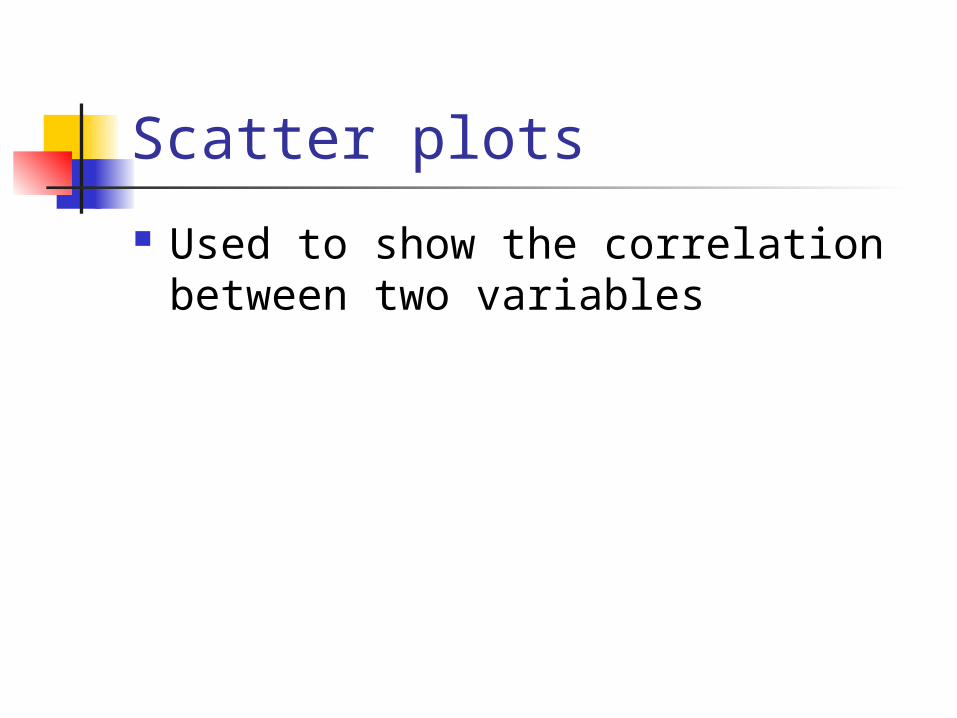
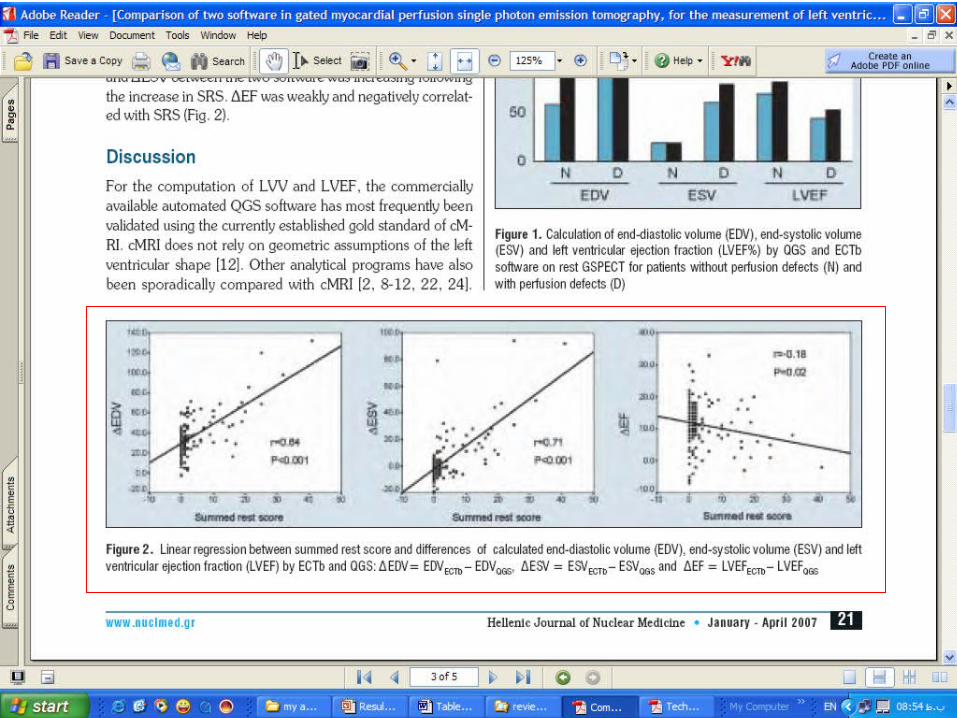
Scatter plots
Used to show the correlation between two variables

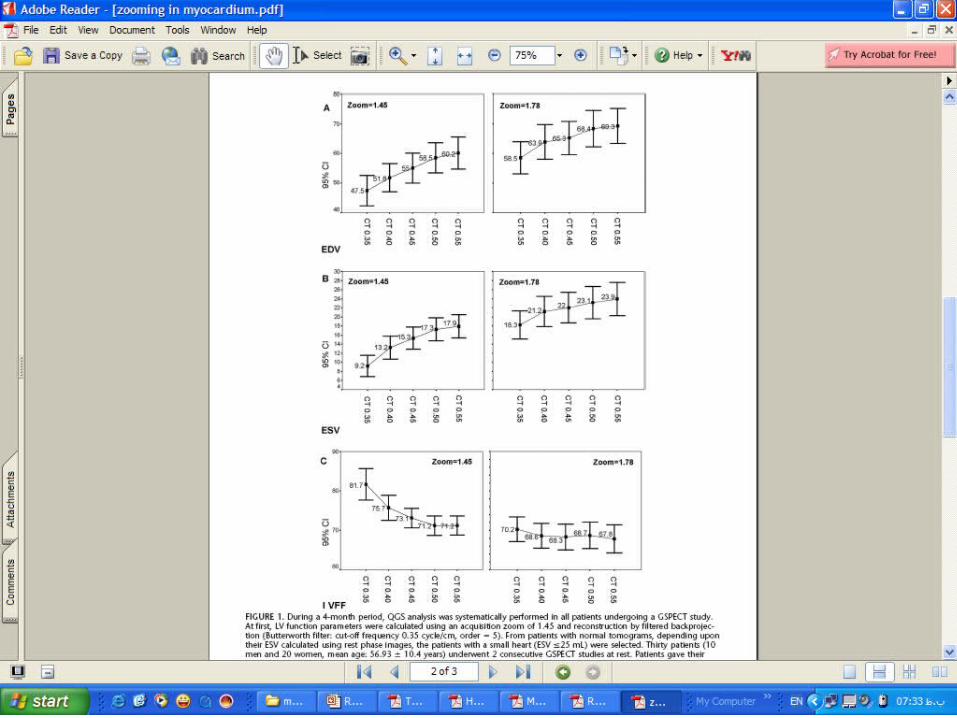
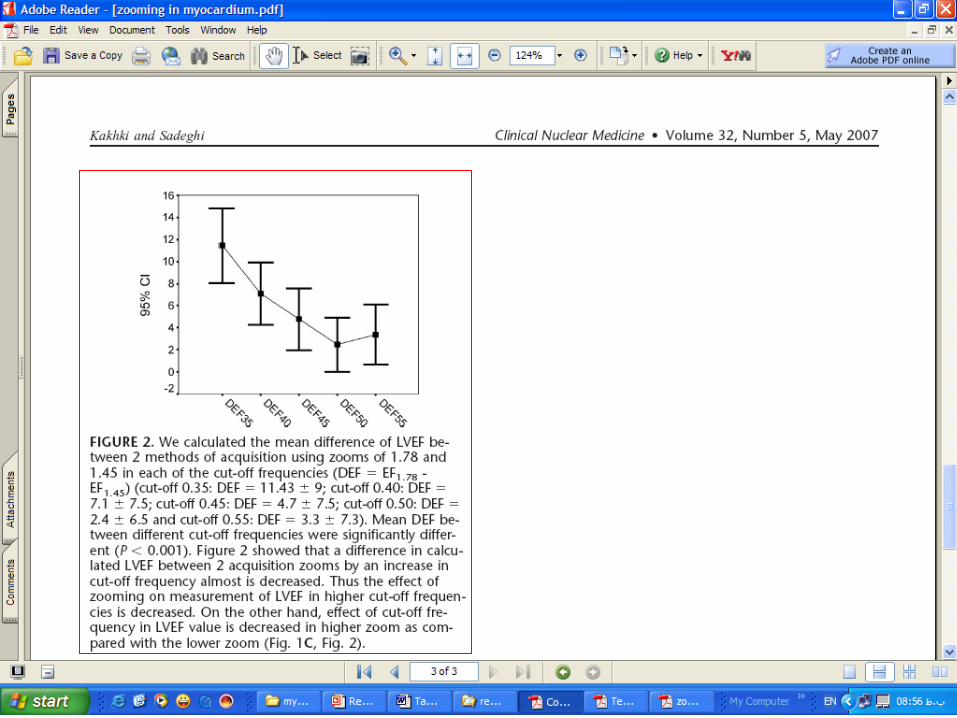
Box plots
If you want to give mean and confidence intervals of several groups for comparison
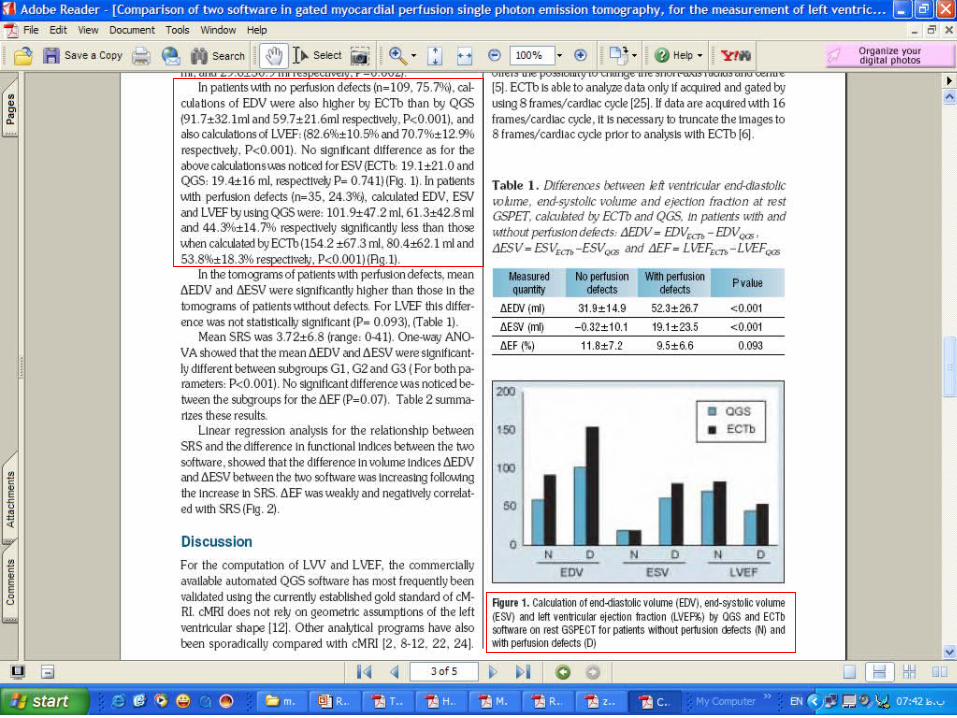
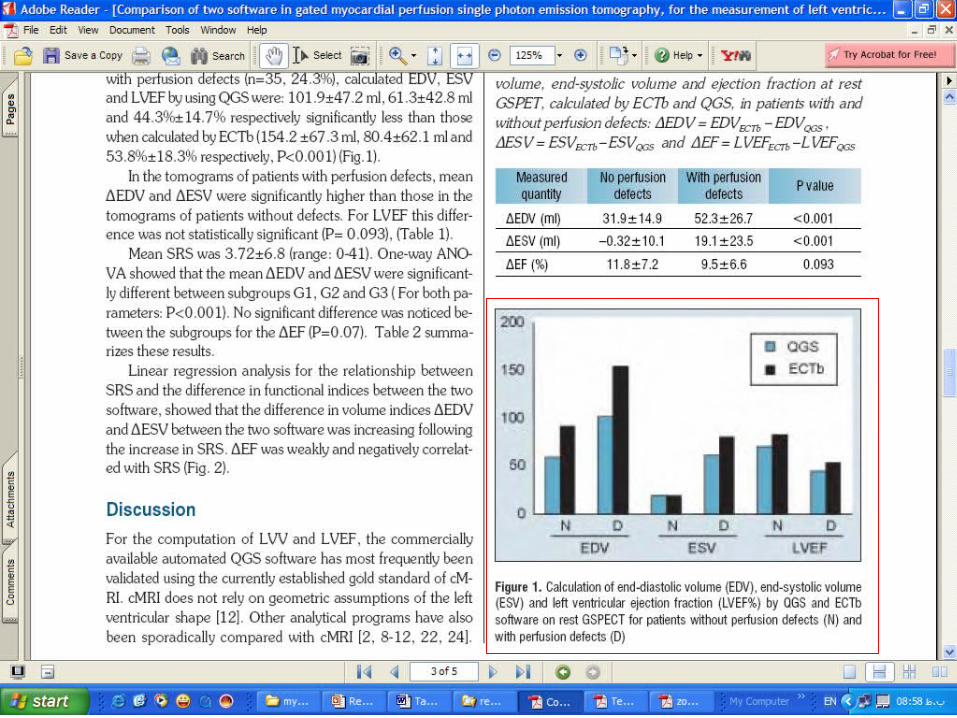
Bar charts
To give several groups and subgroups for comparison

Some tips
Use the horizontal axis for independent and vertical axis for dependent variable
Give each axis a name and its unit of measurement
Always use your computer to prepare your figures if you could

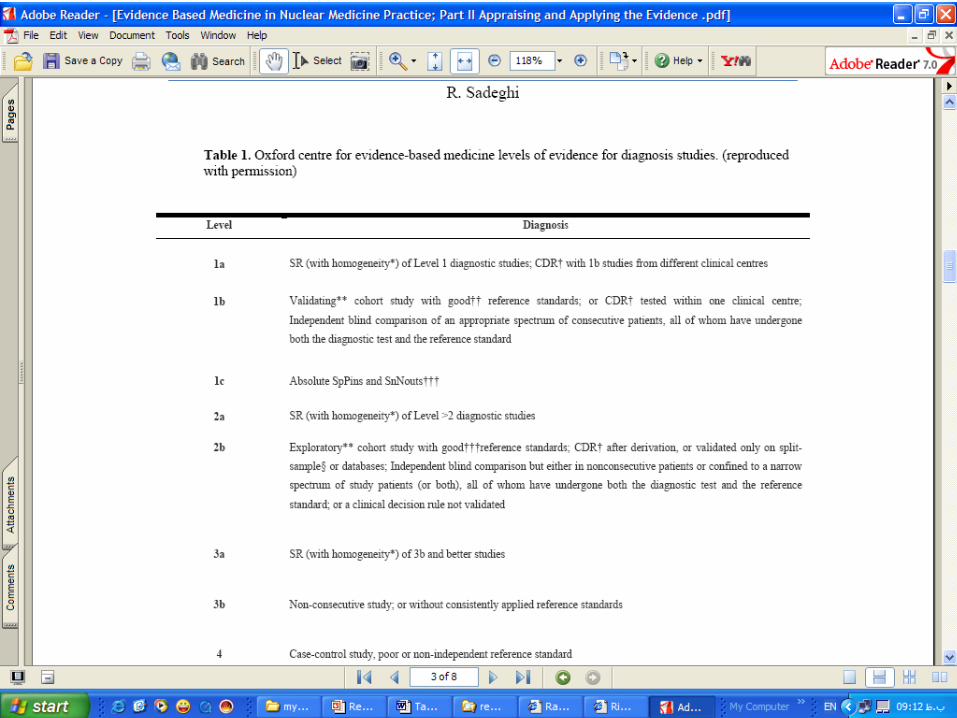
Permission for reproducing figures and tables
Get the permission from the copyright holder This is usually the publisher
Sometimes you can e.mail the responsible person in this regard.
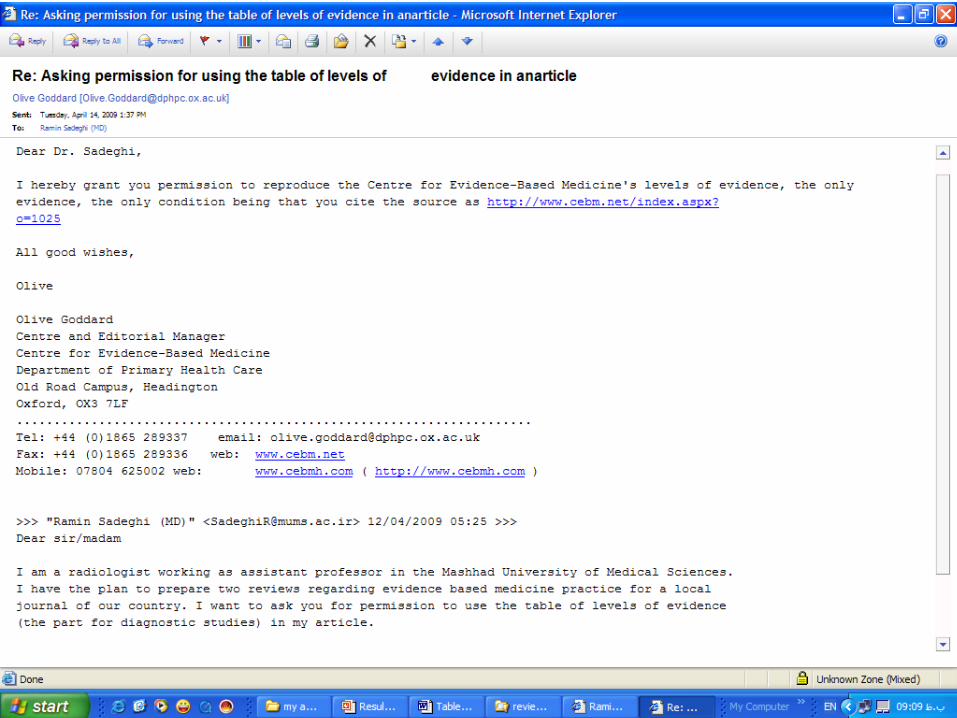
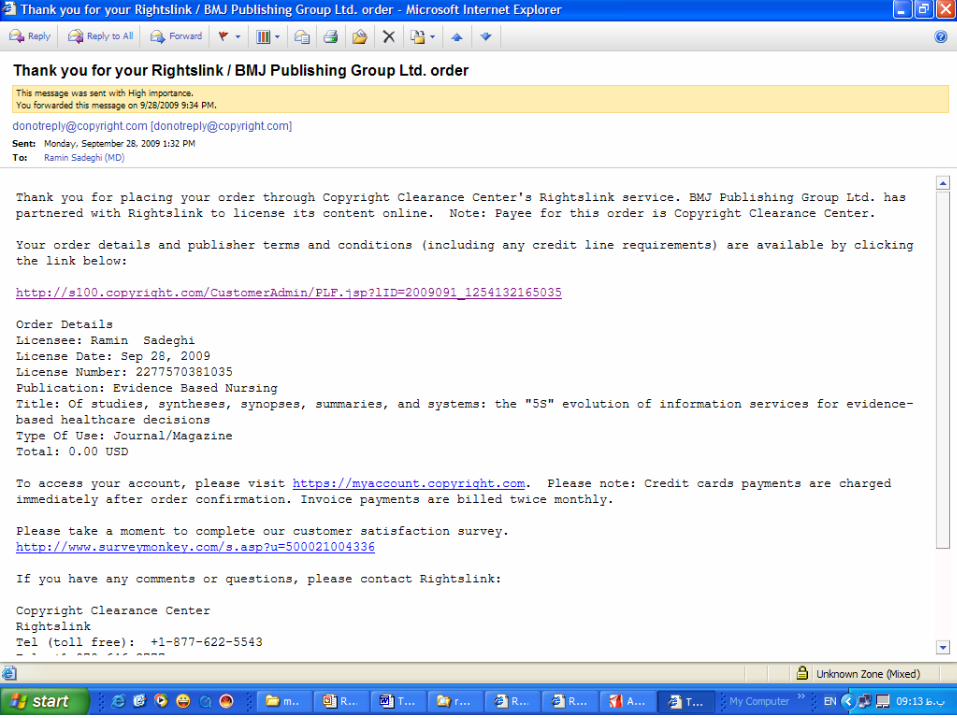

Group work
• Ask for permission to reproduce and image from a publisher


![Mashhad Deployment Rev1[1].4](https://img.pdfslide.us/doc/110x75/5695cf0c1a28ab9b028c5c8a/mashhad-deployment-rev114.jpg)


![Secure Wordpress - 2016[17May - Mashhad]](https://img.pdfslide.us/doc/110x75/58f29ae31a28ab96158b4593/secure-wordpress-201617may-mashhad.jpg)