Embed Size (px)
Citation preview
Results Report on theVitamin C Pilot Program
CONTRIBUTING AUTHORSFrançoise ChoméPeter Ranum
PUBLICATION DATE1997
PUBLICATION BYSUSTAIN, Washington D.C.www.sustaintech.org
SUSTAIN’S objective is to enhance the quality, safety, and availability of food in developingcountries. Through the application of food technology and know-how, SUSTAIN has helpeddeveloping country food manufacturers to enhance the nutrient content, quality, shelf life, andmarketability of locally consumed foods. To this end, SUSTAIN draws on U.S. industryexpertise to assist food manufacturers in developing countries on micronutrient fortification,food processing, post-harvest storage, food safety, and marketing and business development.Further, U.S. specialists assist local counterparts to formulate products that address thespecial needs of women and children most at risk of malnutrition.
Designed as public-private partnerships, SUSTAIN activities draw on a noted pool of foodscientists, nutritionists, and business specialists. Many of these industry specialists serve on avolunteer basis and contribute invaluable guidance, support and expertise. SUSTAIN’sprofessional staff and volunteers work collaboratively with representatives from localgovernments, food industry, public health sector, community organizations, universities andinternational donor organizations throughout the world to design, implement and evaluateprogram activities.
SUSTAIN’S assistance is provided through assessments, technical assistance, and workshoptraining. To examine technical issues in more depth, SUSTAIN conducts scientific studies andorganizes expert advisory panels, technical symposia, and technical publications. Dependingon the nature of the request, SUSTAIN’S assistance is provided either through long-term orshort-term initiatives.
For more information write to:SUSTAIN at 1400 16th Street NW, Box 25, Washington D.C. 20036You may also visit our website and download publications (PDF) at: www.sustaintech.org
This report was made possible through support provided by the Office ofHealth and Nutrition, Global Bureau, U.S. Agency for InternationalDevelopment, under the terms of Grant No. DAN-5120-A-00-1066-00. Theopinions expressed herein are those of SUSTAIN and do not necessarilyreflect the views of the U.S. Agency for International Development, membersof the Advisory Panel, or other persons consulted for this report.
Copyright 1999 by SUSTAIN. All rights reserved.
RESULTS REPORT ON THE VITAMIN C PILOT PROGRAM ii
TABLE OF CONTENTS
Table of Contents .................................................................................................................. ii
List of Tables ....................................................................................................................... iv
List of Abbreviations ............................................................................................................. v
Acknowledgments ................................................................................................................vi
Executive Summary............................................................................................................. vii
I. Objective...........................................................................................................................1
II. Background .....................................................................................................................2
III. The Operational Component...........................................................................................4
A. Special Vitamin Premix................................................................................................4
B. Special Procurement of Commodities...........................................................................4
C. Country Site Selection..................................................................................................5
IV. Monitoring and Evaluation Component ..........................................................................7
A. Methodology ...............................................................................................................7
1. Determination of Vitamin C Uniformity in the Commodities at Plant Sites.................7
2. Determination of Vitamin C Stability from Manufacture to Points of
Distribution........................................................................................................... 10
3. Determination of Within-Bag Variability of Delivered Commodities........................ 13
4. Determination of Vitamin C Retention During Food Preparation............................. 13
5. Analytical Methods ................................................................................................. 16
B. Results and Discussion............................................................................................... 18
1. Uniformity of Vitamin C in the Commodities at Plant Sites...................................... 18
2. Stability of Vitamin C from Manufacture to Points of Distribution........................... 23
3. Within Bag Variability of Delivered Commodities................................................... 25
4. Vitamin C Retention During Food Preparation........................................................ 25
5. Analysis of Vitamin C Cost ..................................................................................... 31
V. Additional Information Requested by the Committee on International Nutrition ............. 34
References........................................................................................................................... 49
VI. Appendices................................................................................................................... 51
RESULTS REPORT ON THE VITAMIN C PILOT PROGRAM iii
A Composition and specification of Wheat Soy Blend (WSB) and Corn Soy Blend
(CSB)
B Advisory panel, statistical subgroup, and other people consulted
C Specifications and laboratory analysis of vitamin fortification premix in CSB/WSB
D Schedule of WSB and CSB pilot procurements from production to distribution
E Cooked food storage temperature history
F Effect of frozen storage on vitamin C content in CSB/WSB samples
G Flow charts of production processes for plants A through E
H Analytical data on CSB/WSB samples taken from plants A through E
I Control charts of vitamin C content in samples taken from plants A through E
J Histogram analysis of vitamin C content in samples taken from plants A through E
K Letter to USAID (specifications for a special production of CSB with high vitamin
C level)
L Analytical data on CSB/WSB samples taken from Haiti and India
M Within-bag variability at distribution point
N Analytical data on cooked CSB/WSB samples taken from Haiti and Tanzania
O USDA letter
P Information on possible alternative CSB/WSB bags
RESULTS REPORT ON THE VITAMIN C PILOT PROGRAM iv
LIST OF TABLES
Table 1. Summary of Plants and Production Runs Sampled...................................................8
Table 2. Minimum Number of Samples that Needed to be Collected
at Distribution Sites............................................................................................... 11
Table 3. Sampling Sites to Study Vitamin C Stability from the Point of
Manufacture to the Point of Distribution ............................................................... 13
Table 4. Summary of Sample Sizes ..................................................................................... 15
Table 5. Summary of Vitamin C Results From Production Plants ........................................ 21
Table 6. Retention of Vitamin C in Dry Commodities ......................................................... 24
Table 7. Summary of Food Preparation Samples Collected in Selected Countries................ 25
Table 8. Summary of Vitamin C Content of the WSB and CSB After Cooking ................... 29
Table 9. Reported Cases of Anemia In Refugee Populations ............................................... 36
Table 10. Reported Scurvy Outbreaks in the Greater Horn of Africa: Somalia,
Sudan, Ethiopia, and Kenya ................................................................................. 39
Table 11. Additional Costs of Adding 50 mg/100g more Vitamin C to CSB/WSB .............. 43
Table 12. Costs of Stabilized Vitamin C Products for CSB/WSB Fortified
at 40 mg/100g ..................................................................................................... 44
Table 13. Cost of Different Forms of Iron........................................................................... 46
Table 14. Possible Consequences of Added Cost from Higher Vitamin C Level .................. 47
Table 15. List of Data Files................................................................................................. 48
RESULTS REPORT ON THE VITAMIN C PILOT PROGRAM v
LIST OF ABBREVIATIONS
ADRA Adventist Development and Relief Agency
AOAC Association of Analytical Chemists
BHA butylated hydroxyanisole
BHR Bureau of Humanitarian Response
BHT butylated hydroxytoluene
CARE Cooperative for American Relief Everywhere
CDC Centers for Disease Control
CIN Committee on International Nutrition
COV coefficient of variation
Cp production capability
Cpk production capability index
CRS Catholic Relief Services
CSB corn soy blend
FDA Food Drug Administration
FFP Office of Food for Peace
FGIS Federal Grain Inspection Service, also called Grain Inspection, Packers and
Stockyards Administration
HPLC high performance (pressure) liquid chromatograph
IOM Institute of Medicine
MCH maternal child health
MT metric ton
NAS National Academy of Sciences
OCF other child feeding
PVO private voluntary organization
PL 480 Public Law 480
RDI recommended daily intake
TCP tricalcium phosphate
SUSTAIN Sharing United States Technology to Aid in the Improvement of Nutrition
UNHCR United Nations High Commissioner for Refugees
USAID United States Agency for International Development
USDA United States Department of Agriculture
WFP World Food Programme
WSB wheat soy blend
RESULTS REPORT ON THE VITAMIN C PILOT PROGRAM vi
ACKNOWLEDGMENTS
The authors wish to express their sincere appreciation to Dr. Sam Kahn and Dr. TomMarchione for their valuable comments, suggestions, and guidance over the course of theVitamin C Pilot Program. The authors would also like to thank the advisory panel andsubgroup members (listed in Appendix B) for their dedication to this study and for theirvaluable expertise. Staff members at SUSTAIN and numerous other people deserve ourappreciation (see Appendix B), but the list is too long for this page. Each of theircontributions was extremely important, and contributed to the overall success of the VitaminC Pilot Program.
RESULTS REPORT ON THE VITAMIN C PILOT PROGRAM vii
EXECUTIVE SUMMARY
This report contains the results of the USAID Vitamin C Pilot Program for use by USAID inconsultation with the National Academy of Sciences to determine appropriate vitamin Cfortification levels in food commodities used in U.S. food aid programs.
The Vitamin C Pilot Program, initiated in March 1996, was designed to produce, provide, andevaluate food aid commodities with increased levels of vitamin C fortification. Using standardprocedures, USAID's Food for Peace program procured two commodities for the pilotprogram. These commodities, corn soy blend (CSB) and wheat soy blend (WSB), wereprovided to Tanzania and Haiti at higher levels of vitamin C. SUSTAIN provided technicaladvice and monitored and evaluated the results of the program.
The report details the following monitoring results:
1. The uniformity of vitamin C distribution in the products at five plant sites. VitaminC distribution at each plant site varied from plant to plant and within any given productionrun. The variability was particularly evident in CSB, which is produced by a continuousprocess. WSB, while produced in much more limited quantities, is processed by a batchsystem and showed more uniformity. The ability of the different plants to control theamount and variation of vitamin C added to the commodities was dependent on the typeof processing equipment, plant design, and quality control procedures used in each plant.
2. The stability of vitamin C from point of production to distribution of CSB shippedto India and of WSB shipped to Haiti. The time involved for shipping, transport, andstorage (nine months for Haiti and five months for India) resulted in very little loss ofvitamin C. The WSB with the conventional level of added vitamin C that was sent to Haitishowed a small (13%) but significant (P<.01) loss of vitamin C. The WSB with the highlevel of added vitamin C and the CSB sent to India showed no significant (P>.05) changein vitamin C.1
3. The variation of vitamin C distribution within bags after shipping and handling toHaiti and Tanzania. Within-bag variation was tested after shipping and handling bysampling bags at two recipient sites from the top, middle, and bottom of the bag. Therewas variation among samples taken from the three bag locations but the variability wasconsistent throughout the bag, indicating that there was no systematic stratification orconcentration of the vitamin within one part of the bag.
4. The stability and presence of vitamin C after food preparation by recipients in aregular program in Haiti and an emergency program in Tanzania. Retention ofvitamin C added at conventional levels was between 17 and 32% in CSB gruel samplesand was 27% in WSB gruel samples. Gruel samples containing 14% CSB or WSB are the
1 The pilot CSB procurement sent to Tanzania could not be tested for vitamin C because the distribution ofadded micronutrients in this pilot procurement was not uniform. Therefore, it was deemed impractical forpurposes of means comparisons; consequently, a procurement of conventional CSB shipped to India wassubstituted.
RESULTS REPORT ON THE VITAMIN C PILOT PROGRAM viii
most common foods prepared from these commodities, accounting for 62% of the 39prepared food samples collected. CSB and WSB containing low levels (below 24mg/100g) of vitamin C lose nearly all of the vitamin C during cooking. Conversely, thehigher vitamin C levels allowed cooked food to retain some vitamin C at the time ofconsumption. The retention at high levels of added vitamin C was 56% in CSB gruel and32% in WSB gruel. In the refugee camps in Tanzania, the next most common food madefrom CSB was “ugali,” which contains 40% CSB. It showed an average vitamin Cretention after cooking from 36 to 74% for ugali prepared with CSB containing high levelsof vitamin C. In Haiti, the second most cooked dish made from WSB contained 80%WSB. This dish showed a mean vitamin C retention of 18% with WSB containing theconventional level of vitamin C and a mean retention of 33% with WSB containing thehigh level of vitamin C.
5. A projection of the increased cost to the Food for Peace Program of increased levelsof vitamin C. The current price of the ethyl cellulose coated vitamin C used inconventional CSB and WSB (40mg/100g) is $9/kg or $3.69/MT of fortified CSB orWSB. The price of vitamin C fluctuates and is currently quite low compared to pastyears, when the cost was twice as high. If the ethyl cellulose coated vitamin C level of thecommodities was increased from its present level of 40 mg/100g of commodity to 90mg/100g, the cost would increase by $6.33/MT. Part of this cost increase can beattributed to having to use a more dilute vitamin premix, resulting in higher storage andshipping expenses.
These results are fully detailed in samples and analyses shown in the appendices.
The report also presents supplemental information requested by the Committee onInternational Nutrition of the National Academy of Sciences. Reports of scurvy outbreakshave been confined, except in rare occasions, to refugee populations in East Africa whererefugees are largely dependent on food aid. SUSTAIN's literature search did not identifycases of scurvy that were attributed to food aid in regular development programs.
General rations containing inadequate vitamin C, combined with a lack of diversity of foodsources, have been named as the primary factors for outbreaks of scurvy in displaced andfamine-affected populations. Other characteristics are lack of ability to cultivate or trade forother food sources, remoteness and inaccessibility, cultural factors affecting food acceptance,and age and physiological status (pregnancy and lactation) of individuals in these situations.Many authors recommend 6 to 10 mg of vitamin C a day as a minimum requirement toprevent clinical manifestation of scurvy. The amount of vitamin C provided by CSB or WSB,containing 40 mg/100g of vitamin C at the point of consumption, when provided at a ration of30 grams of CSB or WSB per day, would be 3.6 mg/day given a 30% cooking retention.
Until 1994, fortified cereal blends such as CSB and WSB were only occasionally provided inthe general ration to refugees in East Africa when high prevalence of scurvy was determined.Most reported outbreaks of scurvy occurred before 1990. Fortified blended foods are nowmore routinely provided in emergency food aid program.
Use of vitamin C tablets was not found to be a practical method for preventing vitamin Cdeficiency in refugee populations.
RESULTS REPORT ON THE VITAMIN C PILOT PROGRAM ix
Based on current production, increasing the level of vitamin C in all CSB and WSB producedto 90 mg/100g while keeping the current budget constant would reduce the tonnage producedby 4,662 metric tons and reduce the number of persons that could be fed a ration of 30 gramsper day for a year by 425,797.
This report also includes information on alternative bagging, use of antioxidants, alternativeforms of vitamin C, and iron fortification. Alternative forms of packaging are underconsideration by the U.S. Department of Agriculture (USDA). USDA's primary interest inevaluating alternative packaging materials is to improve the strength of the bag rather thanimproving the micronutrient protection. Improved vitamin C protection does not appearnecessary: this study showed relatively low levels of vitamin C degradation after shipping,handling, and storage.
A discussion of alternate forms of iron that might reduce the oxidation of vitamin C is alsoincluded in this report. However, this report also notes that further testing would be neededto determine the feasibility, acceptability, and cost of incorporating these other sources of ironinto CSB and WSB.
The form of vitamin C currently used in CSB and WSB contains 97.5% ascorbic acid with a2.5% ethyl cellulose coating. There are alternative forms of vitamin C now available withcoatings of different types and thickness. These may provide better protection during foodpreparation than the current product, but no studies have been done to determine that. Thereare also other chemical forms of vitamin C with improved heat stability that are used inaquaculture, but none have been approved for human feeding.
RESULTS REPORT ON THE VITAMIN C PILOT PROGRAM 1
I. OBJECTIVE
This activity provided technical information to the U.S. Agency for International Development(USAID) Vitamin C Pilot Program, which was designed to produce, provide, and evaluatefood aid commodities that are fortified with increased levels of vitamin C. SUSTAINspecified the premix, recommended the pilot production quantity, and advised on field siteselection. SUSTAIN also monitored and evaluated product quality, production costs, andvitamin C stability from the point of manufacture to the point of distribution and consumption.Two vitamin C fortified commodities used in the USAID Food for Peace Program wereevaluated: corn soy blend (CSB) and wheat soy blend (WSB). This report presents results foruse by USAID and the Committee on International Nutrition (CIN), Institute of Medicine ofthe National Academy of Sciences (NAS), to determine whether vitamin C levels in U.S. foodaid commodities need to be increased.
RESULTS REPORT ON THE VITAMIN C PILOT PROGRAM 2
II. B ACKGROUND
Corn soy blend (CSB) and wheat soy blend (WSB) products are highly nutritious, low-cost,fortified foods that are used to deliver a wide array of macro- and micronutrients in the P.L.480, Title II, Food for Peace Program. In fiscal year 1996 (October 1995 through September1996), 238,300 metric tons (MT) of CSB and 11,310 MT of WSB were programmed fordevelopment activities and emergency activities such as refugee camp food distribution(USAID Annual Food Assistance Report, 1996). These blended cereal-based foods arepartially precooked, which allows them to be easily incorporated into a number of differentfood preparations by recipients.
CSB and WSB are fortified with six essential minerals and eleven vitamins. This fortificationaccounts for 13% of the product cost. Like other P.L. 480 commodities, CSB and WSB areprocured for USAID by the U.S. Department of Agriculture (USDA) Export OperationsDivision/Farm Service Agency. Currently there are seven different commercial companiesapproved by USDA to produce these commodities.
According to USDA guidelines, commodities must be produced in the United States underinspection by the USDA Grain Inspection, Packers and Stockyards Administration/FederalGrain Inspection Service (FGIS). An FGIS representative is present during commodityproduction and takes samples for analysis. Chemical and physical tests are run on thesesamples to determine compliance with specifications for the finished CSB/WSB. Theseroutine tests include some nutritional analyses (protein, fat, moisture content, crude fiber), butthey do not include tests for any of the added vitamins or minerals. Vitamin levels are notincluded in final product specifications. USDA composition specifications for CSB and WSBare contained in Appendix A.
CSB and WSB have vitamin C added in the ratio of 40 mg for every 100 g of commodity.The form of vitamin C currently used contains 97.5% ascorbic acid with a 2.5% ethylcellulose coating. In September 1995, the U.S. Senate and House Appropriations Committeesrecommended that a pilot program be established to provide commodities with a 90 mg/100gfortification level (Foreign Operations, Export Financing, and Related ProgramsAppropriations Bill, 1996, S.Rpt. 104–143).
The operational component for the Vitamin C Pilot Program was implemented by the USAIDFood for Peace Office in the Bureau of Humanitarian Response. It involved procuring,producing, and providing CSB with high and conventional levels of vitamin C to refugeecamps in Tanzania and providing WSB with conventional and high levels of vitamin C todevelopment programs in Haiti, using the usual program procedures for P.L. 480 Title II foodaid.
The monitoring and evaluation component of the Vitamin C Pilot Program was conducted bySUSTAIN under a cooperative agreement with USAID. SUSTAIN, through the USAIDGlobal Bureau's Office of Health and Nutrition in cooperation with the Program, Planning,and Evaluation office for the Bureau of Humanitarian Response (BHR), monitored the
RESULTS REPORT ON THE VITAMIN C PILOT PROGRAM 3
uniformity, stability and physical availability of vitamin C in the commodities from threeselected country programs. In cooperation with the World Food Program (WFP), privatevoluntary organizations (PVOs), and USAID missions, SUSTAIN collected dry commoditysamples in three countries. SUSTAIN also collected information about the local foodpreparation of the commodities and cooked samples in two countries, and determined vitaminC retention after cooking by testing samples of prepared food collected at recipient sites inthese two countries.
The protocol for this activity was reviewed by an Advisory Panel of experts drawn fromgovernment, food relief agencies, and the food industry (Appendix B). These experts areknowledgeable in the fortification, stability, and testing of vitamins in these types of foods.This Advisory Panel met twice: once on April 18, 1996, to review the call forward requestand sampling strategy, and again on May 17, 1996, to review the protocol. A statisticalsubgroup of the Advisory Panel, made up of statisticians and quality control experts of thefood industry, advised on statistical matters and interpretation of the results (Appendix B).They met on May 3, 1996, to review the statistical plan of the study and to recommend thenumber of samples to be collected, and again on April 25, 1997, to discuss the statisticalanalysis of the results. Recommendations and suggestions from these meetings have beenincorporated into this report. A protocol was designed and submitted to the Committee ofInternational Nutrition (CIN) of the Institute of Medicine, National Academy of Science.Agreement on the protocol and recommendations by the CIN were presented to USAID inDecember 1996.
RESULTS REPORT ON THE VITAMIN C PILOT PROGRAM 4
III. T HE OPERATIONAL COMPONENT
SUSTAIN advised the USAID Office of Food for Peace (FFP) in the Bureau forHumanitarian Response on the means to implement a pilot program that would closelyrepresent ordinary food aid operations from procurement through distribution at field sites.This involved:
1. specifying the vitamin premix with higher levels of vitamin C;
2. recommending the quantities of enhanced and conventional commodities to be procured;and
3. consulting on the field programs to be selected.
A. Special Vitamin Premix
The vitamin premix used for CSB and WSB are commercial products made by either WatsonFoods or ADM Paniplus. There are two types: one premix contains the antioxidants butylatedhydroxyanisole (BHA) and butylated hydroxytoluene (BHT), and the other does not. Thelatter is used during some processes when the antioxidants are added to the oil. The USDAspecifications on this premix and a breakdown of the composition are shown in Appendix C,Table C-1. A special premix for adding the higher level of vitamin C was designed (thecomposition is shown in Appendix C, Table C-2). A batch of this product was prepared byWatson Foods and used by two plants for their special production. Because of the higherlevel of vitamin C, this premix has to be made at a 3 lbs/ton addition rate instead of the 2lbs/ton addition rate specified with the current conventional level of vitamin C.
B. Special Procurement of Commodities
SUSTAIN requested the Commodity and Procurement Division of USAID/BHR/FFP to order500 metric tons (MT) of CSB and 240 MT of WSB with the higher vitamin C level and thesame quantities of CSB and WSB with the conventional level of vitamin C. These pilotquantities were recommended by the statistical subgroup of the Advisory Panel as sufficientquantity to constitute a valid pilot test. The production time for both quantities was 2.5 daysof production at the CSB and WSB plants. The statistical subgroup determined thatcollecting 48 samples during this time frame was more than adequate to determine uniformityof vitamin distribution within the commodities according to SUSTAIN’s criteria to assess aminimum 20% drop in vitamin content and the expected variation under normal commercialcommodity production. All subsequent sampling was conducted using this same time frame ofcollecting 48 samples during 2 to 3 days of commodity production.
Special markings were printed on the side of the CSB and WSB bags. This was suggested bycollaborating agencies in the field to help find the bags and distinguish them from the routineproduction runs of these two commodities. Therefore, the WSB and CSB logos were printedin blue (instead of the usual red) for the batches with conventional vitamin C levels. For the
RESULTS REPORT ON THE VITAMIN C PILOT PROGRAM 5
commodities with the higher level of vitamin C, an additional blue bar was printed on the bagnext to the logo. SUSTAIN informed the collaborating agencies that it was important thatthese commodities receive the same transportation, storage, and distribution treatment as anyother P.L. 480 commodities.
The contracts for production of the pilot procurements were awarded to the lowest bidderusing standard procurement procedures. At that time, two plants (referred to in this report asPlant A and Plant B) were being awarded contracts for the production of two pilotsprocurements. From June 24 to 28, 1996, Plant A, the winning bidder for CSB, produced 500MT of CSB with high vitamin C followed by 500 MT of CSB with the conventional level ofvitamin C. Half of each type was sent to refugee camps in Western Tanzania to meetemergency needs of that time. From July 8 to 12, 1996, Plant B, the winning bidder for WSB,made 240 MT of WSB with conventional fortification followed by 240 MT of WSB with highvitamin C. All of this production was sent to Haiti.
C. Country Site Selection
A third task for SUSTAIN was to work in conjunction with FFP to determine the targetcountry sites for the pilot program.
Criteria for Choice of Recipient Country Sites
The countries chosen by the Office of Food for Peace and SUSTAIN for this pilot programwere Haiti, a regular development program, for WSB and Tanzania, an emergency food aiddistribution program, for CSB. These sites were chosen according to the following criteria:
1. One site needed to be in a country where CSB was used in the feeding program and theother site needed to be in a country where WSB was used.
2. One feeding program needed to be in an emergency context and the other needed to be ina development context.
3. At least one country food aid program needed to be chosen where scurvy had beenreported in past camp feeding situations and one program needed to be where significantiron deficiency has been reported.
Other criteria considered were:
1. Interest in the Vitamin C Pilot Program by local country, PVOs, and USAID.
2. Logistical assistance available in the country to SUSTAIN during sampling.
Haiti
There were three PVOs distributing food aid in Haiti (ADRA, CARE, and CRS). SUSTAINworked with ADRA (Adventist Development and Relief Agency) because it was the onlyPVO that had WSB on their remaining allocation for Haiti for fiscal year (FY) 1996 and could
RESULTS REPORT ON THE VITAMIN C PILOT PROGRAM 6
include the pilot procurement in their program. Also, USAID/Haiti was willing to collaboratewith SUSTAIN.
Tanzania
In Tanzania, SUSTAIN worked with the World Food Programme (WFP), the United NationsHigh Commissioner for Refugees (UNHCR), and the USAID mission. A total of 350 MT ofthe CSB pilot procurement was distributed in the Ngara region of Western Tanzania, whereseveral refugee camps were located. The rest of the special procurement was allocated toother areas of Tanzania, mainly in the Kigoma region.
India
The pilot production run sampled at Plant A that was sent to Tanzania did not containsufficiently uniform distribution of vitamin C to allow for an efficient test of stability inshipping. Therefore, after the production of conventional CSB at another plant, Plant C, wasdetermined sufficiently uniform to allow determination of vitamin C stability during shipping,and in consultation with USAID, SUSTAIN tracked down the procurement produced at PlantC. This production of CSB had been shipped to Cochin in southwest India. The WFP officeand USAID/India helped SUSTAIN locate and sample this procurement, which wasdistributed in a preschool feeding program.
RESULTS REPORT ON THE VITAMIN C PILOT PROGRAM 7
IV. M ONITORING AND EVALUATION COMPONENT
A. Methodology
SUSTAIN managed the monitoring, evaluation, and quality control component of the pilotprogram. This involved four principal tasks:
1. determining the uniformity of vitamin C in the commodities during production;
2. determining the stability of the added vitamin C from the point of manufacture to the pointof distribution;
3. estimating the variability of vitamin C distribution within bag; and
4. determining the stability of the added vitamin C during normal food preparations andestimating how much vitamin C would actually be contributed to the recipients’ diets fromnormal rations of these commodities.
1. Determination of Vitamin C Uniformity in the Commodities at Plant Sites
CSB/WSB Production Tested
After the initial sampling results indicated uniformity problems in the fortification of CSB, itwas the consensus among USAID and the SUSTAIN Vitamin C Advisory Panel that each ofthe seven CSB/WSB plants that are being awarded production contracts should be sampled toassess the extent of the uniformity problem.
Four of the six U.S. plants producing CSB and one of the two WSB plants were sampled.One CSB plant and one WSB plant were not in production during the sampling period. Aconventional vitamin C level production run and a high vitamin C production run weresampled in Plants A and B, as summarized in Table 1.
RESULTS REPORT ON THE VITAMIN C PILOT PROGRAM 8
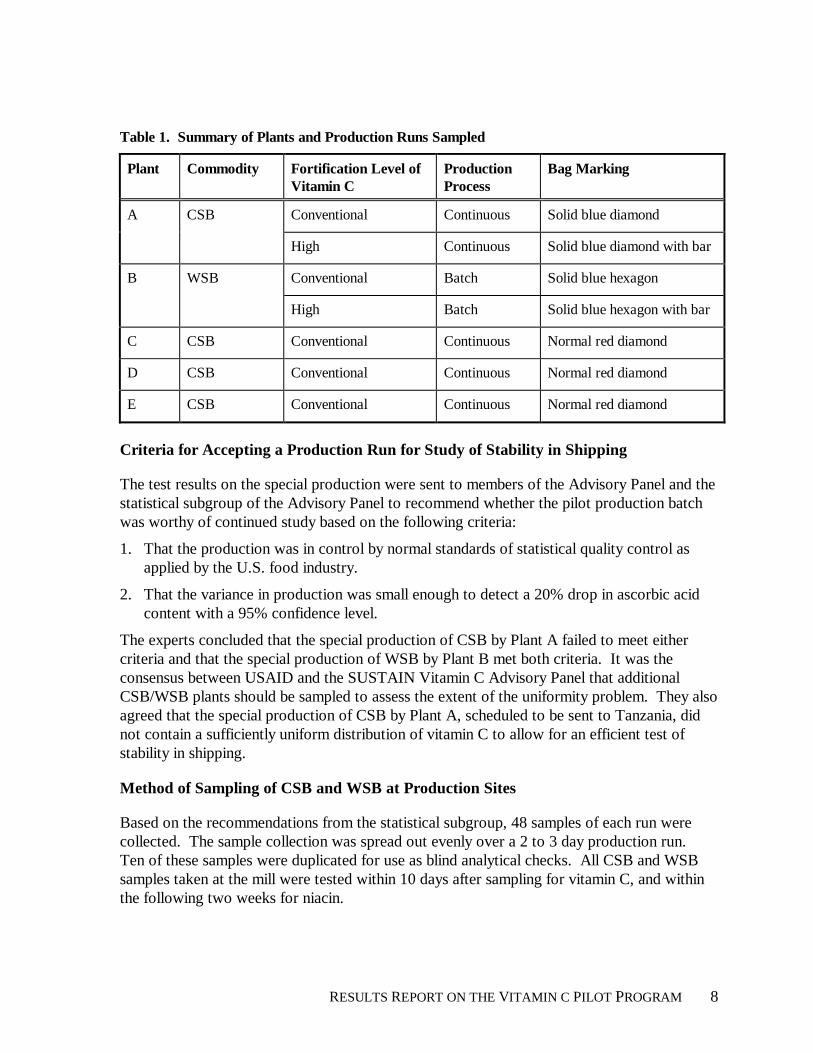
Table 1. Summary of Plants and Production Runs Sampled
Plant Commodity Fortification Level ofVitamin C
ProductionProcess
Bag Marking
A CSB Conventional Continuous Solid blue diamond
High Continuous Solid blue diamond with bar
B WSB Conventional Batch Solid blue hexagon
High Batch Solid blue hexagon with bar
C CSB Conventional Continuous Normal red diamond
D CSB Conventional Continuous Normal red diamond
E CSB Conventional Continuous Normal red diamond
Criteria for Accepting a Production Run for Study of Stability in Shipping
The test results on the special production were sent to members of the Advisory Panel and thestatistical subgroup of the Advisory Panel to recommend whether the pilot production batchwas worthy of continued study based on the following criteria:
1. That the production was in control by normal standards of statistical quality control asapplied by the U.S. food industry.
2. That the variance in production was small enough to detect a 20% drop in ascorbic acidcontent with a 95% confidence level.
The experts concluded that the special production of CSB by Plant A failed to meet eithercriteria and that the special production of WSB by Plant B met both criteria. It was theconsensus between USAID and the SUSTAIN Vitamin C Advisory Panel that additionalCSB/WSB plants should be sampled to assess the extent of the uniformity problem. They alsoagreed that the special production of CSB by Plant A, scheduled to be sent to Tanzania, didnot contain a sufficiently uniform distribution of vitamin C to allow for an efficient test ofstability in shipping.
Method of Sampling of CSB and WSB at Production Sites
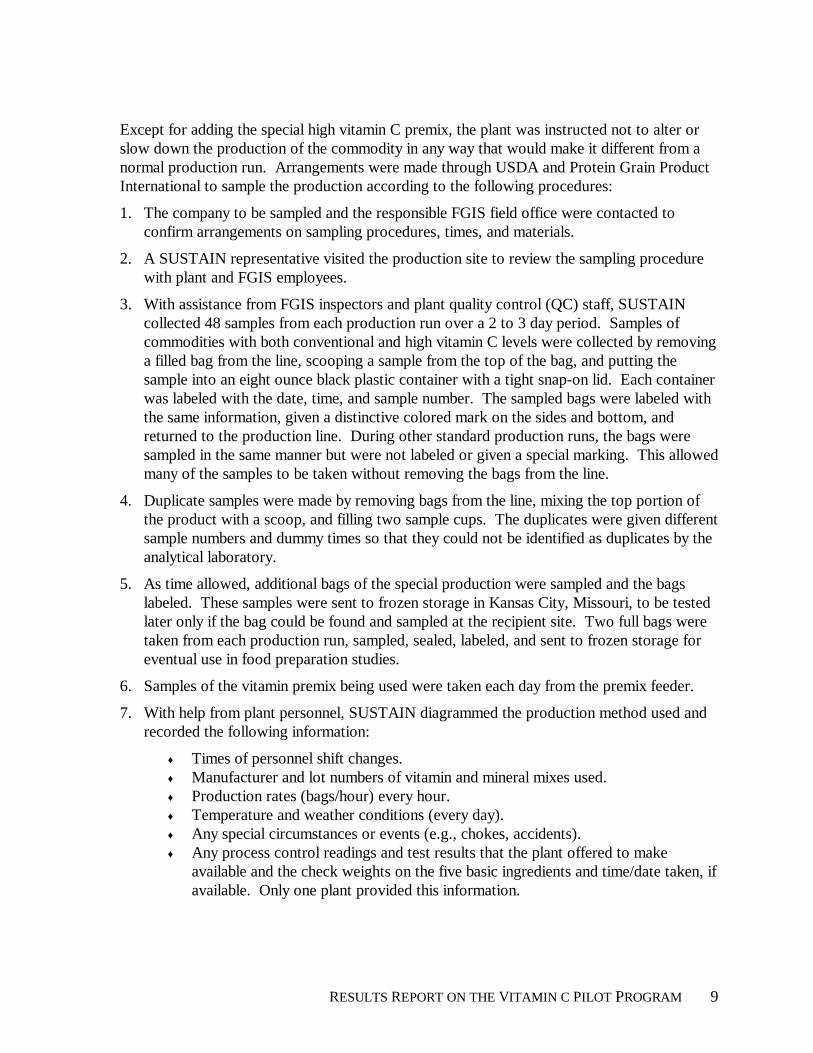
Based on the recommendations from the statistical subgroup, 48 samples of each run werecollected. The sample collection was spread out evenly over a 2 to 3 day production run.Ten of these samples were duplicated for use as blind analytical checks. All CSB and WSBsamples taken at the mill were tested within 10 days after sampling for vitamin C, and withinthe following two weeks for niacin.
RESULTS REPORT ON THE VITAMIN C PILOT PROGRAM 9
Except for adding the special high vitamin C premix, the plant was instructed not to alter orslow down the production of the commodity in any way that would make it different from anormal production run. Arrangements were made through USDA and Protein Grain ProductInternational to sample the production according to the following procedures:
1. The company to be sampled and the responsible FGIS field office were contacted toconfirm arrangements on sampling procedures, times, and materials.
2. A SUSTAIN representative visited the production site to review the sampling procedurewith plant and FGIS employees.
3. With assistance from FGIS inspectors and plant quality control (QC) staff, SUSTAINcollected 48 samples from each production run over a 2 to 3 day period. Samples ofcommodities with both conventional and high vitamin C levels were collected by removinga filled bag from the line, scooping a sample from the top of the bag, and putting thesample into an eight ounce black plastic container with a tight snap-on lid. Each containerwas labeled with the date, time, and sample number. The sampled bags were labeled withthe same information, given a distinctive colored mark on the sides and bottom, andreturned to the production line. During other standard production runs, the bags weresampled in the same manner but were not labeled or given a special marking. This allowedmany of the samples to be taken without removing the bags from the line.
4. Duplicate samples were made by removing bags from the line, mixing the top portion ofthe product with a scoop, and filling two sample cups. The duplicates were given differentsample numbers and dummy times so that they could not be identified as duplicates by theanalytical laboratory.
5. As time allowed, additional bags of the special production were sampled and the bagslabeled. These samples were sent to frozen storage in Kansas City, Missouri, to be testedlater only if the bag could be found and sampled at the recipient site. Two full bags weretaken from each production run, sampled, sealed, labeled, and sent to frozen storage foreventual use in food preparation studies.
6. Samples of the vitamin premix being used were taken each day from the premix feeder.
7. With help from plant personnel, SUSTAIN diagrammed the production method used andrecorded the following information:
♦ Times of personnel shift changes.♦ Manufacturer and lot numbers of vitamin and mineral mixes used.♦ Production rates (bags/hour) every hour.♦ Temperature and weather conditions (every day).♦ Any special circumstances or events (e.g., chokes, accidents).♦ Any process control readings and test results that the plant offered to make
available and the check weights on the five basic ingredients and time/date taken, ifavailable. Only one plant provided this information.
RESULTS REPORT ON THE VITAMIN C PILOT PROGRAM 10
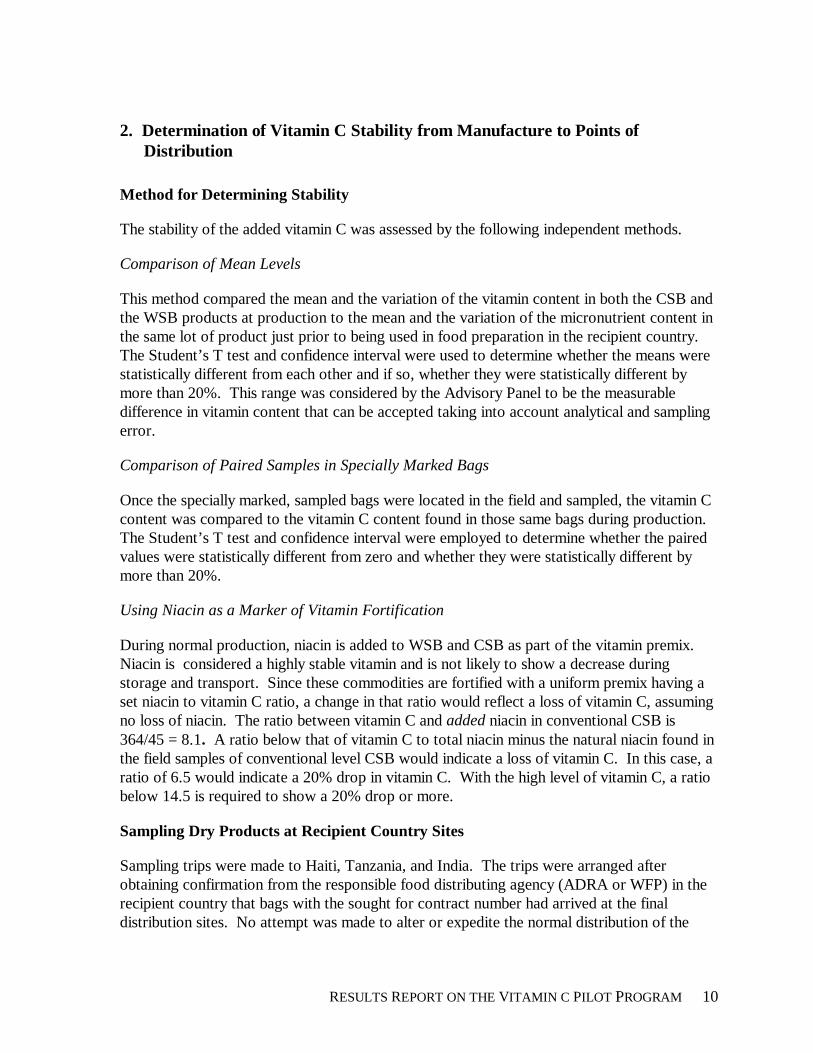
2. Determination of Vitamin C Stability from Manufacture to Points ofDistribution
Method for Determining Stability
The stability of the added vitamin C was assessed by the following independent methods.
Comparison of Mean Levels
This method compared the mean and the variation of the vitamin content in both the CSB andthe WSB products at production to the mean and the variation of the micronutrient content inthe same lot of product just prior to being used in food preparation in the recipient country.The Student’s T test and confidence interval were used to determine whether the means werestatistically different from each other and if so, whether they were statistically different bymore than 20%. This range was considered by the Advisory Panel to be the measurabledifference in vitamin content that can be accepted taking into account analytical and samplingerror.
Comparison of Paired Samples in Specially Marked Bags
Once the specially marked, sampled bags were located in the field and sampled, the vitamin Ccontent was compared to the vitamin C content found in those same bags during production.The Student’s T test and confidence interval were employed to determine whether the pairedvalues were statistically different from zero and whether they were statistically different bymore than 20%.
Using Niacin as a Marker of Vitamin Fortification
During normal production, niacin is added to WSB and CSB as part of the vitamin premix.Niacin is considered a highly stable vitamin and is not likely to show a decrease duringstorage and transport. Since these commodities are fortified with a uniform premix having aset niacin to vitamin C ratio, a change in that ratio would reflect a loss of vitamin C, assumingno loss of niacin. The ratio between vitamin C and added niacin in conventional CSB is364/45 = 8.1. A ratio below that of vitamin C to total niacin minus the natural niacin found inthe field samples of conventional level CSB would indicate a loss of vitamin C. In this case, aratio of 6.5 would indicate a 20% drop in vitamin C. With the high level of vitamin C, a ratiobelow 14.5 is required to show a 20% drop or more.
Sampling Dry Products at Recipient Country Sites
Sampling trips were made to Haiti, Tanzania, and India. The trips were arranged afterobtaining confirmation from the responsible food distributing agency (ADRA or WFP) in therecipient country that bags with the sought for contract number had arrived at the finaldistribution sites. No attempt was made to alter or expedite the normal distribution of the
RESULTS REPORT ON THE VITAMIN C PILOT PROGRAM 11
commodity. The schedule of the distribution of the commodities in Haiti and Tanzania arecontained in Appendix D. A detailed distribution schedule was not available for India, as thecommodity was tracked down only after the procurement was delivered to the distributionsite.
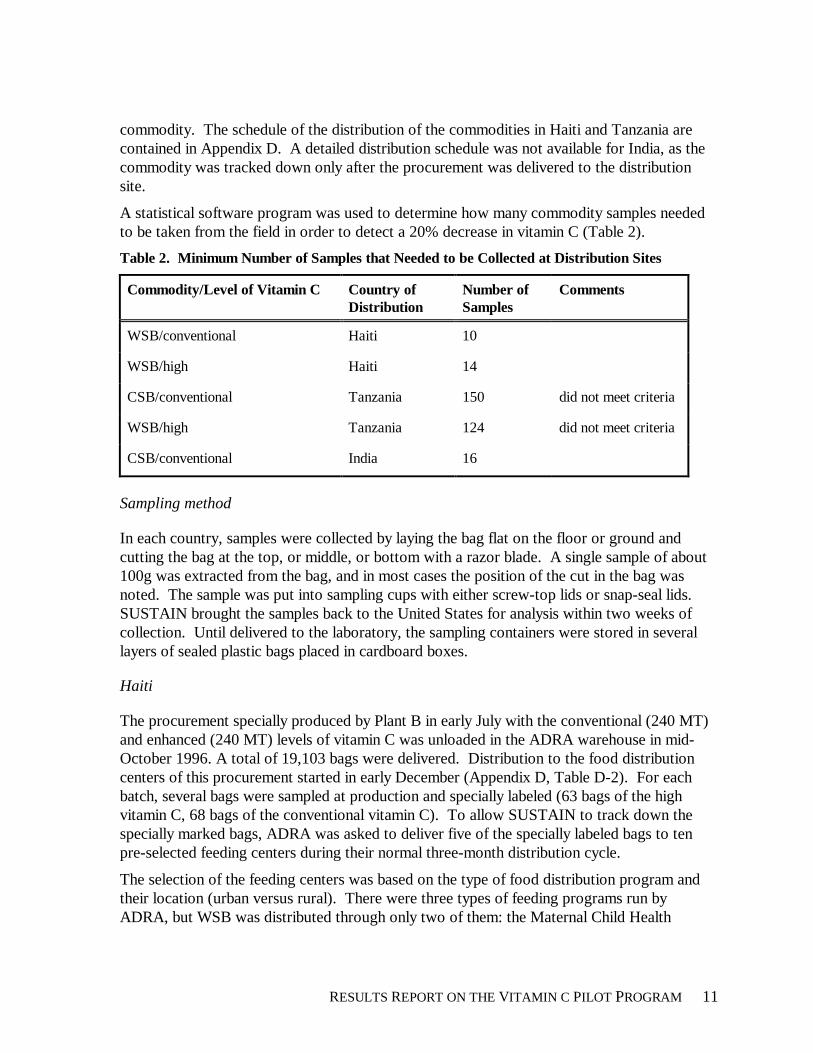
A statistical software program was used to determine how many commodity samples neededto be taken from the field in order to detect a 20% decrease in vitamin C (Table 2).
Table 2. Minimum Number of Samples that Needed to be Collected at Distribution Sites
Commodity/Level of Vitamin C Country ofDistribution
Number ofSamples
Comments
WSB/conventional Haiti 10
WSB/high Haiti 14
CSB/conventional Tanzania 150 did not meet criteria
WSB/high Tanzania 124 did not meet criteria
CSB/conventional India 16
Sampling method
In each country, samples were collected by laying the bag flat on the floor or ground andcutting the bag at the top, or middle, or bottom with a razor blade. A single sample of about100g was extracted from the bag, and in most cases the position of the cut in the bag wasnoted. The sample was put into sampling cups with either screw-top lids or snap-seal lids.SUSTAIN brought the samples back to the United States for analysis within two weeks ofcollection. Until delivered to the laboratory, the sampling containers were stored in severallayers of sealed plastic bags placed in cardboard boxes.
Haiti
The procurement specially produced by Plant B in early July with the conventional (240 MT)and enhanced (240 MT) levels of vitamin C was unloaded in the ADRA warehouse in mid-October 1996. A total of 19,103 bags were delivered. Distribution to the food distributioncenters of this procurement started in early December (Appendix D, Table D-2). For eachbatch, several bags were sampled at production and specially labeled (63 bags of the highvitamin C, 68 bags of the conventional vitamin C). To allow SUSTAIN to track down thespecially marked bags, ADRA was asked to deliver five of the specially labeled bags to tenpre-selected feeding centers during their normal three-month distribution cycle.
The selection of the feeding centers was based on the type of food distribution program andtheir location (urban versus rural). There were three types of feeding programs run byADRA, but WSB was distributed through only two of them: the Maternal Child Health
RESULTS REPORT ON THE VITAMIN C PILOT PROGRAM 12
(MCH) and Other Child Feeding (OCF) programs. The locations selected were: 1) a primaryMCH and a primary OCF in an urban area, and 2) two primary MCH centers and one primaryOCF center in a rural area. In addition to these five locations, secondary centers in closeproximity to the primary centers were selected to ensure there was a matching pair of centersin each of the five distribution areas. In each of the five locations, the primary centersreceived WSB with the conventional level of vitamin C level and the secondary centersreceived WSB with the high level of vitamin C.
Distribution to the selected centers began in late January 1996, and the sampling took place inthe centers in March 1997. Typically, a center receives three months’ worth of commoditiesat a time and the commodities are distributed to the recipients twice a month. Thecommodities are consumed during the two to three weeks between distributions.
Tanzania
The special procurement of CSB produced in Plant A from June 24 to 28, 1996, was sent tothe refugee camps in western Tanzania and was distributed in December 1996 (Appendix D,Table D-1). Logistics and internal transport of food commodities were handled by the WorldFood Programme, and distribution at the distribution sites was under the management ofUNHCR.
The field sampling of the special procurement of CSB was revised after analysis of theproduction samples. The Advisory Panel recommended against sampling this procurement inthe field because the production was not in control and failed to meet SUSTAIN’s acceptancecriteria. USAID project officer concurred on this initial recommendation; however, on advicefrom the Committee on International Nutrition of the National Academy of Sciences(December 1996) and USAID, SUSTAIN attempted to reinstate part of the sampling plan inTanzania. After consulting with WFP and USAID/Tanzania and reviewing the availability ofthe special production that was sent to Tanzania, SUSTAIN determined that it would befeasible to gather prepared food samples of the special CSB procurement from the refugeecamps in Tanzania. In Tanzania, SUSTAIN’s focus was on observing food preparationpractices and sampling CSB (from the remaining special procurement) just prior to and aftercooking. SUSTAIN sampled eight bags from the special procurement.
In addition, SUSTAIN sampled seven bags from another CSB procurement, which wasproduced at Plant D in April 1996.
India
To test the stability of vitamin C during shipping, SUSTAIN identified another conventionalprocurement, one destined for India. The production was sampled in early October 1996 andmet the criteria of being in control and having an acceptable variability to be able to detect a20% drop in ascorbic acid.
Four lots (136 MT/lot) of this conventional procurement were being distributed in the Cochinregion. Most of the bags sampled came from two lots only. Sampling was done at six
RESULTS REPORT ON THE VITAMIN C PILOT PROGRAM 13
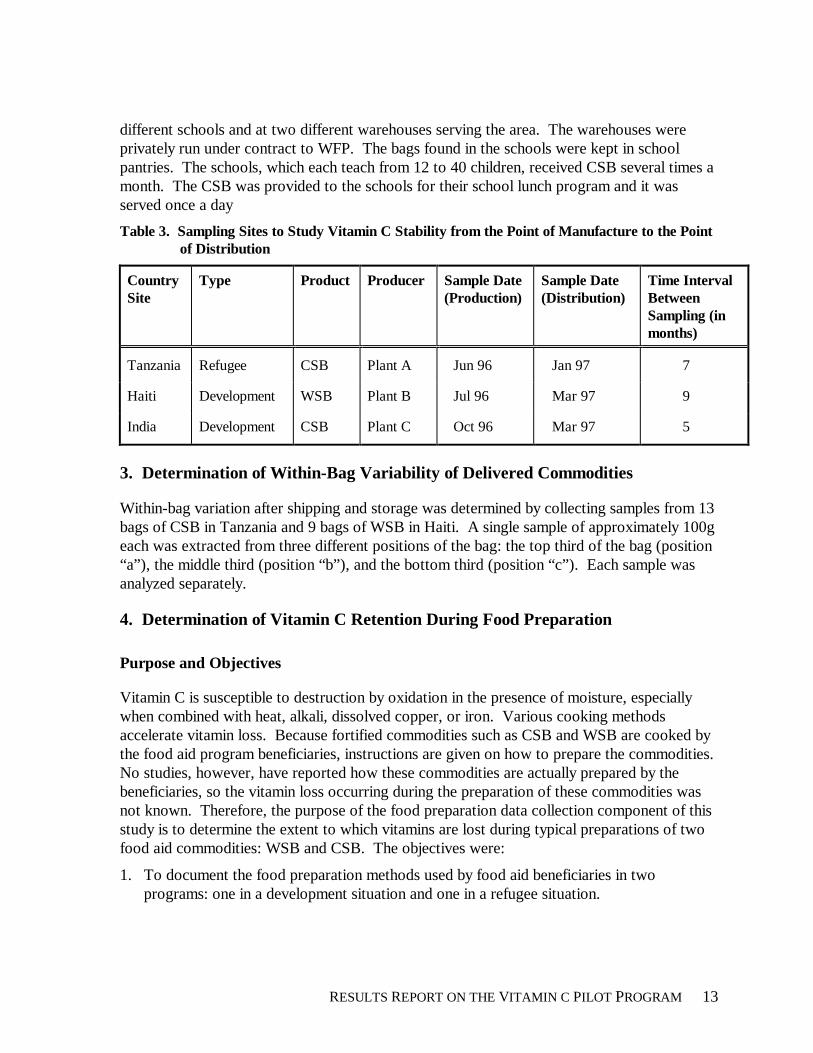
different schools and at two different warehouses serving the area. The warehouses wereprivately run under contract to WFP. The bags found in the schools were kept in schoolpantries. The schools, which each teach from 12 to 40 children, received CSB several times amonth. The CSB was provided to the schools for their school lunch program and it wasserved once a day
Table 3. Sampling Sites to Study Vitamin C Stability from the Point of Manufacture to the Pointof Distribution
CountrySite
Type Product Producer Sample Date(Production)
Sample Date(Distribution)
Time IntervalBetweenSampling (inmonths)
Tanzania Refugee CSB Plant A Jun 96 Jan 97 7
Haiti Development WSB Plant B Jul 96 Mar 97 9
India Development CSB Plant C Oct 96 Mar 97 5
3. Determination of Within-Bag Variability of Delivered Commodities
Within-bag variation after shipping and storage was determined by collecting samples from 13bags of CSB in Tanzania and 9 bags of WSB in Haiti. A single sample of approximately 100geach was extracted from three different positions of the bag: the top third of the bag (position“a”), the middle third (position “b”), and the bottom third (position “c”). Each sample wasanalyzed separately.
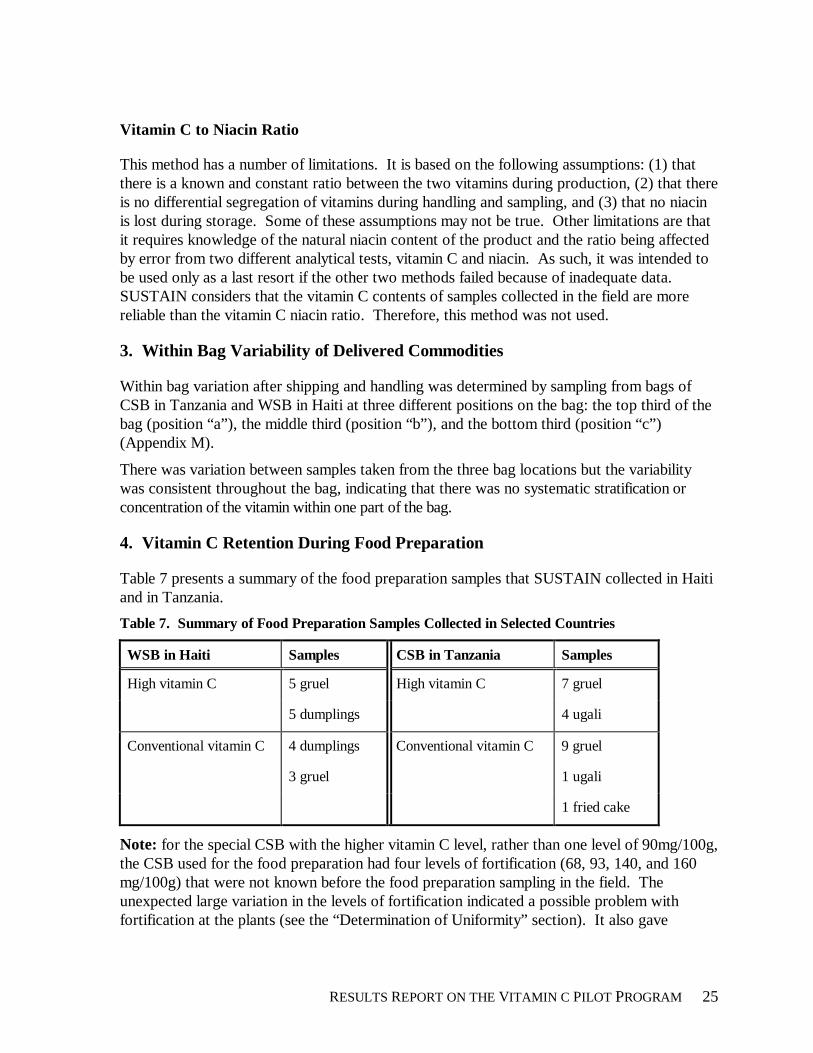
4. Determination of Vitamin C Retention During Food Preparation
Purpose and Objectives
Vitamin C is susceptible to destruction by oxidation in the presence of moisture, especiallywhen combined with heat, alkali, dissolved copper, or iron. Various cooking methodsaccelerate vitamin loss. Because fortified commodities such as CSB and WSB are cooked bythe food aid program beneficiaries, instructions are given on how to prepare the commodities.No studies, however, have reported how these commodities are actually prepared by thebeneficiaries, so the vitamin loss occurring during the preparation of these commodities wasnot known. Therefore, the purpose of the food preparation data collection component of thisstudy is to determine the extent to which vitamins are lost during typical preparations of twofood aid commodities: WSB and CSB. The objectives were:
1. To document the food preparation methods used by food aid beneficiaries in twoprograms: one in a development situation and one in a refugee situation.
RESULTS REPORT ON THE VITAMIN C PILOT PROGRAM 14
2. To sample the typical food preparations of WSB and CSB from several beneficiaryhouseholds for vitamin C analysis.
CSB sampling took place in refugee camps in Tanzania and WSB sampling occurred inimpoverished areas in Haiti. In both locations, food preparations were made with WSB andCSB with both conventional and high vitamin C levels that was taken from the specialprocurement.
Materials and Methods
The equipment used in sampling CSB and WSB included plastic bags, cooler (Igloo), icepacks, 4–ounce containers for samples, spoons, pH paper, portable scale, camera,thermometers, recording thermometers. With the assistance of the agencies distributing thefood aid commodities (ADRA in Haiti, WFP in the refugee camps in Tanzania), SUSTAINmade appointments to meet with beneficiaries who use WSB or CSB regularly. Appointmentstook place at the recipients’ homes. Community leaders (MCH centers workers in Haiti,“street” social workers in the refugee camps) asked several mothers if they would volunteerfor the study. The only requirement was that they would be available for cooking with theappropriate ingredients at the time of the appointment. Preliminary observations had shownthat in Haiti the most commonly prepared WSB dishes were gruel and a vegetable broth withdumplings; in the Tanzanian refugee camps the most commonly prepared CSB dishes weregruel and ugali, a Swahili word referring to a stiff porridge traditionally prepared withfermented cassava. The mothers selected for the study were free to choose the type of dishthat they wanted to cook.
Distribution of Extra Rations
At the sampling appointments, SUSTAIN met with the mothers and gave them each an extraration of the commodity taken from the special procurement bags, which were sampled justprior to cooking. The extra rations were identical in quantity to their regular rations (one- totwo-weeks’ worth of commodity). Typically, the ration is consumed within two or threeweeks after distribution. This is true for the beneficiaries in Haiti and in Tanzania. For eachcommodity, the mothers were divided into two groups: one which cooked the commoditywith the higher level of vitamin C and one which cooked the commodity with the conventionallevel of vitamin C.
Food Preparation
During food preparation, ingredients and weights, cooking procedures, cooking times andtemperatures, and pH measurements were recorded. The length of time that the WSB or CSBcommodities were placed in a water solution prior to cooking was also recorded. SUSTAINnoted the type and nature of utensils and the type of fuel used to cook the food. Critical partsof the preparation were also photographed to record the procedure.
RESULTS REPORT ON THE VITAMIN C PILOT PROGRAM 15
Sampling
In both Haiti and Tanzania, mothers usually serve the food immediately after cooking. Assoon as the food was ready, SUSTAIN collected a representative sample of the cooked foodin a 4-ounce container, which was closed tightly and put in a cooler with frozen ice packs.Within eight hours of collection, the cups were transferred to a freezer. Freezer temperatureswere measured to ensure that the samples were kept frozen at all times. SUSTAIN broughtthe frozen samples back to the United States in a cooler with ice packs and put them in afreezer until they were picked up by Lancaster Laboratories for analysis. A thermometer thatrecorded the temperature every 30 minutes was put with the samples to verify that thesamples were kept under 32º F at all times. The frozen CSB food samples from Tanzaniawere tested for vitamin C within two weeks of sampling. The frozen WSB food samples fromHaiti were tested for vitamin C within three weeks of sampling. The temperature histories ofthese samples are shown in Appendix E.
The WSB and CSB samples taken before and after cooking were analyzed for vitamin C andmoisture content. Samples taken before cooking were also analyzed for niacin and wateractivity.
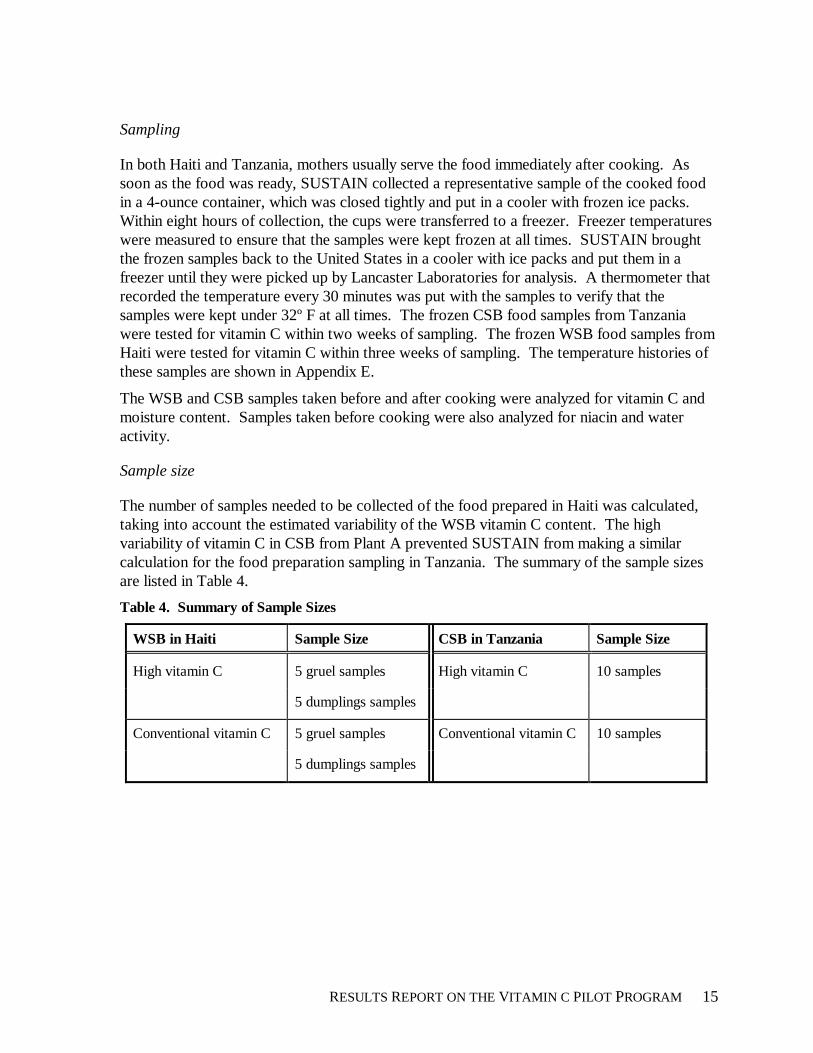
Sample size
The number of samples needed to be collected of the food prepared in Haiti was calculated,taking into account the estimated variability of the WSB vitamin C content. The highvariability of vitamin C in CSB from Plant A prevented SUSTAIN from making a similarcalculation for the food preparation sampling in Tanzania. The summary of the sample sizesare listed in Table 4.
Table 4. Summary of Sample Sizes
WSB in Haiti Sample Size CSB in Tanzania Sample Size
High vitamin C 5 gruel samples High vitamin C 10 samples
5 dumplings samples
Conventional vitamin C 5 gruel samples Conventional vitamin C 10 samples
5 dumplings samples
RESULTS REPORT ON THE VITAMIN C PILOT PROGRAM 16
5. Analytical Methods
Stability of Vitamin C During Frozen Storage
Stability of vitamin C during frozen storage was determined because samples taken atproduction and sent to frozen storage at -20° C in Kansas City and in Lancaster Laboratorieswere to be analyzed only if the marked bag were found and sampled at the recipient site. Thestability of vitamin C during such storage was checked by re-testing a number of samples afterthey had been kept frozen for 6 to 9 months.
The vitamin C content in CSB and WSB before and after frozen storage is shown in AppendixF, Table F-1. These data were log-transformed in order to obtain the following results on apercent retention basis. They showed no significant loss in vitamin C due to frozen storage.
Product Retention Mean 95% Confidence Interval
CSB 95.6% 89.1% to 102.7%
WSB 103.4% 96.5% to 110.7%
Analytical Testing of Vitamins
The samples from the production runs of WSB and CSB were sent by overnight packagedelivery to Lancaster Laboratories in Lancaster, Pennsylvania, for immediate testing ofvitamin C (ascorbic acid).
Vitamin C was tested by the fluorescent method, Association of Official Analytical Chemists(AOAC) 15th Ed. 967.22. This procedure is applicable to foods and feeds. It measures bothreduced vitamin C (ascorbic acid) and the oxidized form (dehydroascorbic acid), both ofwhich are antiscorbutic. The procedure does not measure the hydrolyzed form, 2,3-diketoguiortic acid, which does not have vitamin C activity. The procedure involves oxidizingascorbic acid to dehydroascorbic acid in the presence of charcoal. The oxidized form reactswith 0-phenylenediamine to produce a fluorophor whose fluorescent intensity is proportionalto the concentration. A blank is formed by adding dehydroascorbic acid to boric acid to forma quinoxaline prior to the addition of the diamine solution. Any remaining fluorescence is dueto extraneous materials. A spike was run with every set of samples. The average spikerecovery on a variety of matrices is 96.2%. The detection limit on this procedure is 1mg/100g. A NIST (National Institute of Standards and Technology) dry infant cerealreference standard (AOAC, 1986, 1990) was run with each set. If the standard fell outside ofa 108–121 mg/100g range, the results were not used and the set was repeated.
Niacin was analyzed by the American Association of Cereal Chemists approved method 86-52: Niacin Automated Determination. This method is an automated version of thecolorimetric procedure in which an autoclaved calcium hydroxide extraction of a cerealproduct is acidified and reacted with cyanogen bromide to produce a blue color proportionalto the amount of niacin present. The reading is adjusted for natural color by running a blank
RESULTS REPORT ON THE VITAMIN C PILOT PROGRAM 17
with no cyanogen bromide. An AACC flour reference standard was run with each set. If thestandard fell outside of a 22–27 mg/100g range, the results were not used and the set wasrepeated.
The same analytical methods were used on the prepared food samples as were used on the drysamples except for moisture content, which was measured by vacuum oven.
For the dry samples, moisture was tested by a standard loss of weight in oven drying. Thelaboratory ran the NIST dry infant cereal reference standard containing a certified level ofvitamin C with each sample set. The whole run was repeated if the assay on the standard wasoutside of the acceptable range. For the cooked samples, moisture was tested by a standardloss of weight during vacuum oven drying. Samples high in sugars were dried at 70° C for 16hours. Samples high in volatile oils were dried at 100° C for 5 hours. In all cases the sampleswere dried under pressure less than or equal to 100 mm Hg. The limit of detection is 0.01%.
Water activity (aw) is a water energy measurement. Water activity is an indication of “free”water in a sample available for microbial growth, as well as enzyme and vitamin activity.“Free” refers to the water particles in a product that are not chemically or physically bound.
A representative sample was placed in the Atwater instrument and the aw or equilibriumhumidity (ERH) was measured as a ratio of water vapor pressure above the sample to thewater vapor of pure water at the same temperature. Products with no “free” water have an aw
of 0.000; pure water has an aw of 1.000 (Aqualab Model CX-2 Water Activity Measurement,Operator’s Manual).
Statistical Analysis
Data Obtained From Production of P.L. 480 Commodities
A commercial statistical software program was used to analyze data collected on productionsamples. This program calculates upper and lower control limits and a number of descriptivestatistics useful in analyzing production data. It generates a control chart that can beexamined to determine if the production is in control using a number of different rules orparameters. It also calculates the production capability index (Cp).
Data Collected From the Field
A statistical software program was used to determine how many samples needed to be takenfrom the field in order to detect a 20% decrease in vitamin C, as well as to determine whatdifference could be detected using the same number of samples as was collected from theproduction line. The program uses confidence limits, power estimations, standard deviations,and means in these calculations.
A number of different statistical methods were used to compare the data collected from thefield to that from production in order to determine the percentage drop in vitamin C content.First, all data must fit a normal distribution. If so, a simple two-sample t-test can be used to
RESULTS REPORT ON THE VITAMIN C PILOT PROGRAM 18
determine if there is a significant difference between the two sets of samples. If the data is notnormal, steps can be taken to transform it to usable forms, or other statistical methods can beapplied that do not require normal distribution. The data was then subjected to an analysis ofvariance test to determine the confidence intervals.
B. Results and Discussion
1. Uniformity of Vitamin C in the Commodities at Plant Sites
Description of Sampled CSB and WSB Processing Plants
As mentioned earlier, after the initial sampling of CSB showed poor uniformity of product, itwas the consensus between USAID and the SUSTAIN Vitamin C Advisory Panel that each ofthe seven CSB/WSB plants that are being awarded production contracts should be sampled toassess the extent of the uniformity problem. Four of the six U.S. plants producing CSB andone of the two plants producing WSB were sampled using the procedures described above.Production at the five plants is summarized below and diagrams are provided to show howproduct is produced at each plant (Appendix G). There were no unusual temperature orweather conditions during any of the sampling periods. All of the plant personnel and FGISinspectors were highly cooperative with SUSTAIN during sampling the products.
Plant A
This plant produces corn soy blend and corn meal. The vitamins and minerals were added bytwo small feeders within view of the person running the packer. One feeder fed the mineralpremix and one fed the vitamin premix. A commercial vitamin premix from ADM Paniplus(item 113571) or Watson Enrichment Products (Type WT-2710B for the high vitamin Ccontract) was used.
The fortified product ran through a short mixer and then was blown out to the packing room.An auger carried the product from the bottom of a cyclone separator to the holding bin overthe packer. A switch on this bin would automatically shut down the whole system, includingthe nutrient feeders, if this holding bin got too full. The system would also shut downautomatically if the corn or soy ran out. The person running the bagger could shut down thesystem if packaging problems developed, if he went on a break, or when shifts changed. Theplant ran two shifts; the first one started at 6:00 a.m. The second shift began work at 2:30p.m.
Bags were filled, heat sealed, and conveyed to the railcars, where they were stacked by hand.It took three to four hours to fill a railcar with 2,500 bags. A lot was two railcars, or 135MT. The lot number stamped on each bag was a simple sequential number: 1, 2, 3, etc.Sample numbers were written on approximately 140 bags, half from the production runs withthe conventional level of vitamin C and half from the production run with the high level ofvitamin C.
RESULTS REPORT ON THE VITAMIN C PILOT PROGRAM 19
Plant B
This is a large flour mill that produces WSB on a dedicated batch system. The ground bulgur,soy flour, and wheat protein concentrate used to make up this product are kept in separatebins. The mixer operator used a load cell scale to weigh each ingredient sequentially into oneof two ribbon blenders. Oil, a scoop of vitamin premix (the scoop was calibrated to provideone pound of ADM Paniplus vitamin premix), and a bag of mineral premix (from RolandIndustries in 56 lb bags) were added, resulting in a total mixing weight of 2,005 lbs. This wasthen mixed three to four minutes and sent pneumatically to a 20,000 lb holding bin. Fromthere it was packed out on a single line operating on only one shift. The lot number stampedon each bag was a simple sequential number: 1, 2, 3, etc. Sample numbers were written onapproximately 65 bags for each vitamin C level (high and conventional).
Plant C
This grain processing plant produces CSB and exports corn meal products for the P.L. 480program on the same continuous blending system specifically designed for the product CSB.Other degerminated corn meals manufactured at this location are sold commercially in theUnited States.
All dry ingredients are monitored and metered into a continuous blending system that utilizesa large diameter extended mixing conveyor. Three screw-type micro-ingredient feeders withlarge capacity hoppers meter the vitamin premix, salt/mineral premix, and the tricalciumphosphate into the mixing conveyor at the same time with the precooked corn meal and soyflour ingredients for blending. The refined soy oil with the antioxidants is atomized into theconveyor following the addition of these dry ingredients. The blending system is designedwith an interlocking scheme of equipment, so if any of the ingredient feeders stop, theblending system will automatically shut down.
An industrial programmable logic controller (PLC) computer operates this continuousblending system. A primary scale controls the addition of the precooked corn meal or regularcorn meal, which is set within a desired range. The secondary scales and feeders for theremaining ingredients are automatically adjusted by the load on the primary scale. Randomrate checks are taken during the blending operation for all ingredients to confirm the additionrates versus the scale readings and product specifications.
The product is transferred pneumatically from the end of the mixing conveyor up severalfloors to a screw conveyor that transfers the blended product into six storage bins. A panellocated on the packing floor controls the discharge feeders from these bins. Two bins areoperated at the same time and the product is conveyed pneumatically to a holding bin locatedabove the packing stations.
The holding bin above the packers remains filled by an electronic control mechanism thatsignals the feeders to stop and start to maintain a desired level. There are two packing linesthat transfer bagged product to separate railcars. One side of the holding bin will feed line A;
RESULTS REPORT ON THE VITAMIN C PILOT PROGRAM 20
the other side feeds line B. About 60% of the daily volume packed out is blended in advanceof packing. The balance is blended the same day.
There are normally 2,722 bags per railcar and two cars per lot, or a total of 136.4 MT per lot.Plant C normally packs out two lots per day. Each bag is printed with a lot number followedby a consecutive bag number from 1 to 2,722. The packing line, lot number, and bag numberswere recorded by SUSTAIN for each sample taken. No special markings were placed on thebags sampled by SUSTAIN. Samples of CSB and corn meal were taken during twoconsecutive weeks of sampling.
Plant D
This is a large corn mill that produces corn soy blend, corn meal, and masa flour for PL 480.They also produce a number of commercial products. This plant works continuously 24 hoursa day. Most of the CSB is packed out on line A from 8 a.m. to 5 p.m., but some CSB ispacked out on line B during other times of the day. The lot number stamped on each bag is asimple three digit number: 907, 908, 909, etc.
The vitamin and mineral premixes are metered through W&T™ screw-type feeders onto theground extruded corn in a screw conveyor. The corn is then dropped into a "drag belt" devicein which the soy flour and tricalcium phosphate is added. From there, just after the oil isadded the product drops down into an intensive mixer. The product is then blown up to aholding bin from which it is packed out. The plant has the ability to check weight and adjustthe vitamin and mineral premixes, the TCP, the soy/TCP, and the oil.
Plant E
This is a small, privately owned plant producing mainly CSB with a small amount of cornmeal. It recently changed management. The previous owners had been suspended fromselling product to the government because of alleged discrepancies in fortification practices.The plant started operating in March 1994. It went out of business and was shut down forover a year and started up again during the start of 1997 under new ownership and newmanagement, with new equipment installed to fortify the product with vitamin and minerals.
Each lot is three railcars (either 50-foot cars carrying 2,700 bags or 60-foot cars holding3,000 bags). One lot can run from 202 MT to 225 MT. A consecutive lot number (“BG”followed by three digits) is printed on each bag: BG028, BG029, BG030, etc.
The pregelatinized corn meal (PCM) rate out of the bin is set using check weight (average offour 15-second weights) run each day. The soy flour rate is adjusted based on final productprotein tested every 15 minutes. These two ingredients are blown from outside bins to bemixed with the other ingredients. This plant is unique in how they add the vitamins andminerals. The first batch mixes tricalcium phosphate (one 2,000 lb tote bag), minerals (one700 lb tote bag of salt mix containing salt, ferrous fumarate, and zinc sulfate), and two 50 lbboxes of vitamin premix (Watson Vital Mix 138 CSB) in a ribbon blender. This mix is blownover to one of three holding bins, on the bottom of which are Merrick™ gravimetric belt
RESULTS REPORT ON THE VITAMIN C PILOT PROGRAM 21
feeders over an auger. They run check weights on each belt feeder. The belt feeders haveload cells that show on the monitor of a central controller what each one is delivering.
At the end of the auger, the vitamin/mineral mix is combined with the corn meal, soy flour,and oil and mixed in an intensive continuous mixer. From there the final product is elevatedwith buckets to the hopper over the packer and packed out.
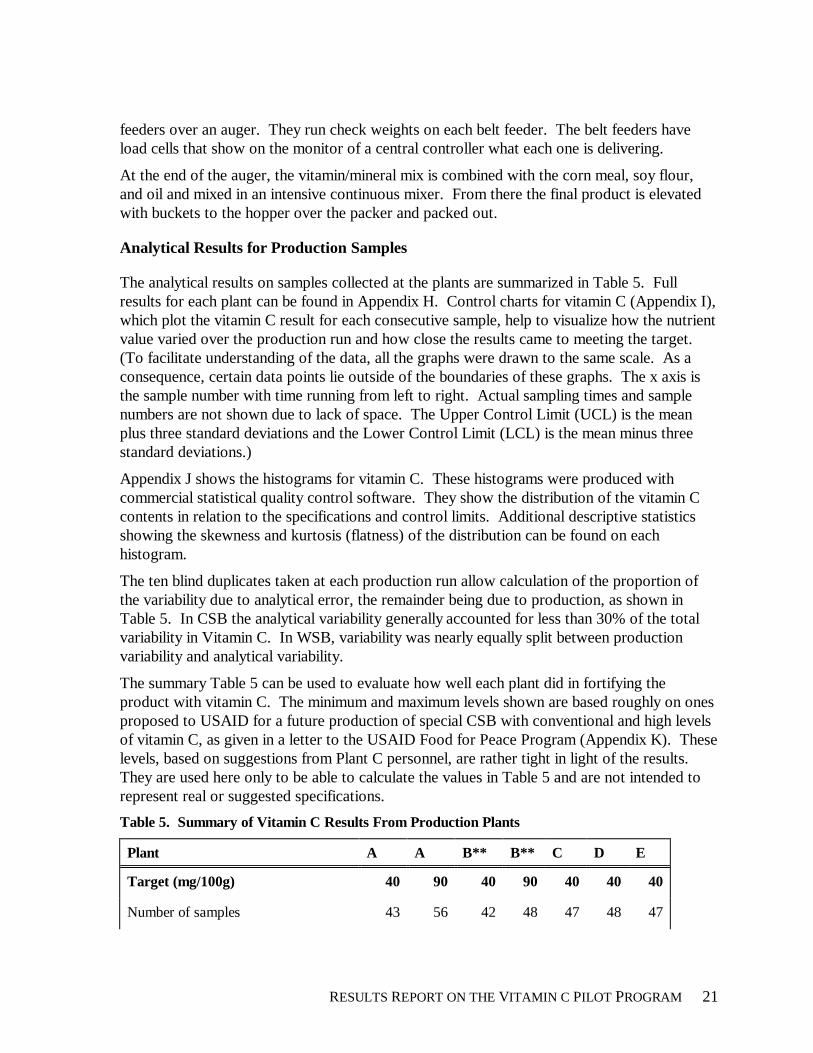
Analytical Results for Production Samples
The analytical results on samples collected at the plants are summarized in Table 5. Fullresults for each plant can be found in Appendix H. Control charts for vitamin C (Appendix I),which plot the vitamin C result for each consecutive sample, help to visualize how the nutrientvalue varied over the production run and how close the results came to meeting the target.(To facilitate understanding of the data, all the graphs were drawn to the same scale. As aconsequence, certain data points lie outside of the boundaries of these graphs. The x axis isthe sample number with time running from left to right. Actual sampling times and samplenumbers are not shown due to lack of space. The Upper Control Limit (UCL) is the meanplus three standard deviations and the Lower Control Limit (LCL) is the mean minus threestandard deviations.)
Appendix J shows the histograms for vitamin C. These histograms were produced withcommercial statistical quality control software. They show the distribution of the vitamin Ccontents in relation to the specifications and control limits. Additional descriptive statisticsshowing the skewness and kurtosis (flatness) of the distribution can be found on eachhistogram.
The ten blind duplicates taken at each production run allow calculation of the proportion ofthe variability due to analytical error, the remainder being due to production, as shown inTable 5. In CSB the analytical variability generally accounted for less than 30% of the totalvariability in Vitamin C. In WSB, variability was nearly equally split between productionvariability and analytical variability.
The summary Table 5 can be used to evaluate how well each plant did in fortifying theproduct with vitamin C. The minimum and maximum levels shown are based roughly on onesproposed to USAID for a future production of special CSB with conventional and high levelsof vitamin C, as given in a letter to the USAID Food for Peace Program (Appendix K). Theselevels, based on suggestions from Plant C personnel, are rather tight in light of the results.They are used here only to be able to calculate the values in Table 5 and are not intended torepresent real or suggested specifications.
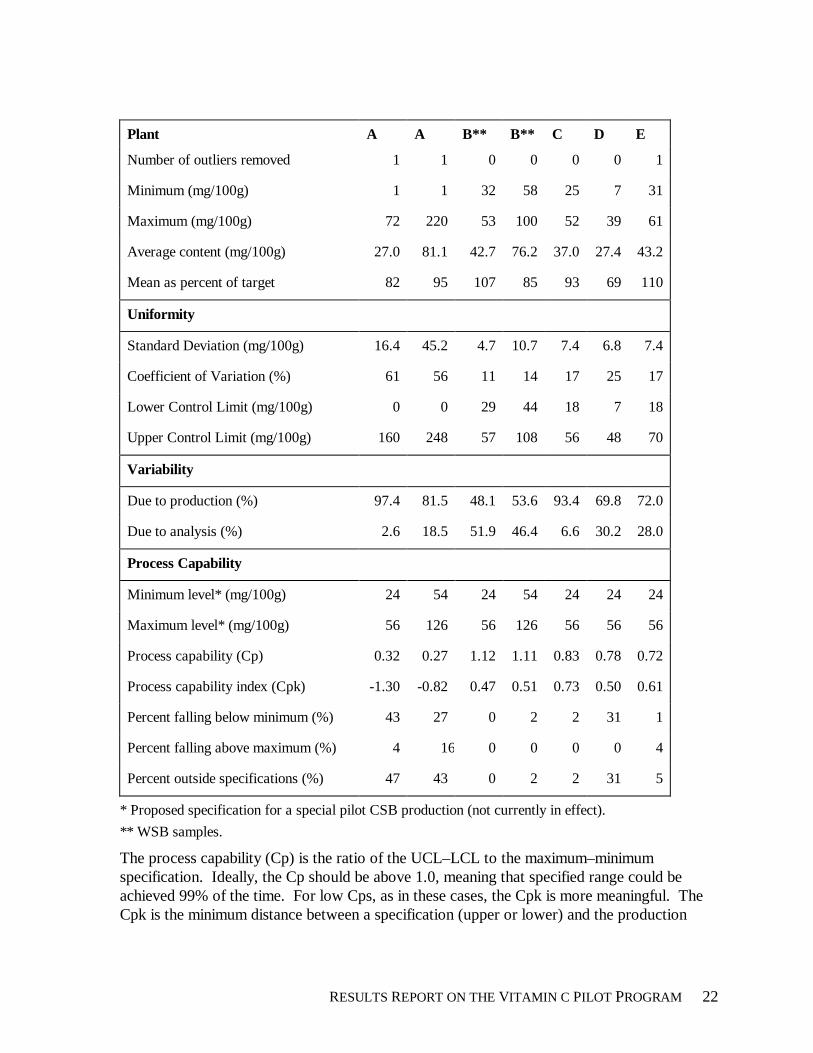
Table 5. Summary of Vitamin C Results From Production Plants
Plant A A B** B** C D E
Target (mg/100g) 40 90 40 90 40 40 40
Number of samples 43 56 42 48 47 48 47
RESULTS REPORT ON THE VITAMIN C PILOT PROGRAM 22
Plant A A B** B** C D E
Number of outliers removed 1 1 0 0 0 0 1
Minimum (mg/100g) 1 1 32 58 25 7 31
Maximum (mg/100g) 72 220 53 100 52 39 61
Average content (mg/100g) 27.0 81.1 42.7 76.2 37.0 27.4 43.2
Mean as percent of target 82 95 107 85 93 69 110
Uniformity
Standard Deviation (mg/100g) 16.4 45.2 4.7 10.7 7.4 6.8 7.4
Coefficient of Variation (%) 61 56 11 14 17 25 17
Lower Control Limit (mg/100g) 0 0 29 44 18 7 18
Upper Control Limit (mg/100g) 160 248 57 108 56 48 70
Variability
Due to production (%) 97.4 81.5 48.1 53.6 93.4 69.8 72.0
Due to analysis (%) 2.6 18.5 51.9 46.4 6.6 30.2 28.0
Process Capability
Minimum level* (mg/100g) 24 54 24 54 24 24 24
Maximum level* (mg/100g) 56 126 56 126 56 56 56
Process capability (Cp) 0.32 0.27 1.12 1.11 0.83 0.78 0.72
Process capability index (Cpk) -1.30 -0.82 0.47 0.51 0.73 0.50 0.61
Percent falling below minimum (%) 43 27 0 2 2 31 1
Percent falling above maximum (%) 4 16 0 0 0 0 4
Percent outside specifications (%) 47 43 0 2 2 31 5
* Proposed specification for a special pilot CSB production (not currently in effect).
** WSB samples.
The process capability (Cp) is the ratio of the UCL–LCL to the maximum–minimumspecification. Ideally, the Cp should be above 1.0, meaning that specified range could beachieved 99% of the time. For low Cps, as in these cases, the Cpk is more meaningful. TheCpk is the minimum distance between a specification (upper or lower) and the production
RESULTS REPORT ON THE VITAMIN C PILOT PROGRAM 23
mean, relative to the range in the data from the mean to either extreme. The Cpk is a truerindex of how well the plant did in meeting specifications because it eliminates the bias of beinghigh or low. Again, a value above 1.0 is good. Also calculated is the percentage of theproduction that would be expected to fall below the minimum specification and above themaximum specification, assuming a normal distribution. All of these calculations are based onhypothetical specifications. These product specifications need to be determined. Productspecifications should be based on the needs of the consumer, not the capability of theproduction plants.
As might be expected, the batch process used by Plant B to produce WSB showed the leastvariation or best uniformity in vitamin C. They were on target with the conventional vitaminC level and a bit low with the high vitamin C. Plant C was the best of the continuous CSBproducers followed closely by Plant E. Plant D had problems in meeting the vitamin C target,running 31% below the target level. Their problem may be primarily due to an incorrectfeeder adjustment. The nutrient feeders at Plant D were old and worn and may not have beenable to hold their calibration or deliver a consistent rate of product. The equipment formetering nutrients at Plants C and E were newer, well maintained, and correctly calibrated.Plant A, as previously discussed, had large variation in the vitamin C levels at both theconventional and high levels of added vitamin C.
Analytical Results for Vitamin Premix Samples
Samples of the vitamin premix used each day during production were taken directly from thevitamin feeder. This sample was tested for vitamin C and niacin by the quality controllaboratories at two premix manufacturers (Watson Foods and American Ingredients) thatroutinely do this type of assay using high pressure liquid chromatography. The samples wereidentified only with a number, so the laboratory did not know whose products they were. Ingeneral, the assays on these premixes, given in Appendix C, Table C-3, showed that theirnutrient content is close to the target. One sample of the vitamin/mineral blend used at PlantE was tested. The results of that were very close to target as well.
2. Stability of Vitamin C from Manufacture to Points of Distribution
The analytical results on the WSB samples collected in Haiti (Appendix H, Table H-2) and onthe CSB samples collected in India are shown in Appendix L. This stability component of thestudy does not include data from Tanzania because the CSB pilot production run sent toTanzania did not contain sufficiently uniform distribution of vitamin C to allow for an efficienttest of stability.
Comparison of Mean Levels
The stability of vitamin C can be determined by comparing the mean vitamin C content in theset of samples collected at production to the mean vitamin C content of the same lot collectedat the recipient location. This method turned out not to be possible with the CSB produced at
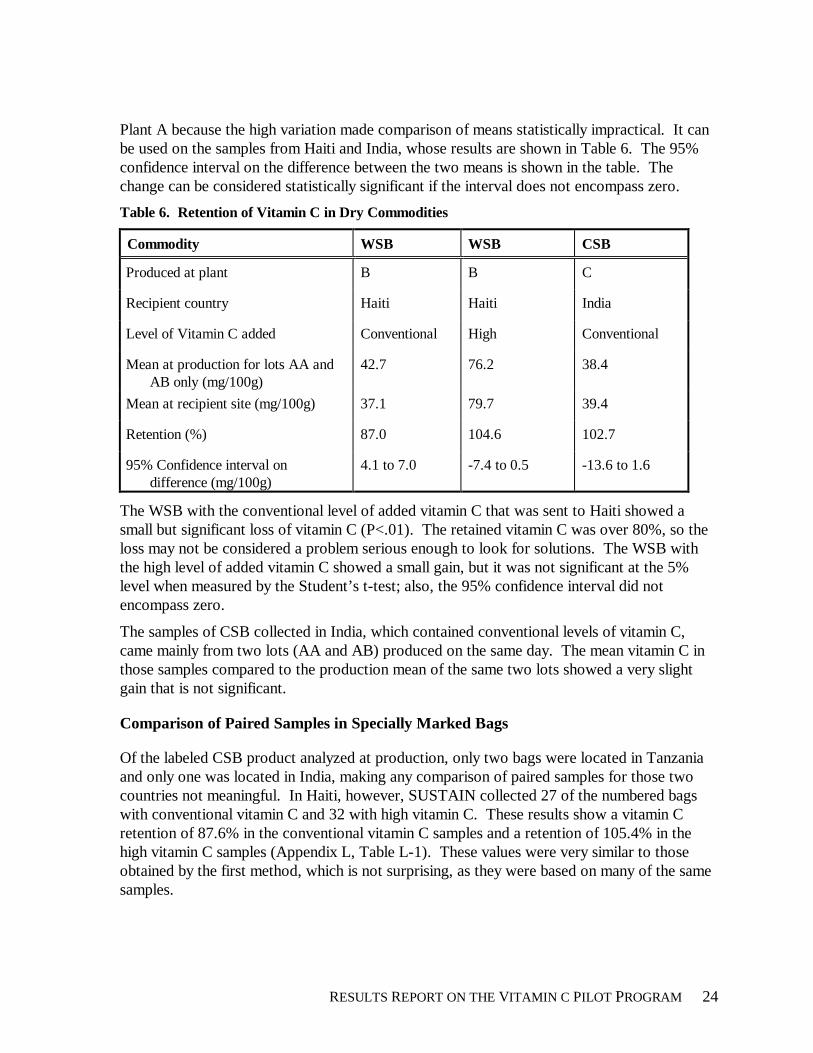
RESULTS REPORT ON THE VITAMIN C PILOT PROGRAM 24
Plant A because the high variation made comparison of means statistically impractical. It canbe used on the samples from Haiti and India, whose results are shown in Table 6. The 95%confidence interval on the difference between the two means is shown in the table. Thechange can be considered statistically significant if the interval does not encompass zero.
Table 6. Retention of Vitamin C in Dry Commodities
Commodity WSB WSB CSB
Produced at plant B B C
Recipient country Haiti Haiti India
Level of Vitamin C added Conventional High Conventional
Mean at production for lots AA andAB only (mg/100g)
42.7 76.2 38.4
Mean at recipient site (mg/100g) 37.1 79.7 39.4
Retention (%) 87.0 104.6 102.7
95% Confidence interval ondifference (mg/100g)
4.1 to 7.0 -7.4 to 0.5 -13.6 to 1.6
The WSB with the conventional level of added vitamin C that was sent to Haiti showed asmall but significant loss of vitamin C (P<.01). The retained vitamin C was over 80%, so theloss may not be considered a problem serious enough to look for solutions. The WSB withthe high level of added vitamin C showed a small gain, but it was not significant at the 5%level when measured by the Student’s t-test; also, the 95% confidence interval did notencompass zero.
The samples of CSB collected in India, which contained conventional levels of vitamin C,came mainly from two lots (AA and AB) produced on the same day. The mean vitamin C inthose samples compared to the production mean of the same two lots showed a very slightgain that is not significant.
Comparison of Paired Samples in Specially Marked Bags
Of the labeled CSB product analyzed at production, only two bags were located in Tanzaniaand only one was located in India, making any comparison of paired samples for those twocountries not meaningful. In Haiti, however, SUSTAIN collected 27 of the numbered bagswith conventional vitamin C and 32 with high vitamin C. These results show a vitamin Cretention of 87.6% in the conventional vitamin C samples and a retention of 105.4% in thehigh vitamin C samples (Appendix L, Table L-1). These values were very similar to thoseobtained by the first method, which is not surprising, as they were based on many of the samesamples.
RESULTS REPORT ON THE VITAMIN C PILOT PROGRAM 25
Vitamin C to Niacin Ratio
This method has a number of limitations. It is based on the following assumptions: (1) thatthere is a known and constant ratio between the two vitamins during production, (2) that thereis no differential segregation of vitamins during handling and sampling, and (3) that no niacinis lost during storage. Some of these assumptions may not be true. Other limitations are thatit requires knowledge of the natural niacin content of the product and the ratio being affectedby error from two different analytical tests, vitamin C and niacin. As such, it was intended tobe used only as a last resort if the other two methods failed because of inadequate data.SUSTAIN considers that the vitamin C contents of samples collected in the field are morereliable than the vitamin C niacin ratio. Therefore, this method was not used.
3. Within Bag Variability of Delivered Commodities
Within bag variation after shipping and handling was determined by sampling from bags ofCSB in Tanzania and WSB in Haiti at three different positions on the bag: the top third of thebag (position “a”), the middle third (position “b”), and the bottom third (position “c”)(Appendix M).
There was variation between samples taken from the three bag locations but the variabilitywas consistent throughout the bag, indicating that there was no systematic stratification orconcentration of the vitamin within one part of the bag.
4. Vitamin C Retention During Food Preparation
Table 7 presents a summary of the food preparation samples that SUSTAIN collected in Haitiand in Tanzania.
Table 7. Summary of Food Preparation Samples Collected in Selected Countries
WSB in Haiti Samples CSB in Tanzania Samples
High vitamin C 5 gruel High vitamin C 7 gruel
5 dumplings 4 ugali
Conventional vitamin C 4 dumplings Conventional vitamin C 9 gruel
3 gruel 1 ugali
1 fried cake
Note: for the special CSB with the higher vitamin C level, rather than one level of 90mg/100g,the CSB used for the food preparation had four levels of fortification (68, 93, 140, and 160mg/100g) that were not known before the food preparation sampling in the field. Theunexpected large variation in the levels of fortification indicated a possible problem withfortification at the plants (see the “Determination of Uniformity” section). It also gave
RESULTS REPORT ON THE VITAMIN C PILOT PROGRAM 26
SUSTAIN the opportunity to determine the effects of different concentrations of vitamin Cupon vitamin C retention in CSB after it was cooked in the field.
Cooking Methods
All preparations were cooked in an aluminum pot over charcoal or wood fire. All dishes had apH of 6, with two exceptions where the pH was 7.
Haiti
a) Gruel (called “bouillie” in Creole)
The main ingredients were WSB, water, salt, and sugar. Other ingredients were sometimesused: condensed can milk, fresh cow milk, fresh coconut milk, mashed banana, vanilla,cinnamon, lemon peel, anise.
Part of the liquid (water and/or fresh cow milk and/or coconut milk) was placed into analuminum pot and brought to boil, often with condiments (salt, cinnamon, anise, lemon peel,etc.). Meanwhile, the rest of the water was put in a bowl with the WSB (sometimes afterpassing the WSB through a sieve) to form a slurry. The slurry was then added to the boilingwater and brought to a boil. Sugar, sometimes with other ingredients such as condensed milkand mashed banana, was added and the mixture was brought again back to a boil. The vanillawas added last. The gruel was ready after boiling another 1 to 3 minutes.
The average total cooking time for WSB gruel was 19 minutes (STD = 5, n = 8). On average,the WSB spent 9 minutes (STD = 3, n = 8) in the slurry comprised of WSB and water beforecooking. This cooking time does not include any time that any other ingredients would havebeen cooked before WSB was added to the pot.
b) Dumplings (called “bouillon boy” in Creole)
These dough dumplings, made of WSB and shaped like fingers, were dumped into a vegetablebroth, sometimes with meat or fish. The main ingredients for the dumplings were WSB,water, and salt. Sometimes wheat flour, oil, and margarine were added to the dough. Theingredients for the broth varied with the availability of the ingredients: water, fresh coconutmilk, fresh vegetables, oil and/or margarine, plantain bananas, spinach, carrots, leeks, onion,tomato paste, potatoes, parsley, ground herring or pork, lemon, garlic, salt, pepper, thyme,bouillon cubes, MSG, watercress, and other green leaf vegetables not found in the UnitedStates.
The broth was prepared with the ingredients above. Usually the vegetables were added to theoil and/or margarine, then water and/or coconut milk were added. If meat was used, it wasfirst rubbed with small lemons, and then cooked in the oil and margarine, then the vegetablesand the liquid were added. While the broth was brought to a boil, the WSB was passedthrough a sieve. Sometimes, wheat flour was mixed with the WSB. Salt water was added tothe WSB flour to form a dough which was often then worked by hand. Sometimes margarine
RESULTS REPORT ON THE VITAMIN C PILOT PROGRAM 27
and oil were also added to the dough. The dough was shaped into finger-sized dumplings (thesize varied according to the mother preference). These fingers were then dumped into thebroth and cooked for several minutes.
The average total cooking time for WSB dumplings was 18 minutes (STD = 6, n = 9). Onaverage, the WSB spent 10 minutes (STD = 3, n = 9) in the dumpling dough comprised ofWSB and water before cooking. This cooking time does not include any time that any otheringredients would have been cooked before WSB was added to the pot.
Note that for the sampling of this dish, the dumplings and vegetable broth were addedtogether in one pot. However, the dumplings were collected as samples without vegetable orbroth.
Tanzania
a) Gruel
The ingredients were CSB and water only. (Of 16 gruel samples, only three included sugar.The refugees did not receive sugar, but could buy it if they had sufficient funds. No otheringredients were available to add to the gruel, except in special therapeutic feeding programs,in which vegetable oil and sugar were added.)
Gruel is the most common CSB food preparation. The CSB was mixed with a portion of coldwater to form a slurry while the rest of the water was brought to a boil. The slurry was thenadded to the boiling water and stirred. The mixture was brought again to a boil and allowedto simmer for a few minutes. Several mothers prepared the porridge by mixing the CSBdirectly with the entire amount of cold water. The mixture was then brought to a boil andallowed to simmer for a few minutes.
The average total cooking time for CSB gruel was 12 minutes (STD = 6, n = 15). Onaverage, the CSB spent 4 minutes (STD = 3, n = 10) in the slurry comprised of CSB andwater before cooking. This cooking time does not include any time that any other ingredientswould have been cooked before CSB was added to the pot.
b) Ugali
Ugali is a stiff paste comprised of CSB and water that accompanies another dish called“sauce.” The sauce is usually prepared with beans and vegetables such as tomatoes, onions,and cabbage. To make ugali, a small amount of water was brought to a boil. A portion ofthis water was removed just before it reached the boiling point and mixed with the CSB inanother bowl into a thick dough. This dough was added to the boiling water and stirred for afew minutes to form a dry, thick paste. The average total cooking time for CSB ugali was 5minutes (STD = 1, n = 5).
RESULTS REPORT ON THE VITAMIN C PILOT PROGRAM 28
c) Soup
The soup was prepared in the same manner as the porridge except that the tomatoes andonions were first sautéed in oil. Water was added and the mixture was brought to boil. Aslurry of CSB was added to the boiling liquid and let to simmer. In the statistical analysis, thissoup sample was treated like the gruel samples because of the cooking similarities.
d) Fried Cake
Fried cakes were not prepared regularly by the refugees. The ingredients used to prepare friedcakes were CSB, vegetable oil, and water. The CSB was mixed with cold water to form athick dough while the oil was heated. The CSB dough was shaped into small flat cakes andfried in hot oil for five minutes.
India
In addition, CSB food preparations were documented in Southern India from a CSBprocurement with conventional level of vitamin C.
a) Gruel
The gruel recipe was the same in India as in the refugee camps in Tanzania.
b) Steamed CSB
Ingredients were CSB, water, carrots, and coconuts. CSB was combined with a small amountof water to form a dough. Carrots were chopped and added to the dough, which was then putinto a small steamer layered with chopped coconut. It was steamed for 10 minutes.
Theoretical CSB/WSB Ration Size Observed in the Field
In Haiti, ADRA calculated the WSB ration size as follows: a family receives a total of fourrations of 30 g/day: one food ration for the malnourished child, two rations for his/hersiblings, and one ration for the mother. In many cases, the family size was larger, and morethan four people were fed with the WSB. As a result, 30 g of WSB is probably not the actualration size consumed by the beneficiary. SUSTAIN measured several servings of gruel anddumplings from six families, and from this data the serving size for a child is estimated to be,on average, 150 g of cooked gruel and 40 g of cooked dumplings (not including the broth).
In the refugee camps in Tanzania, WFP calculated the ration size as follows: number ofpersons per household x 7 days a week x 30 g of CSB per day. For example, for a 4-memberhousehold, the ration is 4 people x 7 days x 30 g = 840 g of CSB/week.
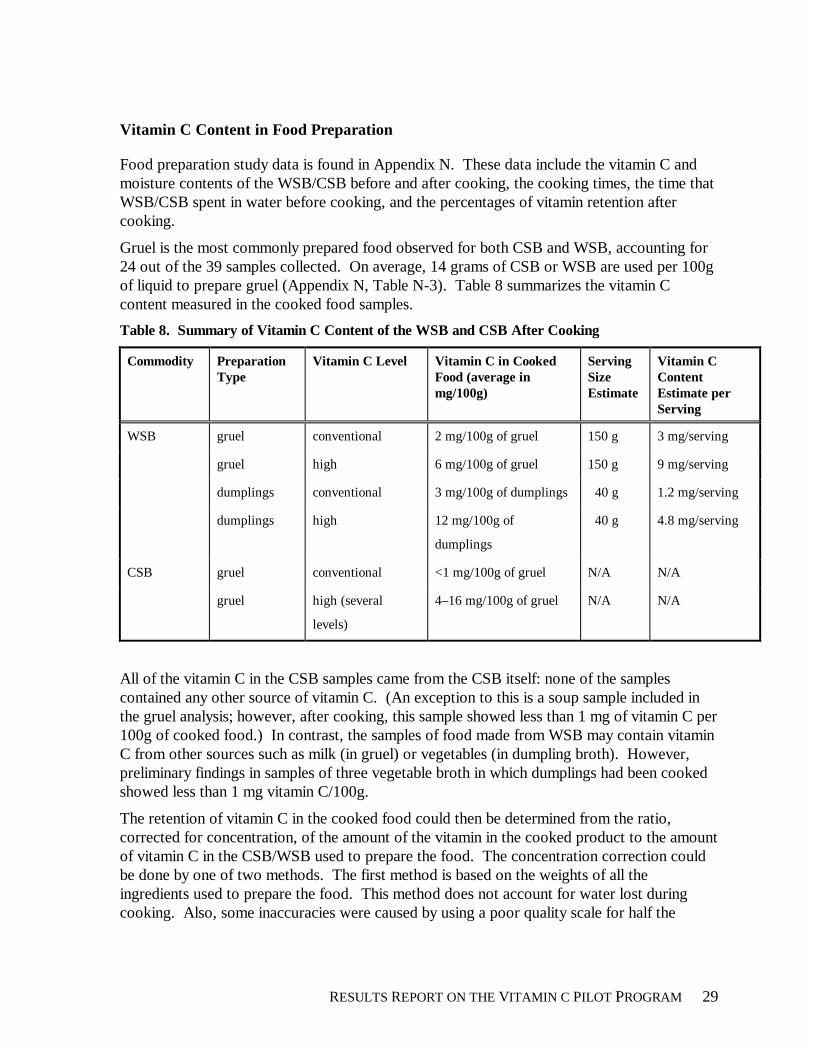
RESULTS REPORT ON THE VITAMIN C PILOT PROGRAM 29
Vitamin C Content in Food Preparation
Food preparation study data is found in Appendix N. These data include the vitamin C andmoisture contents of the WSB/CSB before and after cooking, the cooking times, the time thatWSB/CSB spent in water before cooking, and the percentages of vitamin retention aftercooking.
Gruel is the most commonly prepared food observed for both CSB and WSB, accounting for24 out of the 39 samples collected. On average, 14 grams of CSB or WSB are used per 100gof liquid to prepare gruel (Appendix N, Table N-3). Table 8 summarizes the vitamin Ccontent measured in the cooked food samples.
Table 8. Summary of Vitamin C Content of the WSB and CSB After Cooking
Commodity PreparationType
Vitamin C Level Vitamin C in CookedFood (average inmg/100g)
ServingSizeEstimate
Vitamin CContentEstimate perServing
WSB gruel conventional 2 mg/100g of gruel 150 g 3 mg/serving
gruel high 6 mg/100g of gruel 150 g 9 mg/serving
dumplings conventional 3 mg/100g of dumplings 40 g 1.2 mg/serving
dumplings high 12 mg/100g of
dumplings
40 g 4.8 mg/serving
CSB gruel conventional <1 mg/100g of gruel N/A N/A
gruel high (several
levels)
4–16 mg/100g of gruel N/A N/A
All of the vitamin C in the CSB samples came from the CSB itself: none of the samplescontained any other source of vitamin C. (An exception to this is a soup sample included inthe gruel analysis; however, after cooking, this sample showed less than 1 mg of vitamin C per100g of cooked food.) In contrast, the samples of food made from WSB may contain vitaminC from other sources such as milk (in gruel) or vegetables (in dumpling broth). However,preliminary findings in samples of three vegetable broth in which dumplings had been cookedshowed less than 1 mg vitamin C/100g.
The retention of vitamin C in the cooked food could then be determined from the ratio,corrected for concentration, of the amount of the vitamin in the cooked product to the amountof vitamin C in the CSB/WSB used to prepare the food. The concentration correction couldbe done by one of two methods. The first method is based on the weights of all theingredients used to prepare the food. This method does not account for water lost duringcooking. Also, some inaccuracies were caused by using a poor quality scale for half the
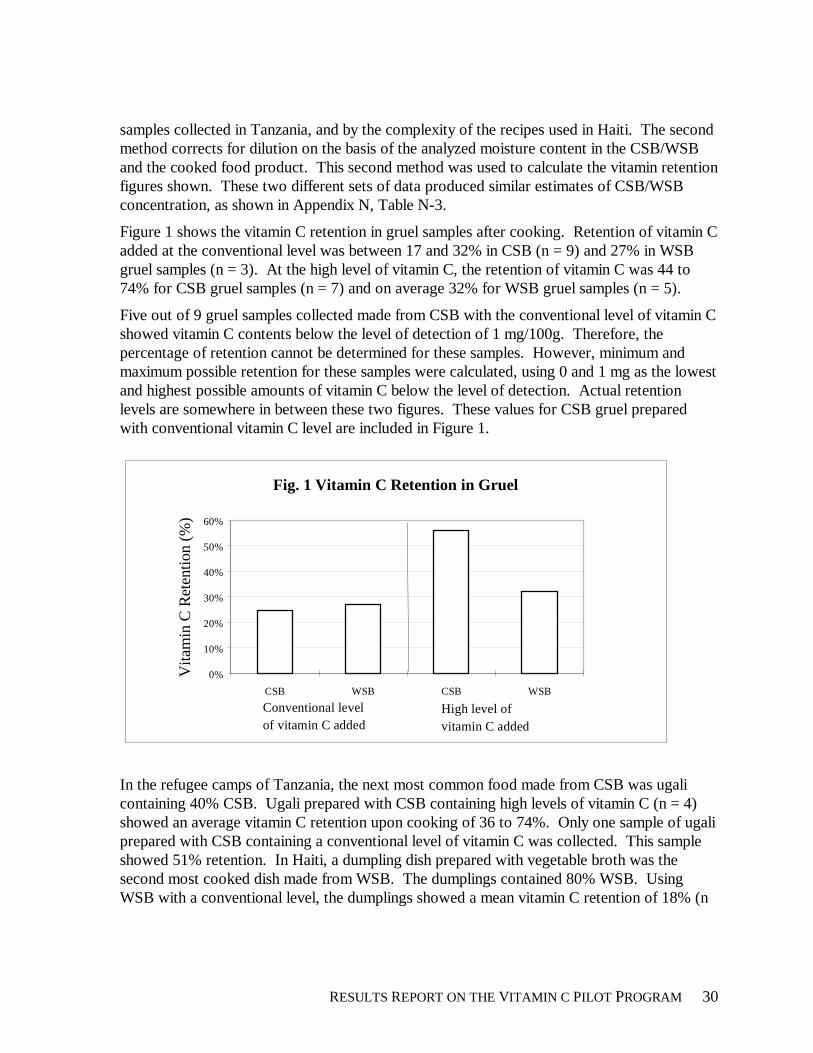
RESULTS REPORT ON THE VITAMIN C PILOT PROGRAM 30
samples collected in Tanzania, and by the complexity of the recipes used in Haiti. The secondmethod corrects for dilution on the basis of the analyzed moisture content in the CSB/WSBand the cooked food product. This second method was used to calculate the vitamin retentionfigures shown. These two different sets of data produced similar estimates of CSB/WSBconcentration, as shown in Appendix N, Table N-3.
Figure 1 shows the vitamin C retention in gruel samples after cooking. Retention of vitamin Cadded at the conventional level was between 17 and 32% in CSB (n = 9) and 27% in WSBgruel samples (n = 3). At the high level of vitamin C, the retention of vitamin C was 44 to74% for CSB gruel samples (n = 7) and on average 32% for WSB gruel samples (n = 5).
Five out of 9 gruel samples collected made from CSB with the conventional level of vitamin Cshowed vitamin C contents below the level of detection of 1 mg/100g. Therefore, thepercentage of retention cannot be determined for these samples. However, minimum andmaximum possible retention for these samples were calculated, using 0 and 1 mg as the lowestand highest possible amounts of vitamin C below the level of detection. Actual retentionlevels are somewhere in between these two figures. These values for CSB gruel preparedwith conventional vitamin C level are included in Figure 1.
Fig. 1 Vitamin C Retention in Gruel
0%
10%
20%
30%
40%
50%
60%
CSB WSB CSB WSB
Vita
min
C R
eten
tion
(%)
Conventional level of vitamin C added
High level of vitamin C added
In the refugee camps of Tanzania, the next most common food made from CSB was ugalicontaining 40% CSB. Ugali prepared with CSB containing high levels of vitamin C (n = 4)showed an average vitamin C retention upon cooking of 36 to 74%. Only one sample of ugaliprepared with CSB containing a conventional level of vitamin C was collected. This sampleshowed 51% retention. In Haiti, a dumpling dish prepared with vegetable broth was thesecond most cooked dish made from WSB. The dumplings contained 80% WSB. UsingWSB with a conventional level, the dumplings showed a mean vitamin C retention of 18% (n
RESULTS REPORT ON THE VITAMIN C PILOT PROGRAM 31
= 4), and using WSB with a high level of vitamin C, the dumplings showed a mean vitamin Cretention of 33% (n = 5).
These results showed large losses of vitamin C in both CSB and WSB during the foodpreparation observed for these commodities. The magnitude of this loss is concentrationdependent for CSB: the higher the level of the vitamin in the dry commodity before cooking,the greater the retention. This finding was not unexpected.
The food industry is well aware that vitamin C does not survive most cooking processes andtherefore does not add it to foods that need to be cooked. This loss of vitamin C occursduring cooking because of oxidation: in the presence of water, vitamin C reacts with oxygenand other oxidizing substances in the food. Heat and enzymes probably accelerate thesereactions. In the process, some of the vitamin C is destroyed. CSB and WSB containing lowlevels (below 24 mg/100g) of vitamin C lose nearly all of the vitamin C during cooking.Conversely, the higher vitamin C levels allow cooked food to retain some vitamin C at thetime of consumption.
Statistical analysis of the data on the prepared food samples can be found in Appendix N.
5. Analysis of Vitamin C Cost
Conventional Fortification
CSB and WSB do not naturally contain vitamin C, so the vitamin level in the product reflectsonly what is added. The premix specifications for conventional CSB and WSB call for theaddition of 364 grams of vitamin C per ton (2,000 lbs) of product (Table C-1, Appendix C).That translates to 40.1 mg/100g added vitamin C, which is normally reported rounded off to40 mg/100g.
USDA specifications require a form of vitamin C with an ethyl cellulose (EC) coating, which,among other things, protects the ascorbic acid from oxidation. While the thickness of the ECcoating is not specified, the product normally used contains 97.5 percent vitamin C and 2.5percent EC. Therefore, to meet the vitamin C requirement of 40.1 mg/100g, the conventionalCSB and WSB must have 41.1 mg/100g (0.411 kg per MT) of coated vitamin C added.
Like with other commodities, the cost of EC-coated vitamin C fluctuates. The 1996 list pricefrom a large manufacturer was $15.00/kg, but this recently dropped to a list price of $9.00/kg.Using this recent figure, the base ingredient cost of conventional vitamin C is:
Amount added per MT (in kg) 0.411
Cost per kg x $9.00
Cost per MT ($U.S.) $3.69
The “real” cost of the vitamin C fortification is somewhat higher, as the calculation abovedoes not include the costs of producing and analyzing the vitamin premix, of which vitamin Cis just one component. It also does not include the premix manufacturer’s profit.
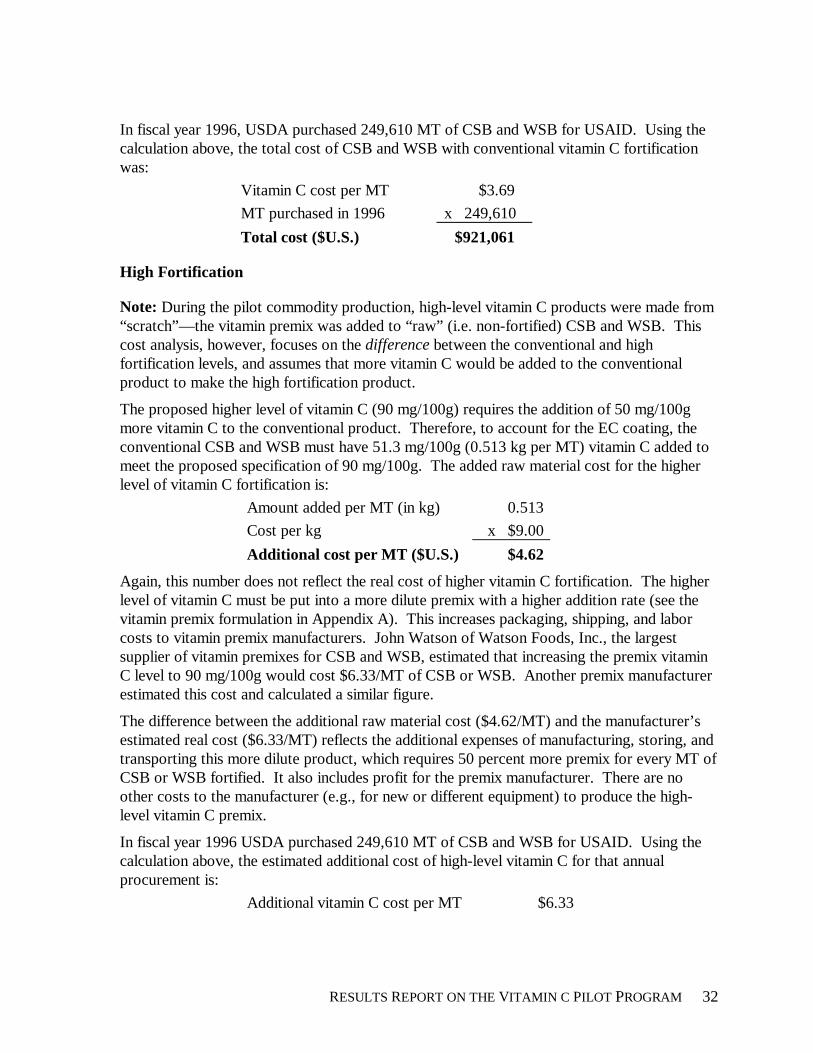
RESULTS REPORT ON THE VITAMIN C PILOT PROGRAM 32
In fiscal year 1996, USDA purchased 249,610 MT of CSB and WSB for USAID. Using thecalculation above, the total cost of CSB and WSB with conventional vitamin C fortificationwas:
Vitamin C cost per MT $3.69
MT purchased in 1996 x 249,610
Total cost ($U.S.) $921,061
High Fortification
Note: During the pilot commodity production, high-level vitamin C products were made from“scratch”—the vitamin premix was added to “raw” (i.e. non-fortified) CSB and WSB. Thiscost analysis, however, focuses on the difference between the conventional and highfortification levels, and assumes that more vitamin C would be added to the conventionalproduct to make the high fortification product.
The proposed higher level of vitamin C (90 mg/100g) requires the addition of 50 mg/100gmore vitamin C to the conventional product. Therefore, to account for the EC coating, theconventional CSB and WSB must have 51.3 mg/100g (0.513 kg per MT) vitamin C added tomeet the proposed specification of 90 mg/100g. The added raw material cost for the higherlevel of vitamin C fortification is:
Amount added per MT (in kg) 0.513
Cost per kg x $9.00
Additional cost per MT ($U.S.) $4.62
Again, this number does not reflect the real cost of higher vitamin C fortification. The higherlevel of vitamin C must be put into a more dilute premix with a higher addition rate (see thevitamin premix formulation in Appendix A). This increases packaging, shipping, and laborcosts to vitamin premix manufacturers. John Watson of Watson Foods, Inc., the largestsupplier of vitamin premixes for CSB and WSB, estimated that increasing the premix vitaminC level to 90 mg/100g would cost $6.33/MT of CSB or WSB. Another premix manufacturerestimated this cost and calculated a similar figure.
The difference between the additional raw material cost ($4.62/MT) and the manufacturer’sestimated real cost ($6.33/MT) reflects the additional expenses of manufacturing, storing, andtransporting this more dilute product, which requires 50 percent more premix for every MT ofCSB or WSB fortified. It also includes profit for the premix manufacturer. There are noother costs to the manufacturer (e.g., for new or different equipment) to produce the high-level vitamin C premix.
In fiscal year 1996 USDA purchased 249,610 MT of CSB and WSB for USAID. Using thecalculation above, the estimated additional cost of high-level vitamin C for that annualprocurement is:
Additional vitamin C cost per MT $6.33
RESULTS REPORT ON THE VITAMIN C PILOT PROGRAM 33
MT purchased in 1996 x 249,610
Additional cost ($U.S.) $1,580,031
Like all commodity prices in an open market, the cost of EC-coated vitamin C fluctuates inresponse to supply and demand. The current base price for EC-coated vitamin C is at an all-time low, ranging from $5.00/kg to $7.00/kg. In 1995, the actual prices paid for ascorbic acidby a large vitamin premix manufacturer ranged from $13.40/kg to $15.75/kg. The currentlow price is attributed to a new supply of ascorbic acid from China, where it is produced inlarge quantities with new plants. By offering the commodity at low prices, manufacturers inChina are hoping to capture a large portion of the world market. Once the situation stabilizes,the price of ascorbic acid and, as a result, the price of the EC coated vitamin C may increase.There is no way to accurately predict future ascorbic acid prices.
RESULTS REPORT ON THE VITAMIN C PILOT PROGRAM 34
V. ADDITIONAL INFORMATION REQUESTED BY THE COMMITTEE ON
INTERNATIONAL NUTRITION
This section of the report includes the information requested by the Committee onInternational Nutrition. Additional cost information can be found in the “Results of theVitamin C Pilot Program” main report.
The text in italics below is cited from “ Vitamin C in Food Aid Commodities: Initial Review ofa Pilot Program” (Committee on International Nutrition, Institute of Medicine. 1996.Washington D.C.: National Academy Press, pp. 16–17).
Committee on International Nutrition (CIN): To address cost effectiveness and theadvisability of increasing the level of vitamin C fortification in CSB and WSB, thecommittee will need to examine information on the vitamin C content (includingvariability) of the blends after production, storage, and food preparation. […].Therefore, the committee requests the following additional information in order toanalyze cost-effectiveness and to have adequate data on which to base a judgmentabout the advisability of increasing the vitamin C content of CSB and WSB. […].
1. Information on the worldwide prevalence of scurvy and of insufficient vitamin Cand iron intakes in the two types of populations that are recipients of CSB and WSB:(1) refugees in camps, and (2) targeted beneficiary households in Title IIdevelopment programs.
In addition to protein-energy malnutrition among displaced and refugee populations,micronutrient deficiencies play a key role in nutrition-related morbidity and mortality (CDC,1992). Scurvy outbreaks have been documented in refugee populations during the pastdecade in addition to deficiencies of vitamin A and iron, conditions known to be importantchildhood problems in developing countries (CDC, 1992; WHO, 1993). “In Central Americaand South and South-east Asia, refugees generally either receive adequate diets or are able tofind ones through trade, cultivation, or from other income” (Seaman et al., 1989). This is notthe case in parts of Africa, where more than 100,000 cases of scurvy occurred among differentEast African refugee populations in the late 1970s and in the 1980s (Desenclos, 1989).Notably, no outbreaks have been reported from West or Southern African refugee situationsthat are widespread in areas including Liberia, Sierra Leone, the Great Lakes Region ofCentral Africa, and Angola.
Recommended dietary levels for refugees include 30 mg of vitamin C per day and 22 mg ofiron per day (Toole, 1994). A typical daily refugee ration in Africa is made up of 400–500 gof cereal, 30–40 g of beans or lentils and 10–20 g of oil, and rarely dried skimmed milk(Henry and Seaman, 1992). This general food basket provides less than 6–10 mg/day ofvitamin C (CDC, 1989; Desenclos, 1987, 1989; Refugee Health Unit, NW, 1985; WHO,
RESULTS REPORT ON THE VITAMIN C PILOT PROGRAM 35
1989). In addition, the rations are estimated to supply on average 15.5 mg iron/day (Toole,1994).
Until 1994, fortified cereal blends were occasionally provided in the general ration becausethese blends were normally reserved for targeted supplementary feeding programs (VanNieuwenhuyse, 1997). They were about twice as expensive as the plain milled cerealsnormally distributed in general rations (UNHCR, 1989). Toole (1992) noted that despiteguidelines, fortification levels of donor cereal rations lacked standardization and periodicshortages regularly took place. It was only in 1994 that a policy to distribute fortified cerealsin the early stage of an emergency situation or to a population totally dependent on food aidwas adopted by WFP and UNHCR. In their Memorandum of Understanding, signed inJanuary 1994, UNHCR and WFP stated that “in an attempt to pre-empt any micronutrientdeficiency, WFP will provide populations, wholly dependent on food aid, micronutrientfortified blended foods. UNHCR will be responsible for providing complementary foodcommodities (local fresh foods, condiments, dried skim milk/dried whole milk, high proteinbiscuits) whenever such are required.” Nevertheless, as Toole (1994) indicated, despite theseguidelines, blended foods were not immediately available in several refugee relief operations,such as in the assistance program for Rwandan refugees in eastern Zaire, in July-August 1994.Note that the refugees fled their country in April 1994 but the intervention in Zaire could startonly in July–August 1994.
Scurvy and insufficient vitamin C intake
Toole (1994) states that between 10 to 15 mg daily will probably prevent clinicalmanifestation of scurvy but many authors refer to 6 to 10 mg/day as a minimum requirement(CDC, 1989; Desenclos, 1987, 1989; Refugee Health Unit, NW, 1985; WHO, 1989). On adiet completely lacking in vitamin C, body stores last about 2 months and symptoms of scurvy(gum bleeding and joint bone pain with or without swelling) appear after four months(Desenclos et al., 1989; Magan et al., 1983). This length of time corresponds to the length oftime that it took for scurvy to manifest in refugee camps. The scurvy outbreaks in refugeecamps will be discussed in section 1.1.
Insufficient iron intake
Iron deficiency anemia occurs worldwide and is probably the most prevalent micronutrientdeficiency disease (Toole, 1994). Worldwide, the majority of iron deficiency is the directresult of low dietary iron content (Yip, 1993). Vitamin C deficiency most likely contributes toiron deficiency anemia (Seaman and Rivers, 1989; Toole, 1992; Yip, 1994). In addition,certain food substances inhibit iron absorption: phosphates/phytates in cereal and proteins inlegumes (WHO, 1993). Parasitic diseases such as hookworm and schistosomiasis alsocorrespond to a high prevalence of anemia (Toole, 1992; Yip, 1994).
More prominent than scurvy, anemia has been found in some refugee populations (Toole,1994; Yip, 1994). However, the numbers may be similar to those found in local development
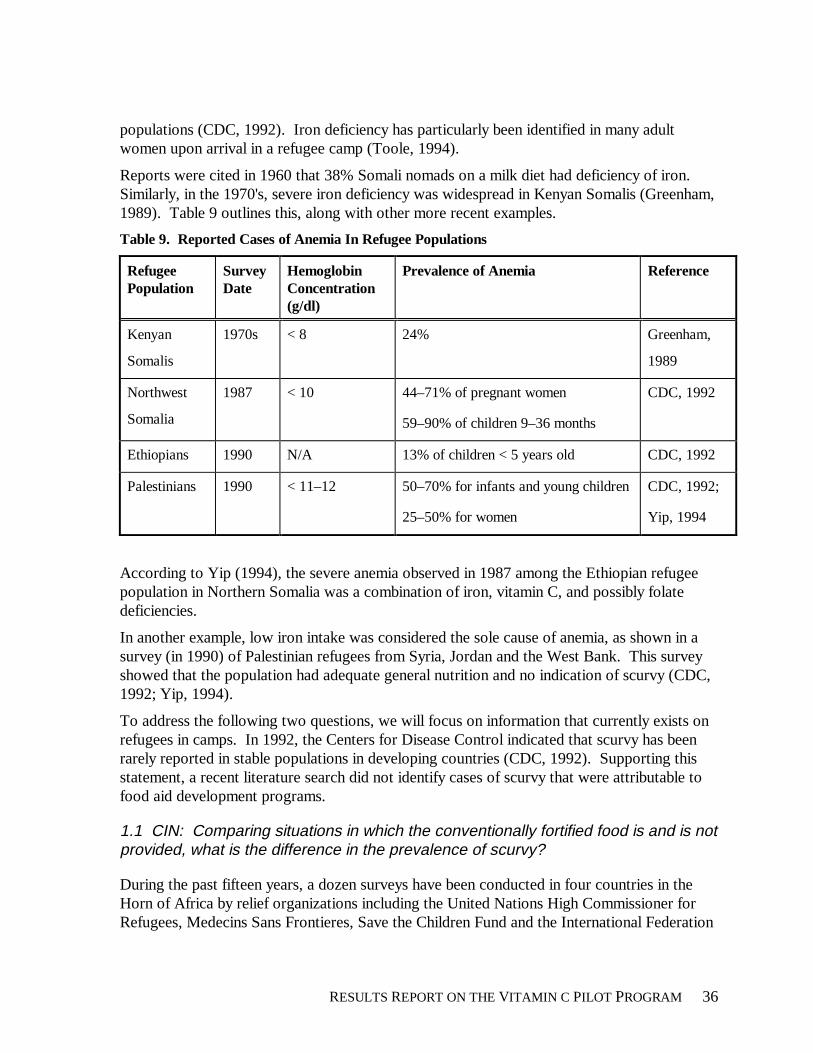
RESULTS REPORT ON THE VITAMIN C PILOT PROGRAM 36
populations (CDC, 1992). Iron deficiency has particularly been identified in many adultwomen upon arrival in a refugee camp (Toole, 1994).
Reports were cited in 1960 that 38% Somali nomads on a milk diet had deficiency of iron.Similarly, in the 1970's, severe iron deficiency was widespread in Kenyan Somalis (Greenham,1989). Table 9 outlines this, along with other more recent examples.
Table 9. Reported Cases of Anemia In Refugee Populations
RefugeePopulation
SurveyDate
HemoglobinConcentration(g/dl)
Prevalence of Anemia Reference
Kenyan
Somalis
1970s < 8 24% Greenham,
1989
Northwest
Somalia
1987 < 10 44–71% of pregnant women
59–90% of children 9–36 months
CDC, 1992
Ethiopians 1990 N/A 13% of children < 5 years old CDC, 1992
Palestinians 1990 < 11–12 50–70% for infants and young children
25–50% for women
CDC, 1992;
Yip, 1994
According to Yip (1994), the severe anemia observed in 1987 among the Ethiopian refugeepopulation in Northern Somalia was a combination of iron, vitamin C, and possibly folatedeficiencies.
In another example, low iron intake was considered the sole cause of anemia, as shown in asurvey (in 1990) of Palestinian refugees from Syria, Jordan and the West Bank. This surveyshowed that the population had adequate general nutrition and no indication of scurvy (CDC,1992; Yip, 1994).
To address the following two questions, we will focus on information that currently exists onrefugees in camps. In 1992, the Centers for Disease Control indicated that scurvy has beenrarely reported in stable populations in developing countries (CDC, 1992). Supporting thisstatement, a recent literature search did not identify cases of scurvy that were attributable tofood aid development programs.
1.1 CIN: Comparing situations in which the conventionally fortified food is and is notprovided, what is the difference in the prevalence of scurvy?
During the past fifteen years, a dozen surveys have been conducted in four countries in theHorn of Africa by relief organizations including the United Nations High Commissioner forRefugees, Medecins Sans Frontieres, Save the Children Fund and the International Federation
RESULTS REPORT ON THE VITAMIN C PILOT PROGRAM 37
of Red Cross and Red Crescent Societies. All illustrated the plight of refugees developingclinical cases of scurvy (Table 10). As mentioned earlier, it is only in 1994 that a policy todistribute fortified cereals to populations totally dependent on food aid was adopted by WFPand UNHCR. Therefore, when distributed, fortified cereals were not part of the generalration but mainly used in special feeding programs.
Typical clinical indicators of scurvy that were cited include swollen gums with bleeding andswollen and/or painful joints, bones, or muscles of the lower extremities (hip, knee, ankle).(UNHCR, 1989). The prevalence of scurvy found in these surveys ranged from 1% to 44%.Four examples of surveys follow.
Ethiopian Refugees in Somalia, 1982
Magan et al. (1983) reported that more than 2,000 cases of scurvy were detected amongEthiopian refugees in Somalia in the summer of 1982, with 72 cases located in the Gedo sub-regions of Bur Dhubo and Hilomareer. “This major outbreak of scurvy occurred as a result ofthe problems of providing an adequate diet to a large population of displaced persons,gathered together in camps scattered throughout a large, semi-arid African country withlimited local food supplies and poorly developed road and communication systems” (Magan etal., 1983). The population was 80% women, children, and elderly men. This population ispastoral nomads, and their traditional diet consisted of about 20% meat and cereal, and 80%camel's milk (up to 4 liters per day, which supplies sufficient vitamin C). When they becamerefugees, international donors provided them with a daily ration (listed below) that wasadequate in many essential nutrients, but contained almost no vitamin C and very littlebioavailable iron (Magan et al., 1983):
♦ 300 g cereals (mainly maize and sorghum)♦ 75 g wheat flour♦ 40 g dried skim milk♦ 40 g beans♦ 30 g edible oil
Although the refugees involved in the scurvy outbreak had been in the same camps for as longas 3 years, it was only in early 1982 that the first cases of scurvy were reported. Magan andcoworkers (1983) believe that the refugees supplemented their rations with local vitamin Csources, including camel's milk, tomatoes, onions, and sweet potatoes purchased in the localmarkets until two to three months before the scurvy outbreak. For four camps, the refugeeswere unable to purchase sufficient amount of foods containing vitamin C because of a localmarket closure. For the other camps of the region, there is no clear explanation on why theoutbreak occurred at that particular time, because the local markets remained open (Magan etal., 1983).
RESULTS REPORT ON THE VITAMIN C PILOT PROGRAM 38
Ethiopian Refugees in Somalia and Sudan, 1984–1987
Desenclos et al. (1989) reviewed data collected from 1985 to 1987 in five refugee camps inSomalia (Table 10: Gannet, Biyoley, Bixin, Tugwajale, Dacawale) and one in Sudan (Wad-Kowli) where scurvy was identified. Scurvy occurred 3 to 10 months after refugees settled incamps; the highest incidences were during and immediately after the dry season. The risk ofdeveloping scurvy increased significantly with length of residence at the camp, with age, andamong females, particularly pregnant and lactating women (Desenclos et al., 1989).
The food rations (<1400 kcal/day consisting of cereals, legumes, and oil) provided negligibleamounts of vitamin C. In the case of the Gannet camp, dry skimmed milk (DSM), usually partof the general ration, was the only commodity containing some vitamin C (30g of DSMprovides about 2 mg of vitamin C) but was not available for distribution during the threemonths prior to the outbreak (Refugee Health Unit, 1985). Refugees enrolled insupplementary feeding programs did not show decreased prevalence of scurvy although theyreceived cooked rations prepared with corn soy milk (CSM) (Desenclos et al., 1989; RefugeeHealth Unit, 1985). Uncooked CSM contains 12 mg of vitamin C per 30 g.
Somali Refugees in Eastern Ethiopia, 1988–1989
In summer 1988, as many as 400,000 refugees from northern Somalia entered easternEthiopia (CDC, 1989). They were settled in several camps, including the Hartisheik camp.Routine nutritional surveys were conducted in the camps by Save the Children (SFK) betweenSeptember 1988 and May 1989 and showed the severity of malnutrition among thispopulation. In addition, in January 1989, the prevalence of scurvy by clinical examination wasshown to be approximately 1%–2%. Delivery of rations (cereal, and occasional lentils andvegetable oil) was intermittent, leaving families with 10-day supplies for 3 or 4 week periods.Logistical difficulties precluded delivering perishable vitamin C containing foods (vegetablesand fruit) to such remote regions. No fortified blended foods were distributed (CDC, 1989).
Somali Refugees in Kenya, 1994 and 1996
In 1994, at the time of a scurvy outbreak, Somali refugees in Kenya were receiving fortifiedblended food: 50 g of CSB/day providing 20 mg of vitamin C (Van Nieuwenhuyse, 1997). Itwas believed that no vitamin C remained after preparation because the beneficiaries cooked itfor over 30 minutes. Purchased camel's milk, garden produce, and wild food were usually themain sources of vitamin C for this population (Van Nieuwenhuyse, 1997).
The scurvy outbreaks in the Dadaab camp appear to be more seasonal rather than related tothe distribution of fortified blended food, with initial cases appearing in June and peakingaround September (Van Nieuwenhuyse, 1997). This corresponded with lack of fresh foodand high camel milk prices. In October 1995, the fortified blended food was withdrawn fromthe general ration The absence of fortified cereal did not change the pattern of scurvyoccurrence in 1996.
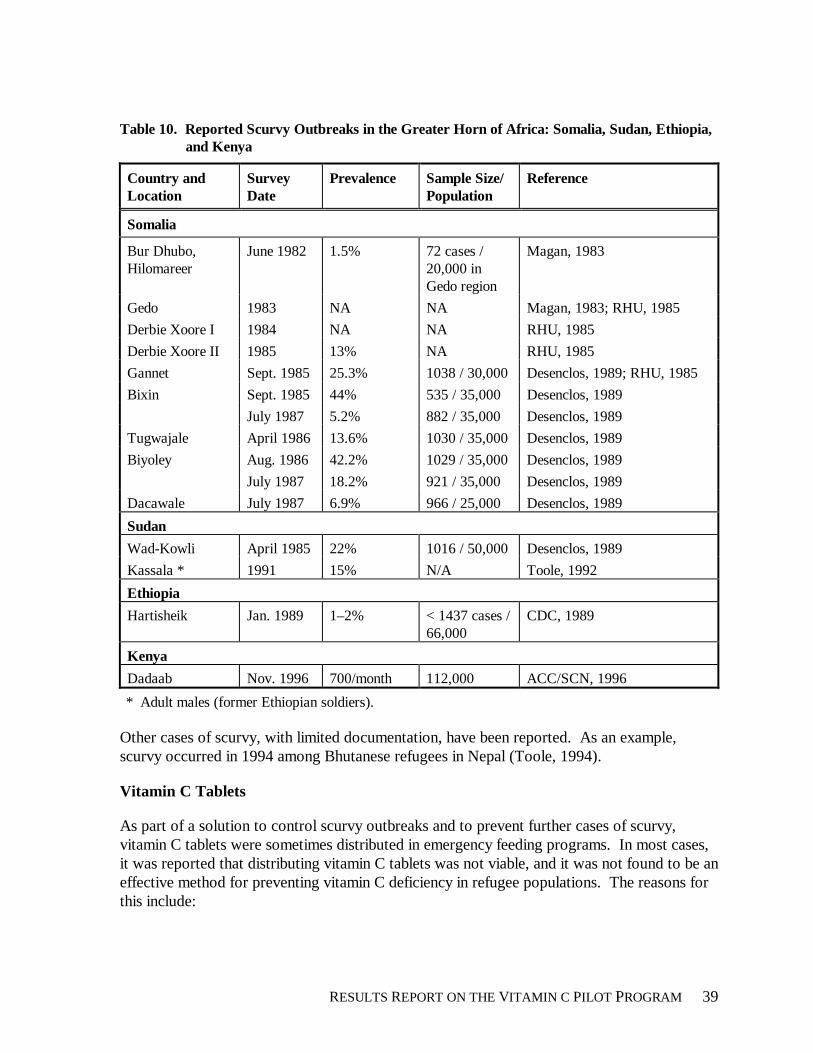
RESULTS REPORT ON THE VITAMIN C PILOT PROGRAM 39
Table 10. Reported Scurvy Outbreaks in the Greater Horn of Africa: Somalia, Sudan, Ethiopia,and Kenya
Country andLocation
SurveyDate
Prevalence Sample Size/Population
Reference
Somalia
Bur Dhubo,Hilomareer
June 1982 1.5% 72 cases /20,000 inGedo region
Magan, 1983
Gedo 1983 NA NA Magan, 1983; RHU, 1985
Derbie Xoore I 1984 NA NA RHU, 1985
Derbie Xoore II 1985 13% NA RHU, 1985
Gannet Sept. 1985 25.3% 1038 / 30,000 Desenclos, 1989; RHU, 1985
Bixin Sept. 1985 44% 535 / 35,000 Desenclos, 1989
July 1987 5.2% 882 / 35,000 Desenclos, 1989
Tugwajale April 1986 13.6% 1030 / 35,000 Desenclos, 1989
Biyoley Aug. 1986 42.2% 1029 / 35,000 Desenclos, 1989
July 1987 18.2% 921 / 35,000 Desenclos, 1989
Dacawale July 1987 6.9% 966 / 25,000 Desenclos, 1989
Sudan
Wad-Kowli April 1985 22% 1016 / 50,000 Desenclos, 1989
Kassala * 1991 15% N/A Toole, 1992
Ethiopia
Hartisheik Jan. 1989 1–2% < 1437 cases /66,000
CDC, 1989
Kenya
Dadaab Nov. 1996 700/month 112,000 ACC/SCN, 1996
* Adult males (former Ethiopian soldiers).
Other cases of scurvy, with limited documentation, have been reported. As an example,scurvy occurred in 1994 among Bhutanese refugees in Nepal (Toole, 1994).
Vitamin C Tablets
As part of a solution to control scurvy outbreaks and to prevent further cases of scurvy,vitamin C tablets were sometimes distributed in emergency feeding programs. In most cases,it was reported that distributing vitamin C tablets was not viable, and it was not found to be aneffective method for preventing vitamin C deficiency in refugee populations. The reasons forthis include:
RESULTS REPORT ON THE VITAMIN C PILOT PROGRAM 40
♦ Logistical difficulties to implement the program of tablet distribution (Seaman, 1989;Toole, 1994; UNHCR, 1989). UNHCR (1989) determined that an adequate supply ofvitamin C tablets for 300,000 refugees in Eastern Sudan during the outbreak in 1985would have been as many as three million vitamin C tablets a month. Also counting,packaging, and distributing tablets requires extensive effort (RHU, 1985).
♦ Poor compliance (Seaman, 1989; Toole, 1994). This can be due to the unfamiliarity withtablet consumption and suspicion of tablet consumption among traditional populations(non-compliance would render the activity cost-inefficient).
♦ Vitamin C tablets would need to be distributed on a weekly basis (UNHCR, 1989). Thetime required for supplementary distribution may interfere with the time health workersalso need to spend on other essential tasks.
1.2 CIN: What are the salient characteristics for targeting those at risk of scurvy inpopulations in which scurvy has been identified?
General rations containing inadequate vitamin C, combined with a lack of diversity of foodsources, have been blamed as the primary factors for outbreaks of scurvy in displaced andfamine-affected populations, particularly during the first year of an emergency (CDC, 1992;Moren, 1994; Nieburg, 1992; Toole, 1994; UNHCR, 1989; WHO, 1989). Unfortunately,actual vitamin C intake in refugee camps is difficult to measure, since local food sources andcooking procedures may vary. A further complicating factor is that cigarette smoking isknown to increase vitamin C requirements (WHO, 1993).
Scurvy outbreaks appear in the early stage of an emergency or in populations totallydependent on food aid, especially when access to local food is not possible. Refugees oftenexchange ration foods for fruit and vegetables among other items. “The most telling riskfactor is duration of stay in a refugee camp, reflecting the time on rations lacking in vitaminC” (Toole, 1994).
Salient characteristics for targeting those at risk of scurvy include:
♦ Displaced and famine-affected populations (CDC, 1992).♦ Dry season and incapability to cultivate (Desenclos, 1989; Henry and Seaman, 1992).♦ Limited local supplies of fresh produce (Magan, 1983).♦ Age (Toole, 1992).♦ Female, particularly pregnant and lactating (Toole, 1992).♦ Difficult access by relief organizations due to war or remoteness (International Federation
of Red Cross and Red Crescent Societies, 1996).♦ Lack of acceptance of food sources due to cultural preferences (Mason,1992; Toole,
1992).♦ Lack of resources (food or monetary) to trade for other food sources (Toole, 1992).
CIN: (Information on scurvy prevalence should be available from the Centers forDisease Control and Prevention, United Nations High Commissioner for Refugees,World Health Organization, CARE (at least for El Salvador and Guatemala), and
RESULTS REPORT ON THE VITAMIN C PILOT PROGRAM 41
others. Secondary data on diet may be available from national or regional surveys,from Title II program evaluations, or other sources. The committee’s objective is toobtain data useful for determining whether the populations already targeted toreceive Title II commodities are in need and have benefited from the CSB and WSBprovided.)
The following resources provided the information reported above:Billinge Hospital, EnglandCenters for Disease Control, U.S.Emory University, U.S.London School of Hygiene and Tropical Medicine, EnglandMedecins Sans Frontières, France and HollandOffice of the United Nations High Commissioner for Refugees, Refugee Health Unit,
Somalia and Commission on Refugees, SudanOXFAM, UKOxford University, EnglandProgram Against Micronutrient Malnutrition, U.S.Save the Children Fund, UKUNICEFUnited Nations Administrative Committee on Coordination - Subcommittee on Nutrition,
U.S.World Food Program, ItalyWorld Health Organization, Croatia and Switzerland
2. CIN: Estimates of the cost of promising alternatives as the following:
2.1 CIN: Improved packaging, handling, and storage of the blended commodities.
2.1.1 CIN: Packaging methods to reduce moisture uptake include increasing thethickness of the polyethylene liners of the bags or inclusion of a desiccant in theplastic. Studies of vitamin C degradation in low-moisture foods suggest that watercontent greater than 10% results in a marked increase in the rate of loss of vitaminC (Bookwalter et al., 1980).
Alternative Packaging
The Commodity Credit Corporation (CCC) is reported to have begun preliminary evaluationsof alternative packaging systems for blended and fortified commodities used under foreignfood assistance programs administered by CCC and USAID. This includes bags used forWSB and CSB. The primary objective of the evaluation is to find a bag with greater strength.It is not to find packaging that provides greater stability of micronutrients or to improve the
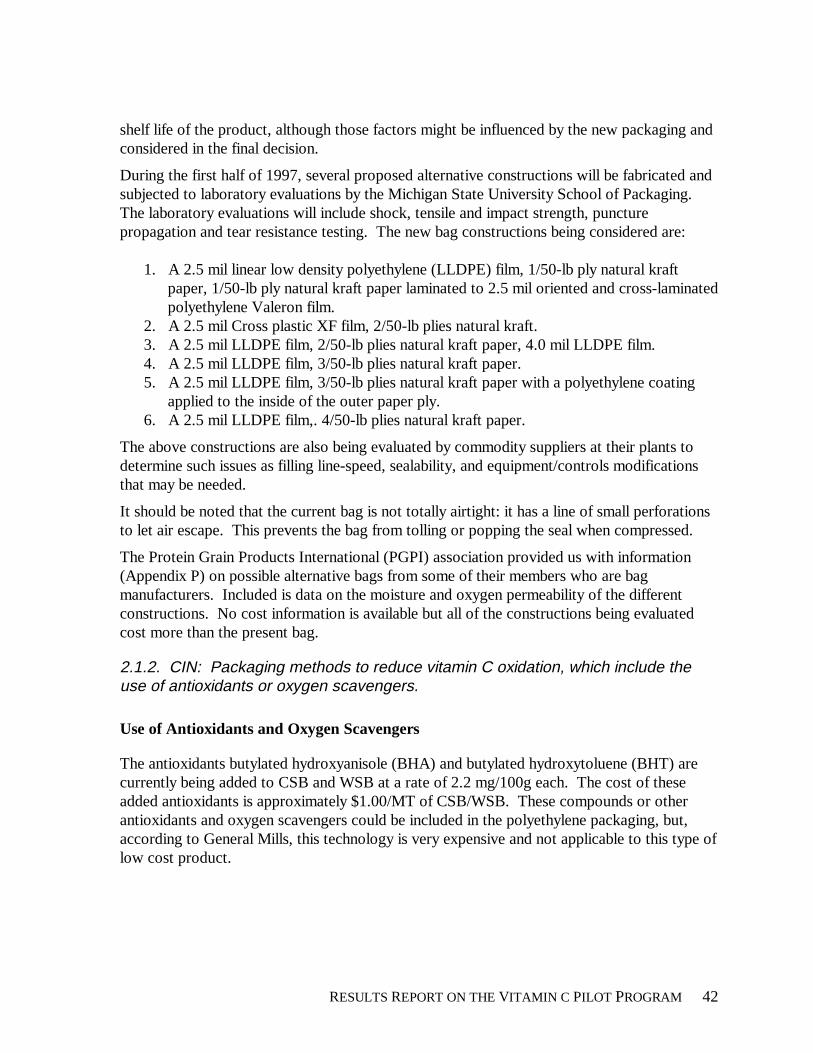
RESULTS REPORT ON THE VITAMIN C PILOT PROGRAM 42
shelf life of the product, although those factors might be influenced by the new packaging andconsidered in the final decision.
During the first half of 1997, several proposed alternative constructions will be fabricated andsubjected to laboratory evaluations by the Michigan State University School of Packaging.The laboratory evaluations will include shock, tensile and impact strength, puncturepropagation and tear resistance testing. The new bag constructions being considered are:
1. A 2.5 mil linear low density polyethylene (LLDPE) film, 1/50-lb ply natural kraftpaper, 1/50-lb ply natural kraft paper laminated to 2.5 mil oriented and cross-laminatedpolyethylene Valeron film.
2. A 2.5 mil Cross plastic XF film, 2/50-lb plies natural kraft.3. A 2.5 mil LLDPE film, 2/50-lb plies natural kraft paper, 4.0 mil LLDPE film.4. A 2.5 mil LLDPE film, 3/50-lb plies natural kraft paper.5. A 2.5 mil LLDPE film, 3/50-lb plies natural kraft paper with a polyethylene coating
applied to the inside of the outer paper ply.6. A 2.5 mil LLDPE film,. 4/50-lb plies natural kraft paper.
The above constructions are also being evaluated by commodity suppliers at their plants todetermine such issues as filling line-speed, sealability, and equipment/controls modificationsthat may be needed.
It should be noted that the current bag is not totally airtight: it has a line of small perforationsto let air escape. This prevents the bag from tolling or popping the seal when compressed.
The Protein Grain Products International (PGPI) association provided us with information(Appendix P) on possible alternative bags from some of their members who are bagmanufacturers. Included is data on the moisture and oxygen permeability of the differentconstructions. No cost information is available but all of the constructions being evaluatedcost more than the present bag.
2.1.2. CIN: Packaging methods to reduce vitamin C oxidation, which include theuse of antioxidants or oxygen scavengers.
Use of Antioxidants and Oxygen Scavengers
The antioxidants butylated hydroxyanisole (BHA) and butylated hydroxytoluene (BHT) arecurrently being added to CSB and WSB at a rate of 2.2 mg/100g each. The cost of theseadded antioxidants is approximately $1.00/MT of CSB/WSB. These compounds or otherantioxidants and oxygen scavengers could be included in the polyethylene packaging, but,according to General Mills, this technology is very expensive and not applicable to this type oflow cost product.
RESULTS REPORT ON THE VITAMIN C PILOT PROGRAM 43
2.2. CIN: Cost estimates of increasing the level of vitamin C in only one of theblended commodities, especially the cost associated with the special handling thatwould be needed to target the highly fortified commodity to high-risk sites.
Cost to Increase the Current Vitamin C Level in One Commodity Only
The additional costs of adding 50 mg/100g more vitamin C to CSB and WSB to bring thecurrent level of 40 mg/100g up to the higher level of 90 mg/100g, based on FY 1996 (August1995 to September 1996) call forward figures, are shown in Table 11.
As discussed in the analysis of vitamin C cost section, the $6.33/MT increase in the cost ofcommodity figure used in these calculations is based on the current price of vitamin C, whichwill vary and is currently at an all time low compared to what it has run in the past.
The USDA stated in a letter (Appendix O) that special handling of P.L.480, such as airfreighting them to recipient locations, is currently not permitted. This would not appear to bea viable solution to any vitamin activity lost on shipment because the cost, based on normalcommercial charges for shipping bulk quantities, would easily exceed $250/MT.
Table 11. Additional Costs of Adding 50 mg/100g more Vitamin C to CSB/WSB
Units CSB WSB Total
Quantity purchased MT 238,300 11,310 249,610
Total cost $ $79,768,542 $5,184,617 $84,953,159
Average cost $/MT $334.74 $458.41
Extra Vitamin C cost $/MT $6.33 $6.33
Total cost $ $1,508,439 $71,592 $1,580,031
2.3 CIN: Changing the vitamin premix or the mineral mix:
2.3.1 CIN: The use of other forms of stabilized coated vitamin C as an alternative toethyl-cellulose coating. The 4% ethyl-cellulose water soluble coating, which is usedto stabilize the vitamin C because ethyl cellulose coating is likely to be susceptible tomoisture uptake.
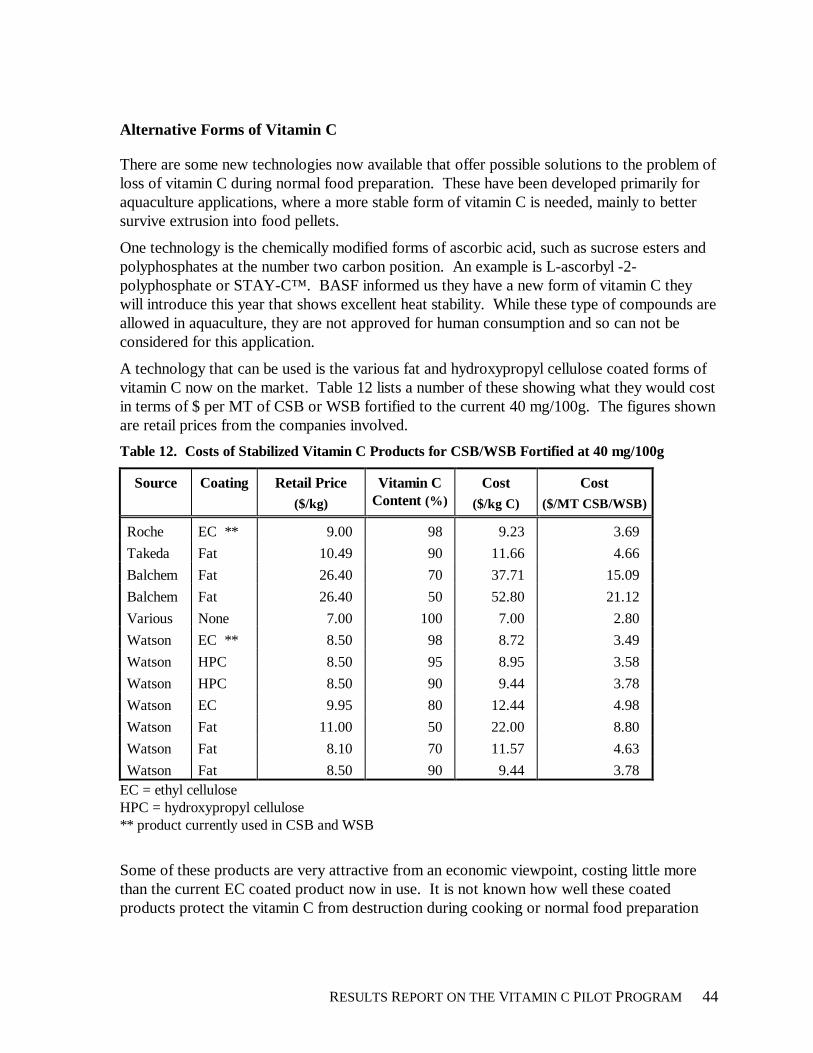
RESULTS REPORT ON THE VITAMIN C PILOT PROGRAM 44
Alternative Forms of Vitamin C
There are some new technologies now available that offer possible solutions to the problem ofloss of vitamin C during normal food preparation. These have been developed primarily foraquaculture applications, where a more stable form of vitamin C is needed, mainly to bettersurvive extrusion into food pellets.
One technology is the chemically modified forms of ascorbic acid, such as sucrose esters andpolyphosphates at the number two carbon position. An example is L-ascorbyl -2-polyphosphate or STAY-C™. BASF informed us they have a new form of vitamin C theywill introduce this year that shows excellent heat stability. While these type of compounds areallowed in aquaculture, they are not approved for human consumption and so can not beconsidered for this application.
A technology that can be used is the various fat and hydroxypropyl cellulose coated forms ofvitamin C now on the market. Table 12 lists a number of these showing what they would costin terms of $ per MT of CSB or WSB fortified to the current 40 mg/100g. The figures shownare retail prices from the companies involved.
Table 12. Costs of Stabilized Vitamin C Products for CSB/WSB Fortified at 40 mg/100g
Source Coating Retail Price($/kg)
Vitamin CContent (%)
Cost($/kg C)
Cost($/MT CSB/WSB)
Roche EC ** 9.00 98 9.23 3.69
Takeda Fat 10.49 90 11.66 4.66
Balchem Fat 26.40 70 37.71 15.09
Balchem Fat 26.40 50 52.80 21.12
Various None 7.00 100 7.00 2.80
Watson EC ** 8.50 98 8.72 3.49
Watson HPC 8.50 95 8.95 3.58
Watson HPC 8.50 90 9.44 3.78
Watson EC 9.95 80 12.44 4.98
Watson Fat 11.00 50 22.00 8.80
Watson Fat 8.10 70 11.57 4.63
Watson Fat 8.50 90 9.44 3.78EC = ethyl celluloseHPC = hydroxypropyl cellulose** product currently used in CSB and WSB
Some of these products are very attractive from an economic viewpoint, costing little morethan the current EC coated product now in use. It is not known how well these coatedproducts protect the vitamin C from destruction during cooking or normal food preparation
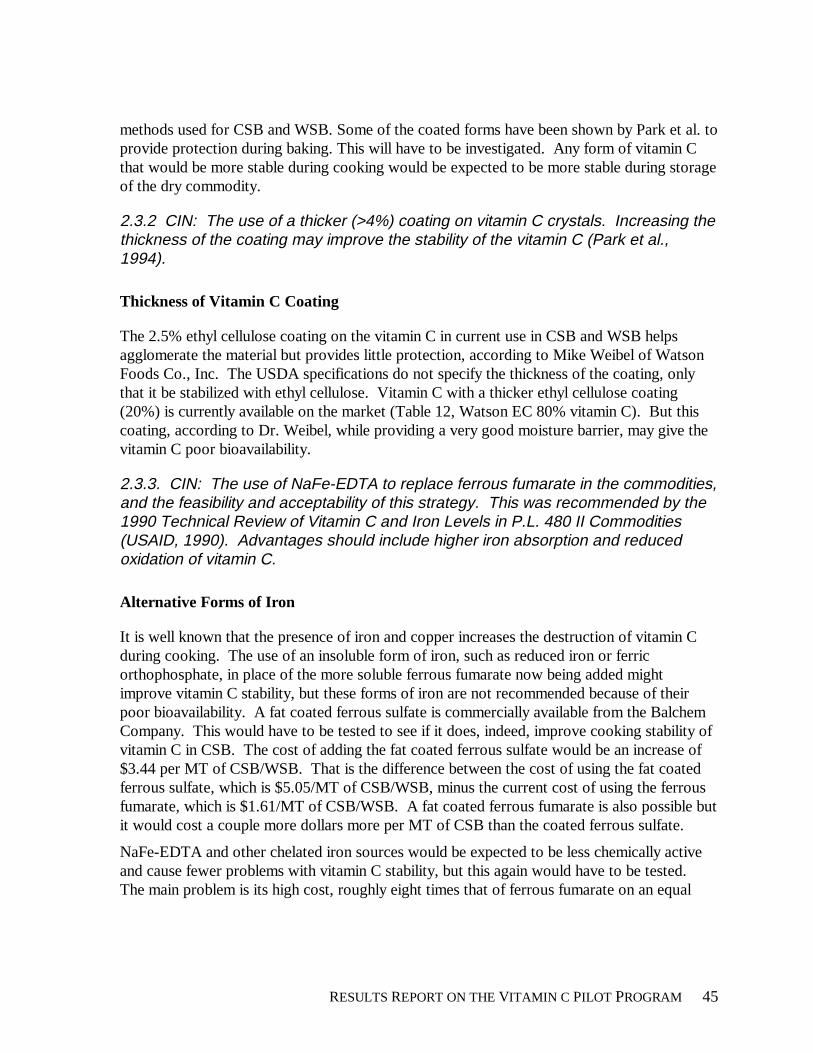
RESULTS REPORT ON THE VITAMIN C PILOT PROGRAM 45
methods used for CSB and WSB. Some of the coated forms have been shown by Park et al. toprovide protection during baking. This will have to be investigated. Any form of vitamin Cthat would be more stable during cooking would be expected to be more stable during storageof the dry commodity.
2.3.2 CIN: The use of a thicker (>4%) coating on vitamin C crystals. Increasing thethickness of the coating may improve the stability of the vitamin C (Park et al.,1994).
Thickness of Vitamin C Coating
The 2.5% ethyl cellulose coating on the vitamin C in current use in CSB and WSB helpsagglomerate the material but provides little protection, according to Mike Weibel of WatsonFoods Co., Inc. The USDA specifications do not specify the thickness of the coating, onlythat it be stabilized with ethyl cellulose. Vitamin C with a thicker ethyl cellulose coating(20%) is currently available on the market (Table 12, Watson EC 80% vitamin C). But thiscoating, according to Dr. Weibel, while providing a very good moisture barrier, may give thevitamin C poor bioavailability.
2.3.3. CIN: The use of NaFe-EDTA to replace ferrous fumarate in the commodities,and the feasibility and acceptability of this strategy. This was recommended by the1990 Technical Review of Vitamin C and Iron Levels in P.L. 480 II Commodities(USAID, 1990). Advantages should include higher iron absorption and reducedoxidation of vitamin C.
Alternative Forms of Iron
It is well known that the presence of iron and copper increases the destruction of vitamin Cduring cooking. The use of an insoluble form of iron, such as reduced iron or ferricorthophosphate, in place of the more soluble ferrous fumarate now being added mightimprove vitamin C stability, but these forms of iron are not recommended because of theirpoor bioavailability. A fat coated ferrous sulfate is commercially available from the BalchemCompany. This would have to be tested to see if it does, indeed, improve cooking stability ofvitamin C in CSB. The cost of adding the fat coated ferrous sulfate would be an increase of$3.44 per MT of CSB/WSB. That is the difference between the cost of using the fat coatedferrous sulfate, which is $5.05/MT of CSB/WSB, minus the current cost of using the ferrousfumarate, which is $1.61/MT of CSB/WSB. A fat coated ferrous fumarate is also possible butit would cost a couple more dollars more per MT of CSB than the coated ferrous sulfate.
NaFe-EDTA and other chelated iron sources would be expected to be less chemically activeand cause fewer problems with vitamin C stability, but this again would have to be tested.The main problem is its high cost, roughly eight times that of ferrous fumarate on an equal
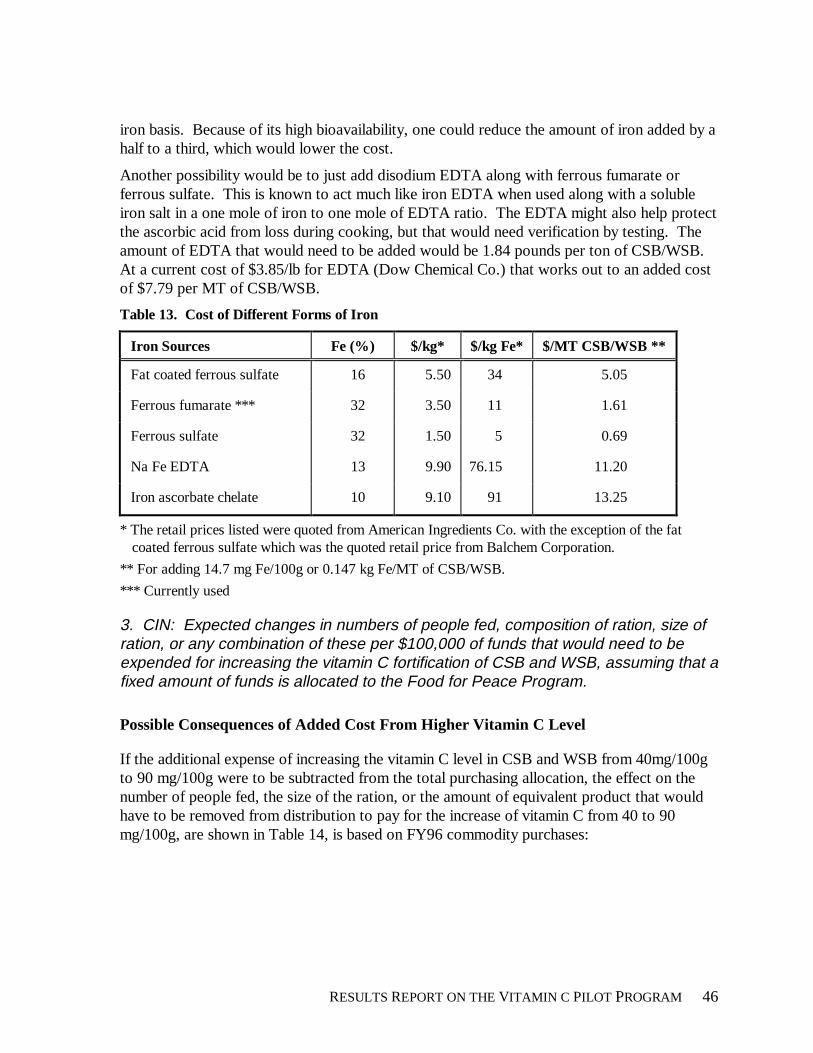
RESULTS REPORT ON THE VITAMIN C PILOT PROGRAM 46
iron basis. Because of its high bioavailability, one could reduce the amount of iron added by ahalf to a third, which would lower the cost.
Another possibility would be to just add disodium EDTA along with ferrous fumarate orferrous sulfate. This is known to act much like iron EDTA when used along with a solubleiron salt in a one mole of iron to one mole of EDTA ratio. The EDTA might also help protectthe ascorbic acid from loss during cooking, but that would need verification by testing. Theamount of EDTA that would need to be added would be 1.84 pounds per ton of CSB/WSB.At a current cost of $3.85/lb for EDTA (Dow Chemical Co.) that works out to an added costof $7.79 per MT of CSB/WSB.
Table 13. Cost of Different Forms of Iron
Iron Sources Fe (%) $/kg* $/kg Fe* $/MT CSB/WSB **
Fat coated ferrous sulfate 16 5.50 34 5.05
Ferrous fumarate *** 32 3.50 11 1.61
Ferrous sulfate 32 1.50 5 0.69
Na Fe EDTA 13 9.90 76.15 11.20
Iron ascorbate chelate 10 9.10 91 13.25
* The retail prices listed were quoted from American Ingredients Co. with the exception of the fatcoated ferrous sulfate which was the quoted retail price from Balchem Corporation.
** For adding 14.7 mg Fe/100g or 0.147 kg Fe/MT of CSB/WSB.
*** Currently used
3. CIN: Expected changes in numbers of people fed, composition of ration, size ofration, or any combination of these per $100,000 of funds that would need to beexpended for increasing the vitamin C fortification of CSB and WSB, assuming that afixed amount of funds is allocated to the Food for Peace Program.
Possible Consequences of Added Cost From Higher Vitamin C Level
If the additional expense of increasing the vitamin C level in CSB and WSB from 40mg/100gto 90 mg/100g were to be subtracted from the total purchasing allocation, the effect on thenumber of people fed, the size of the ration, or the amount of equivalent product that wouldhave to be removed from distribution to pay for the increase of vitamin C from 40 to 90mg/100g, are shown in Table 14, is based on FY96 commodity purchases:
RESULTS REPORT ON THE VITAMIN C PILOT PROGRAM 47
Table 14. Possible Consequences of Added Cost from Higher Vitamin C Level
Units CSB WSB Total
Quantity purchased MT 238,300 11,310 249,610
Total cost $ $79,768,542 $5,184,617 $84,953,15
9
Average cost $/MT $334.74 $458.41
Average cost $/bag $18.41 425.21
Extra Vitamin C cost $/MT $6.33 $6.33
Total cost $ $1,508,439 $71,592 $1,580,031
Equivalent product* MT 4,506 156 4,662
Equivalent product* bags 180,252 6,247 186,499
Fewer people that would be fed
per year at 30g/person/day
people/day 411,534 14,263 425,797
Reduction in size of ration needed
to pay for increase in vitamin C
to 90 mg/100g
grams -0.57 -0.41 -0.56
* This is the amount of product, in MT or in bags, that could not be distributed if the cost of theincrease vitamin C (from 40 to 90 mg) was subtracted from the total amount of funds availableduring FY 96 to produce these commodities.
As discussed in the main report (Analysis of Vitamin C Cost), the vitamin C cost of $6.33/MTof commodity is based on the current price of vitamin C (May 1997), which, like allcommodities, fluctuates according to market supply and demand. This cost includes the costrequired to raise the vitamin C level from 40 to 90 mg/100g, including the cost of raw vitaminC, which is currently low.
4. CIN: Clear identification of the stakeholders’ rationale for promoting theincreased content of vitamin C in CSB and WSB. This would inform the committeeof specific aspects of effectiveness that Congress has been advised to expect fromthe increased level of fortification.
We are limited in our ability to comment on the request for information on the stakeholders'rationale because we have not been contacted by members of Congress, nor have we beenencouraged to be in contact with members of Congress. We have also not been contacted byany interested parties who may have encouraged Congress to pursue action in this area. The
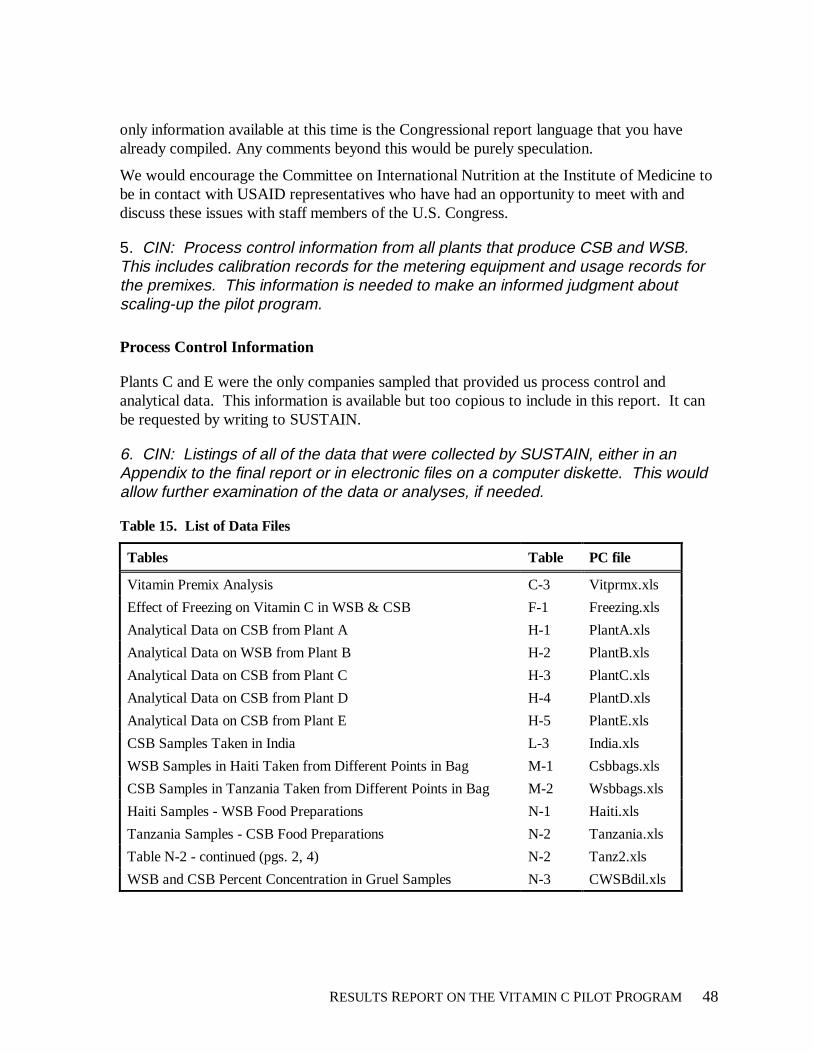
RESULTS REPORT ON THE VITAMIN C PILOT PROGRAM 48
only information available at this time is the Congressional report language that you havealready compiled. Any comments beyond this would be purely speculation.
We would encourage the Committee on International Nutrition at the Institute of Medicine tobe in contact with USAID representatives who have had an opportunity to meet with anddiscuss these issues with staff members of the U.S. Congress.
5. CIN: Process control information from all plants that produce CSB and WSB.This includes calibration records for the metering equipment and usage records forthe premixes. This information is needed to make an informed judgment aboutscaling-up the pilot program.
Process Control Information
Plants C and E were the only companies sampled that provided us process control andanalytical data. This information is available but too copious to include in this report. It canbe requested by writing to SUSTAIN.
6. CIN: Listings of all of the data that were collected by SUSTAIN, either in anAppendix to the final report or in electronic files on a computer diskette. This wouldallow further examination of the data or analyses, if needed.
Table 15. List of Data Files
Tables Table PC file
Vitamin Premix Analysis C-3 Vitprmx.xls
Effect of Freezing on Vitamin C in WSB & CSB F-1 Freezing.xls
Analytical Data on CSB from Plant A H-1 PlantA.xls
Analytical Data on WSB from Plant B H-2 PlantB.xls
Analytical Data on CSB from Plant C H-3 PlantC.xls
Analytical Data on CSB from Plant D H-4 PlantD.xls
Analytical Data on CSB from Plant E H-5 PlantE.xls
CSB Samples Taken in India L-3 India.xls
WSB Samples in Haiti Taken from Different Points in Bag M-1 Csbbags.xls
CSB Samples in Tanzania Taken from Different Points in Bag M-2 Wsbbags.xls
Haiti Samples - WSB Food Preparations N-1 Haiti.xls
Tanzania Samples - CSB Food Preparations N-2 Tanzania.xls
Table N-2 - continued (pgs. 2, 4) N-2 Tanz2.xls
WSB and CSB Percent Concentration in Gruel Samples N-3 CWSBdil.xls
RESULTS REPORT ON THE VITAMIN C PILOT PROGRAM 49
REFERENCES
ACC/SCN. 1996. Update on the nutrition situation of refugees and displaced people. UnitedNations Administrative Committee on Coordination, Sub-Committee on Nutrition(ACC/SCN), Refugee Nutrition Information System Update No. 2, November 11, pp.3, 4.
Briend A. 1994. Supplementary feeding programmes. ACC/SCN Workshop on theImprovement of the Nutrition of Refugees and Displaced People in Africa, Machakos,Kenya, Background document # 3B p.4.
Centers for Disease Control (CDC). 1989. Nutritional status of Somali refugees - EasternEthiopia, September 1988–May 1989. Morbidity and Mortality Weekly Report 38(26):455–456, 461–463.
Centers for Disease Control (CDC). 1992. Famine-affected, refugee, and displacedpopulations: recommendations for public health issues. Morbidity and MortalityWeekly Report 41(RR–13): 14–16.
Desenclos J.C. 1987. Relief food and vitamin C deficiency (Vitamin C letter). The LancetAug. 22: 462–463.
Desenclos J.C., Berry A.M., Padt R., Farah B., Segala C., and Nabil A.M. 1989.Epidemiological patterns of scurvy among Ethiopian refugees. Bulletin of the WorldHealth Organization 67(3): 309–316.
Greenham R. 1989. Scurvy and anaemia in Refugees (letter). The Lancet July, 15 (8655):170.
Harrell-Bond B.E., Henry C.J.K., and Wilson K. 1989. Fortification of foods for refugees(letter). The Lancet 1(8651): 1392.
Henry C.J.K. and Seaman J. 1992. The micronutrient fortification of refugee rations toprevent nutritional deficiencies in refugee diets. Journal of Refugee Studies 5(3/4): 359.
Magan A.M., Warsame M., Ali-Salad A. and Toole M.J. 1983. An outbreak of scurvy inSomali refugee camps. Disasters 7(2): 94–97
Mason J., Wallace J., Katona-Apte J., and Alnwick D. 1996. Nutrition and food aid,Methodologies. In: World Disasters Report. International Federation of Red Cross andRed Crescent Societies, Oxford University Press, Oxford, UK, pp. 35–41.
Moren A. 1994. Health and nutrition information systems among refugees and displacedpersons. ACC/SCN Workshop on the Improvement of the Nutrition of Refugees andDisplaced People in Africa, Machakos, Kenya, Background document # 5.
RESULTS REPORT ON THE VITAMIN C PILOT PROGRAM 50
Nieburg P., Person-Karell B., and Toole, M.J. 1992. Malnutrition-mortality relationshipsamong refugees. Journal of Refugee Studies 5(3/4): 253.
RHU (Refugee Health Unit), NW of the Somali Ministry of Health, Medecins sans Frontieres,and League of Red Cross and Red Crescent Societies 1985. Scurvy Survey Report,Gannet B refugee camp/NW Somalia. Hargeysa, Somalia.
Seaman J. and Rivers J.P.W. 1989. Scurvy and anaemia in refugees (letter). The LancetMay 27: 1204.
Toole M.J., Nieburg P., Waldman R.J., and Person-Karell B. 1989. Adequacy of refugeerelief rations (letter). The Lancet 2(8657): 268.
Toole M.J. 1992. Micronutrient deficiencies in refugees. The Lancet 339: 1214–1216
Toole M.J. 1994. Preventing micronutrient deficiency diseases. ACC/SCN Workshop on theImprovement of the Nutrition of Refugees and Displaced People in Africa, Machakos,Kenya, Background document #2 pp.1–4, 10–13, 20.
UNHCR. 1989. Options to alleviate nutritional deficiency diseases in refugees. DiscussionPaper. UNHCR Technical Support Service.
Van Nieuwenhuyse C. 1997. Personal communication. World Food Program, Rome, Italy.
Waler G. 1991. Provisional Guidelines for calculating food rations for refugees (letter).Office of the United Nations High Commissioner for refugees, Geneva, Switzerland.(UNHCR/IOM/66/91)
WHO. 1989. Scurvy and food aid among refugees in the Horn of Africa. WeeklyEpidemiological Record 64(12): 85–87.
WHO. 1993. Guidelines on micronutrient supplementation. Guidelines. World HealthOrganization, Regional Office for Europe, Zagreb Area office, Zagreb, Croatia, pp.2–3,8, 13.
Yip R. 1994. Iron deficiency: contemporary scientific issues and international programmaticapproaches. Journal of Nutrition 124: 1479S–1490S.
Appendix A
Composition and Specilication of Wheat Soy Blend (WSB) and Corn Soy Blend (CSB)
RESULTS REPORT ON THE VITAMIN C PILOT PROGRAM 5 1
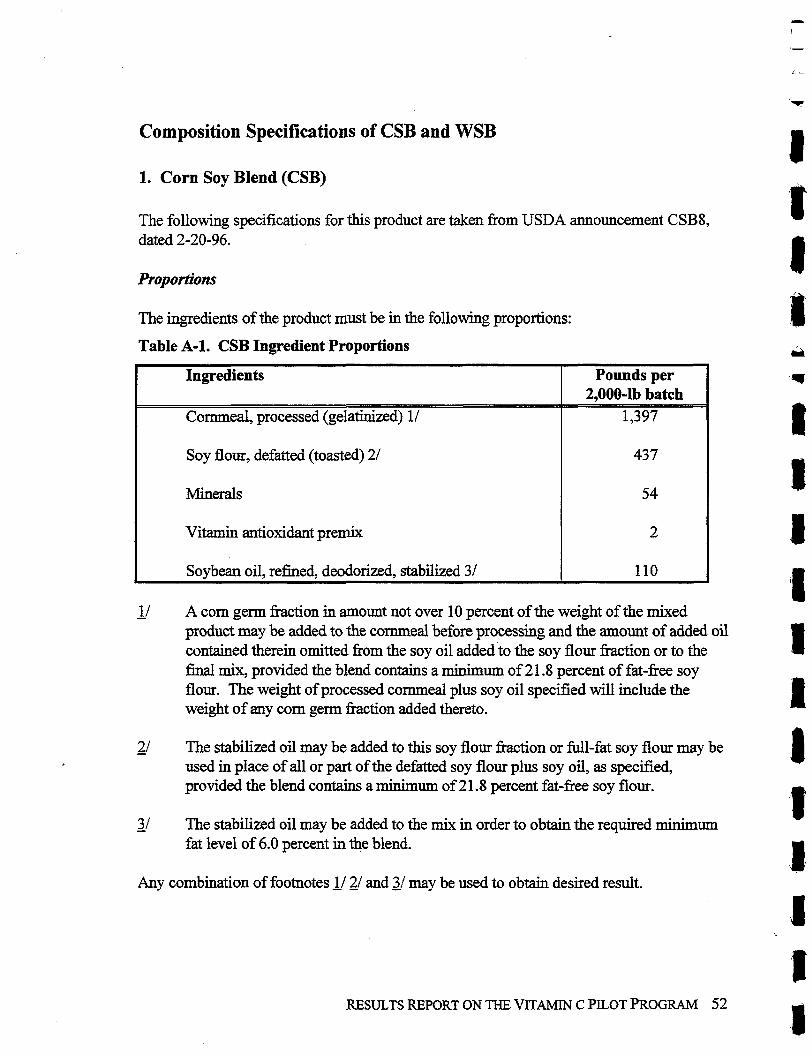
Composition Specifications of CSB and WSB
1. Corn Soy Blend (CSB)
The following specifications for this product are taken fiom USDA announcement CSB8, dated 2-20-96.
Proportions
The ingredients of the product must be in the following proportions:
Table A-1. CSB Ingredient Proportions
11 A corn germ fraction in amount not over 10 percent of the weight of the mixed - product may be added to the cornmeal before processing and the amount of added oil contained therein omitted fiom the soy oil added to the soy flour fraction or to the final mix, provided the blend contains a rnjnimum of 21.8 percent of fat-free soy flour. The weight of processed cornmeal plus soy oil specified will include the weight of any corn germ hction added thereto.
Ingredients Pounds per 2,000-lb batch
21 The stabilized oil may be added to this soy flour hction or full-fat soy flour may be - used in place of all or part of the defatted soy flour plus soy oil, as specified, provided the blend contains a minimum of 21.8 percent fat-free soy flour.
Cornmeal, processed (gelatinized) 11
Soy flour, defatted (toasted) 21
Minerals
Vitamin antioxidant premix
Soybean oil, refined, deodorized, stabilized 3/
31 The stabilized oil may be added to the mix in order to obtain the required minimum - fat level of 6.0 percent in the blend.
1,397
437
54
2
110
Any combination of footnotes 2/ and 31 may be used to obtain desired result.
RESULTS REPORT ON THE VITAMIN C PILOT PROGRAM 52
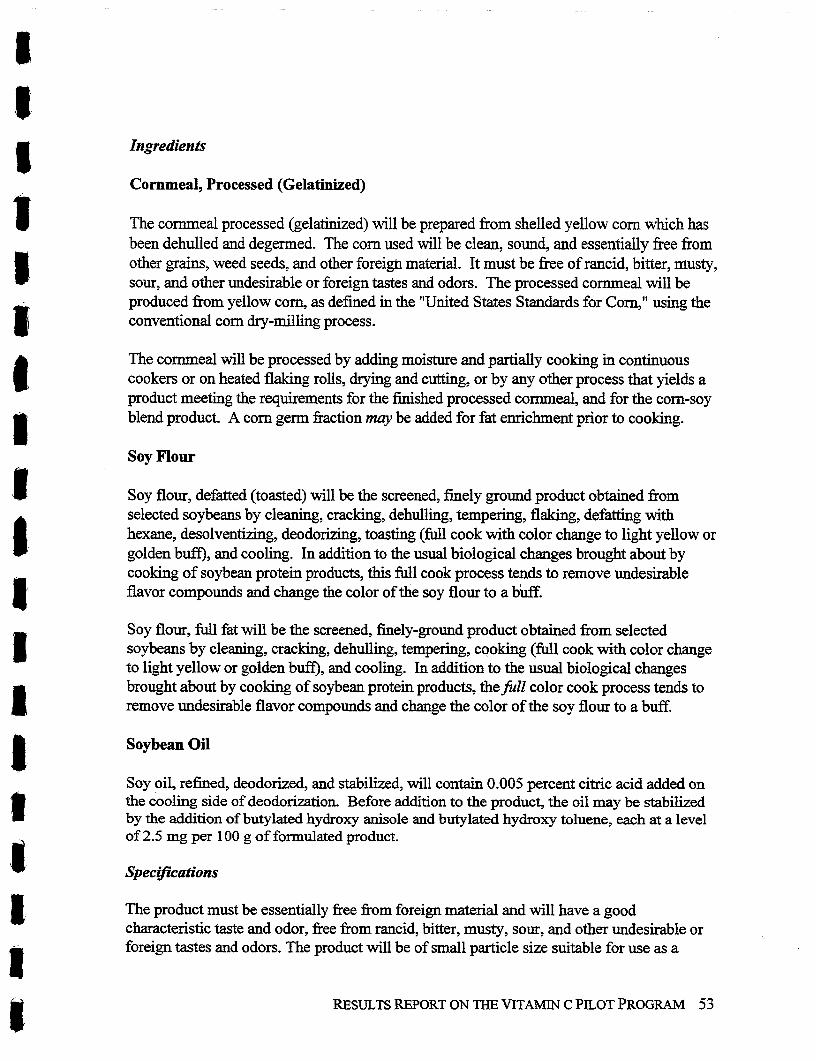
Ingredients
Cornmeal, Processed (Gelatinized)
The cornmeal processed (gelatinized) will be prepared fiom shelled yellow corn which has been dehulled and degenned. The corn used will be clean, sound, and essentially fiee from other grains, weed seeds, and other foreign material. It must be free of rancid, bitter, musty, sour, and other undesirable or foreign tastes and odors. The processed cornmeal will be produced fiom yellow corn, as defined in the "United States Standards for Corn," using the conventional corn dry-milling process.
The cornmeal will be processed by adding moisture and partially cooking in continuous cookers or on heated flaking rolls, drying and cutting, or by any other process that yields a product meeting the requirements for the finished processed cornmeal, and for the corn-soy blend product. A corn germ hction may be added for fat enrichment prior to cooking.
Soy Flour
Soy flour, defatted (toasted) will be the screened, finely ground product obtained from selected soybeans by cleaning, cracking, dehulling, tempering, flaking, defatting with hexane, desolventizing, deodorizing, toasting (full cook with color change to light yellow or golden buff), and cooling. In addition to the usual biological changes brought about by cooking of soybean protein products, this full cook process tends to remove undesirable flavor compounds and change the color of the soy flour to a b s .
Soy flour, full fat will be the screened, finely-ground product obtained fiom selected soybeans by cleaning, cracking, dehulling, tempering, cooking (full cook with color change to light yellow or golden bufl), and cooling. In addition to the usual biological changes brought about by cooking of soybean protein products, thefill color cook process tends to remove undesirable flavor compounds and change the color of the soy flour to a buff.
Soybean Oil
Soy oil, refined, deodorized, and stabilized, will contain 0.005 percent citric acid added on the cooling side of deodorization. Before addition to the product, the oil may be stabilized by the addition of butylated hydroxy anisole and butylated hydroxy toluene, each at a level of 2.5 mg per 100 g of formulated product.
The product must be essentially fiee fiom foreign material and will have a good characteristic taste and odor, fiee from rancid, bitter, musty, sour, and other undesirable or foreign tastes and odors. The product will be of small particle size suitable for use as a
RESULTS REPORT ON THE VITAMIN C PILOT PROGRAM 53
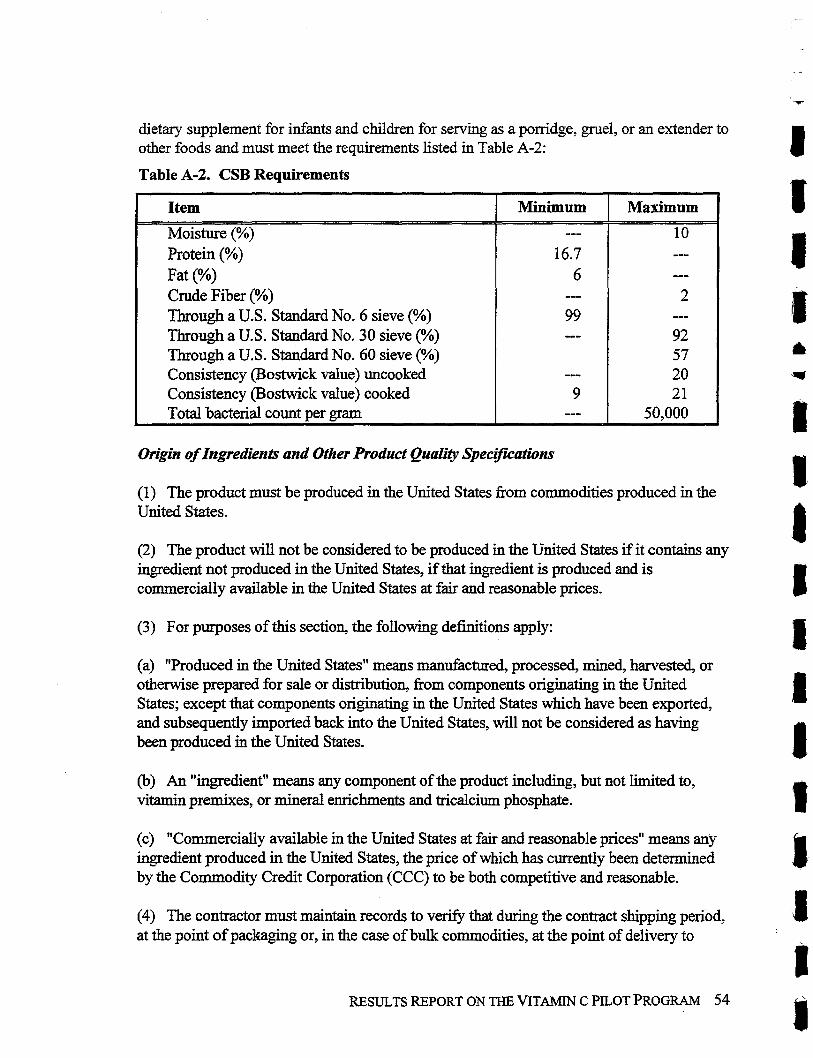
dietary supplement for infants and children for serving as a pomdge, gruel, or an extender to other foods and must meet the requirements listed in Table A-2:
Table A-2. CSB Requirements
Origin of Ingrediennt and Other Product Quality SpeczfZu:afions
(1) The product must be produced in the United States fiom commodities produced in the United States.
Maximum
10 --- --- 2
--- 92 57 20 21
50,000
Item
Moisture (%) Protein (%) Fat (%) Crude Fiber (%) Through a U.S. Standard No. 6 sieve (%) Through a U. S. Standard No. 30 sieve (%) Through a U.S. Standard No. 60 sieve (Oh) Consistency (Bostwick value) uncooked Consistency (Bostwick value) cooked Total bacterial count per gram
(2) The product will not be considered to be produced in the United States if it contains any ingredient not produced in the United States, if that ingredient is produced and is commercially available in the United States at fair and reasonable prices.
Minimum ---
16.7 6
--- 99 ---
--- 9
---
(3) For purposes of this section, the following definitions apply:
(a) "Produced in the United States" means manufactured, processed, mined, harvested, or otherwise prepared for sale or distribution, from components originating in the United States; except that components originating in the United States which have been exported, and subsequently imported back into the United States, will not be considered as having been produced in the United States.
(b) An "ingredient" means any component of the product including, but not limited to, vitamin premixes, or mineral enrichments and tricalcium phosphate.
(c) "Commercially available in the United States at fair and reasonable prices" means ariy ingredient produced in the United States, the price of which has currently been determined by the Commodity Credit Corporation (CCC) to be both competitive and reasonable.
(4) The contractor must maintain records to verify that during the contract shipping period, at the point of packaging or, in the case of bulk commodities, at the point of delivery to
RESULTS REPORT ON THE VITAMIN C PILOT PROGRAM 54
CCC, the product was in compliance with the domestic origin requirements of this section of the Announcement.
(5) Representatives of the KCCO, Warehouse Examination Division, will fiom time to time conduct domestic origin compliance reviews on behalf of CCC to determine if the records maintained by the contractor are sufficient to indicate compliance with the contract requirement that the product delivered to CCC was produced and manufactured in the U.S. fiom materials produced and manufactured in the U.S. CCC's examiners will review procurement, production, inventory, delivery, and any other pertinent records. The results of these examinations are submitted to the contracting officer for review.
(6) The product must conform in every respect to the provisions of the Federal Food, Drug, and Cosmetic Act, as amended, and the regulations promulgated thereunder, including any Defect Action Level guidelines issued by the Food and Drug Administration (FDA) which may be applicable to this product. Any shipments with counts in excess of the FDA Defect Action Level guidelines will be rejected to the contractor's account in accordance with Article 60 of USDA- 1.
(7) In regard to aflatoxin in corn-based products, a test for aflatoxin will be conducted by the Field Management Division, Federal Grain Inspection Service (FGIS), USDA. If the aflatoxin test proves positive, then a quantitative test will be made to establish the exact level of aflatoxin. If the quantitative test shows that the aflatoxin level exceeds FDA guidelines (more than 20 ppb), the product will be rejected. The fees for such tests are to be paid by the contractor.
RESULTS REPORT ON THE VITAMIN C PILOT PROGRAM 55
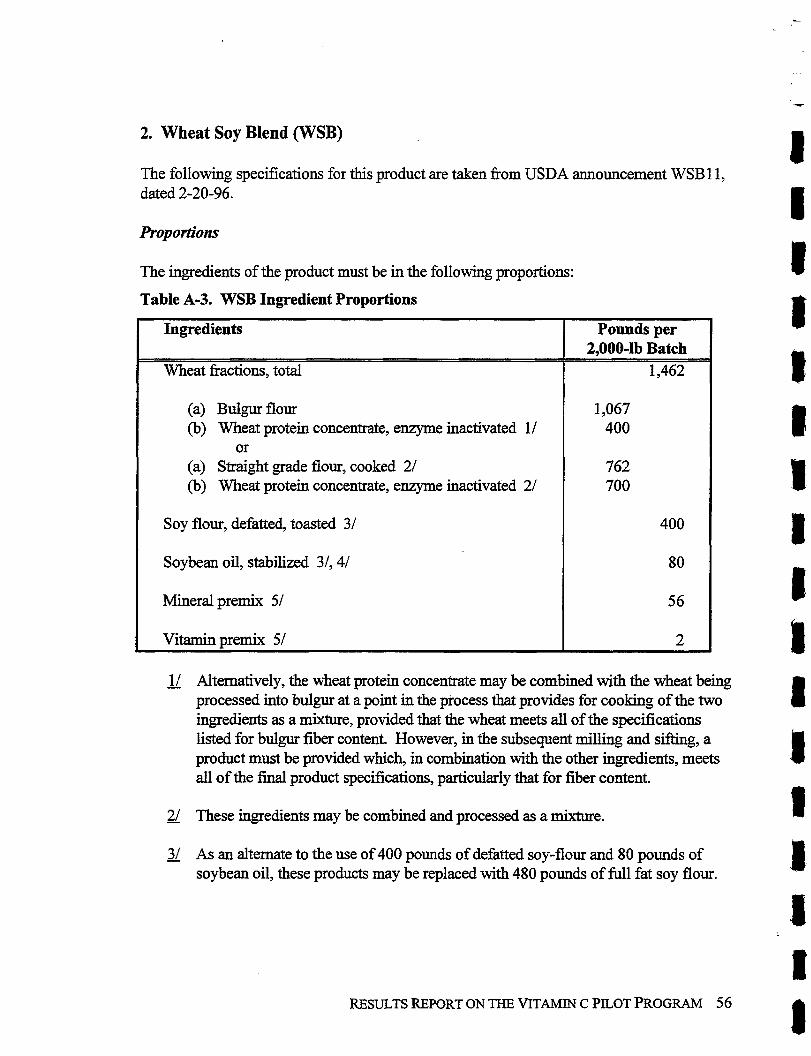
2. Wheat Soy Blend (WSB)
The following specifications for this product are taken fiom USDA announcement WSB I 1, dated 2-20-96.
Proportions
The ingredients of the product must be in the following proportions:
Table A-3. WSB Ingredient Proportions
11 Alternatively, the wheat protein concentrate may be combined with the wheat being - processed into bulgur at a point in the process that provides for cooking of the two ingredients as a mixture, provided that the wheat meets all of the specifications listed for bulgur fiber content. However, in the subsequent milling and sifting, a product must be provided which, in combination with the other ingredients, meets all of the final product specifications, particularly that for fiber content.
Ingredients
Wheat fi-actions, total
(a) Bdgur flour (b) Wheat protein concentrate, enzyme inactivated 11
or (a) Straight grade flour, cooked 21 (b) Wheat protein concentrate, enzyme inactivated 21
Soy flour, defatted, toasted 31
Soybean oil, stabilized 3/,4/
Mineral premix 51
Vitamin premix 51
21 These ingredients may be combined and processed as a mixture. -
Pounds per 2,000-lb Batch
1,462
1,067 400
762 700
400
80
5 6
2
31 As an alternate to the use of 400 pounds of defatted soy-flour and 80 pounds of - soybean oil, these products may be replaced with 480 pounds of full fat soy flour.
41 If additional soybean oil is required to attain the minimum fat content specified for - the final blend, the additional oil can replace an equal amount of bulgur or straight grade flour.
5 / The mineral and vitamin premixes can not be combined and must be added to the - fornulation separately.
Ingredients
Bulgur Flour
Bulgur flour is made by washing, scouring, and soaking wheat in water, cooking it in water or steam at atmospheric or higher pressures, then drying and partially debraning it. The cooked product is gelatinized but not dextrinized and has a translucent appearance. The partially debraned cooked and dried wheat is cracked and further reduced in whole or in part to a flour-like fineness by grinding.
Wheat Protein Concentrate, Enzyme Inactivated
Wheat protein concentrate is obtained fiom the total millrun middlings derived from normal flour milling operations. The wheat protein concentrate is prepared by regrinding and sifting, he-grinding and air classification, or other similar means of obtaining the desired &tion fiom the starting materials. Either the starting materials or the final product after grinding and sieving is heated in moist conditions so as to inactivate enzymes and to reduce any raw or bitter flavors, without significantly damaging the nutritive properties of the product as would accompany any toasting sufficient to cause color darkening. If desired, the protein concentrate may be heat processed in admixture with straight grade flour or wheat in the bulgur process.
The other ingredients in WSB are the same as described for CSB.
RESULTS REPORT ON THE VITAMIN C PILOT PROGRAM 5 7
Appendix B
Advisory Panel, Statistical Subgroup, and Other People Consulted
RESULTS REPORT ON THE VITAMIN C PILOT PROGRAM 59
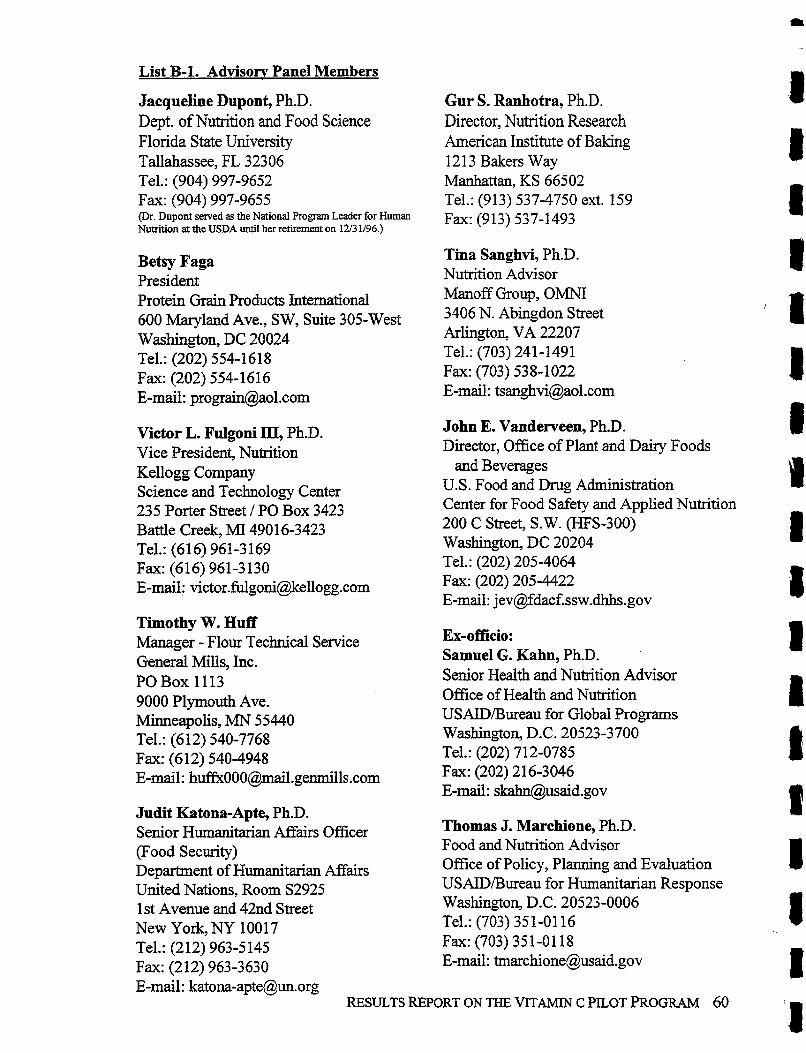
List B-1. Advisorv Panel Members
Jacqueline Dupont, PbD. Gur S. Ranhotra, Ph.D. Dept. of Nutrition and Food Science Director, Nutrition Research Florida State University American Institute of Baking Tallahassee, FL 32306 12 13 Bakers Way Tel.: (904) 997-9652 Manhattan, KS 66502 Fax: (904) 997-9655 Tel.: (913) 537-4750 ext. 159 (Dr. Dupont served as the National P r o m Leader for Human Fax: (9 13) 53 7- 1493 Nutrition at the USDA until her retirement on 1213 1/96.)
Betsy Faga Tina Sanghvi, Ph.D.
President Nutrition Advisor
Protein Grain Products International Manoff Group, OMNI
600 Maryland Ave., SW, Suite 305-West 3406 N. Abingdon Street
Washington, DC 20024 Arlington, VA 22207 Tel.: (202) 554-1 618 Tel.: (703) 241 -1491
Fax: (202) 554-161 6 Fax: (703) 538-1022
E-mail: [email protected] E-mail: [email protected]
Victor L. Fulgoni III, Ph.D. Vice President, Nutrition Kellogg Company Science and Technology Center 235 Porter Street / PO Box 3423 Battle Creek, MI 49016-3423 Tel.: (616) 961-3169 Fax: (616) 961-3130 E-mail: [email protected]
John E. Vanderveen, Ph.D. Director, Office of Plant and Dairy Foods
and Beverages U.S. Food and Drug Administration Center for Food Safety and Applied Nutrition 200 C Street, S.W. (HFS-300) Washington, DC 20204 Tel.: (202) 205-4064 Fax: (202) 205-4422 E-mail: [email protected]
Timothy W. Huff Manager - Flour Technical Service Ex-officio:
Samuel G. Kahn, Ph.D. General Mills, Inc. PO Box 1113 Senior Health and Nutrition Advisor
9000 Plymouth Ave. Office of Health and Nutrition
Minneapolis, MN 55440 USAID/Bureau for Global Programs Tel.: (6 12) 540-7768 Washington, D.C. 20523-3700
Fax: (612) 540-4948 Tel.: (202) 712-0785
E-mail: [email protected] Fax: (202) 21 6-3046 E-mail: [email protected]
Judit Katona-Apte, Ph.D. Senior Humanitarian Affairs Officer Thomas J. Marchione, Ph.D.
(Food Security) Food and Nutrition Advisor
Department of Humanitarian Affairs Office of Policy, Planning and Evaluation United Nations, Room S2925 USAID/Bureau for Humanitarian Response
1 st Avenue and 42nd Street Washington, D.C. 20523-0006
New York, NY 100 17 Tel.: (703) 351-01 16
Tel.: (212) 963-5145 Fax: (703) 35 1-0 1 18
Fax: (212) 963-3630 E-mail: [email protected] E-mail: [email protected]
RESULTS REPORT ON THE VITAMIN C PILOT PROGRAM 60
List B-2. Statistical Sub~rrou~ Members
Kristin Barkhouse Kellogg Co., Statistics Science and Technology Center 235 Porter Street 1 PO Box 3423 Battle Creek, MI 490 16-3423 Tel.: (616) 961-6152 Fa: (616) 961-3290
Timothy W. Huff Manager - Flour Technical Service General Mills, Inc. PO Box 1113 9000 Plymouth Ave. Minneapolis, MN 55440 Tel.:(612) 540-7768 Fax: (612) 540-4948
Nort Hoischuh, General Mills, Inc. Marvin Hurrle, General Mills, Inc. Same address as above
Present atfirst of luto meetings: Gary Beecher Nutrient Composition Laboratory BHNRC, ARS, USDA Agricultural Research Center Beltsville, MD 20705 Tel.: (301) 344-2356
Robert Brill Monsanto Co. 800 N Lingbergh Blvd. St. Louis, MO 63167 Tel.: (3 14) 694-1684 Fax: (314) 694-8083
Clark Hartford Rhijne-Poulenc Inc. Prospect Plains Road CN 7500 Cranbury, NJ 085 12-7500 Tel.: (609) 860-5420 Fax: (609) 860-0357
List B-3. Other Peo~le Consulted*
Baley, Sandra Bathia, Rita Bell, Robert Bechtel, Kathie Bownik, Ted Brause, Jon Brown, Merle Burkholder, Brent Cadet, Florence Calhoun, Frank Carlson, Helen Didion, John Firth, James Gedeon, Michaele Gettier, Joe Graves, Sylvia Gross, Bill Guenant, Bradley Hagen, David Hansch, Steve Harvey, Michael Henry, Annie Hicks, Vicki Holbrook, William Holsinger, Virginia Jensen, Dean Jones, Julie Miller Josma, Geralde Kvitashvili, Elizabeth Lacey, Irene Lange, John Levinson, Ellen Loegering, Steve MacNeil, Amy Markunas, Jeanne Marsh, Peter Maurelius, Maurissaint Meyers, Marc Miteff, Steve
Lancaster Laboratories, Lancaster, PA UNHCR, Geneva, Switzerland CARE, Atlanta, GA USDA, FSA, Kansas City, MO ADM Milling Co., North Kansas city, MO USAID, BHR USDA, CFSA CDC, Atlanta, GA USAID, Haiti ADM Paniplus, Olathe, KS USAID, BHR Didion Milling, Inc., Cambria, WI USDA, FSA USAPD, Haiti USAID, Nairobi, Kenya USAID, BHR Lauhoff Grain Co., Danville, IL WFP, Ngara, Tanzania USAID, BHR Refugee Policy Group USAID, Haiti ADRA, Haiti USDA, CFSA ADRA, Haiti USDA, ARS USDA, ASCS Saint Catherine College, St. Paul, MN ADRA, Haiti USAID, BHR WFP, Dar-Es-Salaam, Tanzania ConAgra Milling Co. Food Aid Coalition CRS, Baltimore, MD CRS, Baltimore, MD USAID, BHR Bethel Grain Co., Benton, IL ADRA, Haiti Balchern Corporation, State Hill, NY USDA, Kansas City, MO
RESULTS REPORT ON THE VITAMIN C PILOT PROGRAM 62
1
Mon Desir, Emmanuel Murphy, Suzanne Neelamegham, Mr. Nelson, Francisca Nelson, Randall Nelson, Robert Olewnik, Maureen Partridge, Natalie Parvanta, Ibrahim (Abe) Paz-Castillo, Janet Petak, Jerry Pruviance, Randy Ramaswamy, Hema Rinne, Charlie Rusby, Paul Schultz, Brad Sharp, John Sindt, Robert Sireuil, Elissa Staten, Lisa Straws, Joel Swindale, Anne Tanner, Bonnie Testerman, Donna Van der Haar, Frits Van Nieuwenhuyse, Christine Villedrouin, Dominique Volpe, Theresa Washington, Oscar Watson, John Weaver, Kenneth Weeks, Cora Weibel, Mike Wiemer, Katbryn Woods, Marvin Young, Helen
ADRA, Haiti University of California, CA WFP, New Delhi India USAID, BHR USDA, FSA, Kansas City, MO Bancroft Bag, Inc. AIB, Manhattan, KS Food and Nutrition, USDA, National Agricultural Library CDC, Atlanta, GA USAID, BHR Bethel Grain Co., Benton, IL ADRA USAID, New Delhi, India American Ingredient Co., Kansas City, MO USAID, Haiti ConAgra Milling Co., Atchinson, KS USDA, FGIS IFAC Consultant University of Arizona, Tucson, AZ USAID, Dar-Es-Salaam, T-a IMPACT USDA, CFSA USDA, FSA, Kansas City, MO PAMM, Atlanta, GA WFP, Rome, Italy ADRA, Haiti Nabisco, East Hanver, NJ Lauhoff Grain Co., Danville, IL Watson Foods Co., Inc. FGIS, Kansas City, MO FDA Watson Foods Co., Inc., West Haven, CT General Mills, Minneapolis, MN Lauhoff Grain Co., Danville, IL OXFAM, London, UK
* Unless otherwise noted, persons consulted are located in the greater Washington, DC area.
RESULTS REPORT ON THE VITAMIN C PILOT PROGRAM 63
Appendix C
Specifications and Laboratory Analysis of Vitamin Fortification Premix in CSB/WSB
I , RESULTS REPORT ON THE VITAMIN C PILOT PROGRAM 65
I '2 " ir"TppFagganprG, pprfoTq ~ l ~ , ~ i l ? 7 3 ~
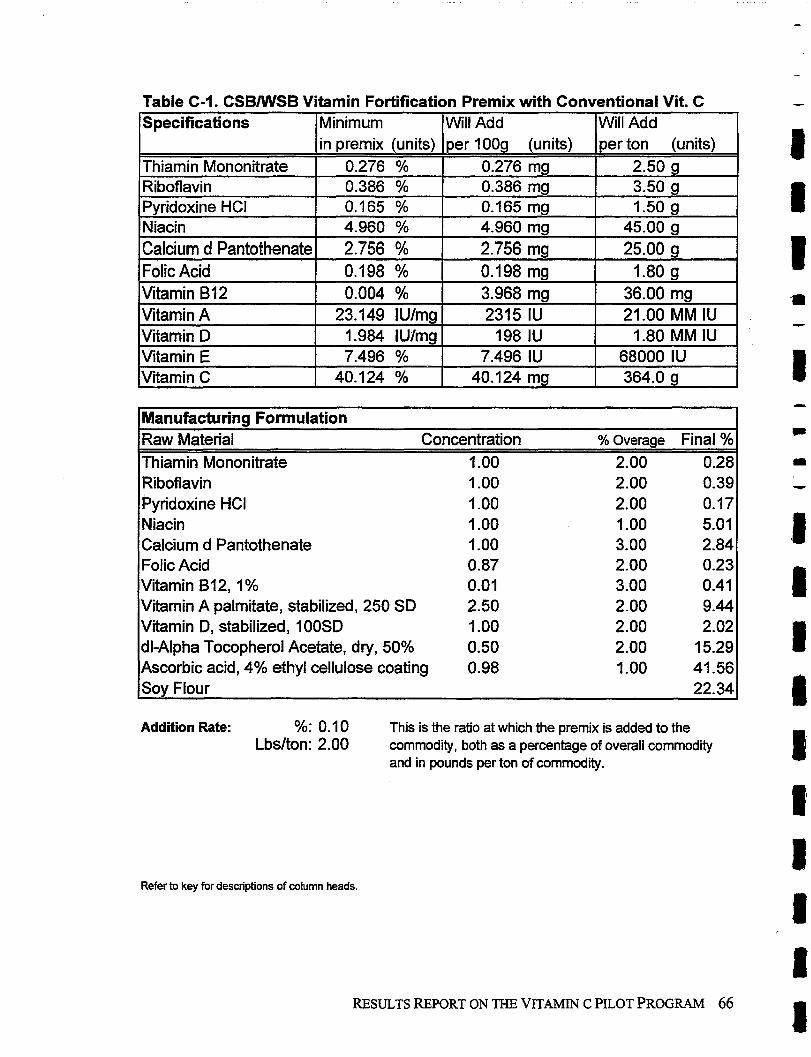
Table C-I. CSBMlSB Vitamin Fortification Premix with Conventional Vit. C -
Manufacturing Formulation Raw Material Concentration % overage Final % Thiamin Mononitrate I .OO 2.00 0.28 Riboflavin I .OO 2.00 0.39 Pyridoxine HCI 1-00 2.00 0.17 Niacin 1 .OO 1-00 5.01 Calcium d Pantothenate 1 .OO 3.00 2.84 Folic Acid 0.87 2.00 0.23 Vitamin 612, 1 % 0.01 3.00 0.41 Vitamin A palmitate, stabilized, 250 SD 2.50 2.00 9.44 Vitamin D, stabilized, 100SD 1-00 2.00 2.02 dl-Alpha Tocopherol Acetate, dry, 50% 0.50 2.00 15.29 Ascorbic acid, 4% ethyl cellulose coating 0.98 1 .OO 41 -56 Soy Flour 22.34
Specifications
Thiamin Mononitrate Riboflavin Pyridoxine HCI Niacin Calcium d Pantothenate Folic Acid Vitamin B12 Vitamin A Vitamin D Vitamin E Vitamin C
Addition Rate: %: 0.10 This is the ratio at which the premix is added to the Lbsiton: 2.00 commodity, both as a percentage of overall commodity
and in pounds per ton of commodity.
Refer to key for descriptions of column heads.
Minimum in premix (units)
0.276 % 0.386 % 0.165 % 4.960 % 2.756 % 0.198 % 0.004 %
23.149 IUImg 1.984 IUImg 7.496 %
40.124 %
RESULTS REPORT ON THE VITAMIN C PILOT PROGRAM 66 1
Will Add per I OOg (units)
0.276 mg 0.386 mg 0.165 mg 4.960 mg 2.756 mg 0.198 mg 3.968 mg 2315 IU
198 IU 7.496 IU
40.124 mg
Will Add per ton (units)
2.50 g 3.50 g 1.50 g
45.00 g 25.00 g
1.80 g 36.00 mg 21.00 MM IU
1.80 MM IU 68000 IU 364.0 g
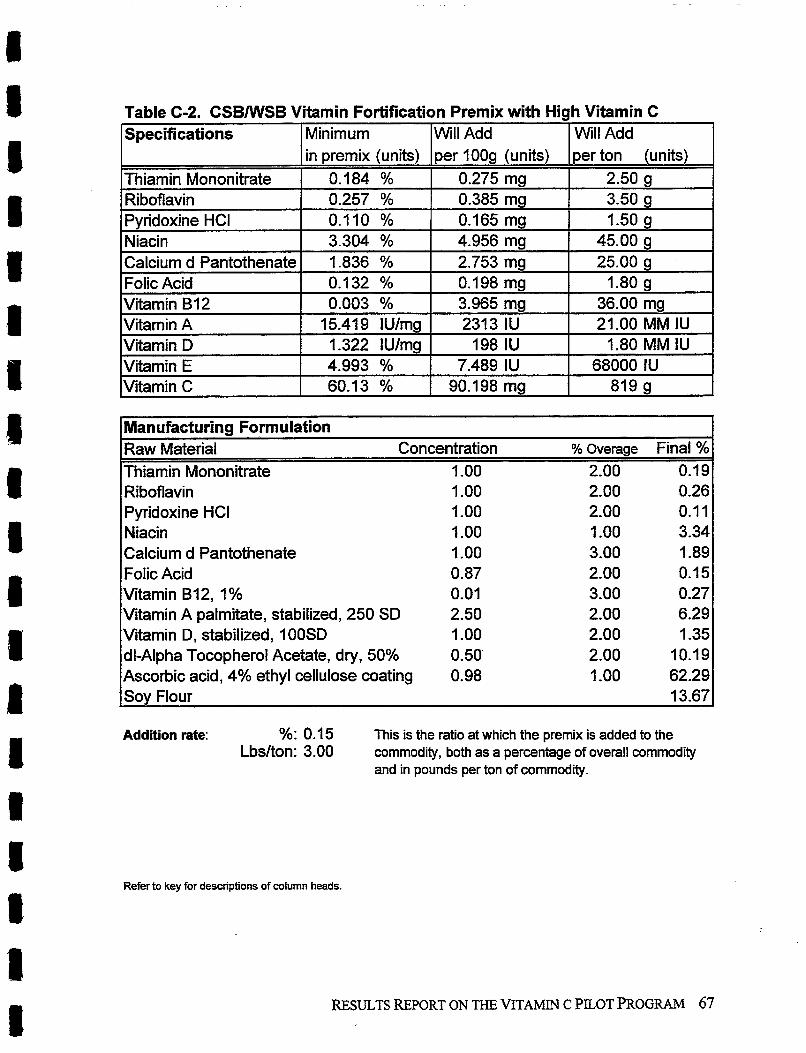
Manufacturing Formulation Raw Material Concentration % Overage Final % Thiamin Mononitrate I .OO 2.00 0.19 Riboflavin 1-00 2.00 0.26 Pyridoxine HCI 1.00 2.00 0.1 1 Niacin I .OO 1 .OO 3.34 Calcium d Pantothenate 1-00 3.00 1.89 Folic Acid 0.87 2.00 0.15 Vitamin B12, 1% 0.01 3.00 0.27 Vitamin A palmitate, stabilized, 250 SD 2.50 2.00 6.29 Vitamin D, stabilized, 1 00SD 1-00 2.00 I .35 dl-Alpha Tocopherol Acetate, dry, 50% 0.50 2.00 10.19 Ascorbic acid, 4% ethyl cellulose coating 0.98 1-00 62.29 Soy Flour 13.67
Table C-2. CSBNSB Vitamin Fortification Premix with High Vitamin C
Addition rate: %: 0.15 This is the ratio at which the premix is added to the Lbsfton: 3.00 commodity, both as a percentage of overall commodity
and in pounds per ton of commodity.
Specifications
Thiamin Mononitrate Riboflavin Pyridoxine HCI Niacin Calcium d Pantothenate Folic Acid Vitamin B12 Vitamin A Vitamin D Vitamin E Vitamin C
Refer to key for descriptions of column heads.
RESULTS REPORT ON THE VITAMIN C PLOT PROGRAM 67
Will Add per ton (units)
2.50 g 3.50 g 1.50 g
45.00 g 25.00 g
1.80 g 36.00 mg 21 .OO MM IU
1.80 MM IU 68000 IU
819 a
Minimum in premix (units)
0.184 % 0.257 % 0.110 % 3.304 % 1.836 % 0.132 % 0.003 %
15.419 IUfmg 1.322 IUfmg 4.993 % 60.13 %
Will Add per 100g (units)
0.275 mg 0.385 mg 0.165 mg 4.956 mg 2.753 mg 0.1 98 mg 3.965 mg 2313 IU 198 IU
7.489 IU 90.1 98 ma
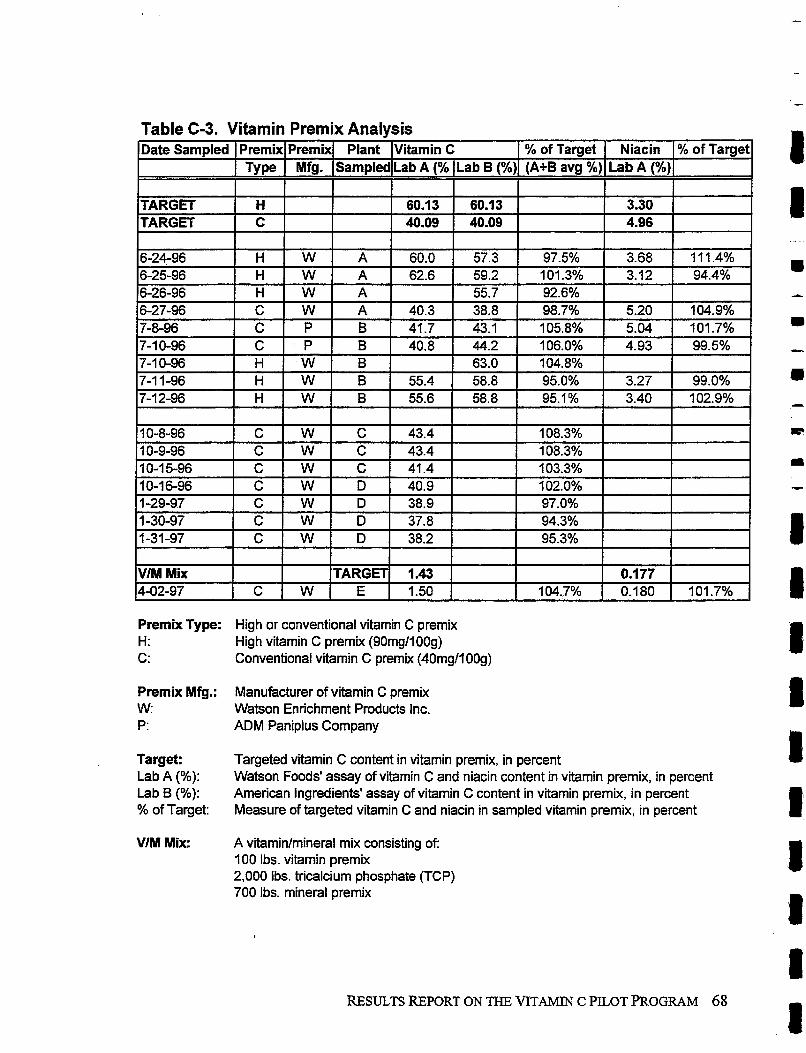
Premix Type: High or conventional vitamin C premix H: High vitamin C premix (90mg/100g) C: Conventional vitamin C premix (40mg/IOOg)
Table C-3. Vitamin Premix Analysis
Premix Mfg.: Manufacturer of vitamin C premix W: Watson Enrichment Products Inc. P : ADM Paniplus Company
VIM Mix 4-02-97
Target: Targeted vitamin C content in vitamin premix, in percent Lab A (%): Watson Foods' assay of vitamin C and niacin content in vitamin premix, in percent Lab B (%): American Ingredients' assay of vitamin C content in vitamin premix, in percent % of Target: Measure of targeted vitamin C and niacin in sampled vitamin premix, in percent
VIM Mix: A vitaminjmineral mix consisting of: I00 Ibs. vitamin premix 2,000 Ibs. tricalcium phosphate (TCP) 700 Ibs. mineral premix
RESULTS REPORT ON THE VITAMIN C PILOT PROGRAM 68
C 1.43 1.50 W
TARGET E 104.7%
0.1 77 0.180 101.7%
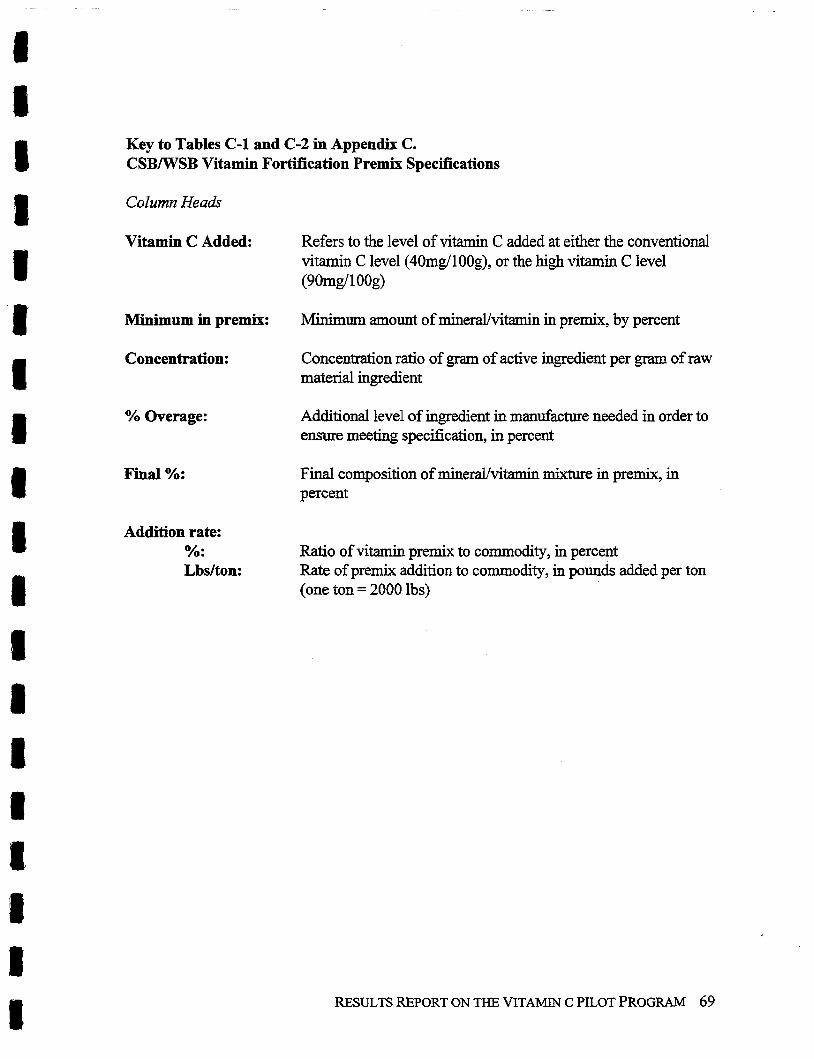
Key to Tables C-1 and C-2 in Appendix C. CSBNSB Vitamin Fortification Premix Specifications
Column Heah
Vitamin C Added: Refers to the level of vitamin C added at either the conventional vitamin C level (40mg/lOOg), or the high vitamin C level (90mg/1 OOg)
Minimum in premix: Minimum amount of mineralfvitarnin in premix, by percent
Concentration: Concentration ratio of gram of active ingredient per gram of raw material ingredient
% Overage:
Final %:
Addition rate: %: Lbsfton:
Additional level of ingredient in manufacture needed in order to ensure meeting specification, in percent
Final composition of minerdvitamin mixture in premix, in percent
Ratio of vitamin premix to commodity, in percent Rate of premix addition to commodity, in pounds added per ton (one ton = 2000 lbs)
RESULTS REPORT ON THE VITAMIN C PILOT PROGRAM 69
I I I u I 4 I I 8 n il I I 8 I ;I
1 RESULTS REPORT ON THE VITAMIN C PLOT PROGRAM 7 1
m WJU8 s s a m bsh%ws n a y s 73ipT5y , - 'K
Appendix D
Schedule of WSB and CSB Pilot Procurements from Production to Distribution
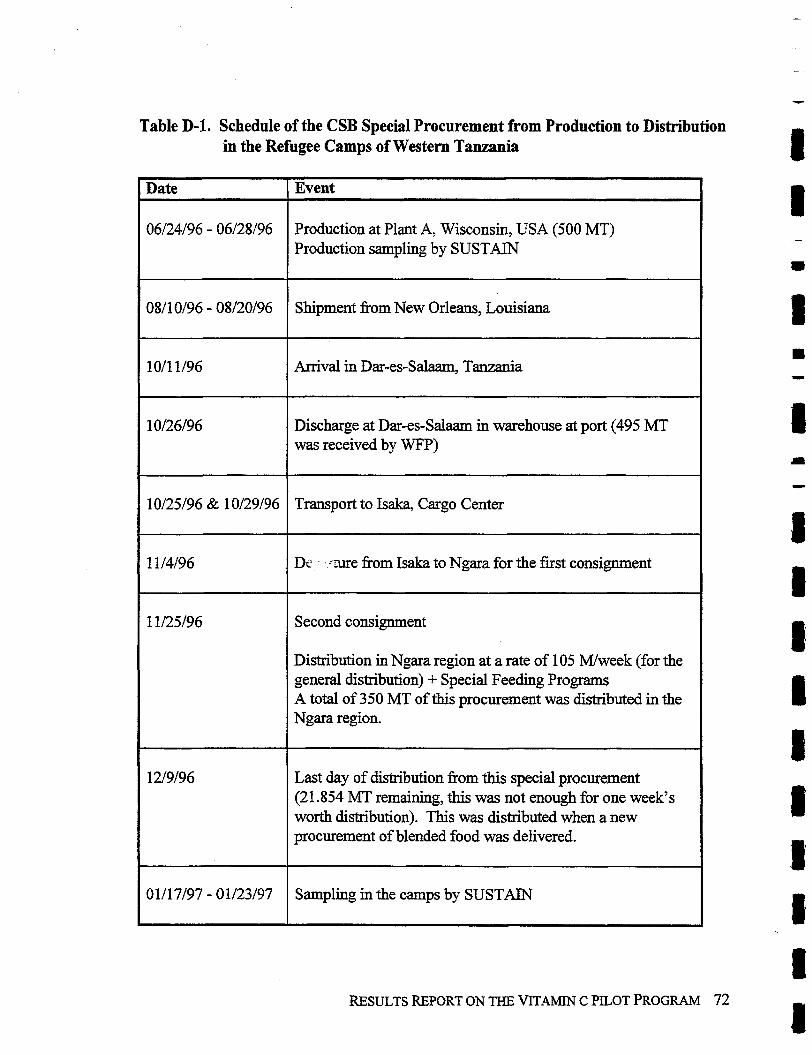
Table D-1. Schedule of the CSB Special Procurement from Production to Distribution in the Refugee Camps of Western Tanzania
RESULTS W O R T ON THE VITAMTN C PILOT PROGRAM 72
Date
06/24/96 - 06/28/96
0811 0196 - 08/20/96
1011 1 196
10/26/96
1 0125196 & 1 0/29/96
1 1/4/96
1 1/25/96
12/9/96
01/17/97 - 01/23/97
Event
Production at Plant A, Wisconsin, USA (500 MT) Production sampling by SUSTAIN
Shipment fiom New Orleans, Louisiana
Arrival in Dar-es-Salaam, Tanzania
Discharge at Dar-es-Salaam in warehouse at port (495 MT was received by WFP)
Transport to Isaka, Cargo Center
DL - m e fiom Isaka to Ngara for the first consignment
Second consignment
Distribution in Ngara region at a rate of 105 W e e k (for the general distribution) + Special Feeding Programs A total of 350 MT of this procurement was distributed in the Ngara region.
Last day of distribution fiom this special procurement (21.854 MT remaining, this was not enough for one week's worth distribution). This was distributed when a new procurement of blended food was delivered.
Sampling in the camps by SUSTAIN
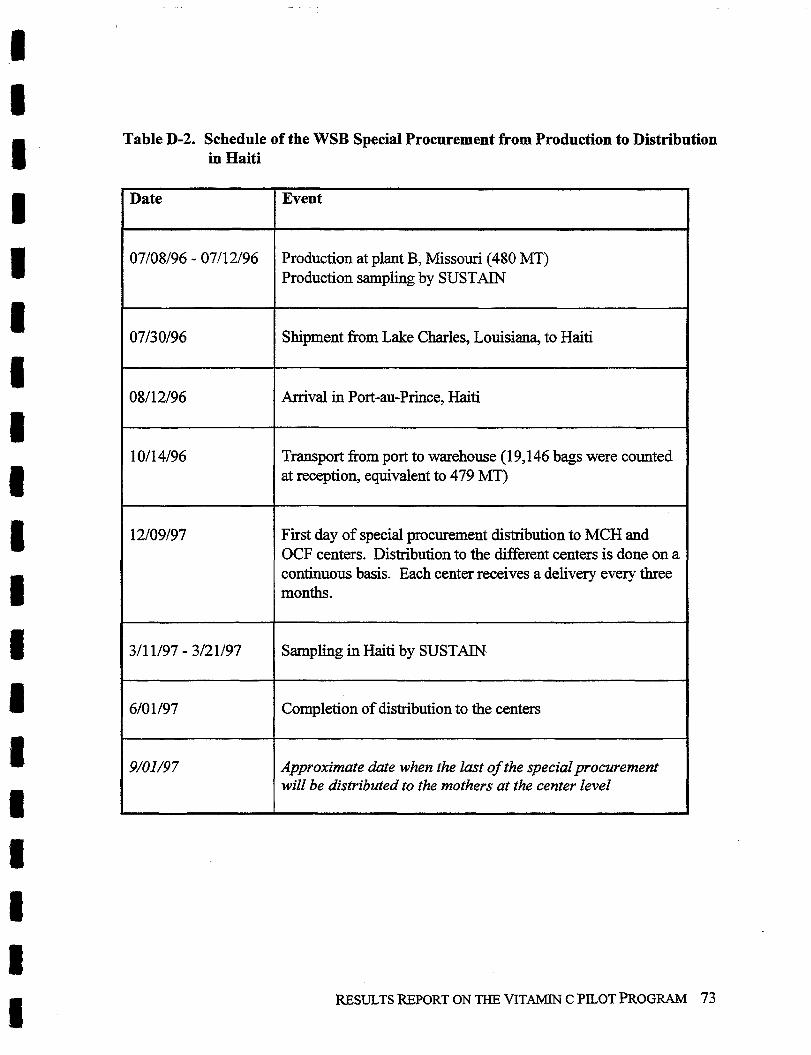
Table D-2. Schedule of the WSB Special Procurement from Production to Distribution in Haiti
RESULTS W O R T ON THE VITAMIN C PILOT PROGRAM 73
Date
07/08/96 - 07/12/96
07/30/96
0811 2/96
1011 4/96
12/09/97
311 1/97 - 3/21/97
610 1/97
9/01/97
Event
Production at plant B, Missouri (480 MT) Production sampling by SUSTAIN
Shipment from Lake Charles, Louisiana, to Haiti
Arrival in Port-au-Prince, Haiti
Transport fi-om port to warehouse (1 9,146 bags were counted at reception, equivalent to 479 MT)
First day of special procurement distribution to MCH and OCF centers. Distribution to the different centers is done on a continuous basis. Each center receives a delivery every three months.
Sampling in Haiti by SUSTAIN
Completion of distribution to the centers
Approximate date when the East of the special procurement will be distributed to the mothers at the center level
Appendix E
Cooked Food Storage Temperature History
RESULTS REPORT ON THE VITAMIN C PILOT PROGRAM 75
e # r n h q p k @ p cF@Q$7;(;y3 Ed! ."*L i r , ,113, C 9 J,J;$$~ $a %!. <, ,&. _ 4 d h. ( ~ l i ~ .a:?
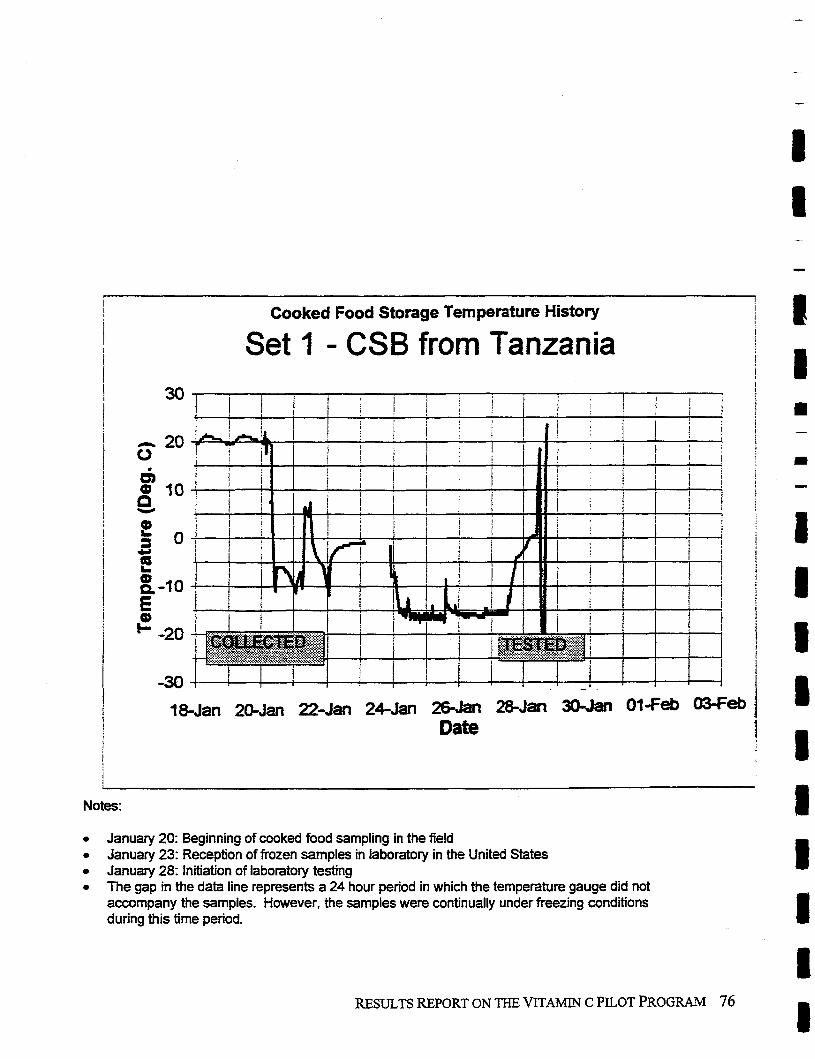
f 0 u E g-to E Q,
+ -20
Cooked Food Storage Temperature History i i
Set 1 - CSB from Tanzania
Date ! j
Notes: I .I January 20: Beginning of cooked food sampling in the field
January 23: Reception of frozen samples in laboratory in the United States January 28: initiation of laboratory testing
.I The gap in the data line represents a 24 hour period in which the temperature gauge did not accompany the samples. However, the samples were continually under freezing conditions during this time period.
RESULTS REPORT ON THE VITAMIN C PILOT PROGRAM 76
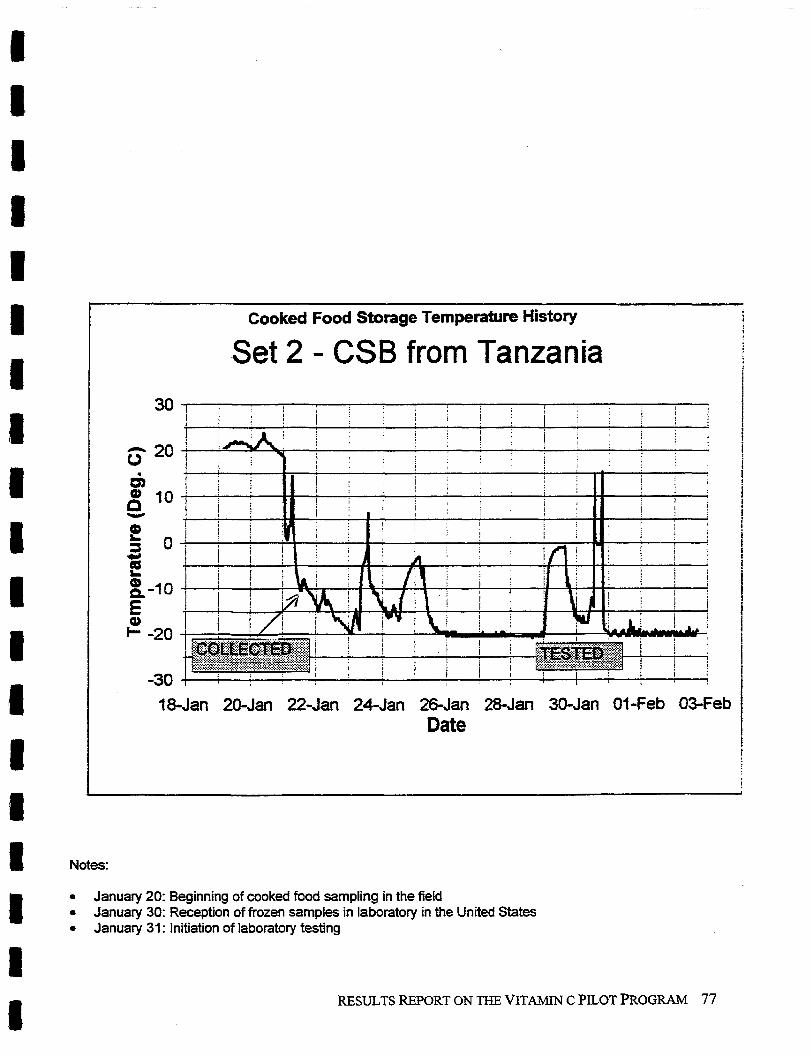
Cooked Food Storage Temperature History ! 1
Set 2 - CSB from Tanzania
18-Jan 20-Jan 22-Jan 24-Jan 26-Jan 28-Jan 30Jan 01 -Feb 03-Feb Date
t !
Notes:
January 20: Beginning of cooked food sampling in the field January 30: Reception of frozen samples in laboratory in the United States January 31 : Initiation of laboratory testing
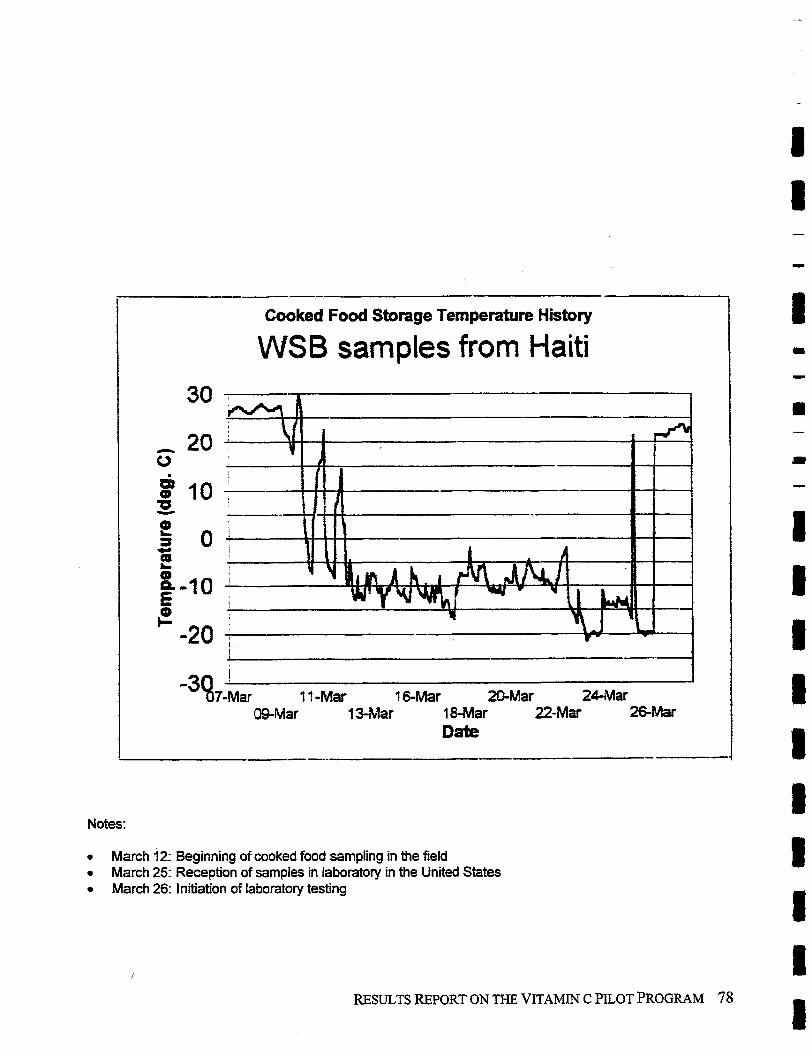
1 Cooked Food Storaae Ternseralure Historv
WSB samples from Haiti
-38mar ~ ? - ~ a r 1 &Mar 20-Mar 2 4 - ~ a r 09-Mar 1 3-Mar 1 M a r 22-Mar &Mar
Date
Notes:
March 12: Beginning of cooked food sampling in the field * March 25: Reception of samples in laboratory in the United States
March 26: Initiation of laboratory testing
RESULTS REPORT ON THE VITAMIN C PILOT PROGRAM 78
Appendix F
Effect of Frozen Storage on Vitamin C Content in CSBIWSB Samples
RESULTS REPORT ON THE VITAMIN C PLOT PROGRAM 79
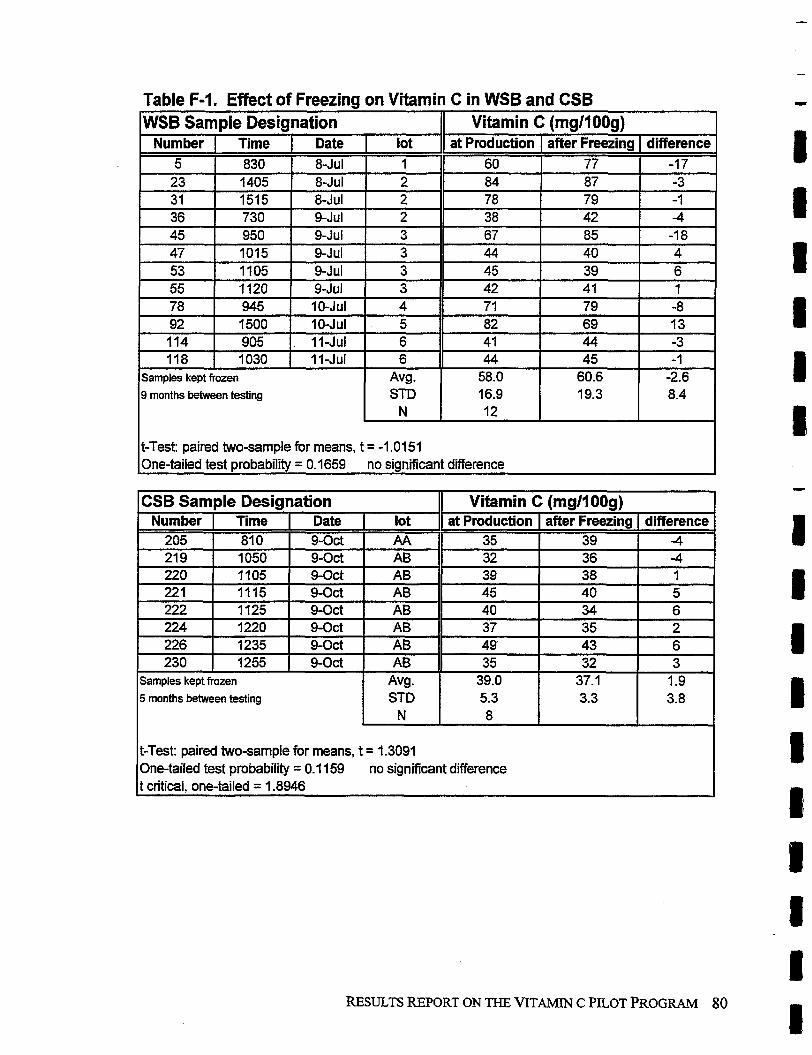
Table F-I. Effect of Freezing on Vitarni I C in WSB and CSB WSB Sample Designation
Number Time Date lot 5 830 8-JuI 1
Samples kept frozen
9 months between testing
t-Test: paired two-sample for means, t = -1.0151 One-tailed test probability = 0.1659 no significant difference
RESULTS REPORT ON THE VITAMIN C PILOT PROGRAM 80
CSB Sample Designation
t-Test: paired two-sample for means, t = 1.3091 One-tailed test probability = 0.1 159 no significant difference t critical, one-tailed = 1.8946
Vitamin C (mgMOOg) Number
205 21 9 220 221 222 224 226 230
at Production 35 32 39 45 40 37 49 35
39.0 5.3 8
Time 81 0 1050 1105 1115 1125 1220 1235 1255
Date 9-Oct 9-Oct 9-Oct 9-Oct 9-Oct 9-Oct 9-Oct 9-Oct
lot AA AB A6 AB AB AB AB AB
Samples kept frozen
5 months between testing
after Freezing 39 36 38 40 34 35 43 32
37.1 3.3
A v ~ . STD
N
difference -4 -4 - 1 5 6 2 6 3
1.9 3.8
Appendix G
Flow Charts of Production Processes for Plants A Through E
RESULTS REPORT ON THE VITAMIN C PILOT PROGRAM 8 1
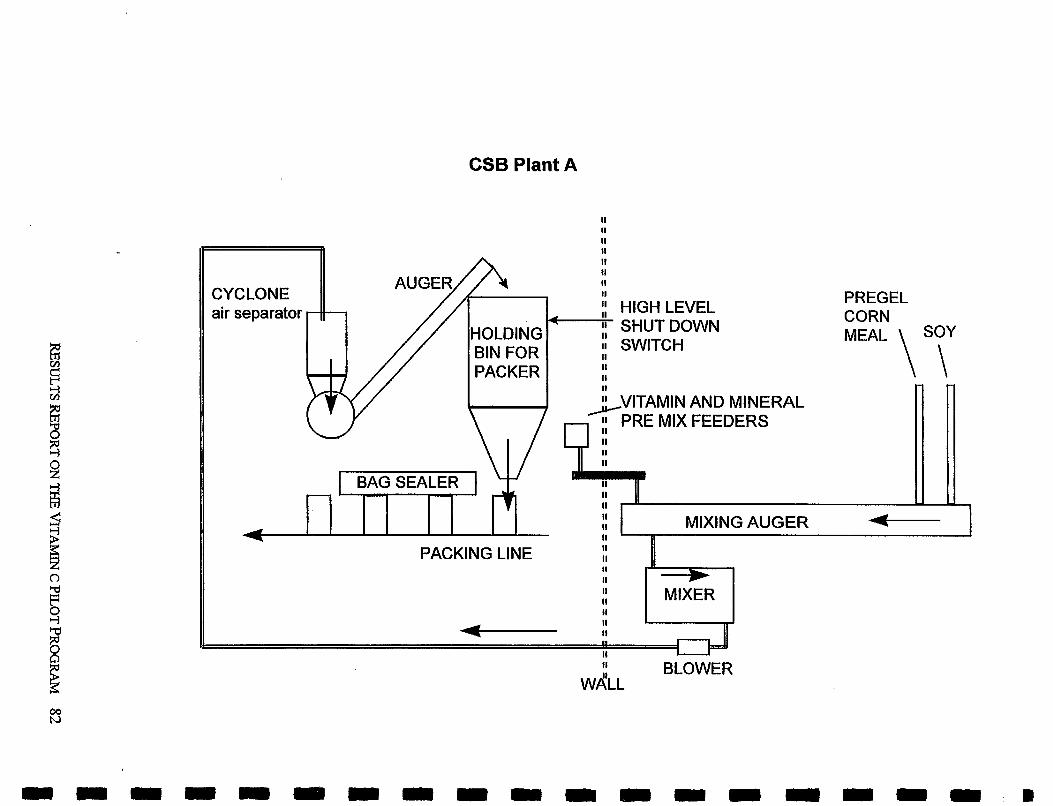
CSB Plant A
II II II II II II
CYCLONE I' HIGH LEVEL PREGEL
air separator II SHUT DOWN CORN
II
AND MINERAL
MEAL lVsy RE MIX FEEDERS
II II MIXING AUGER - II
PACKING LINE II II II II II II MIXER II
i
II BLOWER WALL
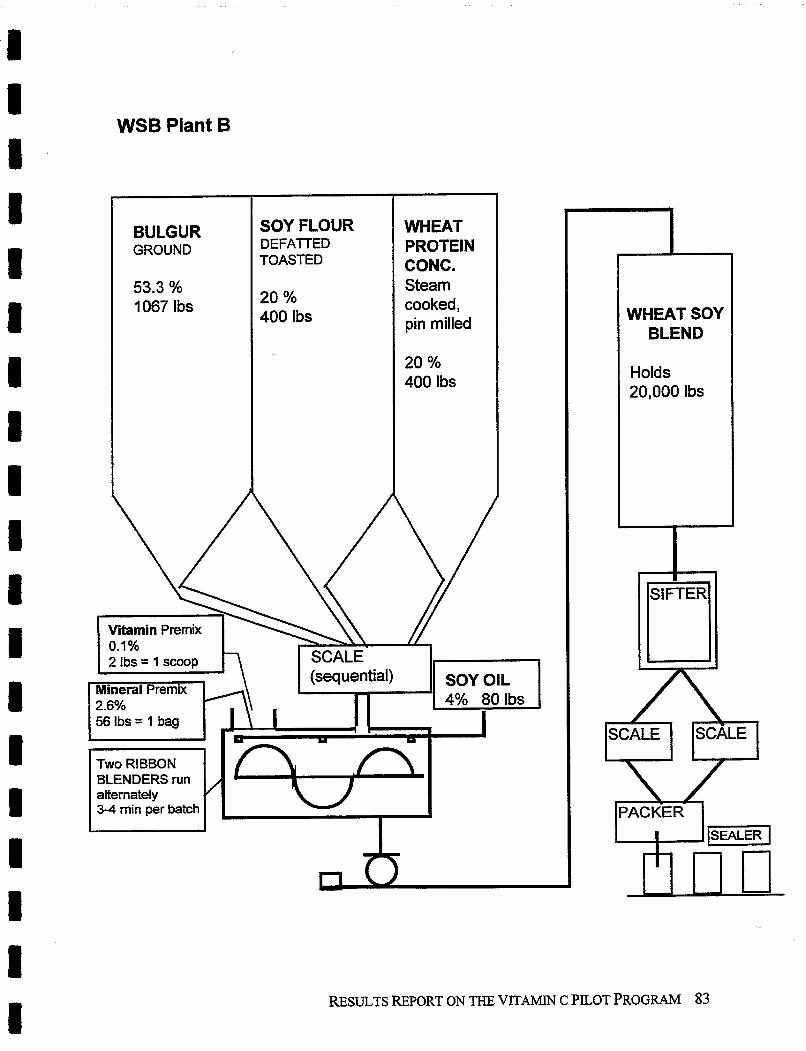
WSB Plant B
RESULTS REPORT ON THE VITAMIN C PILOT PROGRAM 83
WHEAT SOY BLEND
Holds 20,000 Ibs
\ /
Vitamin Premix 0.1% 2 ~ b s = 1 scoop SCALE
(sequential) Mineral Premix 2.6% 56 Ibs = 1 bag - - Y Ia SCALE SCALE
Two RIBBON BLENDERS run alternately 3-4 min per batch PACKER
A
WHEAT PROTEIN CONC. Steam cooked, pin milled
20 % 400 Ibs
BULGUR GROUND
53.3 % 1 067 Ibs
SOY FLOUR DEFAITED TOASTED
20 % 400 Ibs
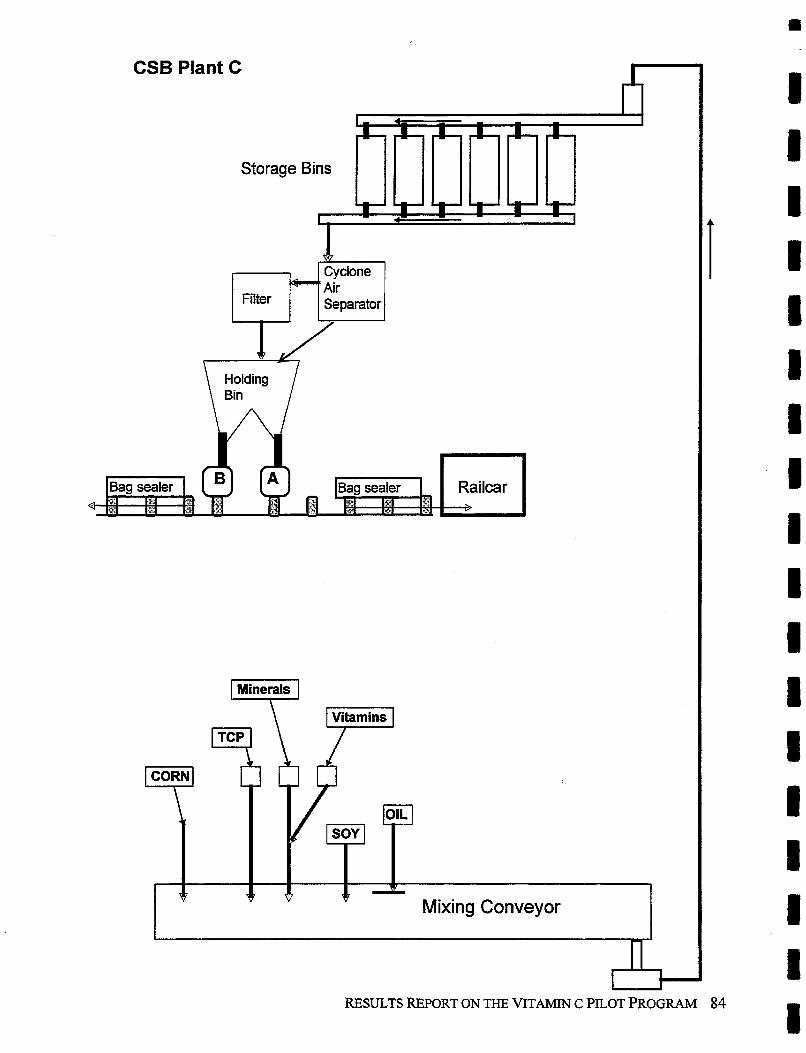
CSB Plant C
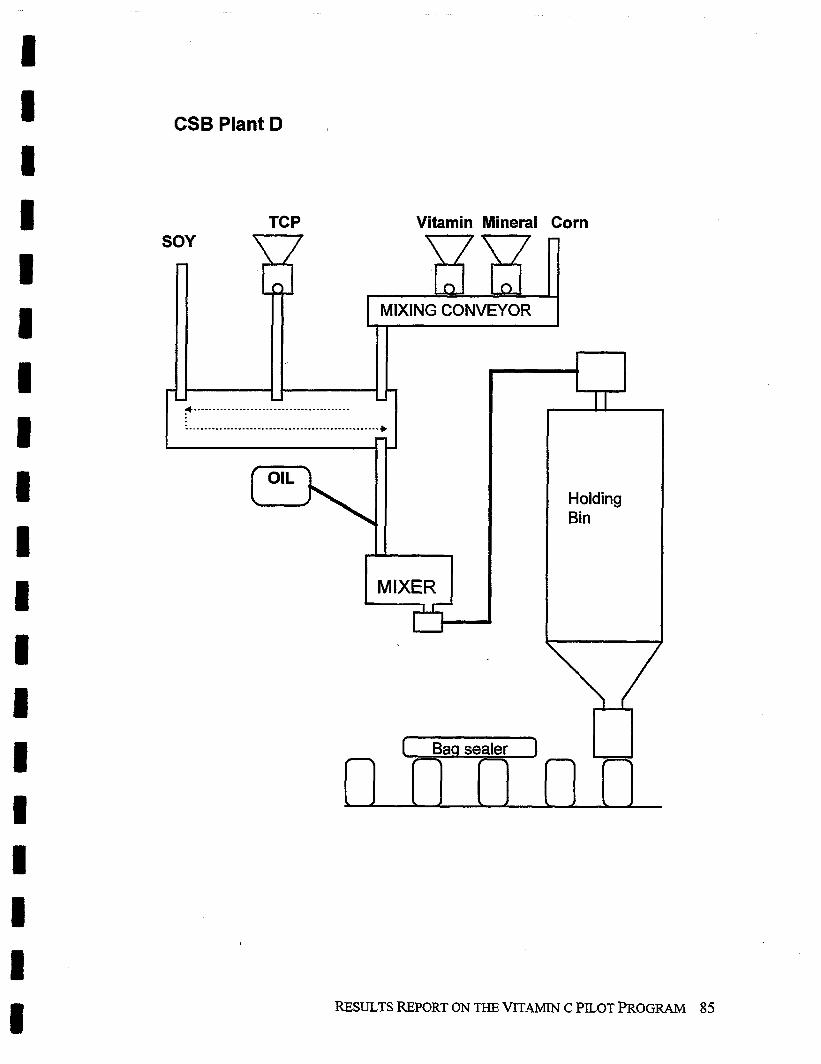
CSB Plant D
TCP Vitamin Mineral Corn SOY
C
MIXING CONVEYOR
- - $ ......................................... I I ................................................... +
7 -
Holding Bin
MIXER
[ Baqsealer y( nnnnn
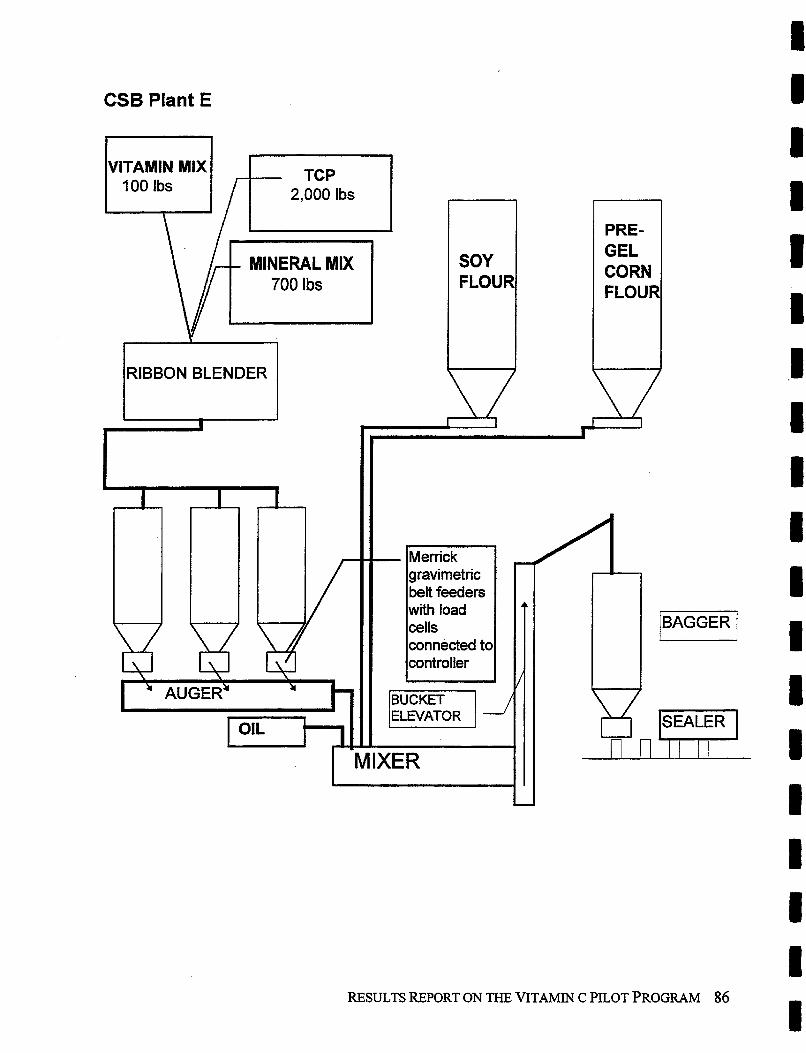
CSB Plant E
RESULTS REPORT ON THE VITAMIN C PILOT PROGRAM 86
VITAMIN MIX
- MINERAL MIX
RIBBON BLENDER
SOY FLOUR
PRE- GEL CORN FLOUR
Appendix H
Analytical Data on CSB/WSB Samples Taken from Plants A Through E
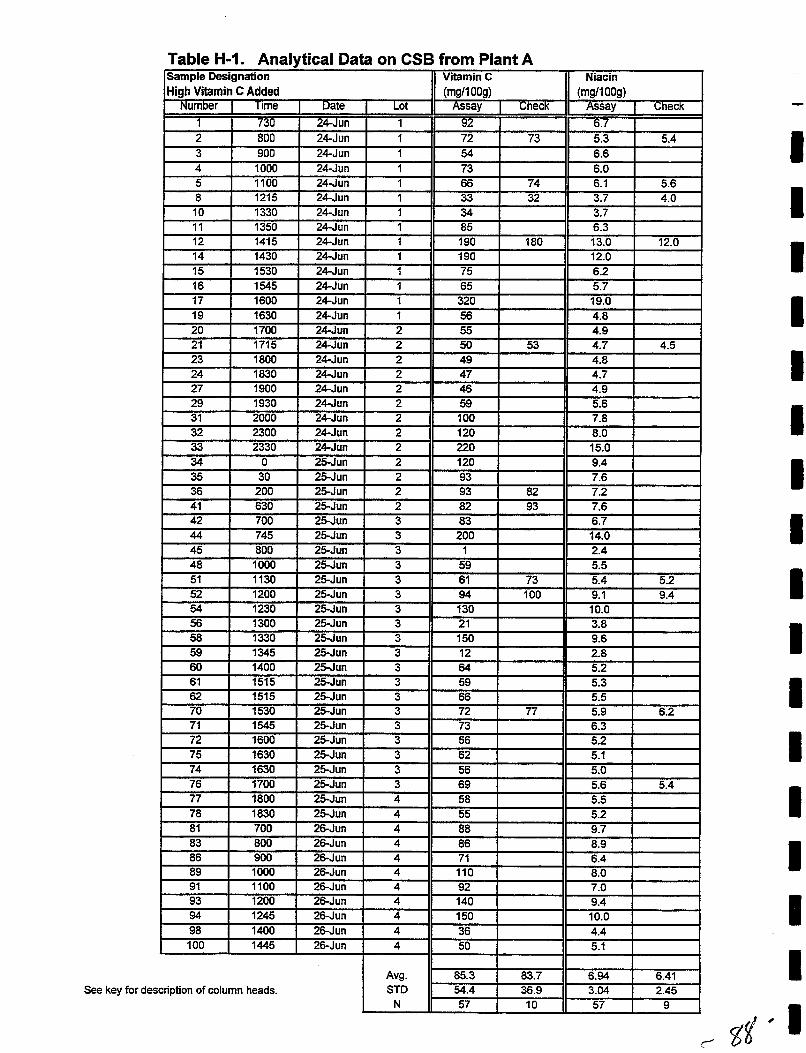
Table H-I. Analytical Data on CSB from Plant A
See key for description of column heads.
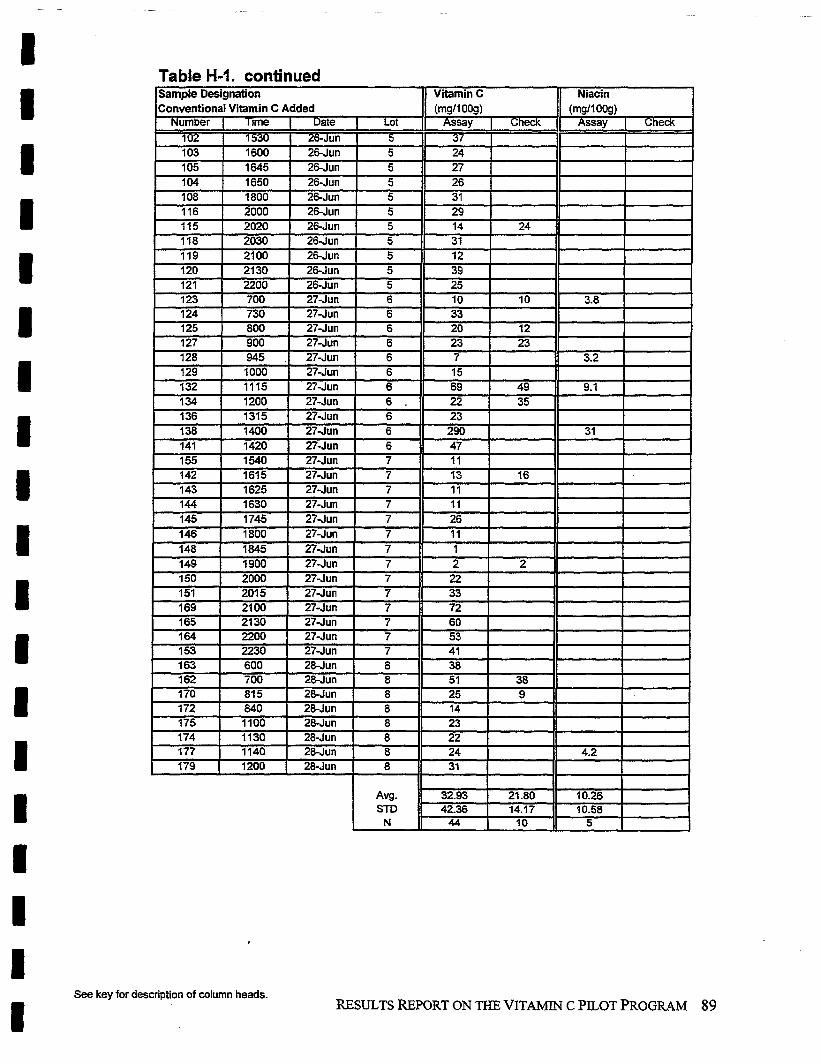
Table H-I. continued
See key for description of column heads.
I Avg. 32.93 21.80 10.26 STD
-- 42.36 14.17 10.58
N 44 10 5
RESULTS REPORT ON THE VITAMIN C PILOT PROGRAM 89
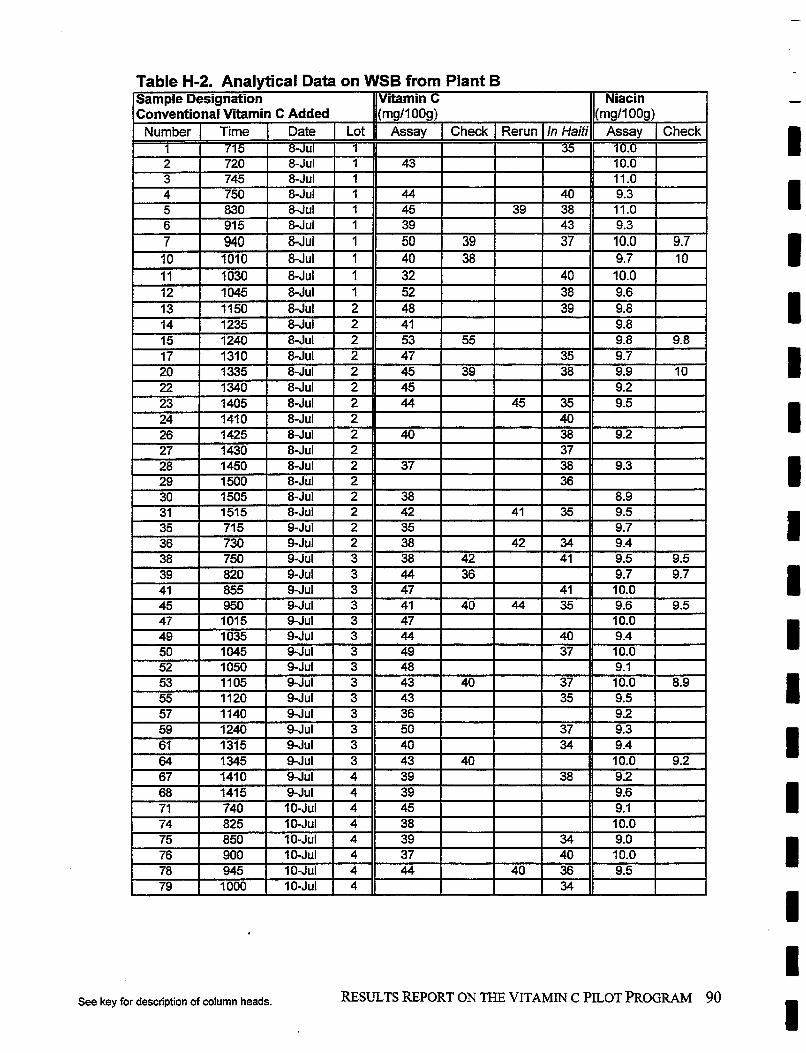
Table H-2. Analytical Data on WSB from Plant B
See key for description of column heads. RESULTS REPORT ON THE VITAMIN C PILOT PROGRAM 90
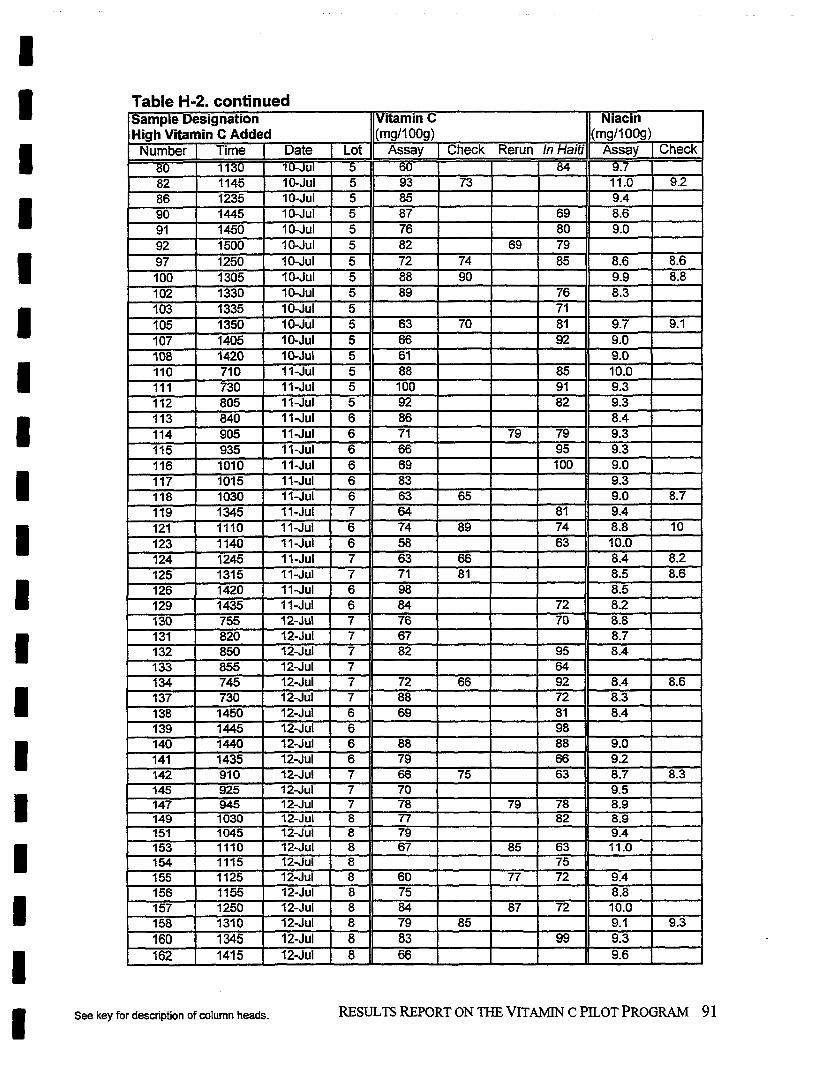
Table H-2. continued
See key for description of column heads. RESULTS REPORT ON THE VITAMIN C PILOT PROGRAM 9 1
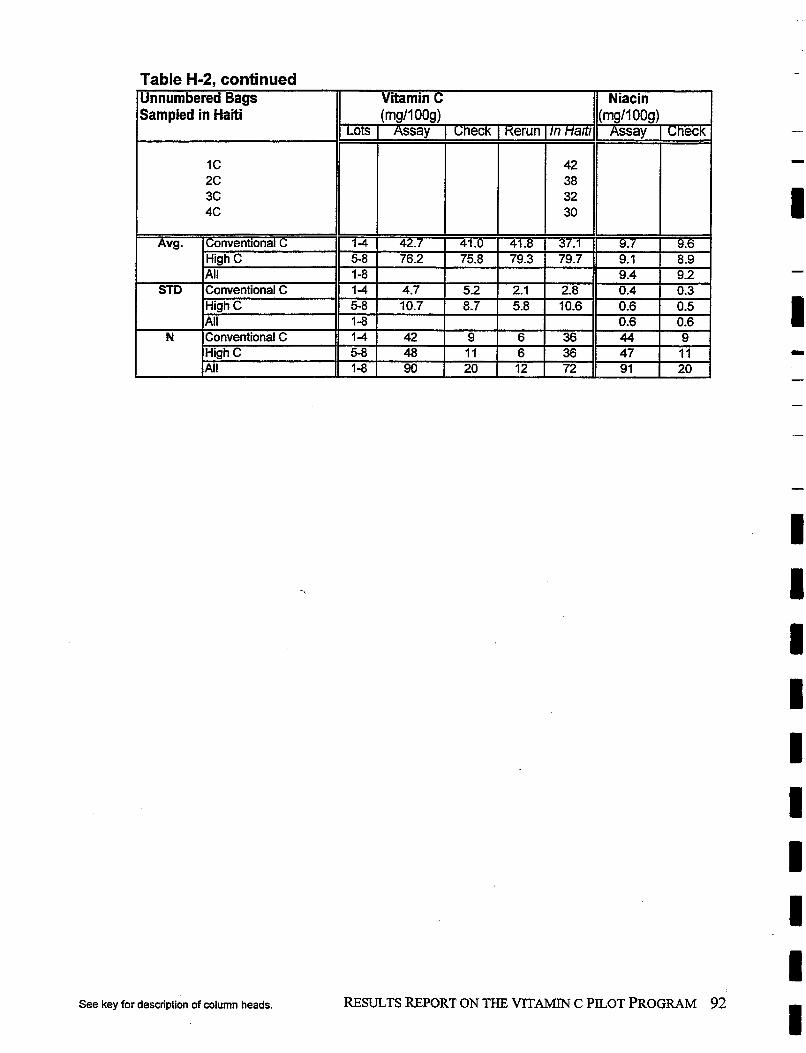
Table H-2, continued Unnumbered Bags Vitamin C Niacin Sampled in Haiti (mglloog) (mg/l009)
1 C 2C 3C 4C 30
See key for description of column heads. RESULTS REPORT ON THE VITAMIN C PILOT PROGRAM 92 I
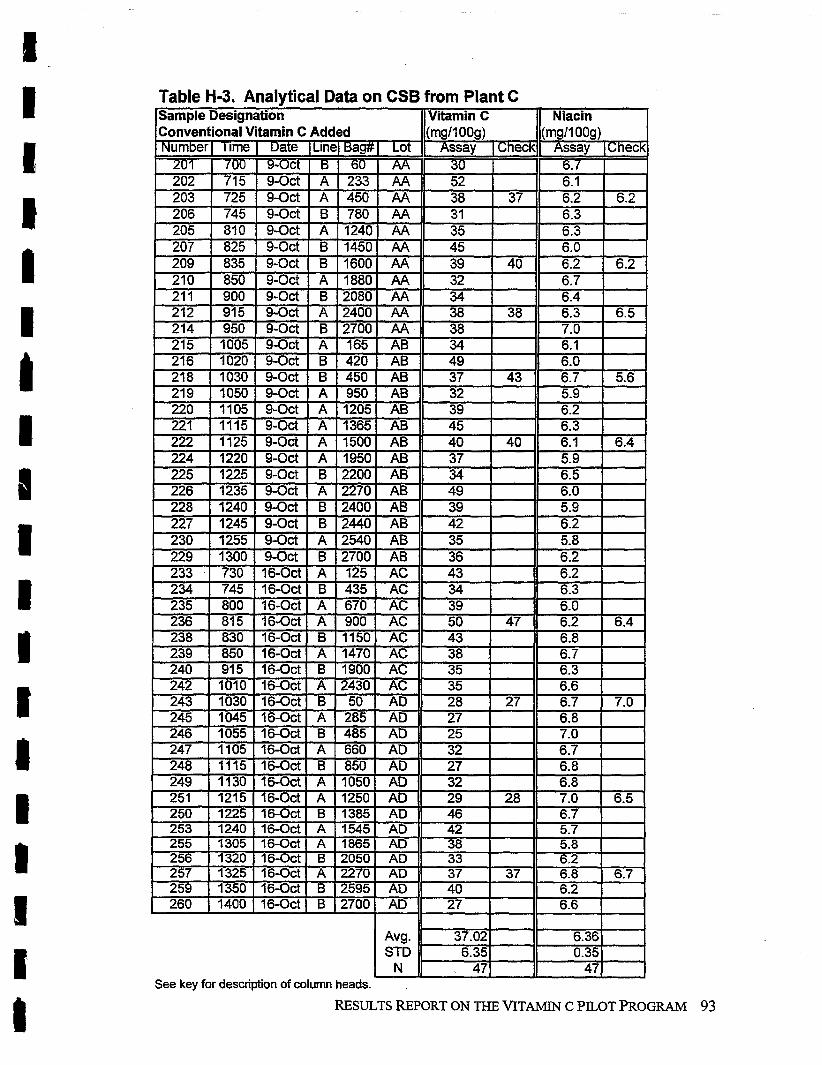
Table H-3. Analytical Data on CSB from Plant C
See key for description of column heads.
RESULTS REPORT ON THE VITAMIN C PILOT PROGRAM 93
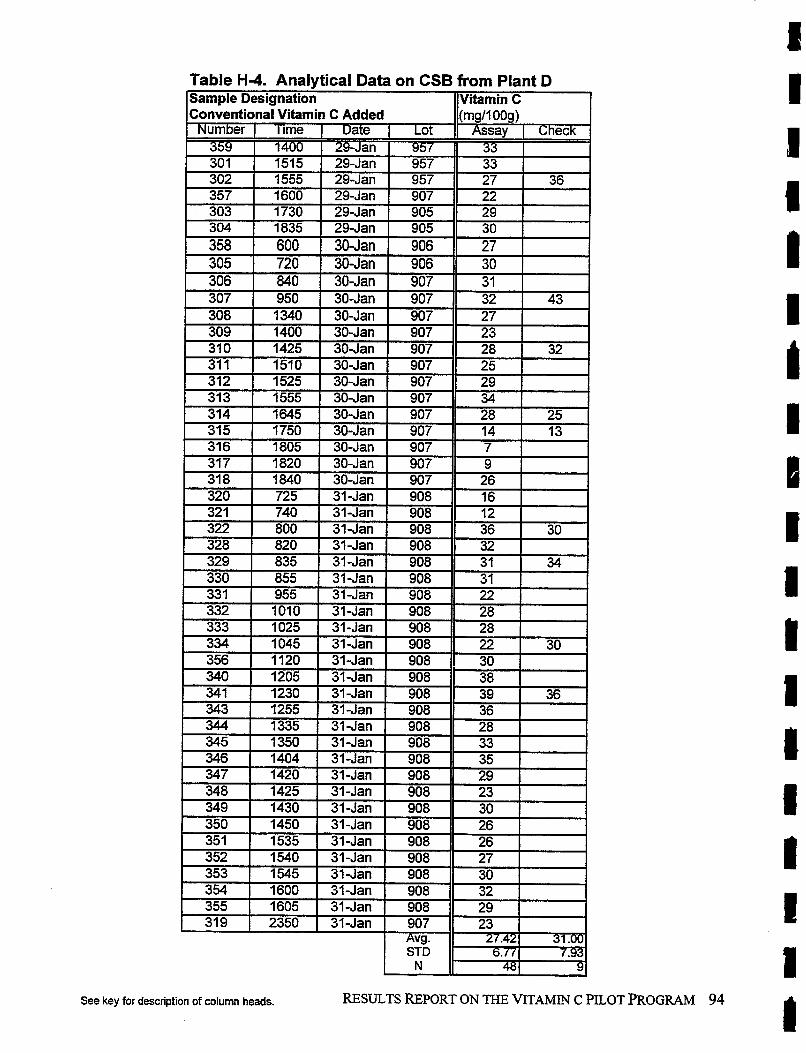
Table H-4. Analytical Data on CSB from Plant D [sample Designation (IViamin C I
See key for description of column heads. RESULTS REPORT ON THE VITAMIN C PILOT PROGRAM 94
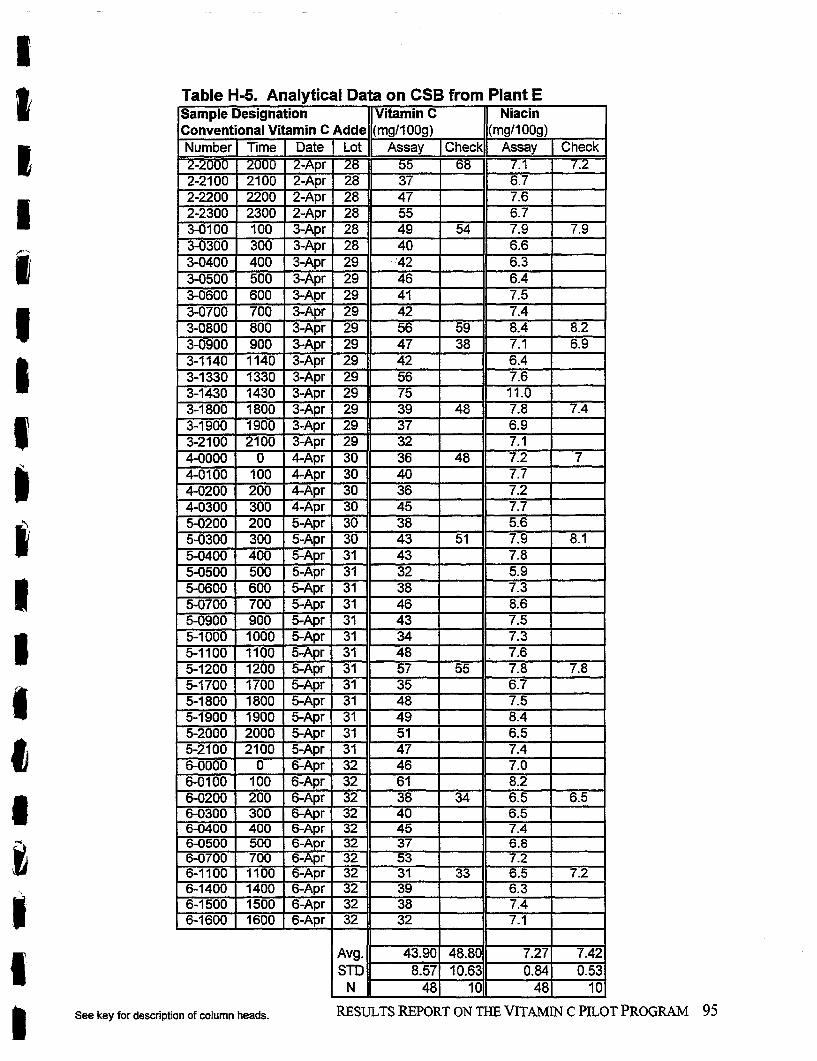
Table H-5. Analytical Data on CSB from Plant E
See key for description of column heads. RESULTS REPORT ON THE VITAMIN C PILOT PROGRAM 95
Key to Tables H-1 to H-5 in Appendix H. Analytical Data from on CSB/WSB Samples Taken from Plants A Through E
Column Head:
Assay: Nutrient content measured by the laboratory analysis
Sample Designation: Identification code of samples that can include lot number, sampling date, sampling time, etc.
High/Conventional Refers to the level of vitamin C added, either high vitamin C Vitamin C Added: content (90 mg/lOOg) or conventional content (40 mg/1 OOg)
Vitamin C (assay): Assay of the vitamin C content reported in mg per 100 grams of commodity
Vitamin C (assay check): Blind duplicate sample for assay vitamin C content
Niacin (assay): Assay of the niacin content reported in mg per 100 grams of commodity
Niacin (assay check): Blind duplicate sample for assay niacin content
Rerun: Assay of the rerun test on samples that were kept frozen at -20°C.
In Haiti: Assay of vitamin C content of samples collected in Haiti fiom the same bags sampled at production plant
Unnumbered bags Assay of vitamin C content of samples collected in Haiti fiom sampled in Haiti: bags not sampled during production
RESULTS REPORT ON THE VITAMIN C PILOT PROGRAM 96
Appendix I
Control Charts of Vitamin C Content in Samples Taken from Plants A Through E
RESULTS REPORT ON THE VITAMIN C PILOT PROGRAM 97
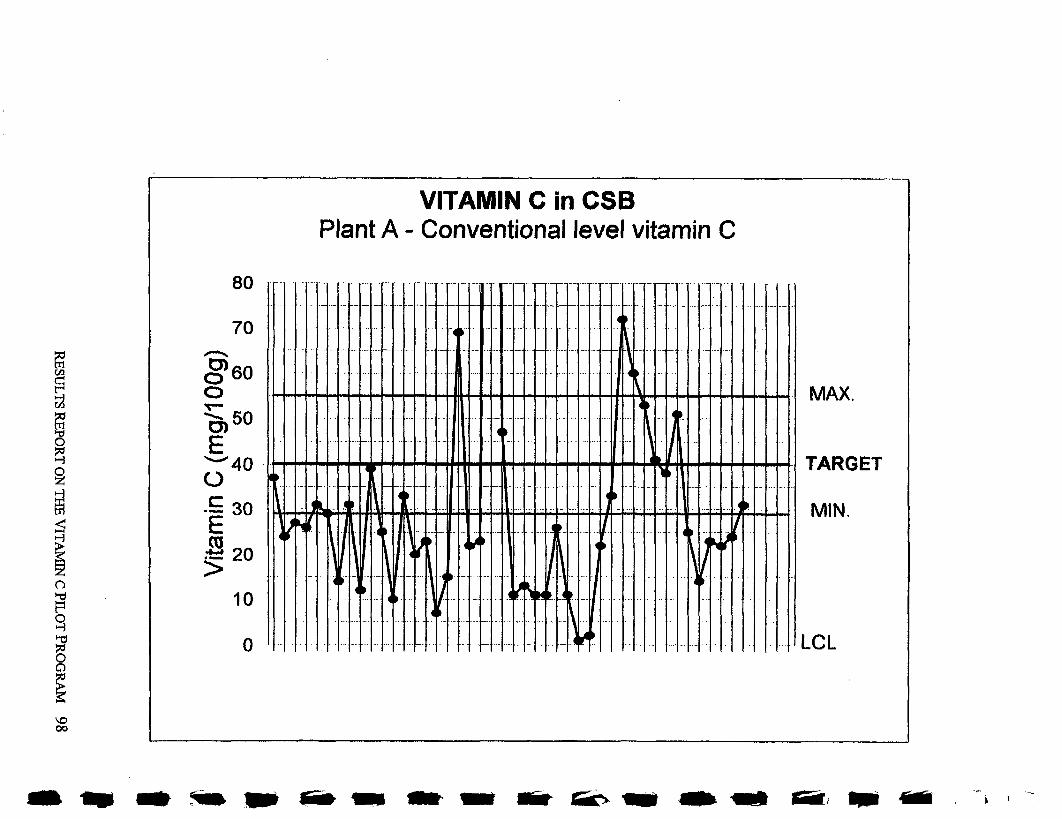
RESULTS RE
POR
T O
N THE V
ITA
MIN
C PIL
OT
PRO
GR
AM
98
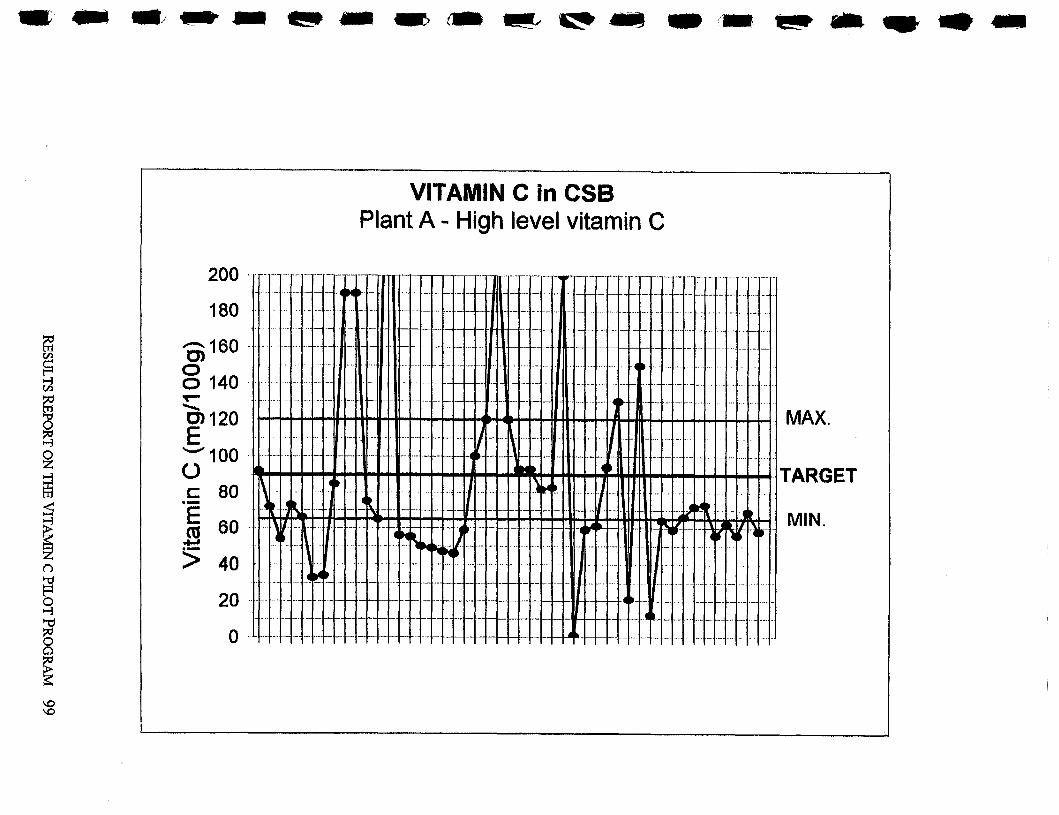
RESULTS REPO
RT O
N TH
E VITA
MIN
C PIL
OT
PROGRAM 99
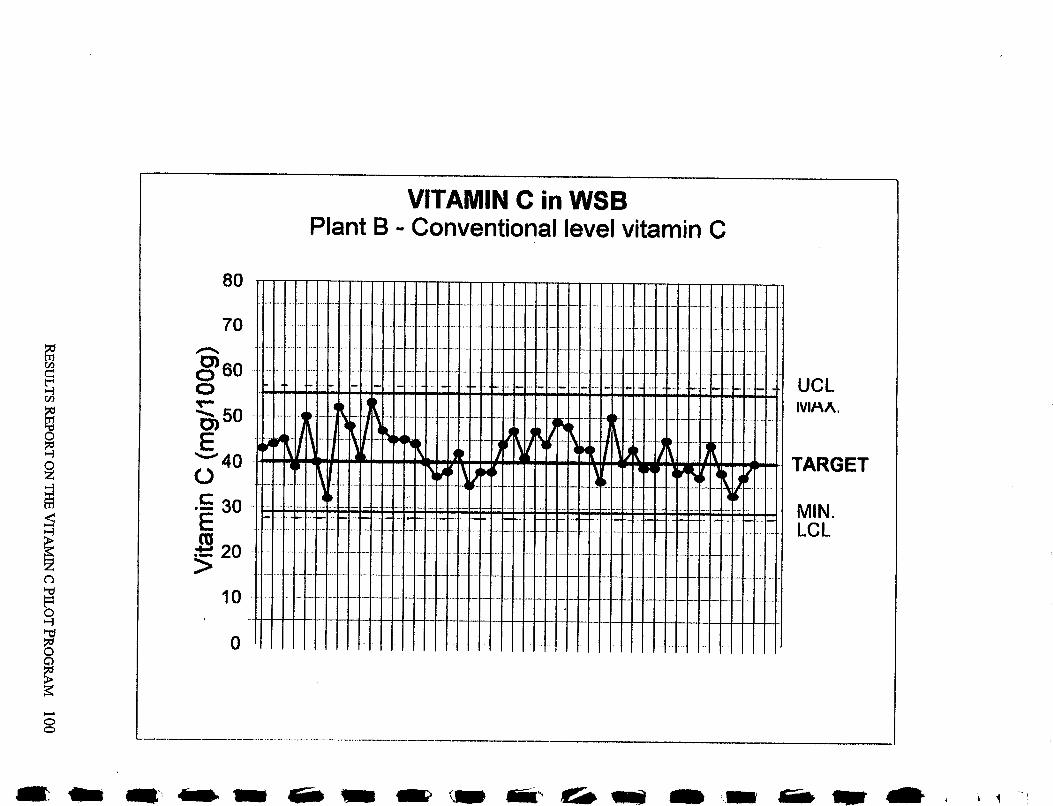
RE
SUL
TS R
EPO
RT
ON
THE VIT
AM
IN C
PILO
T PR
OG
RA
M 100
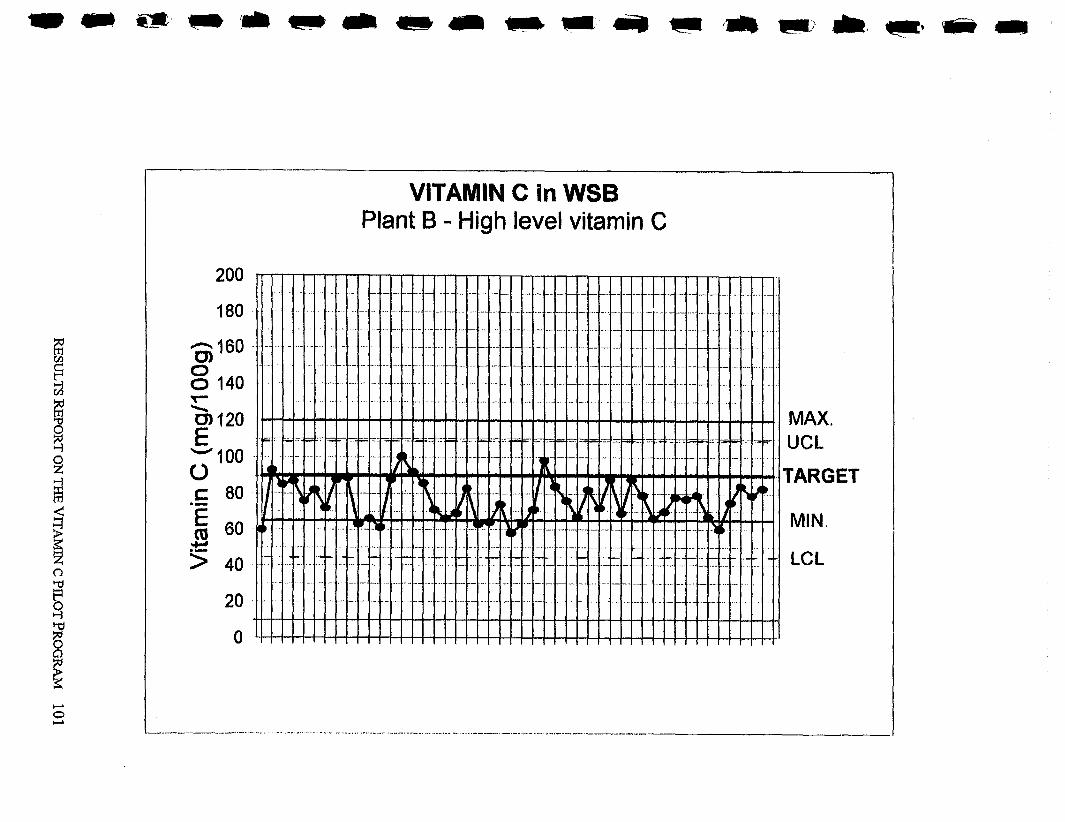
RE
SUL
TS R
EPO
RT
ON
THE V
ITA
MIN
C PIL
OT
PRO
GR
AM
101
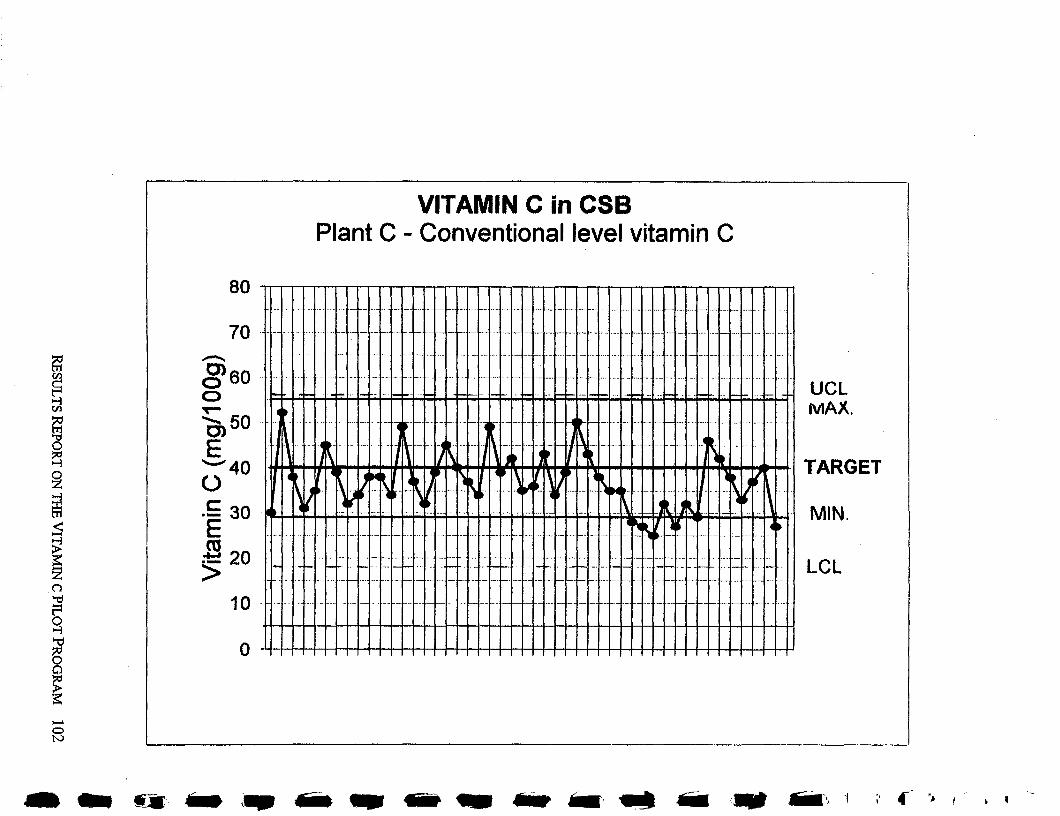
-
-
--
- -
RESU
LTS RE
POR
T ON THE V
ITA
MIN
C PIL
OT
PRO
GR
AM
102
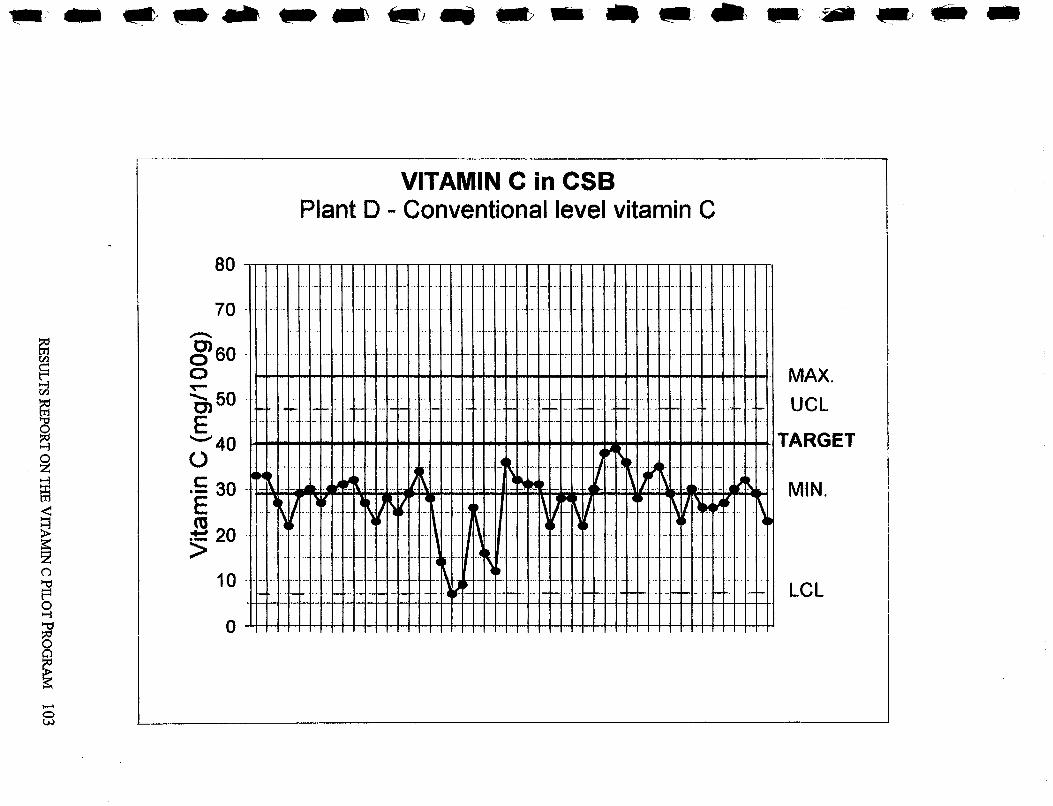
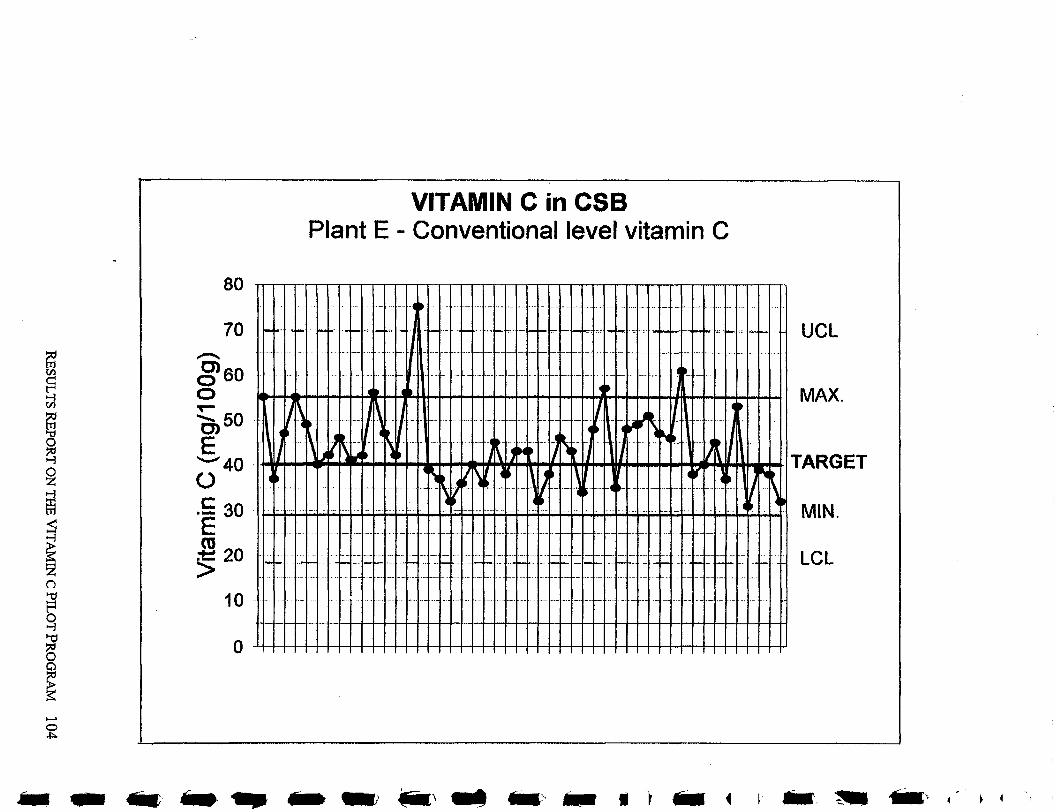
RESULTS RE
POR
T O
N TH
E VIT
AM
IN C
PILOT PRO
GR
AM
104
Key to Control Charts in Appendix I. Control Charts of Vitamin C Content in Samples Taken from Plants A Through E
Notes:
To facilitate understanding of the data, all the graphs were drawn to the same scale. As a consequence, certain data points lie outside of the boundaries of these graphs. . The x axis indicates the sampling period, with time in the sampling period running from left to right. The actual sampling time is on reported on the graph for lack of space.
Graph labels:
LCL: Lower Control Limit: 3 standard deviations from the mean of the vitamin C content during production
UCL : Upper Control Limit: 3 standard deviations from the mean of the vitamin C content during production
Min.: Arbitrary control specification limit for minimum vitamin C content during analysis of production run
Max.: Arbitrary control specification limit for maximum vitamin C content during analysis of production run
RESULTS REPORT ON THE VITAMIN C PILOT PROGRAM 105
Appendix J
Histogram Analysis of Vitamin C Content in Samples Taken from Plants A Through E
RESULTS REPORT ON THE VITAMIN C PILOT PROGRAM 107
J D P ~ V ~ Q U S paWe ~ ~ r ~ l m ~ r B
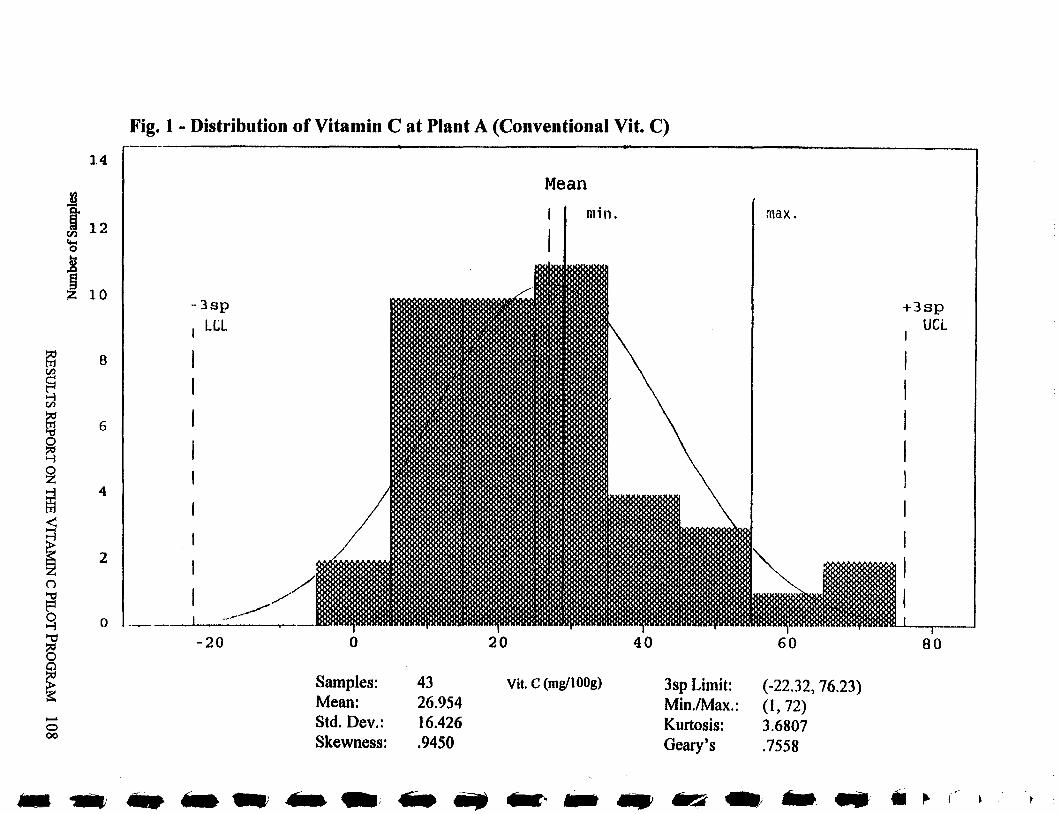
RE
SUL
TS R
EPO
RT
ON
THE V
ITA
MIN
C PIL
OT
PRO
GR
AM
108
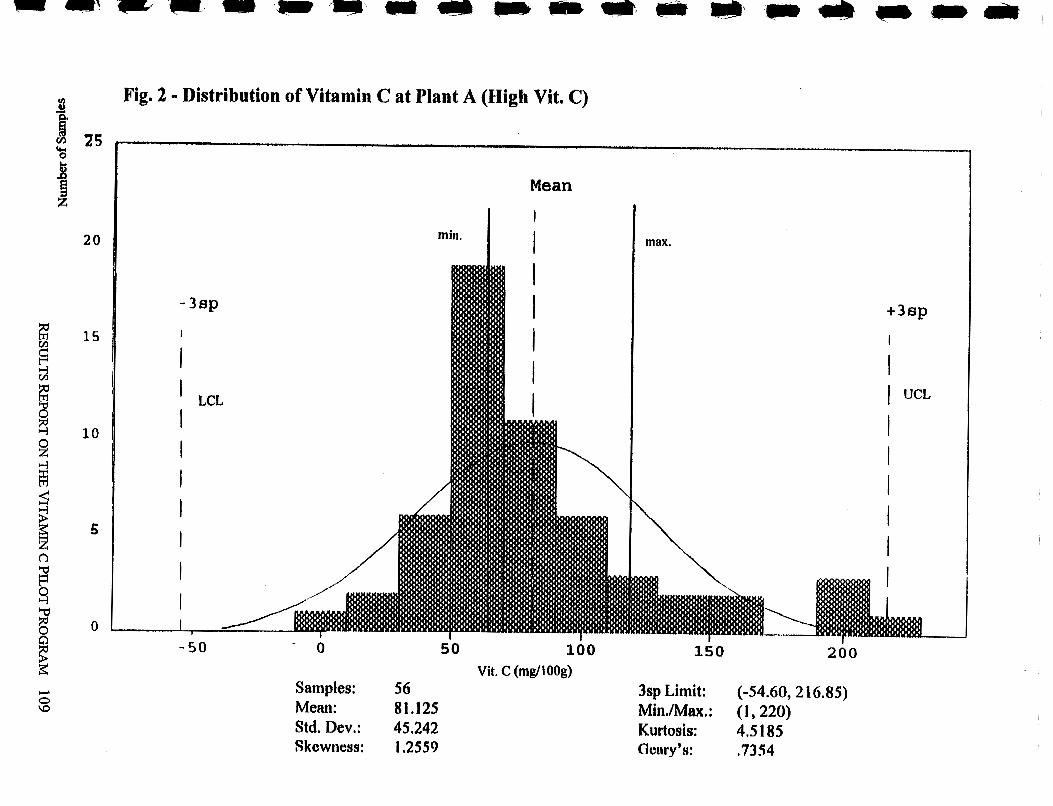
sa~
dm
g
$0 ~aq
um
N
RE
SUL
TS R
EPO
RT
ON
TH
E V
ITA
MIN
C PIL
OT
PROGRAM 109
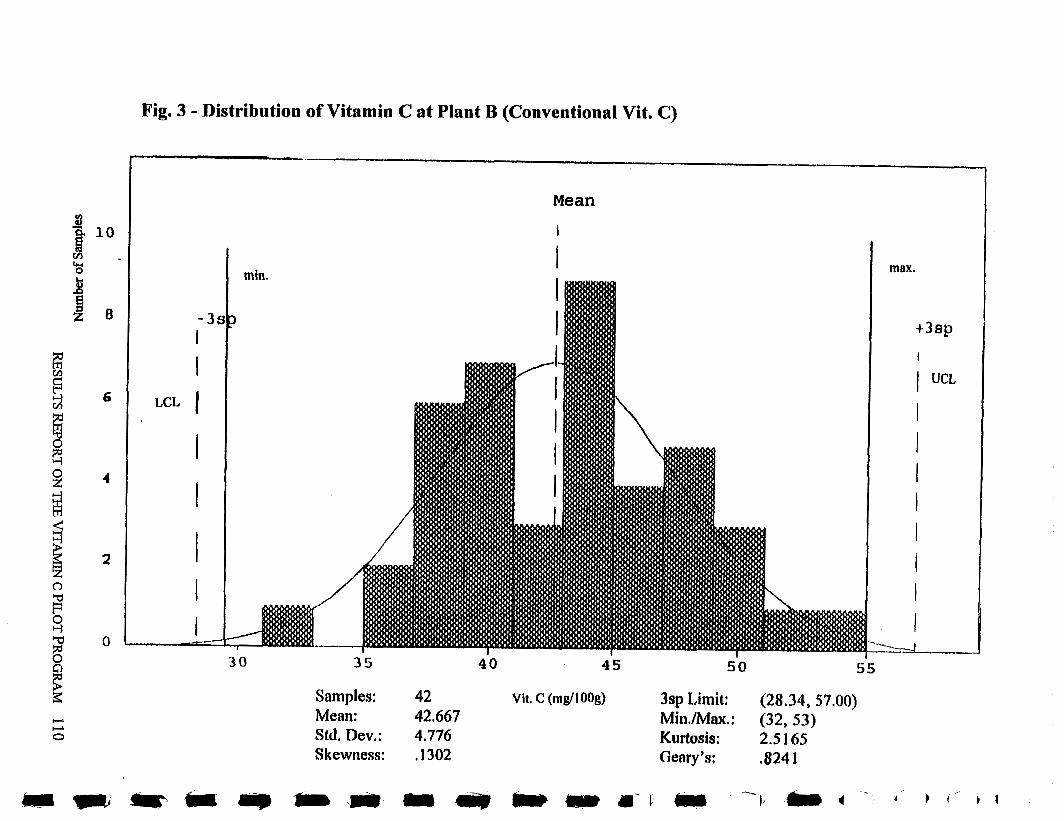
SI
~~
S
JO Jaqm
nN
RESULTS RE
POR
T ON TH
E VIT
AM
IN C PILO
T PRO
GR
AM
1 10
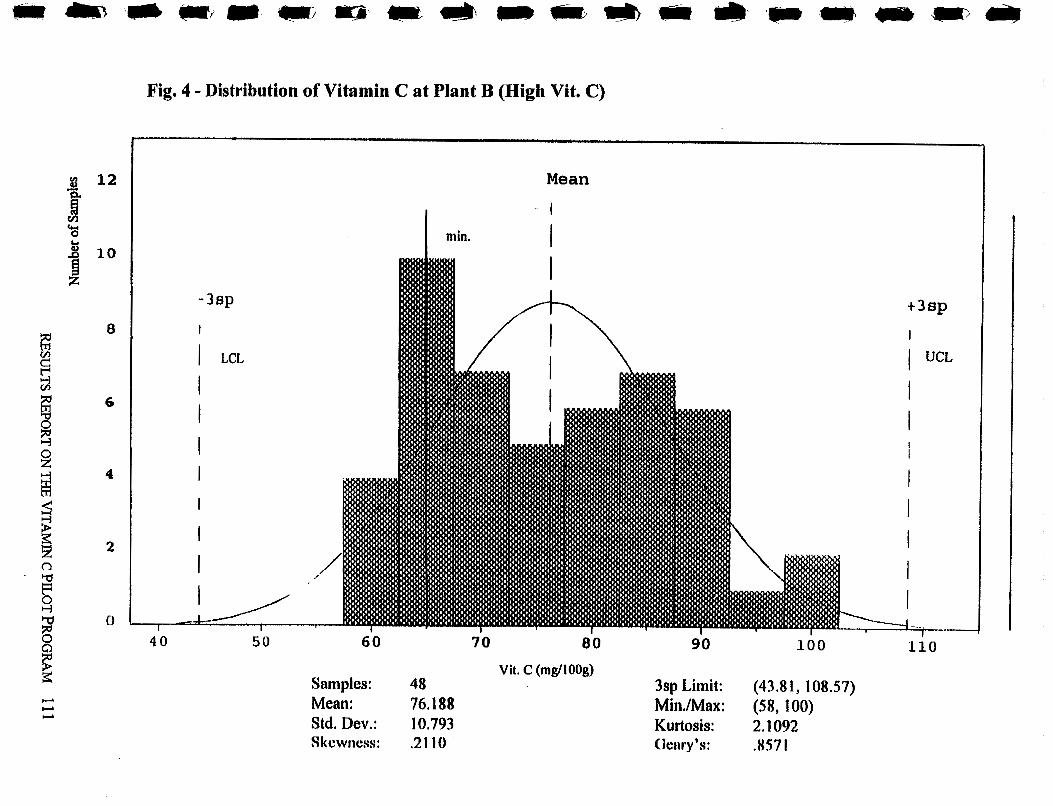
RESU
LTS REPO
RT O
N THE V
ITAM
IN C P
EO
T PR
OG
RA
M 1
1 1
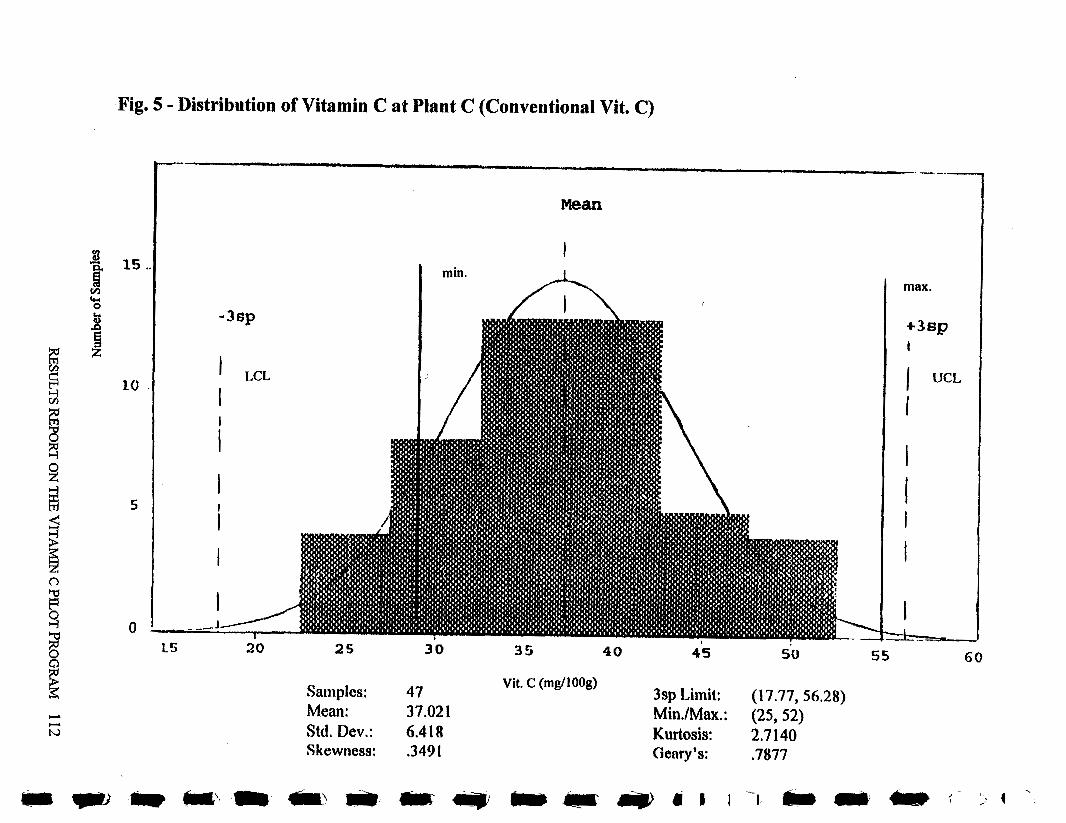
RE
SUL
TS R
EPO
RT
ON
THE V
ITA
MIN
C P
LO
T P
R(
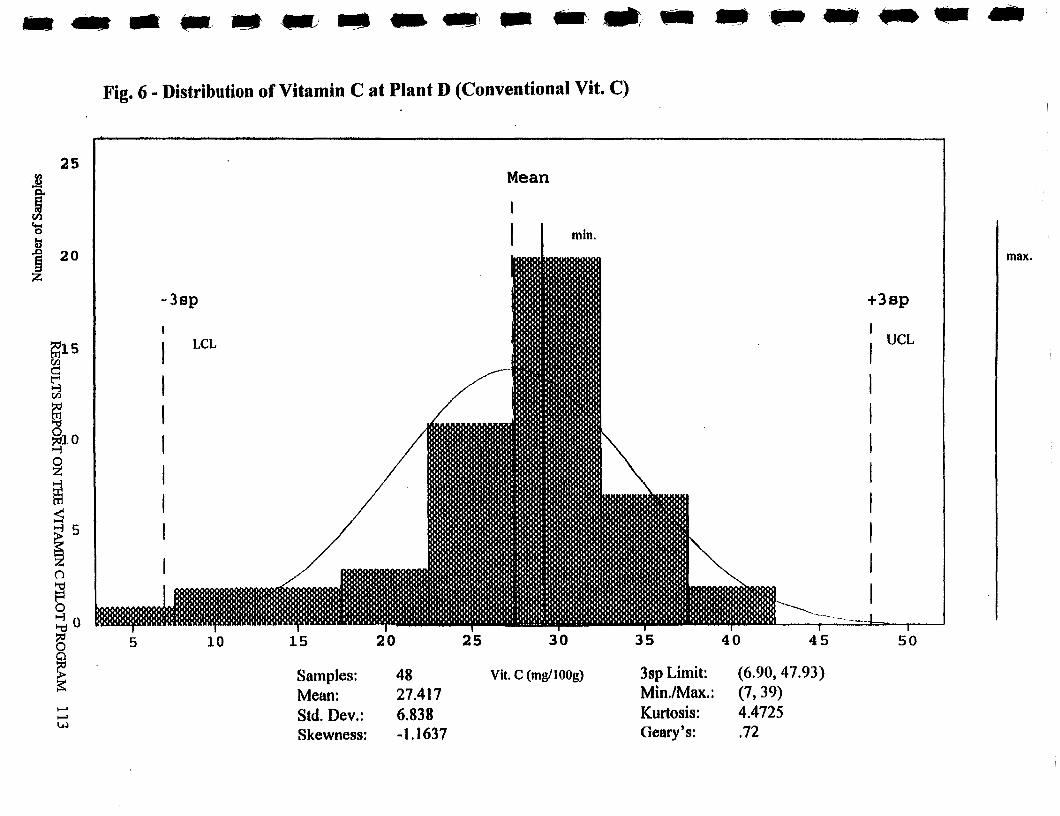
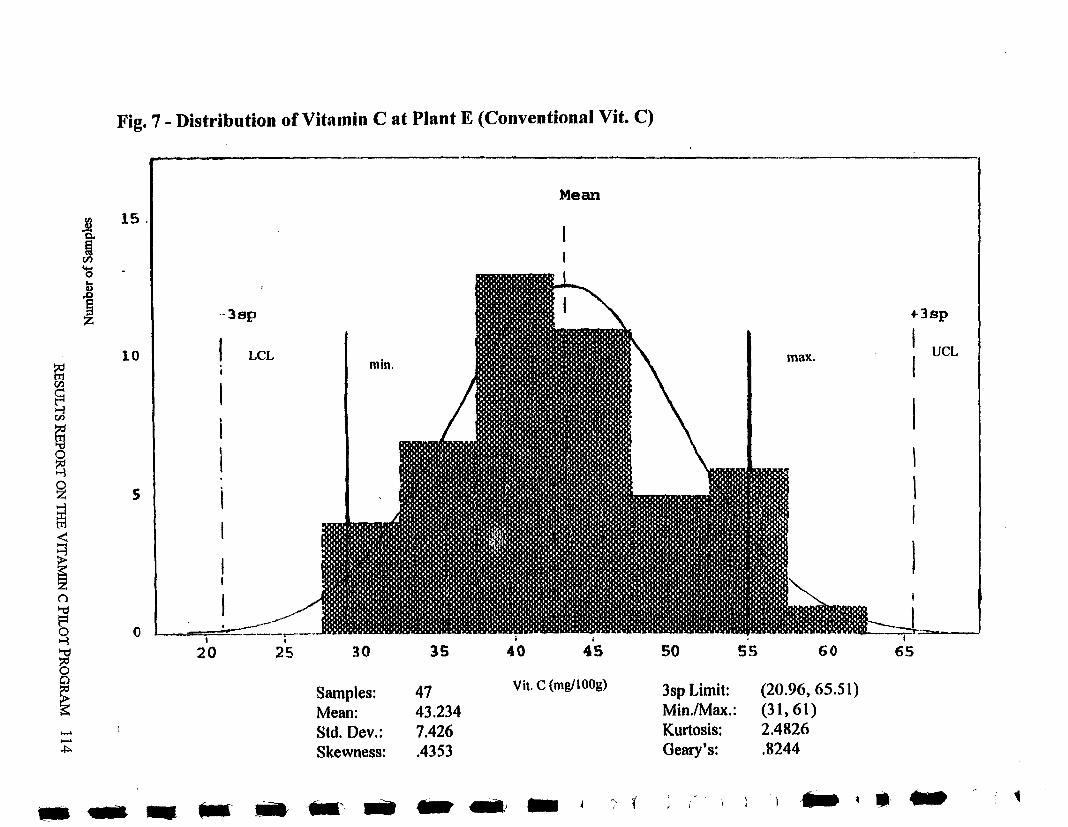
Fig. 7 - Distribution of Vitamin C at Plant E (Conventional Vit. C)
I LCL I
I I i
m 15. P) - t V)
I I
UCL
fi
Mean
I I
Samples: 47 vit. c (mJlOOg) 3sp Limit: (20.96,65.5 1 ) Mean: 43.234 Min./Max.: (3 1,6 1 ) Std. Dev.: 7.426 Skewness: .4353
Kurtosis: 2.4826 Geary 's: ,8244
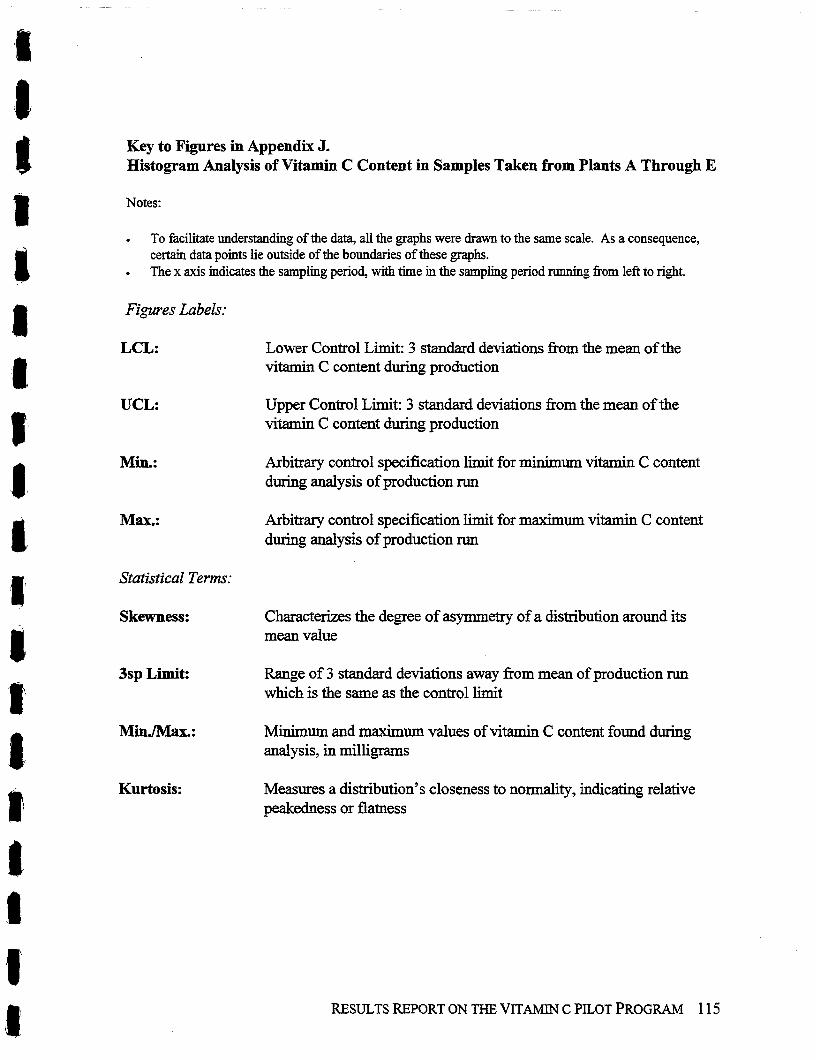
Key to Figures in Appendix J. Histogram Analysis of Vitamin C Content in Samples Taken from Plants A Through E
Notes:
. To facilitate understanding of the data, all the graphs were drawn to the same scale. As a consequence, certain data points lie outside of the boundaries of these graphs. . The x axis indicates the sampling period, with time in the sampling period running from left to right.
Figures Labels:
LCL:
UCL:
Lower Control Limit: 3 standard deviations fiom the mean of the vi- C content during production
Upper Control Limit: 3 standard deviations fiom the mean of the vitamin C content during production
Arbitrary control specification limit for minimum vitamin C content during analysis of production run
Max.: Arbitrary control specification limit for maximum vitamin C content during analysis of production run
Statistical Term:
Skewness: Characterizes the degree of asymmetry of a distribution around its mean value
3sp Limit: Range of 3 standard deviations away from mean of production run which is the same as the control limit
MinJMax.: Minimum and maximum values of vitamin C content found during analysis, in milligrams
Kurtosis: Measures a distribution's closeness to normality, indicating relative peakedness or flatness
RESULTS REPORT ON THE VITAMIN C PILOT PROGRAM 1 15
a
1
f
I 4
0 REPORT ON THE VITAMIN C PILOT PROGRAM 1 17 ptpTFTp g& &$) cTr3c &. 3b~w kv4 -, rib
d
Appendix K
Letter to USAID (Specifications for a special production of CSB with
high vitamin C level)
SUSTAIN Peter Ranum 50 Amberwood, Grand Island, NY 14072 Phone: (71 6) 773-4742 fax: 775-1 037 e-mail: [email protected]
Subject: Vitamin C specification on special high vitamin C Corn Soy Blend procurement
Date: April 07, 1997
To: Jon Brause, BHRlFFP
From: Peter Ranum, SUSTAIN
cc: Tom Marchione, BHR/PPE Sam Kahn, G/PHN/HN Liz Turner, SUSTAIN Franqoise Chome, SUSTAIN
Following are the proposed additional specifications on a special procurement of Corn Soy Blend with the higher level of vitamin C:
Packaging: The procurement is to show a blue colored diamond in place of the normally red colored diamond.
Analytical: A minimum of 24 samples of the product will be collect roughly evenly over the production run. In order for the production to be acceptable, the mean vitamin C (ascorbic acid ) content of these 24 samples must fall within 10% of the 90 mg1100g target, or within a range of 8 1-99 mg/1 OOg, and one standard deviation on this group of samples must be no greater than 20% of the mean.
RESULTS REPORT ON THE VITAMIN C PILOT PROGRAM 1 18
Appendix L
Analytical Data on CSBfWSB Samples Taken from Haiti and India
RESULTS REPORT ON THE VITAMIN C PILOT PROGRAM 1 19
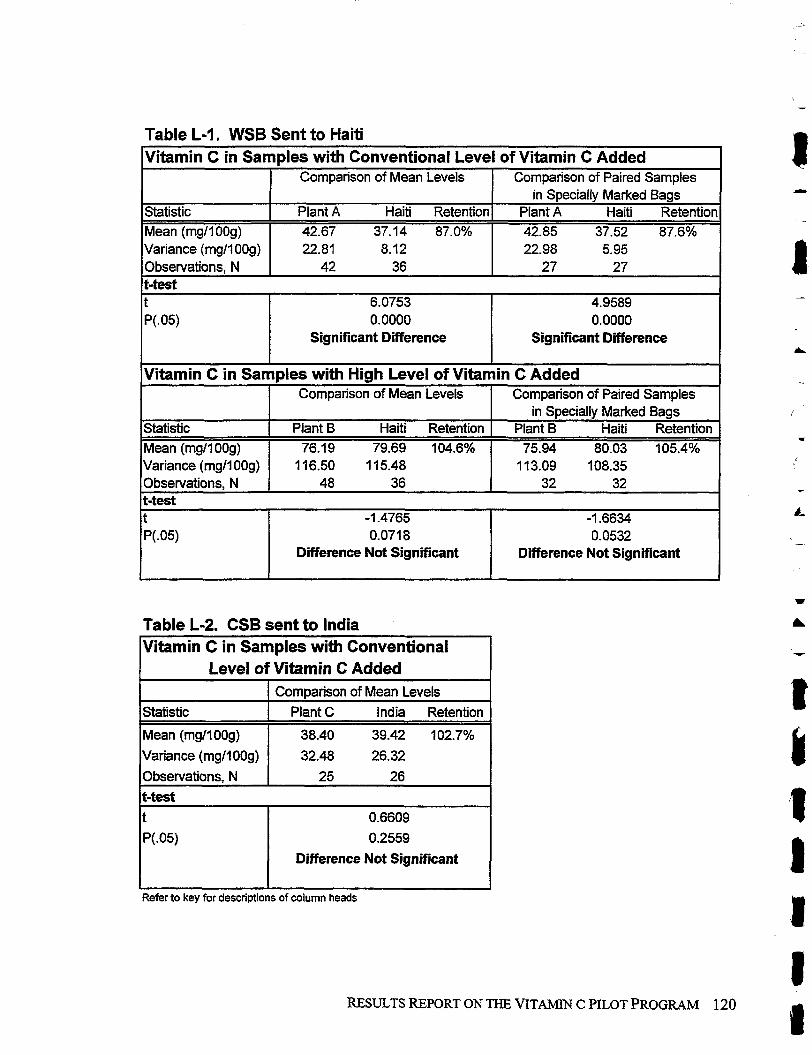
Table L-I. WSB Sent to Haiti
Table L-2. CSB sent to lndia
Vitamin C in Samples with Conventional Level of Vitamin C Added
[vitamin C in Samples with Conventional
Statistic Mean (mgM 00g) Variance (mgIl00g) Observations, N
I t-test
Comparison of Mean Levels
Plant A Haiti Retention
42.67 37.14 87.0% 22.81 8.12
42 36
Level of Vitamin C Added
0.6609
0.2559
Difference Not Significant
Comparison of Paired Samples in Specially Marked Bags
Plant A Haiti Retention 42.85 37.52 87.6% 22.98 5.95
27 27 t-test
Statistic
Mean (mg1100g)
Variance (mgll00g)
I
Refer to key for descriptions of column heads
t P(.05)
Comparison of Mean Levels
Plant C India Retention
38.40 39.42 102.7%
32.48 26.32
RESULTS REPORT ON THE VITAMM C PILOT PROGRAM 120 J
6.0753 0.0000
Significant Difference
4.9589 0.0000
Significant Difference
Vitamin C in Samples with High Level of Vitamin C Added
Statistic Mean (mg1100g) Variance (mg1100g) Observations, N
Comparison of Mean Levels
Plant B Haiti Retention 76.19 79.69 104.6%
1 16.50 1 15.48 48 36
Comparison of Paired Samples in Specially Marked Bags
Plant B Haiti Retention 75.94 80.03 105.4%
1 13.09 108.35 32 32
t-test t P(.05)
-1 -4765 0.071 8
Difference Not Significant
-1.6634 0.0532
Difference Not Significant
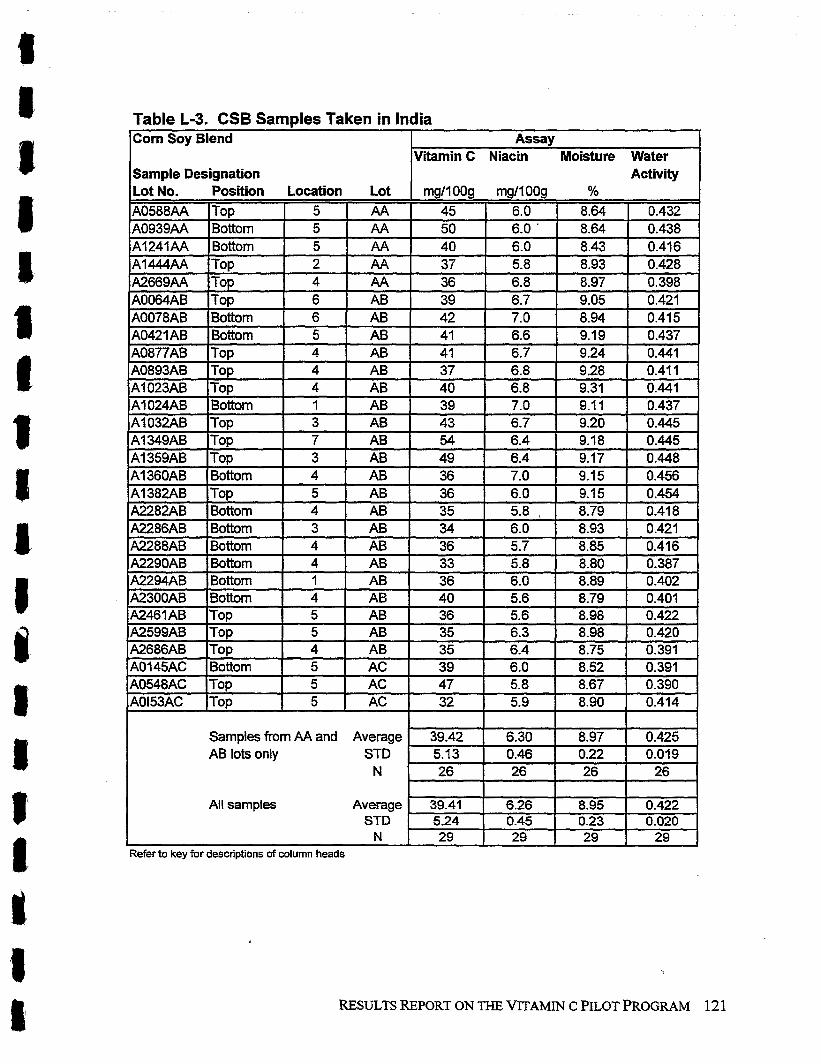
Isample Designation I Activity I
Table L-3. CSB Samples Taken in India Corn Soy Blend
Refer to key for descriptions of column heads
Assay Vitamin C Niacin Moisture Water
A0153AC ITop I 5 32 5.9 8.90 0.414
RESULTS REPORT ON THE VITAMIN C PILOT PROGRAM 12 1
Samples from AA and Average AB lots only STD
N
All samples Average STD
N
39.42 5.13 26
39.41 5.24 29
6.30 0.46 26
6.26 0.45 29
8.97 0.22 26
8.95 0.23 29
0.425 0.019
26
0.422 0.020
29
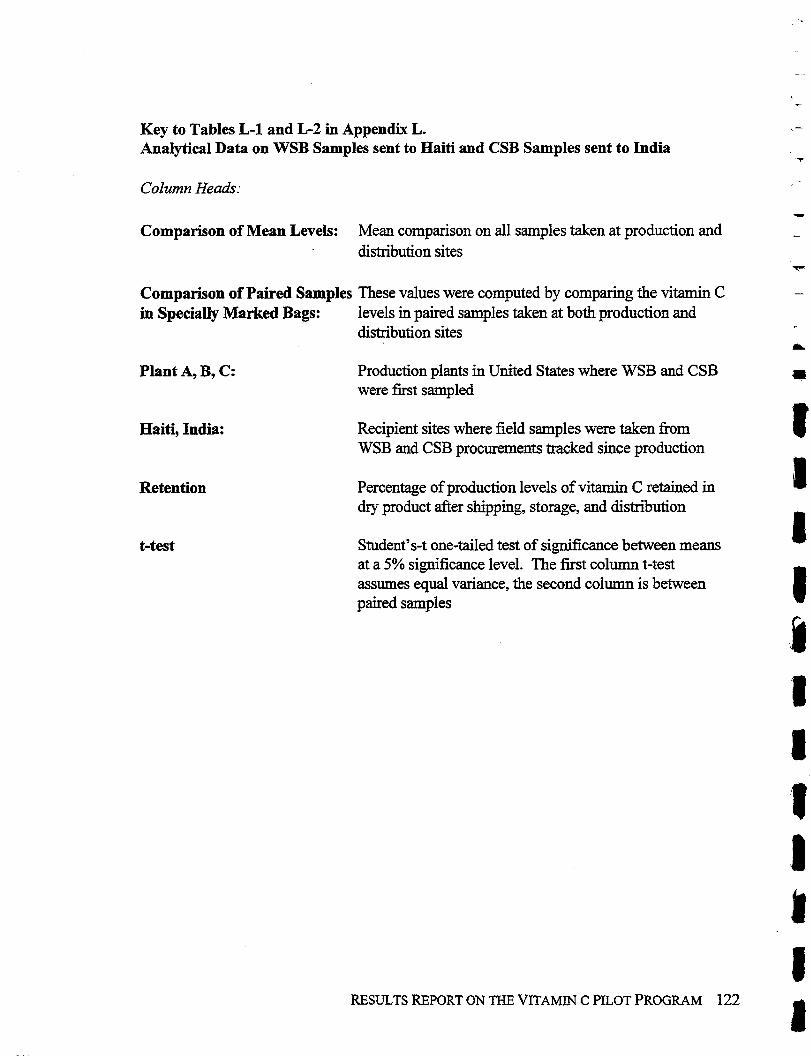
Key to Tables L-1 and L-2 in Appendix L. Analytical Data on WSB Samples sent to Haiti and CSB Samples sent to India
Column Heads:
Comparison of Mean Levels: Mean comparison on all samples taken at production and distribution sites
Comparison of Paired Samples These values were computed by comparing the vitamin C in Specially Marked Bags: levels in paired samples taken at both production and
distribution sites
Plant A, B, C:
Haiti, India:
Retention
t-test
Production plants in United States where WSB and CSB were first sampled
Recipient sites where field samples were taken fiom WSB and CSB procurements tracked since production
Percentage of production levels of vitamin C retained in dry product after shipping, storage, and distribution
Student's-t one-tailed test of significance between means at a 5% significance level. The first column t-test assumes equal variance, the second column is between paired samples
RESULTS REPORT ON THE VITAMIN C PILOT PROGRAM 122 I
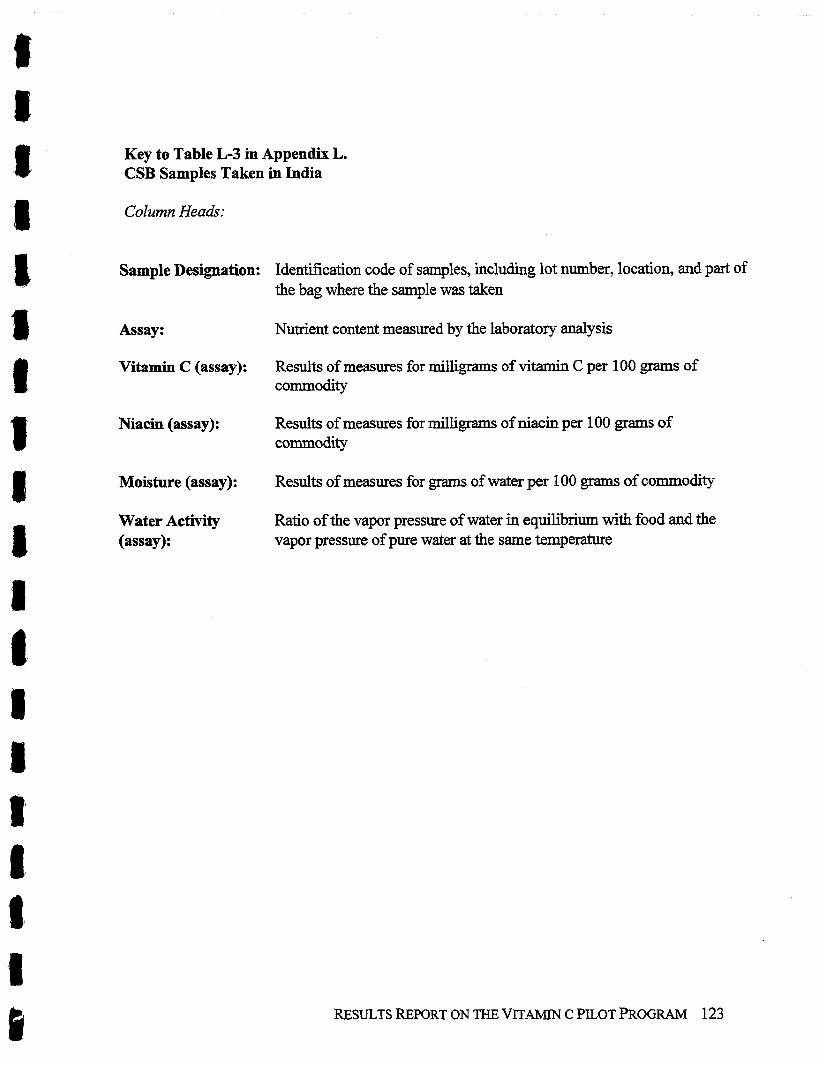
Key to Table L-3 in Appendix L. CSB Samples Taken in India
Column Heads:
Sample Designation: Identification code of samples, including lot number, location, and part of the bag where the sample was taken
Assay: Nutrient content measured by the laboratory analysis
Vitamin C (assay): Results of measures for milligrams of vitamin C per 100 grams of commodity
Niacin (assay): Results of measures for milligrams of niacin per 100 grams of commodity
Moisture (assay): Results of measures for grams of water per 100 grams of commodity
Water Activity Ratio of the vapor pressure of water in equilibrium with food and the (assay): vapor pressure of pure water at the same temperature
RESULTS REPORT ON THE VITAMIN C PILOT PROGRAM 123
Appendix M
Within-Bag Variability at Distribution Point
RESULTS REPORT ON THE VITAMIN C PILOT PROGRAM 125 fl{!Tll, .p @
A. d ~ ? ' ~ ~ Q r ~ ~ PQ4~yn TqJfpla41Jj8
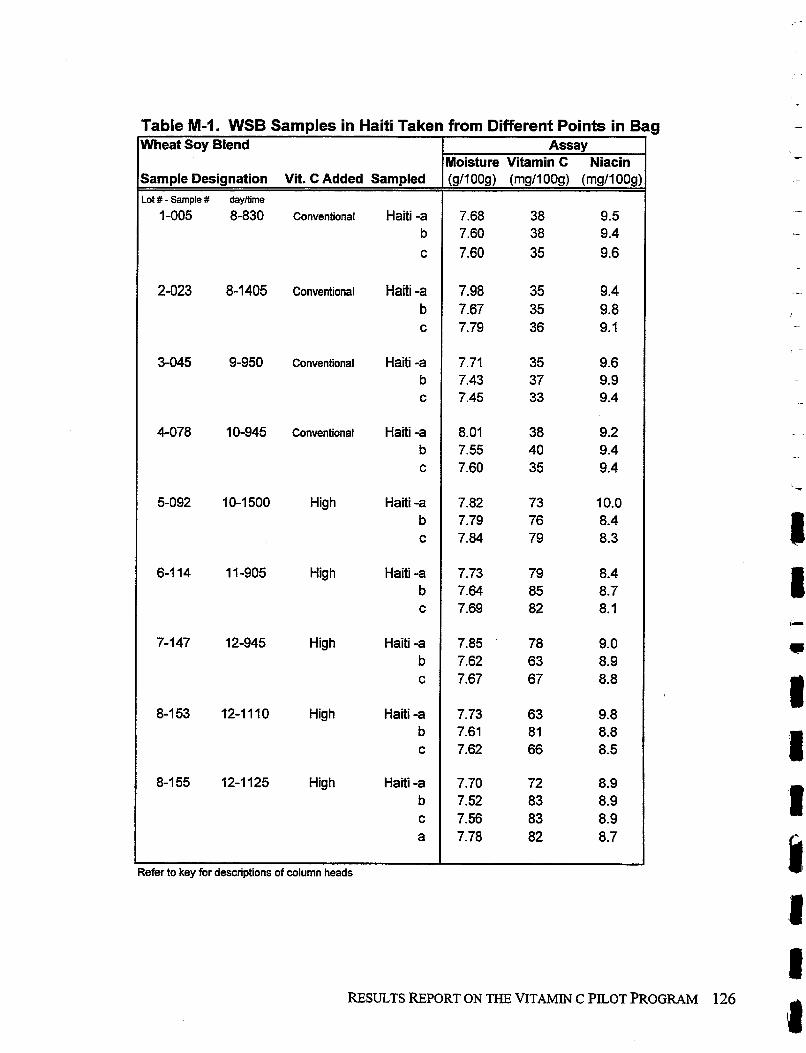
2-023 8-1405 Conventional Haiti -a b
Table M-I. WSB Samples in Haiti Taken from Different Points in B
3-045 9-950 Conventional Haiti -a b C
Wheat Soy Blend
Sample Designation Vit. C Added Sampled Lot # - Sample # dayfime
1-005 8-830 conventional Haiti -a b c
4-078 10-945 Conventional Haiti -a b C
Assay Moisture Vitamin C Niacin (911 009) (rngI100g) (rng/100g)
7.68 38 9.5 7.60 38 9.4 7.60 35 9.6
5-092 10-1 500 High Haiti -a b
6-1 14 1 1-905 High Haiti -a b C
7-1 47 12-945 High Haiti -a b
8-153 12-1110 High Haiti -a b C
8-1 55 12-1 125 High Haiti -a b C
Refer to key for descriptions of column heads
RESULTS REPORT ON THE VITAMIN C PILOT PROGRAM 126
J
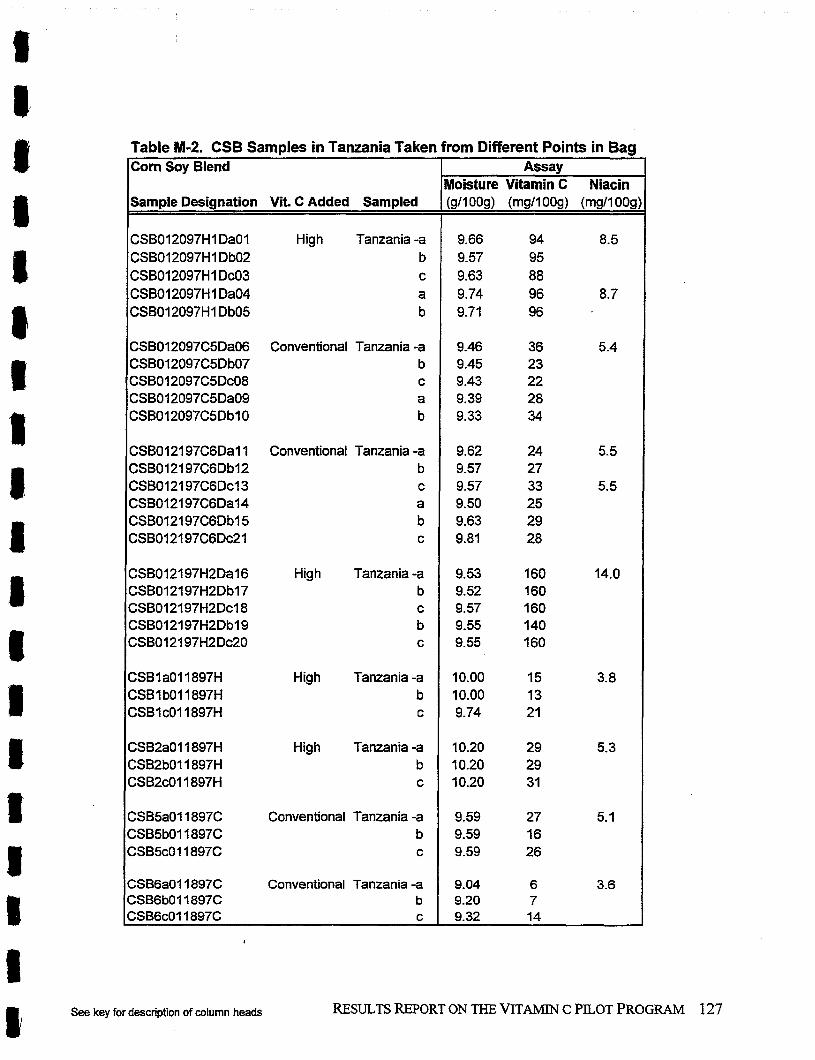
CSB012097Hl Da01 High Tanzania -a CSB012097Hl Db02 b CSB012097H 1 Dc03 c CSB012097Hl Da04 a CSB012097Hl Db05 b
Table M-2. CSB Samples in Tanzania Taken from Different Points in Bag
CSB012097C5Da06 Conventional Tanzania -a CSB012097C5Db07 b CSB012097C5Dc08 c CSB012097C5Da09 a CSB012097C5Db10 b
Corn Soy Blend
Sample Designation Vit. C Added Sampled
CSBO12197C6Dal1 Conventional Tanzania -a CSB012197C6Db12 b CSB012197C6DcI 3 c CSB012197C6Da14 a CSB012197C6Db15 b CSB012197C6Dc21 c
Assay Moisture Vitamin C Niacin (911 009) (mgl100g) (mg/I 00g)
CSB012197H2Da16 High Tanzania -a CSB012197H2Dbl7 b CSB012197H2DcI 8 c CSB012197H2Db19 b CSB012197H2Dc20 c
CSBla011897H High Tanzania -a CSBl b011897H b CSBl c011897H c
CSB2a011897H High Tanzania -a CSB2b011897H b CSB2c011897H c
C S B ~ ~ O I 1897C Conventional Tanzania -a CSB5b011897C b CSB5c011897C c
CSB6a011897C Conventional Tanzania -a CSB6b0 1 1897C b CSB6c011897C c
See key for description of column heads RESULTS REPORT ON THE VITAMM C PILOT PROGRAM 127
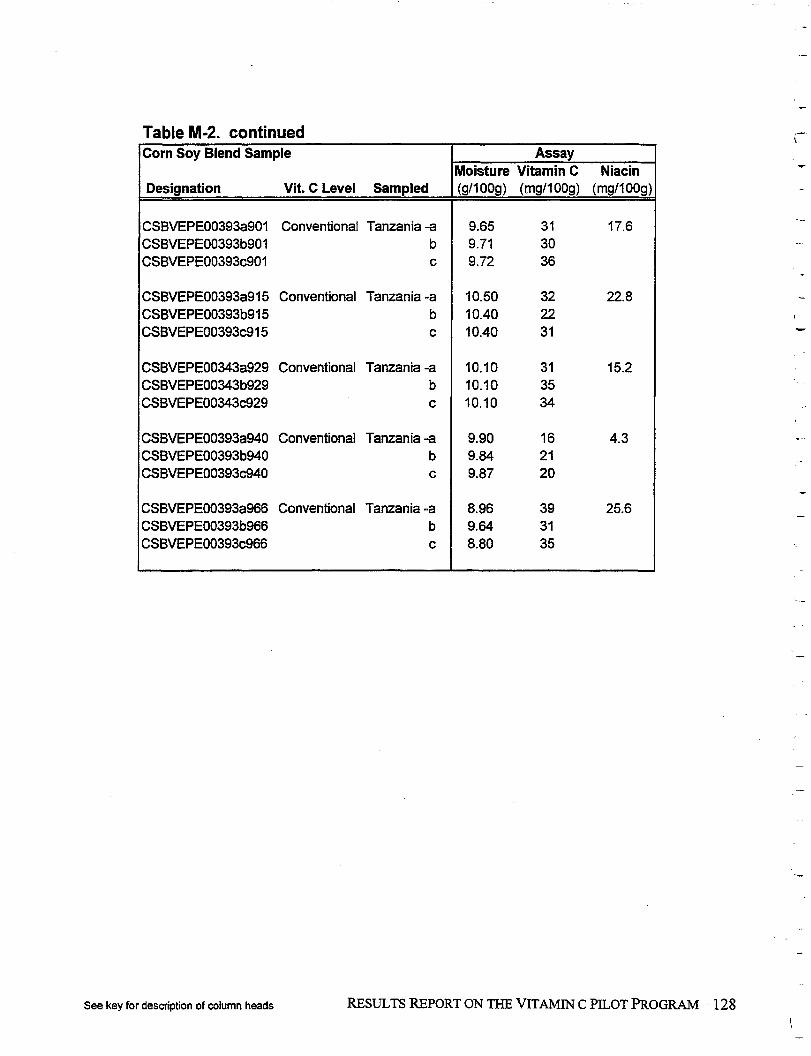
Table M-2. continued
See key for description of column heads RESULTS REPORT ON THE VITAMIN C PILOT PROGRAM 128
Corn Soy Blend Sample
Designation Vit. C Level Sampled
CSBVEPE00393a901 Conventional Tanzania -a CSBVEPE00393b901 b CSBVEPE00393c901 c
CSBVEPE00393a915 Conventional Tanzania -a CSBVEPE00393b915 b CSBVEPE00393c915 c
CSBVEPE00343a929 Conventional Tanzania -a CSBVEPE00343b929 b CSBVEPE00343c929 c
CSBVEPE00393a940 Conventional Tanzania -a CSBVEPE00393b940 b CSBVEPE00393c940 c
CSBVEPE00393a966 Conventional Tanzania -a CSBVEPE00393b966 b CSBVEPE00393c966 c
Assay Moisture Vitamin C Niacin (gt100g) (mgt100g) (mgt100g)
9.65 31 17.6 9.71 30 9.72 36
10.50 32 22.8 10.40 22 10.40 31
10.10 31 15.2 10.10 35 10.10 34
9.90 16 4.3 9.84 21 9.87 20
8.96 39 25.6 9.64 31 8.80 35
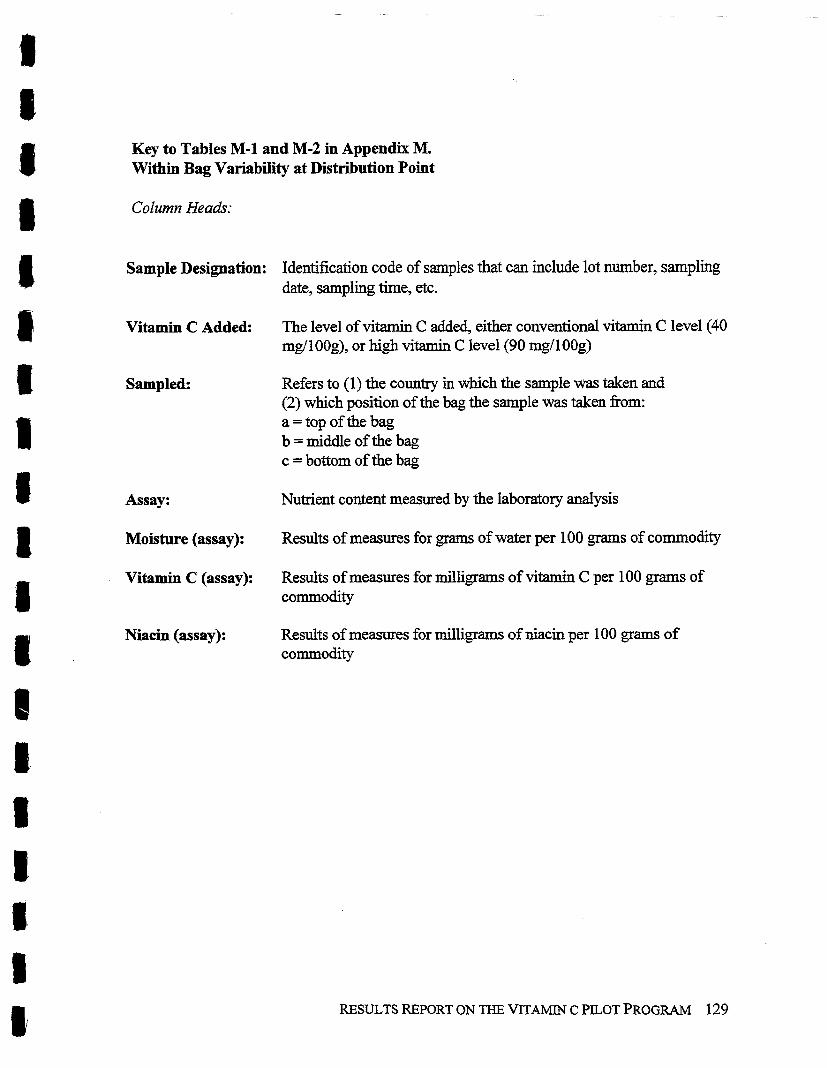
Key to Tables M-1 and M-2 in Appendix M. Within Bag Variability at Distribution Point
Column Heads:
Sample Designation: Identification code of samples that can include lot number, sampling date, sampling time, etc.
Vitamin C Added: The level of vitamin C added, either conventional vitamin C level (40 mg/100g), or high vitamin C level (90 mg1100g)
Sampled: Refers to (1) the country in which the sample was taken and (2) which position of the bag the sample was taken from: a = top of the bag b = middle of the bag c = bottom of the bag
Assay: Nutrient content measured by the laboratory analysis
Moisture (assay): Results of measures for grams of water per 100 grams of commodity
Vitamin C (assay): Results of measures for milligrams of vitamin C per 100 grams of commodity
Niacin (assay): Results of measures for milligrams of niacin per 100 grams of commodity
RESULTS REPORT ON THE VITAMIN C PILOT PROGRAM 129
Appendix N
Analytical Data on Cooked CSB/WSB Samples Taken from Haiti and Tanzania
C RESULTS REPORT ON THE VITAMIN C PILOT PROGRAM 13 1
83 ~ ~ ~ ; ~ ~ ~ : : ~ ~ : u g ~ j ~ q y q pwflbq T?aJnmE; ..,,~. .",
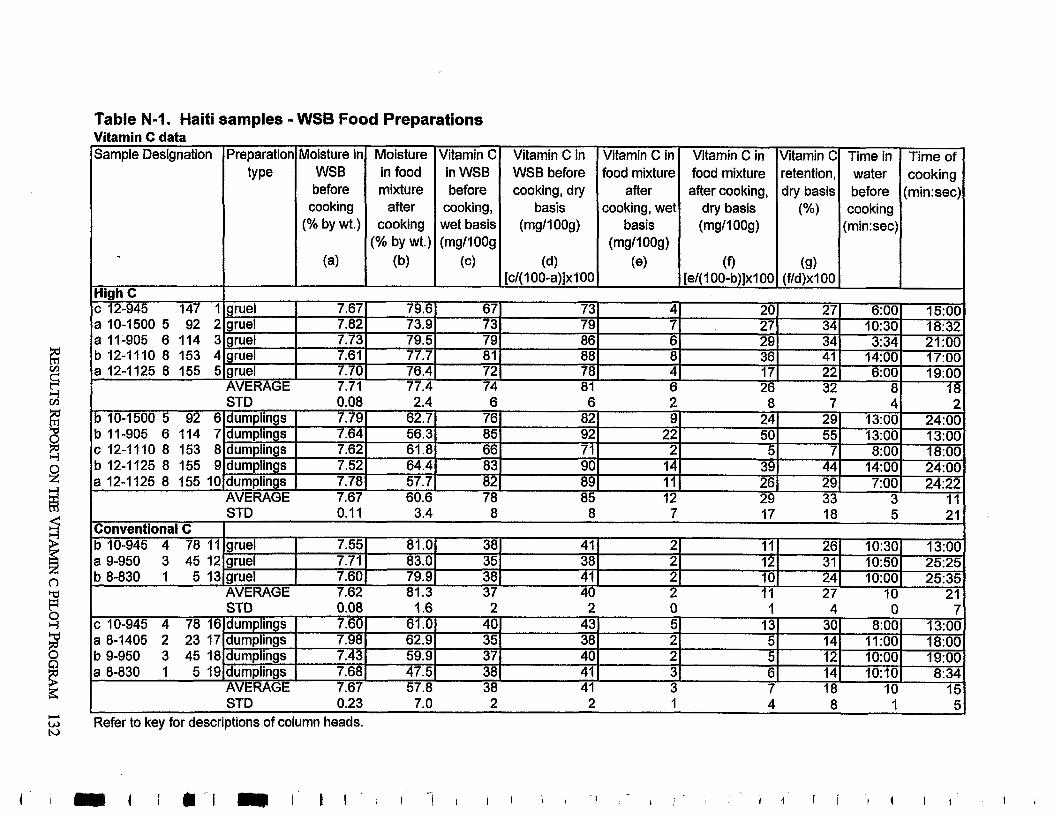
Table N-I. Haiti : Vitamin C data sample Designation
High C ic12-945 147 1
Conventional C b 10-945 4 78 11 a 9-950 3 45 12 b 8-830 I 5 13
ramples - WSB Food Prepa~
Preparation Moisture in Moisture tY Pe WSB in food
before mixture cooking after
(% by wt.) cooking (% by wt.)
(a) (b)
gruel gruel
7.73 gruel 7.61 77.7
7.70 76.4 AVERAGE 7.71 77.4 STD 0.08 2.4
AVERAGE 7.67 60.6
ations
Vitamin C in WSB before
cooking, wet basis (mgIl00g
(c)
Vitamin C in Vitamin C in Vitamin C in WSB before food mixture food mixture cooking, dry after after cooking,
basis cooking, wet dry basis (mgll OOg) basis (mg/l OOg)
(mg/l OOg) (dl (el (9
[c/(l 00-a)]xl 00 [e/(l00-b)]xl00
Vitamin C Time in Time of retention, water cooking dry basis before (min:sec)
(%) cooking (min:sec)
STD 0.11 3.4 8 8 7 17 18 5 21
- - Refer to key for descriptions of column heads.
gruel gruel gruel
-
ST0 0.08 1.6 2 2 0 1 4 0 7 c 10-945 4 78 16 a 8-1405 2 23 17 b 9-950 3 45 18 a 8-830 1 5 19
AVERAGE 7.62 81.3 37 40 2 11 27 10 2 1
7.55 7.71 7.60
AVERAGE 7.67 57.8 38 41 3 7 18 I 0 15 STD 0.23 7.0 2 2 1 4 8 1 fi
dumplings dumplings dumplings dumplings
81 .O 83.0 79.9
7.60 7.98 7.43 7.68
38 35 38
61 .O 62.9 59.9 47.5
4 1 38 4 1
40 35 37 38
2 2 2
43 38 40 4 1
11 12 10
5 2 2 3
26 31 24
13 5 5 6
10:30 1050 1O:OO
13:OO 25:25 25:35
30 14 12 14
8:OO 11:OO 1O:OO 1O:lO
13:OO 18:OO 19:OO 8:34
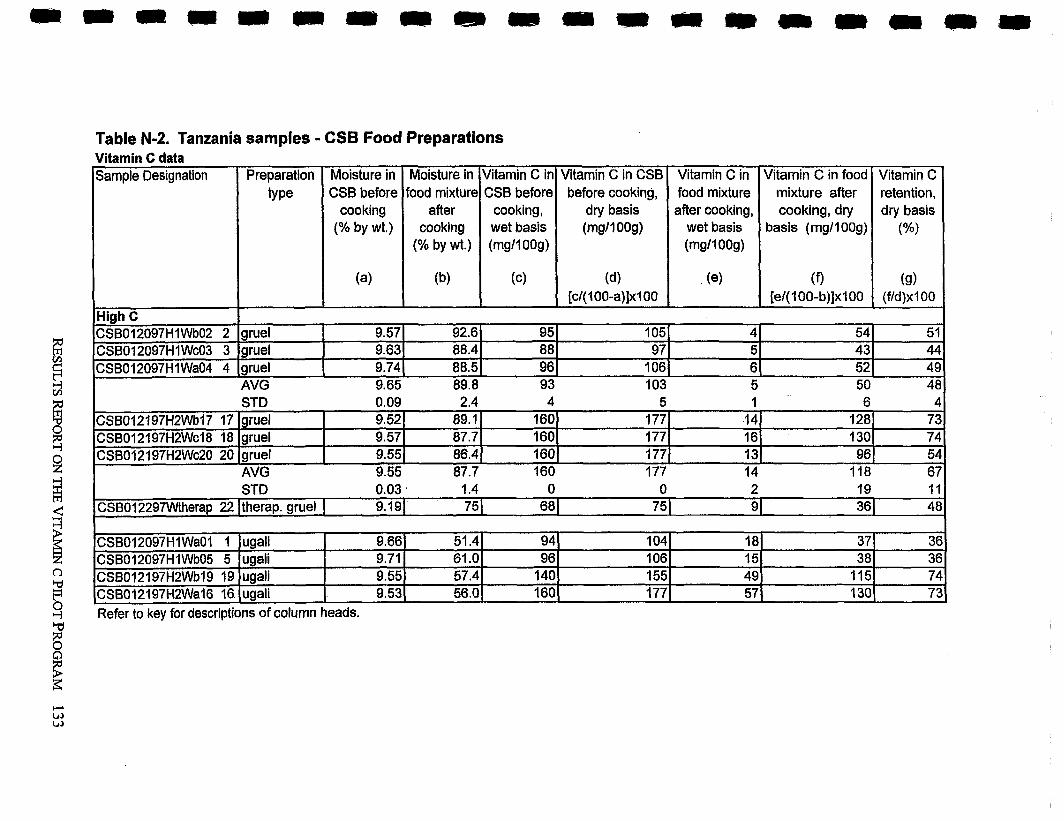
Table N-2. Tanzania samples - CSB Food Preparations Vitamin C data
STD 0.03 * 1.4 0 0 2 19 I I CSB012297Wtherap 22 Itherap. gruel 1 9.191 75) 681 751 91 36 1 48
STD 0.09 2.4 4 5 1 6 4
Refer to key for descriptions of column heads.
Vitamin C in CSB before cooking,
dry basis (mg1100g)
(dl [c1(100-a)]xlOO
Sample Designation Moisture in food mixture
after cooking
(% by wt.)
(b)
/ ~ i ~ h C CSB012097HlWb02 2 CSB012097Hl Wc03 3 CSB012097HlWa04 4
AVG 9.55 87.7 160 177 14 118 67
128 130 96
CSB012197H2Wbl7 17 CSB012197H2Wc18 18 CSB012197H2Wc20 20
Vitamin C in CSB before
cooking, wet basis (mg1100g)
(c)
Preparation type
73 74 54
gruel gruel gruel
94 96
140 160
104 106 155 177
Vitamin C retention, dry basis
(%)
(9) (f1d)xI 00
Vitamin C in food mixture after cooking,
wet basis (mg/l OOg)
(e)
1 AVG 9.65 89.8 93 103 5 50 48
Moisture in CSB before
cooking (% by wt.)
(a)
gruel gruel gruel
9.52 9.57 9.55
CSB012097H1Wa01 1 CSB012097Hl Wb05 5 CSB012197H2Wb19 19 CSB012197H2Wa16 16
Vitamin C in food mixture after cooking, dry
basis (mg1100g)
(9 [e/(lOO-b)]xlOO
160 160 160
89.1 87.7 86.4
18 15 49 57
ugali ugali ugali ugali
9.66 9.71 9.55 9.53
51.4 61 .O 57.4 56.0
9.57 9.63 9.74
177 177 177
37 38
115 130
14 16 13
36 36 74 73
5 1 44 49
92.6 88.4 88.5
4 5 6
54 43 52
95 88 96
105 97
106
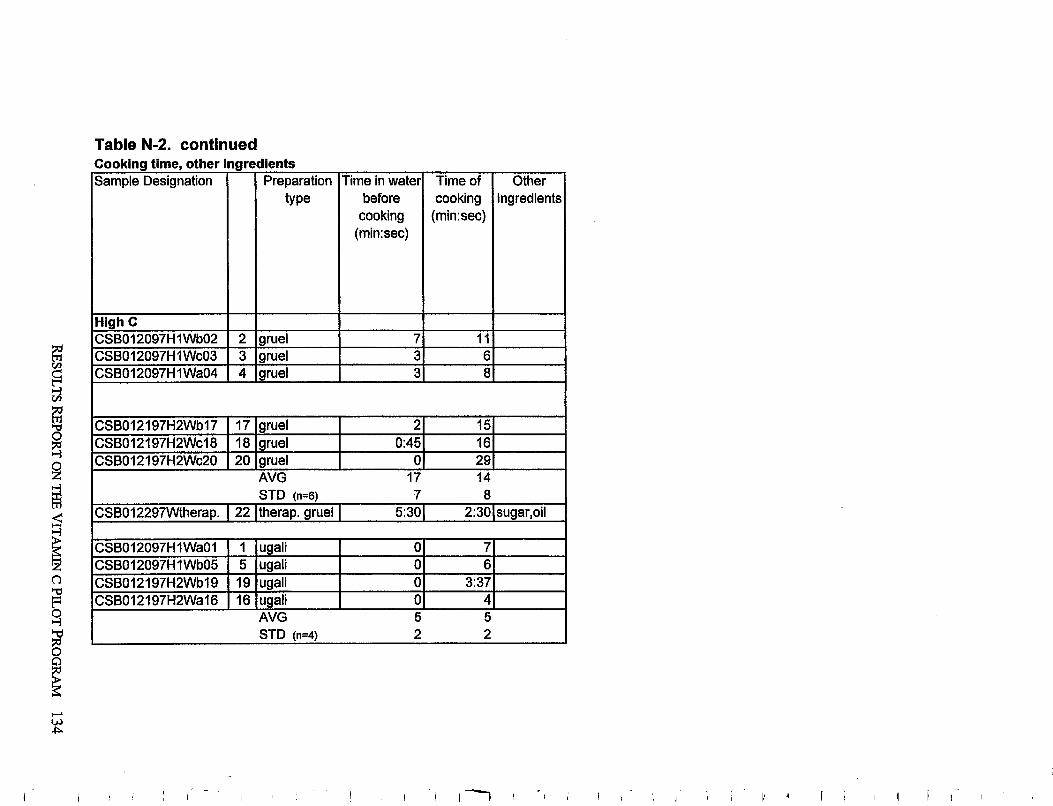
Table N-2. continued Cooking time, other ingredients
(Sample Designation 1 I Preparation Time in water before
cooking (min:sec) n Time of I Other I
High C CSB012097H1 Wb02 2 gruel 7 11 CSB012097H1 Wc03 3 aruel 3 6
hi ' ' 2
3 I AVG 5 5 I
P d
v I STD (n=4) 2 2 I
! z
CSB012197H2Wb17 CSB012197H2Wd8 CSB012197H2Wc20
STD (n=6) 7 8 CSB012297Wtherap. 1 22 Itherap. gruel I 5301 2:301sugar,oil
AVG 17 14
17 18 20
gruel gruel gruel
2 0:45
0
15 16 29
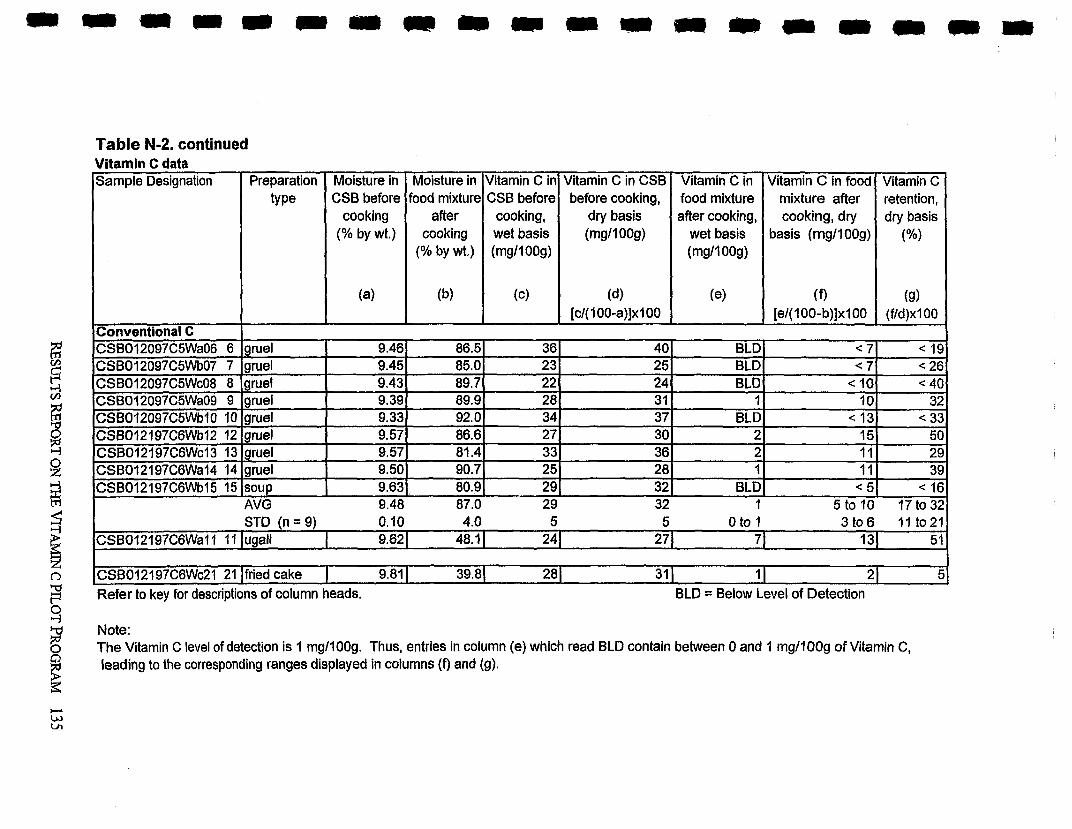
STD (n = 9) 0.10 4.0 5 5 0 to I 3 t o 6 11 to21 CSB012197C6Wal I I I (ugali I 9.621 48.1 1 24 1 271 71 131 51
Table N-2. continued Vitamin C data
SB012197C6Wc21 21 lfried cake 1 9.81 1 39.81 28 1 31 1 I I 21 5 Refer to key for descriptions of column heads. BLD = Below Level of Detection
Note: The Vitamin C level of detection is 1 mgl100g. Thus, entries in column (e) which read BLD contain between 0 and 1 mg/100g of Vitamin C, leading to the corresponding ranges displayed in columns (9 and (g).
Sample Designation Vitamin C in CSB before
cooking, wet basis (mgll OOg)
(c)
Conventional C CSB012097C5Wa06 6 CSB012097C5Wb07 7 CSB012097C5Wc08 8 CSB012097C5Wa09 9 CSB012097C5Wb10 10 CSB012197C6Wb12 12 CSB012197C6Wc13 13 CSB012197C6Wal4 14 CSB012197C6Wb15 15
Preparation type
Vitamin C in CSB before cooking,
dry basis (mg1100g)
(d) [c/( I 00-a)]xl 00
Moisture in CSB before
cooking (% by wt.)
(a)
gruel gruel gruel gruel gruel gruel gruel gruel soup
Moisture in food mixture
after cooking
(% by wt.)
(b)
Vitamin C in food mixture after cooking,
wet basis (mgll OOg)
(e)
AVG 9.48 87.0 29 32 I 5to IO 17to32
Vitamin C in food mixture after cooking, dry
basis (mg1100g)
(9 [e/(l00-b)]xI 00
9.46 9.45 9.43 9.39 9.33 9.57 9.57 9.50 9.63
Vitamin C retention, dry basis
(%)
(9) (f1d)xI 00
40 25 24 3 1 37 30 36 28 32
86.5 85.0 89.7 89.9 92.0 86.6 81.4 90.7 80.9
36 23 22 28 34 27 33 25 29
BLD BLD BLD I
BLD 2 2 1
BLD
< 7 < 7
< 10 10
< 13 15 11 11
< 5
< 19 < 26 < 40
32 < 33
50 29 39
< 16
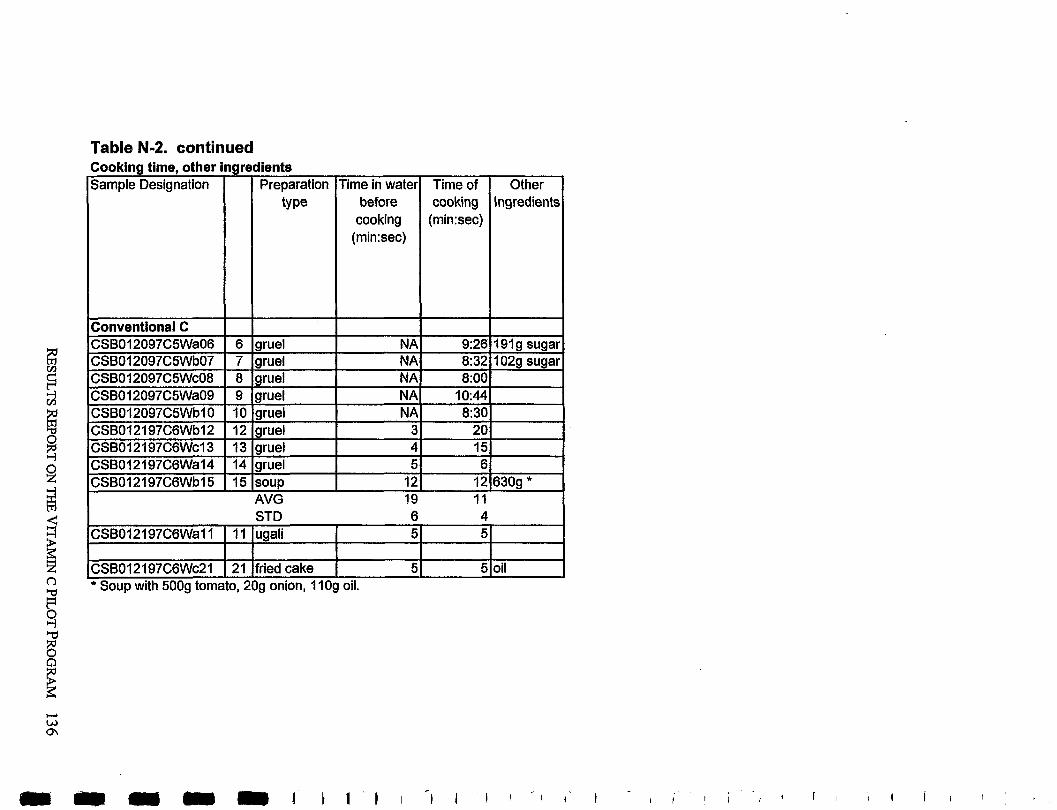
Table N-2. continued Cooking time, other ingredients
/sample Designation I I Preparation Other Ingredients n
Conventional C CSB012097C5Wa06 CSB012097C5Wb07 CSB012097C5Wc08 CSB012097C5Wa09 CSB012097C5Wb10
STD 6 4 CSB012197C6Wa11 I I I lugali ! 51 51
I I I I
6 7
-
~SB012197C6Wcl3 CSB012197C6Wal4 CSB012197C6Wb15
I I I I I CSB012197C6Wc21 1 21 lfried cake I 51 51oil I * Soup with 5009 tomato, 209 onion, I log oil.
8 9 10
gruel aruel
AVG 19 11
13 14 15
gruel gruel aruel
NA NA
gruel gruel soup
NA NA NA
9:26 8:32 8:OO
10:44 8:30
4 5
12
191g sugar 102a suaar
15 6
12 630g *
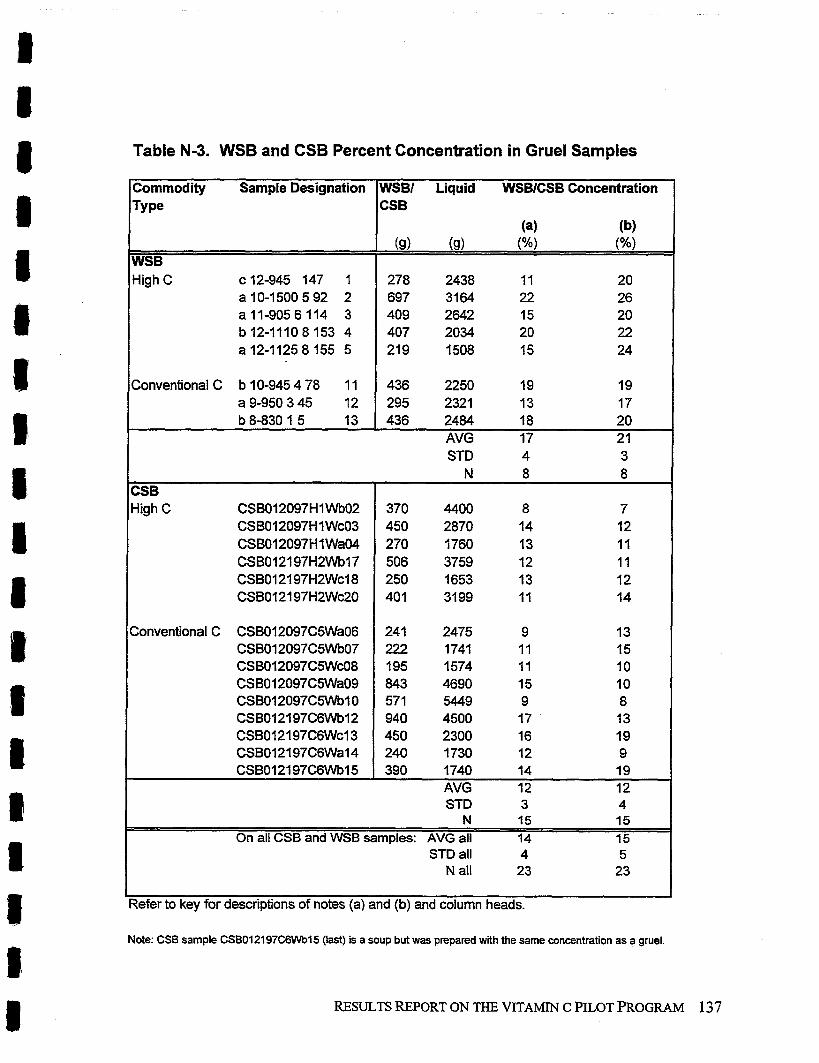
Table N-3. WSB and CSB Percent Concentration in Gruel Samples
l~ommodity Sample Designation 1 WSBl Liquid WSBICSB Concentration 1
High C c 12-945 147 1 al0-1500592 2 al l-9056114 3 b 12-1110 8 153 4 a 12-1125 8 155 5
/Type
WSB
CSB
(a) (b) (9) (9) (%I (%I
STD 4 N 8 8 1
Conventional C b 10-945 4 78 1 1 a 9-950 3 45 12 b 8-830 1 5 13
CSB Iigh C CSB012097HlWb02
CSB012097H 1 Wc03 CSB012097H1 Wa04 CSB012197H2Wbl7 CSB012197H2Wcl8 CSB012197H2Wc20
436 2250 19 19 295 2321 13 17 436 2484 18 20
Conventional C CSB012097C5Wa06 CSB012097C5Wb07 CSB012097C5Wc08 CSB012097C5Wa09 CSBOl2097C5WblO CSB012197C6Wbl2 CSB012197C6WcI 3 CSBO12197C6Wa14 CSB012197C6Wb15
AVG 17 2 1
241 2475 9 13 222 1741 11 15 195 1574 11 10 843 4690 15 10 57 1 5449 9 8 940 4500 17 13 450 2300 16 19 240 1730 12 9 390 1740 14 19
AVG 12 12 I STD 3 4 I
N 15 15 On all CSB and WSB samples: AVG all 14 15
STD all 4 5 N all 23 23
I I Refer to key for descriptions of notes (a) and (b) and column heads.
Note: CSB sample CSB012197C6Wb15 (last) is a soup but was prepared with the same concentration as a gruel.
RESULTS REPORT ON THE VITAMIN C PILOT P R O G W 137
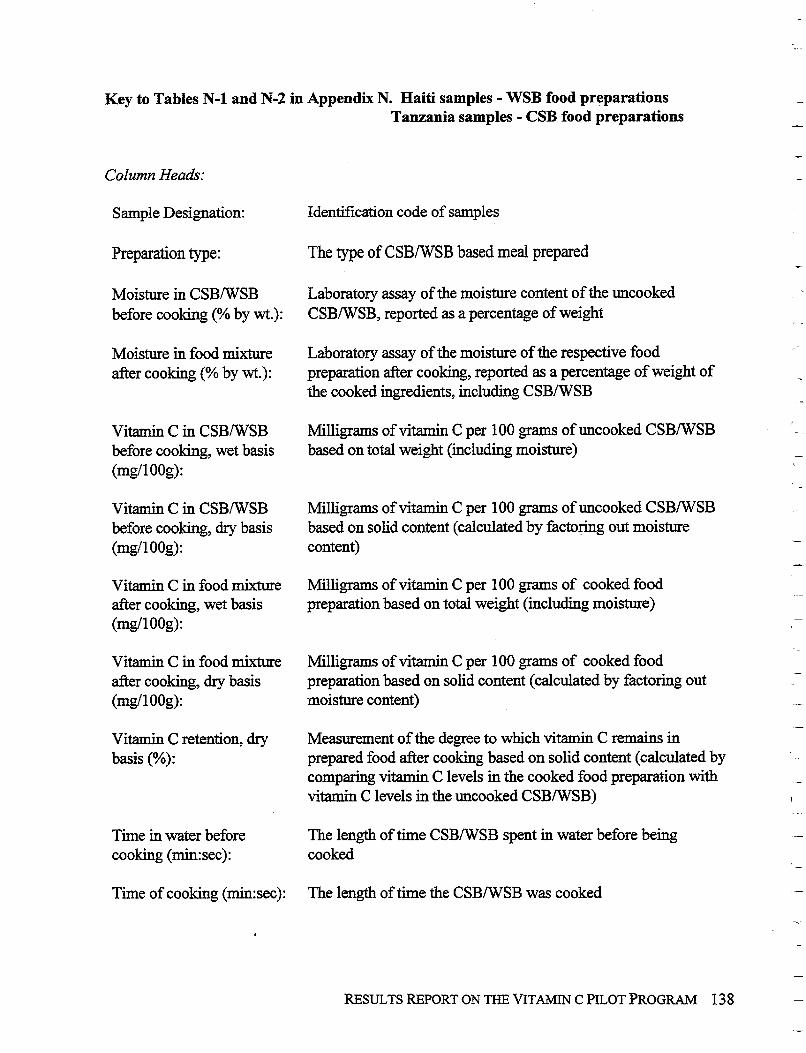
Key to Tables N-1 and N-2 in Appendix N. Haiti samples - WSB food preparations Tanzania samples - CSB food preparations
Column Heads:
Sample Designation:
Preparation type:
Moisture in CSB/WSB before cooking (% by wt.):
Moisture in food mixture after cooking (% by wt.):
Vitamin C in CSB/WSB before cooking, wet basis (mg/l OOg):
Vitamin C in CSBNSB before cooking, dry basis (mg/l OOg):
Vitamin C in food mixture after cooking, wet basis (mg/1 OOg):
Vitamin C in food mixture after cooking, dry basis (mg/l OOg):
Vitamin C retention, dry basis (%):
Time in water before cooking (rnin: sec) :
Time of cooking (min:sec):
Identification code of samples
The type of CSBNSB based meal prepared
Laboratory assay of the moisture content of the uncooked CSB/WSB, reported as a percentage of weight
Laboratory assay of the moisture of the respective food preparation after cooking, reported as a percentage of weight of the cooked ingredients, including CSB/WSB
Milligrams of vitamin C per 100 grams of uncooked CSB/WSB based on total weight (including moisture)
Milligrams of vitamin C per 100 grams of uncooked CSB/WSB based on solid content (calculated by factoring out moisture content)
Milligrams of vitamin C per 100 grams of cooked food preparation based on total weight (including moisture)
Milligrams of vitamin C per 100 grams of cooked food preparation based on solid content (calculated by factoring out moisture content)
Measurement of the degree to which vitamin C remains in prepared food after cooking based on solid content (calculated by comparing vitamin C levels in the cooked food preparation with vitamin C levels in the uncooked CSBNSB)
The length of time CSBNSB spent in water before being cooked
The length of time the CSB/WSB was cooked
RESULTS REPORT ON THE VITAMIN C PILOT PROGRAM 13 8
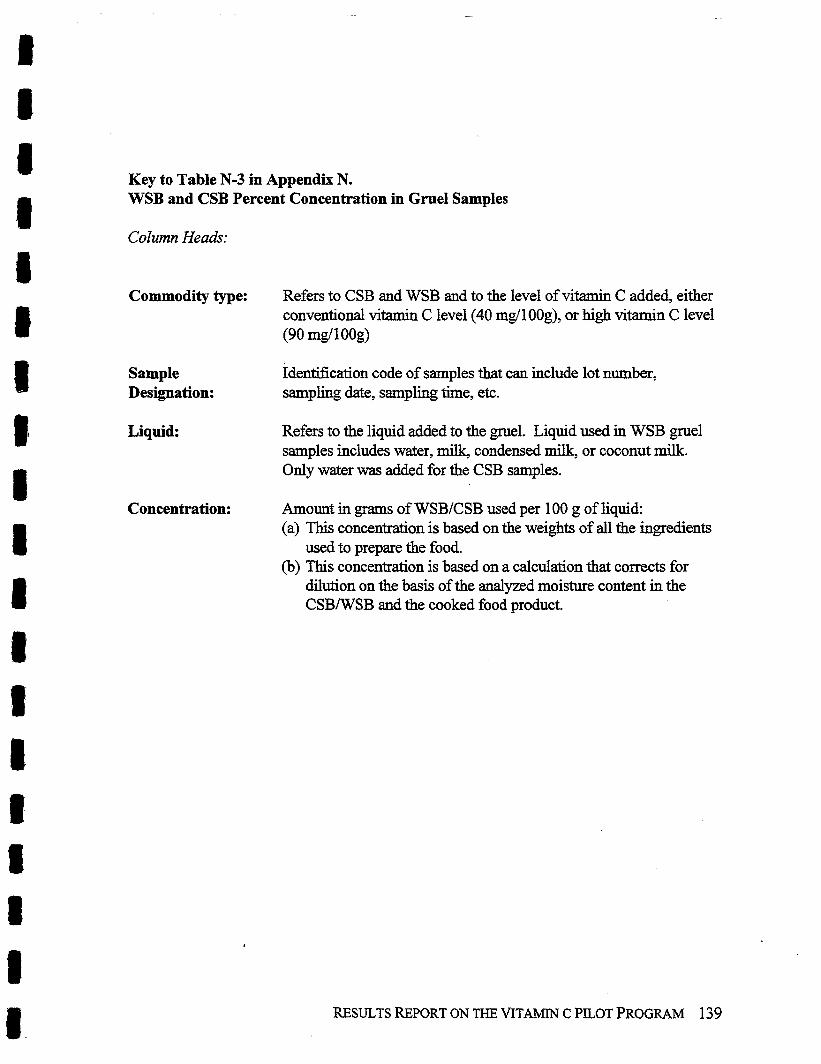
Key to Table N-3 in Appendix N. WSB and CSB Percent Concentration in Gruel Samples
Column Heads:
Commodity type: Refers to CSB and WSB and to the level of vitamin C added, either conventional vitamin C level (40 mg/lOOg), or high vitamin C level (90 mg/ 1 OOg)
Sample Identification code of samples that can include lot number, Designation: sampling date, sampling time, etc.
Liquid: Refers to the liquid added to the gruel. Liquid used in WSB gruel samples includes water, milk, condensed milk, or coconut milk. Only water was added for the CSB samples.
Concentration: Amount in grams of WSB/CSB used per 100 g of liquid: (a) This concentration is based on the weights of all the ingredients
used to prepare the food. (b) This concentration is based on a calculation that corrects for
dilution on the basis of the analyzed moisture content in the CSB/WSB and the cooked food product.
RESULTS REPORT ON THE VITAMiN C PILOT PROGRAM 139
Statistical Analysis to Determine the Stability of Vitamin C During Preparation
SAS software, version 6.12 (1 996), was used for all analyses contained in this summary. Vitamin C content is expressed in milligram of vitamin C per 100 grams of food based on solid content.
The vitamin C content (before and after preparation) was log-transformed for ease of interpretation (back-transformed to obtain percentages). The vitamin C content in CSB and WSB was tested by two different models. The effects considered in the models were preparation type (discrete: gruel, dumpling, ugali), vitamin C content prior to cooking (covariate), time in water (covariate), cooking time (covariate), and water activity (covariate). Interactions were tested and nonsignificant covariate effects (P>. 10) were eliminated from the model@) to have a concise, relevant model that explained a good portion of the variability observed in vitamin C retention.
None of the tested effects had a significant impact on retention of vitamin C in preparations made from CSB. In other words, vitamin C retention was not affected by preparation type, amount of vitamin prior to cooking, time in water, etc.
Preparations made from WSB, however, were significantly affected by the amount of vitamin C present prior to cooking. Retention (%) of vitamin C in dumplings made with WSB (conventional and high) increased at a significantly faster rate than gruel preparations when initial levels of vitamin C increased fiom conventional to high. Furthermore, retention in dumplings made with WSB containing conventional levels of vitamin C increased to a significantly greater extent than dumplings made from WSB already containing elevated levels of vitamin C . The change in vitamin C retention associated with a change in initial vitamin C was not significant in either gruel preparation (conventional or high).
In summary, percent retention of vitamin C in CSB preparations was more variable then seen in WSB preparations. This increased variability may explain, in part, why vitamin C retention in CSB preparations could not be attributed to relevant factors such as cooking time or preparation type. For WSB, however, while the level of initial vitamin C did not affect the percent retention, preparations made from the high end of conventional WSB (approximately 40 mg1100g dry basis) had more potential for improved retention than high and elevated WSB did. The fact that the two WSB sources both reached 80% retention although initial vitamin C levels were quite different, may be partially attributed to the fact that the vitamin C added was provided by two different premix manufacturers.
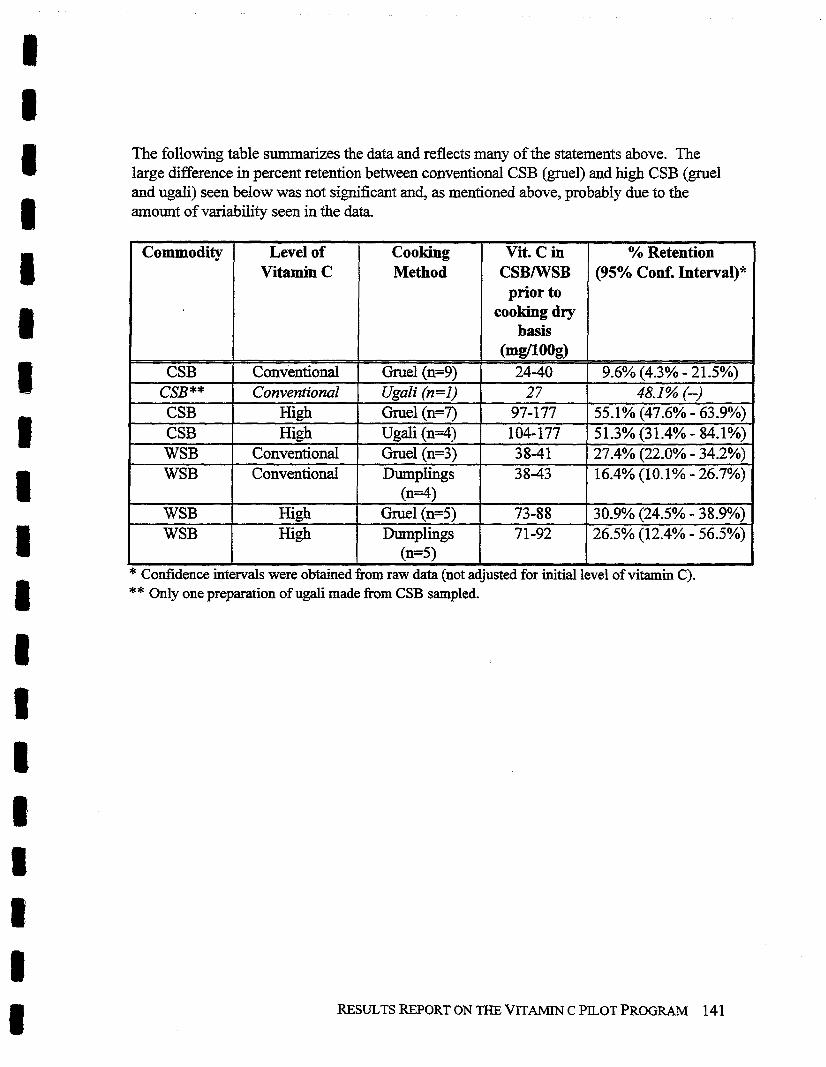
The following table summarizes the data and reflects many of the statements above. The large difference in percent retention between conventional CSB (gruel) and high CSB (gruel and ugali) seen below was not significant and, as mentioned above, probably due to the amount of variability seen in the data.
Commodity
CSB CSB** CSB CSB WSB WSB
WSB WSB
* Confidence intervals were obtained from raw data (not adjusted for initial level of vitamin C). ** Only one preparation of ugali made from CSB sampled.
Level of Vitamin C
Conventional Conventional
High High
Conventional ConventionaI
High High
Cooking Method
Gruel (n=9) Ugali (n=l) h e 1 (n=7) Ugali (n=4) Gruel (n=3) Dumplings
(n=4) Gruel (n=5) Dumplings
(n=5)
Vit. C in CSBIWSB prior to
cooking dry basis
(mgfi009) 24-40
27 97- 177 104-177 38-41 38-43
73-88 71-92
% Retention (95% Conf. Interval)"
9.6% (4.3% - 21.5%) 48.1 % (--)
55.1% (47.6% - 63.9%) 51.3% (31.4% - 84.1%) 27.4% (22.0Y0 - 34.2%) 16.4% (10.1% - 26.7%)
-
30.9% (24.5% - 38.9%) 26.5% (12.4% - 56.5%)
4
Appendix 0
USDA Letter
8 RESULTS REPORT ON THE VITAMIN C PILOT PROGRAM 143 c?"., @JAY mqp@*4 ~ + B U f B i ' $ Y V ' ' C $ # \I*? ir9~11ff 9, d~i$;- rhbfi&hlia
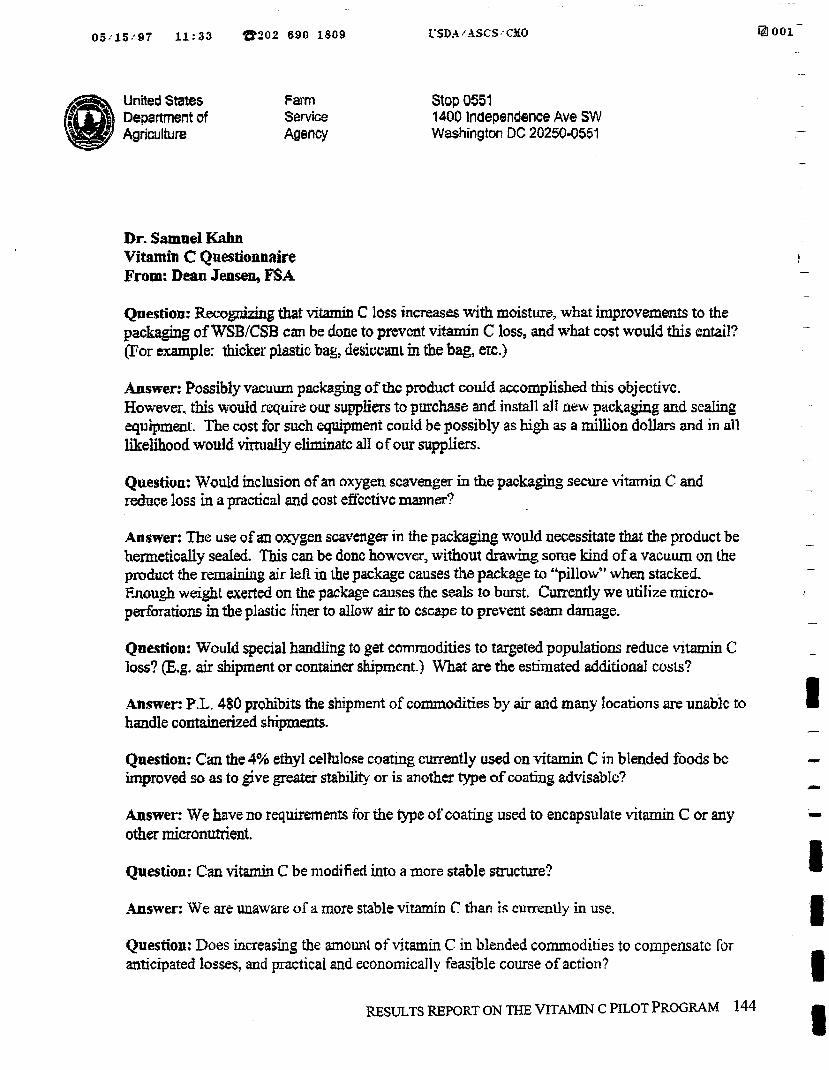
United States Farm Department of Service Agriculture &encY
Dr. Samael K a b Vitamin C Questionnaire From: Dean Jensen, FSA
Stop 0551 1400 lndependence Ave SW Washington DC 202504551
Question: Recognkhg that vitamin C loss increases with moisture, what improvements to the packaging of WSB/CSB can be done to prevcnt vitamin C bss, and what cost would this entail? -
("For example: thicker plastic bag, desir;r;;ml in the bag, etc.) -
Answer: Possibly vacuum packaging of thc product could accomplished this ubjtctivc. However. this would require uur suppliers to purchase and illstall all uew packaging and scaling equipmenl. The cost for such equipment could be possibly as high as a million dollars m d in all likelihood would vimdy eliminate dl1 of our suppliers.
Questiua: NTould inclusion of an oxygen scavenger in the packaging secure vitamin. C and - reduce loss in a practical and cost effcctivc manner?
Answer: The use of an oxygen scavenger in the packapg m70uld necessitate that the product be hermetically sealed. 'Ibis can be donc howcvcr, without drawing sorue kind of a vacuum on the p d u c t the remaining air lefi in h e package causes the package to "pillo~v" when stacked. E~~augh weight exerted on the package causes the seals to burst. Currently we utilize micro- perfo~ations in the plastic liner to allow air to cscap~ to prevent seam damage.
Question: WouW special handling to get commodities to targeted populations reduce vitamin C loss? (E.g. air shipment or container shipment.) What are the estimated additioad costs?
Answer: P.L. 480 prohibits the shipment of commodities by air and many locations me unablc to handle containerized shipments.
Qaestion: Can the 4% ethyl cellulase coatrng currently usad on vitamin C in blended foods bc improved so rts to give greater stabiliQ or is another type of coating advisable?
Answer: We have no requirements for the type of coating used to encrrpsulate vitamin C or any other micronutrient.
Question: Can vitamin C be ~nodi fied into a more stable structure?
Answer: We ae wawars of a more stable vitamin C tl~an is cunrmlly in use.
Question: Does increasing the amount of vitamin C in blended commodities to coinprnsatc for anticipated losses, and practical and economically feasible course of action?
RESULTS REPORT ON THE VITAMIN C PILOT PROGRAM 144
I 05;15:87 11:34 e 2 0 2 690 1809 Z'SD.4;ASCS: CIO
United States farm stop 0551 Department of Service 1400 Independence Ave SW Agriculture Agency Washington DC 20250-0551
Answer: We are unaware if increasing the amount of vira~nil~ C in blended commodities to compensate for anticipated losses would be s practical and economically feasible course of action.
Question: What changes in proccssing control may he needed in scaling-up the pilot program. (Process cot~trcsl infarmation &om plants hiit producc WSB and CSB, e.g. calibration controls for metering equipment and usage conirois for the premixes wui~lcl be of value i n making informed judgement about scaling-up the pilot activity.)
Answer: We are unaware of any processing chanses may be nccrlcd in scaling-up the pilot P r o m .
Sam- We have sent your questionnaire to A S and to PGPT. Tf they are able to provide you with any further answers we will forward them along to you.
RESULTS REPORT ON THE VITAMIN C PILOT PROGRAM 145
Appendix P
Information on Possible Alternative CSB/WSB Bags
RESULTS REPORT ON THE VITAMIN C PILOT PROGRAM 147
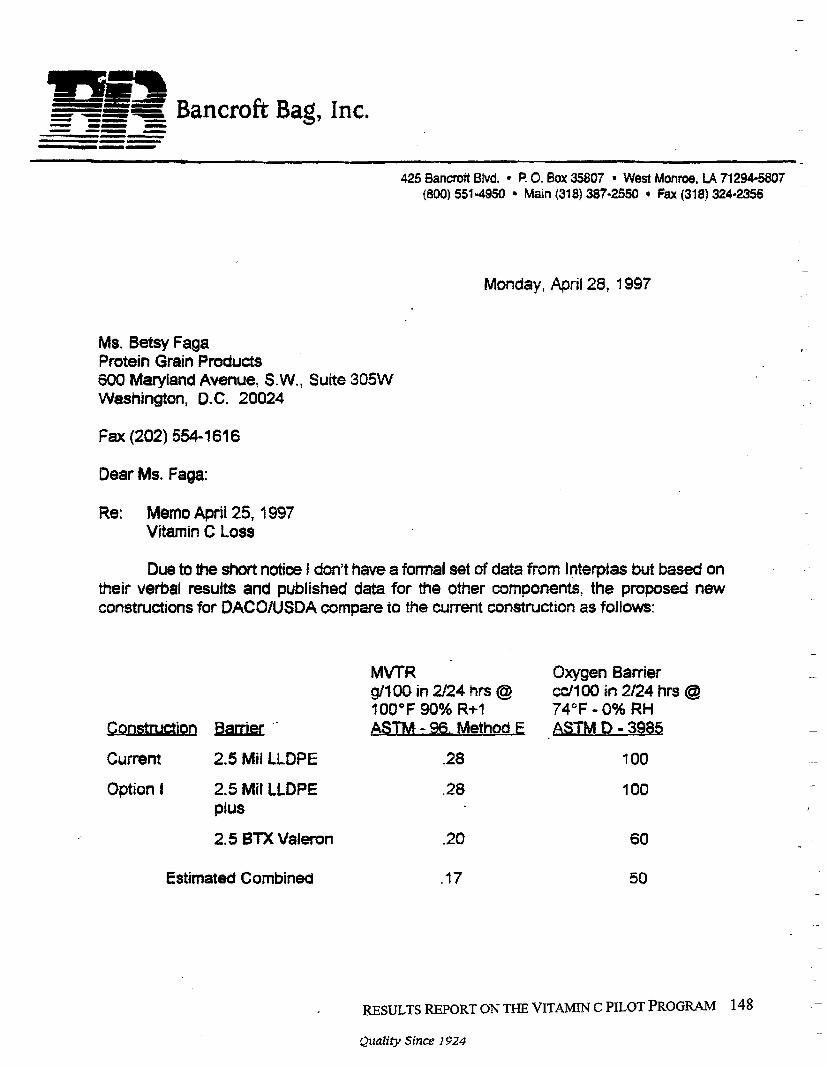
- Bancroft Bag, Inc.
-
= == -- - .I- - - -- - -- -- --- 425 Bancroft Blvd. P. 0. Box 35807 West Monroe. UI 71294-5807
(800) 551-4950 Main (318) 387-2550 * fax (318) 324.2356
Monday, April 28, 1997
Ms. Betsy Faga Protein Grain Products 600 Maryland Avenue, S.W., Suite 305W Washington, D.C. 20024
Fax (202) 554-1 61 6
Dear Ms. Faga:
Re: Memo Aprii 25, 1997 Vitamin C Loss
Due to the shatt notice I don't have a formal set of data from l@erptas but based on their verbal results and published data for the other components, the proposed new constructions for DACO/USDA compare to the current construction as follows:
MWR Oxygen Barrier 91100 in 2/24 hrs @ d l 0 0 in 2/24 hrs @ 100QF 90% R+1 74°F - 0% RH
Const- Banier .' 3M - 96. Method E ASTM D - 3985
Current 2.5 Mil LLDPE -28 100
Option I 2.5 Mil LLDPE plus
2.5 BTX Valemn .20 60
Estimated Combined . I7 50
RESULTS REPORT ON THE VITAMIN C PILOT PROGRAM 148
Quality Since 11324
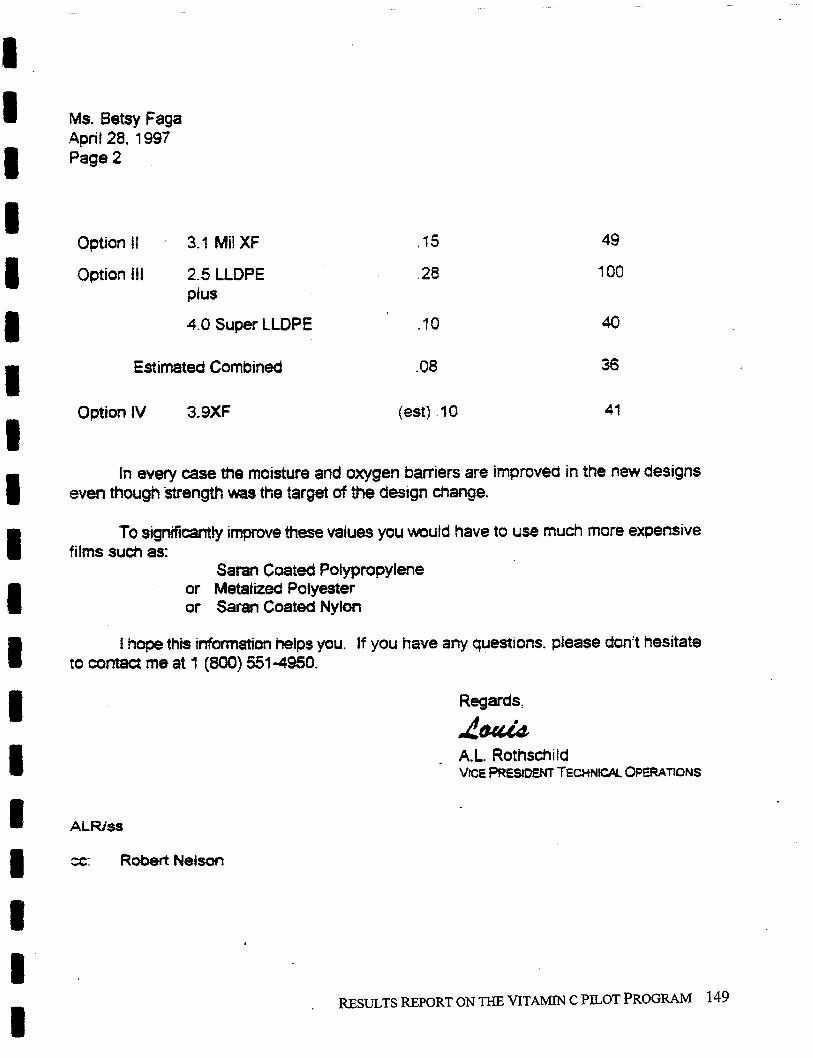
Ms. Betsy Faga April 28. 1997 Page 2
Option 11 3.1 Mil XF
Option 111 2.5 LLDPE plus
4.0 Super LlDPE
Estimated Combined
Option 1V 3.9XF (est) .1O
In every case the moisture and oxygen barriers are improved in the new designs even though strength was the target of the des~gn change.
To significzmtly improve these values you wuld have to use much more expensive films sucb as:
Saran Coated Polypropylene or Metalized Polyester or Saran Coated Nylm
I hope this infannation helps you. If you have any questions. please don't hesitate to cantact me at 1 (800) 551 4950.
Regards,
A w A.L. Rothschild VICE PRESIDEM TECHNICAL OPERAT~ONS
z: Robert Nelsun
. RESULTS REPORT ON THE VITAMIN C PILOT PROGRAM 149
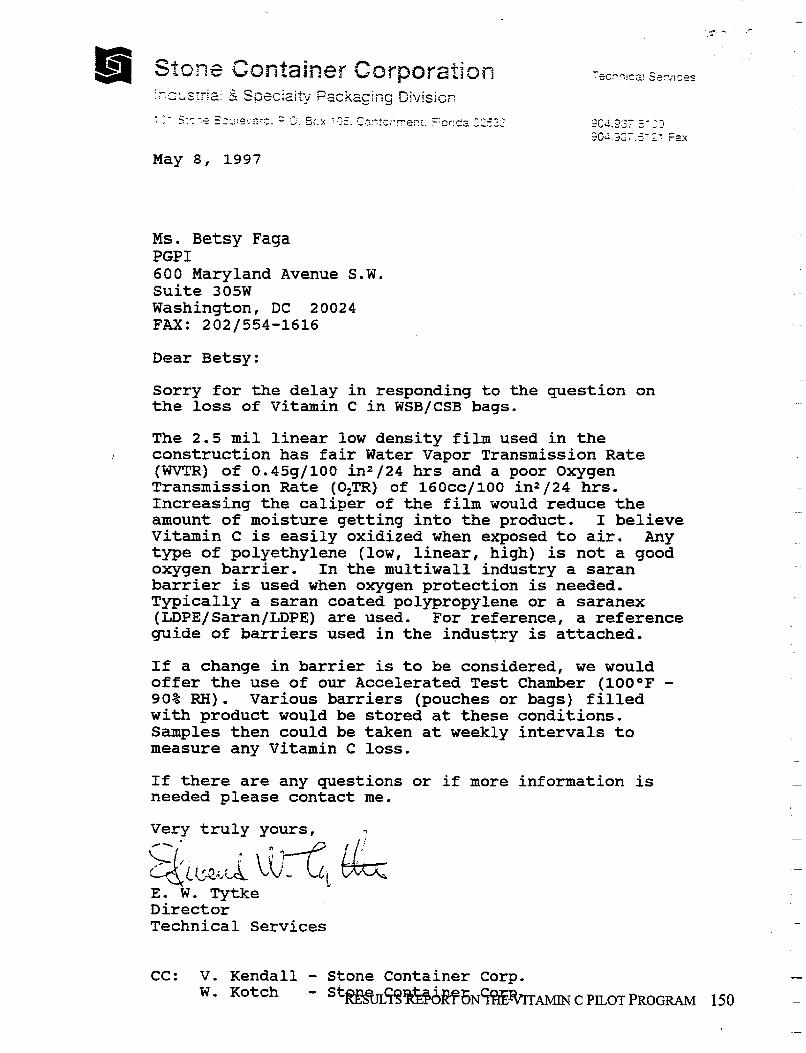
S t m e Container Corpor~t ion
May 8, 1997
Ms. Betsy Faga PGPI 600 Maryland Avenue S.W. Suite 305W Washington, DC 20024 FAX: 202/554-1616
Dear Betsy:
Sorry for the delay in responding to the question on the loss of Vitamin C in WSB/CSB bags.
The 2.5 mil linear low density film used in the I construction has fair Water Vapor Transmission Rate
(WVTR) of 0,45g/100 in2/24 hrs and a poor Oxygen Transmission Rate (0,TR) of 160cc/100 in2 /24 hrs. Increasing the caliper of the film would reduce the amount of moisture getting into the product, I believe Vitamin C is easily oxidized when exposed to air. Any type of polyethylene (low, linear, high) is not a good oxygen barrier. In the multiwall industry a saran barrier is used when oxygen protection is needed. Typically a saran coated polypropylene or a saranex (LDPE/Saran/LDPE) are used. For reference, a reference guide of barriers used in the industry is attached.
If a change in barrier is to be considered, we would offer the use of our Accelerated Test Chamber (lOO°F - 90% RH). Various barriers (pouches or bags) filled with product would be stored at these conditions, Samples then could be taken at weekly intervals to measure any Vitamin C loss.
If there are any questions or if more information is needed please contact me.
Very truly yours, 7
El W. Tytke Director Technical Services
CC: V. Kendall - Stone Container Corp. ch - St%%JL!%@d~6~%%~~m C PILOT PROGRAM 150
I ~ t j Stone
I Container Industrial Bag Division Technical Senices
A reference guide of barriers used in multiwall and consumer bags. .. .
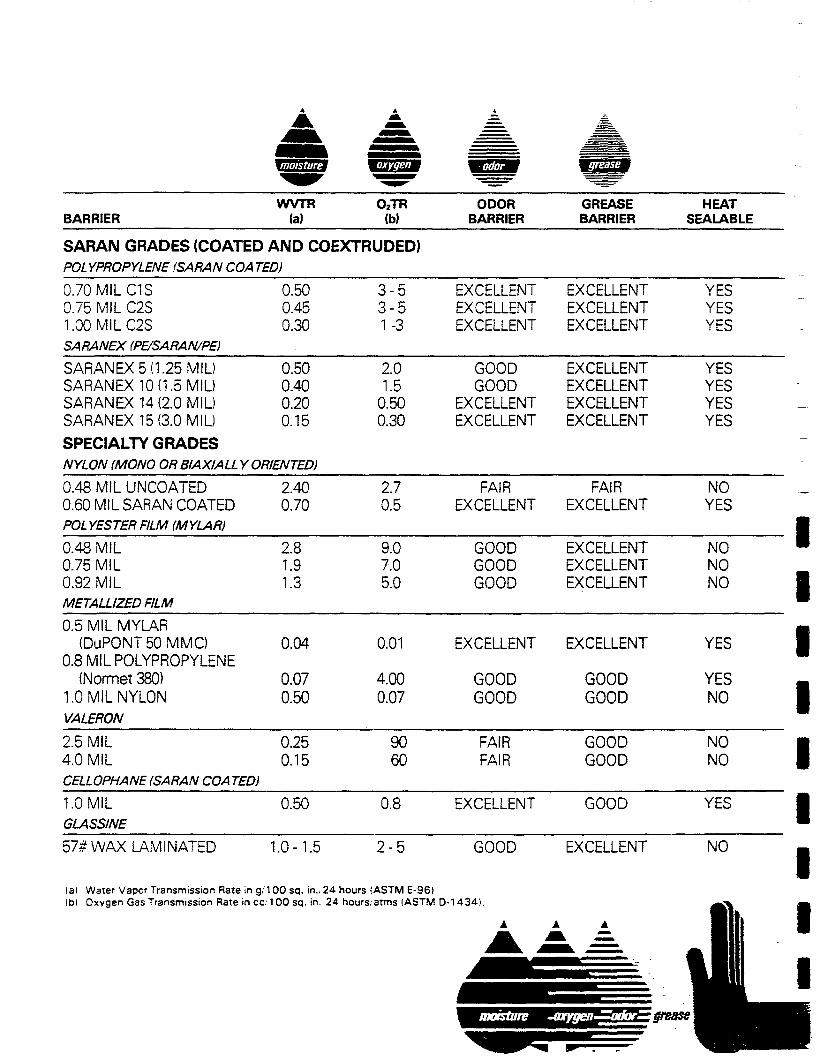
-
BARRIER
- - -- - - - - -- - - - - -
rn OzTR ODOR GREASE HEAT la) (b) BARRIER BARRIER SEALABLE
SARAN GRADES (COATED AND COEXTRUDED) POLYPROPYLENE (SARAN COATED)
0.70 MIL CIS 0.50 3 - 5 EXCELLENT EXCELLENT YES 0.75 MIL C2S 0.45 3 - 5 EXCELLENT EXCELLENT YES 1 .OO MIL C2S 0.30 1 -3 EXCELLENT EXCELLENT YES SARANEX fP&SARAN/PEI
-- -
SARANEX 5 (1 -25 MIL) 0.50 2.0 - GOOD EXCELLENT YES SARANEX 10 (1.5 MIL) 0.40 1.5 GOOD EXCELLENT YES SARANEX 14 (2.0 MIL) 0.20 0.50 EXCELLENT EXCELLENT YES -
SARANEX 15 (3.0 MIL) 0.15 0.30 EXCELLENT EXCELLENT YES SPECIALTY GRADES
-
NYLON (MONO OR BIAXIALL Y ORIENTEDI -
0.48 MIL UNCOATED 2.40 2.7 FAIR FA1 R NO - 0.60 MIL SARAN COATED 0.70 0.5 EXCELLENT EXCELLENT YES POL YESTER FILM (MYLAR)
0.48 MIL 2.8 9.0 GOOD EXCELLENT NO 0.75 MIL 1.9 7.0 GOOD EXCELLENT NO
I 0.92 MIL 1.3 5.0 GOOD EXCELLENT NO METALLIZED FILM
0.5 MIL MYLAR (DuPONT 50 MMC) 0.04 0.01 EXCELLENT EXCELLENT YES
0.8 MIL POLYPROPYLENE (Normet 380) 0.07 4.00 GOOD GOOD
I 1.0 MIL NYLON 0.50 0.07 GOOD GOOD NO VALERON
1 2.5 MIL 0.25 90 FAIR GOOD NO 4.0 MIL 0.15 60 FA1 R GOOD NO CELLOPHANE (SARAN COA TED)
1.0 MIL 0.50 0.8 EXCELLENT GOOD YES GLASSINE I 57# WAX LAMINATED 1 .O - 1.5 2 - 5 GOOD EXCELLENT NO
la1 Warer Vapor Transmission Rate in g:100 sq. in., 24 hours iASTM E-96) I
: bl Oxvgen Gas ?ran Rare in cc: 100 sq. in. 24 .s, arms IASTM D-1
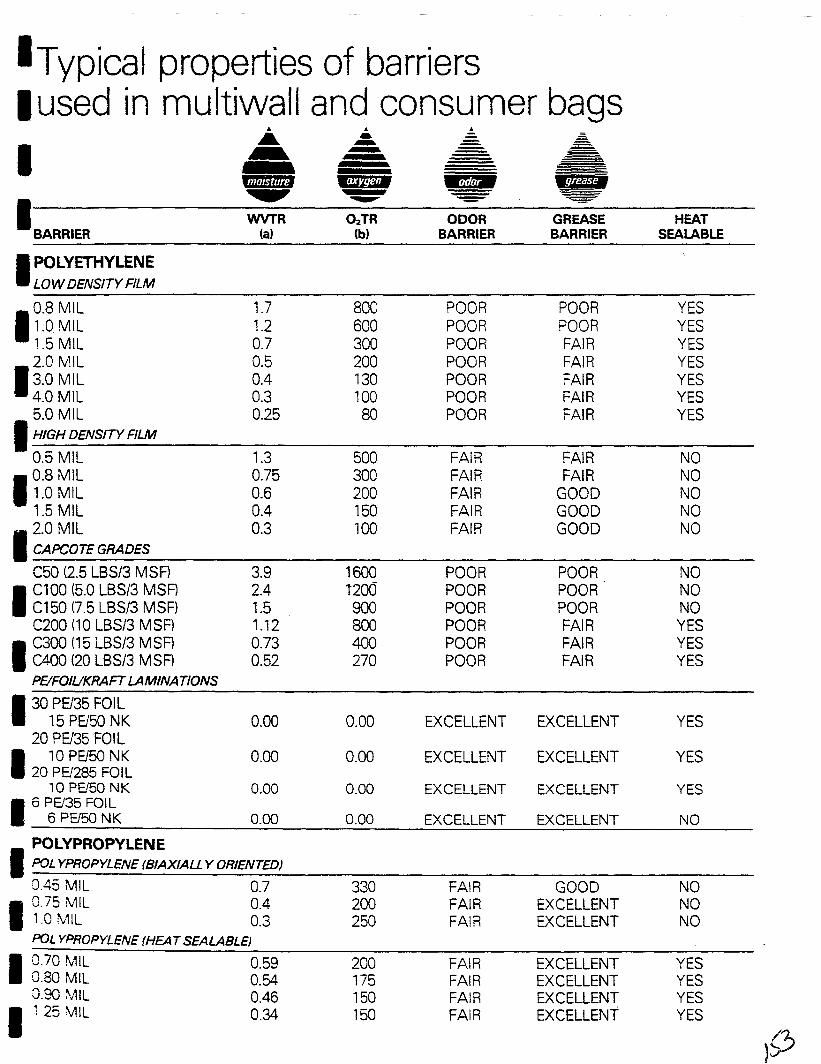
B ~ ~ ~ i c a l properties of barriers Iused in multiwall and consumer bags
A A A A - - - - - = - - - - - --
I - - - - _.f-- - - --- - - __I - tam# - - - - - - - - @zBs - - -
WVTR OzTR ODOR GREASE HEAT BARRIER (a) (b) BARRIER BARRIER SEALABLE
I POLYETHYLENE LOW DENSITY FILM
0.8 MIL 1.7 800 POOR POOR YES (1 .O MIL 1.2 600 POOR POOR YES
1.5 MIL 0.7 300 POOR FA1 R YES
1 ::: :;: 0.5 200 POOR FA1 R YES 0.4 130 POOR FA1 R YES
4.0 MIL 0.3 1 00 POOR FA1 R YES 0.25 80 POOR FA1 R YES 1 > L F k N s I T y FILM
0.5 MIL 1.3 500 FA1 R FA1 R NO
1 ::: ;;: 0.75 300 FA1 R FA1 R NO 0.6 200 FA1 R GOOD NO
1.5 MIL 0.4 1 50 FA1 R GOOD NO 0.3 1 00 FA1 R GOOD NO
C50 (2.5 LBSl3 MSF) 3.9 1600 POOR POOR, NO
I ClOO (5.0 LBS13 MSF) 2.4 7200 POOR POOR NO C150 (7.5 LBSI3 MSF) 1.5 900 POOR POOR NO C200 (1 0 LBSl3 MSF) 1.12 800 POOR FA1 R YES C300 ( 1 5 LBS13 M SF) 0.73 400 POOR FA1 R YES C400 (20 LB S/3 M SF) 0.52 270 POOR FA1 R YES PUFOIUKRA FT LA MINATIONS
30 PU35 FOl L ) 15PV50NK 0.00 0.00 EXCELLENT EXCELLENT YES
0.00 0.00 EXCELLENT EXCELLENT YES 20 PEf285 FOIL
10 PE5U NK 0.00 0.00 EXCELLENT EXCELLENT YES 6 PE135 FOIL 1 6PV50NK 0.00 0.00 EXCELLENT EXCELLENT NO , POLYPROPYLENE POLYPROPYLENE IBIAXIALL Y ORIENTED)
3.45 VlL 0.7 330 FA1 R GOOD NO 0.75 MIL 0.4 200 FA1 R EXCELLENT NO
0.3 250 FA1 R EXCELLENT NO POL YPROPYLENE {MAT SEALABLE)
0.70 MIL 0.59 200 FA1 R EXCELLENT YES 0.80 MIL 0.54 175 FA1 R EXCELLENT YES 3.90 !AIL 0.46 1 50 FA1 R EXCELLENT YES ( i 25 0.34 1 50 FA1 R EXCELLENT YES
Glossary The data included in this summary are a compilation of iaboratow evaluations, supplier data and literature references. These data are reported as "tycical properties"; variations in published data wtll exist as the result of specific polymer density variations as well as variation in equipment p r~ess ing parameters.
A semicn/sr~ilir~. iicnt weight thermoplastic ~rcduces EI\, sc:%,,mi=rizing ethylene gas. Low Density Foike~t. ,!ere iLDPE) films referenced wili nave dersiti~s racging from 0.910-0.925 act; High Densi:] Fciyethylene (HDPE) density ranges 0.941 -0.565 act. Since density and fiim thickness have :i te greater effect on barrier properties, no disSnc~ion is made in thissummary between linesr Icw density polyethylene and LDPE, or high mciecdlar weight high density polyethylene anc AEPE.
CAPCOTE GRADES A medium dens?/ pciyethylene (0.926-0.940 g/cc) extrusion ccatec to Natural Kraft using a vacuum roll coatirg process in place of the . - conventional Chill RoilINip Roll process.
PEIFQIUKRAFT LAMINATIONS The nomenclaturz 3C PU35 Foil/l5 PU50 NK represents 30 lbs3 MSF Low Density Poly- ethylene (LDPU extmsion coated to 0.00035 inch thick aluminum foil which is laminated using 15 lbd3 MSF LDPE to a 50 lbi3 MSF Natural Kraft !NK'i.
POLYPROPYLENE (HEAT SEALASLEI Biaxially oriented fiirr modified during processing so ?ha: the surface is heat sealable.
POLYPROPYLENE (SARAN COATED) Biaxially Oriented ?olypropylene coated with polyvinyliclene chicrice (Saran). The film can be mated on one side IC1 S) or on both sides (CZSI. The Saran tzarrng functions as a heat seai fayer. Sarsn ccz::r:g also impr~ves ihe film's gas 5arrier crccerties.
SARANEX Coextruded muliilayer therrncplastic film produced by The Dow Chemical Company. The coextrusion is constructed Low Density Poly- ethylene/Saran/Low Density Polyethylene.
METALLIZED Fl LM DuPonr 50 MMC A 50 gauge (O.CG05 in.) pclvester film with a vacuum depcsiTion of alurinum on one side. Overcoated on k,ott! sides z i the fiim with 3 heat sealable baicier coarirc of Saran.
NORPROP FILM NORMET 380 An 80 gauge (0.12008 in.) coexrruded biaxilly oriented polyprcoylene f i l r . vacuum metallized on the non-sealaole side.
VALERON A highly oriented High Dersity Polyethylene film produced by Van Leer Company. The film is spirally cut and cross laminated.
CELLOPHANE (SARAN COATED) Film produced from celluiose [wood pulp) is saran coated to improve barrier properties.
GLASSINE (WAX LAMINATED) Sheet prepared from wood pulp that has been hydrated i.e. water is driven into the pulp fiber. As a result the fiber repels grease and oil. The sheet is wax laminated to improve water vapor barrier properties.
Stone Container Corporation Bag Division Technical Senices
RESULTS REPORT ON TIE VITAMIN C PILOT PROGRAM 154