Embed Size (px)
Citation preview

Results presentation
Second Quarter 2015 Ian Thom – Group Chief Executive Siobhan Bailey – Group Finance Director 28 November 2014
Viridian Group

Forward looking statements
2
This presentation may include forward looking statements. These forward looking statements can be identified by the use of forward looking terminology, including the terms ''believes,'' ''estimates,'' ''anticipates,'' ''expects,'' ''intends,'' ''may,'' ''will'' or ''should'' or, in each case, their negative, or other variations or comparable terminology. These forward looking statements include all matters that are not historical facts and include statements regarding the Group's intentions, beliefs or current expectations concerning, among other things, the Group's results of operations, financial condition, liquidity, prospects, growth, strategies and the industry in which it operates. By their nature, forward looking statements involve risks and uncertainties because they relate to events and depend on circumstances that may or may not occur in the future. Readers are cautioned that forward looking statements are not guarantees of future performance and that the Group's actual results of operations, financial condition and liquidity, and the development of the industry in which it operates may differ materially from those made in or suggested by the forward looking statements contained in this presentation. In addition, even if the Group's results of operations, financial condition and liquidity, and the development of the industry in which the Group operates are consistent with the forward looking statements contained in this presentation, those results or developments may not be indicative of results or developments in subsequent periods.

Table of contents
Financial highlights 1
3
5
2
Cash flow and net debt
3
4
Conclusion
Business developments
Financial summary and KPIs
4
Page No.
5
8
14
16

Financial highlights
● Encouraging set of results for the Second Quarter 2015 which were in line with expectations
● Pro-forma EBITDA* for the Second Quarter 2015 was £24.8m (2014 - £24.8m) and for the First Half 2015 was
£48.5m (2014 - £47.2m)
● Pro-forma cash flow before interest and tax** for the First Quarter 2015 was £38.3m (2014 - £18.6m) and for the First Half 2015 was £57.2m (2014 - £41.6m)
● Senior net debt was £526.9m at 30 September 2014 (30 June 2014 – £549.8m)
● Redemption of 10% of senior secured notes at 103% effective 28 October 2014
* EBITDA based on regulated entitlement, before exceptional items and certain remeasurements and Arcapita advisory fees and excluding earnings from renewable wind farm assets
** Pro-forma EBITDA, less pension charges, plus movements in provisions and working capital (inc purchase of and proceeds from sale of other intangibles), less gross capex (excluding capex of renewable wind farm assets) and exceptional items and including the effects of FX
4

Energia Group business developments
5
High availability of Huntstown plants with reduction in utilisations ● Availability of 100% for Huntstown 1 and 2 for Second Quarter 2015
● Utilisations of Huntstown 1 at 3.3% and Huntstown 2 at 53.0% for Second Quarter 2015
I- SEM
● I-SEM high level design published by SEM Committee on 17 September 2014. High level design is as proposed in the draft decision published on 9 June 2014
– New centralised Day Ahead Market (“DAM”)
– Participation in the DAM will be mandatory with optional participation in the common European intra-day electricity market
● Capacity Remuneration Mechanism (“CRM”) will be incorporated into the I-SEM
– CRM will be quantity-based in the form of reliability options
● The detailed market design phase has commenced and the Project Plan Quarterly Update published on 10 October 2014 anticipates a delivery date for Go-Live of I-SEM in Q4 2017
Electricity sales volumes
● Business electricity sales volumes for the Second Quarter 2015 were 1.2TWh (Second Quarter 2014 – 1.2TWh)
● Business customer sites supplied at 30 September 2014 were 61,500 (30 June 2014 – 61,100)
● RoI residential customers supplied at 30 September 2014 increased to 38,800 (30 June 2014 – 21,700) reflecting continued growth in customer base following entry into this market in January 2014.

Energia Group business developments (cont’d)
6
Renewable portfolio
PPAs
● Average contracted renewable generation capacity for Second Quarter 2015 was 692MW (Second Quarter 2014 - 602MW) with 692MW operational capacity at 30 September 2014 (30 June 2014 – 692MW)
● 88MW of contracted capacity currently in construction (30 June 2014 – 88MW)
● 144MW in various stages of development (30 June 2014 – 149MW)
Assets
● Direct investment in operational and in-development windfarm capacity 164MW(a) at 30 September 2014
− 9MW operational at 30 September 2014 (30 June 2014 – 9MW)
− Two windfarms with a total capacity of 25MW in construction as at 30 September 2014
− 130MW(a) of fully-consented capacity in development expected to become operational in the next three years
● Further pipeline of projects (43MW) in various stages of obtaining planning permission and grid connections
(a) Includes 31MW for which the acquisition of the minority partner’s share will become effective on financial close

Power NI business developments
7
Electricity Sales and Competition
● Residential customer numbers at 30 September 2014 was 556,000 (30 June 2014 – 559,000)
● Total electricity sales for Second Quarter 2015 was 0.6TWh (Second Quarter 2014 – 0.7TWh)
● Regulated residential tariffs held flat with effect from 1 October 2014 as agreed with Utility Regulator
● The Utility Regulator commissioned Cornwall Energy to undertake a review of effectiveness of competition in the NI energy retail market
− Initial report published on 19 November 2014 concludes that competition is established and increases with customer size
Contracted capacity
● Capacity under contract at 30 September 2014 was 600MW with Ballylumford
● On 19 March 2014 the Utility Regulator announced a consultation on the possible cancellation of PPB’s remaining contracted capacity with Ballylumford from December 2014 based on their economic assessment of the contracts
● Update paper published by the Utility Regulator on 31 July 2014
− PPB proposed to reduce its costs by £2.4m per annum with a ‘gain share’ mechanism
● Final decision published on 10 October 2014
− Latest assessment is that retention of the contract would be beneficial to Northern Ireland customers
− Utility Regulator has decided not to instruct cancellation of PPB’s remaining contracted capacity with Ballylumford at this time but keep under review from both a policy and economic perspective
PPB business developments

0.8
0.6
Q2 14 Q2 15
Energia Group Power NI
18.015.6
5.67.8
1.2 1.2
Q2 14 Q2 15Energia Group Power NI PPB
242.4192.7
92.6
86.1
32.6
26.4
Q2 14 Q2 15
Energia Group Power NI PPB
Financial summary – Second Quarter 2015 Encouraging performance across all businesses
Turnover (£m)(a) Gross Capital Expenditure for continuing operations (£m)(c)
Pro-forma EBITDA (£m)(b)
(a) Turnover is based on regulated entitlement (b) Pro-forma EBITDA is EBITDA based on regulated entitlement, before exceptional items and certain remeasurements and Arcapita advisory fees and excluding earnings from renewable wind farm assets £0.2m Second Quarter 2015
and £nil in Second Quarter 2014. (c) Excludes capital expenditure on renewable wind farm assets of £7.3m in Second Quarter 2015 and £3.8m in Second Quarter 2014. Includes other group capex of £0.2m in Second Quarter 2015 and £0.3m in Second Quarter 2014 (d) Pro-forma cash flow before interest and tax defined as Pro-forma EBITDA, less pension charges, plus movements in provisions and working capital (inc purchase of and proceeds from sale of other intangibles), less gross capex
(excluding capex of renewable wind farm assets) and exceptional items and including the effects of FX 8
Pro-forma cash flow before interest & tax (£m)(d)
367.6
304.5
24.8 24.8
0.7
1.1
18.6
38.3
Q2 14 Q2 15

Energia Group KPIs
9
Q2 14 Q2 15
Energia Group
Availability (%)
Huntstown 1 100.0 100.0
Huntstown 2 99.2 100.0
Utilisation (%)
Huntstown 1 3.9 3.3
Huntstown 2 42.9 53.0
Energia business electricity sales (TWh) 1.2 1.2
Energia business gas sales (therms million) 13 11
Wind farm operational PPA contracts (MW)
Average capacity during the period 602 692
Period end capacity – at 30 September 608 692
18.0
15.6
Q2 14 Q2 15
242.4
192.7
Q2 14 Q2 15
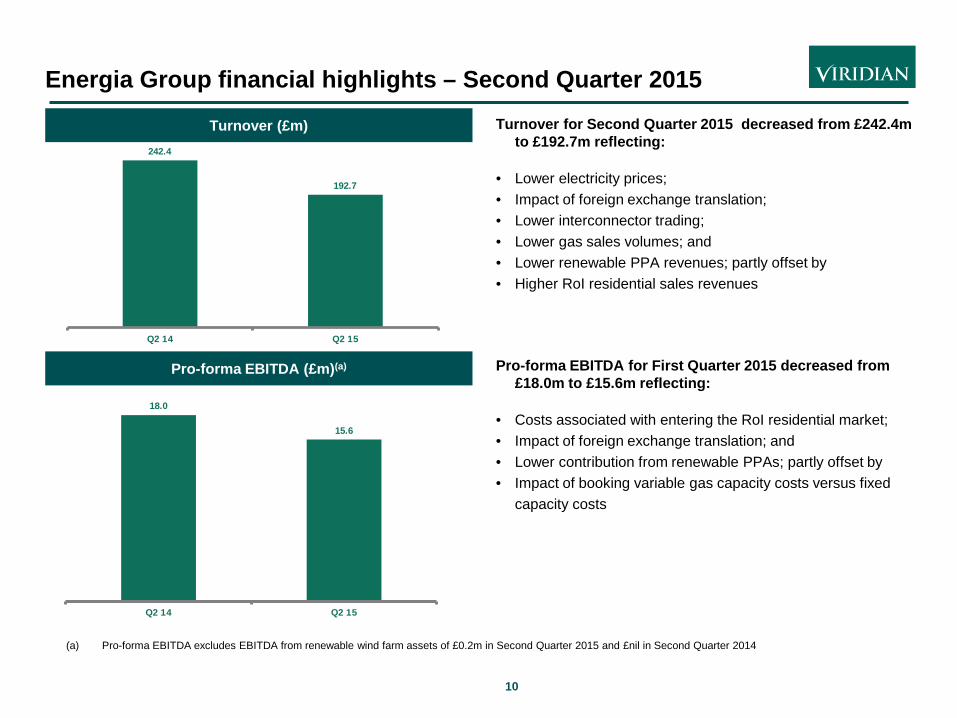
Energia Group financial highlights – Second Quarter 2015
10
Pro-forma EBITDA (£m)(a)
Turnover for Second Quarter 2015 decreased from £242.4m to £192.7m reflecting:
• Lower electricity prices; • Impact of foreign exchange translation; • Lower interconnector trading; • Lower gas sales volumes; and • Lower renewable PPA revenues; partly offset by • Higher RoI residential sales revenues
Pro-forma EBITDA for First Quarter 2015 decreased from £18.0m to £15.6m reflecting:
• Costs associated with entering the RoI residential market; • Impact of foreign exchange translation; and • Lower contribution from renewable PPAs; partly offset by • Impact of booking variable gas capacity costs versus fixed
capacity costs
Turnover (£m)
(a) Pro-forma EBITDA excludes EBITDA from renewable wind farm assets of £0.2m in Second Quarter 2015 and £nil in Second Quarter 2014

Power NI KPIs
11
Q2 14 Q2 15
Power NI
Power NI electricity sales (TWh) 0.7 0.6
Power NI customer sites (No.)
Residential 570,000 556,000
Non-residential 37,000 37,000

5.6
7.8
Q2 14 Q2 15
92.6 86.1
Q2 14 Q2 15
Power NI financial highlights – Second Quarter 2015
12
Turnover (£m)(a)
Turnover for Second Quarter 2015 decreased from £92.6m to £86.1m reflecting:
• Reduction in residential customer numbers; • Lower consumption; and • Lower market prices
Pro-forma EBITDA for Second Quarter 2015 increased from £5.6m to £7.8m reflecting: • Higher unregulated earnings associated with higher unregulated
sales; and • Lower operating costs
Pro-forma EBITDA (£m)(a)
(a) Based on regulated entitlement

1.2 1.2
Q2 14 Q2 15
32.6
26.4
Q2 14 Q2 15
PPB financial highlights – Second Quarter 2015
13
Turnover (£m)(a)
Turnover for Second Quarter 2015 decreased from £32.6m to £26.4m reflecting: • Lower availability and utilisation of the Ballylumford plant; and • Lower market prices
Pro-forma EBITDA for Second Quarter 2015 was £1.2m (Second Quarter 2014 - £1.2m)
Pro-forma EBITDA (£m)(a)
(a) Based on regulated entitlement
14
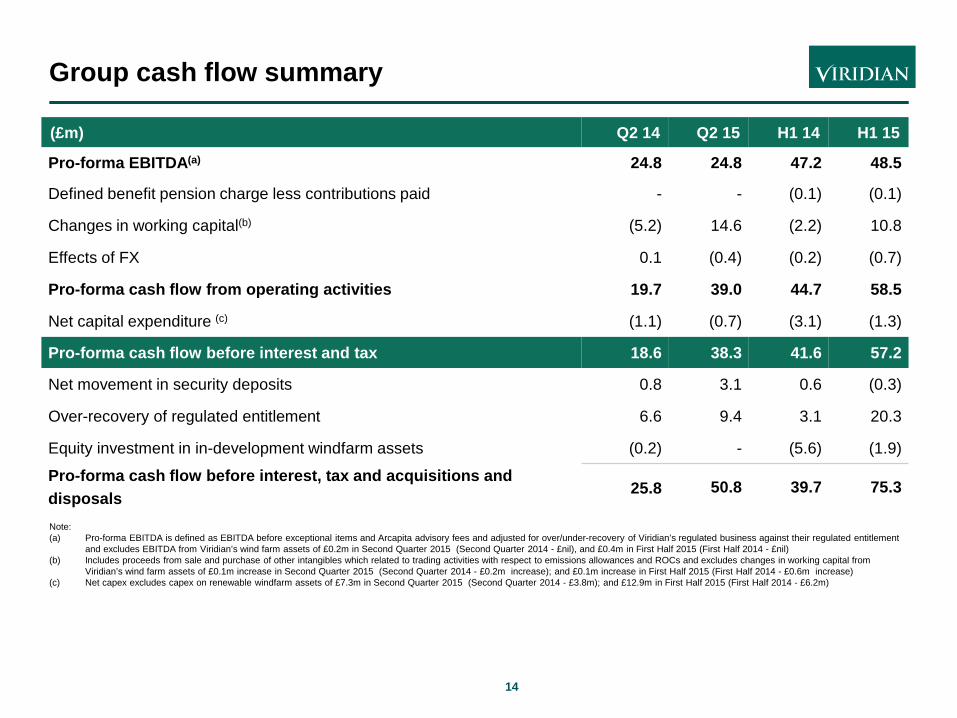
Group cash flow summary
(£m) Q2 14 Q2 15 H1 14 H1 15
Pro-forma EBITDA(a) 24.8 24.8 47.2 48.5
Defined benefit pension charge less contributions paid - - (0.1) (0.1)
Changes in working capital(b) (5.2) 14.6 (2.2) 10.8
Effects of FX 0.1 (0.4) (0.2) (0.7)
Pro-forma cash flow from operating activities 19.7 39.0 44.7 58.5
Net capital expenditure (c) (1.1) (0.7) (3.1) (1.3)
Pro-forma cash flow before interest and tax 18.6 38.3 41.6 57.2
Net movement in security deposits 0.8 3.1 0.6 (0.3)
Over-recovery of regulated entitlement 6.6 9.4 3.1 20.3
Equity investment in in-development windfarm assets (0.2) - (5.6) (1.9)
Pro-forma cash flow before interest, tax and acquisitions and disposals 25.8 50.8 39.7 75.3
Note: (a) Pro-forma EBITDA is defined as EBITDA before exceptional items and Arcapita advisory fees and adjusted for over/under-recovery of Viridian’s regulated business against their regulated entitlement
and excludes EBITDA from Viridian’s wind farm assets of £0.2m in Second Quarter 2015 (Second Quarter 2014 - £nil), and £0.4m in First Half 2015 (First Half 2014 - £nil) (b) Includes proceeds from sale and purchase of other intangibles which related to trading activities with respect to emissions allowances and ROCs and excludes changes in working capital from
Viridian’s wind farm assets of £0.1m increase in Second Quarter 2015 (Second Quarter 2014 - £0.2m increase); and £0.1m increase in First Half 2015 (First Half 2014 - £0.6m increase) (c) Net capex excludes capex on renewable windfarm assets of £7.3m in Second Quarter 2015 (Second Quarter 2014 - £3.8m); and £12.9m in First Half 2015 (First Half 2014 - £6.2m)

15
Net debt
Net debt (£m) As at
31 Mar 14
30 Jun 14 30 Sept 14 Cash and investments (24.9) (48.3) (68.0) Senior secured notes 346.5 337.5 341.5 Senior RCF - - - Subordinated shareholder loan 1,2 382.9 396.1 402.4 Junior bank facility asset 1 (144.8) (146.9) (149.7) Amount due from fellow subsidiary - - (0.2) Interest accruals 1.2 11.4 0.9
Senior net debt 560.9 549.8 526.9
Project finance cash (2.8) (3.2) (5.4) Project finance bank facilities 16.6 21.9 30.2
Total net debt 574.7 568.5 551.7
● Senior net debt decreased to £526.9m at 30 September 2014 (30 June 2014 - £549.8m; 31 March 2014 - £560.9m) ● Cash and investments increased to £68.0m (30 June 2014 - £48.3m; 31 March 2014 - £24.9m) reflecting positive cash
generation and over-recovery of regulated entitlement in the period; ● Senior secured notes increase since June 2014 reflects the amortisation of transaction expenses and OID partly offset
by changes in foreign exchange translation; ● Senior RCF £nil at 30 September 2014 (30 June 2014 - £nil; 31 March 2014 - £nil); ● Increase in subordinated shareholder loan since June 2014 reflects the unwinding of the discounted fair value – interest
cash paid for first time in September 2014 whereas previously capitalised; and ● Increase in junior bank facility asset reflects the unwinding of the discounted fair value
1 Subordinated shareholder loan and junior bank facility asset at 30 September 2014 net to £252.7m (30 June 2014 net to £249.2m; 31 March 2014 net to £238.1m). Junior facility A held on balance sheet of the Company’s parent VGHL at 30 September 2014 was £204.8m (30 June 2014 - £207.5m; 31 March 2014 - £203.6m) 2 Subordinated shareholder loan at 30 September 2014 split between non-interest bearing £171.6m (30 June 2014 - £166.1m; 31 March 2014 - £160.3m) and interest bearing £230.8m (30 June 2014 - £230.0m; 31 March 2014 - £222.6m) which accrues interest on a payment in kind basis

Conclusion ● Encouraging set of results for the Second Quarter 2015 which were in line with expectations ● Outlook:
– Renewable PPA pipeline continues to be delivered
– I-SEM final high level design decision published together with an overall programme for detailed design
phase
– Utility Regulator formally announced decision not to cancel PPB’s remaining contracted capacity
– Continued managed growth in the residential supply market in the RoI
– Capacity pot for 2015 calendar year confirmed – 1.6% increase on 2014
– Current phase of renewable asset investment proceeding according to plan
16