Embed Size (px)
Citation preview

Commonwealth Bank of Australia ACN 123 123 124
Results PresentationFor the half year ended 31 December 2009
10 February 2010
COMMONWEALTH BANK OF AUSTRALIA | ACN 123 123 124 | 10 AUGUST 2016
RESULTS PRESENTATIONFOR THE FULL YEAR ENDED 30 JUNE 2016
For
per
sona
l use
onl
y

2
Customer Focus
TSR Outperformance
People StrengthTechnologyProductivity
Capabilities
Growth
Opportunities
“One CommBank”
Continued growth in business and institutional banking
Disciplined capability-led growth outside Australia
Our Strategy
For
per
sona
l use
onl
y

3
To excel at
securing and
enhancing
the financial
wellbeing of
people, businesses
and communities
Our Vision and Values
Integrity
Accountability
Collaboration
Excellence
Service
Our Vision Our Values
For
per
sona
l use
onl
y
4
Notes
For
per
sona
l use
onl
y
5
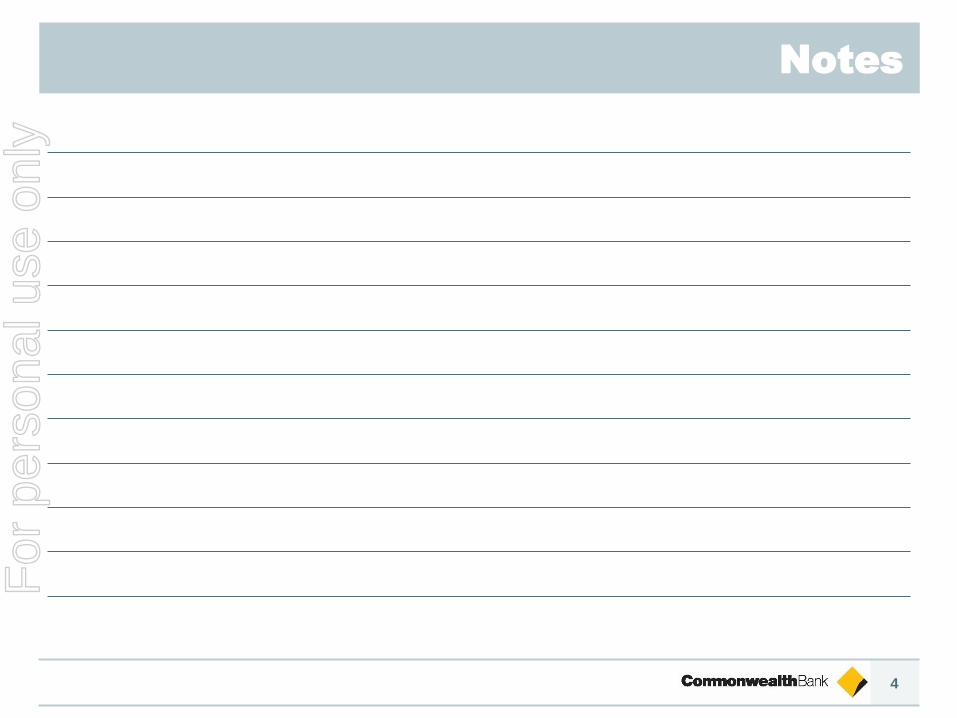
Overview
Result again built on the consistent execution of a
10 year strategy:
- Customer satisfaction, innovation, strength
Changing operating context, impacting returns:
- Economic sentiment
- Interest rates
- Competitive intensity
- Regulatory compliance/costs
Long-term focus, continuing to reinvest
For
per
sona
l use
onl
y

6
Total assets ($bn) 933 7%
Total liabilities ($bn) 872 6%
FUA ($bn) – average 143 4%
RWA ($bn) 395 7%
Provisions to Credit RWAs (%) 1.09% (5) bpts
Cash earnings ($m) 9,450 3%
ROE (Cash) 16.5% (170) bpts
Cash EPS ($) 5.55 -
DPS ($) 4.20 -
Cost-to-Income 42.4% (40) bpts
NIM (%) 2.07 (2) bpts
NIM (%) ex Treasury & Markets 2.06 -
Group ($m) 14,177 6%
Retail Banking Services ($m) 6,988 10%
Business and Private Banking ($m) 2,419 6%
Institutional Banking & Markets3 ($m) 1,772 (3%)
Wealth Management ($m) 717 15%
NZ (NZ$m) 1,444 4%
Bankwest ($m) 1,082 -
Additional
information
Balance Sheet
Financial Operating Performance 2
Snapshot FY161
Capital & Funding
1. All movements on prior comparative period unless stated 2. Operating Performance is Total Operating Income less Operating
Expense 3. Growth (1%) ex CVA / FVA 4. Internationally comparable capital - refer glossary for definition 5. The Group
commenced disclosure of its leverage ratio at 30 September 2015, thus no comparatives have been presented
Capital – CET1 (Int’l)4 14.4% 170 bpts
Capital – CET1 (APRA) 10.6% 150 bpts
LT wholesale funding WAM (yrs) 4.1 0.3yrs
Deposit funding (%) 66% 1%
Liquidity Coverage Ratio (%) 120% -
Leverage Ratio (APRA) 5.0% N/A5
For
per
sona
l use
onl
y

7
Jun 16Jun 16 vs
Jun 15
Statutory Profit ($m) 9,227 2%
Cash NPAT ($m) 9,450 3%
ROE – Cash (%) 16.5% (170) bpts
Cash Earnings per Share ($) 5.55 -
Dividend per Share ($) 4.20 -
Cash NPAT up 3%
For
per
sona
l use
onl
y

8
FY16 vs FY15
Business Unit% of
Group
NPAT
Operating
IncomeCosts
Operating
PerformanceLIE
Cash
NPAT
Cost-to-
Income
Jun 16
RBS 47% 8% 3% 10% 5% 11% 33%
BPB 17% 5% 4% 6% 18% 5% 38%
IB&M 12% 2% 11% (3%) 51% (9%) 38%
IB&M 13% 3% 11% (1%) 51% (7%) 37%
Wealth 7% 2% (3%) 15% n/a (6%) 70%
ASB 9% 6% 3% 8% 46% 5% 37%
BWA 8% (1%) (2%) - (80%) (4%) 42%
IFS 0% 13% 39% (37%) large (57%) 81%
Business Unit Summary
1
Additional
information
ex CVA / FVA
1. Excludes Corporate Centre and Other. 2. % of Group NPAT calculated based on Group result excluding CVA / FVA
3. ASB result in NZD except for “% of Group NPAT”, which is in AUD. 4. BWA LIE represents a reduction in loan impairment benefit.
3
2
4For
per
sona
l use
onl
y

9
4,436 1,567 1,164 617 763 908
RBS BPB IB&M WM BWA ASB
$m
1. All movements on prior comparative period except where noted
2. Growth in Markets income excluding derivative valuation adjustments
3. ASB result and performance metrics in NZD
3
Income 8%
C:I 150 bpts to 32.6%
Business loans 6%
Loan impairment 18%
Markets 14%
Loan impairment 51%
Funds Income 2%
CommInsure 13%
C:I 30 bpts to 41.7%
Reduced impairment credit
Home loans 9%
C:I 110 bpts to 37.3%
Loan impairment 46%+11%
+5%
-9%
-6%-4%
+5%
Cash NPAT FY161
Divisional Contributions
2
For
per
sona
l use
onl
y

10
Customer Satisfaction
85%
87%
89%
91%
93%
95%
97%
Dec 14 Jun 15 Dec 15 Jun 16
Satisfaction with Internet Banking Services
via "Website" or "App“
Internet Banking
Peer 1CBA Peer 2 Peer 3Refer notes slide at back of this presentation for source information
Additional
information
93.3%
For
per
sona
l use
onl
y

11
Continued focus on the customer
Retail #1 13 consecutive months to Jun 16
Business #1 First or equal first - all key segments
Wealth #1 Regained #1 in adviser satisfaction in Apr 16
IFS #1 PT Bank Commonwealth (Indonesia)
Internet #1 First or equal first since May 2013
Customer Satisfaction
=
Refer notes slide at back of this presentation for source information
For
per
sona
l use
onl
y

12
42.9
44.4
43.3
30.528.6
27.2
MFI Share
Refer notes slide at back of this presentation for source information
%
CBA (incl. Bankwest)
Peer 1 Peer 2Peer 3 14-17 25-34 35-49 50-64 65+18-24
Overall 33.9%
MF
I S
ha
re %
Customer lifecycle (age)
Opportunity
Gap
MFI Share MFI Share by Age
Additional
information
Date Legend
Jun 1
5
Jun 1
4
Jun 1
633.1
13.5 13.6
11.6 11.9
20.219.2
13.5
11.4
34.2 33.9
19.4
Jun 16
Jun 14
For
per
sona
l use
onl
y

13
Customer focus - more needs met
CBA Peers
Jun 06 Jun 16
(#)
Refer notes slide at back of this presentation for source information
Jun 06 Jun 16
% Satisfied ('Very Satisfied' or 'Fairly Satisfied')
Retail Customer Satisfaction Customer Needs Met
3.15
62%
67%
72%
77%
82%
87% 82.8%
2.0
2.2
2.4
2.6
2.8
3.0
3.2
For
per
sona
l use
onl
y
14
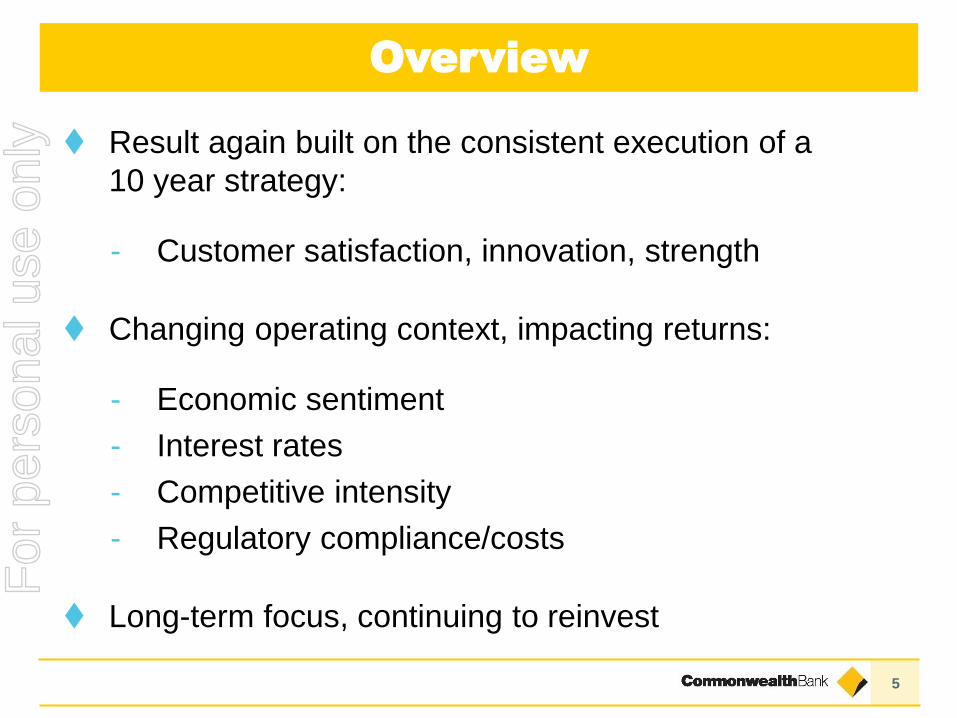
Market Share1
% Jun 16 Dec 15 Jun 15
Home loans 25.3 25.1 25.2
Credit cards – RBA2 24.4 24.7 24.3
Other household lending3 16.8 16.9 17.4
Household deposits4 29.2 29.1 29.0
Business lending – RBA 16.9 17.0 17.0
Business lending – APRA 18.7 18.7 18.8
Business deposits – APRA 20.2 20.3 20.3
Asset finance 12.8 13.1 13.2
Equities trading 4.7 5.6 6.0
Equities – online retail trading5 55.8 56.1 55.6
Australian Retail – administrator view6 15.7 15.6 15.8
FirstChoice Platform6 11.1 11.0 11.1
Australia life insurance (total risk)6 11.4 11.6 12.1
Australia life insurance (individual risk)6 10.9 11.0 11.6
NZ home loans 21.8 21.8 21.7
NZ retail deposits 21.0 20.9 21.4
NZ business lending 12.4 11.9 11.6
NZ retail FUA6 15.6 15.7 16.2
NZ annual inforce premiums6 28.5 28.7 28.8
Additional
information
1. Prior periods have been restated in line with market updates 2. As at 31 May 16 3. Includes personal loans, margin loans and
other forms of lending to individuals 4. Comparatives have been restated to include the impact of new market entrants. 5. CommSec market share is an internally derived number based on publically available ASX data 6. As at 31 Mar 16.
For
per
sona
l use
onl
y

15
8.8%9.5%
6.7% 7.0% 6.6%6.1%
8.8% 9.1%
6.6%
12.7%
Ongoing volume growth
Household
Deposits
Home
Lending
Business
Lending2
ASB
(Business & Rural)
12 months to Jun 16
BPB > system in 2H16
IB&M < system in 2H16
1. Spot balance growth twelve months to June 2016. Source RBA/APRA/RBNZ. CBA includes BWA except Business Lending. 2. Domestic Lending balance growth (BPB & IB&M). Source RBA.
System CBA
ASB
(Home Lending)ex Bankwest
Above system growth in
2H16
Driven by continued strong
growth in Transaction Accounts
Balance Growth1
ASB – strong growth across the
board: housing, business, rural
For
per
sona
l use
onl
y

161. Source: APRA. Total deposits (excluding CD’s). CBA includes Bankwest. 2. Source: Pillar 3 Regulatory Disclosure, 31 March
2016 3. Peer comparisons are calculated from disclosures assuming there are not material balances in the “notice period
deposits that have been called” and the “fully insured non-operational deposits” categories.
Deposits
Deposits vs Peers1
Deposits in LCR calculation2
Additional
information
June 2016 ($bn)
231
182
114 106
210
187
194
138
CBA Peer 3 Peer 2 Peer 1
Household
deposits
Other
deposits
244
308
369
441
As at 31 March 2016 ($bn)
5% 10% 25% 25% 40% 100%
30 day Net Cash Outflow assumptions
CBA overweight more
stable deposits
3 3
3 3
-
20
40
60
80
100
120
140
160
Retail /SME Stable
Retail /SME Less
stable
Retail /SME High
runoff
AllOperational
accounts
Corp/GovNon
Operational
FI NonOperational
CBA
Peer 1
Peer 2
Peer 3
For
per
sona
l use
onl
y

17
15%
9% 14% 17%
34%
14% 14%
20%
40%
RBS BPB IB&M BWA NZ
88,351 103,528
126,780
FY14 FY15 FY16
Transaction Banking
$m
2
Ex
offset
accounts
FY16 v FY15
Group Transaction Balances Strong growth across divisions
RBS New Transaction Accounts3
+22%
831k959k
1,070k
FY14 FY15 FY16
#
1. Includes non-interest bearing deposits. 2. Excludes Cash Management Pooling Facilities (CMPF). 3. Number of new RBS
personal transaction accounts, including offset accounts.
1
Innovation & Simplicity
Real time
Instant Banking
Fast, simple processes
Group
+22%
+29%
For
per
sona
l use
onl
y

18
Easy
application
and approval
with focus on
financial
wellbeing
Simplified Personal Loans
Easy
conversion
of
conditional
to full
approval
Simplified Home Loans
Enhanced Property Search
Open, fund
and access
transaction
accounts
in under 5
minutes
Instant Banking
Now across
key platforms
– property
listings,
prices etc
Innovation and Simplicity
For
per
sona
l use
onl
y

19
New transaction
accounts opened < 5
minutes + instant
access via Cardless
Cash, Tap & Pay
Innovation and Simplicity
May 2016
Instant Banking Photo a billPaperless Statements
1. Since launch in October 2015
BPAY details
automatically
populated from photo
– simple click for
payment
June 2016October 2015
Move to paperless
statements with a single
click - over 800,000
additional accounts now
paperless1
For
per
sona
l use
onl
y

20
40k+ Albert terminals,
24 apps incl. Kounta -
cloud based system for
orders, payments,
inventory update -
same time, one device
March 2016
Kounta on AlbertOnDeck
1. Australian FinTech Awards.
Exclusive banking
referral arrangement
with leading online
small business lender
February 2016
Awarded
Best
Fintech/Bank
Collaboration1
Innovation Labs
May 2016
Sydney, Hong Kong,
London -
Supporting an
innovation ecosystem
with clients,
government and
communities
Innovation and Simplicity
Melbourne “pop-up”
For
per
sona
l use
onl
y

21
Now with 40,000+
devices in market
60% new merchants
to CBA
Roll-out
AlbertEasy Alerts
Customisable push
notifications for
deposits, high/low
balance & payment
reminders
October 2015
Canstar
Innovation
Award
TYME
May 2016
Innovation and Simplicity
Customer on-boarding
in ~5 minutes with
biometric
identification
(500 kiosks1)
1. In Pick ‘n’ Pay stores within South Africa
For
per
sona
l use
onl
y

22
ProductivityAdditional
information
Productivity Metrics Personal Loans – Same day funding
10%
26%
29%
32%
37%
42%
FY11 FY12 FY13 FY14 FY15 FY16
% of new loans funded same day1
1. Percentage of personal loans funded on day of application, excluding applications referred for
manual decisioning and fraud verification
Measure Metric Timeframe
Asset Finance
Approval
– turnaround
times
Settlement Received to Funded
(for the new Fast Lane abridged
settlement process)
FY16 vs
FY15
SME Loan
Approval (IFS)
– turnaround
times
Median turnaround time in days
from SME customers wanting to
have an unsecured or secured
loan with CBA China county
banks to credit approval
May 16 vs
May 15
Colonial First
State Customer
Request
– turnaround
times
Median time in hours from
customer request receipt time
until request is fully processed by
CFS Investor Services
Mar 16 vs
Dec 14
Bankwest Small
Business
Personal Liability
Credit Card
– turnaround
times (TAT)
TAT in calendar days from when
the customer requests the
application (sales enquiry) to the
time the customer has their credit
card ordered using the 75th
percentile as a measure
FY16 vs
FY15For
per
sona
l use
onl
y

23
Productivity + Efficiency + Investment
Cost-to-Income Reinvestment
44.6
42.842.4
FY12 FY15 FY16
(%)
1,246
51%
37%
12%
FY15 FY16
Productivity
& Growth
Risk &
Compliance
Branches
& Other
Productivity
72%
Bankwest
Small Business
Credit Card
(Turnaround time)
Asset Finance
Approval
(Turnaround time)
SME Loan
Approval - IFS
(Turnaround time)
Colonial
Customer
Requests
(Turnaround time)
97%
73%
85%
1,373
($m)
+10%
For
per
sona
l use
onl
y

24
Notes
For
per
sona
l use
onl
y

25
9.1%
10.6%65%
66% 3.84.1
75
12.7%
14.4%
59
Jun 15 Jun 16 Jun 15 Jun 16 Jun 15 Jun 16 Jun 15 Jun 16
Basel III
Common Equity Tier 1
Strength
% of Total Funding Portfolio Tenor2
(years)
$bn
LCR
120% 120%
CLF1
HQLA1
assets
Internationally
comparable1
1. Refer glossary for definitions 2. Weighted Average Maturity of long term wholesale debt. Includes all deals with first call or residual maturity of 12 months or greater. 3. Liquids are reported net of applicable regulatory haircuts.
134
CapitalDeposit
Funding
Wholesale
FundingLiquidity
3
132
66
66
For
per
sona
l use
onl
y

26
Notes
For
per
sona
l use
onl
y

Commonwealth Bank of Australia ACN 123 123 124
Results PresentationFor the half year ended 31 December 2009
10 February 2010
COMMONWEALTH BANK OF AUSTRALIA | ACN 123 123 124 | 10 AUGUST 2016
RESULTS PRESENTATIONFOR THE FULL YEAR ENDED 30 JUNE 2016
CHIE F F INA NCIA L OFF ICE R
DAV ID CRA IGFor
per
sona
l use
onl
y

28
$m Jun 16 Jun 15
Cash NPAT 9,450 9,137
Non-cash items
Hedging and IFRS volatility
Unrealised accounting
gains and losses arising
from the application of
“AASB 139 Financial
Instruments:
Recognition and
Measurement”
(200) 6
Other
Bankwest non-cash
items(27) (52)
Treasury shares
valuation adjustment4 (28)
Total non-cash items (223) (74)
Statutory NPAT 9,227 9,063
Non-cash items & TaxAdditional
information
Non-cash items Tax
Effective Tax Rate “cash basis” (%)
27.2% 27.3%27.5%
FY14 FY15 FY16
• Australia’s largest tax payer1
• Effective tax rate reflects global business mix
• Signatory of Voluntary Tax Transparency Code
1. Bloomberg, July 2016
For
per
sona
l use
onl
y
29
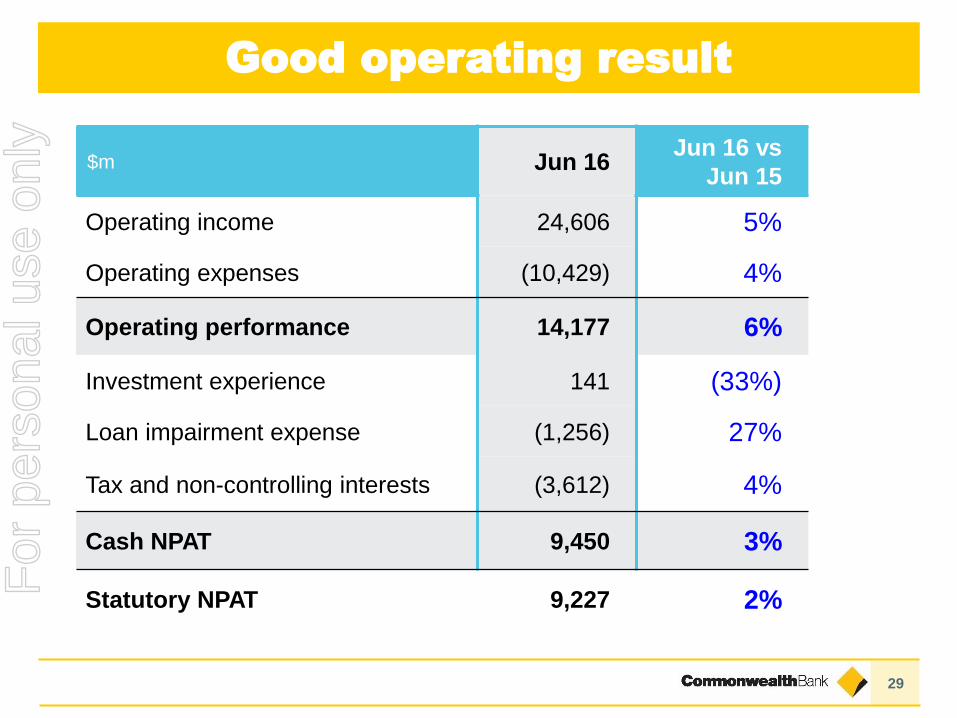
Good operating result
$m Jun 16Jun 16 vs
Jun 15
Operating income 24,606 5%
Operating expenses (10,429) 4%
Operating performance 14,177 6%
Investment experience 141 (33%)
Loan impairment expense (1,256) 27%
Tax and non-controlling interests (3,612) 4%
Cash NPAT 9,450 3%
Statutory NPAT 9,227 2%
For
per
sona
l use
onl
y

30
573 654
783
371
424
3782
(39) (74)
FY14 FY15 FY16
$m
Other Banking Income
$m
Sales
Trading
CVA / FVA
1,0871,039
946
2,112 2,209 2,215
1,037 1,005 1,010
946 1,039 1,087
188
558 5484,283
4,811 4,860
FY14 FY15 FY16
Commissions
Lending
fees
Trading
Other
Other Banking Income Trading Income
Additional
information
For
per
sona
l use
onl
y

31
15,82716,935
4,8114,860
2,7302,811
FY15 FY16
Operating Income up 5%
+5.3%
$m
Average FUA 4%
Insurance income flat
Volume 8%
Margin (2) bpts
FVA / CVA ($35m)
Trading (ex FVA/CVA) 8%
OBI (ex Trading) flat
Funds & Insurance +3%
Other Banking Income +1%
Net Interest Income +7%
+4.7% before FX
For
per
sona
l use
onl
y

32
- -2
(2)
(2)
209 207
FY15 Assetpricing
Fundingcosts &
Basis risk
Portfoliomix
Capital &Other
Treasury &Markets
FY16
206 206
Group NIM 3bps ex Treasury & Markets
ex Treasury
& Markets
Group NIMAdditional
information
12 Month Movement
bpts
210 206 206
214209
207
FY14 FY15 FY16
For
per
sona
l use
onl
y

33
12
(3) (1) (1)
206205
1H16 Assetpricing
Fundingcosts &
Basis risk
Portfoliomix
Capital &Other
Treasury& Markets
2H16
208206
Underlying Group NIM down 1bpt1
1. Excluding Treasury and Markets
ex Treasury
& Markets
bpts
6 Month Movement
209 204 206 205
Dec 14 Jun 15 Dec 15 Jun 16
212207 208 206
For
per
sona
l use
onl
y

34
65%58%
51%
24%30%
37%
11% 12% 12%
FY14 FY15 FY16
1st Half
2nd Half
$m
541647 582 589 595
681
638639
655 593651
692
FY11 FY12 FY13 FY14 FY15 FY16
1,179
1,286
% of total
Productivity
& Growth
Branches
& Other
Risk &
Compliance
1,2371,182
1,246
Continuing to InvestAdditional
information
Gross Investment Spend Investment Spend
1,373
For
per
sona
l use
onl
y

35
250 71 65 71
(21)9,993
10,293 10,429
FY15 Staff Amortisation Other FY16underlying
InvestmentSpend
increase
FX FY16
Underlying expenses up 3%
$m
Underlying
Total Operating Expenses
+4.4%+3.0%
For
per
sona
l use
onl
y

36
Credit quality
Consumer (bpts)
Corporate (bpts)
90+ days
ASB
Bankwest
RBS
Additional
information
LIE to Gross Loans
LIE to Gross Loans
Home Loan Arrears
17
19
1718 18 18
FY11 FY12 FY13 FY14 FY15 FY16
43
24 23
1311
20
FY11 FY12 FY13 FY14 FY15 FY16
0.0%
0.5%
1.0%
1.5%
Jun 13 Dec 13 Jun 14 Dec 14 Jun 15 Dec 15 Jun 16
1324
30
13
1Q16 2Q16 3Q16 4Q16
Uptick largely in
commodity and
related sectors
20132012
2016
20152014
90+ days
Group Home Loan Arrears
LIE percentage of average GLA. Consumer represents Retail Banking Services, ASB Retail, Bankwest Retail and IFS Retail. Corporate represents Institutional Banking and Markets, Business and Private Banking, ASB Business, Bankwest Business, IFS Business and other corporate related expense. Statutory Corporate LIE for FY13 26 bpts and FY14 11 bpts.
0.0%
0.5%
1.0%
1.5%
Jun Jul Aug Sep Oct Nov Dec Jan Feb Mar Apr May Jun
For
per
sona
l use
onl
y
37
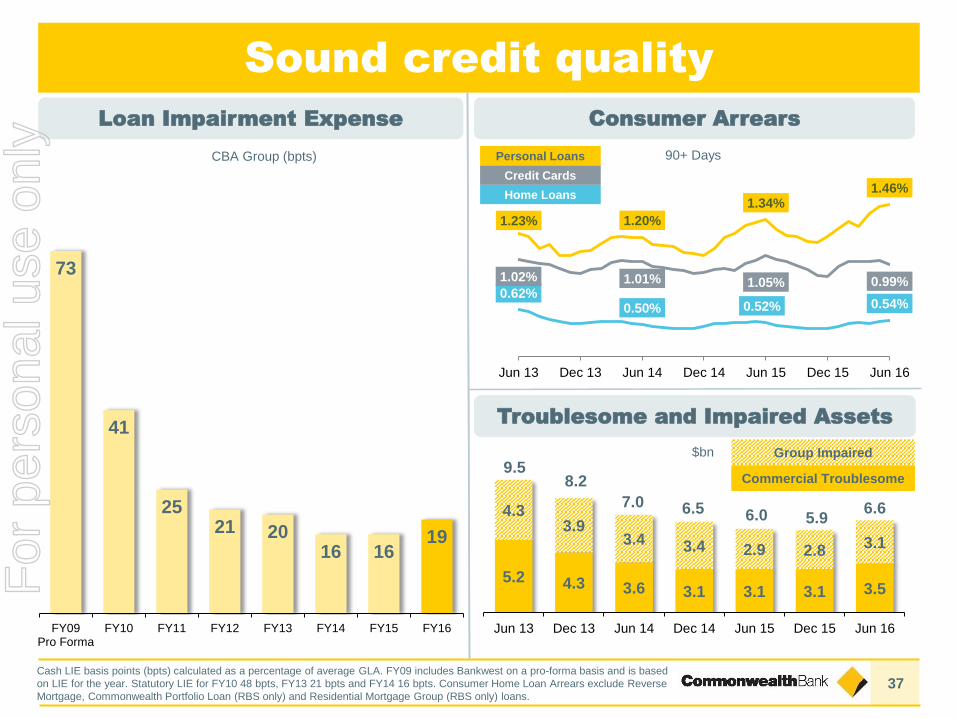
Sound credit quality
$bn
90+ DaysCBA Group (bpts)
Home Loans
Credit Cards
Personal Loans
Loan Impairment Expense
Troublesome and Impaired Assets
73
41
2521 20
16 1619
FY09Pro Forma
FY10 FY11 FY12 FY13 FY14 FY15 FY16
5.2 4.3 3.6 3.1 3.1 3.1 3.5
4.33.9
3.4 3.4 2.9 2.83.1
Jun 13 Dec 13 Jun 14 Dec 14 Jun 15 Dec 15 Jun 16
Group Impaired
Commercial Troublesome9.5
8.2
7.0 6.5 6.0 5.9
Consumer Arrears
0.62%0.50% 0.52% 0.54%
1.23% 1.20%
1.34%1.46%
1.02% 1.01% 1.05% 0.99%
Jun 13 Dec 13 Jun 14 Dec 14 Jun 15 Dec 15 Jun 16
6.6
Cash LIE basis points (bpts) calculated as a percentage of average GLA. FY09 includes Bankwest on a pro-forma basis and is based
on LIE for the year. Statutory LIE for FY10 48 bpts, FY13 21 bpts and FY14 16 bpts. Consumer Home Loan Arrears exclude Reverse
Mortgage, Commonwealth Portfolio Loan (RBS only) and Residential Mortgage Group (RBS only) loans.
For
per
sona
l use
onl
y
38
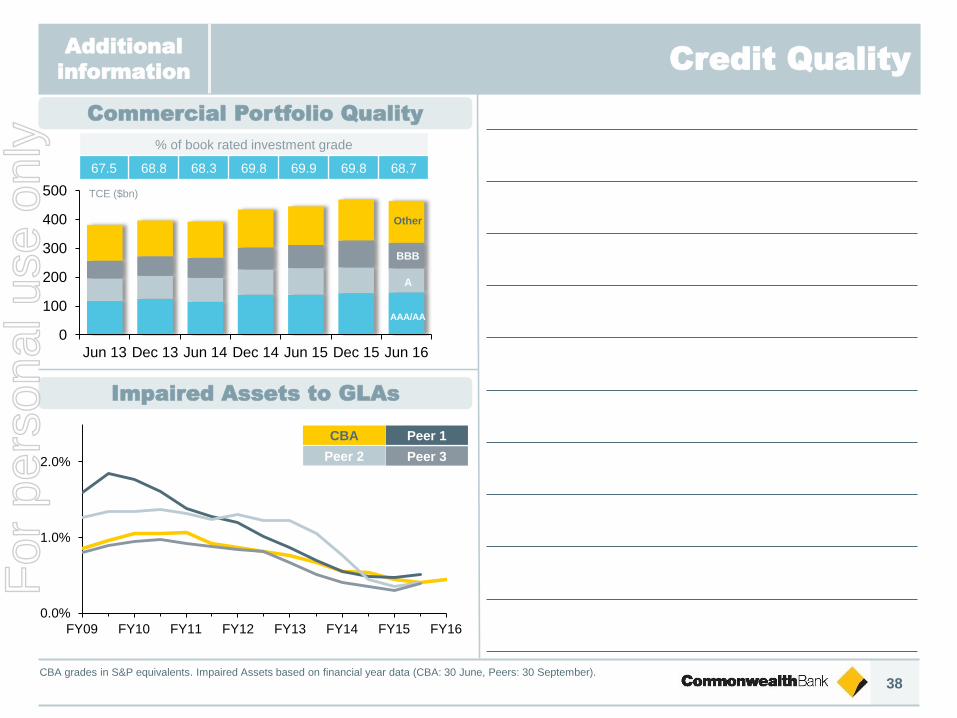
Credit QualityAdditional
information
0
100
200
300
400
500
Jun 13 Dec 13 Jun 14 Dec 14 Jun 15 Dec 15 Jun 16
AAA/AA
A
BBB
Other
TCE ($bn)
% of book rated investment grade
67.5 68.8 68.3 69.8 69.9 69.8 68.7
Commercial Portfolio Quality
Impaired Assets to GLAs
0.0%
1.0%
2.0%
FY09 FY10 FY11 FY12 FY13 FY14 FY15 FY16
CBA Peer 1
Peer 2 Peer 3
CBA grades in S&P equivalents. Impaired Assets based on financial year data (CBA: 30 June, Peers: 30 September).
For
per
sona
l use
onl
y

39
Strong provisioning
Individual Provisions Collective Provisions
$m $m
Bankwest
Consumer
Commercial
Overlay
610492
566
128
128
169
389
267209
Jun 14 Jun 15 Jun 16
944887
1,127
729 762 859
941 9811,077
347 264187
762 755695
Jun 14 Jun 15 Jun 16
2,7622,779 2,818
Economic
Overlay
unchanged
For
per
sona
l use
onl
y

40
RBS
Source: RBA/APRA. CBA includes Bankwest
CBA Peer 1
Peer 2 Peer 3$m FY16FY16 vs
FY15
Home loans 4,100 9%
Consumer finance 2,520 4%
Retail deposits 3,149 11%
Distribution 427 8%
Other 165 0%
Total banking income 10,361 8%
Operating expenses (3,373) 3%
Operating performance 6,988 10%
Loan impairment expense (660) 5%
Tax (1,892) 11%
Cash net profit after tax 4,436 11%
Additional
information
Retail Banking Services Home Loan Market Share
25.3%
23.2%
14.8%
14.6%
Jun 07 Jun 16
11%
13%
15%
17%
19%
21%
23%
25%
27%
For
per
sona
l use
onl
y
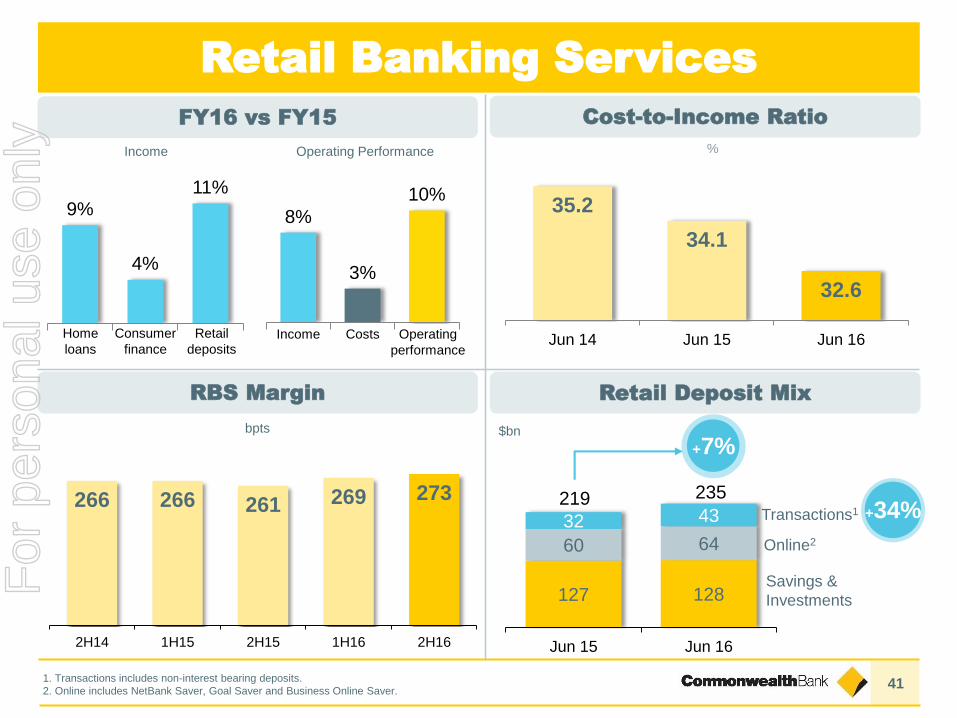
41
35.2
34.1
32.6
Jun 14 Jun 15 Jun 16
127 128
60 64
32 43
Jun 15 Jun 16
bpts $bn
Retail Banking Services
235219
1. Transactions includes non-interest bearing deposits.
2. Online includes NetBank Saver, Goal Saver and Business Online Saver.
Savings &
Investments
Online2
Transactions1
%
9%
4%
11%
Home
loans
Consumer
finance
Retail
deposits
8%
3%
10%
Income Costs Operating
performance
Income Operating Performance
266 266 261 269 273
2H14 1H15 2H15 1H16 2H16
FY16 vs FY15 Cost-to-Income Ratio
Retail Deposit MixRBS Margin
+7%
+34%
For
per
sona
l use
onl
y

42
Corporate
$m FY16FY16 vs
FY15
Corporate Financial Services 1,395 6%
Regional and Agribusiness 646 1%
Local Business Banking 1,137 5%
Private Bank 366 11%
CommSec 364 7%
Total banking income 3,908 5%
Operating expenses (1,489) 4%
Operating performance 2,419 6%
Loan impairment expense (179) 18%
Tax (673) 5%
Cash net profit after tax 1,567 5%
$m FY16FY16 vs
FY15
Institutional Banking 2,164 0%
Markets 689 9%
Total banking income 2,853 2%
Operating expenses (1,081) 11%
Operating performance 1,772 (3%)
Loan impairment expense (252) 51%
Tax (356) (6%)
Cash net profit after tax 1,164 (9%)
Additional
information
Business & Private Banking Institutional Banking & Markets
For
per
sona
l use
onl
y

431. Spot balance growth twelve months to June 2016. 2. Spot balance growth six months to June 2016. 3. Source RBA. IB&M represents Core Domestic Lending balance growth and excludes Cash Management Pooling Facilities (CMPF). 4. Combined Institutional Banking and Markets and Business and Private Banking.
Corporate
bpts
Income Operating Performance
CFS RAB LBB Private
Bank
Comm
Sec
Income Costs Operating
performance
Income Operating Performance
Institutional
Banking
Markets
(ex CVA /
FVA)
Markets Income
(ex CVA /
FVA)
Costs Operating
performance
BPB – FY16 vs FY15 IB&M – FY16 vs FY15
NIM4
0%
9%
14%
2%
11%
(3%)3%
6%
1%
5%
11%
7%5%
4%
6%
204
197192
Jun 15 Dec 15 Jun 16
12 months to Jun 16
6.6% 6.1%
7.7%
Australian Business Lending Growth
6 months to Jun 16
2.5%
4.4%
(1.4%)
System BPB IB&M IB&MSystem BPB
2, 31, 3
For
per
sona
l use
onl
y
44
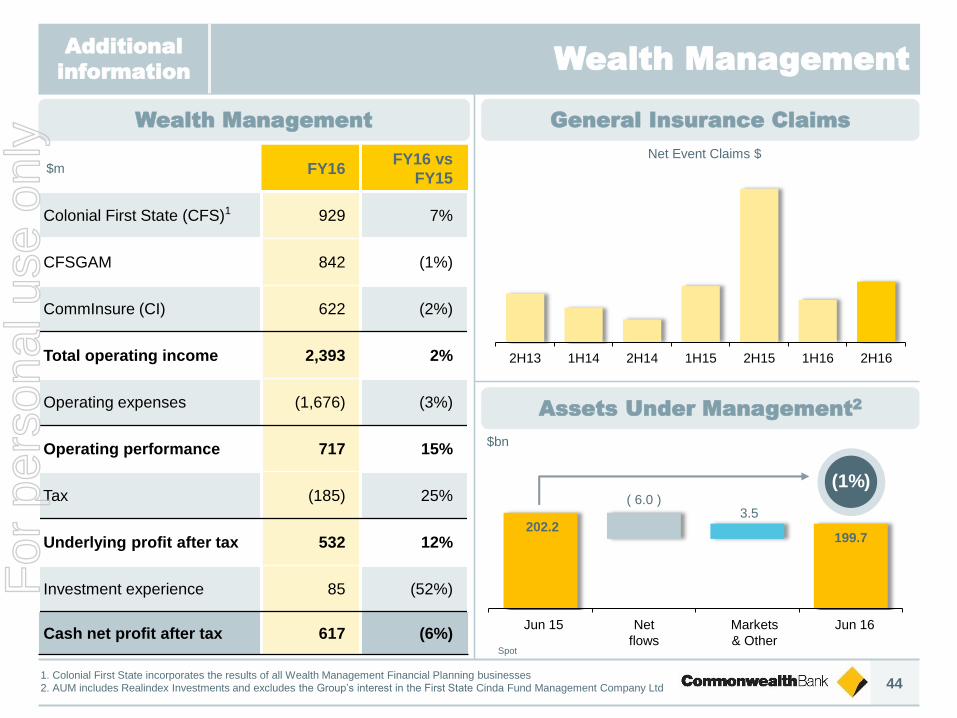
Wealth Management
$m FY16FY16 vs
FY15
Colonial First State (CFS)1 929 7%
CFSGAM 842 (1%)
CommInsure (CI) 622 (2%)
Total operating income 2,393 2%
Operating expenses (1,676) (3%)
Operating performance 717 15%
Tax (185) 25%
Underlying profit after tax 532 12%
Investment experience 85 (52%)
Cash net profit after tax 617 (6%)
1. Colonial First State incorporates the results of all Wealth Management Financial Planning businesses
2. AUM includes Realindex Investments and excludes the Group’s interest in the First State Cinda Fund Management Company Ltd
$bn
Spot
Additional
information
Wealth Management General Insurance Claims
Assets Under Management2
(1%)
Net Event Claims $
2H13 1H14 2H14 1H15 2H15 1H16 2H16
202.2
( 6.0 )3.5
199.7
Jun 15 Jun 16Net
flows
Markets
& Other
For
per
sona
l use
onl
y

45
2%
(3%)
15%
(6%)
7%
(1%)
(2%)
FY16 vs FY15
3 year rolling average of percentage of assets outperforming
benchmark returns
Wealth Management
Income1 Operating Performance
CFS CFSGAM CISpot
$bn
$m
Funds Under Administration
Insurance Inforce CFSGAM Funds Performance
131.9134.3
1.3 1.1
Jun-15 Net Flows Markets and Other Jun-16Jun 15 Jun 16Net
Flows
Markets
& Other
2,467
(1)42
2,508
Jun-15 Life Insurance General Insurance Jun-16
+2%
Jun 15 Jun 16Life
Insurance
General
InsuranceSpot
1. Total operating income
2. Driven by non-recurrence of divestments and investment revaluation gains in the prior year
NPATIncome1 CostsOp.
perf.
Investment
experience
52%
+2%
80%
100% 100%
76%
100%
25%
100% 99%
69%
6%
100%
78%
Core Growth Global
resourcesProperty
securities
Global
infra-
structure
securities
Fixed
interestCash Stewart
Investors
Infra
structure
funds
Weighted
AverageRealindexFirst
State
Stewart
Asia
2
For
per
sona
l use
onl
y

46
113 113 120 132 137 164 183 198 198153 115 170 188 197 200 218 222 222
FY08 FY09 FY10 FY11 FY12 FY13 FY14 FY15 FY16
Interim Final
cents
Dividend per Share
Payout ratio (cash)
Additional
information
63%
87%
84%74% 63%
84%
62%
84%
62%
90%
71%
81%
70%
81%
70%
81%
71%
75.0% 78.2% 73.9% 73.2% 75.8% 75.9% 75.1% 75.1% 76.5%
82%
For
per
sona
l use
onl
y

47
266
228
290
320334
364
401420 420
FY08 FY09 FY10 FY11 FY12 FY13 FY14 FY15 FY16
Dividend maintained
Cash NPAT Payout Ratio
cents per share
76.5%75.1%75.1%75.9%75.8%73.2%73.9%
78.2%75.0%
For
per
sona
l use
onl
y

48
Pro-forma Capital Additional
information
10.6%9.6%
8.0%
14.4%
(100)
CET1 (APRA)ReportedJun 16
Higher mortgagerisk weight
CET1 (APRA)Pro-forma
Jun 16
APRAMin
CET1 (Int'l)ReportedJun 16
Entitlement offer
(Aug-15) raised
$5.1bn or 131
bpts
Estimated increase
in average risk
weight for the
Group’s mortgage
portfolio1
Mortgage risk weight change has
no impact on the Group’s
internationally comparable ratio.
Capital raising strengthened the
Group’s position within the Global
top quartile
1. On 5 August 2016, APRA reaffirmed its aim to increase the average risk weight on Australian mortgages measured across all IRB
ADIs to an average of at least 25 per cent. APRA has advised both recalibration and modelling changes which are likely to lead to
some volatility in mortgage risk weights over coming quarters as these changes are finalised. 2. Refer glossary for definition
2
Note: Colonial Group debt – first tranche matured in April 2015 ($350m). Remaining debt to mature in FY17 ($1,200m or 30bpts of CET1) and FY18 ($665m or 15bpts of CET1).
For
per
sona
l use
onl
y

49
Strong Capital Position
1. Internationally comparable capital - refer glossary for definition
bpts
CET1
118(72)
(6)
9.1%
10.2% 10.6%
8.0%
14.4%
Jun 15APRA
Dec 15APRA
Dec 15Interim
Dividend(Net of DRP)
CashNPAT
RWA& Other
Jun 16APRA
APRAMin
Jun 16Int'l 1F
or p
erso
nal u
se o
nly

50
Notes
For
per
sona
l use
onl
y

51
International Peer Basel III CET1
G-SIBs in dark grey
1. APRA Insight Issue Two “International capital comparison update” (4 July 2016)
2. Domestic peer figures as at 31 March 2016. NAB included in peer bank top quartile in accordance with APRA update (see 1 above).
3. Deduction for accrued expected future dividends added back for comparability
Source: Morgan Stanley and CBA. Based on last reported CET1 ratios up to 5 August 2016 assuming Basel III capital reforms fully implemented.
Peer group comprises listed commercial banks with total assets in excess of A$750 billion and which have disclosed fully implemented Basel III ratios or provided sufficient
disclosure for a Morgan Stanley estimate.
17.7
14.9 14.7
14.5 14.4 14.0 13.9
13.5 13.5 13.5 13.2 13.0 12.9 12.5 12.4 12.1 12.1 11.9 11.8
11.6 11.6 11.4 11.4 11.4 11.3 11.3 11.1 10.8 10.8 10.7 10.6 10.6 10.5 10.3 10.3 10.2 10.1 10.1
No
rde
a
UB
S
WB
C
RB
S
CB
A
AN
Z
ING
Llo
yd
s
Inte
sa
San
pa
olo
Ch
ina C
on
str
uct.
Ban
k
Sta
nd
ard
Ch
art
ere
d
NA
B
ICB
C
Cit
i
HS
BC
Su
mit
om
o M
itsu
i
Ch
ina M
erc
ha
nts
Ba
nk
JP
Mo
rga
n
Cre
dit
Su
iss
e
Barc
lay
s
Co
mm
erz
ban
k
Cre
dit
Ag
rico
le S
A
Mit
su
bis
hi
UF
J
BN
P P
ari
ba
s
So
cG
en
Ban
k o
f C
hin
a
Ban
k o
f C
om
m
BB
VA
Deu
tsc
he
Miz
uh
o
We
lls
Farg
o
Sa
nta
nd
er
Ban
k o
f A
meri
ca
Un
iCre
dit
RB
C
Ag
ri.
Ban
k o
f C
hin
a
Sc
oti
ab
an
k
To
ron
to D
om
inio
n
332 2 2 3333 3
APRA top quartile 1
3 3 33 33 33
For
per
sona
l use
onl
y

52
Funding
1. Includes the categories ‘central bank deposits’ and ‘due to other financial institutions’ (including collateral received) 2. Includes
restructure of swaps and reclassification of deals between short and long term funding
Margin to BBSW (bpts)
200
175
150
125
100
75
50
25
0
Additional
information
Funding Composition Average Long Term Funding Costs
Indicative Funding Cost CurvesIssuance
1
-
5
10
15
20
25
Dec 13 Jun 14 Dec 14 Jun 15 Dec 15 Jun-16
Securitisation Long Term Wholesale Covered Bond
38
31
382$bn
3 8 13 14 17 26
49
72
87
100
47
74
98
114
129
0
20
40
60
80
100
120
140
1 year 2 year 3 year 4 year 5 year
Jun 07 Jun 15 Jun 16
Margin to BBSW (bpts)
Portfolio Average Cost
Indicative Spot Market Cost
Predicted LT
funding costs
if current
market rates
remain
unchanged
Jun 06 Jun 08 Jun 10 Jun 12 Jun 14 Jun 16
Jun 16
1%
1%
2%
3%
3%
10%
14%
66%
RMBS
Short Term Collateral Deposits
Hybrids
Covered Bonds
LT Wholesale Funding ≤ 12 months
LT Wholesale Funding > 12 months
ST Wholesale Funding
Customer Deposits
For
per
sona
l use
onl
y
53
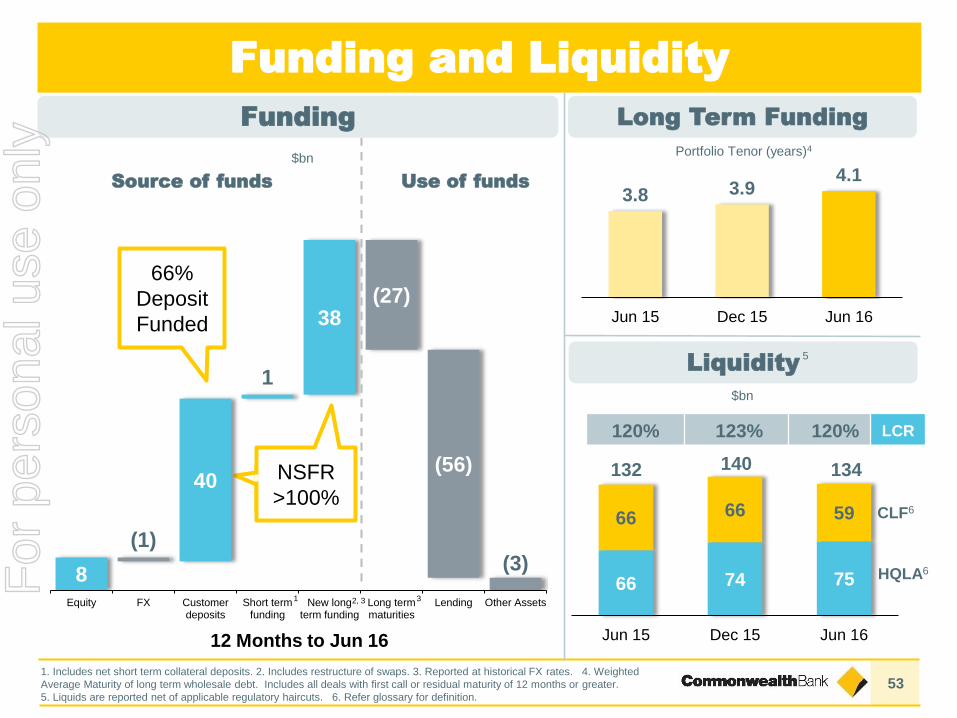
Funding and Liquidity
$bn
Liquidity5
66 74 75
66 66 59
Jun 15 Dec 15 Jun 16
140132 134
120% 123% 120% LCR
CLF6
HQLA6
1. Includes net short term collateral deposits. 2. Includes restructure of swaps. 3. Reported at historical FX rates. 4. Weighted
Average Maturity of long term wholesale debt. Includes all deals with first call or residual maturity of 12 months or greater.
5. Liquids are reported net of applicable regulatory haircuts. 6. Refer glossary for definition.
Long Term Funding
3.8 3.94.1
Jun 15 Dec 15 Jun 16
Portfolio Tenor (years)4
8
40
1
38
(1)
(27)
(56)
(3)
Equity FX Customerdeposits
Short termfunding
New longterm funding
Long termmaturities
Lending Other Assets
12 Months to Jun 16
66%
Deposit
Funded
Source of funds Use of funds
$bn
Funding
2, 31 3
NSFR
>100%
For
per
sona
l use
onl
y

54
Notes
For
per
sona
l use
onl
y

55
Summary
9.1%
10.6%
65%
66%
3.8
4.1
120%
120%
Jun 15 Jun 16 Jun 15 Jun 16 Jun 15 Jun 16 Jun 15 Jun 16
CET1 Wholesale
Funding
LCR
(years)
Deposit
Funding
1. IB&M ex CVA/FVA
2. In NZD
Strength
FY13 FY14 FY15 FY16
$m
1,3731,2461,1821,237
A volume driven income result
Continuing to invest
+7%
+1%
+3%
Total Operating Income
NII
OBI
F&I
Volume
+8%
+5%FUA
+4%
FY16 vs FY15 (Income less operating expenses, $m)
FY16 vs FY15
Good operating performance
6,988
2,419 1,843
717 1,444
1,082
RBS BPB IB&M WM NZ BW
+10%
+6%-1%
+15%+4%
Flat
1 2
For
per
sona
l use
onl
y

56
Notes
For
per
sona
l use
onl
y

Commonwealth Bank of Australia ACN 123 123 124
Results PresentationFor the half year ended 31 December 2009
10 February 2010
COMMONWEALTH BANK OF AUSTRALIA | ACN 123 123 124 | 10 AUGUST 2016
RESULTS PRESENTATIONFOR THE FULL YEAR ENDED 30 JUNE 2016
CHIE F E XE CUTIV E OFF ICE R
IA N NA RE VFor
per
sona
l use
onl
y
58
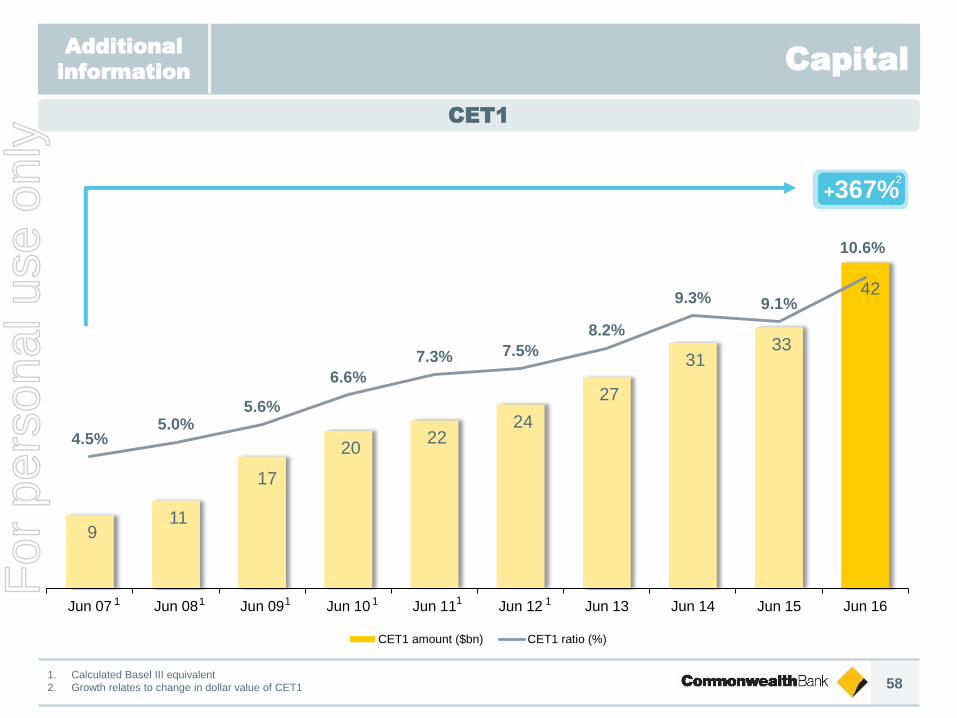
CapitalAdditional
information
CET1
9 11
17
20 22
24
27
31 33
42
4.5%5.0%
5.6%
6.6%
7.3% 7.5%
8.2%
9.3% 9.1%
10.6%
Jun 07 Jun 08 Jun 09 Jun 10 Jun 11 Jun 12 Jun 13 Jun 14 Jun 15 Jun 16
CET1 amount ($bn) CET1 ratio (%)
+367%
1 1 1 1 1 1
1. Calculated Basel III equivalent
2. Growth relates to change in dollar value of CET1
2
For
per
sona
l use
onl
y

59
Depositors and shareholders fund our
lending to borrowers
Depositors
11.3 milliondeposit customers
Borrowers
1.9 millionhome loan customers
Shareholders
Over 800,000Australian households are
direct shareholders and
millions more individuals
through their
superannuation funds
* based on the average customer term deposit balance and CBA 3 year TD offer announced on 2 August, 2016
** based on rate reduction announced on 2 August, 2016
A customer who invests in a 3
year term deposit offer will earn
$575more per year*
76% of profits are paid to
shareholders as dividends.
The average retail shareholder
will receive $3,738 this year
$403per year saved on the average
variable home loan**
For
per
sona
l use
onl
y

60
3.6
2.4 2.52.3
2.9 2.9
201220132014201520162017
Economic Indicators (June FY)
Additional
information
GDP % CPI% Unemployment Rate %
Cash Rate % Total Credit Growth % Housing Credit Growth %
2.3 2.3
2.7
1.71.4 1.3
2012 2013 2014 2015 2016 2017
5.2
5.4
5.8
6.2
5.95.8
2012 2013 2014 2015 2016 2017
3.50
2.752.50
2.001.75
1.25
2012 2013 2014 2015 2016 2017
4.40
3.10
5.00
5.906.20
2012 2013 2014 2015 2016 2017
6.75
5.004.60
6.40
7.306.70
2012 2013 2014 2015 2016 2017
4.75
7.00
5.00
Credit Growth = 12 months to June qtr
GDP, Unemployment & CPI = Financial year average
Cash Rate = As at end June qtr
= forecast
5.7
2.3
4.0
1.6
2.3
2012 2013 2014 2015 2016
Nominal GDPGDP
For
per
sona
l use
onl
y

61
Solid underlying GDP growth and stable employment,
but nominal growth remains weak
Globally, monetary stimulus unable to offset low
confidence from weak incomes and instability
“More of the same” the most likely scenario, but with
some downside risk
For CBA – conservatism, focus on the long-term,
wary of structural responses to cyclical trends
Outlook
For
per
sona
l use
onl
y

62
$m
Result quality
APRA CET1
1. CBA is half to June 2016. Peers are half to March 2016. 2. Reported CBA is at June 2016. Peers as at March 2016.
3. CBA as at June 2016. Peers as at March 2016.
Additional
information
ROE1
Capitalised Software2
Capital3
10.6% 10.5%
9.8% 9.7%
CBA Peer 3 Peer 1 Peer 2
CBA ROE for 2H16
15.6%
14.2% 14.1%
CBA Peer 3 Peer 2 Peer 1
1,651
2,127 2,228 2,249
Peer 3 Peer 2 CBA Peer 1
9.7%
Group NIM
CBA
Peers
Cash basis %
1.7
1.8
1.9
2.0
2.1
2.2
2.3
2.4
Mar 13 Sep 13 Mar 14 Sep 14 Mar 15 Sep 15 Mar 16 Jun 16
For
per
sona
l use
onl
y

63
Summary
Result again built on the consistent execution of a
10 year strategy:
- Customer satisfaction, innovation, strength
Changing operating context, impacting returns:
- Economic sentiment
- Interest rates
- Competitive intensity
- Regulatory compliance/costs
Long-term focus, continuing to reinvest
For
per
sona
l use
onl
y

Commonwealth Bank of Australia ACN 123 123 124
Results PresentationFor the half year ended 31 December 2009
10 February 2010
COMMONWEALTH BANK OF AUSTRALIA | ACN 123 123 124 | 10 AUGUST 2016
RESULTS PRESENTATIONFOR THE FULL YEAR ENDED 30 JUNE 2016
S UP P LE ME NTA RY S L IDE S
Overv iew, Cus tomers & People
Technology & Innovat ion
Risk & Cred i t Qual i t y
Capi ta l & Funding
Economic Ind icators
65
83
95
111
125
For
per
sona
l use
onl
y

65
CBA Overview
Refer notes slide at back of this presentation for source information
1. Source: RBA 2. Source: APRA 3. Source: Plan for Life Mar-16 4. Source: Bloomberg, 27 Jul 2016 5. S&P, Moody’s, Fitch
* S&P put major Australian Banks on “Outlook Negative” 7 Jul 2016
People,
Customers &
Delivery
Strength
Market Capitalisation4 #1
Capital (CET1) 10.6%
Total Assets $933bn
Credit Ratings5 AA-*/Aa2/AA-
Australia NZ Other Total
Customers 13.1m 2.3m 0.5m 15.9m
Staff 41,400 5,800 4,500 51,700
Branches 1,131 133 145 1,409
ATMs 4,381 445 172 4,998
Market
Shares
Customer
Satisfaction
Main Financial Institution (MFI) #1
Home Lending1 #1
Household Deposits2 #1
FirstChoice Platform3 #1
Retail #1
Business #1
Internet Banking #1
=
For
per
sona
l use
onl
y
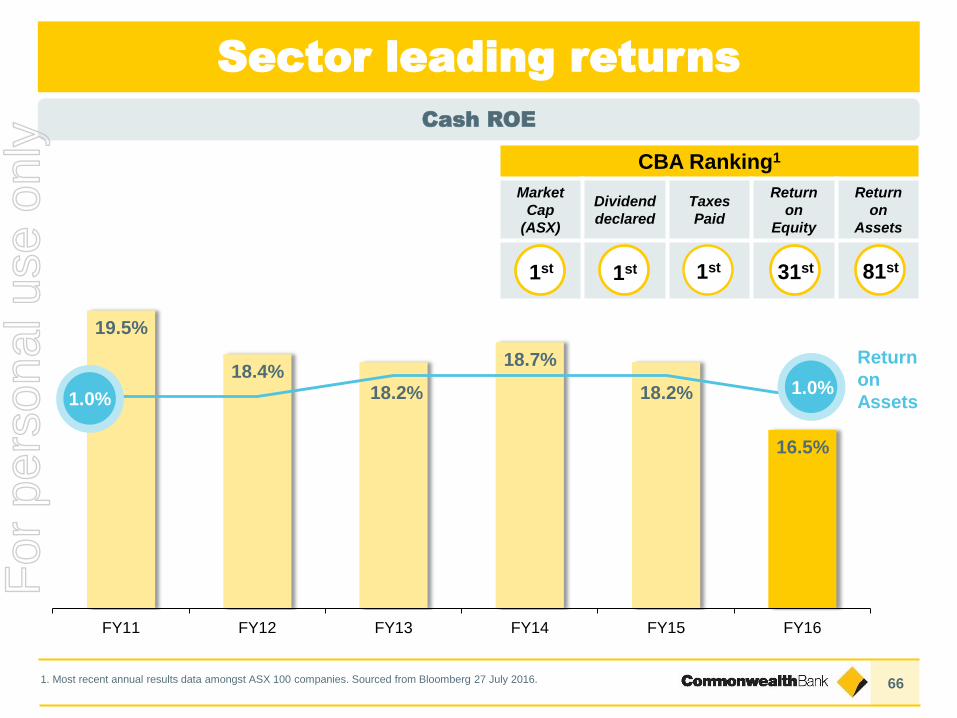
66
Sector leading returns
CBA Ranking1
Market
Cap
(ASX)
Dividend
declared
Taxes
Paid
Return
on
Equity
Return
on
Assets
1st 31st
1. Most recent annual results data amongst ASX 100 companies. Sourced from Bloomberg 27 July 2016.
1st 1st 81st
Cash ROE
19.5%
18.4%18.2%
18.7%
18.2%
16.5%
FY11 FY12 FY13 FY14 FY15 FY16
Return
on
Assets1.0%1.0%
For
per
sona
l use
onl
y

67
Broad contributor to Australian wellbeing
All figures are annual figures as at 30 June 2016
1. Bloomberg data as at July 2016
Operating Income
FY16
$24.6bn
Loan impairmentCost of lending across
the economyExpenses
Including ~5,000 SME
partners and suppliers
(>90% Australian)
Tax expenseAustralia’s largest tax
payer1 and signatory of
the Voluntary Tax
Transparency Code
DividendsReturned to over 800,000
shareholders & super funds
Retained for capital
and growthOver $192 billion in new
lending in FY16
SalariesEmploying ~41,400
people in Australia,
~51,700 globally
$4.2bn$1.3bn
$3.6bn
$2.3bn
$7bn
$6.2bn
For
per
sona
l use
onl
y

68
1.9m
4.1m
11.3m
3.2m 905k 650k
1.7m
>300k~800k 51,700
Home Loans Credit Cards Retail Savingsand Transactions
Insurance Personal Loans BusinessRelationships
FundsManagement
CommSec Shareholders Employees
Super
fund
unit
holders
?
1. Customers who hold at least one product in each of the major product categories shown. Totals not mutually exclusive –
includes cross product holdings. Figures are approximates only and may include some level of duplication across customer
segments. CommSec total includes active accounts only. Figures may reflect restatements consistent with current period reporting.
Australia Offshore
2.3m
5.1m
15.2m
4.5m
1.1m
Our Stakeholders
Customer Product Holdings1
For
per
sona
l use
onl
y

69
Customer needs met
Refer notes slide at back of this presentation for source information
Individual products may not add up to the overall totals due to rounding
12.8%
10.9%
8.4% 8.0%
CBA Peer 3 Peer 1 Peer 2
3.15
2.21
3.29
4.16
Overall Non-InternetUsers
Mobile AppOnly Users
Website andMobile App
Users
By Age By Channel
Share of Product Wealth – Share of Product
1.54
2.70
3.35 3.43 3.35
2.59
3.15
14 - 17 18 - 24 25 - 34 35 - 49 50 - 64 65+ Total18+
1.532.34
1.11
1.890.52
4.07
Products heldat CBA
Productsheld anywhere
Share of
product
12.8%
58.7%
65.4%
Deposits
Lending and Cards
Wealth
3.15
8.30
For
per
sona
l use
onl
y

70
Corporate Responsibility Strategy
Our VisionTo excel at securing and enhancing the financial wellbeing of people, businesses and communities
Our Values
Corporate Responsibility Strategy
Our role in society Our people The way we do business
Build
capability
Innovate
purposefully
Fairness and
respect
Community
mindedTransparently
Influence
for goodSustainably
For
per
sona
l use
onl
y

71
Corporate Responsibility
The most sustainable bank
in the world
The Group has been recognised as
the most sustainable company in
Australia and the most sustainable
bank in the world1
A leading sustainability-driven
company
In 2015/16, the Group was once again
included in the Dow Jones Sustainability
World Index (DJSI)2.
Strong environmental,
social and
governance practices
The Group continues to be
listed on the FTSE4Good
Index - comprising
companies demonstrating
strong Environmental, Social
and Governance (ESG)
practices.
Leader in climate
disclosure
The Group has been
included in the CDP ASX
200 Climate Disclosure
Leadership Index for the
seventh consecutive year.
Our vision is to excel at securing and enhancing the financial wellbeing of people, businesses and communities. Our corporate
responsibility efforts help us deliver on our vision with a focus on our role in society, our people and the way we do business.
A great place to work• WGEA3 citation retained
• Named 2nd most inclusive employer in
the 2016 Australian Workplace Equality
Index (AWEI) Awards, which recognises
workplace support for LGBTI people.
• Employee network Unity named the 2016
LGBTI Employee Network of the Year.
1. World Economic Forum, G100 - the global index of the world's most sustainable corporations. 2. The DJSI World is the first
global index to track the financial performance of the leading sustainability-driven companies worldwide. 3.Workplace Gender
Equality Agency
For
per
sona
l use
onl
y

72
Corporate Responsibility Corporate Responsibility
Our role in society
120k 200k 236k285k 289k 299k
557k
FY10 FY11 FY12 FY13 FY14 FY15 FY16
Delivering on 2015 $50 million investment
commitment to education over 3 years
Doubled investment in Start Smart financial literacy
program leading to 550,000+ students registered
Learning Impact Fund launched to evaluate
education programs in Australia to raise the
academic achievement of children and young
adults
$1.6 million investment to develop a centre of
expertise for cyber security education with UNSW
Australia’s leading technology bank
$10 million provided (of $15 million commitment)
in FY16 to support Australian researchers in
building the world’s first silicon-based quantum
computer in Sydney
Innovation labs bringing clients, government and
communities together to explore the latest
FinTech developments
Program expansion to
meet new target of >500k
Start Smart students (registered)1
1. Start Smart students’ refers to the number of students booked to attend Commonwealth Bank’s Start Smart Programs during a 12 month period
For
per
sona
l use
onl
y

73
Corporate Responsibility Corporate Responsibility
Our people
26%28%
31% 30%32%
34% 35%
FY10 FY11 FY12 FY13 FY14 FY15 FY16
Women in Executive Manager and above roles1
Employer of Choice for Gender Equality
Named second most inclusive employer in the 2016
Australian Workplace Equality Index (AWEI) Awards
and employee network Unity was named the 2016
LGBTI Employee Network of the Year
Announced new 40 per cent target for women in
Executive Manager and above positions by 2020
243
262
FY15 FY16
Committed to national Financial Inclusion Action
Plan (FIAP) program alongside 10 other community
and industry organisations
More than $262m in total community investment
Granted $2m to 229 grassroots programs through
the Staff Community Fund, Australia’s longest-
running workplace-giving program
Total Community Investment2
$m
1. Percentage of roles at the level of Executive Manager and above filled by women, in relation to the total headcount at this level. Comparatives have been restated to include IFS. 2. Total community investment includes investment in the form of cash, time, foregone revenue and program implementation costs. This figure was measured in this way for the first time in FY15.
For
per
sona
l use
onl
y

74
Corporate Responsibility Corporate Responsibility
The way we do business
Committed to addressing
community concerns about
industry conduct
Released Wealth Management
Responsible Investing framework
- integrating ESG considerations
across our investment processes
1,786 professionals trained on
ESG matters
Released financed carbon
emissions report assessing the
carbon emissions intensity of our
business lending portfolio
The Group was closely
involved through the full
process of government
consultation and engagement
to the Financial System Inquiry
(FSI)
Released Human Rights
Position Statement formalising
our commitment to respect
human rights across all
operations, including our
supply chain practices
Launched Elevate
Reconciliation Action Plan in
June 2016
Updated Group Environment
Policy acknowledging
international efforts to limit
global warming to two degrees
First Australian Bank to be
awarded a 5 Star Green Star
rating for our current branch
design
Commonwealth Bank Place is
the first Australian office
awarded a 6 Star Green Star
rating across all four aspects:
design, construction, interior
fit-out and operation
performance
For
per
sona
l use
onl
y

75
People
Customer
satisfaction
FY16 FY15 FY14 FY13 FY12 FY11
Roy Morgan MFI Retail Customer Satisfaction %- Rank (CBA)1
82.81st
84.21st
83.21st
83.01st
79.02nd
75.24th
DBM Business Financial Services Monitor (avg)- Rank (CBA)2
7.2=1st
7.5=1st
7.4=1st
7.4=1st
7.3 =1st
7.1=2nd
Wealth Insights Platform Service Level Survey (avg)- Rank (CBA)3
8.071st
7.752nd
7.941st
8.321st
7.861st
7.741st
Employee Engagement Index Score (CBA) %4 77 81 81 80 80 n/a
Employee Turnover Voluntary %5 11.3 10.2 10.2 10.2 12.9 12.7
Women in Manager and above roles %6 43.6 43.2 42.9 42.0 42.0 43.6
Women in Executive Manager and above roles %6 35.2 33.9 31.8 30.3 30.9 28.2
Lost Time Injury Frequency Rate (LTIFR)7 1.2 1.9 1.5 1.9 2.8 2.4
Absenteeism Rate8 6.0 6.0 6.1 6.2 6.2 6.0
Scope 1 emissions tCO2-e (CBA)9 6,847 7,249 7,936 8,064 8,192 8,183
Scope 2 emissions tCO2-e (CBA)9 81,307 86,264 91,275 100,997 118,047 137,948
Scope 3 emissions tCO2-e (CBA)9 33,854 39,361 44,826 47,438 47,667 63,719
School Banking students (active)10 330,874 310,474 273,034 233,217 191,416 140,280
Start Smart students (booked)11 557,475 298,505 288,728 284,834 235,735 200,081
Greenhouse
Gas
Emissions
Financial
Literacy
Programs
Corporate Responsibility Scorecard
All metrics capture data of the wholly owned and operated entities of the Commonwealth Bank Group (the Group) unless otherwise stated. For definitions and notes, please refer source slide at the end of this presentation.
For
per
sona
l use
onl
y

76
Investing in our society
550,000+
Students
registered for Start
Smart financial
education
$2m
In grants to 229
youth focused
organisations
170,357
Calls to our
Indigenous
customer
assistance line
$262m
Total
Community
Investment
52%
Student customers
saving regularly
via School Banking
21
CareerTrackers
Indigenous interns
#1
Largest tax payer
in Australia
2,400+
Businesses
engaged with our
innovation labs
$1.6m
Toward cyber
security educationFor
per
sona
l use
onl
y

77
Detailed assessment undertaken of the carbon emissions arising from the Group’s business lending, providing the analysis and insights
to identify and act on key opportunities to reduce these carbon emissions.
The Group’s lending exposure to renewable electricity generation reached $2.2 billion as at 30 June 2016, more than 5 times our
exposure to direct coal related electricity generation. The next iteration of the Group’s assessed carbon emissions reporting will be
available in the coming months.
Supporting the transition to a
low carbon economy
For methodology and further details, please refer to: https://www.commbank.com.au/content/dam/commbank/about-
us/docs/sustainability-20151103-assessed-emissions-lending-port.pdf.
Agriculture (incl.
Forestry &Fishing)
29%
Electricity, Gas & Water 17%
Manufacturing17%
Mining9%
Transport & Storage
11%
Construction1%
Property & Business
3%
Other13%
CBA Group Business Lending
Emissions Intensity (EI) of Expenditure
CBA Group Business Lending
Emissions Profile
Weighted portfolio average EI of expenditure includes a double count of electricity scope 1
emissions across all sectors. Sector classification defined by ANZSIC main business activity.
EI of Expenditure (kgCO2e/AUD) % of actual emissions in each sector1.9
1.8
0.5 0.5
0.30.2
<0.1 <0.1 <0.1 <0.1 <0.1 <0.05 <0.05 <0.05 <0.05
0
1
2
Portfolio average 0.3
For
per
sona
l use
onl
y

78
Open Advice Review
Hon Ian Callinan AC
Chairman
Hon Geoffrey
Davies AO
Deputy Chairman
Hon Julie
Dodds-Streeton QC
Panellist
Reports program
outcomes publicly
Provide support
for customers
Reviews
individual cases
if required
Investigates
fraud, forgery and
dishonest
conduct
Provides
expert advice
Independent
Expert
Independent
Customer
Advocates
Independent
Review
Panel
Independent
Forensic
Expert
Consultant
Expert
Advisor
♦ Offer to review advice provided to all Financial
Wisdom and Commonwealth Financial Planning
customers between September 2003 and July 2012
♦ Opened 3 July 2014. Expressions of interest closed 3
July 2015, registrations closed 3 July 2016
♦ 350,000 letters sent to current CFP customers
♦ Over 500 people working on the program
♦ As at 10 August 2016:
♦ Approx. 8,600 customers have requested a review
of their advice
♦ 5,000 assessments issued
♦ Compensation offered in 666 cases ($8.7m)
♦ On track to deliver all assessments by the end of the
2016 calendar year
♦ Promontory Financial Group’s sixth progress report to
be delivered in September 2016
Promontory Financial Group
Maurice
Blackburn
Shine
Lawyers
Slater &
Gordon
McGrathNichol
Program Progress
Fiona Guthrie
For
per
sona
l use
onl
y

79
CFSGAM – Global Reach
Joint venture
1. Assets under management indicated above includes Realindex Investments which is a wholly owned investment management subsidiary of the Colonial First State group of companies 2. USA assets managed through CFSAMAL (Australia based non-domiciled), FSII (UK based non-domiciled), FSI Singapore (Singaporean based non-domiciled), USA SEC Registered Investment Advisers
UK, Europe
and Middle East AUM $71.6 billion
Asia (incl. Japan)AUM $9.7 billion
North AmericaAUM $6.8 billion2
Australia
and New ZealandAUM $111.6 billion1
Spot
For
per
sona
l use
onl
y

80
CBA in Asia and South Africa
Indonesia
♦ PT Bank Commonwealth (98%): 90 branches and
144 ATMs
♦ PT Commonwealth Life (80%): 29 life offices
♦ First State Investments
Japan
♦ Tokyo CBA branch
♦ First State Investments
Singapore
♦ CBA branch
♦ First State Investments
Vietnam
♦ Vietnam International Bank (20%): 155 branches
♦ Hanoi Representative Office
♦ Ho Chi Minh City CBA branch; 28 ATMs
South Africa
♦ CBA SA (TYME entities)
India
♦ Mumbai CBA branch
China
♦ Bank of Hangzhou (20%): 189 branches
♦ Qilu Bank (20%): 120 branches
♦ County Banking (Henen & Hebei):
- 15 branches (10 @ 100% holding, 5 @ 80% holding)
- 8 sub-branches (2 @ 100% holding, 6 @ 80% holding)
♦ CBA Beijing, Shanghai and Hong Kong branches
♦ BoCommLife (37.5%): operating in 11 provinces
♦ First State Investments Hong Kong and First State
Cinda JV (46%)
♦ Colonial Mutual Group Beijing Rep Office
Map not to scale
Asia
South
Africa
For
per
sona
l use
onl
y

81
0
50
100
150
200
250
300
Jun 11 Jun 12 Jun 13 Jun 14 Jun 15 Jun 16
-
500
1,000
1,500
2,000
2,500
Consumer Lending (LHS) Commercial Lending (LHS)Total Inforce (RHS)
Lending Balances CAGR 12%
Inforce Premium CAGR 14%
Jun 11 Jun 12 Jun 13 Jun 14 Jun 15 Jun 16
-
50
100
150
200
250
300 ‘000
A$mSpot (A$m)
Revenue Direct Proprietary Customers
Proprietary IncomeProprietary Loans & Inforce Premium
A$m
IFS – Continued growth1
1. International Financial Services incorporates the Asian retail and business banking operations (Indonesia, China, Vietnam and
India), associate investments in two Chinese and one Vietnamese bank and a Chinese life insurance business, the life insurance
operations in Indonesia and a financial services technology business in South Africa.
Jun 11 Jun 12 Jun 13 Jun 14 Jun 15 Jun 16
-
100
200
300
400
500
600
-
20
40
60
80
100
120
140
Jun 11 Jun 12 Jun 13 Jun 14 Jun 15 Jun 16
Insurance OBI NII
Proprietary Income CAGR 9%
For
per
sona
l use
onl
y

82Refer notes slide at back of this presentation for source information CBA Peers
Business Customer Satisfaction
6.4
6.6
6.8
7.0
7.2
7.4
7.6
7.8
Jun 13 Jun 14 Jun 15 Jun 16
6.4
6.6
6.8
7.0
7.2
7.4
7.6
7.8
8.0
Jun 13 Jun 14 Jun 15 Jun 166.4
6.6
6.8
7.0
7.2
7.4
7.6
7.8
8.0
8.2
Jun 13 Jun 14 Jun 15 Jun 16
6.4
6.6
6.8
7.0
7.2
7.4
7.6
7.8
Jun 13 Jun 14 Jun 15 Jun 16
Micro
Medium Large
Small
IB&M first/equal first –
57 consecutive
months
CBA all segments:
7.2 (= #1)
For
per
sona
l use
onl
y

83
Single view of
customer across
channels
CommSee
Revitalised
Processes
Innovation Lab
Leading apps for
phones, tablets and
smart watches
Pi, Albert, Leo,
Emmy
Legacy system
replacement
Real-time banking
Straight-through
processing
Simplified
architecture
Resilient systems
Revitalised
front-line
Innovation
Culture
State-of-the-
art Core
Simple, personalised
digital experiences
Building an innovation
ecosystem
Anywhere, anytime,
any device
Customer insights
through analytics
Standardised,
scalable, reliable &
secure systems
World class technology & operationsWorld class technology & operations
The Digital
Future
For
per
sona
l use
onl
y

84
Australia’s leading technology bank
Refer notes slide at back of this presentation for source information
#1
Innovative Card &
Payment product –Mobile Wallet
(AB&F)
#1
Client
Feedback(Peter Lee Associates)
#1
Innovative Business
Product – Daily IQ(AB+F)
#1
Following
on
social media
#1
Internet Business
Bank – CommBiz(AB+F)
#1
Free
financial
app
#1
Mobile
Banking(CANSTAR)
#1
Online Banking
7 years in a row (CANSTAR)
#1
Customer Satisfaction
Internet Banking Services
(Roy Morgan)
For
per
sona
l use
onl
y

85
85%
87%
89%
91%
93%
95%
97%
Dec 14 Jun 15 Dec 15 Jun 16
85%
87%
89%
91%
93%
95%
97%
Dec 14 Jun 15 Dec 15 Jun 1685%
87%
89%
91%
93%
95%
97%
Dec 14 Jun 15 Dec 15 Jun 16
Customer Satisfaction - Online
Satisfaction with Internet Banking Services
via "Website" or "App“
Refer notes slide at back of this presentation for source information
1. Unique number of customers who have logged into NetBank or
CommBank App in June 2016.Peer 1CBA Peer 2 Peer 3
Internet Banking Website
App
Satisfaction with Internet Banking Services
via "App“
Satisfaction with Internet Banking Services
via "Website"
93.3%
93.6%
92.9%
5.6m active
online
users1
For
per
sona
l use
onl
y

86
Innovation and Simplicity
NZFinancial Toolkit
Clever Kash - cashless
interactive moneybox
1st in Mobile app
satisfaction at 87%1
June 2016March 2016
Toolkit gives customers
assistance with planning,
saving and budgeting
240,000 customers have
used the Financial Toolkit
since launch
Wealth Solutions
October 2015 – June 2016
Online features include:
Interactive & personalised
general insurance quotes
Business Essential Super –
600+ accounts opened
Book appointments online
1 Customer Retail Market Monitor, Camorra Research, June 2016
For
per
sona
l use
onl
y

87
Investigating and
experimenting widely
with the technology –
working on 25+ use
cases for blockchain
technology with our
partners
Exploring new opportunities
Partnering with
UNSW to deliver
training to more than
16,000 people –
boosting Australia’s
reserve of security
engineering
professionals
Our $15m investment
is supporting
Australian
researchers to
develop the world’s
first silicon-based
quantum computer
Quantum Cyber securityBlockchain
For
per
sona
l use
onl
y

88
Small Business
1Access to specialists
available within every
branch, with increased
small business capabilities
Over 170k conversations
(58k in branch) with small
business customers to better
understand their business and
their needs
Bank of the Year – Small
Business (Canstar)
Ranked #1 in small
business customer
satisfaction for 19
consecutive months to
Jun 16
Australian first real-time
transaction account alerts
Recently launched data
feed integration between
NetBank and Xero
Small business customers
using market leading Albert
technology (25k devices)
Simple Business Overdraft
limits up 47%
40k+ customers using new
asset finance online
quoting with real time
decisioning and same day
funding
For
per
sona
l use
onl
y
89
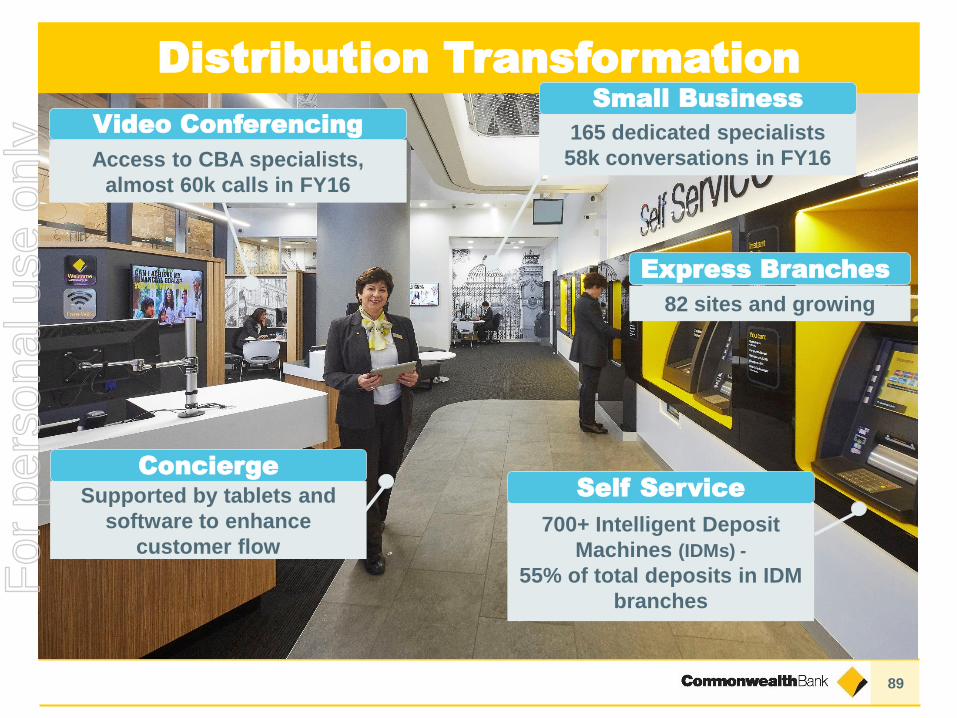
Distribution Transformation
700+ Intelligent Deposit
Machines (IDMs) -
55% of total deposits in IDM
branches
165 dedicated specialists
58k conversations in FY16
Video Conferencing
Access to CBA specialists,
almost 60k calls in FY16
Concierge
Supported by tablets and
software to enhance
customer flow
Small Business
Express Branches
82 sites and growing
Self Service
For
per
sona
l use
onl
y

90
Self Service and Digital
Simple activities move to digital
Intelligent Deposit Machines (IDMs) Digital Transactions
Accounts with e-statements
Migration of selected services
# low-value add interactions in branch per month (m)
Pin change Statement
enquiry
Updated contact
details
Credit card
repayment
35%
49%86%
30%
Transactions and Savings (% of total)
Dec 13 Jun 14 Dec 14 Jun 15 Dec 15 Jun 16
63%
44%
Total BPay and Transfers via Digital (Six Monthly, #)
Dec 13 Jun 14 Dec 14 Jun 15 Dec 15 Jun 16
309m
225m
% of deposits completed via IDM in branches
that have had a machine for > 1 month1
1. The Intelligent Deposit Machine rate has been aligned with other migration measures
11%
55%
Jun 12 Jun 13 Jun 14 Jun 15 Jun 16
Jun 16
Jun 15
Deposits now 39% of
total IDM transactions
For
per
sona
l use
onl
y
91
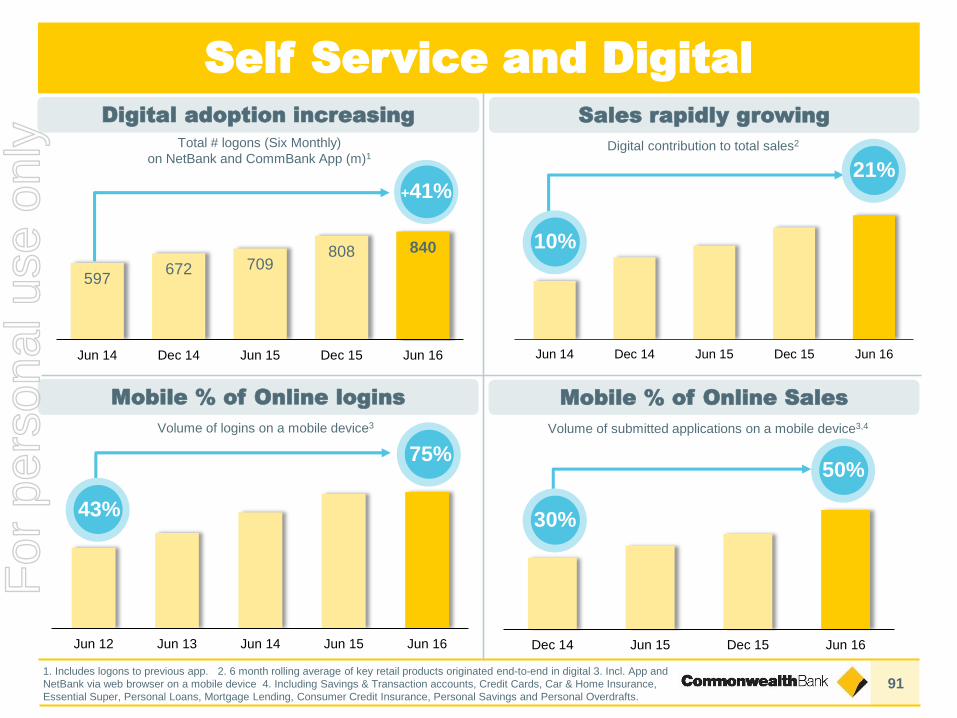
Digital adoption increasing
Mobile % of Online logins Mobile % of Online Sales
Sales rapidly growing
Digital contribution to total sales2
597672 709
808 840
Jun 14 Dec 14 Jun 15 Dec 15 Jun 16
Total # logons (Six Monthly)
on NetBank and CommBank App (m)1
+41%
Volume of logins on a mobile device3 Volume of submitted applications on a mobile device3,4
Dec 14 Jun 15 Dec 15 Jun 16
50%
30%
75%
Jun 12 Jun 13 Jun 14 Jun 15 Jun 16
43%
Self Service and Digital
Jun 14 Dec 14 Jun 15 Dec 15 Jun 16
10%
21%
1. Includes logons to previous app. 2. 6 month rolling average of key retail products originated end-to-end in digital 3. Incl. App and
NetBank via web browser on a mobile device 4. Including Savings & Transaction accounts, Credit Cards, Car & Home Insurance,
Essential Super, Personal Loans, Mortgage Lending, Consumer Credit Insurance, Personal Savings and Personal Overdrafts.
For
per
sona
l use
onl
y

92
2003 2004 2005 2006 2007 2008 2009 2010 2011 2012 2013 2014 2015 2016
2003 2004 2005 2006 2007 2008 2009 2010 2011 2012 2013 2014 2015 2016
(all transactions)
(transactions of value)
m(deposits & withdrawals)m
m
Transaction volumes
~75% of online logins
via mobile device
(all transactions, including credit cards)m
Branch
Point of Sale2
Internet3
ATM1
130
59
325
261
606
40
700
1,676
All figures are approximates. 1. All cardholder transactions at Australian CBA ATMs. ATM includes IDMs and an increase in the dollar
value of deposits. ATM only transactions reduced for FY16. 2. Calendar years to 2006; financial years thereafter. Includes EFTPOS
Payments Australia Ltd (EPAL), MasterCard and Visa volumes only. 3. Calendar years to ‘07; financial years thereafter. Includes BPAY.
2003 2004 2005 2006 2007 2008 2009 2010 2011 2012 2013 2014 2015 2016
2003 2004 2005 2006 2007 2008 2009 2010 2011 2012 2013 2014 2015 2016
For
per
sona
l use
onl
y

93
Transaction volumes
By Number By $ Value
FY16
% of total
FY16
% of total
2%
10%
65%
23%
Branch ATM PoS Internet
34%
5%
9%
52%
Branch ATM PoS Internet
For
per
sona
l use
onl
y

94
1.5
2.53.0
3.8
4.6
Jun 14 Dec 14 Jun 15 Dec 15 Jun 16
Cumulative volume of unique transactions (m)1
Logons per week (m) Transactions per week ($bn)3
Growing MobileAdditional
information
Jun 14 Dec 14 Jun 15 Dec 15 Jun 16
2.71.2
0.1
5.3
Number of accounts enrolled (k)4
26
215
363
465
Jun 14 Dec 14 Jun 15 Dec 15 Jun 16
Jun 14 Dec 14 Jun 15 Dec 15 Jun 16
361313
256
176
Number of Pay Tags in market (k)
1.2 1.4
1.82.0
2.7
Jun 15 Sep 15 Dec 15 Mar 16 Jun 16
Volume of transactions per quarter (m)2
1. Launched April 2014 2. Volume of transactions using Tap & Pay (inc. HCE/Pay Tag) 3. Includes BPAY 4. Number of unique
accounts that have enrolled for Lock, Block and Limit (excl. temp. lock)
CommBank App CommBank App
Tap & Pay Pay Tag
Lock, Block & Limit
Cardless Cash
10
1518
2124
Jun 14 Dec 14 Jun 15 Dec 15 Jun 16
8.5 412
541
Self Service and Digital
For
per
sona
l use
onl
y

95
RBS Home Loan Portfolio
Portfolio1 Jun
15
Dec
15
Jun
16
Total Balances - Spot ($bn) 321 331 345
Total Balances - Average ($bn) 311 326 332
Total Accounts (m) 1.5 1.5 1.5
Variable Rate (%) 84 84 84
Owner Occupied (%) 58 59 60
Investment (%) 36 35 35
Line of Credit (%) 6 6 5
Proprietary (%) 61 60 59
Broker (%) 39 40 41
Interest Only (%)2 38 38 39
Lenders’ Mortgage Insurance (%)2 24 23 22
Low Deposit Premium (%)2 7 7 7
Mortgagee In Possession (bpts) 4 4 5
Annualised Loss Rate (bpts) 2 2 2
Portfolio Dynamic LVR (%)3 48 48 49
Customers in Advance (%)4 76 76 75
Payments in Advance incl. offset5 28 31 33
New Business1 Jun
15
Dec
15
Jun
16
Total Funding ($bn) 80 44 87
Average Funding Size ($’000) 274 304 302
Serviceability Buffer (%)6 2.25 2.25 2.25
Variable Rate (%) 87 90 88
Owner Occupied (%) 59 65 65
Investment (%) 37 32 33
Line of Credit (%) 4 3 2
Proprietary (%) 59 55 55
Broker (%) 41 45 45
Interest Only (%)2 39 38 38
Lenders’ Mortgage Insurance (%)2 19 15 14
Low Deposit Premium (%)2 7 6 5
1. All portfolio and new business metrics are based on balances and fundings respectively, unless stated otherwise. All new business metrics are based on 12 months to June and 6 months to December.
2. Excludes Line of Credit (Viridian LOC).
3. LVR defined as current balance/current valuation.
4. Any payment ahead of monthly minimum repayment; includes offset facilities.
5. Average number of payments ahead of scheduled repayments.
6. Serviceability test based on the higher of the customer rate plus a 2.25% interest rate buffer or a minimum floor rate.
For
per
sona
l use
onl
y

96
Australian Home Loan Portfolio1
Portfolio losses continue to be low (FY16: 2bpts)
77% of customers paying in advance2 by 31 months on average, including offset facilities
Regular stress testing undertaken to identify areas of sensitivity
Portfolio dynamic LVR3 of 50% (RBS: 49%, Bankwest: 56%)
Limited “low doc”4 lending (0.05% of approvals and <1% of the portfolio)
Modest growth in Investment Home Loans; Investment loan arrears below portfolio average
Low proportion of loans reliant on foreign income (<1% of originations) as a result of strict lending criteria
Higher of customer rate plus 2.25% or minimum floor rate (RBS: 7.25% pa, Bankwest: 7.35% pa)
80% cap on less certain income sources (e.g. rent, bonuses etc.)
Maximum LVR of 95%5 for all loans
Lenders’ Mortgage Insurance (LMI) required for higher risk loans, including high LVR loans
Limits on investor income allowances e.g. RBS restrict the use of negative gearing where LVR>90%
Buffer applied to existing mortgage repayments
Interest only loans assessed on principal and interest basis
Servicing Criteria
Strong Portfolio Quality
1. RBS and Bankwest, except where noted. 2. Defined as any payment ahead of monthly minimum repayment; includes offset facilities. 3. LVR defined as current balance/current valuation. 4. RBS Only. Documentation is required, including Business Activity Statements. 5. For Bankwest, maximum LVR excludes any capitalised mortgage insurance.
For
per
sona
l use
onl
y

97
Australian Home Loan Portfolio1
Portfolio1 Jun
15
Dec
15
Jun
16
Total Balances - Spot ($bn) 383 393 409
Total Balances - Average ($bn) 371 388 395
Total Accounts (m) 1.7 1.7 1.8
Variable Rate (%) 85 85 85
Owner Occupied (%) 60 62 62
Investment (%) 35 33 33
Line of Credit (%) 5 5 5
Proprietary (%) 57 56 55
Broker (%) 43 44 45
Interest Only (%)2 37 38 39
Lenders’ Mortgage Insurance (%)2 26 25 24
Mortgagee In Possession (bpts) 4 4 5
Annualised Loss Rate (bpts) 2 2 2
Portfolio Dynamic LVR (%)3 49 49 50
Customers in Advance (%)4 77 78 77
Payments in Advance incl. offset5 27 29 31
New Business1 Jun
15
Dec
15
Jun
16
Total Funding ($bn) 94 50 101
Average Funding Size ($’000) 274 302 300
Serviceability Buffer (%)6 2.25 2.25 2.25
Variable Rate (%) 87 90 88
Owner Occupied (%) 60 66 66
Investment (%) 37 31 32
Line of Credit (%) 3 3 2
Proprietary (%) 55 52 51
Broker (%) 45 48 49
Interest Only (%)2 41 39 40
Lenders’ Mortgage Insurance (%)2 21 16 15
1. All portfolio and new business metrics are based on balances and fundings respectively, unless stated otherwise. All new business metrics are based on 12 months to June and 6 months to December.
2. Excludes Line of Credit (Viridian LOC/Equity Line).
3. LVR defined as current balance/current valuation. Comparative information has been reclassified to conform to presentation in the current period.
4. Any payment ahead of monthly minimum repayment; includes offset facilities.
5. Average number of payments ahead of scheduled repayments.
6. Serviceability test based on the higher of the customer rate plus a 2.25% interest rate buffer or a minimum floor rate. Jun 15 RBS only.
For
per
sona
l use
onl
y
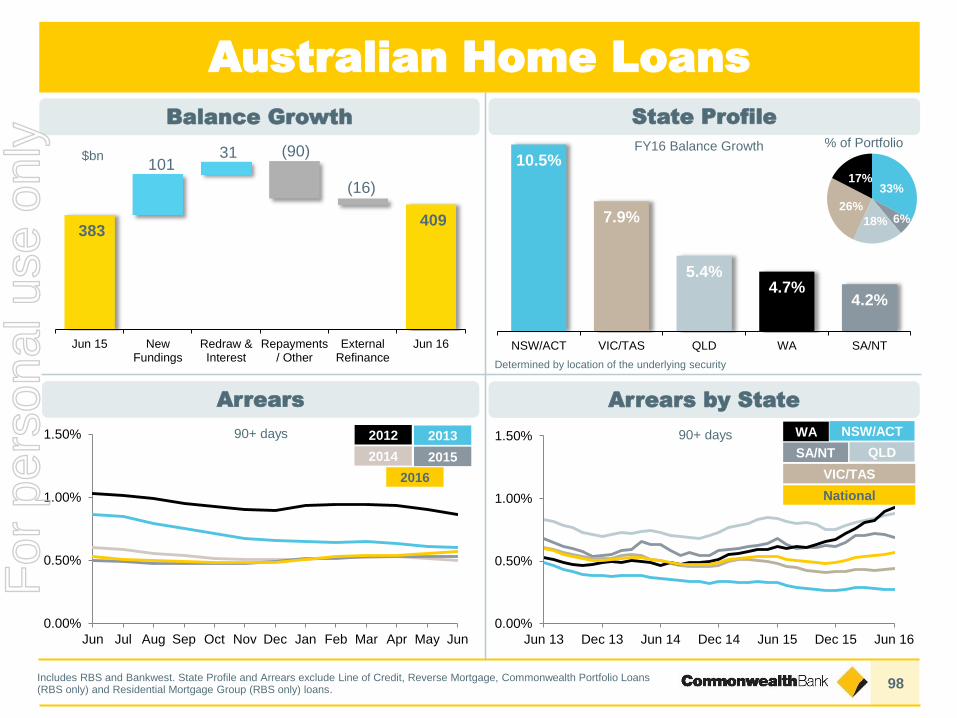
98
Australian Home Loans
FY16 Balance Growth
Balance Growth
Arrears Arrears by State
State Profile
10.5%
7.9%
5.4%4.7%
4.2%
NSW/ACT VIC/TAS QLD WA SA/NT
33%
6%18%
26%
17%
% of Portfolio
Determined by location of the underlying security
$bn
383 409
101 31 (90)
(16)
Jun 15 NewFundings
Redraw &Interest
Repayments/ Other
ExternalRefinance
Jun 16
Includes RBS and Bankwest. State Profile and Arrears exclude Line of Credit, Reverse Mortgage, Commonwealth Portfolio Loans (RBS only) and Residential Mortgage Group (RBS only) loans.
0.00%
0.50%
1.00%
1.50%
Jun Jul Aug Sep Oct Nov Dec Jan Feb Mar Apr May Jun
20132012
2016
20152014
WA NSW/ACT
SA/NT QLD
VIC/TAS
National
90+ days90+ days
0.00%
0.50%
1.00%
1.50%
Jun 13 Dec 13 Jun 14 Dec 14 Jun 15 Dec 15 Jun 16
For
per
sona
l use
onl
y

99
321 345
87 28 (79)
(12)
RBS Home Loan Growth Profile
Jun 15 New
fundings
Redraw &
interest
Repayments
/ Other
External
refinanceJun 16
$bn
90+ days
Months on Book
Home Loan Arrears by Vintage3
Home Loan Balances
Home Loan Dynamic LVR2
0%
10%
20%
30%
40%
50%
60%
70%
0-60% 61-80% 81-90% 91-95% 96+%
Pro
po
rtio
n o
f T
ota
l P
ort
folio
Dynamic LVR Band
Average
Dynamic
LVR
Jun 15 48%
Dec 15 48%
Jun 16 49%
0.0%
0.5%
1.0%
1.5%
2.0%
0 6 12 18 24 30 36 42 48 54 60 66 72 78
FY07-09
FY13
FY10
FY11
FY15FY14
FY12
FY16
1. % of home loan fundings ($’s). Market represents quarterly MFAA data up to Mar 16. CBA includes Residential Mortgage Group.
2. Dynamic LVR is current balance / current valuation. 3. Vintage Arrears includes: Line of Credit, Reverse Mortgage,
Commonwealth Portfolio Loan and Residential Mortgage Group loans.
Broker Share of Fundings1
47%
50%51%
52% 52%54%
38% 39%40%
42%
45%46%
Dec 13 Jun 14 Dec 14 Jun 15 Dec 15 Jun 16
Market CBA
For
per
sona
l use
onl
y

100
RBS Consumer Arrears
2.0%
2.5%
3.0%
3.5%
Jun Jul Aug Sep Oct Nov Dec Jan Feb Mar Apr May Jun
2.0%
2.5%
3.0%
3.5%
4.0%
4.5%
Jun Jul Aug Sep Oct Nov Dec Jan Feb Mar Apr May Jun
0.5%
1.0%
1.5%
2.0%
2.5%
3.0%
Jun Jul Aug Sep Oct Nov Dec Jan Feb Mar Apr May Jun
30+ days30+ days
30+ days
FY13FY12
FY16
FY15FY14
FY13FY12
FY16
FY15FY14
FY13FY12
FY16
FY15FY14
Home Loans exclude Line of Credit, Reverse Mortgage, Commonwealth Portfolio Loan and Residential Mortgage Group loans.
Home Loans
Personal Loans
Credit Cards
Consumer Arrears
Home Loan arrears stable year on year. WA and QLD
portfolios continue to experience stress, mainly due to
mining towns, while NSW improved.
Personal Loan arrears remain elevated mainly due to
economic worsening in WA and QLD.
Lower Credit Card arrears benefiting from improved
collections strategies.
For
per
sona
l use
onl
y

101
Group Consumer Arrears
ASB
Bankwest
RBS
ASB
Bankwest
RBS
90+ days
Home Loans
Credit Cards
Personal Loans90+ days
90+ days 90+ days
Consumer Portfolios
Credit Cards Personal Loans
Home Loans
0.0%
1.0%
2.0%
Jun 13 Dec 13 Jun 14 Dec 14 Jun 15 Dec 15 Jun 160.0%
1.0%
2.0%
Jun 13 Dec 13 Jun 14 Dec 14 Jun 15 Dec 15 Jun 16
0.0%
1.0%
2.0%
Jun 13 Dec 13 Jun 14 Dec 14 Jun 15 Dec 15 Jun 160.0%
1.0%
2.0%
Jun 13 Dec 13 Jun 14 Dec 14 Jun 15 Dec 15 Jun 16
Consumer represents Retail Banking Services, ASB Retail and Bankwest Retail. ASB write-off Credit Card and Personal Loans
typically around 90 days past due if no agreed repayment plan. Home Loans exclude Line of Credit, Reverse Mortgage,
Commonwealth Portfolio Loan (RBS only) and Residential Mortgage Group (RBS only) loans.
ASB
Bankwest
RBS
For
per
sona
l use
onl
y

102
Australian Investment Home Loans
New Business Profile (%)
0.00%
0.20%
0.40%
0.60%
0.80%
1.00%
Jun 13 Dec 13 Jun 14 Dec 14 Jun 15 Dec 15 Jun 16
Borrower Profile
Arrears
Owner Occupied
Investment Loan
Portfolio
90+ days
Owner Occupied
Investment Loan
Applicant Gross Income BandFundings (12 Months to Jun 16)
0%
5%
10%
15%
20%
25%
30%
35%
40%
0k to 75k 75k to100k
100k to125k
125k to150k
150k to200k
200k to500k
> 500k
Investment Home Loans
Owner Occupied
Investor
Line of Credit
Includes RBS and Bankwest except where noted. Income Bands, Arrears and Profile: excludes Line of Credit, Reverse Mortgage,
Commonwealth Portfolio Loan (RBS only) and Residential Mortgage Group (RBS only) loans except where noted. Fundings based
on dollars.
Modest growth in Investment Home Loans (<10%)
Arrears lower than overall portfolio
Strong borrower profile skewed to higher income
bands
Differential pricing for investment home loans
60 66 66
37 31 32
3 3 2
FY15 1H16 FY16
For
per
sona
l use
onl
y
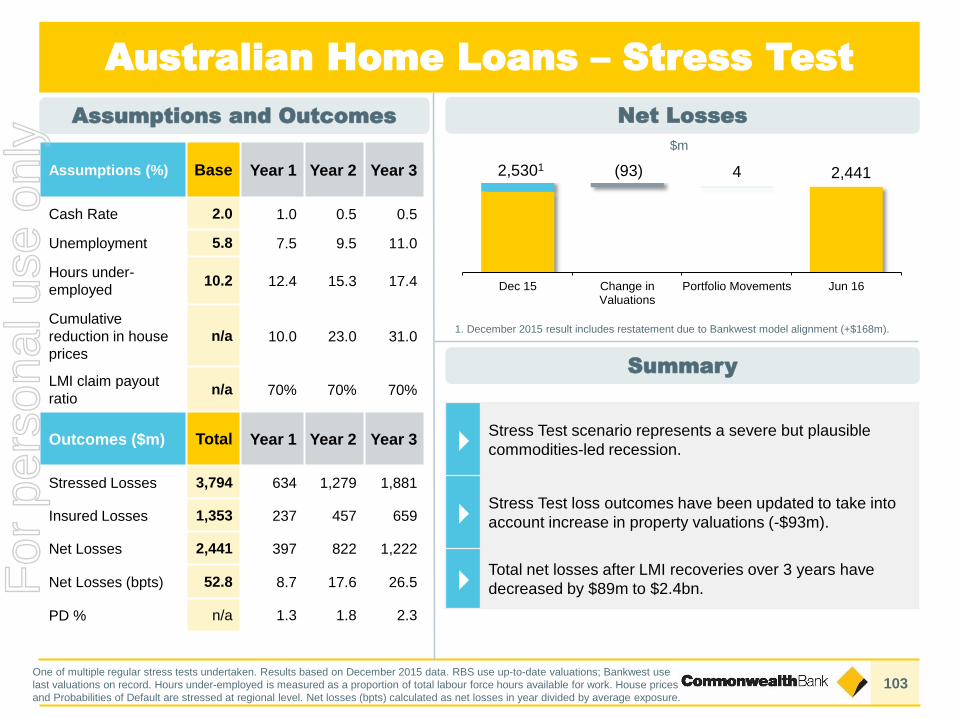
103
Australian Home Loans – Stress Test
Assumptions (%) Base Year 1 Year 2 Year 3
Cash Rate 2.0 1.0 0.5 0.5
Unemployment 5.8 7.5 9.5 11.0
Hours under-
employed10.2 12.4 15.3 17.4
Cumulative
reduction in house
prices
n/a 10.0 23.0 31.0
LMI claim payout
ration/a 70% 70% 70%
Outcomes ($m) Total Year 1 Year 2 Year 3
Stressed Losses 3,794 634 1,279 1,881
Insured Losses 1,353 237 457 659
Net Losses 2,441 397 822 1,222
Net Losses (bpts) 52.8 8.7 17.6 26.5
PD % n/a 1.3 1.8 2.3
Assumptions and Outcomes
Summary
Net Losses
1. December 2015 result includes restatement due to Bankwest model alignment (+$168m).
One of multiple regular stress tests undertaken. Results based on December 2015 data. RBS use up-to-date valuations; Bankwest use
last valuations on record. Hours under-employed is measured as a proportion of total labour force hours available for work. House prices
and Probabilities of Default are stressed at regional level. Net losses (bpts) calculated as net losses in year divided by average exposure.
(93) 4
Dec 15 Change inValuations
Portfolio Movements Jun 16
$m
2,5301 2,441
Stress Test scenario represents a severe but plausible
commodities-led recession.
Stress Test loss outcomes have been updated to take into
account increase in property valuations (-$93m).
Total net losses after LMI recoveries over 3 years have
decreased by $89m to $2.4bn.For
per
sona
l use
onl
y

104
Regulatory Exposure Mix
PortfolioRegulatory Credit Exposure Mix
CBA Peer 1 Peer 2 Peer 3
Residential Mortgages 56% 39% 45% 55%
Corporate, SME, Specialised Lending 27% 33% 39% 30%
Bank 4% 6% 5% 3%
Sovereign 9% 14% 8% 8%
Qualifying Revolving 3% 3% 2% 2%
Other Retail 1% 5% 1% 2%
Total Advanced 100% 100% 100% 100%
Source: Pillar 3 disclosures for CBA as at June 2016 and Peers as at March 2016. Excludes Standardised (including Other Assets),
CVA and Securitisation, which represents 7% of CBA, 6% of Peer 1, 6% of Peer 2 and 4% of Peer 3 before exclusion.
For
per
sona
l use
onl
y

105
Credit Exposures by Industry
TCE TIA $m TIA % of TCE
Jun 15 Jun 16 Jun 15 Jun 16 Jun 15 Jun 16
Consumer 54.2% 54.9% 1,353 1,405 0.25% 0.24%
Sovereign 8.4% 9.0% - - - -
Banks 8.6% 6.8% 10 10 0.01% 0.01%
Property 6.3% 6.6% 562 544 0.90% 0.79%
Finance – Other 4.6% 5.2% 87 64 0.19% 0.12%
Retail & Wholesale 2.3% 2.4% 387 694 1.69% 2.71%
Agriculture 1.8% 1.9% 905 853 4.97% 4.32%
Manufacturing 1.7% 1.6% 374 597 2.24% 3.56%
Transport1 1.5% 1.5% 426 405 2.83% 2.51%
Mining1 1.9% 1.5% 374 583 2.01% 3.63%
Business Services 1.2% 1.2% 137 155 1.16% 1.26%
Energy 0.9% 1.1% 64 50 0.72% 0.45%
Construction 0.9% 0.8% 267 407 3.07% 4.85%
Health & Community 0.6% 0.7% 71 64 1.10% 0.87%
Culture & Recreation 0.8% 0.7% 250 125 3.26% 1.77%
Other 4.3% 4.1% 647 636 1.52% 1.48%
Total 100.0% 100.0% 5,914 6,592 0.60% 0.63%
1. Comparative information has been reclassified to conform to presentation in the current period. Refer glossary for definition of
terms.
For
per
sona
l use
onl
y

106
- 500 1,000 1,500 2,000 2,500
A-
AA-
BBB-
A-
BBB+
BBB
BBB-
AA-
AA-
AAA
A
A+
AA-
A
A-
BBB
A-
BBB-
BBB
A
Sector Exposures
Exposures by Industry Top 20 Commercial Exposures
Group TCE by Geography
Jun 15 Dec 15 Jun 16
Australia 76.6% 75.4% 76.7%
New Zealand 8.5% 8.8% 9.2%
Europe 5.6% 6.4% 5.4%
Other International 9.3% 9.4% 8.7%
TCE $bnAAA
to AA-
A+
to A-
BBB+
to
BBB-
Other Jun 16
Sovereign 87.3 6.8 0.2 0.3 94.6
Banks 31.7 29.7 8.0 2.4 71.8
Property 1.7 5.8 14.3 47.4 69.2
Finance - Other 22.9 19.0 9.3 3.1 54.3
Retail & Wholesale - 3.6 7.1 15.0 25.7
Agriculture - 0.5 1.9 17.3 19.7
Manufacturing 1.0 3.5 5.2 7.1 16.8
Transport 0.2 1.5 9.1 5.3 16.1
Mining 1.3 3.8 6.0 4.9 16.0
Energy 0.2 1.6 8.3 1.1 11.2
All other excl.
Consumer1.5 6.7 19.3 41.8 69.3
Total 147.8 82.5 88.7 145.7 464.7
CBA grades in S&P equivalents.
TCE $m
For
per
sona
l use
onl
y
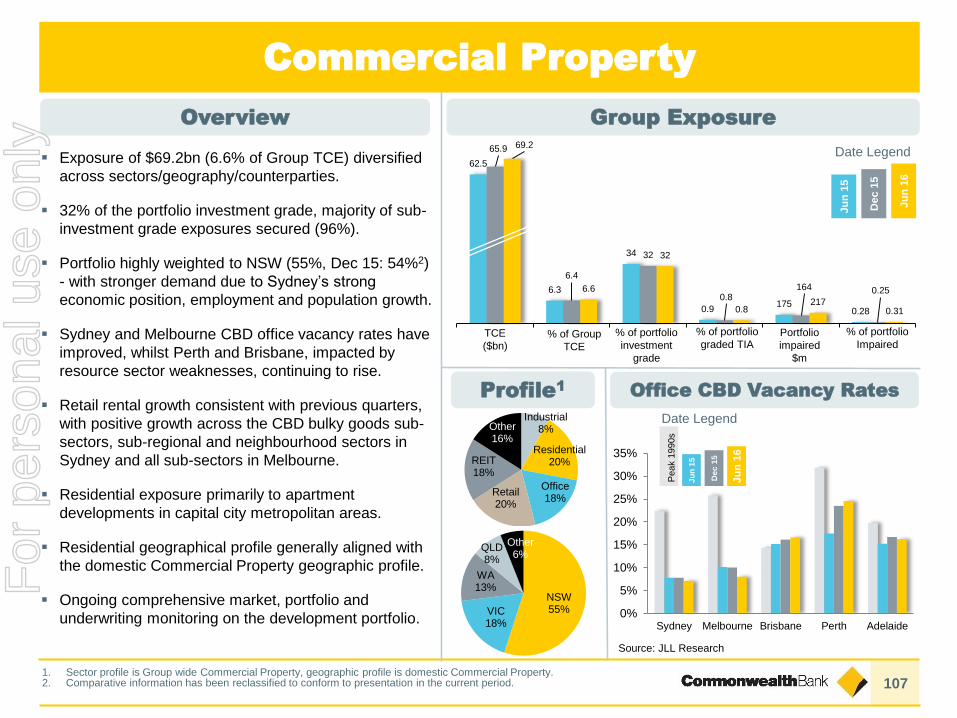
107
Commercial Property
Overview
62.5
6.3
34
0.9175
0.28
65.9
6.4
32
0.8164 0.25
69.2
6.6
32
0.8217
0.31
% of Group
TCE
Portfolio
impaired
$m
% of portfolio
investment
grade
TCE
($bn)
% of portfolio
graded TIA
% of portfolio
Impaired
Ju
n 1
5
Dec 1
5
Ju
n 1
6
Date Legend
Group Exposure
Office CBD Vacancy Rates
NSW55%VIC
18%
WA13%
QLD8%
Other6%
Profile1
Industrial8%
Residential20%
Office18%
Retail20%
REIT18%
Other16%
Source: JLL Research
Ju
n 1
5
Dec
15
Ju
n 1
6
Date Legend
Peak 1
990s
0%
5%
10%
15%
20%
25%
30%
35%
Sydney Melbourne Brisbane Perth Adelaide
Exposure of $69.2bn (6.6% of Group TCE) diversified
across sectors/geography/counterparties.
32% of the portfolio investment grade, majority of sub-
investment grade exposures secured (96%).
Portfolio highly weighted to NSW (55%, Dec 15: 54%2)
- with stronger demand due to Sydney’s strong
economic position, employment and population growth.
Sydney and Melbourne CBD office vacancy rates have
improved, whilst Perth and Brisbane, impacted by
resource sector weaknesses, continuing to rise.
Retail rental growth consistent with previous quarters,
with positive growth across the CBD bulky goods sub-
sectors, sub-regional and neighbourhood sectors in
Sydney and all sub-sectors in Melbourne.
Residential exposure primarily to apartment
developments in capital city metropolitan areas.
Residential geographical profile generally aligned with
the domestic Commercial Property geographic profile.
Ongoing comprehensive market, portfolio and
underwriting monitoring on the development portfolio.
1. Sector profile is Group wide Commercial Property, geographic profile is domestic Commercial Property. 2. Comparative information has been reclassified to conform to presentation in the current period.
For
per
sona
l use
onl
y

108
Mining, Oil and Gas
18.6
1.9
79
2.0 155 0.8
18.8
1.8
74
2.3 244 1.3
16.0
1.5
70
3.6 1741.1
Overview
Mining, Oil and Gas by Sector
Group Exposure
($bn)
-
2.0
4.0
6.0
8.0
10.0
12.0
14.0
Oil & GasExtraction
MetalsMining
Iron OreMining
Gold OreMining
MiningServices
BlackCoal
Mining
OtherMining
% of Group
TCE
Portfolio
impaired
$m
% of portfolio
investment
grade
TCE
($bn)
% of
portfolio
graded TIA
% of
portfolio
Impaired
Ju
n 1
5
Dec 1
5
Ju
n 1
6
Date Legend
Ju
n 1
5
Dec 1
5
Ju
n 1
6
Date Legend
Exposure of $16.0bn (1.5% of Group TCE), $2.8bn
reduction from Dec 15 due to active portfolio
management, repayments and limited origination.
Portfolio continues to perform acceptably:
70% investment grade.
Diversified by commodity/customer/region.
Focus on quality, low cost sponsors.
Mining services exposure modest (4% of total).
Oil and Gas Extraction is the largest sub-sector (60%
of total): 75% investment grade with 33% related to
LNG – typically supported by strong sponsors with
significant equity contribution.
TIA level has increased as commodity prices remain
lower for longer.
Impaired asset coverage ratio is 47%.
Market conditions expected to remain challenging in
near term – Producers have implemented significant
cost reductions and discretionary capital expenditure
scale back.
Comparative information has been reclassified to conform to presentation in the current period.
For
per
sona
l use
onl
y

109
Agriculture
Ju
n 1
5
Dec 1
5
Ju
n 1
6
Date Legend
Ju
n 1
5
Dec 1
5
Ju
n 1
6
Date Legend
Ju
n 1
5
Dec 1
5
Ju
n 1
6
Date Legend
18.2
1.8
13
5.0506
2.8
18.5
1.8
11
3.9323
1.8
19.7
1.9
12
4.3386
2.0
-
1.0
2.0
3.0
4.0
5.0
6.0
7.0
8.0
9.0
DairyFarming
GrainGrowing
Sheep andBeef
Farming
Forestry,Fishing and
Services
Horticultureand Other
Crops
OtherLiverstock
Overview Group Exposure
NZ Dairy Exposure1
Group Exposure by Sector
($bn)
6.3
0.6
10.1
3.2124 2.0
6.9
0.7
5.64.3 164
2.4
7.4
0.7
7.16.2
245 3.3
% of Group
TCE
Portfolio
impaired
$m
% of portfolio
investment
grade
TCE
($bn)
% of
portfolio
graded TIA
% of
portfolio
Impaired
% of Group
TCE
Portfolio
impaired
$m
% of portfolio
investment
grade
TCE
($bn)
% of
portfolio
graded TIA
% of
portfolio
Impaired
1. New Zealand dairy exposure (AUD) included in Group exposure.
Exposure of $19.7bn (1.9% of Group TCE) is well
diversified by geography, sector and client base.
Australian agriculture portfolio performing well.
NZ dairy portfolio:
Represents 0.7% of Group TCE. Continues to
perform acceptably, notwithstanding deterioration in
global milk prices.
Provision levels increased in the half year.
Based on milk price forecasts the outlook remains
challenging in the near term.
For
per
sona
l use
onl
y

110
41
4.1
74
0.4106
0.3
46
4.4
75
0.8
200
0.4
43
4.1
74
1.7123
0.3
148
14.9
91
0.1116
0.1
164
15.8
91
0.2
210
0.1
147
14.1
90
0.5 1330.1
Offshore Exposure
Exposure of $147bn (14.1% of Group TCE) with 70% to
Banks, Sovereigns and Other Finance sectors.
Excluding Banks, Sovereigns and Other Finance:
Exposure of $43bn with $22bn to Mining, Retail &
Wholesale Trade and Transport.
74% is rated investment grade.
TIAs have increased to 1.7% in the last 12 months
due to downgrades in commodity and commodity
related sectors.
Overview Offshore Exposure
Offshore by SectorCommercial Offshore Exposure
(Excl. Banks/Sovereigns/Other Finance)
($bn)
% of Group
TCE
Portfolio
impaired
$m
% of portfolio
investment
grade
TCE
($bn)
% of
portfolio
graded TIA
% of
portfolio
Impaired
% of Group
TCE
Portfolio
impaired
$m
% of portfolio
investment
grade
TCE
($bn)
% of
portfolio
graded TIA
% of
portfolio
Impaired
Offshore excludes New Zealand.
Ju
n 1
5
Dec 1
5
Ju
n 1
6
Date Legend
Ju
n 1
5
Dec 1
5
Ju
n 1
6
Date Legend
Ju
n 1
5
Dec 1
5
Ju
n 1
6
Date Legend
0.0
10.0
20.0
30.0
40.0
50.0
60.0
70.0
Bank Sovereign Finance -Other
Mining Retail &Wholesale
Transport Other
For
per
sona
l use
onl
y

111
Liquidity Coverage Ratio
1. Liquids are reported net of applicable regulatory haircuts
LCR 120% at 30 Jun 2016
Committed Liquidity Facility reduced by $7.5bn
The Group’s Net Stable Funding Ratio (NSFR) is currently above the 100% requirement
$bn
Liquidity Coverage
Ratio ($bn)Jun 16 Jun 15
Change
($bn)
High Quality Liquid Assets 75.1 65.9 9.2
Committed Liquidity Facility 58.5 66.0 (7.5)
Total LCR liquid assets 133.6 131.9 1.3%
Net Cash Outflows due to:
Customer deposits 70.1 65.8 4.3
Wholesale funding 19.4 30.8 (11.4)
Other 21.9 13.8 8.1
Net Cash Outflows 111.4 110.4 1.0
LCR 120% 120% -
Internal
RMBS
RBA repo-
eligible
Cash, Govt,
Semi-govt
LCR Qualifying Liquid Assets1
6674 75
2523 22
4143 37
Jun 15 Dec 15 Jun 16
132
140134
For
per
sona
l use
onl
y
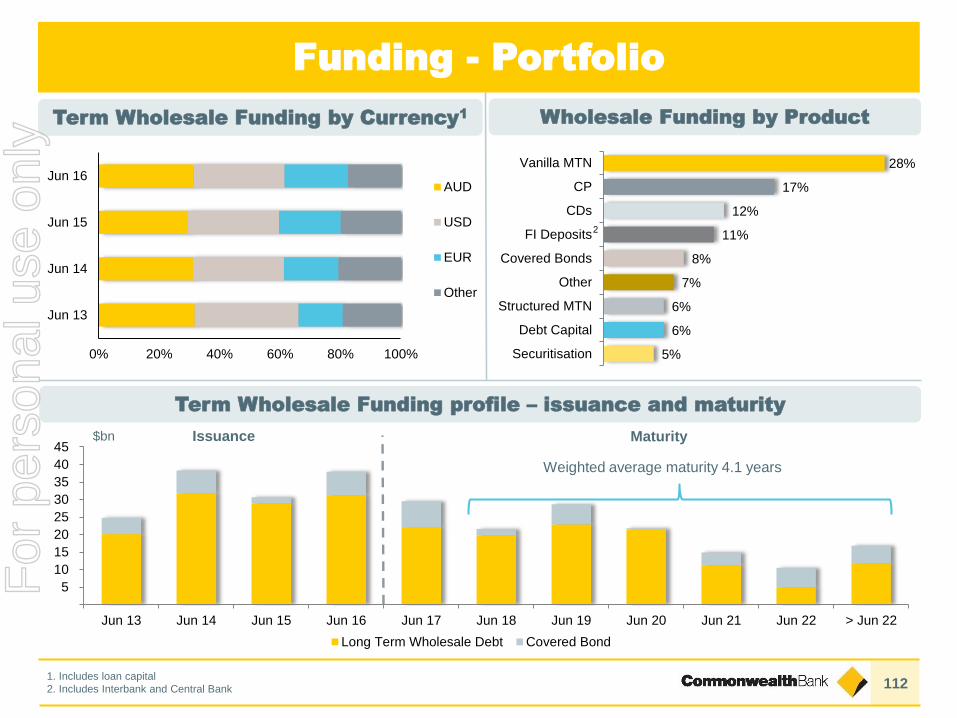
112
0% 20% 40% 60% 80% 100%
Jun 13
Jun 14
Jun 15
Jun 16AUD
USD
EUR
Other
5
10
15
20
25
30
35
40
45
Jun 13 Jun 14 Jun 15 Jun 16 Jun 17 Jun 18 Jun 19 Jun 20 Jun 21 Jun 22 > Jun 22
Long Term Wholesale Debt Covered Bond
Funding - Portfolio
Weighted average maturity 4.1 years
2
Issuance Maturity$bn
Term Wholesale Funding by Currency1
Wholesale Funding by Product
Term Wholesale Funding profile – issuance and maturity
5%
6%
6%
7%
8%
11%
12%
17%
28%
Securitisation
Debt Capital
Structured MTN
Other
Covered Bonds
FI Deposits
CDs
CP
Vanilla MTN
1. Includes loan capital
2. Includes Interbank and Central Bank
For
per
sona
l use
onl
y
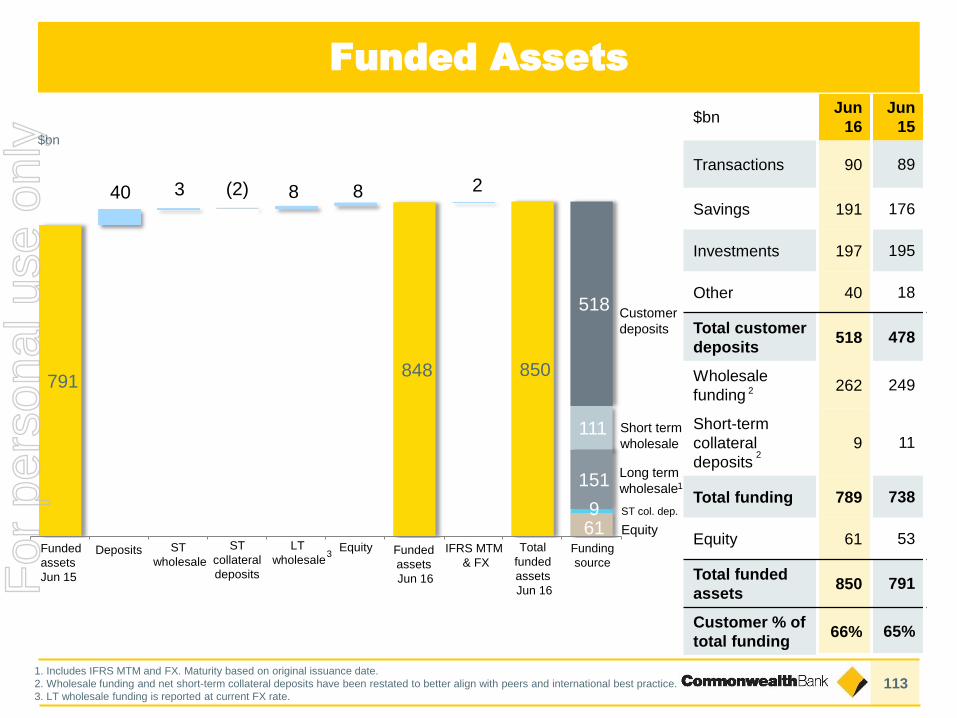
113
$bnJun
16
Jun
15
Transactions 90 89
Savings 191 176
Investments 197 195
Other 40 18
Total customer
deposits518 478
Wholesale
funding262 249
Short-term
collateral
deposits
9 11
Total funding 789 738
Equity 61 53
Total funded
assets850 791
Customer % of
total funding66% 65%
Funded
assets
Jun 15
Deposits ST
wholesale
LT
wholesaleEquity Funded
assets
Jun 16
IFRS MTM
& FX
Total
funded
assets
Jun 16
Funding
source
Equity
Long term
wholesale
Customer
deposits
Short term
wholesale
$bn
1
1. Includes IFRS MTM and FX. Maturity based on original issuance date.
2. Wholesale funding and net short-term collateral deposits have been restated to better align with peers and international best practice.
3. LT wholesale funding is reported at current FX rate.
Funded Assets
791 848 850
61
40 3 8 8 2
9
151
(2)
111
518
ST col. dep.
ST
collateral
deposits
2
2
3
For
per
sona
l use
onl
y

114
Interest Rate Risk in the Banking Book
Capital ($0.6bn) assigned to interest rate risk in banking book per APS117. Bpts (basis points) of APRA CET1 ratio.
$1,303m $1,403m $1,181m $388m $868m $1,401m $596m
Jun 13 Dec 13 Jun 14 Dec 14 Jun 15 Dec 15 Jun 16
Repricing & Yield
Curve Risk
Basis
Risk
Optionality
Risk
Repricing & Yield
Curve Risk
Basis
Risk
Optionality
Risk
bpts 43 47 43 13 27 48 20
Embedded Gain
(offset to capital) Embedded Gain
(offset to capital)
For
per
sona
l use
onl
y

115
RWA & Capital Usage
Basis points contribution to change in APRA CET1 ratio.
Total Risk Weighted Assets Credit Risk Weighted Assets
Capital Usage – CET1 (APRA)
118 26 1(72)
(25) (8)10.2%
10.6%
Dec 15 Dec 15 InterimDividend (net of DRP)
Cash NPAT Credit RWA IRRBBRWA
Market &Op RWA
Other Jun 16
335.0
344.06.8
2.5 0.3 0.3(0.9)
Dec 15 Volume Quality Data RegTreatments
FX Jun 16
$bn $bn
392.7
394.7
9.12.0
1.0
(10.1)
Dec 15 CreditRisk
TradedMarket Risk
IRRBB OperationalRisk
Jun 16
(25) (5) 26 (3) (7) (19) (6) 2 (1) (1) (25)CET1 impact bpts CET1 impact bpts
For
per
sona
l use
onl
y

116
The APRA Basel III capital requirements are more conservative than those of the Basel Committee on
Banking Supervision (BCBS), leading to lower reported capital ratios. In July 2015, APRA published a
study that compared the major banks’ capital ratios against a set of international peers1
Equity investmentsBalances below prescribed threshold are risk weighted, compared to a 100% CET1 deduction under
APRA’s requirements.
Capitalised expenses Balances are risk weighted, compared to a 100% CET1 deduction under APRA’s requirements.
Deferred tax
assets
Balances below prescribed threshold are risk weighted, compared to a 100% CET1 deduction under
APRA’s requirements.
IRRBBAPRA requires capital to be held for Interest Rate Risk in the Banking Book (IRRBB). The BCBS does
not have any capital requirement.
Residential mortgages Loss Given Default (LGD) of 15%, compared to the 20% LGD floor under APRA’s requirements.
Other retail standardised
exposuresRisk-weighting of 75%, rather than 100% under APRA’s requirements.
Corporate exposures
Unsecured non-retail exposures: LGD of 45%, compared to the 60% or higher LGD under APRA’s
requirements.
Non-retail undrawn commitments: Credit conversion factor of 75%, compared to 100% under APRA’s
requirements.
Specialised lending
Use of IRB probabilities of default (PD) and LGDs for income producing real estate and project finance
exposures, reduced by application of a scaling factor of 1.06. APRA applies higher risk weights under a
supervisory slotting approach, but does not require the application of the scaling factor.
Currency conversion
threshold
Increase in the A$ equivalent concessional threshold level for small business retail and small/medium
enterprise corporate exposures.
1. APRA study entitled “International capital comparison study” (13 July 2015)
APRA & International Comparison
For
per
sona
l use
onl
y

117
APRA & International Comparison
The following table provides details on the differences, as at 30 June 2016, between the APRA Basel III
capital requirements and internationally comparable capital ratio1.
CET1 Basel III (APRA) 10.6%
Equity investments 0.8%
Capitalised expenses 0.1%
Deferred tax assets 0.3%
IRRBB 0.2%
Residential mortgages 0.7%
Other retail standardised exposures 0.1%
Unsecured non-retail exposures 0.6%
Non-retail undrawn commitments 0.4%
Specialised lending 0.5%
Currency conversion threshold 0.1%
Total adjustments 3.8%
CET1 Basel III (Internationally Comparable) 14.4%
1. Analysis aligns with the APRA study entitled “International capital comparison study” (13 July 2015)
For
per
sona
l use
onl
y

118
10%3%
9%
6%
16%
11%
40%
10%
13%
58%
12% 12%
Other Assets
Other Lending
Home Loans
Trading Securities
Cash &
equivalentsEquity
Deposits
Long Term3
Short Term3
Other Liabilities
Trading Liabilities
Assets Liab + Equity
Based on analysis of Citigroup, JP Morgan, Bank of America and Wells Fargo as at
31 March 2016.
Average of four banks.
Other Fair
Value Assets
1. Based on statutory balance sheets.
2. Balance sheets do not include derivative assets and liabilities.
3. Wholesale funding
UK and US Balance Sheet Comparison1,2
6% 4%
11% 11%
15%12%
39%
8%
20%
57%
9% 8%
Other Assets
Other Fair
Value Assets
Other Lending
Home Loans
Trading Securities
Cash &
equivalents Equity
Deposits
Long Term3
Short Term3
Other Liabilities
Trading Liabilities
Assets Liab + Equity
Based on analysis of Lloyds, RBS, HSBC and Barclays as at 30 June 2016.
Average of four banks.
USAUnited Kingdom
For
per
sona
l use
onl
y

119
Other Assets
Other Lending
Home Loans
Trading Securities
Cash & equivalentsEquity
Deposits
Long Term1
Short Term1
Other Liabilities
CBA balance sheet as at 30 June 2016.
Balance sheet does not include derivative assets and liabilities.
Based on statutory balance sheet.
Assets Liab + Equity
Other Fair
Value Assets
3%0%
6%3%
9%
10%
28%
18%
51%
62%
3%7%
Trading Liabilities
Assets – CBA has a safe, conservative asset profile:
51% of balance sheet is home loans, which are stable/long
term.
Trading securities and other fair value assets comprise just
15% of CBA balance sheet compared to 26% and 25% for
UK and US banks respectively.
CBA’s balance sheet is less volatile due to a lower
proportion of fair value assets.
Funding – CBA has a secure, sustainable low risk
funding profile:
Higher deposit base than US and UK banks (62%
including 31% of household deposits).
CBA wholesale funding profile has a longer duration than
UK banks. This means CBA has lower dependence on
wholesale funding markets in any given period compared
to UK banks.
Assets*
Amortised cost Fair Value
CBA 81% 19%
UK 42% 58%
US 55% 45%
* Includes grossed up derivatives.
1. Wholesale funding - based on residual maturity
Australian Banks – Safe Assets, Secure Funding
Commonwealth Bank Balance Sheet Comparisons
For
per
sona
l use
onl
y

120
The Australian major banks are
domestic systemically-important banks
(D-SIBs). From 1 January 2016, D-
SIBs are required to hold 1% additional
capital in the form of CET1 (called the
D-SIB buffer).
The Countercyclical Capital Buffer
(CCyB), which was also effective from
1 January 2016, currently has no
material impact on the Group1.
Both the D-SIB and CCyB form part of
the CCB. From 1 January 2016, if a
bank’s CET1 ratio falls within the CCB,
they may be restricted from making
discretionary payments such as
dividends, hybrid Tier 1 distributions
and bonuses
CET1 ratio Value
% of earnings
able to be used
for discretionary
payments
Above top of CCBPCR + 3.5%,
and above100%
Fourth quartile of
CCB
Less than PCR
+ 3.5%60%
Third quartile of
CCB
Less than PCR
+ 2.625%40%
Second quartile of
CCB
Less than PCR
+ 1.75%20%
First quartile of CCBLess than
PCR+ 0.875%0%
Prudential capital
ratio (4.5% minimum
plus any additional
amount required by
APRA)
PCR 0%
Above example assumes the total CCB (including the D-SIB buffer of 1% and
CCyB of 0%) is 3.5%
Capital Conservation Buffer (CCB)
1. In December 2015, APRA announced that the CCyB for Australian exposures has been set at 0%. The Group has limited
exposures to those offshore jurisdictions in which a CCyB in excess of 0% has been imposed.
For
per
sona
l use
onl
y

121Replicating portfolio provides partial economic hedge for certain liabilities and assets that display imperfect correlation between
the cash rate and the product interest rate
1Actual and Forecast Scenario
2002 FY18FY16
Official Cash Rate
Replicating Portfolio Yield
Replicating Portfolio
Actual and Forecast Scenario
For
per
sona
l use
onl
y

122
Regulatory Expected Loss
$m Jun 16 Dec 15 Jun 15
Regulatory Expected Loss (EL) 4,430 4,214 4,083
Eligible Provisions (EP)
Collective Provisions1 2,562 2,656 2,599
Specific Provisions1,2 1,801 1,649 1,656
General Reserve for Credit Losses adjustment 552 386 346
less ineligible provisions (standardised portfolio) (609) (592) (593)
Total Eligible Provisions 4,306 4,099 4,008
Regulatory EL in Excess of EP 124 115 75
Common Equity Tier 1 Adjustment3 314 245 134
1. Includes transfer from collective provision to specific provisions (Jun 16: $256m, Dec 15: $145m, Jun 15: $163m). 2. Specific provisions
includes partial write offs (Jun 16: $601m, Dec 15: $595m, Jun 15: $606m). 3. Excess of eligible provisions compared to expected loss for
defaulted exposures (Jun 16: $190m, Dec 15: $130m, June 15: $59m), not available to reduce the shortfall for non-defaulted exposures.
For
per
sona
l use
onl
y

123
5.0% 5.0%
5.6% 5.6%
APRA Int'l (1)
Leverage Ratio
$m Jun 16
Tier 1 Capital 48,553
Total Exposures 980,846
Leverage Ratio (APRA) 5.0%
$m Jun 16
Group Total Assets 933,078
Less subsidiaries outside the scope of regulatory
consolidations (16,625)
Less net derivative adjustment (1,662)
Add securities financing transactions 493
Less asset amounts deducted from Tier 1 Capital (18,140)
Add off balance sheet exposures 83,702
Total Exposures 980,846
Leverage ratio = Tier 1 Capital
Total Exposures
Leverage ratio introduced to constrain the build-up of
leverage in the banking system.
Scheduled to be introduced as a minimum requirement
from 1 January 2018.
CBA Leverage Ratio well above prescribed Basel Committee minimum
Dec 15 Jun 16
Basel
Committee
minimum
3%
1. Tier 1 capital included in the calculation of the internationally comparable leverage ratio aligns with the APRA study entitled
“international capital comparison study” (13 July 2015), and includes Basel III non-compliant Tier 1 instruments that are currently
subject to transitional rules.
For
per
sona
l use
onl
y

124
APRA
Leverage ratio
CCB + D-SIB
2016 2017 2018 2019
Regulatory Change
Response to FSI
Countercyclical
Capital Buffer (CCyB)
Implementation from 1 Jul 2016 – increase in mortgage risk weights
Disclosure requirements only Implementation
Implemented 1 Jan 2016 CCB CET1 2.5% + D-SIB CET1 1.0%
Implemented 1 Jan 2016 – not material
Basel Committee
Capital floors
Standardised &
Advanced Credit Risk
IRRBB
Consultation - expected
to be finalised in 2016
Finalised Mar 2016
Implementation to be advised
NSFR Consultation
Standardised
Operational Risk
Market Risk Finalised Jan 2016
Implementation to be advised
Implementation to be advised
Implementation
Implementation
Consultation - expected
to be finalised in 2016
Consultation - expected
to be finalised in 2016
Additional disclosures from 2018For
per
sona
l use
onl
y
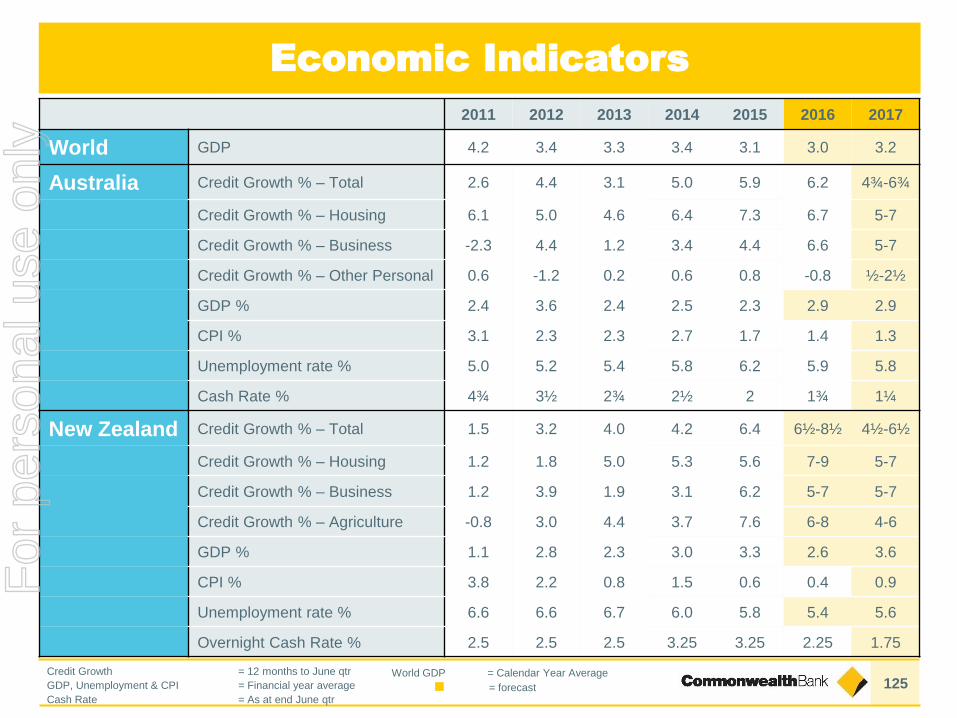
125Credit Growth = 12 months to June qtr
GDP, Unemployment & CPI = Financial year average
Cash Rate = As at end June qtr= forecast
World GDP = Calendar Year Average
2011 2012 2013 2014 2015 2016 2017
World GDP 4.2 3.4 3.3 3.4 3.1 3.0 3.2
Australia Credit Growth % – Total 2.6 4.4 3.1 5.0 5.9 6.2 4¾-6¾
Credit Growth % – Housing 6.1 5.0 4.6 6.4 7.3 6.7 5-7
Credit Growth % – Business -2.3 4.4 1.2 3.4 4.4 6.6 5-7
Credit Growth % – Other Personal 0.6 -1.2 0.2 0.6 0.8 -0.8 ½-2½
GDP % 2.4 3.6 2.4 2.5 2.3 2.9 2.9
CPI % 3.1 2.3 2.3 2.7 1.7 1.4 1.3
Unemployment rate % 5.0 5.2 5.4 5.8 6.2 5.9 5.8
Cash Rate % 4¾ 3½ 2¾ 2½ 2 1¾ 1¼
New Zealand Credit Growth % – Total 1.5 3.2 4.0 4.2 6.4 6½-8½ 4½-6½
Credit Growth % – Housing 1.2 1.8 5.0 5.3 5.6 7-9 5-7
Credit Growth % – Business 1.2 3.9 1.9 3.1 6.2 5-7 5-7
Credit Growth % – Agriculture -0.8 3.0 4.4 3.7 7.6 6-8 4-6
GDP % 1.1 2.8 2.3 3.0 3.3 2.6 3.6
CPI % 3.8 2.2 0.8 1.5 0.6 0.4 0.9
Unemployment rate % 6.6 6.6 6.7 6.0 5.8 5.4 5.6
Overnight Cash Rate % 2.5 2.5 2.5 3.25 3.25 2.25 1.75
Economic Indicators
For
per
sona
l use
onl
y

126
Australia remains well placed,
but exposed to global uncertainty
1. Source: Bloomberg
2. Source: CEIC
(annual % change)
Australia EurozoneUK JapanUS
(%) (%)
GDP1
Unemployment Rate2
Global Interest Rates1
Australia is into its 25th year
of continuous economic
growth
Unemployment
rates trending lower
Australian policy makers
retain some firepower
-10
-6
-2
2
6
Mar 05 Nov 08 Jul 12 Mar 16
0
4
8
12
Jan 05 Sep 07 May 10 Jan 13 Sep 15
-2
0
2
4
6
8
Jan 05 Sep 07 May 10 Jan 13 Sep 15
For
per
sona
l use
onl
y

127
Chinese economic growth is slowing
(annual % change) (% of share of annual exports)
1. Source: National Bureau of Statistics of China / CBA
2. Source: CEIC
China: GDP1
Export Shares2
We expect the Chinese economy to
grow by 6% in 2017, with lower
interest rates and supportive fiscal
policy.
China and the rest of emerging Asia drive
global economic growth and commodity
demand. Slower growth in China is a risk for
the global economy and Australia.
CBA
(f)
0
10
20
30
40
Jan 00 Mar 03 May 06 Jul 09 Sep 12 Nov 15
ASEAN EUChina JapanNorth America
0
4
8
12
16
1998 2004 2010 2016
For
per
sona
l use
onl
y

128
Growth in China is shifting away from resource-
intensive industries
1. Source: CEIC
2. Source: ABS
China GDP growth by industry1
Short term overseas arrivals2
China continues to transition from
investment led growth to
consumption/services driven growth.
This process means slower demand
growth for resource-based goods.
China’s transition presents opportunities for
Australia. Rising incomes in China will benefit
the education, tourism and agricultural
sectors in Australia. There is also scope for
health and financial exports to China.
(rolling annual total millions)(annual % change)
0%
5%
10%
15%
20%
Mar 07 Jun 09 Sep 11 Dec 13 Mar 16
Industry
Services
Agriculture
0.0
0.5
1.0
1.5
Jan 02 May 05 Sep 08 Jan 12 May 15
New Zealand
UK
Japan
China
India
For
per
sona
l use
onl
y

129
The domestic growth transition continues
1. Source: ABS
2. Source: ABS / CBA
Growth drivers from mining peak1
Progress on the transition2
The transition from mining to other sources
of growth continues. We are further through
the investment downturn than many
appreciate.
Australia is around 80% of the way through
the anticipated decline in mining capex. At
the same time, we are also around 70% of
the way through the expected loss of mining
construction-related jobs.
(cumulative contribution to GDP since end 2012)
-4
0
4
8
12
Dec 12 Jun 13 Dec 13 Jun 14 Dec 14 Jun 15 Dec 15
GDPOther (non-mining)
Rise in resource exports
Downturn in mining capex
0
28
55
83
110
0.0
1.3
2.5
3.8
5.0
% of GDP
Ch in
'000
F’cast F’castActual
to date
Actual
to date
Drop in mining capex Mining-related job losses
For
per
sona
l use
onl
y

130
But the transition is uneven
(rolling annual total ‘000)
1. Source: ABS
(index; end 2012=100)Dwelling construction
1Transition drivers
1
A record residential construction boom is
underway, lifting employment and related
parts of retail like hardware, furnishings
and white goods.
Non-mining capex
The transition is not uniform. Other parts of
the transition have failed to fire. Businesses
have been reluctant to invest and
governments have not lifted capex.
Residential
construction
Government
capex
(index, end 2012=100)
100
150
200
250
Sep 89 Sep 95 Sep 01 Sep 07 Sep 1360
80
100
120
Jun 12 Jun 13 Jun 14 Jun 15 Jun 16
Commencements
Approvals
For
per
sona
l use
onl
y

131
Consumer spending has lifted & the lower
currency is supporting service industries
(annual % change)
1. Source: ABS
(smoothed annual % change)
Employment & the consumer1
Some “surprises”1
Other parts of the transition are more
encouraging. An improvement in the labour
market is positive for consumer spending,
despite the weakness in wages growth.
The lower Australian dollar helps lift tourism
exports and enhances the competitiveness
of domestic manufacturing and service
providers.
-1
0
1
2
3
4
5
Mar 08 Mar 10 Mar 12 Mar 14 Mar 16
Jobs growth
Consumer
spending
-3
0
3
6
Sep 08 Sep 10 Sep 12 Sep 14 Sep 16
Consumer
spending
Non-resource
exports
For
per
sona
l use
onl
y
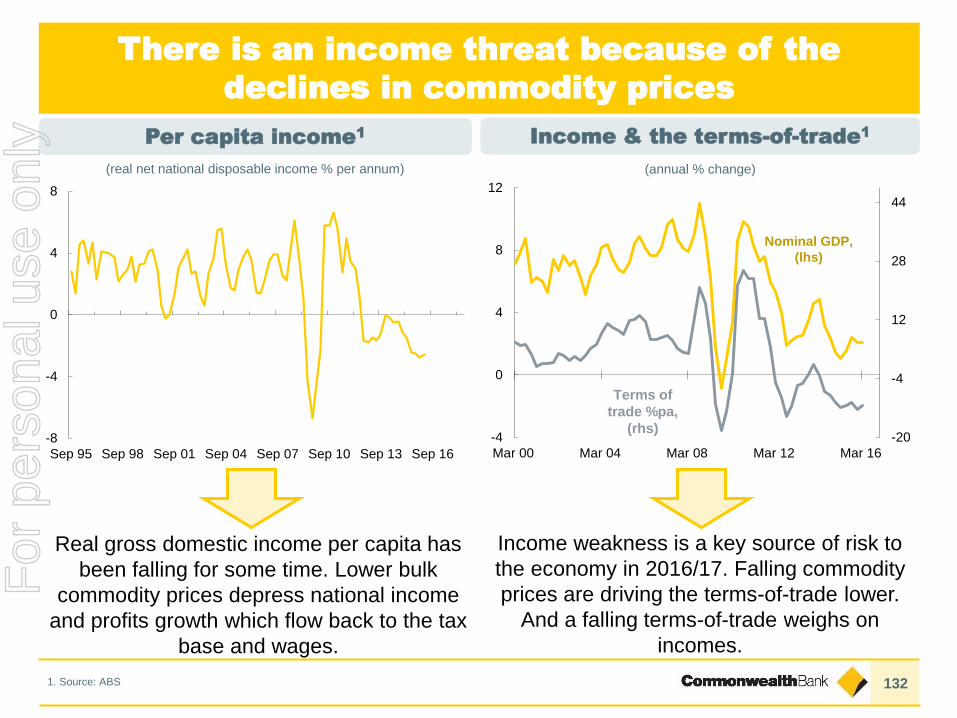
132
There is an income threat because of the
declines in commodity prices
(real net national disposable income % per annum)
1. Source: ABS
(annual % change)
Per capita income1
Income & the terms-of-trade1
Real gross domestic income per capita has
been falling for some time. Lower bulk
commodity prices depress national income
and profits growth which flow back to the tax
base and wages.
Income weakness is a key source of risk to
the economy in 2016/17. Falling commodity
prices are driving the terms-of-trade lower.
And a falling terms-of-trade weighs on
incomes.
-8
-4
0
4
8
Sep 95 Sep 98 Sep 01 Sep 04 Sep 07 Sep 10 Sep 13 Sep 16
-20
-4
12
28
44
-4
0
4
8
12
Mar 00 Mar 04 Mar 08 Mar 12 Mar 16
Nominal GDP,
(lhs)
Terms of
trade %pa,
(rhs)
For
per
sona
l use
onl
y

133
The housing market is slowing
(moving annual total ‘000)
1. Source: ABS
2. Source: ABS / CBA
Population growth1
CBA: Housing demand & supply2
Population growth has slowed as net
migration eased. Therefore, the
underlying demand for new dwellings
has stepped down.
Housing supply is now running ahead of
housing demand, satisfying some past
backlog.
Total
Net migration
Natural increase
(‘000)
0
100
200
300
400
500
Jun 91 Dec 94 Jun 98 Dec 01 Jun 05 Dec 08 Jun 12 Dec 15
Supply
Demand
Pent-up demand
Excess supply
-100
0
100
200
-100
0
100
200
Sep 90 Sep 96 Sep 02 Sep 08 Sep 14
For
per
sona
l use
onl
y

134
Dwelling price growth diverges
1. Source: CoreLogic RP Data
2. Source: RBA
(annual % change) (annual % change)
Dwelling prices2
Housing credit growth2
Dwelling price growth varies widely by region.
House and apartment price growth has lifted
a little in recent months.
Higher dwelling prices, regulatory changes to
investor lending and lower mortgage rates have
produced divergent credit growth.
Total
housing
Owner-occupier
housing
Investor
housing
-20
-10
0
10
20
30
40
50
Jan 06 Jan 08 Jan 10 Jan 12 Jan 14 Jan 16
Sydney
Brisbane
Melbourne
Perth
0
9
18
27
36
Jan 02 Jan 05 Jan 08 Jan 11 Jan 14
For
per
sona
l use
onl
y

135
Household balance sheets remain strong
(%)
1. Source: ABS
2. Source: ABS / RBA
Saving ratio1
Cash holdings2
The household savings rate remains at a
relatively high level, but has eased over the
past year. Consumer spending growth is
running in line with longer term averages.
Australian businesses and households have
significant holdings of cash which makes them
well placed to deal with global risks.
0
20
40
60
Mar 88 Mar 93 Mar 98 Mar 03 Mar 08 Mar 13
Business
(exc financial)
Households
(deposits as % of GDP)
-3
0
3
6
9
12
Sep 98 Sep 02 Sep 06 Sep 10 Sep 14
Consumer spending
Savings ratio
For
per
sona
l use
onl
y

136
Households in better shape in net terms
Household net worth has improved despite an increase in debt, driven by a large increase
in the value of residential assets. Households would be vulnerable to a fall in asset values
and/or a rise in interest rates.
(% of annual household disposable income)
1. Disposable income is after tax and before the deduction of interest payments. Source: ABS / RBA.
Household Wealth and Liabilities1
0
150
300
450
600
750
Mar 00 Mar 04 Mar 08 Mar 12 Mar 16
Dwellings
Liabilities
Financial Assets
Net Wealth
For
per
sona
l use
onl
y

137
Housing “Bubble” –
typical characteristicsCurrent position in Australia
Unsustainable asset prices Prices were supported by underbuilding in past years but demand
and supply are now more in balance.
Dwelling price growth is slowing across the nation.
Strong lift in construction will dampen dwelling price growth
Residential rental yields stabilising as new supply rises
Speculative investment
artificially inflates asset prices
Investor interest is a rational response to low interest rates, rising
risk appetite and the pursuit of yield
Investor demand now easing after APRA’s regulatory changes
Strong volume growth driven
by relaxed lending standards
Minimal “low doc” lending
Mortgage insurance for higher LVR loans
Full recourse lending
Lift in rates for investors as a macroprudential policy response
Interaction of high debt levels
and interest rates
A high proportion of borrowers ahead of required repayment levels
Interest rate buffers built into loan serviceability tests at application
Housing credit growth remains modest and at the bottom end of
the range of the past three decades.
Domestic economic shock –
trigger for price correction
Respectable Australian economic growth outcomes
Unemployment rate has fallen and arrears rates are low
Factors that typically characterise a house price
bubble are not evident in Australia
For
per
sona
l use
onl
y

138
New Zealand
(USD/tonne)
1. Source: GlobalDairyTrade
2. Source: Stats NZ
(monthly, seasonally adjusted ‘000)
GDT overall price
Whole Milk Powder
Global dairy trade auction results1
NZ short term arrivals2
Dairy prices weakened over 2014 and
2015. A gradual recovery is expected over
2016 as production falls in response to
ongoing lower prices.
Meanwhile, tourism (now the biggest foreign
exchange earner) is going from strength to
strength. Chinese visitor numbers have
soared over the past few years.
1,000
2,000
3,000
4,000
5,000
6,000
Jul 08 Jul 09 Jul 10 Jul 11 Jul 12 Jul 13 Jul 14 Jul 15 Jul 16160
180
200
220
240
260
280
300
05 06 07 08 09 10 11 12 13 14 15 16
Lions tour
RWC
CWC
For
per
sona
l use
onl
y

139
New Zealand
(%)
1. Source: Stats NZ / ASB
2. Source: ASB
(ASB forecast and implied market pricing)
NZ CPI inflation1
OCR forecasts2
The inflation environment remains very
subdued. The recent NZ dollar appreciation
may see inflation staying lower for longer.
The RBNZ has cut the Official Cash Rate
from 3.5% to 2.25%. We expect the RBNZ
will cut the OCR even further.
-1
0
1
2
3
4
5
6
Jun 00 Jun 03 Jun 06 Jun 09 Jun 12 Jun 15
(f)
Annual %
Quarterly change1.5
2.0
2.5
3.0
3.5
4.0
Sep 13 Jun 14 Mar 15 Dec 15 Sep 16 Jun 17 Mar 18
OCR implied by current
market pricing
ASB Economics Forecast
(peak of 3.5% in 2020)
For
per
sona
l use
onl
y
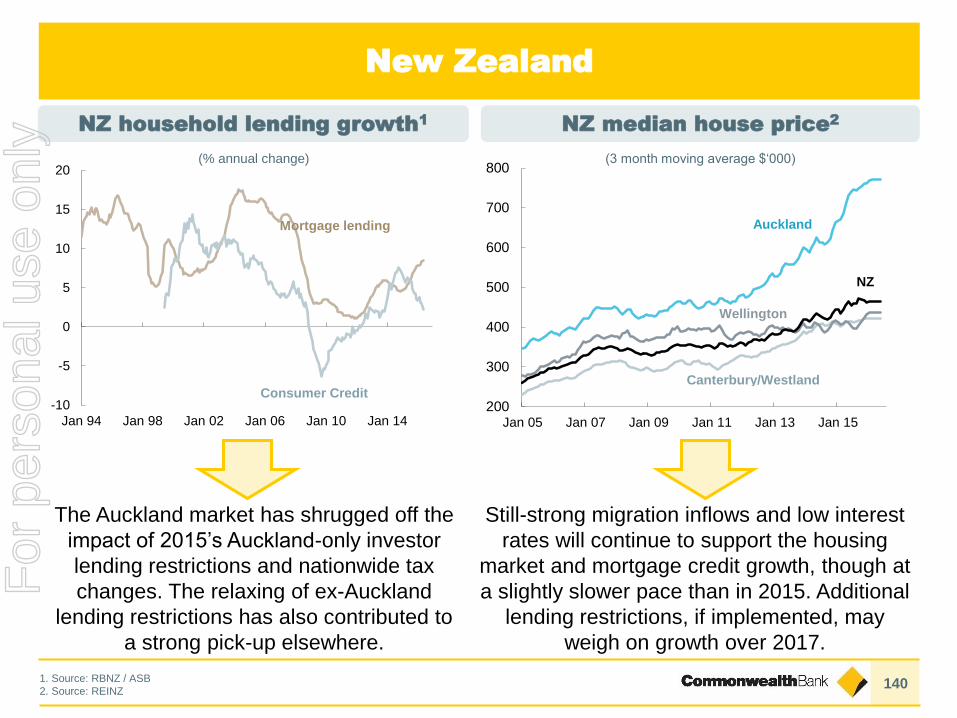
140
New Zealand
(% annual change)
1. Source: RBNZ / ASB
2. Source: REINZ
(3 month moving average $‘000)
NZ household lending growth1
NZ median house price2
The Auckland market has shrugged off the
impact of 2015’s Auckland-only investor
lending restrictions and nationwide tax
changes. The relaxing of ex-Auckland
lending restrictions has also contributed to
a strong pick-up elsewhere.
Still-strong migration inflows and low interest
rates will continue to support the housing
market and mortgage credit growth, though at
a slightly slower pace than in 2015. Additional
lending restrictions, if implemented, may
weigh on growth over 2017.
-10
-5
0
5
10
15
20
Jan 94 Jan 98 Jan 02 Jan 06 Jan 10 Jan 14
Mortgage lending
Consumer Credit200
300
400
500
600
700
800
Jan 05 Jan 07 Jan 09 Jan 11 Jan 13 Jan 15
Auckland
Wellington
Canterbury/Westland
NZ
For
per
sona
l use
onl
y

141
Customer Metrics - Sources
1 Roy Morgan Research Retail Main Financial Institution (MFI) Customer Satisfaction. Australian population 14+, % “Very Satisfied” or “Fairly Satisfied” with
relationship with that MFI. 6 month rolling average to June 2016. Peers includes ANZ, NAB and Westpac. CBA excludes Bankwest. (Slides 11, 13 & 65)
2 Customer Needs Met / Products per Customer – Roy Morgan Research. Australian Population 18+, Banking and Finance products per Banking and Finance
customer at main financial institution. 6 month rolling average to June 2016. CBA excludes Bankwest. Rank based on comparison to ANZ, NAB and Westpac.
Wealth includes Superannuation, Insurance and Managed Investments. Share of product is calculated by dividing Products held at CBA by Products held
anywhere. “Internet Banking” refers to CBA customers who conducted internet banking in the last 4 weeks. Note: Individual products may not add up to the
overall totals due to rounding. (Slides 13 & 69)
3 Roy Morgan Research, Australians 14+, Proportion of Banking and Finance MFI Customers that nominated each bank as their Main Financial Institution (MFI
Share), 12 month average to June 2016. Peers includes ANZ, NAB and Westpac (incl. St George Group). CBA includes Bankwest. “Internet Banking” refers to
customers who conducted internet banking via app and website anywhere in the last 4 weeks. (Slides 12 & 65)
4 DBM Business Financial Services Monitor (June 2016), average satisfaction rating of business customers’ Main Financial Institution (MFI), across all Australian
businesses, using an 11 pt scale where 0 is Extremely Dissatisfied and 10 is Extremely Satisfied, 6 month rolling average. (Slides 11, 65, & 82)
5 DBM Business Financial Services Monitor. Micro businesses are defined as those with annual turnover up to $1 million, Small businesses are those with annual
turnover of $1 million to less than $5 million, Medium businesses are those with annual turnover of $5 million to less than $50 million, Large businesses are
those with annual turnover of $50m to less than $500m, and IB&M businesses are those with annual turnover of $100 million or more. All charts use a 6 month
rolling average. (Slide 82)
6 Wealth Insights platform service and overall satisfaction score - Ranking of Colonial First State (the platform provider) is calculated based on the weighted
average (using Plan for Life FUA) of the overall adviser satisfaction scores of FirstChoice and FirstWrap compared with the weighted average of other platform
providers in the relevant peer set. The relevant peer set includes platforms belonging to Westpac, NAB, ANZ, AMP and Macquarie in the Wealth Insights survey.
This measure is updated annually in April. (Slide 11 & 65)
7 PT Bank Commonwealth in Indonesia rated number one among foreign banks for customer service as measured by MRI (one of the leading industry Standards
for Customer Service Excellence). (Slide 11)
8 Proportion of Banking & Finance customers’ Wealth products captured by the financial institution. Roy Morgan Research. Australian Population 18+ , 6 month
average to June 2016. Calculated by dividing Wealth products held at institution by products held anywhere. Wealth Products includes Total Insurance (excl.
Private Health), Managed Investments and Superannuation. CBA excludes Bankwest. (Slide 69)
9 Roy Morgan Research. Australian population 14+. Proportion of customers who conducted internet banking via website or app with their Main Financial
Institution in the last 4 weeks, who are either “Very Satisfied” or “Fairly Satisfied” with the service provided by that institution. 6 month average to June 2016.
Rank based on comparison to ANZ, NAB and Westpac. (Slides 10, 65, 84 & 85)
10 Roy Morgan Research. Australian population 14+. Proportion of customers who conducted internet banking via website with their Main Financial Institution in
the last 4 weeks, who are either “Very Satisfied” or “Fairly Satisfied’ with the service provided by that institution. 6 month average to June 2016. Rank based on
comparison to ANZ, NAB and Westpac. (Slide 85)
11 Roy Morgan Research. Australian population 14+. Proportion of customers who conducted internet banking via an app with their Main Financial Institution in the
last 4 weeks, who are either “Very Satisfied” or “Fairly Satisfied’ with the service provided by that institution. 6 month average to June 2016. Rank based on
comparison to ANZ, NAB and Westpac. (Slide 85)For
per
sona
l use
onl
y

142
Sustainability Scorecard – Sources and definitions
All metrics capture data of the wholly owned and operated entities of the Commonwealth Bank Group (the Group) unless otherwise stated.
1. The metric represents the proportion of retail Main Financial Institution (MFI) customers surveyed by Roy Morgan Research that are either ‘Very Satisfied’ or
‘Fairly Satisfied’ with their overall relationship (defined as customers who consider CBA to be their main financial institut ion, and hold at least a
Deposit/Transaction account) with their financial institution on a scale of 1 to 5 where 1 is ‘Very Dissatisfied’ and 5 is ‘Very Satisfied’. The metric is reported as a
6 month rolling average, based on the Australian population aged 14 and over. The ranking refers to CBA’s position relative to the other three main Australian
banks (Westpac, NAB and ANZ).
2. The metric represents the average satisfaction of CBA's Business and Institutional Banking customers as measured by DBM’s Bus iness Financial Services
Monitor. Respondents rate their overall satisfaction using an 11-point scale (where 0 is ‘Extremely Dissatisfied’ and 10 is ‘Extremely Satisfied’). Results are
reported as a 6 month rolling average as at 30 June. The rank refers to CBA’s position relative to the other three major Australian banks (Westpac, NAB and
ANZ).
3. The Colonial First State (the platform provider) score is calculated based on the weighted average (using Funds Under Administration (FUA) from the most
recent Plan for Life FUA subscription database) of the overall satisfaction scores (out of 10) of FirstChoice and FirstWrap. The ranking is calculated by
comparing the overall satisfaction score with the weighted average of other platform providers in the relevant peer set. The relevant peer set includes platforms
belonging to Westpac, NAB, ANZ, AMP and Macquarie Bank in the Wealth Insights survey.
4. The index shows the proportion of employees replying with a score of 4 or 5 to four engagement questions. These questions relate to satisfaction, retention,
advocacy and pride on a scale of 1-5 (5 is "Strongly Agree", 1 is "Strongly Disagree"). The result captures the responses of CBA employees only.
5. Employee turnover refers to all voluntary exits of permanent employees as a percentage of the average, permanent headcount paid directly by the Group (full-
time, part-time, job share or on extended leave), excluding ASB and Sovereign. Due to events recorded after the close of the previous reporting period, 2015
result has been restated from 10.0% to 10.2%.
6. Percentage of roles at the level of both Manager and Executive Manager and above filled by women, in relation to the total headcount at this level. Headcount
captures permanent headcount (full-time, part-time, job share, on extended leave), and contractors (fixed term arrangements) paid directly by the Group,
excluding ASB and Sovereign. Due to the expansion of the reporting scope for the Group, the 2014 and 2015 figures have been restated.
7. LTIFR is the reported number of occurrences of lost time arising from injury or disease that have resulted in an accepted workers compensation claim, for each
million hours worked by the average number of domestic employees (permanent, casual and contractors paid directly by the Group) over the year. Data is
presented using the information available as at 30 June for each financial year.
8. Absenteeism refers to the average number of sick leave days (and for CommSec employees, carers leave days) per domestic full-time equivalent (FTE).
Absenteeism is the annualised figure as at 31 May each year. Figures prior to 2012 are for CBA domestic only.
9. Scope 1 carbon emissions relate to the consumption of natural gas and stationary fuel by domestic retail and commercial properties. It also includes the
business use of our domestic tool-of-trade vehicle fleet. Scope 2 carbon emissions relate to the electricity use by domestic retail, commercial, ATMs and certain
residential properties. Scope 3 carbon emissions relate to indirect emissions associated with Scope 1 and 2, rental car and taxi use, business use of private
vehicles, dedicated bus service, business flights, office paper and waste to landfill.
10. The number of active School Banking students who banked at least once during a 12 month period through a School Banking school.
11. The number of students booked to attend Commonwealth Bank’s Start Smart Programs during a 12 month period.
For
per
sona
l use
onl
y

143
Technology - Sources
Apple, the Apple logo, iPhone and iPad are trademarks of Apple Inc., registered in the U.S. and other countries. App Store is a service mark of Apple Inc.
Sources for ‘Australia’s leading technology bank’ (slide 84)
1 Free financial app: CommBank app on iOS and Android in Australia. Sources are the Apple App Store and the Google Play Store.
2 Online banking: CBA won Canstar's Bank of the Year – Online Banking award for 2016 (for the 7th year in a row). Awarded May 2016.
3 Customer satisfaction – internet banking services: Roy Morgan Research. Australian population 14+. Proportion of customers who conducted
internet banking via website or app with their Main Financial Institution in the last 4 weeks, who are either “Very Satisfied” or “Fairly Satisfied”
with the service provided by that institution. Rank based on comparison to ANZ, NAB and Westpac. CBA held the number one position for
Overall Satisfaction the entire financial year 2016.
4 Social media: CBA’s combined following across its main Facebook, Linkedin, Twitter and Instagram sites is the largest of the main Australian
banks (subsidiary and associated pages not included in count). In addition, global independent website The Financial Brand rates the social
media presence of banks and credit unions globally. For the second quarter of 2016, CBA is the #1 Australian bank on their list:
http://thefinancialbrand.com/59589/power-100-2016-q2-bank-rankings/.
5 Australian Banking and Finance magazine awarded CBA the Most Innovative Business Bank Product (for Daily IQ) at the Corporate &
Business Banking Awards 2015.
6 Client feedback: Peter Lee Associated ranked CommBiz 1st or equal 1st across all eight platform measures including processing, security
features, integration with accounting systems, overall features/ functionality, user friendliness, overall value for money, reporting, customer
service and support, ease of use of platform via smartphone/tablet.
7 Australian Banking and Finance magazine awarded CBA the Best Internet Business Bank award at the Corporate & Business Banking
Awards 2015.
8 Australian Banking and Finance magazine awarded CBA the Innovative Card & Payment Product of the year for Mobile Wallet. Awarded June
2016.
9 Mobile banking: CBA won Canstar’s Bank of the Year - Mobile Banking award for 2016. Awarded May 2016.
For
per
sona
l use
onl
y

144
Glossary of Key Definitions
Funding & Risk
Liquidity coverage
ratio (LCR)
The LCR is a quantitative liquidity measure that is part of
the Basel III reforms. It was implemented by APRA in
Australia on 1 Jan 2015. It requires Australian ADI’s to
hold sufficient liquid assets to meet 30 day net cash
outflows projected under an APRA-prescribed stress
scenario.
High quality liquid
assets (HQLA)
As defined by APRA in Australian Prudential Standard
APS210: Liquidity. Qualifying HQLA includes cash, Govt
and Semi Govt securities, and RBNZ eligible securities
($6.2bn for FY16). The Exchange Settlement Account
(ESA) balance is netted down by the Reserve Bank of
Australia open-repo of internal RMBS.
Committed liquidity
facility (CLF)
The Reserve Bank of Australia (RBA) provides the CLF
to participating ADIs under the LCR as a shortfall in
Commonwealth government and Semi-government
securities exists in Australia. ADIs can draw under the
CLF in a liquidity crisis against qualifying securities
pledged to the RBA. The amount of the CLF for each ADI
is set by APRA annually.
TIA Commercial Troublesome and (Group) Impaired assets.
Commercial
Troublesome
Commercial Troublesome includes exposures where
customers are experiencing financial difficulties which, if
they persist, could result in losses of principal or interest,
and exposures where repayments are 90 days or more
past due and the value of security is sufficient to recover
all amounts due.
Total Committed
Exposure (TCE)
Total Committed Exposure is defined as the balance
outstanding and undrawn components of committed
facility limits. It is calculated before collateralisation and
excludes settlement exposures.
Credit Risk
Estimates (CRE)
Refers to the Group’s regulatory estimates of long-run
Probability of Default (PD), downturn Loss Given Default
(LGD) and Exposure at Default (EAD).
Capital & Other
Risk Weighted
Assets or RWA
The value of the Group’s On and Off Balance Sheet
assets are adjusted by risk weights calculated
according to various APRA prudential standards. For
more information, refer to the APRA website.
CET1 Expected
Loss (EL)
Adjustment
CET1 adjustment that represents the shortfall
between the calculated regulatory expected loss and
eligible provisions with respect to credit portfolios
which are subject to the Basel advanced capital IRB
approach. The adjustment is assessed separately
for both defaulted and non-defaulted exposures.
Where there is an excess of regulatory expected
loss over eligible provisions in both assessments,
the difference must be deducted from CET1. For
non-defaulted exposures where the EL is lower than
the eligible provisions, this may be included in Tier 2
capital up to a maximum of 0.6% of total credit
RWAs.
Leverage Ratio Tier 1 Capital divided by Total Exposures, with this
ratio expressed as a percentage. Total exposures is
the sum of On Balance Sheet items, derivatives,
securities financing transactions (SFTs), and Off
Balance Sheet items, net of any Tier 1 regulatory
deductions that are already included in these items.
Internationally
comparable capital
The Internationally Comparable CET1 ratio is an
estimate of the Group’s CET1 ratio calculated using
rules comparable with our global peers. The analysis
aligns with the APRA study entitled “International
capital comparison study” (13 July 2015).
Credit value
adjustment (CVA)
Valuation adjustment to reflect the market view of
counterparty credit risk on over the counter (OTC)
derivatives.
Funding valuation
adjustment (FVA)
The expected funding cost or benefit over the life of
the uncollateralised derivative portfolio.
For
per
sona
l use
onl
y

145
Disclaimer
The material in this presentation is general background information about the Group and its activities current as at the
date of the presentation, 10 August 2016. It is information given in summary form and does not purport to be complete. It
is not intended to be relied upon as advice to investors or potential investors and does not take into account the
investment objectives, financial situation or needs of any particular investor. Investors should consult with their own legal,
tax, business and/or financial advisors in connection with any investment decision.
Any forward-looking statements included in this presentation speak only as at the date of this presentation and undue
reliance should not be placed upon such statements. Although the Group believes the forward-looking statements to be
reasonable, they are not certain. To the maximum extent permitted by law, responsibility for the accuracy or completeness
of any forward-looking statements whether as a result of new information, future events or results or otherwise is
disclaimed.
The Group is under no obligation to update any of the forward-looking statements contained within this presentation,
subject to disclosure requirements applicable to the Group.
Cash Profit
The Management Discussion and Analysis discloses the net profit after tax on both a statutory and cash basis. The
statutory basis is prepared and reviewed in accordance with the Corporations Act 2001 and the Australian Accounting
Standards, which comply with International Financial Reporting Standards (IFRS). The cash basis is used by management
to present a clear view of the Group’s underlying operating results, excluding items that introduce volatility and/or one-off
distortions of the Group’s current period performance. These items, such as hedging and IFRS volatility, are calculated
consistently with the prior comparative period and prior half disclosures and do not discriminate between positive and
negative adjustments. A list of items excluded from statutory profit is provided in the reconciliation of the Net profit after tax
(“cash basis”) on page 3 of the Profit Announcement (PA) and described in greater detail on
page 15 of the PA and can be accessed at our website:
http://www.commbank.com.au/about-us/shareholders/financial-information/results/
Disclaimer & Important Notice
For
per
sona
l use
onl
y

Commonwealth Bank of Australia ACN 123 123 124
Results PresentationFor the half year ended 31 December 2009
10 February 2010
COMMONWEALTH BANK OF AUSTRALIA | ACN 123 123 124 | 10 AUGUST 2016
RESULTS PRESENTATIONFOR THE FULL YEAR ENDED 30 JUNE 2016
For
per
sona
l use
onl
y