Embed Size (px)
Citation preview
Results Presentation | H1 FY21 1
RESULTS PRESENTATION | FY21
30 August 2021
Results Presentation | H1 FY21 2Results Presentation | FY21 2
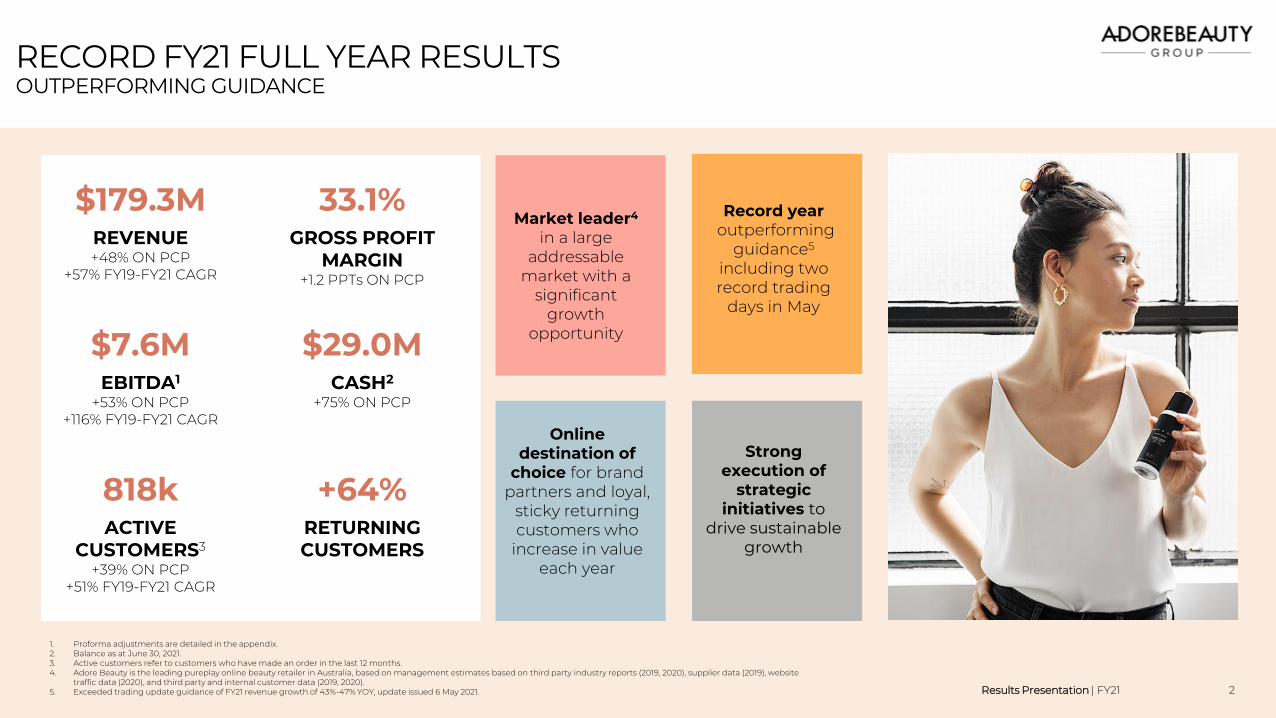
Market leader4
in a large addressable
market with a significant
growth opportunity
Record yearoutperforming
guidance5
including two record trading
days in May
Online destination of
choice for brand partners and loyal,
sticky returning customers who
increase in value each year
Strong execution of
strategic initiatives to
drive sustainable growth
$179.3MREVENUE+48% ON PCP
+57% FY19-FY21 CAGR
33.1%GROSS PROFIT
MARGIN+1.2 PPTs ON PCP
$7.6MEBITDA1
+53% ON PCP+116% FY19-FY21 CAGR
$29.0MCASH2
+75% ON PCP
818kACTIVE
CUSTOMERS3
+39% ON PCP+51% FY19-FY21 CAGR
+64%RETURNING CUSTOMERS
RECORD FY21 FULL YEAR RESULTS OUTPERFORMING GUIDANCE
1. Proforma adjustments are detailed in the appendix. 2. Balance as at June 30, 2021.3. Active customers refer to customers who have made an order in the last 12 months.4. Adore Beauty is the leading pureplay online beauty retailer in Australia, based on management estimates based on third party industry reports (2019, 2020), supplier data (2019), website
traffic data (2020), and third party and internal customer data (2019, 2020). 5. Exceeded trading update guidance of FY21 revenue growth of 43%-47% YOY, update issued 6 May 2021.
Results Presentation | H1 FY21 3Results Presentation | FY21 3
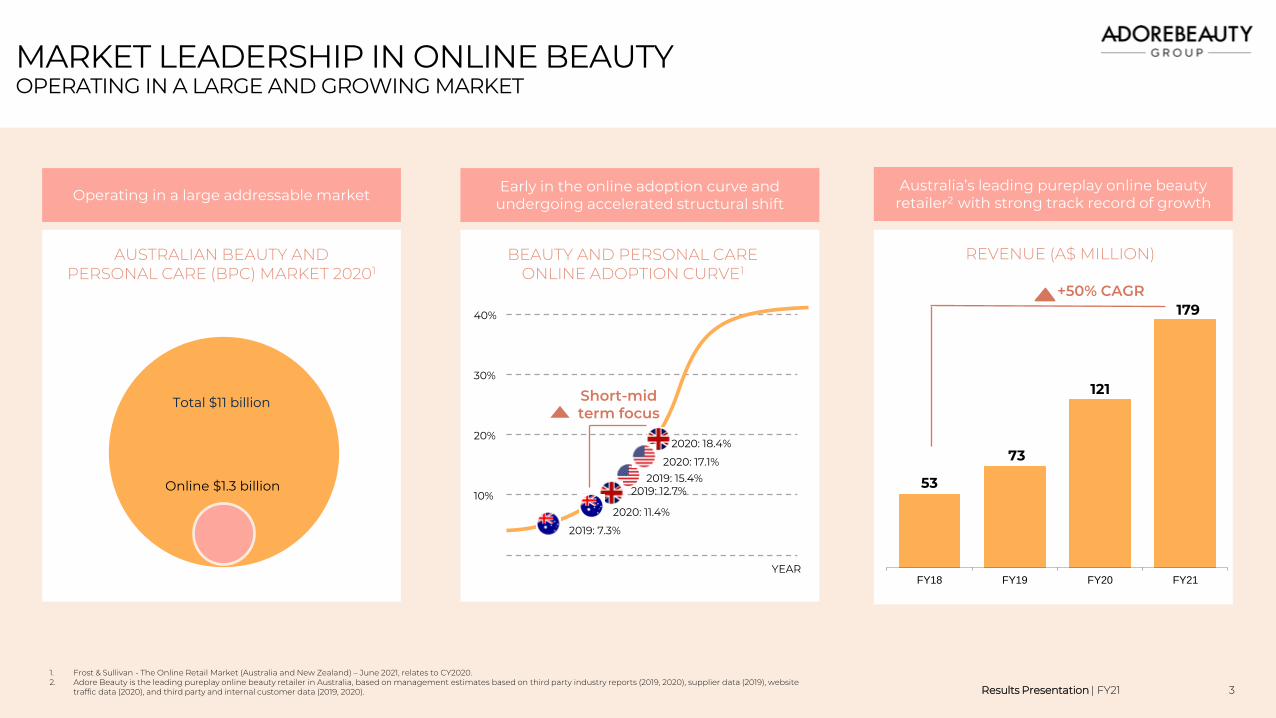
MARKET LEADERSHIP IN ONLINE BEAUTYOPERATING IN A LARGE AND GROWING MARKET
Operating in a large addressable market
AUSTRALIAN BEAUTY AND PERSONAL CARE (BPC) MARKET 20201
Total $11 billion
Online $1.3 billion
Early in the online adoption curve and undergoing accelerated structural shift
Australia’s leading pureplay online beauty retailer2 with strong track record of growth
30%
20%
40%
10%
2020: 17.1%
2019: 15.4%
2019: 7.3%
2020: 18.4%
2019: 12.7%
2020: 11.4%
Short-mid term focus
BEAUTY AND PERSONAL CARE ONLINE ADOPTION CURVE1
53
73
121
179
FY18 FY19 FY20 FY21
+50% CAGR
REVENUE (A$ MILLION)
YEAR
1. Frost & Sullivan - The Online Retail Market (Australia and New Zealand) – June 2021, relates to CY2020.2. Adore Beauty is the leading pureplay online beauty retailer in Australia, based on management estimates based on third party industry reports (2019, 2020), supplier data (2019), website
traffic data (2020), and third party and internal customer data (2019, 2020).
Results Presentation | H1 FY21 4Results Presentation | FY21 4
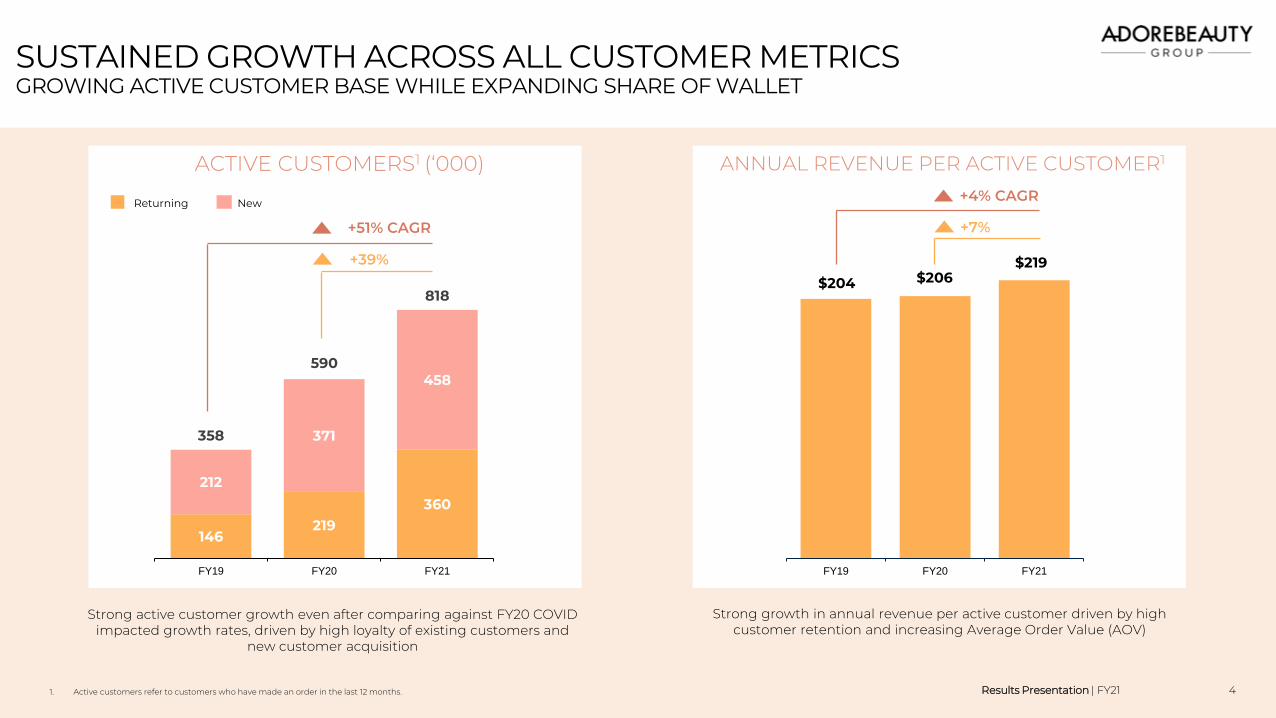
SUSTAINED GROWTH ACROSS ALL CUSTOMER METRICSGROWING ACTIVE CUSTOMER BASE WHILE EXPANDING SHARE OF WALLET
+39%
ACTIVE CUSTOMERS1 (‘000) ANNUAL REVENUE PER ACTIVE CUSTOMER1
FY19 FY20 FY21
+7%
Strong active customer growth even after comparing against FY20 COVID impacted growth rates, driven by high loyalty of existing customers and
new customer acquisition
Strong growth in annual revenue per active customer driven by high customer retention and increasing Average Order Value (AOV)
+51% CAGR
+4% CAGR
$204$219
$206
146219
360
212
371
458
358
590
818
FY19 FY20 FY21
Returning customers New customersReturning New
1. Active customers refer to customers who have made an order in the last 12 months.
Results Presentation | H1 FY21 5Results Presentation | FY21 5
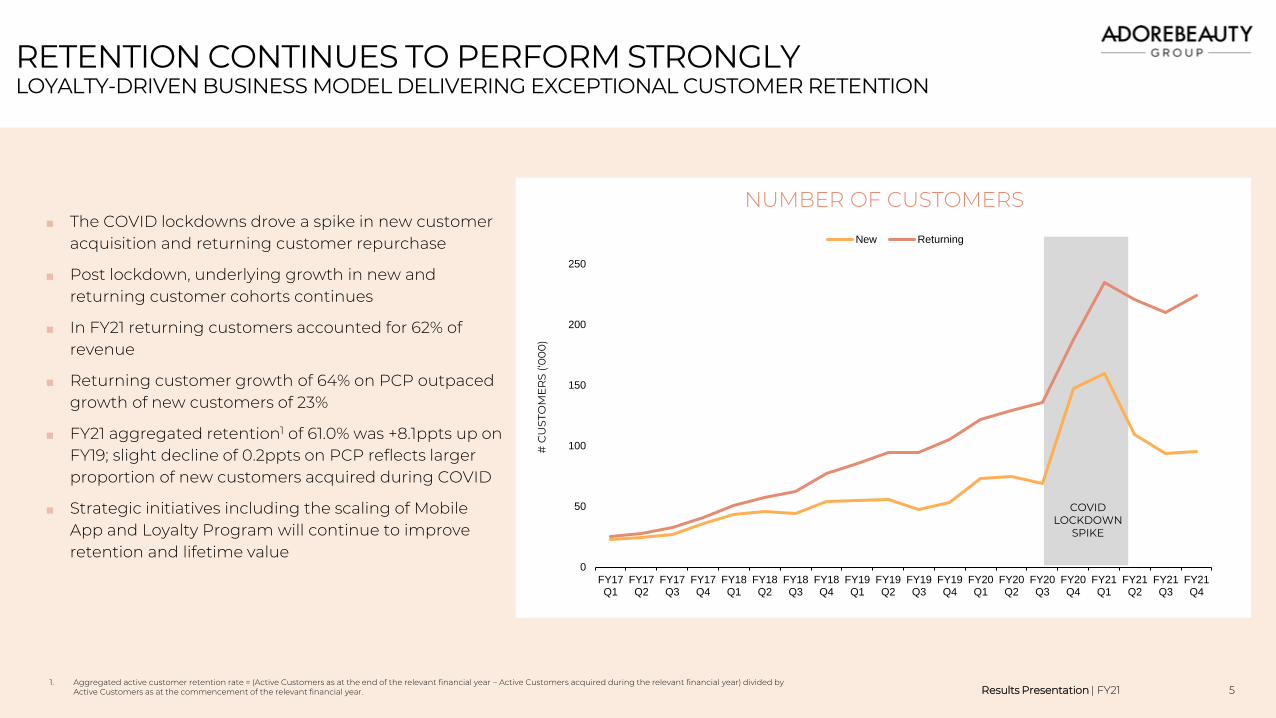
RETENTION CONTINUES TO PERFORM STRONGLYLOYALTY-DRIVEN BUSINESS MODEL DELIVERING EXCEPTIONAL CUSTOMER RETENTION
# C
US
TOM
ER
S (‘
00
0)
0
50
100
150
200
250
FY17Q1
FY17Q2
FY17Q3
FY17Q4
FY18Q1
FY18Q2
FY18Q3
FY18Q4
FY19Q1
FY19Q2
FY19Q3
FY19Q4
FY20Q1
FY20Q2
FY20Q3
FY20Q4
FY21Q1
FY21Q2
FY21Q3
FY21Q4
New Returning
COVID LOCKDOWN
SPIKE
■ The COVID lockdowns drove a spike in new customer acquisition and returning customer repurchase
■ Post lockdown, underlying growth in new and returning customer cohorts continues
■ In FY21 returning customers accounted for 62% of revenue
■ Returning customer growth of 64% on PCP outpaced growth of new customers of 23%
■ FY21 aggregated retention1 of 61.0% was +8.1ppts up on FY19; slight decline of 0.2ppts on PCP reflects larger proportion of new customers acquired during COVID
■ Strategic initiatives including the scaling of Mobile App and Loyalty Program will continue to improve retention and lifetime value
NUMBER OF CUSTOMERS
1. Aggregated active customer retention rate = (Active Customers as at the end of the relevant financial year – Active Customers acquired during the relevant financial year) divided by Active Customers as at the commencement of the relevant financial year.
Results Presentation | H1 FY21 6Results Presentation | FY21 6
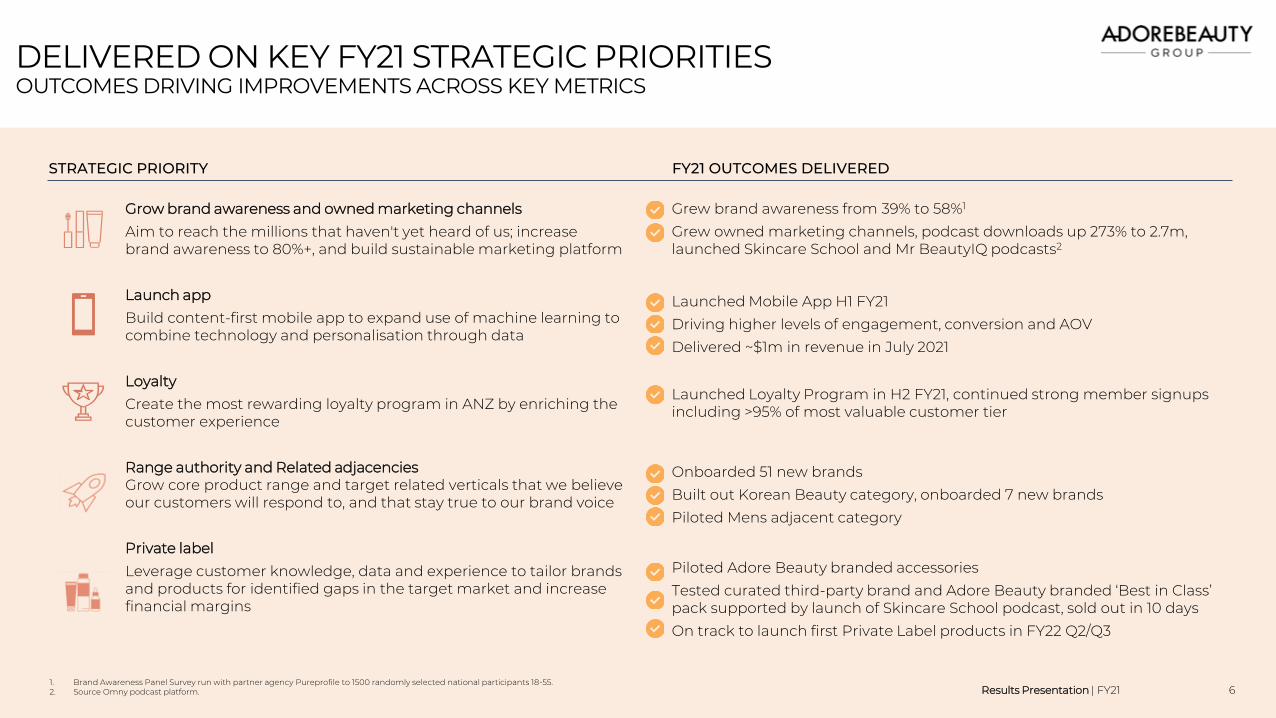
DELIVERED ON KEY FY21 STRATEGIC PRIORITIESOUTCOMES DRIVING IMPROVEMENTS ACROSS KEY METRICS
Grow brand awareness and owned marketing channels
Aim to reach the millions that haven't yet heard of us; increase brand awareness to 80%+, and build sustainable marketing platform
Launch app
Build content-first mobile app to expand use of machine learning to combine technology and personalisation through data
Loyalty
Create the most rewarding loyalty program in ANZ by enriching the customer experience
Range authority and Related adjacenciesGrow core product range and target related verticals that we believe our customers will respond to, and that stay true to our brand voice
Private label
Leverage customer knowledge, data and experience to tailor brands and products for identified gaps in the target market and increase financial margins
Grew brand awareness from 39% to 58%1
Grew owned marketing channels, podcast downloads up 273% to 2.7m, launched Skincare School and Mr BeautyIQ podcasts2
Launched Mobile App H1 FY21
Driving higher levels of engagement, conversion and AOV
Delivered ~$1m in revenue in July 2021
Launched Loyalty Program in H2 FY21, continued strong member signups including >95% of most valuable customer tier
Piloted Adore Beauty branded accessories
Tested curated third-party brand and Adore Beauty branded ‘Best in Class’ pack supported by launch of Skincare School podcast, sold out in 10 days
On track to launch first Private Label products in FY22 Q2/Q3
STRATEGIC PRIORITY FY21 OUTCOMES DELIVERED
Onboarded 51 new brands
Built out Korean Beauty category, onboarded 7 new brands
Piloted Mens adjacent category
1. Brand Awareness Panel Survey run with partner agency Pureprofile to 1500 randomly selected national participants 18-55.2. Source Omny podcast platform.
Results Presentation | H1 FY21 7
RECORD FY PERFORMANCE
Results Presentation | H1 FY21 8Results Presentation | FY21 8
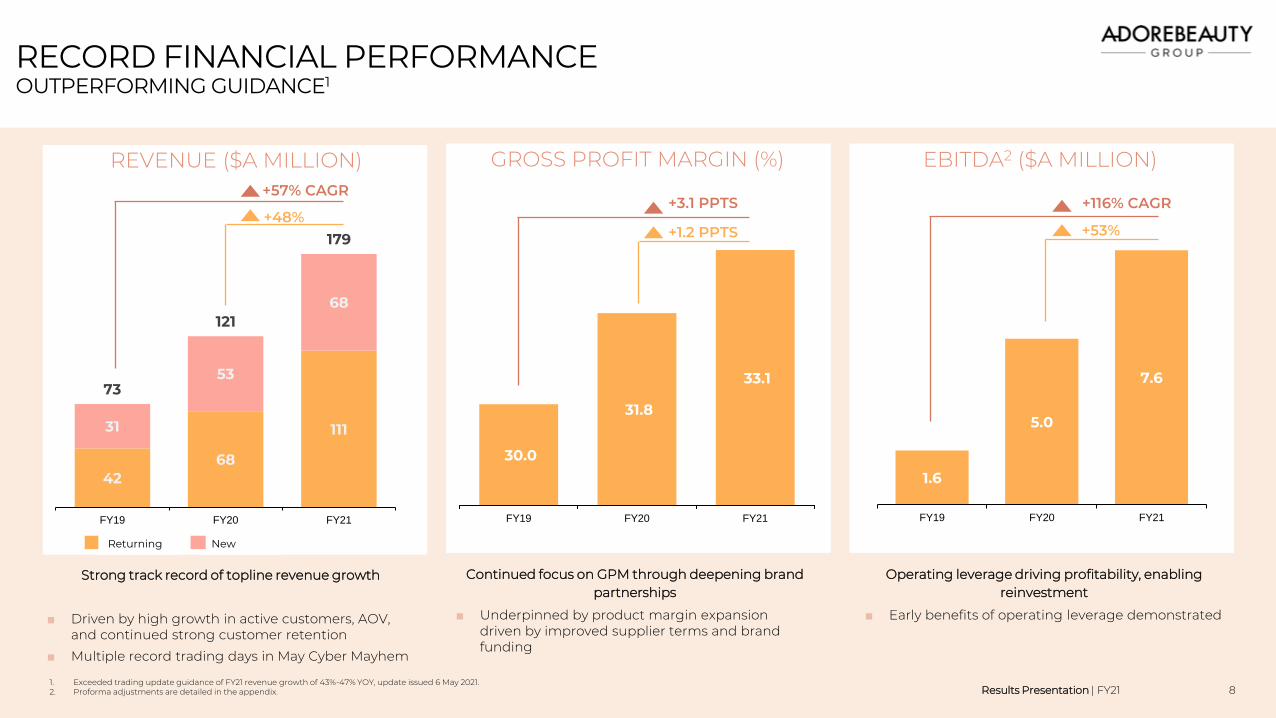
RECORD FINANCIAL PERFORMANCEOUTPERFORMING GUIDANCE1
REVENUE ($A MILLION) GROSS PROFIT MARGIN (%) EBITDA2 ($A MILLION)
Strong track record of topline revenue growth
■ Driven by high growth in active customers, AOV, and continued strong customer retention
■ Multiple record trading days in May Cyber Mayhem
4268
11131
53
68
73
121
179
FY19 FY20 FY21
Continued focus on GPM through deepening brand partnerships
■ Underpinned by product margin expansion driven by improved supplier terms and brand funding
Operating leverage driving profitability, enabling reinvestment
■ Early benefits of operating leverage demonstrated
30.0
31.8
33.1
FY19 FY20 FY21
1.6
5.0
7.6
FY19 FY20 FY21
+57% CAGR
+48%+3.1 PPTS
+1.2 PPTS
+116% CAGR
+53%
Returning New
1. Exceeded trading update guidance of FY21 revenue growth of 43%-47% YOY, update issued 6 May 2021.2. Proforma adjustments are detailed in the appendix.
Results Presentation | H1 FY21 9Results Presentation | FY21 9
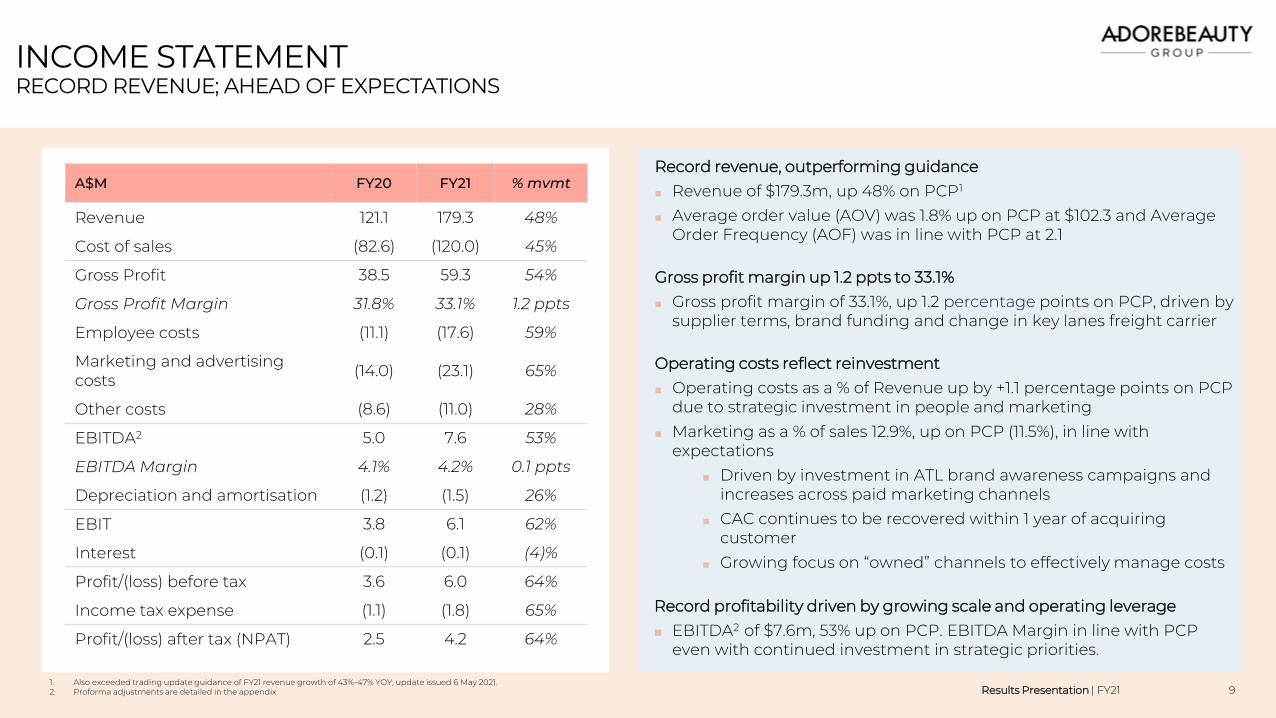
Record revenue, outperforming guidance
■ Revenue of $179.3m, up 48% on PCP1
■ Average order value (AOV) was 1.8% up on PCP at $102.3 and Average Order Frequency (AOF) was in line with PCP at 2.1
Gross profit margin up 1.2 ppts to 33.1%
■ Gross profit margin of 33.1%, up 1.2 percentage points on PCP, driven by supplier terms, brand funding and change in key lanes freight carrier
Operating costs reflect reinvestment
■ Operating costs as a % of Revenue up by +1.1 percentage points on PCP due to strategic investment in people and marketing
■ Marketing as a % of sales 12.9%, up on PCP (11.5%), in line with expectations
■ Driven by investment in ATL brand awareness campaigns and increases across paid marketing channels
■ CAC continues to be recovered within 1 year of acquiring customer
■ Growing focus on “owned” channels to effectively manage costs
Record profitability driven by growing scale and operating leverage
■ EBITDA2 of $7.6m, 53% up on PCP. EBITDA Margin in line with PCP even with continued investment in strategic priorities.
INCOME STATEMENTRECORD REVENUE; AHEAD OF EXPECTATIONS
A$M FY20 FY21 % mvmt
Revenue 121.1 179.3 48%
Cost of sales (82.6) (120.0) 45%
Gross Profit 38.5 59.3 54%
Gross Profit Margin 31.8% 33.1% 1.2 ppts
Employee costs (11.1) (17.6) 59%
Marketing and advertising costs
(14.0) (23.1) 65%
Other costs (8.6) (11.0) 28%
EBITDA2 5.0 7.6 53%
EBITDA Margin 4.1% 4.2% 0.1 ppts
Depreciation and amortisation (1.2) (1.5) 26%
EBIT 3.8 6.1 62%
Interest (0.1) (0.1) (4)%
Profit/(loss) before tax 3.6 6.0 64%
Income tax expense (1.1) (1.8) 65%
Profit/(loss) after tax (NPAT) 2.5 4.2 64%
1. Also exceeded trading update guidance of FY21 revenue growth of 43%-47% YOY, update issued 6 May 2021.2. Proforma adjustments are detailed in the appendix.
Results Presentation | H1 FY21 10Results Presentation | FY21 10
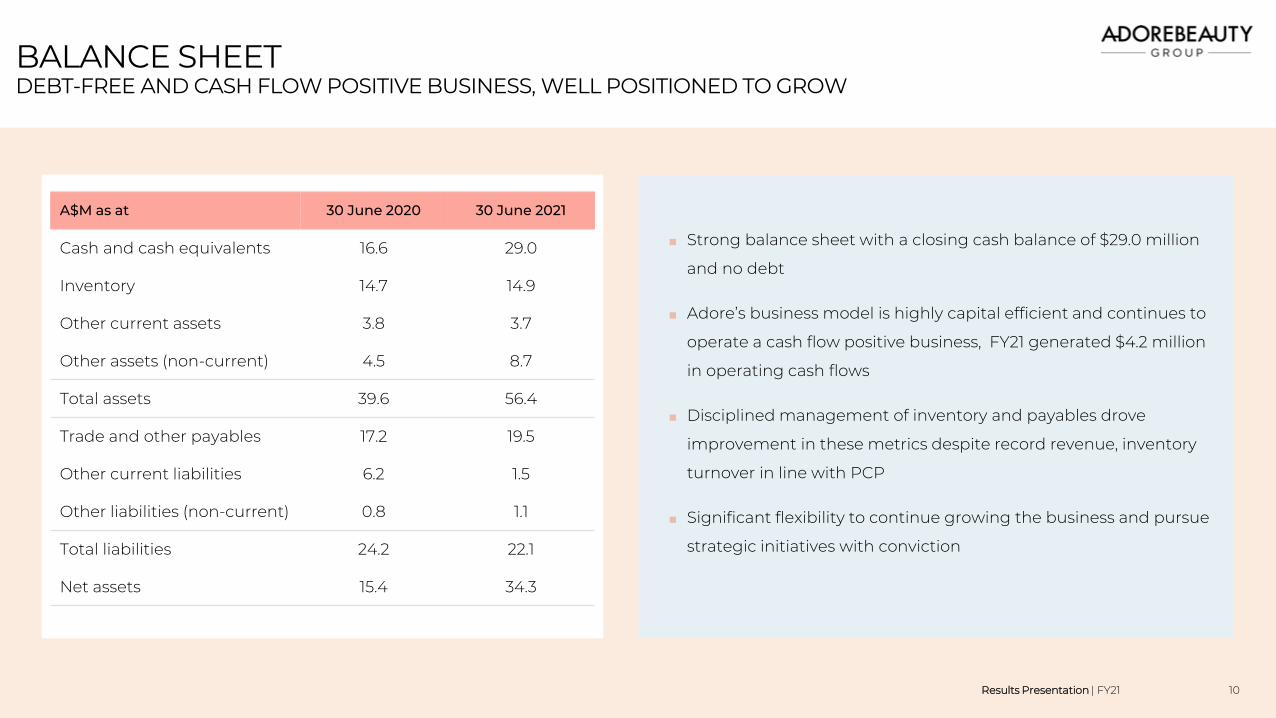
■ Strong balance sheet with a closing cash balance of $29.0 million
and no debt
■ Adore’s business model is highly capital efficient and continues to
operate a cash flow positive business, FY21 generated $4.2 million
in operating cash flows
■ Disciplined management of inventory and payables drove
improvement in these metrics despite record revenue, inventory
turnover in line with PCP
■ Significant flexibility to continue growing the business and pursue
strategic initiatives with conviction
A$M as at 30 June 2020 30 June 2021
Cash and cash equivalents 16.6 29.0
Inventory 14.7 14.9
Other current assets 3.8 3.7
Other assets (non-current) 4.5 8.7
Total assets 39.6 56.4
Trade and other payables 17.2 19.5
Other current liabilities 6.2 1.5
Other liabilities (non-current) 0.8 1.1
Total liabilities 24.2 22.1
Net assets 15.4 34.3
BALANCE SHEETDEBT-FREE AND CASH FLOW POSITIVE BUSINESS, WELL POSITIONED TO GROW
Results Presentation | H1 FY21 11Results Presentation | FY21 11
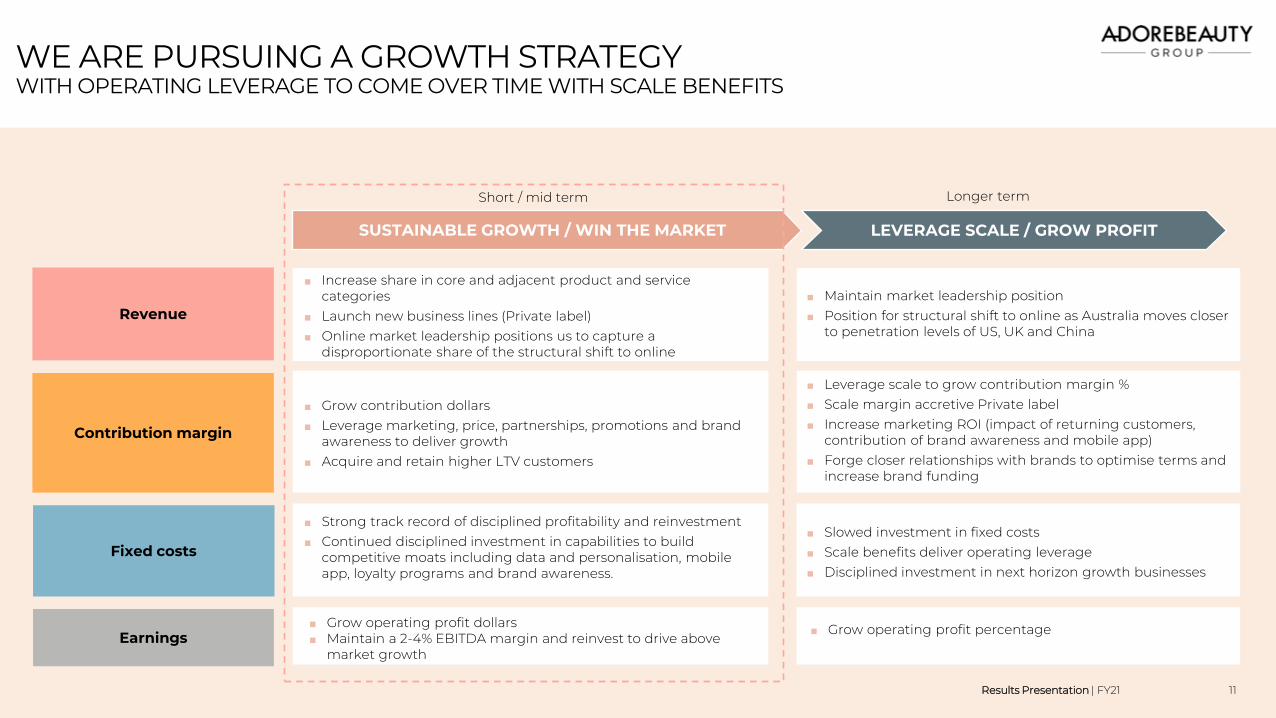
WE ARE PURSUING A GROWTH STRATEGY WITH OPERATING LEVERAGE TO COME OVER TIME WITH SCALE BENEFITS
Revenue
Contribution margin
Fixed costs
Earnings
LEVERAGE SCALE / GROW PROFIT
Short / mid term Longer term
SUSTAINABLE GROWTH / WIN THE MARKET
■ Increase share in core and adjacent product and service categories
■ Launch new business lines (Private label)■ Online market leadership positions us to capture a
disproportionate share of the structural shift to online
■ Grow contribution dollars■ Leverage marketing, price, partnerships, promotions and brand
awareness to deliver growth■ Acquire and retain higher LTV customers
■ Strong track record of disciplined profitability and reinvestment■ Continued disciplined investment in capabilities to build
competitive moats including data and personalisation, mobile app, loyalty programs and brand awareness.
■ Grow operating profit dollars■ Maintain a 2-4% EBITDA margin and reinvest to drive above
market growth
■ Maintain market leadership position■ Position for structural shift to online as Australia moves closer
to penetration levels of US, UK and China
■ Leverage scale to grow contribution margin %■ Scale margin accretive Private label■ Increase marketing ROI (impact of returning customers,
contribution of brand awareness and mobile app)■ Forge closer relationships with brands to optimise terms and
increase brand funding
■ Slowed investment in fixed costs■ Scale benefits deliver operating leverage■ Disciplined investment in next horizon growth businesses
■ Grow operating profit percentage
Results Presentation | H1 FY21 12
FY21OPERATIONAL
HIGHLIGHTS
Results Presentation | H1 FY21 13Results Presentation | FY21 13
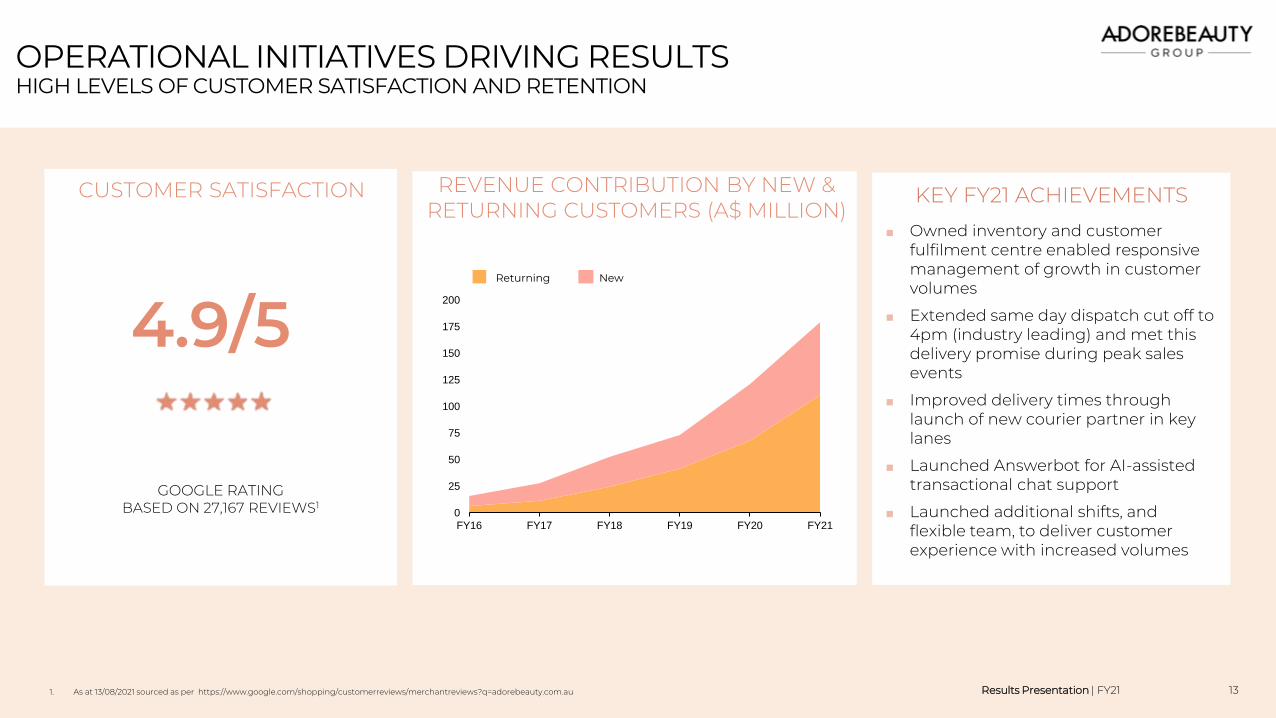
OPERATIONAL INITIATIVES DRIVING RESULTSHIGH LEVELS OF CUSTOMER SATISFACTION AND RETENTION
CUSTOMER SATISFACTION
4.9/5
0
25
50
75
100
125
150
175
200
FY16 FY17 FY18 FY19 FY20 FY21
Returning New
REVENUE CONTRIBUTION BY NEW & RETURNING CUSTOMERS (A$ MILLION)
KEY FY21 ACHIEVEMENTS
■ Owned inventory and customer fulfilment centre enabled responsive management of growth in customer volumes
■ Extended same day dispatch cut off to 4pm (industry leading) and met this delivery promise during peak sales events
■ Improved delivery times through launch of new courier partner in key lanes
■ Launched Answerbot for AI-assisted transactional chat support
■ Launched additional shifts, and flexible team, to deliver customer experience with increased volumes
GOOGLE RATINGBASED ON 27,167 REVIEWS1
Returning New
1. As at 13/08/2021 sourced as per https://www.google.com/shopping/customerreviews/merchantreviews?q=adorebeauty.com.au
Results Presentation | H1 FY21 14Results Presentation | FY21 14
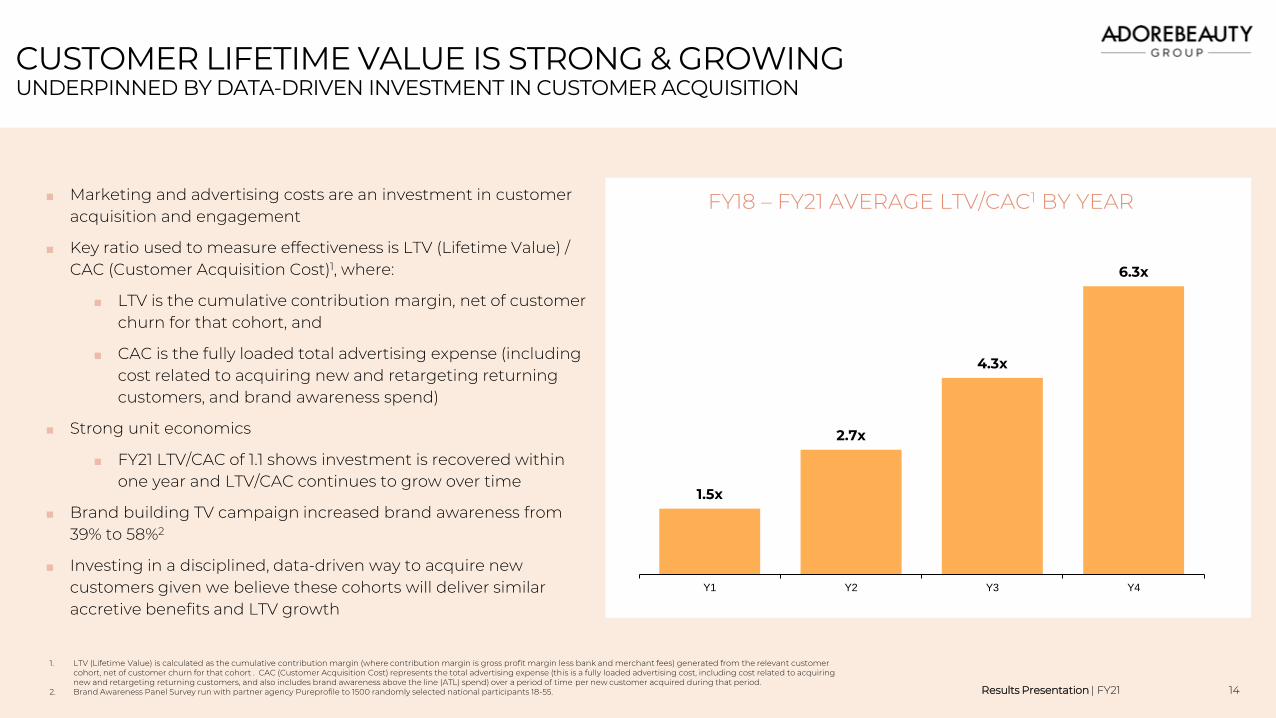
CUSTOMER LIFETIME VALUE IS STRONG & GROWINGUNDERPINNED BY DATA-DRIVEN INVESTMENT IN CUSTOMER ACQUISITION
■ Marketing and advertising costs are an investment in customer acquisition and engagement
■ Key ratio used to measure effectiveness is LTV (Lifetime Value) / CAC (Customer Acquisition Cost)1, where:
■ LTV is the cumulative contribution margin, net of customer churn for that cohort, and
■ CAC is the fully loaded total advertising expense (including cost related to acquiring new and retargeting returning customers, and brand awareness spend)
■ Strong unit economics
■ FY21 LTV/CAC of 1.1 shows investment is recovered within one year and LTV/CAC continues to grow over time
■ Brand building TV campaign increased brand awareness from 39% to 58%2
■ Investing in a disciplined, data-driven way to acquire new customers given we believe these cohorts will deliver similar accretive benefits and LTV growth
1.5x
2.7x
4.3x
6.3x
Y1 Y2 Y3 Y4
FY18 – FY21 AVERAGE LTV/CAC1 BY YEAR
1. LTV (Lifetime Value) is calculated as the cumulative contribution margin (where contribution margin is gross profit margin less bank and merchant fees) generated from the relevant customer cohort, net of customer churn for that cohort . CAC (Customer Acquisition Cost) represents the total advertising expense (this is a fully loaded advertising cost, including cost related to acquiring new and retargeting returning customers, and also includes brand awareness above the line (ATL) spend) over a period of time per new customer acquired during that period.
2. Brand Awareness Panel Survey run with partner agency Pureprofile to 1500 randomly selected national participants 18-55.
Results Presentation | H1 FY21 15Results Presentation | FY21 15
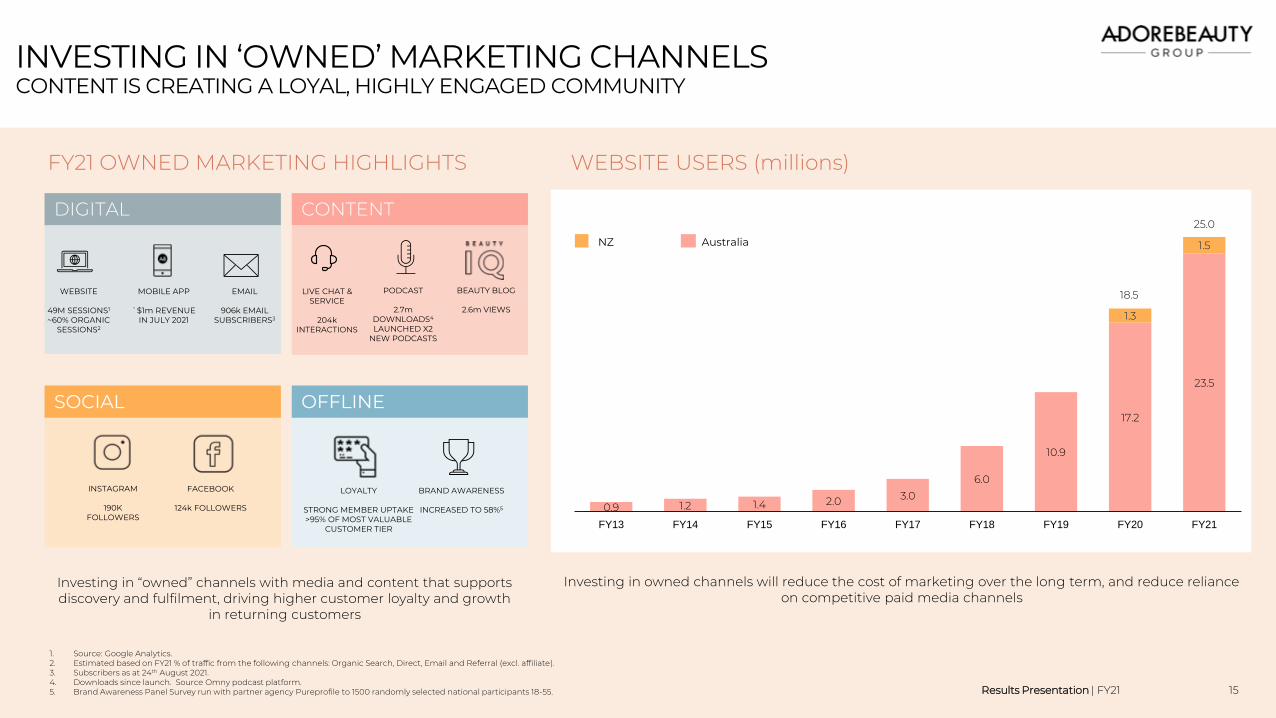
INVESTING IN ‘OWNED’ MARKETING CHANNELSCONTENT IS CREATING A LOYAL, HIGHLY ENGAGED COMMUNITY
FY21 OWNED MARKETING HIGHLIGHTS
0.9 1.2 1.4 2.0 3.0
6.0
10.9
17.2
23.5
1.3
1.5
FY13 FY14 FY15 FY16 FY17 FY18 FY19 FY20 FY21
Australia NZ
25.0
18.5
WEBSITE USERS (millions)
DIGITAL CONTENT
SOCIAL OFFLINE
906k EMAIL SUBSCRIBERS3
WEBSITE
49M SESSIONS1
~60% ORGANIC SESSIONS2
LIVE CHAT &SERVICE
204k INTERACTIONS
BEAUTY BLOG
2.6m VIEWS
PODCAST
2.7m DOWNLOADS4
LAUNCHED X2 NEW PODCASTS
190K FOLLOWERS
124k FOLLOWERS
LOYALTY
STRONG MEMBER UPTAKE>95% OF MOST VALUABLE
CUSTOMER TIER
MOBILE APP
`$1m REVENUE IN JULY 2021
Investing in “owned” channels with media and content that supports discovery and fulfilment, driving higher customer loyalty and growth
in returning customers
Investing in owned channels will reduce the cost of marketing over the long term, and reduce reliance on competitive paid media channels
BRAND AWARENESS
INCREASED TO 58%5
NZ Australia
1. Source: Google Analytics.2. Estimated based on FY21 % of traffic from the following channels: Organic Search, Direct, Email and Referral (excl. affiliate).3. Subscribers as at 24th August 2021.4. Downloads since launch. Source Omny podcast platform.5. Brand Awareness Panel Survey run with partner agency Pureprofile to 1500 randomly selected national participants 18-55.
Results Presentation | H1 FY21 16Results Presentation | FY21 16
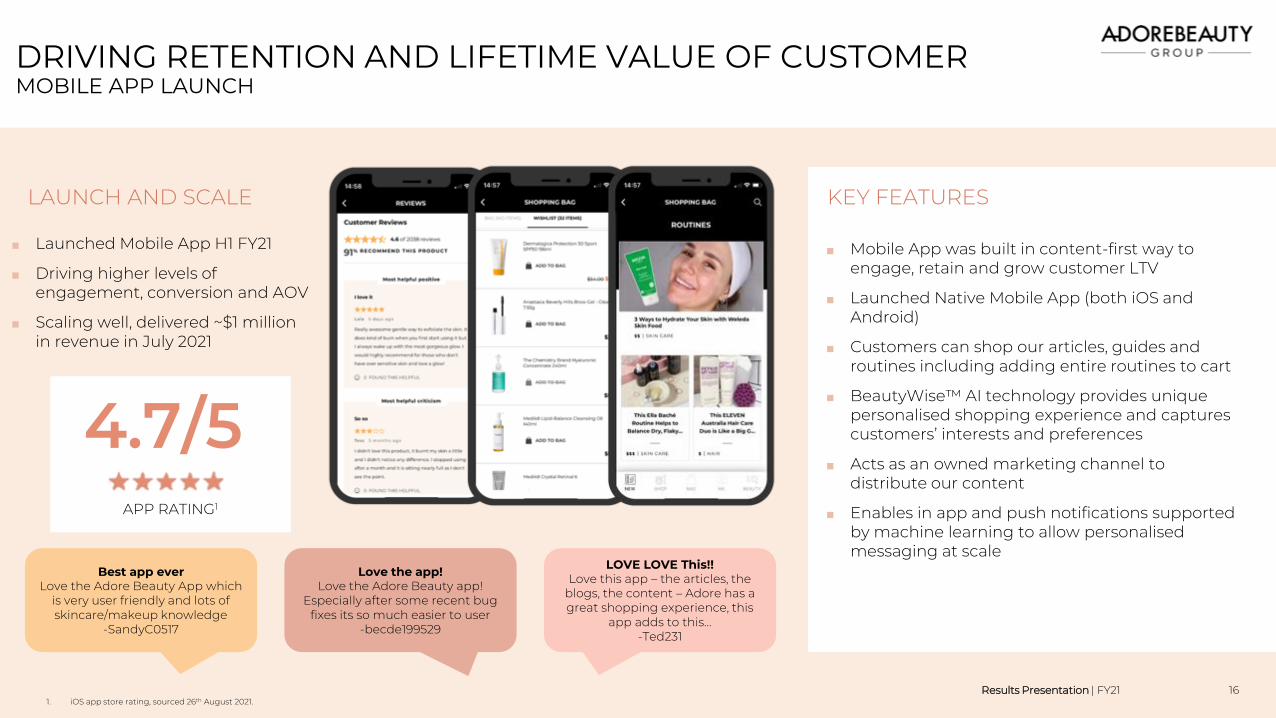
DRIVING RETENTION AND LIFETIME VALUE OF CUSTOMERMOBILE APP LAUNCH
KEY FEATURES
■ Launched Mobile App H1 FY21
■ Driving higher levels of engagement, conversion and AOV
■ Scaling well, delivered ~$1 million in revenue in July 2021
■ Mobile App was built in content-first way to engage, retain and grow customer LTV
■ Launched Native Mobile App (both iOS and Android)
■ Customers can shop our articles, guides and routines including adding entire routines to cart
■ BeautyWise™ AI technology provides unique personalised shopping experience and captures customers’ interests and preferences
■ Acts as an owned marketing channel to distribute our content
■ Enables in app and push notifications supported by machine learning to allow personalised messaging at scale
LAUNCH AND SCALE
Best app everLove the Adore Beauty App which
is very user friendly and lots of skincare/makeup knowledge
-SandyC0517
Love the app!Love the Adore Beauty app!
Especially after some recent bug fixes its so much easier to user
-becde199529
LOVE LOVE This!!Love this app – the articles, the
blogs, the content – Adore has a great shopping experience, this
app adds to this…-Ted231
1. iOS app store rating, sourced 26th August 2021.
4.7/5APP RATING1
Results Presentation | H1 FY21 17Results Presentation | FY21 17
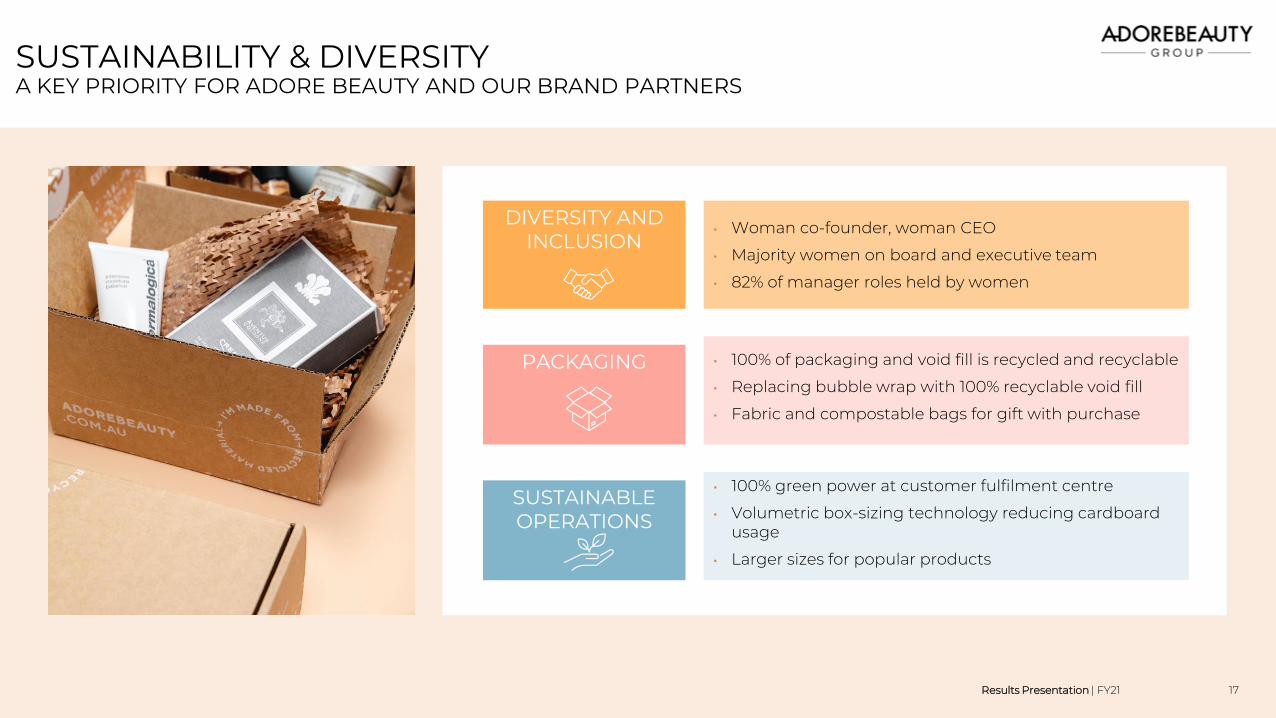
SUSTAINABILITY & DIVERSITYA KEY PRIORITY FOR ADORE BEAUTY AND OUR BRAND PARTNERS
DIVERSITY AND INCLUSION
PACKAGING
SUSTAINABLE OPERATIONS
• 100% green power at customer fulfilment centre
• Volumetric box-sizing technology reducing cardboard usage
• Larger sizes for popular products
• Woman co-founder, woman CEO
• Majority women on board and executive team
• 82% of manager roles held by women
• 100% of packaging and void fill is recycled and recyclable
• Replacing bubble wrap with 100% recyclable void fill
• Fabric and compostable bags for gift with purchase
Results Presentation | H1 FY21 18
STRATEGY AND OUTLOOK
Results Presentation | H1 FY21 19Results Presentation | FY21 19
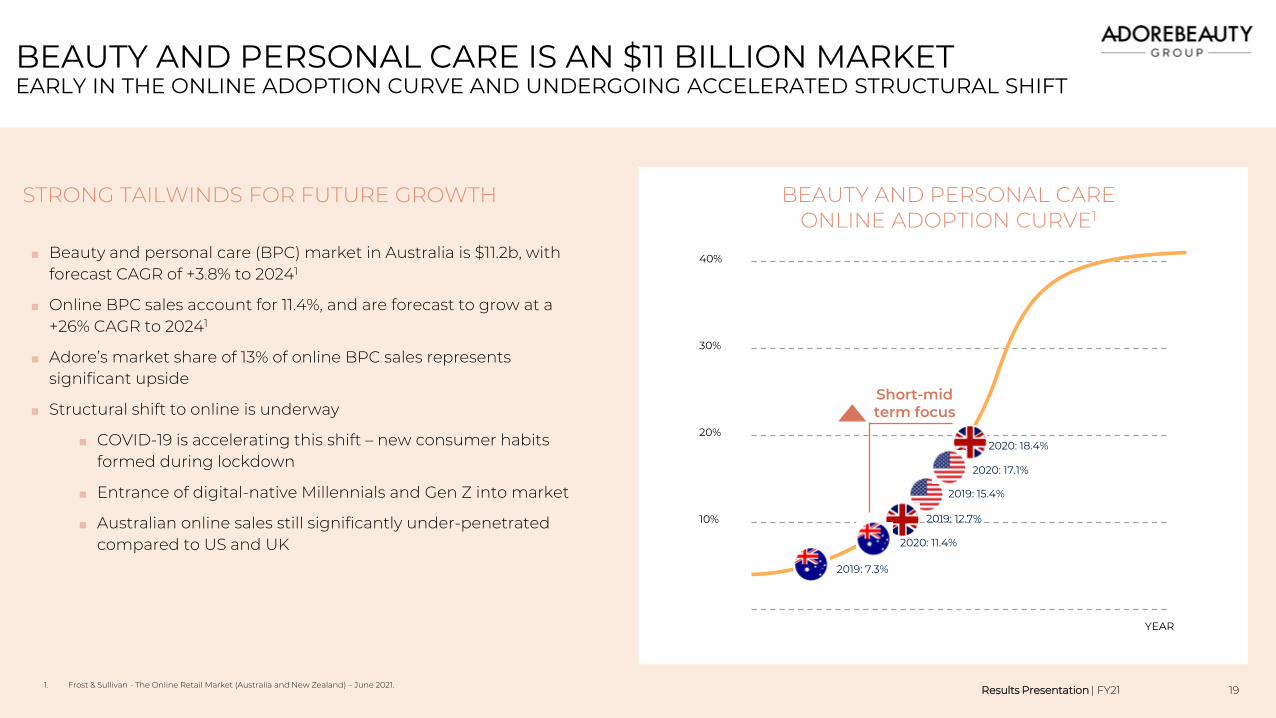
BEAUTY AND PERSONAL CARE IS AN $11 BILLION MARKETEARLY IN THE ONLINE ADOPTION CURVE AND UNDERGOING ACCELERATED STRUCTURAL SHIFT
1. Frost & Sullivan - The Online Retail Market (Australia and New Zealand) – June 2021.
BEAUTY AND PERSONAL CARE ONLINE ADOPTION CURVE1
30%
20%
40%
10%
2020: 17.1%
2019: 15.4%
2019: 7.3%
2020: 18.4%
2019: 12.7%
2020: 11.4%
Short-mid term focus
STRONG TAILWINDS FOR FUTURE GROWTH
■ Beauty and personal care (BPC) market in Australia is $11.2b, with forecast CAGR of +3.8% to 20241
■ Online BPC sales account for 11.4%, and are forecast to grow at a +26% CAGR to 20241
■ Adore’s market share of 13% of online BPC sales represents significant upside
■ Structural shift to online is underway
■ COVID-19 is accelerating this shift – new consumer habits formed during lockdown
■ Entrance of digital-native Millennials and Gen Z into market
■ Australian online sales still significantly under-penetrated compared to US and UK
YEAR
Results Presentation | H1 FY21 20Results Presentation | FY21 20
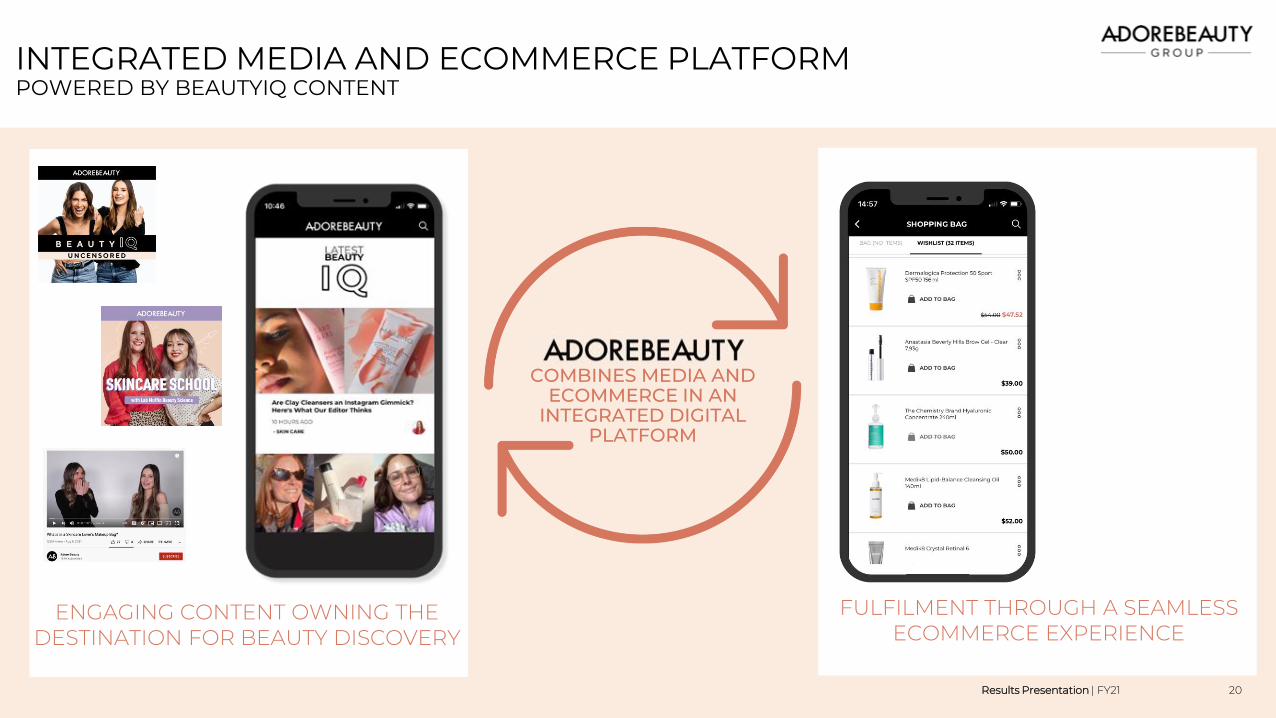
INTEGRATED MEDIA AND ECOMMERCE PLATFORM POWERED BY BEAUTYIQ CONTENT
ENGAGING CONTENT OWNING THE DESTINATION FOR BEAUTY DISCOVERY
COMBINES MEDIA AND ECOMMERCE IN AN
INTEGRATED DIGITAL PLATFORM
FULFILMENT THROUGH A SEAMLESS ECOMMERCE EXPERIENCE
Results Presentation | H1 FY21 21Results Presentation | FY21 21
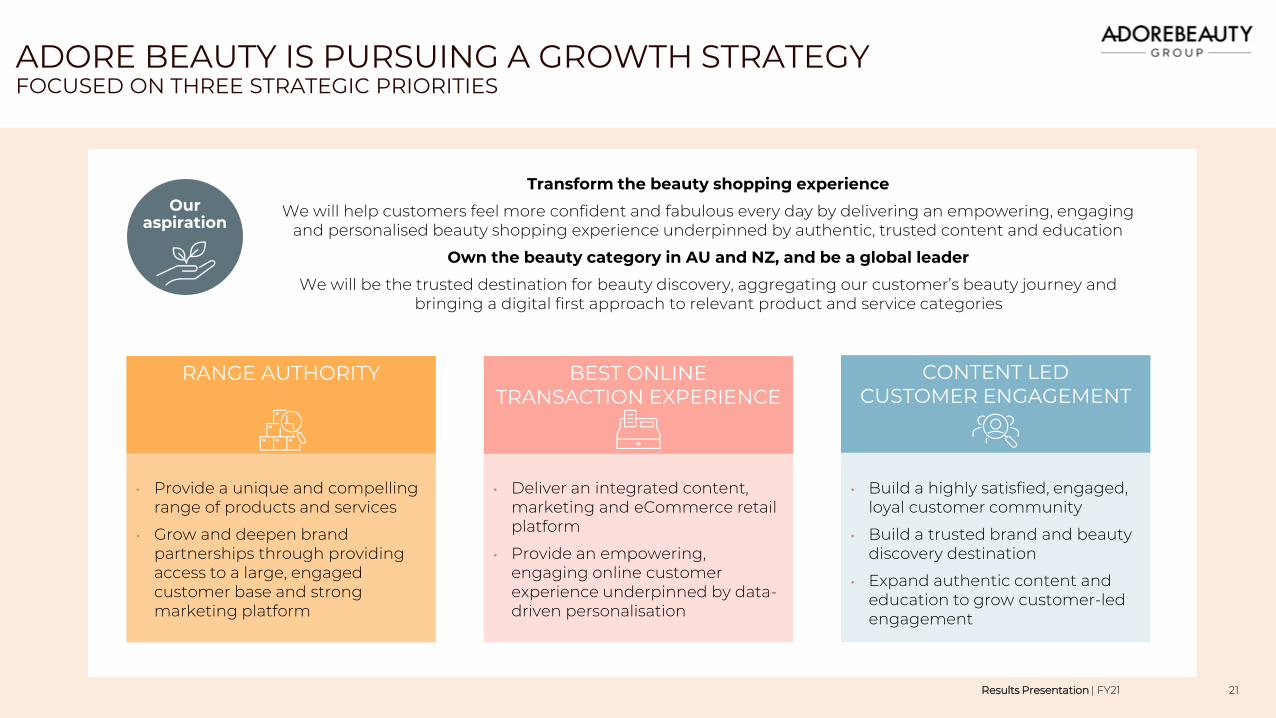
• Build a highly satisfied, engaged, loyal customer community
• Build a trusted brand and beauty discovery destination
• Expand authentic content and education to grow customer-led engagement
• Provide a unique and compelling range of products and services
• Grow and deepen brand partnerships through providing access to a large, engaged customer base and strong marketing platform
• Deliver an integrated content, marketing and eCommerce retail platform
• Provide an empowering, engaging online customer experience underpinned by data-driven personalisation
ADORE BEAUTY IS PURSUING A GROWTH STRATEGY FOCUSED ON THREE STRATEGIC PRIORITIES
Our aspiration
Transform the beauty shopping experience
We will help customers feel more confident and fabulous every day by delivering an empowering, engaging and personalised beauty shopping experience underpinned by authentic, trusted content and education
Own the beauty category in AU and NZ, and be a global leader
We will be the trusted destination for beauty discovery, aggregating our customer’s beauty journey and bringing a digital first approach to relevant product and service categories
RANGE AUTHORITY BEST ONLINE TRANSACTION EXPERIENCE
CONTENT LED CUSTOMER ENGAGEMENT
Results Presentation | H1 FY21 22Results Presentation | FY21 221. 2020 market size, Frost & Sullivan - The Online Retail Market (Australia and New Zealand) – June 2021
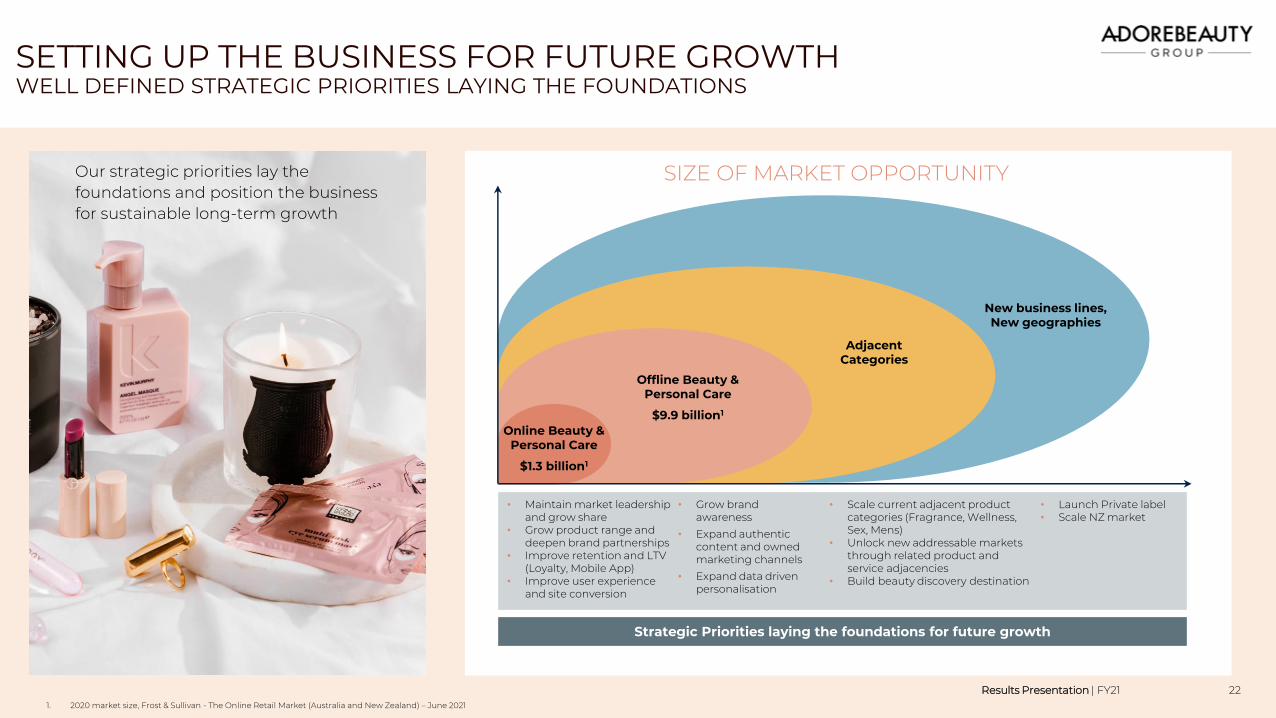
Strategic Priorities laying the foundations for future growth
• Maintain market leadership and grow share
• Grow product range and deepen brand partnerships
• Improve retention and LTV (Loyalty, Mobile App)
• Improve user experience and site conversion
• Scale current adjacent product categories (Fragrance, Wellness, Sex, Mens)
• Unlock new addressable markets through related product and service adjacencies
• Build beauty discovery destination
• Grow brand awareness
• Expand authentic content and owned marketing channels
• Expand data driven personalisation
• Launch Private label• Scale NZ market
Adjacent Categories
New business lines, New geographies
Online Beauty & Personal Care
$1.3 billion1
Offline Beauty & Personal Care
$9.9 billion1
Our strategic priorities lay the foundations and position the business for sustainable long-term growth
SETTING UP THE BUSINESS FOR FUTURE GROWTHWELL DEFINED STRATEGIC PRIORITIES LAYING THE FOUNDATIONS
SIZE OF MARKET OPPORTUNITY
Results Presentation | H1 FY21 23Results Presentation | FY21 23
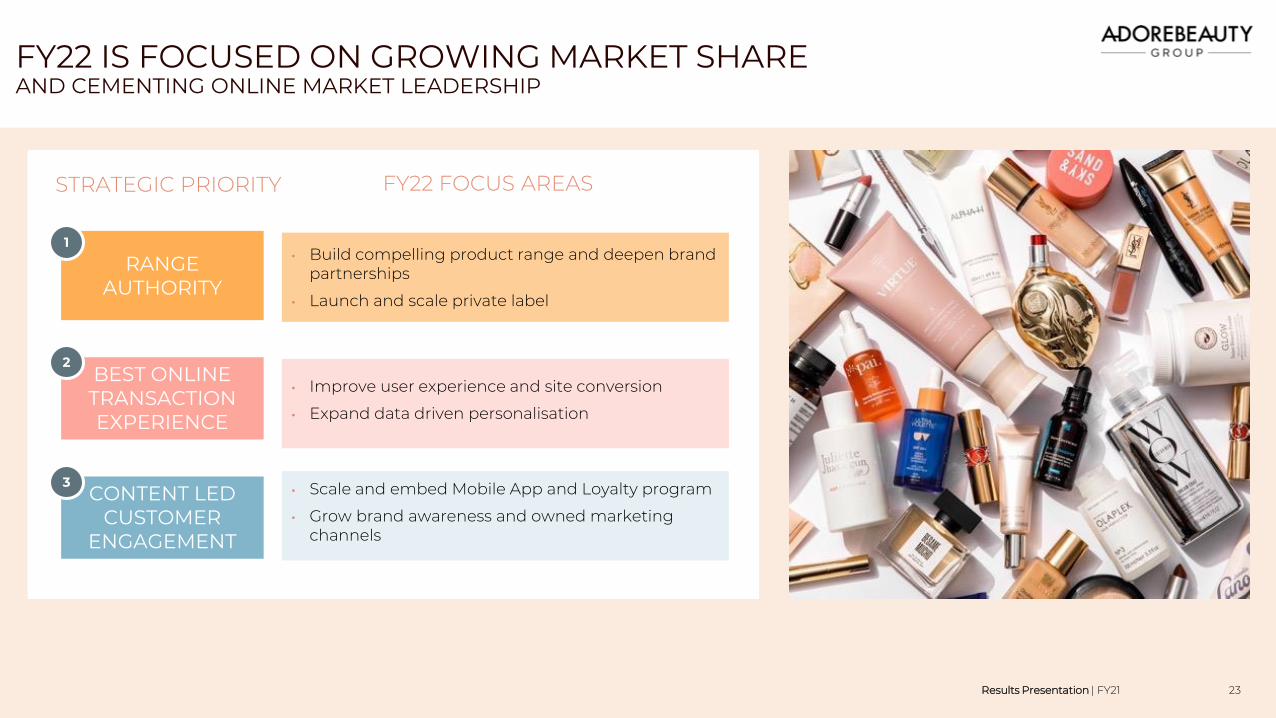
FY22 IS FOCUSED ON GROWING MARKET SHAREAND CEMENTING ONLINE MARKET LEADERSHIP
RANGE AUTHORITY
BEST ONLINE TRANSACTION EXPERIENCE
CONTENT LED CUSTOMER
ENGAGEMENT
1
2
3• Scale and embed Mobile App and Loyalty program
• Grow brand awareness and owned marketing channels
• Build compelling product range and deepen brand partnerships
• Launch and scale private label
• Improve user experience and site conversion
• Expand data driven personalisation
STRATEGIC PRIORITY FY22 FOCUS AREAS
Results Presentation | H1 FY21 24Results Presentation | FY21 24
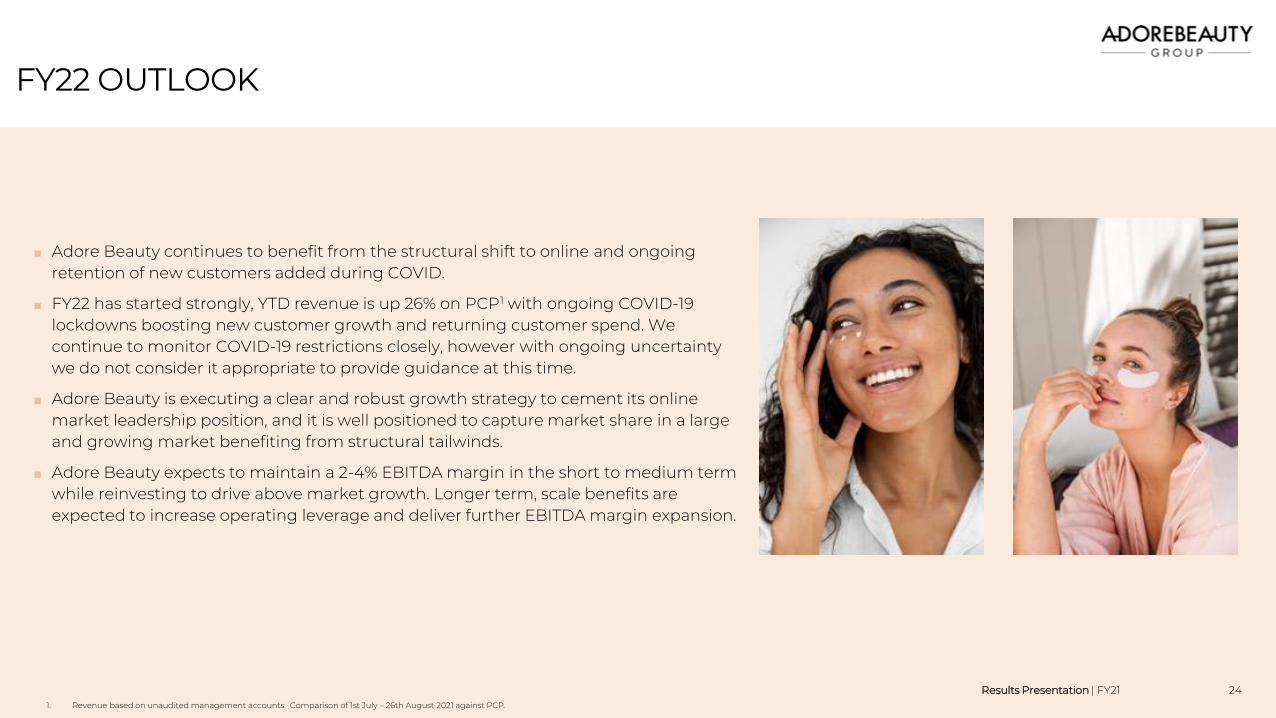
FY22 OUTLOOK
■ Adore Beauty continues to benefit from the structural shift to online and ongoing retention of new customers added during COVID.
■ FY22 has started strongly, YTD revenue is up 26% on PCP1 with ongoing COVID-19 lockdowns boosting new customer growth and returning customer spend. We continue to monitor COVID-19 restrictions closely, however with ongoing uncertainty we do not consider it appropriate to provide guidance at this time.
■ Adore Beauty is executing a clear and robust growth strategy to cement its online market leadership position, and it is well positioned to capture market share in a large and growing market benefiting from structural tailwinds.
■ Adore Beauty expects to maintain a 2-4% EBITDA margin in the short to medium term while reinvesting to drive above market growth. Longer term, scale benefits are expected to increase operating leverage and deliver further EBITDA margin expansion.
1. Revenue based on unaudited management accounts. Comparison of 1st July – 26th August 2021 against PCP.
Results Presentation | H1 FY21 25Results Presentation | FY21 25
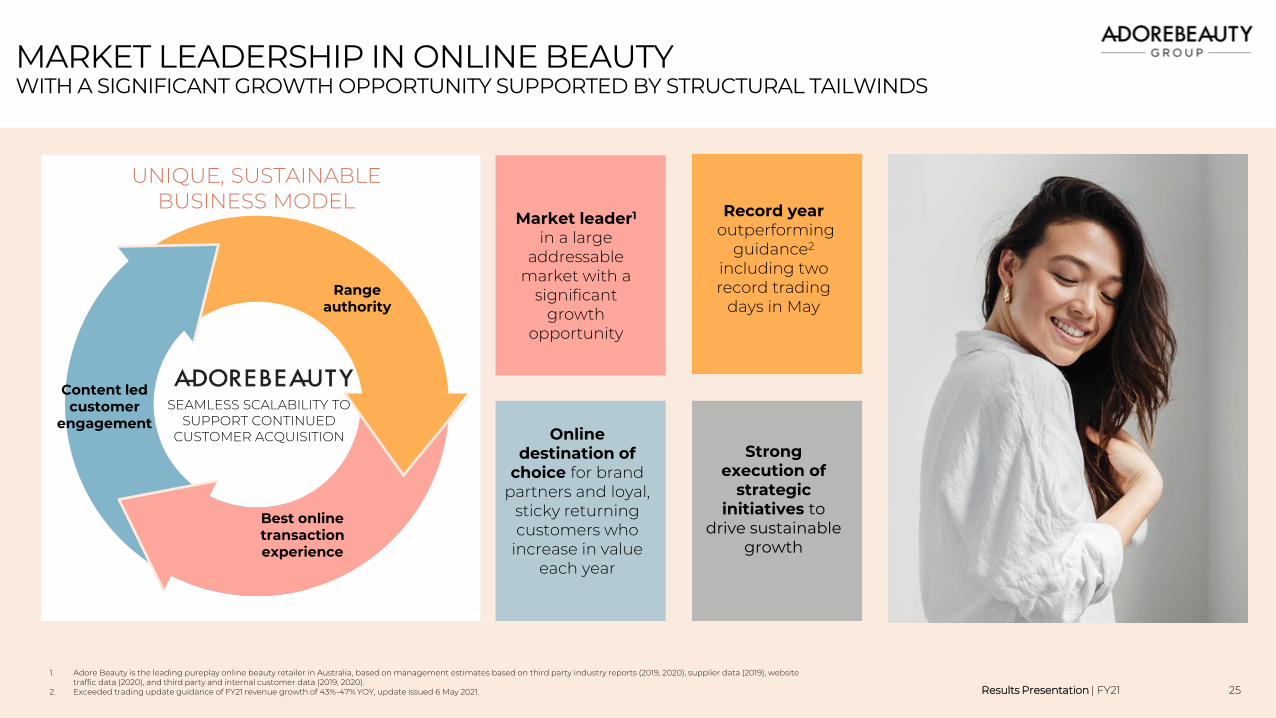
Market leader1
in a large addressable
market with a significant
growth opportunity
Record yearoutperforming
guidance2
including two record trading
days in May
Online destination of
choice for brand partners and loyal,
sticky returning customers who
increase in value each year
Strong execution of
strategic initiatives to
drive sustainable growth
MARKET LEADERSHIP IN ONLINE BEAUTYWITH A SIGNIFICANT GROWTH OPPORTUNITY SUPPORTED BY STRUCTURAL TAILWINDS
1. Adore Beauty is the leading pureplay online beauty retailer in Australia, based on management estimates based on third party industry reports (2019, 2020), supplier data (2019), website traffic data (2020), and third party and internal customer data (2019, 2020).
2. Exceeded trading update guidance of FY21 revenue growth of 43%-47% YOY, update issued 6 May 2021.
UNIQUE, SUSTAINABLE BUSINESS MODEL
SEAMLESS SCALABILITY TO SUPPORT CONTINUED
CUSTOMER ACQUISITION
Best online transaction experience
Content led customer
engagement
Range authority

Results Presentation | H1 FY21 26
QUESTIONS
Results Presentation | H1 FY21 27
APPENDIX
Results Presentation | H1 FY21 28Results Presentation | FY21 28
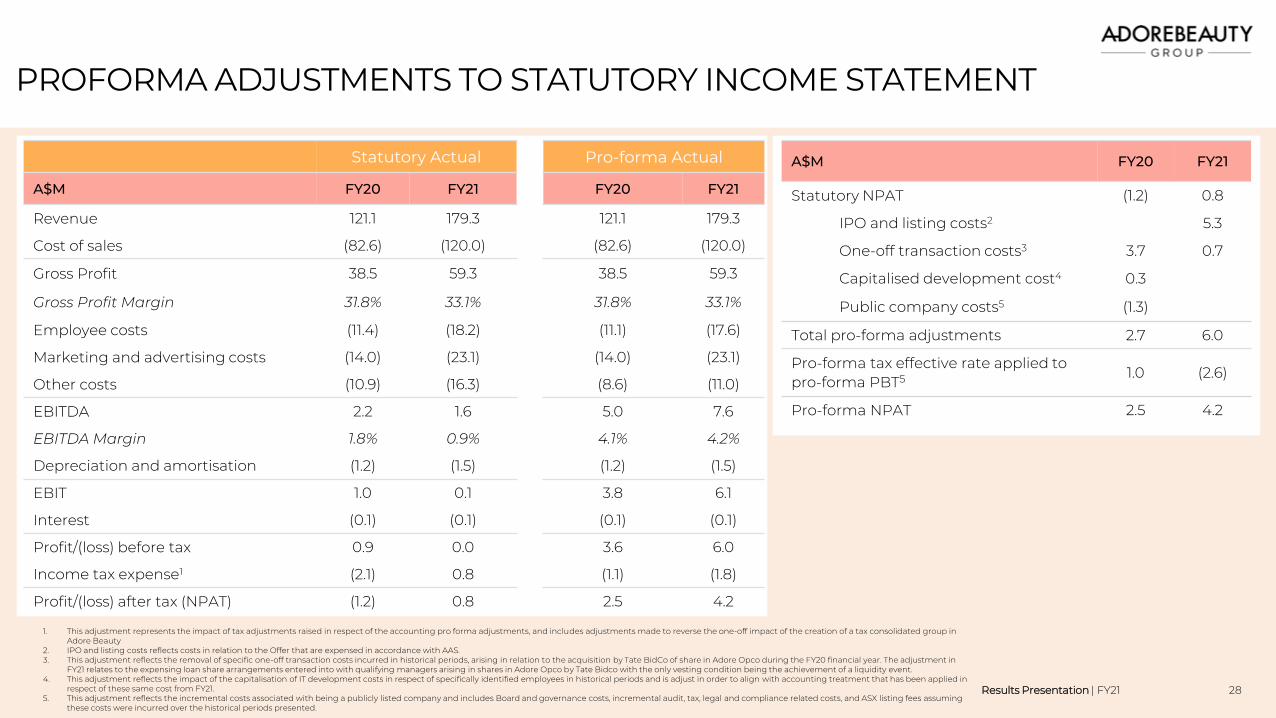
PROFORMA ADJUSTMENTS TO STATUTORY INCOME STATEMENT
1. This adjustment represents the impact of tax adjustments raised in respect of the accounting pro forma adjustments, and includes adjustments made to reverse the one-off impact of the creation of a tax consolidated group in Adore Beauty
2. IPO and listing costs reflects costs in relation to the Offer that are expensed in accordance with AAS. 3. This adjustment reflects the removal of specific one-off transaction costs incurred in historical periods, arising in relation to the acquisition by Tate BidCo of share in Adore Opco during the FY20 financial year. The adjustment in
FY21 relates to the expensing loan share arrangements entered into with qualifying managers arising in shares in Adore Opco by Tate Bidco with the only vesting condition being the achievement of a liquidity event. 4. This adjustment reflects the impact of the capitalisation of IT development costs in respect of specifically identified employees in historical periods and is adjust in order to align with accounting treatment that has been applied in
respect of these same cost from FY21. 5. This adjustment reflects the incremental costs associated with being a publicly listed company and includes Board and governance costs, incremental audit, tax, legal and compliance related costs, and ASX listing fees assuming
these costs were incurred over the historical periods presented.
Statutory Actual Pro-forma Actual
A$M FY20 FY21 FY20 FY21
Revenue 121.1 179.3 121.1 179.3
Cost of sales (82.6) (120.0) (82.6) (120.0)
Gross Profit 38.5 59.3 38.5 59.3
Gross Profit Margin 31.8% 33.1% 31.8% 33.1%
Employee costs (11.4) (18.2) (11.1) (17.6)
Marketing and advertising costs (14.0) (23.1) (14.0) (23.1)
Other costs (10.9) (16.3) (8.6) (11.0)
EBITDA 2.2 1.6 5.0 7.6
EBITDA Margin 1.8% 0.9% 4.1% 4.2%
Depreciation and amortisation (1.2) (1.5) (1.2) (1.5)
EBIT 1.0 0.1 3.8 6.1
Interest (0.1) (0.1) (0.1) (0.1)
Profit/(loss) before tax 0.9 0.0 3.6 6.0
Income tax expense1 (2.1) 0.8 (1.1) (1.8)
Profit/(loss) after tax (NPAT) (1.2) 0.8 2.5 4.2
A$M FY20 FY21
Statutory NPAT (1.2) 0.8
IPO and listing costs2 5.3
One-off transaction costs3 3.7 0.7
Capitalised development cost4 0.3
Public company costs5 (1.3)
Total pro-forma adjustments 2.7 6.0
Pro-forma tax effective rate applied to pro-forma PBT5 1.0 (2.6)
Pro-forma NPAT 2.5 4.2
Results Presentation | H1 FY21 29Results Presentation | FY21 29
DISCLAIMER
This presentation has been prepared by Adore Beauty Group Limited ACN 636 138 988 (Company). This presentation contains summary information about the Company and its subsidiaries (Group) and the business conducted by the Group as at 30th August 2021. The information in this presentation is general information and in summary form and does not purport to be complete or comprehensive. This presentation should be read in conjunction with the Company’s other periodic and continuous disclosure announcements lodged with the Australian Securities Exchange.
This presentation is not and should not be considered, and does not contain or purport to contain, an offer, invitation, solicitation or recommendation with respect to the purchase or sale of any securities in the Company (Securities) nor does it constitute financial product or investment advice (nor taxation or legal advice) nor take into account your investment objectives, taxation situation, financial situation or needs. This presentation does not constitute an advertisement for an offer or proposed offer of Securities. Neither this presentation nor anything contained in it shall form the basis of any contract or commitment and it is not intended to induce or solicit any person to engage in, or refrain from engaging in, any transaction nor is it intended to be used as the basis for making an investment decision.
The material contained in this presentation may include information, data, estimates and projections derived from publicly available sources or other third party sources that have not been independently verified by the Company. No representation or warranty is made as to the accuracy, completeness or reliability of the information. Estimates and projections involve risks and uncertainties and are subject to change based on various factors.
To the fullest extent permitted by law, no representation or warranty (expressed or implied) is given or made by any person (including the Company) in relation to the accuracy or completeness of all or any part of this presentation and no responsibility for any loss arising in any way (including by negligence) from anyone acting or refraining from acting as a result of the material contained in this presentation is accepted by the Company.
An investor must not act on the basis of any matter contained in this presentation but must make its own assessment of the Group and conduct its own investigation and analysis. The information in this presentation is subject to change without notice. The Company has no obligation to update or correct this presentation, except as required by law.
A number of figures, amounts, percentages, estimates and calculations of value in this presentation are subject to the effect of rounding. Accordingly, the actual calculation of these figures may differ from the figures set out in this presentation.
All dollar values are in Australian dollars (A$), unless otherwise stated.
The operating and historical financial information given in this presentation is given for illustrative purposes only and should not be relied upon as (and is not) an indication of the Company's views on the Group's future performance or condition. You should note that past performance of the Group cannot be relied upon as an indicator of (and provides no guidance as to) future Group performance.
This presentation may contain forward-looking statements with respect to the operations and businesses of the Company. The assumptions underlying these forward-looking statements involve circumstances and events that have not yet taken place, and which are subject to uncertainty and contingencies outside the Company’s control. Readers are cautioned not to place undue reliance on any forward-looking statements. The Company does not undertake any obligation to publicly release the result of any revisions to forward-looking statements in this presentation or to otherwise update forward-looking statements, whether as a result of new information, future events, or otherwise, after the date of this presentation , except as required by law.

Results Presentation | H1 FY21 30