Embed Size (px)
Citation preview
RESULTS PRESENTATIONFOR THE YEAR ENDED
31 MARCH 2018
AIR
PO
RTS
CO
MP
AN
Y SO
UTH
AFR
ICA
RES
ULT
S P
RES
ENTA
TIO
N 2
01
8
2
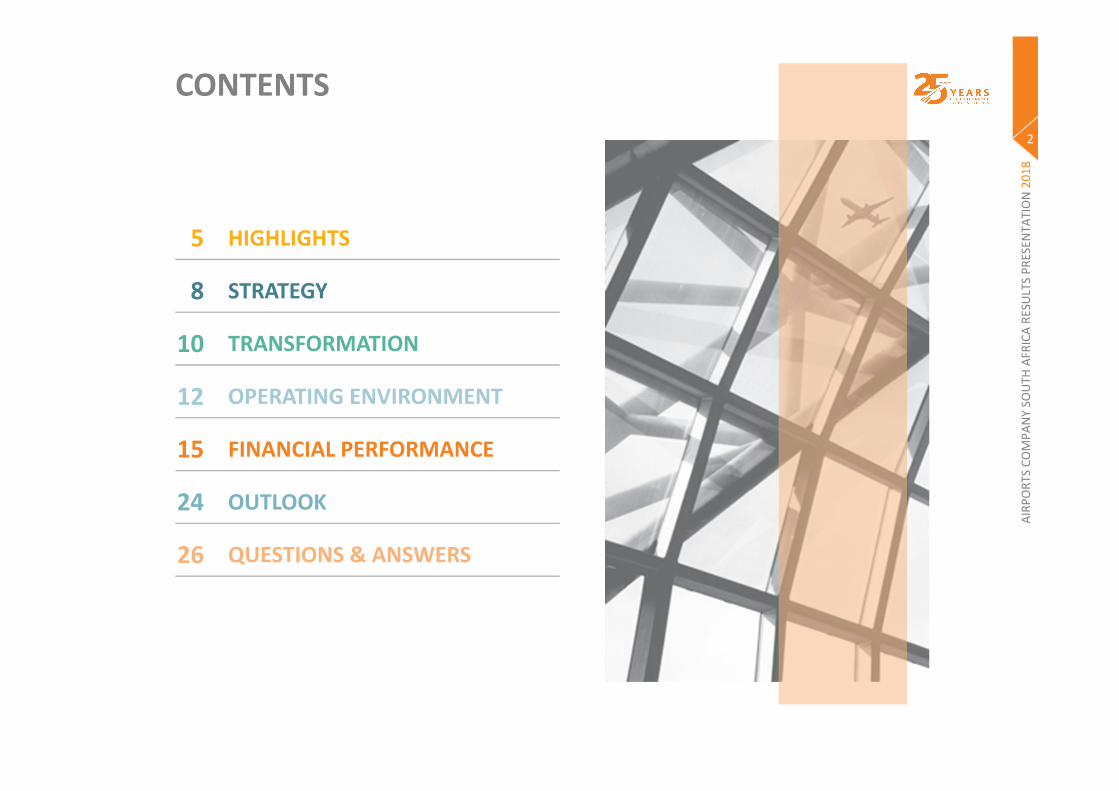
CONTENTS
5 HIGHLIGHTS
8 STRATEGY
10 TRANSFORMATION
12 OPERATING ENVIRONMENT
15 FINANCIAL PERFORMANCE
24 OUTLOOK
26 QUESTIONS & ANSWERS
AIR
PO
RTS
CO
MP
AN
Y SO
UTH
AFR
ICA
RES
ULT
S P
RES
ENTA
TIO
N 2
01
8
3
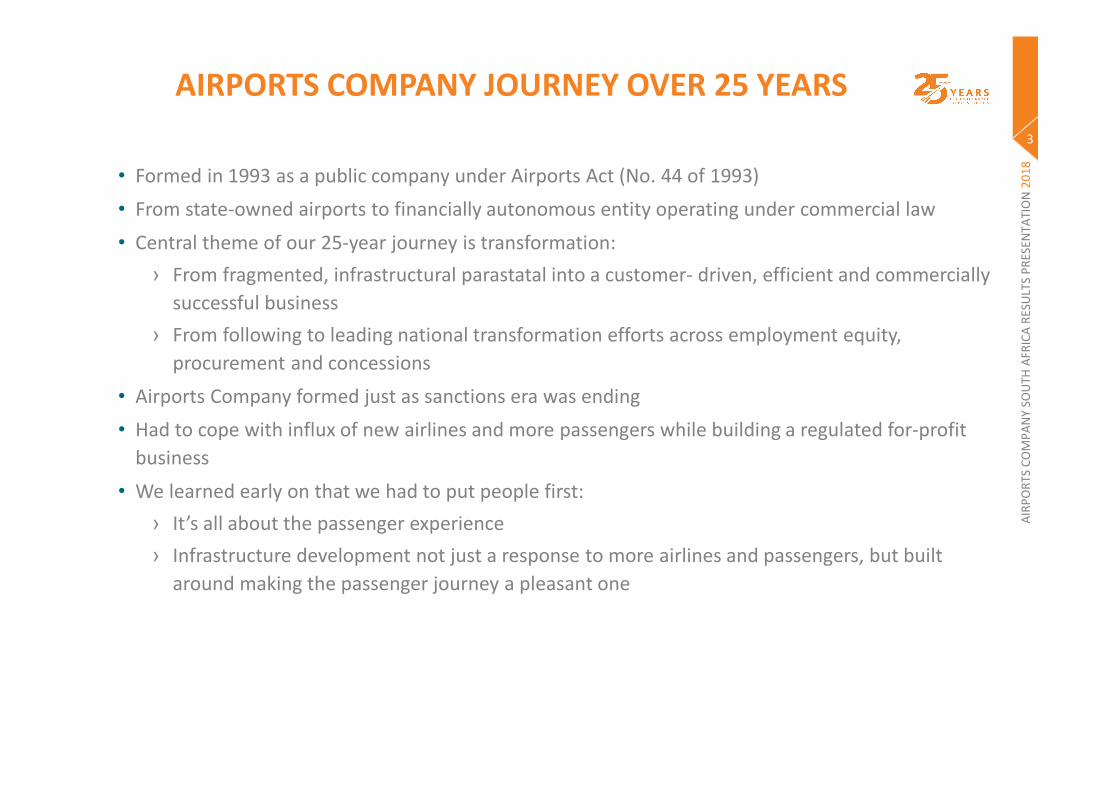
AIRPORTS COMPANY JOURNEY OVER 25 YEARS
• Formed in 1993 as a public company under Airports Act (No. 44 of 1993)
• From state-owned airports to financially autonomous entity operating under commercial law
• Central theme of our 25-year journey is transformation:
› From fragmented, infrastructural parastatal into a customer- driven, efficient and commercially
successful business
› From following to leading national transformation efforts across employment equity,
procurement and concessions
• Airports Company formed just as sanctions era was ending
• Had to cope with influx of new airlines and more passengers while building a regulated for-profit
business
• We learned early on that we had to put people first:
› It’s all about the passenger experience
› Infrastructure development not just a response to more airlines and passengers, but built
around making the passenger journey a pleasant one
AIR
PO
RTS
CO
MP
AN
Y SO
UTH
AFR
ICA
RES
ULT
S P
RES
ENTA
TIO
N 2
01
8
4
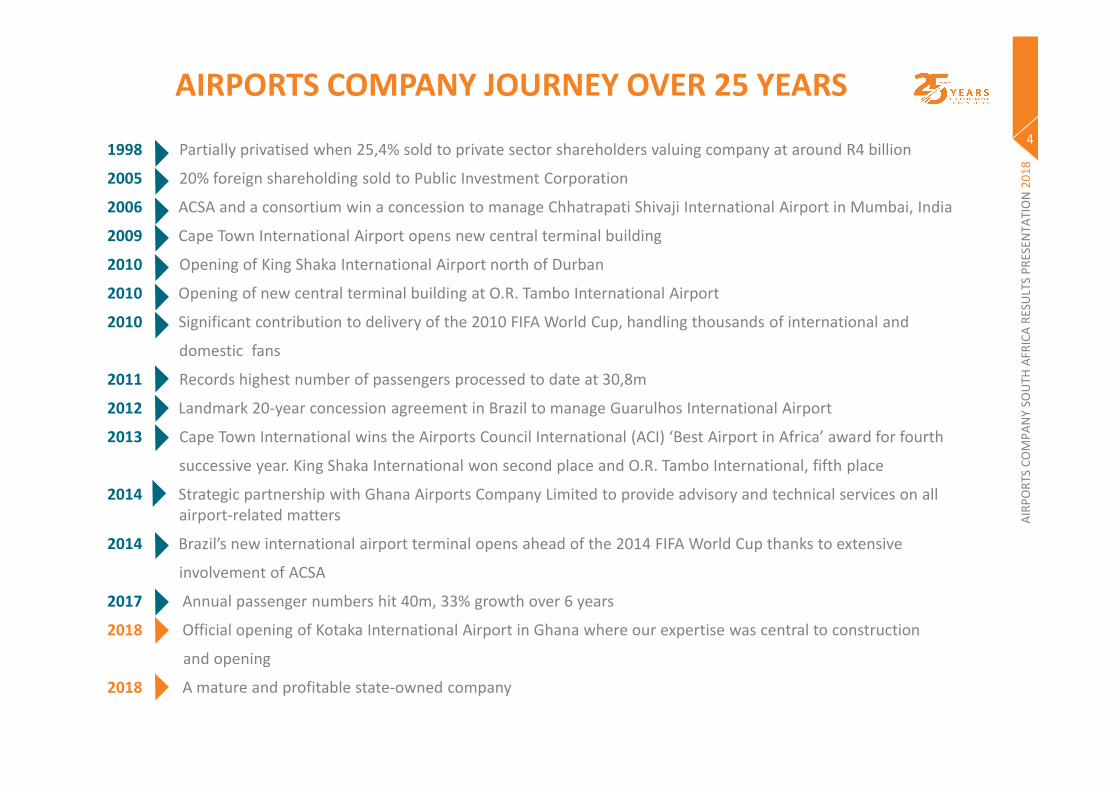
AIRPORTS COMPANY JOURNEY OVER 25 YEARS
1998 Partially privatised when 25,4% sold to private sector shareholders valuing company at around R4 billion
2005 20% foreign shareholding sold to Public Investment Corporation
2006 ACSA and a consortium win a concession to manage Chhatrapati Shivaji International Airport in Mumbai, India
2009 Cape Town International Airport opens new central terminal building
2010 Opening of King Shaka International Airport north of Durban
2010 Opening of new central terminal building at O.R. Tambo International Airport
2010 Significant contribution to delivery of the 2010 FIFA World Cup, handling thousands of international and
domestic fans
2011 Records highest number of passengers processed to date at 30,8m
2012 Landmark 20-year concession agreement in Brazil to manage Guarulhos International Airport
2013 Cape Town International wins the Airports Council International (ACI) ‘Best Airport in Africa’ award for fourth
successive year. King Shaka International won second place and O.R. Tambo International, fifth place
2014 Strategic partnership with Ghana Airports Company Limited to provide advisory and technical services on allairport-related matters
2014 Brazil’s new international airport terminal opens ahead of the 2014 FIFA World Cup thanks to extensive
involvement of ACSA
2017 Annual passenger numbers hit 40m, 33% growth over 6 years
2018 Official opening of Kotaka International Airport in Ghana where our expertise was central to construction
and opening
2018 A mature and profitable state-owned company
5
AIR
PO
RTS
CO
MP
AN
Y SO
UTH
AFR
ICA
HIGHLIGHTS

AIR
PO
RTS
CO
MP
AN
Y SO
UTH
AFR
ICA
RES
ULT
S P
RES
ENTA
TIO
N 2
01
8
6
HIGHLIGHTS
• Board vacancies filled
• The company continued to be resilient despite challenging operating conditions
• Maintained sound financial performance and satisfactory airport service levels
• Remained steadfast in the implementation of our governance framework and
operating model
• Seven transformation sector strategies progressing well
• Continued to strengthen Supply Chain Management governance processes
• Building relationships with our stakeholders is pivotal in creating sustainable value

AIR
PO
RTS
CO
MP
AN
Y SO
UTH
AFR
ICA
RES
ULT
S P
RES
ENTA
TIO
N 2
01
8
7
ECONOMIC IMPACT
What are we doing today to ensure the legacy of tomorrow?
* This figure comprises of 2 992 direct employees (not including contractors), around 5 519 jobs as a result of supply chain spending and 6 440 supported through spending of ACSA employees and suppliers employees
Source: PwC Economic Impact Study commissioned by ACSA 2017
ACSA contributed
R9.5 billion toSA’s economyin FY2017
ACSA supported
14 950SA jobsin FY2017*
ACSA supported
R2.8 billionof incometo workers in SA

8
AIR
PO
RTS
CO
MP
AN
Y SO
UTH
AFR
ICA
STRATEGY

AIR
PO
RTS
CO
MP
AN
Y SO
UTH
AFR
ICA
RES
ULT
S P
RES
ENTA
TIO
N 2
01
8
9
VISION 2025
Run airports
By running our airports efficiently
and developing them innovatively,
we will enhance the regional economy.
Develop airports
Improving our capacity and infrastructure
grows our footprint through
effective operation and partnerships.
Grow our footprint
A larger footprint increases our exposure
to diverse methods, allowing us to learn and grow,
and improve the way we run airports.
Long-term horizons
Our strategy is implemented over three time horizons
to create value over the short, medium and long-term
Horizon 1
By 2020:Extend and defend our business
Horizon 2
By 2025:Build emerging businesses and drive medium-term growth
Horizon 3
Beyond 2025:Create viable options to ensure the company’s success in future

10
AIR
PO
RTS
CO
MP
AN
Y SO
UTH
AFR
ICA
TRANSFORMATION

AIR
PO
RTS
CO
MP
AN
Y SO
UTH
AFR
ICA
RES
ULT
S P
RES
ENTA
TIO
N 2
01
8
11
TRANSFORMATION
Our Transformation Agenda is to
contribute towards strengthening
South Africa’s democracy
1. Social:
To assist people living below the
poverty line and to assist them to
mainstream economic growth
2. Moral:
to promote equality and to
contribute towards correcting
the imbalances of our past
3. Economic:
to align our business to reflect
the demographics of South Africa
towards economic equality
1. Design and implement socio
economic activities that will
empower our communities to
ultimately lead to better lives
2. Create equal opportunities that
are reflective of fairness,
transparency, the economically
active population and the
elimination of unfair
discrimination
3. Develop small, medium and large
size businesses with a broad
objective of changing the face of
business at ACSA to an industry
that is reflective of the South
African demographics
Transformation agenda Goals Objectives
TR
AN
SF
OR
MA
TIO
N A
GE
ND
A:
20
15
-20
20
12
AIR
PO
RTS
CO
MP
AN
Y SO
UTH
AFR
ICA
OPERATING ENVIRONMENT
AIR
PO
RTS
CO
MP
AN
Y SO
UTH
AFR
ICA
RES
ULT
S P
RES
ENTA
TIO
N 2
01
8
13
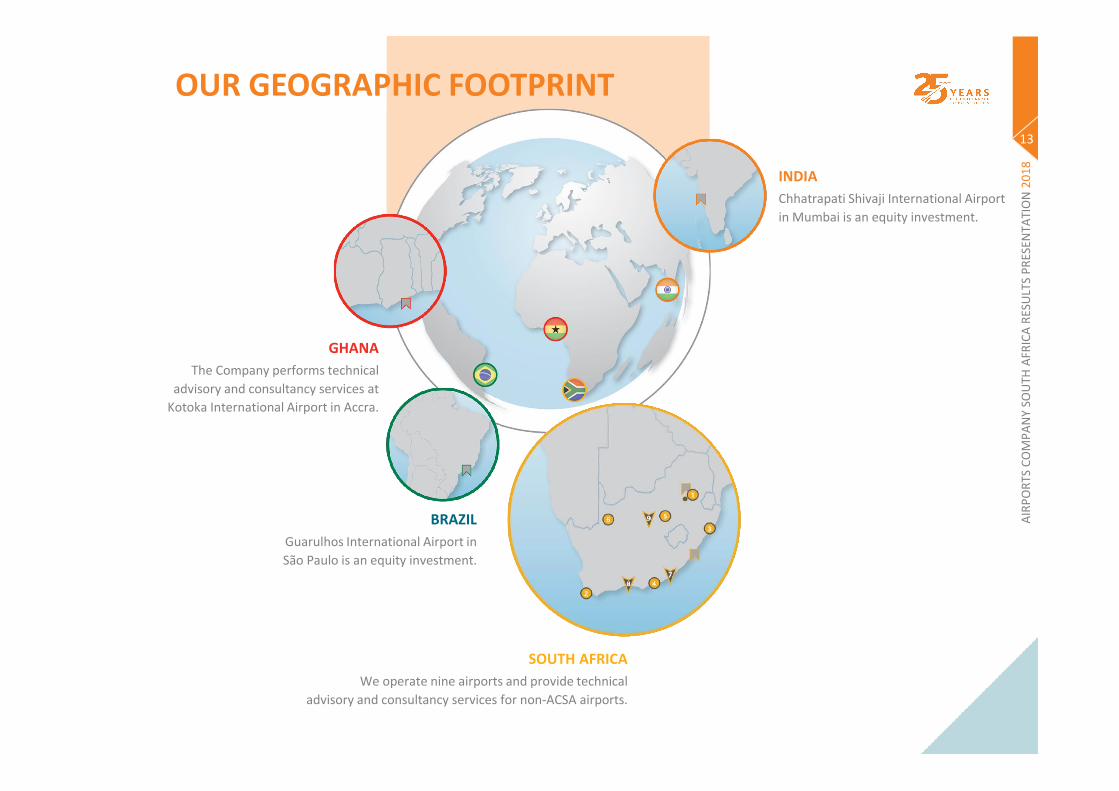
OUR GEOGRAPHIC FOOTPRINT
INDIA
Chhatrapati Shivaji International Airport
in Mumbai is an equity investment.
GHANA
The Company performs technical
advisory and consultancy services at
Kotoka International Airport in Accra.
BRAZIL
Guarulhos International Airport in
São Paulo is an equity investment.
SOUTH AFRICA
We operate nine airports and provide technical
advisory and consultancy services for non-ACSA airports.
AIR
PO
RTS
CO
MP
AN
Y SO
UTH
AFR
ICA
RES
ULT
S P
RES
ENTA
TIO
N 2
01
8
14
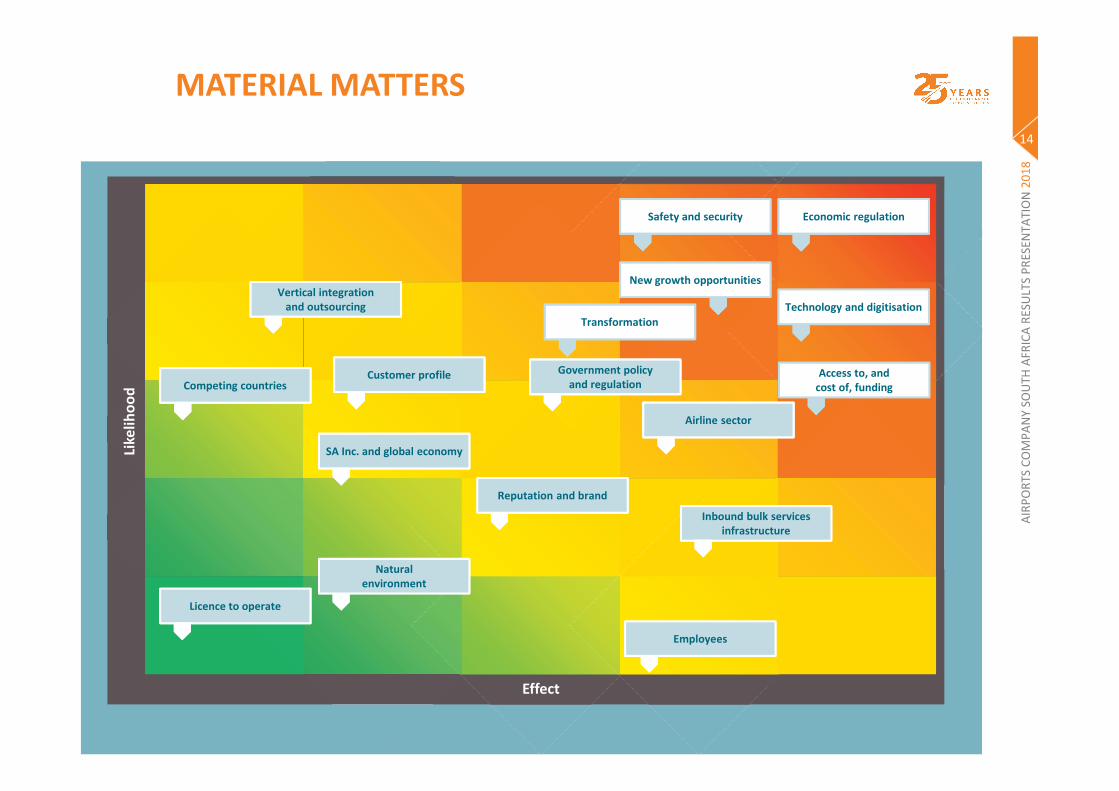
MATERIAL MATTERS
Effect
Like
liho
od
SA Inc. and global economy
Vertical integrationand outsourcing
Competing countriesCustomer profile
Reputation and brand
Naturalenvironment
Inbound bulk services infrastructure
Employees
Airline sector
Access to, andcost of, funding
Technology and digitisation
Government policyand regulation
Transformation
New growth opportunities
Safety and security Economic regulation
Licence to operate
15
AIR
PO
RTS
CO
MP
AN
Y SO
UTH
AFR
ICA
FINANCIAL PERFORMANCE
AIR
PO
RTS
CO
MP
AN
Y SO
UTH
AFR
ICA
RES
ULT
S P
RES
ENTA
TIO
N 2
01
8
16
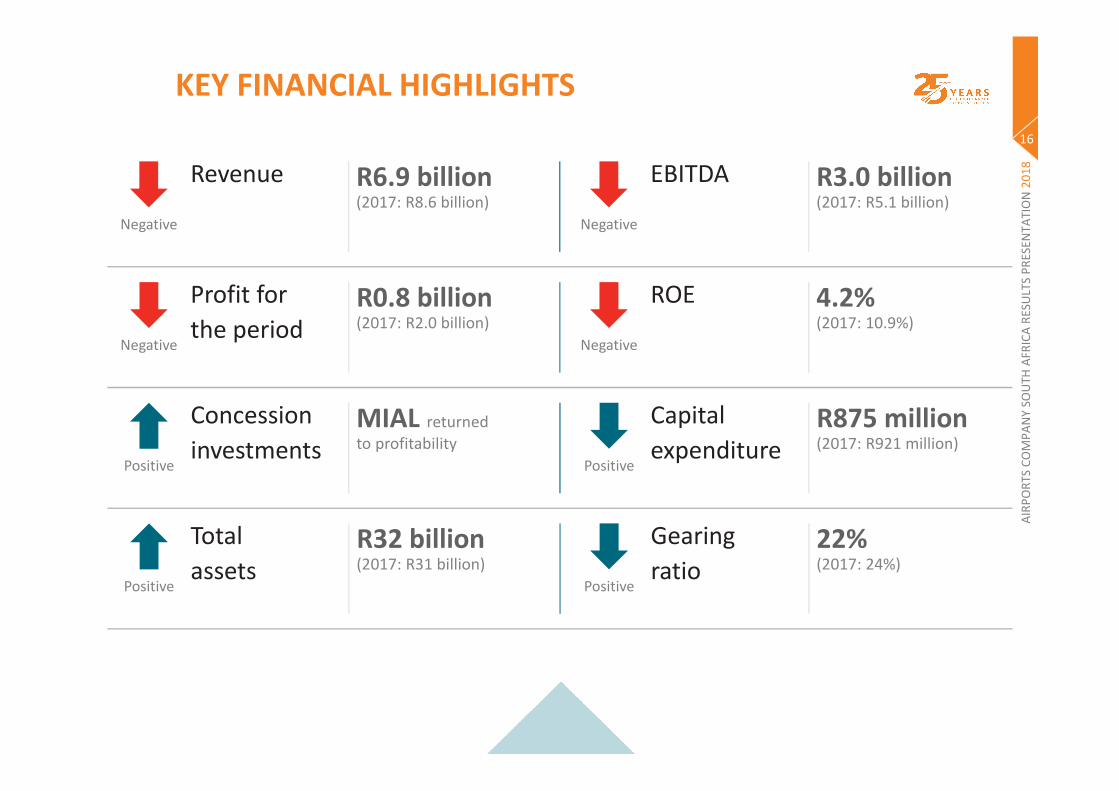
KEY FINANCIAL HIGHLIGHTS
Revenue R6.9 billion(2017: R8.6 billion)
Negative
EBITDA R3.0 billion(2017: R5.1 billion)
Negative
Profit for
the periodR0.8 billion(2017: R2.0 billion)
Negative
ROE 4.2%(2017: 10.9%)
Negative
Concession
investmentsMIAL returned
to profitability
Positive
Capital
expenditureR875 million(2017: R921 million)
Positive
Total
assetsR32 billion(2017: R31 billion)
Positive
Gearing
ratio22%(2017: 24%)
Positive
AIR
PO
RTS
CO
MP
AN
Y SO
UTH
AFR
ICA
RES
ULT
S P
RES
ENTA
TIO
N 2
01
8
17
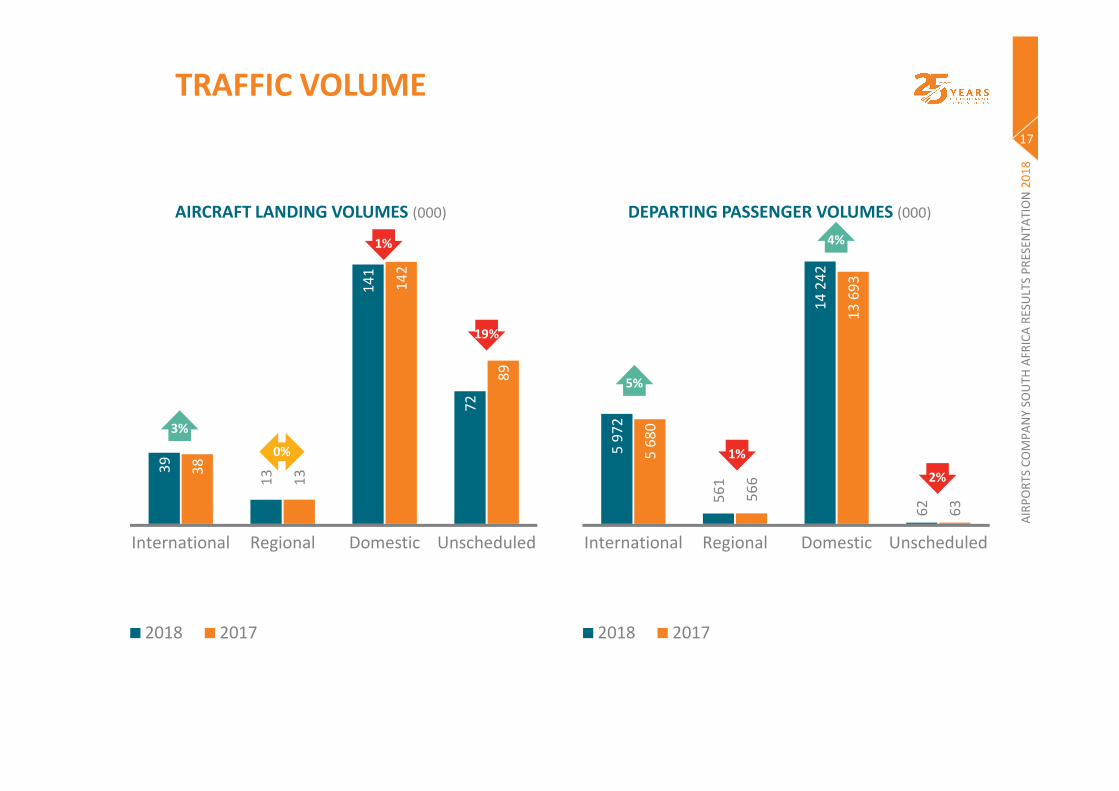
TRAFFIC VOLUME
39
13
14
1
72
38
13
14
2
89
International Regional Domestic Unscheduled
2018 2017
AIRCRAFT LANDING VOLUMES (000)
5 9
72
56
1
14
24
2
62
5 6
80
56
6
13
69
3
63
International Regional Domestic Unscheduled
2018 2017
DEPARTING PASSENGER VOLUMES (000)
0%
3%
1%
19%
5%
1%
4%
2%
AIR
PO
RTS
CO
MP
AN
Y SO
UTH
AFR
ICA
RES
ULT
S P
RES
ENTA
TIO
N 2
01
8
18
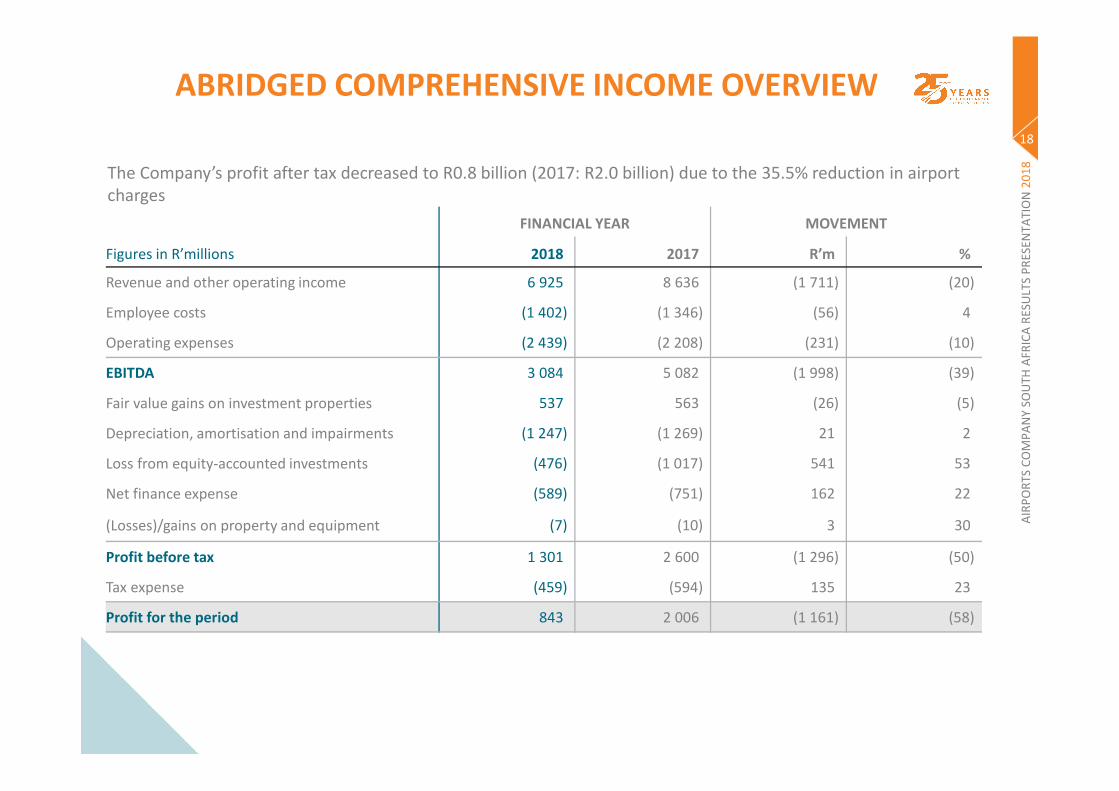
ABRIDGED COMPREHENSIVE INCOME OVERVIEW
The Company’s profit after tax decreased to R0.8 billion (2017: R2.0 billion) due to the 35.5% reduction in airport charges
FINANCIAL YEAR MOVEMENT
Figures in R’millions 2018 2017 R’m %
Revenue and other operating income 6 925 8 636 (1 711) (20)
Employee costs (1 402) (1 346) (56) 4
Operating expenses (2 439) (2 208) (231) (10)
EBITDA 3 084 5 082 (1 998) (39)
Fair value gains on investment properties 537 563 (26) (5)
Depreciation, amortisation and impairments (1 247) (1 269) 21 2
Loss from equity-accounted investments (476) (1 017) 541 53
Net finance expense (589) (751) 162 22
(Losses)/gains on property and equipment (7) (10) 3 30
Profit before tax 1 301 2 600 (1 296) (50)
Tax expense (459) (594) 135 23
Profit for the period 843 2 006 (1 161) (58)
AIR
PO
RTS
CO
MP
AN
Y SO
UTH
AFR
ICA
RES
ULT
S P
RES
ENTA
TIO
N 2
01
8
19
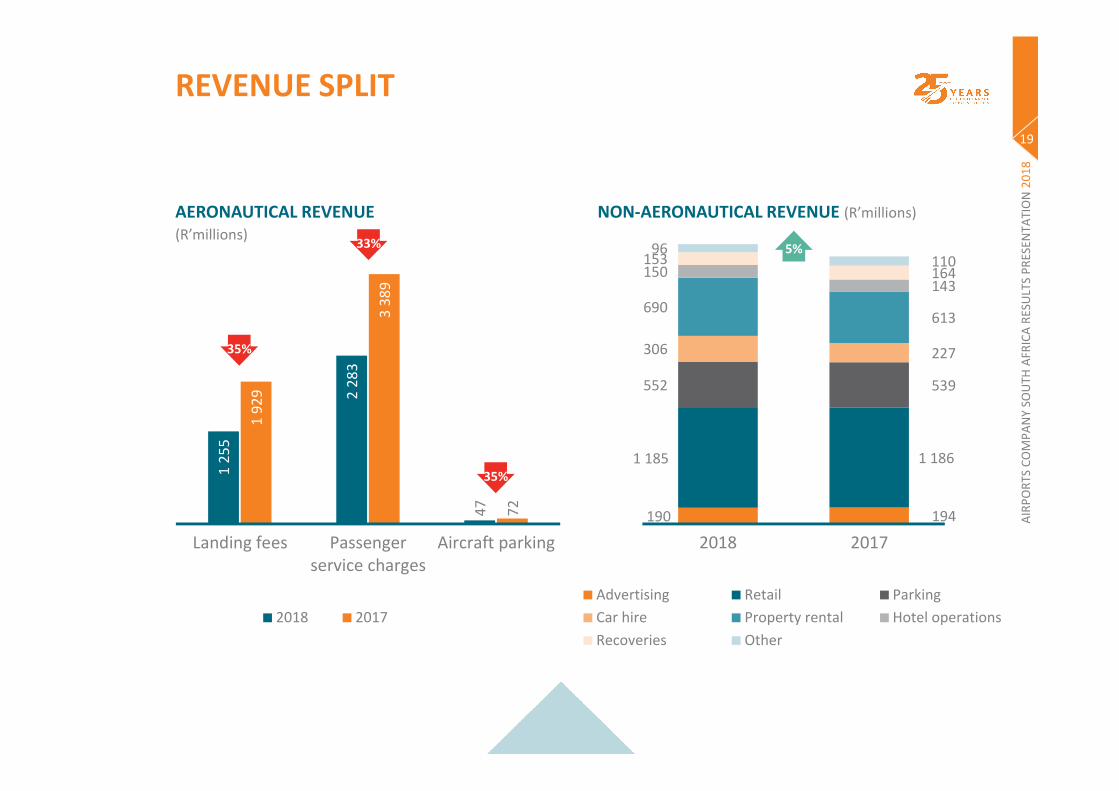
REVENUE SPLIT
1 2
55
2 2
83
47
1 9
29
3 3
89
72
Landing fees Passengerservice charges
Aircraft parking
2018 2017
AERONAUTICAL REVENUE (R’millions)
190 194
1 185 1 186
552 539
306 227
690613
150143
153164
96110
2018 2017
Advertising Retail Parking
Car hire Property rental Hotel operations
Recoveries Other
NON-AERONAUTICAL REVENUE (R’millions)
35%
33%
35%
5%
AIR
PO
RTS
CO
MP
AN
Y SO
UTH
AFR
ICA
RES
ULT
S P
RES
ENTA
TIO
N 2
01
8
20
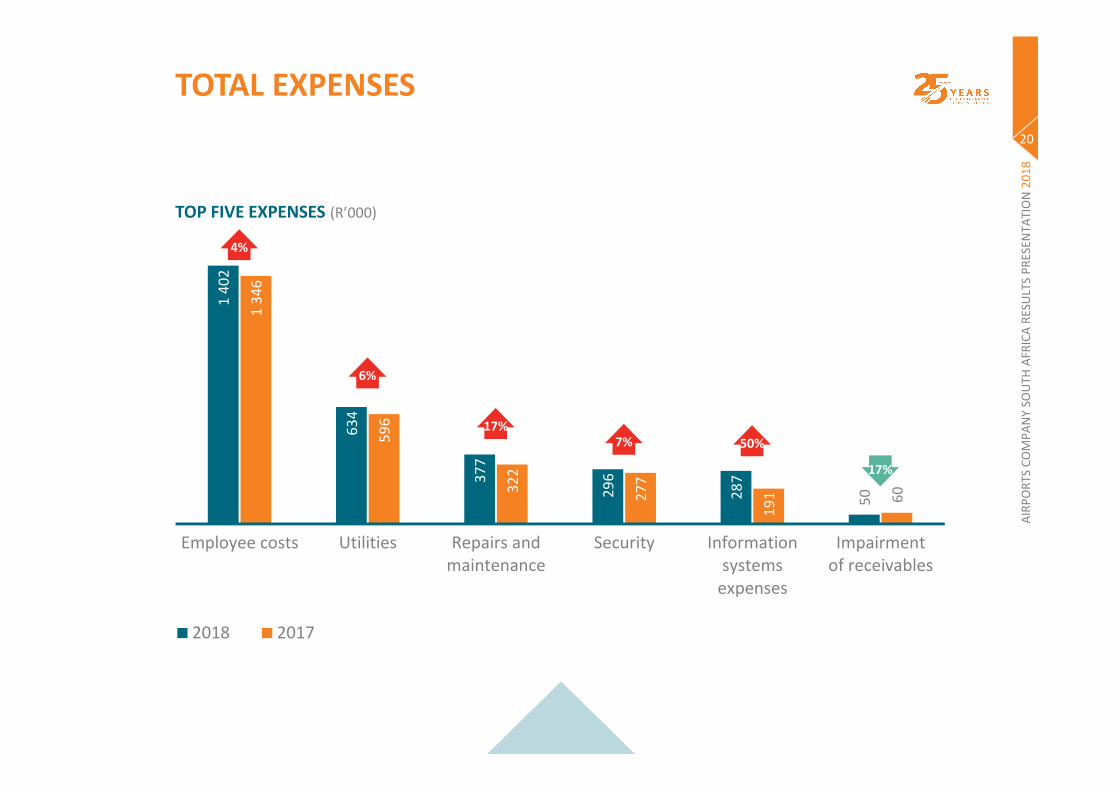
TOTAL EXPENSES
1 4
02
63
4
37
7
29
6
28
7
50
1 3
46
59
6
32
2
27
7
19
1 60
Employee costs Utilities Repairs andmaintenance
Security Informationsystems
expenses
Impairmentof receivables
2018 2017
TOP FIVE EXPENSES (R’000)
17%
4%
6%
17%7% 50%
AIR
PO
RTS
CO
MP
AN
Y SO
UTH
AFR
ICA
RES
ULT
S P
RES
ENTA
TIO
N 2
01
8
21
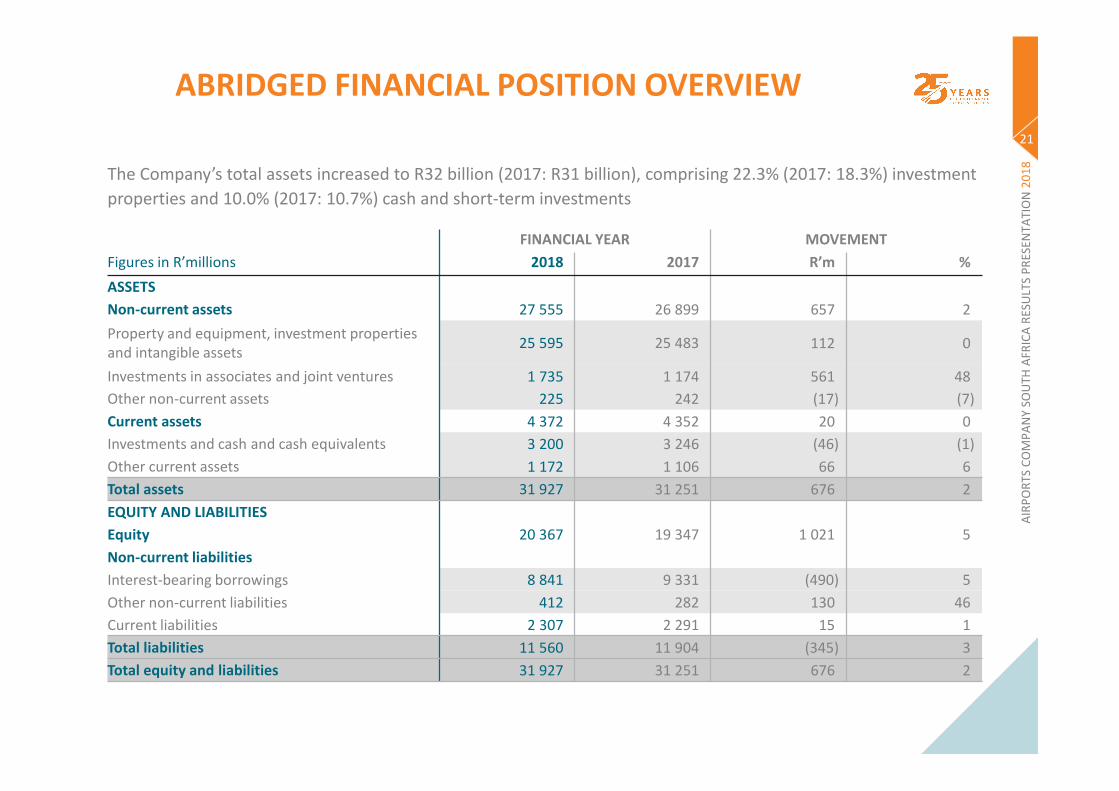
ABRIDGED FINANCIAL POSITION OVERVIEW
The Company’s total assets increased to R32 billion (2017: R31 billion), comprising 22.3% (2017: 18.3%) investment
properties and 10.0% (2017: 10.7%) cash and short-term investments
FINANCIAL YEAR MOVEMENT
Figures in R’millions 2018 2017 R’m %
ASSETS
Non-current assets 27 555 26 899 657 2
Property and equipment, investment properties and intangible assets
25 595 25 483 112 0
Investments in associates and joint ventures 1 735 1 174 561 48
Other non-current assets 225 242 (17) (7)
Current assets 4 372 4 352 20 0
Investments and cash and cash equivalents 3 200 3 246 (46) (1)
Other current assets 1 172 1 106 66 6
Total assets 31 927 31 251 676 2
EQUITY AND LIABILITIES
Equity 20 367 19 347 1 021 5
Non-current liabilities
Interest-bearing borrowings 8 841 9 331 (490) 5
Other non-current liabilities 412 282 130 46
Current liabilities 2 307 2 291 15 1
Total liabilities 11 560 11 904 (345) 3
Total equity and liabilities 31 927 31 251 676 2

AIR
PO
RTS
CO
MP
AN
Y SO
UTH
AFR
ICA
RES
ULT
S P
RES
ENTA
TIO
N 2
01
8
22
DEBT EVOLUTION AND GEARING RATIO
Agency Ratings Outlook
Company rating Rating action Long-term domestic currency Long-term national scale
Moody’s Affirmed Baa3 Aa1.za Stable
DEBT EVOLUTION (EXCLUDING SWAPS) (R billion) GEARING RATIO (%)
13
9
-2.0
-1.6
-1.2
-0.8
-0.4
0.0
0.0
2.0
4.0
6.0
8.0
10.0
12.0
14.0
2014 2015 2016 2017 2018
Change in debt levels[RHS] Debt levels[LHS]
48
39
31
2522
2014 2015 2016 2017 2018

AIR
PO
RTS
CO
MP
AN
Y SO
UTH
AFR
ICA
RES
ULT
S P
RES
ENTA
TIO
N 2
01
8
23
CASH FLOW STATEMENT OVERVIEW
1 7211 374
3 221124
(485)
(1 490)
(553)(353)
(811)
Openingcash
Cashgenerated
Income taxpaid
Interestreceived
Investingactivities
Debtrepaid
Dividendspaid
Interestand other
financecosts paid
Endingcash
TOTAL CASH DECLINED BY R347 MILLION
(R’million)

24
AIR
PO
RTS
CO
MP
AN
Y SO
UTH
AFR
ICA
OUTLOOK
AIR
PO
RTS
CO
MP
AN
Y SO
UTH
AFR
ICA
RES
ULT
S P
RES
ENTA
TIO
N 2
01
8
25
OUTLOOK
CELEBRATING 25 YEARS OF OPERATIONS
FINANCIAL POSITION REMAINS SOUND
FINAL PERMISSION ISSUED IN AUGUST 2018
CHALLENGES IN OUR EXTERNAL BUSINESS ENVIRONMENT PERSISTS

26
AIR
PO
RTS
CO
MP
AN
Y SO
UTH
AFR
ICA
QUESTIONS & ANSWERS
AIR
PO
RTS
CO
MP
AN
Y SO
UTH
AFR
ICA
RES
ULT
S P
RES
ENTA
TIO
N 2
01
8
27
DISCLAIMER
The information contained in this presentation is confidential, and is intended solely for this
presentation. This presentation may contain information proprietary to the Airports Company South
Africa SOC Limited (“the Company”), and may not be reproduced or disseminated in whole or in part
without the Company's written consent. The Company is not acting as your adviser in any transaction
that may be proposed herein, and this presentation does not constitute a recommendation, guidance
or proposal to enter into any transaction. Any decision to enter into a transaction should be made on
the basis of information contained within an offering circular, programme memorandum or prospectus
published in relation to such an offering. The Company does not guarantee or otherwise assure the
expected results of any transaction as envisaged in this presentation. You shall not be entitled to
place any reliance on the information contained in this presentation for the purposes of entering into
any proposed transaction or otherwise.