Embed Size (px)
Citation preview
Results Postprocessing
Chapter Eight
August 26, 2005Inventory
#0022658-2
AN
SY
S W
ork
ben
ch
– Sim
ula
tion
AN
SY
S W
ork
ben
ch
– Sim
ula
tion
AN
SY
S W
ork
ben
ch
– Sim
ula
tion
AN
SY
S W
ork
ben
ch
– Sim
ula
tion
Training Manual
Results Postprocessing
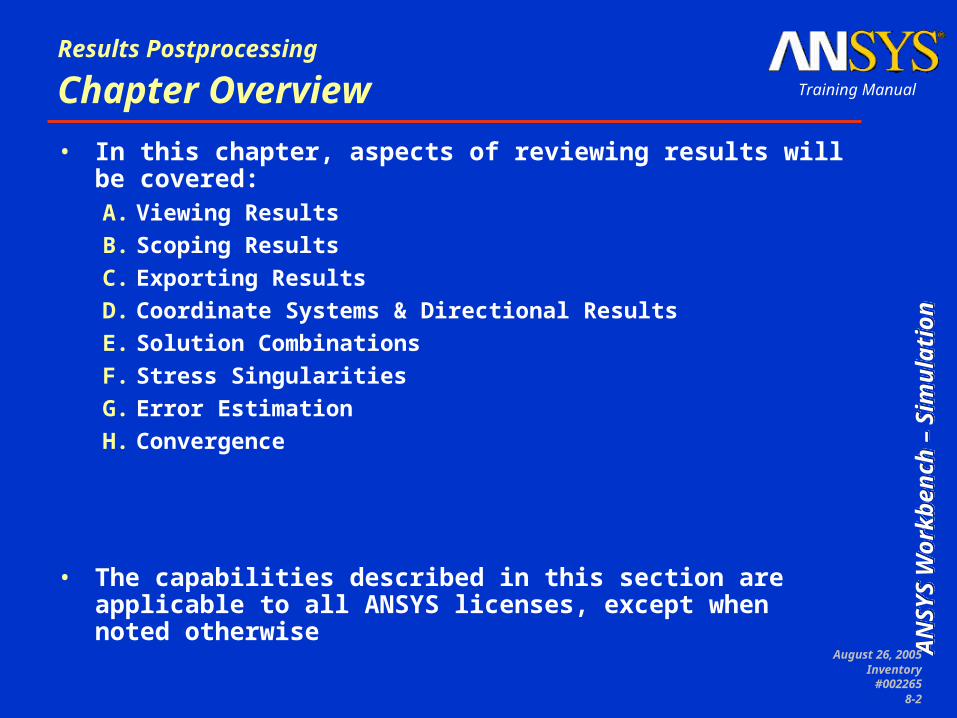
Chapter Overview
• In this chapter, aspects of reviewing results will be covered:A. Viewing Results
B. Scoping Results
C. Exporting Results
D. Coordinate Systems & Directional Results
E. Solution Combinations
F. Stress Singularities
G. Error Estimation
H. Convergence
• The capabilities described in this section are applicable to all ANSYS licenses, except when noted otherwise
August 26, 2005Inventory
#0022658-3
AN
SY
S W
ork
ben
ch
– Sim
ula
tion
AN
SY
S W
ork
ben
ch
– Sim
ula
tion
AN
SY
S W
ork
ben
ch
– Sim
ula
tion
AN
SY
S W
ork
ben
ch
– Sim
ula
tion
Training Manual
Results Postprocessing
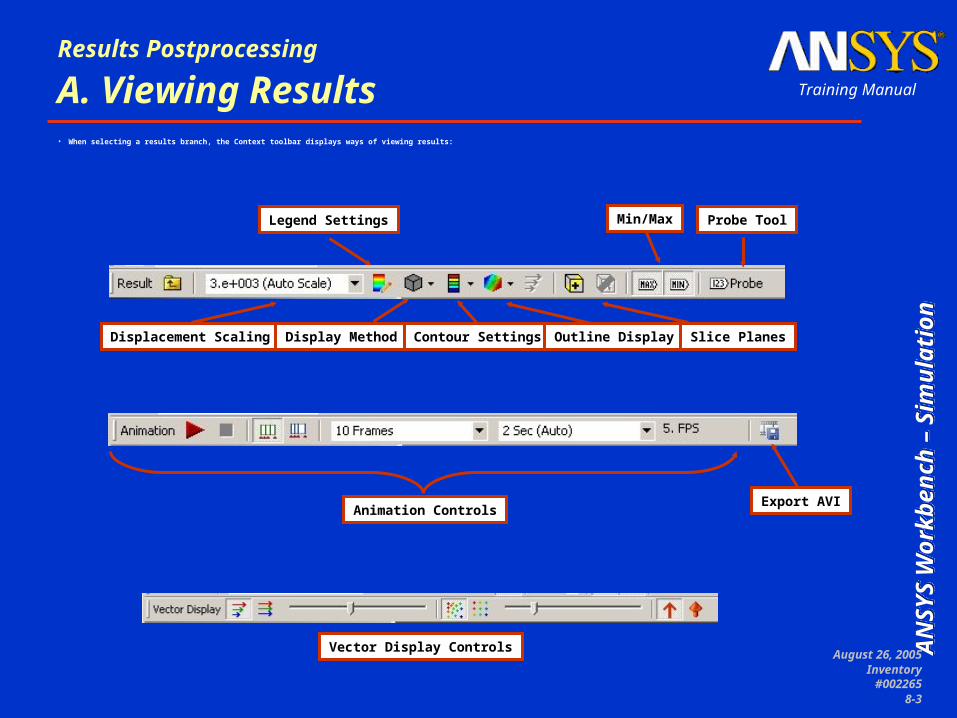
• When selecting a results branch, the Context toolbar displays ways of viewing results:
A. Viewing Results
Animation ControlsExport AVI
Min/Max
Displacement Scaling Display Method Contour Settings Outline Display Slice Planes
Probe ToolLegend Settings
Vector Display Controls
August 26, 2005Inventory
#0022658-4
AN
SY
S W
ork
ben
ch
– Sim
ula
tion
AN
SY
S W
ork
ben
ch
– Sim
ula
tion
AN
SY
S W
ork
ben
ch
– Sim
ula
tion
AN
SY
S W
ork
ben
ch
– Sim
ula
tion
Training Manual
Results Postprocessing
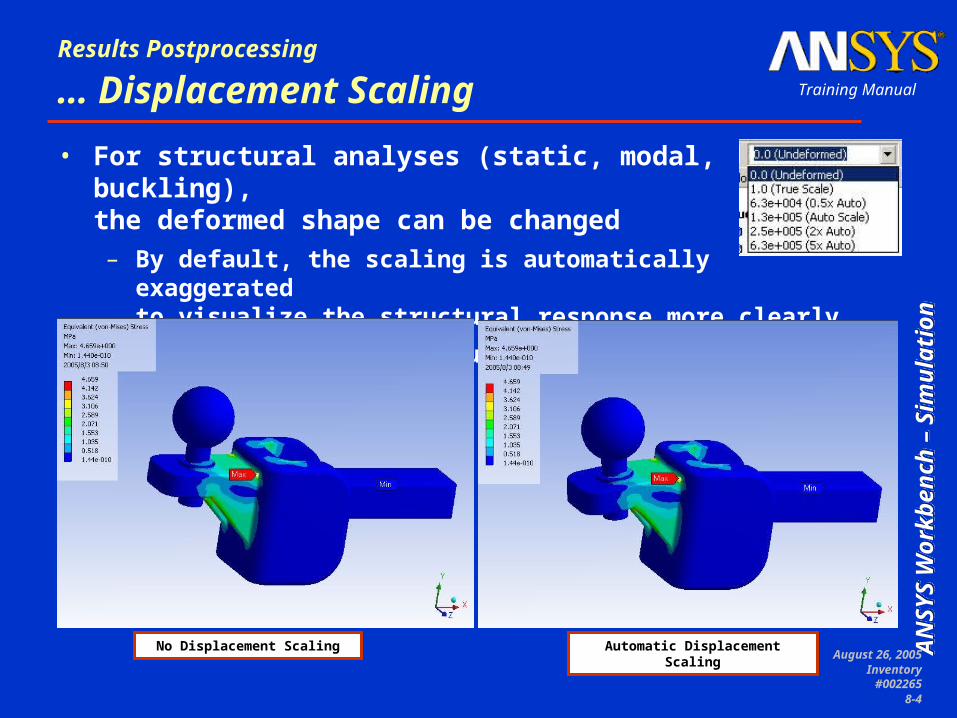
… Displacement Scaling
• For structural analyses (static, modal, buckling), the deformed shape can be changed– By default, the scaling is automatically exaggerated
to visualize the structural response more clearly
– The user can change to undeformed or actual deformation
No Displacement Scaling Automatic Displacement Scaling
August 26, 2005Inventory
#0022658-5
AN
SY
S W
ork
ben
ch
– Sim
ula
tion
AN
SY
S W
ork
ben
ch
– Sim
ula
tion
AN
SY
S W
ork
ben
ch
– Sim
ula
tion
AN
SY
S W
ork
ben
ch
– Sim
ula
tion
Training Manual
Results Postprocessing
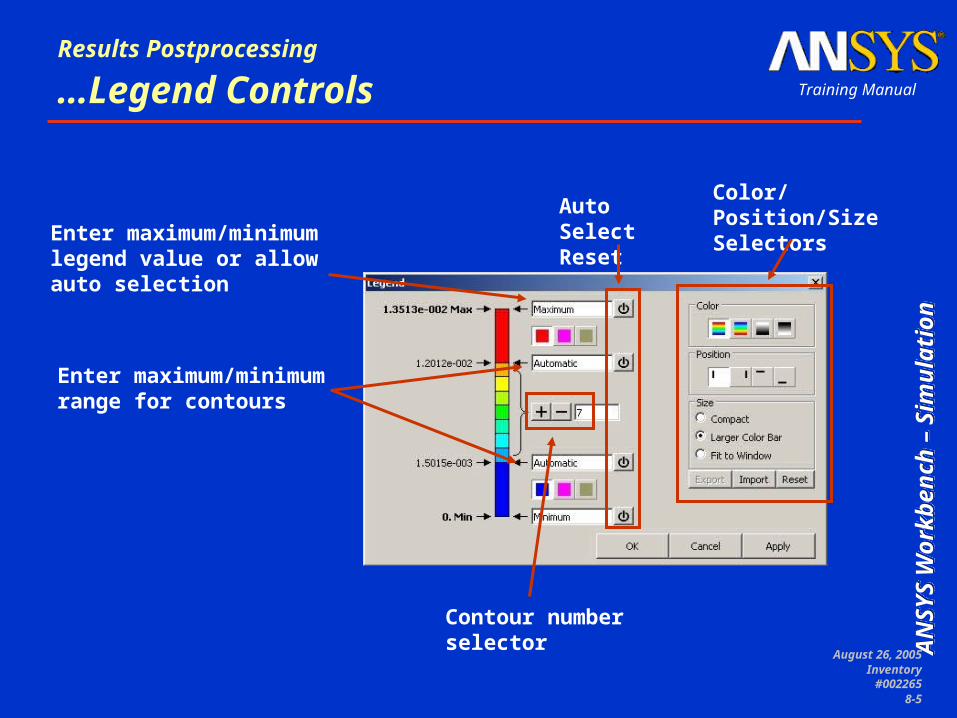
…Legend Controls
Color/Position/Size Selectors
Enter maximum/minimum legend value or allow auto selection
Contour number selector
Auto Select Reset
Enter maximum/minimum range for contours
August 26, 2005Inventory
#0022658-6
AN
SY
S W
ork
ben
ch
– Sim
ula
tion
AN
SY
S W
ork
ben
ch
– Sim
ula
tion
AN
SY
S W
ork
ben
ch
– Sim
ula
tion
AN
SY
S W
ork
ben
ch
– Sim
ula
tion
Training Manual
Results Postprocessing
… Display Method
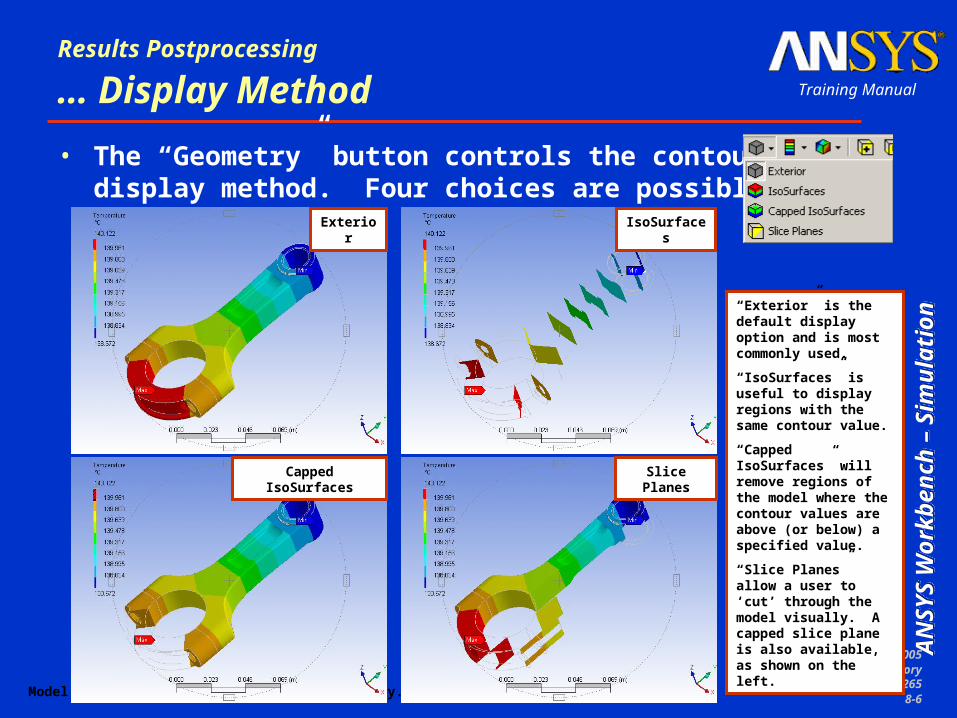
• The “Geometry” button controls the contourdisplay method. Four choices are possible:
“Exterior” is the default display option and is most commonly used.
“IsoSurfaces” is useful to display regions with the same contour value.
“Capped IsoSurfaces” will remove regions of the model where the contour values are above (or below) a specified value.
“Slice Planes” allow a user to ‘cut’ through the model visually. A capped slice plane is also available, as shown on the left.
Model shown is from a sample Inventor assembly.
Slice Planes
IsoSurfacesExterior
Capped IsoSurfaces

August 26, 2005Inventory
#0022658-7
AN
SY
S W
ork
ben
ch
– Sim
ula
tion
AN
SY
S W
ork
ben
ch
– Sim
ula
tion
AN
SY
S W
ork
ben
ch
– Sim
ula
tion
AN
SY
S W
ork
ben
ch
– Sim
ula
tion
Training Manual
Results Postprocessing
… Contour Settings
• The “Contours” button controls the way inwhich contours are shown on the model
Solid Fill
Contour BandsSmooth Contours
Isolines
August 26, 2005Inventory
#0022658-8
AN
SY
S W
ork
ben
ch
– Sim
ula
tion
AN
SY
S W
ork
ben
ch
– Sim
ula
tion
AN
SY
S W
ork
ben
ch
– Sim
ula
tion
AN
SY
S W
ork
ben
ch
– Sim
ula
tion
Training Manual
Results Postprocessing
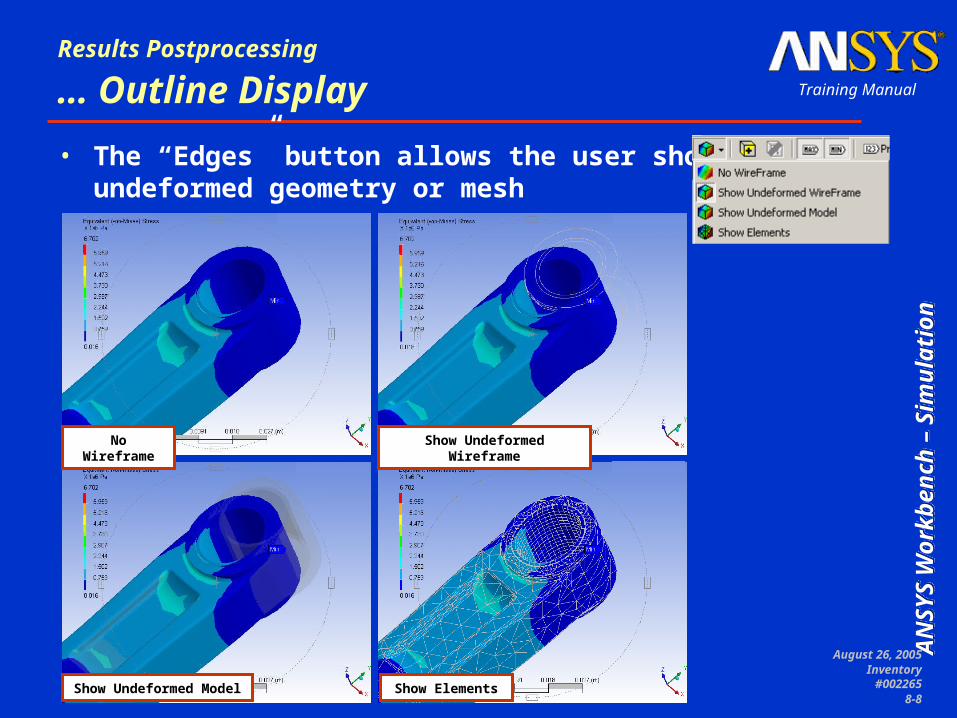
… Outline Display
• The “Edges” button allows the user show theundeformed geometry or mesh
No Wireframe Show Undeformed Wireframe
Show Undeformed Model Show Elements
August 26, 2005Inventory
#0022658-9
AN
SY
S W
ork
ben
ch
– Sim
ula
tion
AN
SY
S W
ork
ben
ch
– Sim
ula
tion
AN
SY
S W
ork
ben
ch
– Sim
ula
tion
AN
SY
S W
ork
ben
ch
– Sim
ula
tion
Training Manual
Results Postprocessing
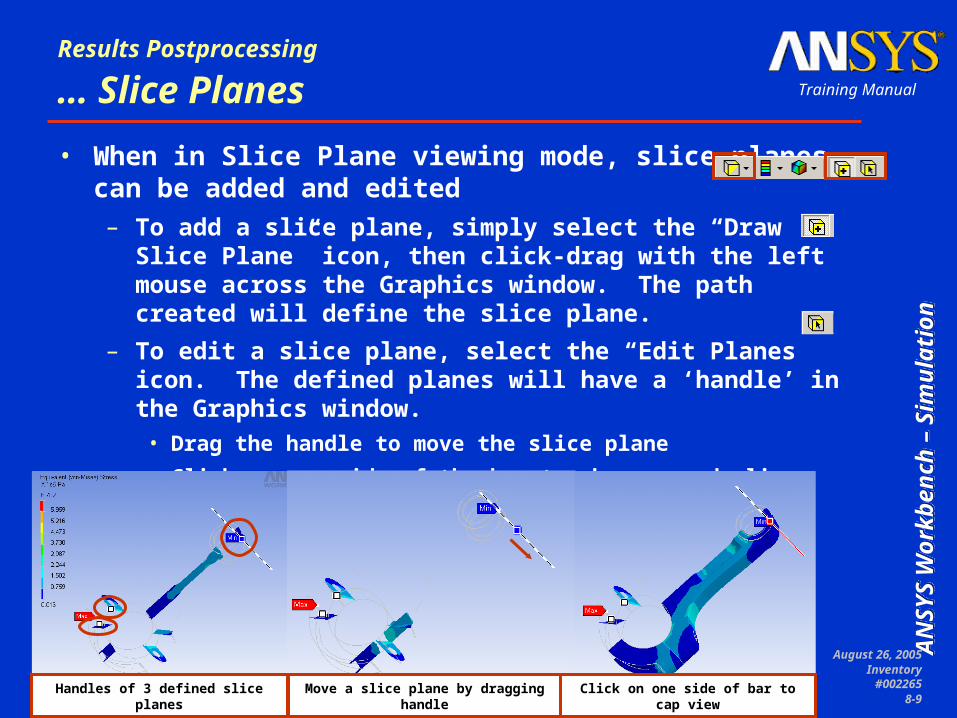
… Slice Planes
• When in Slice Plane viewing mode, slice planescan be added and edited– To add a slice plane, simply select the “Draw Slice Plane”
icon, then click-drag with the left mouse across the Graphics window. The path created will define the slice plane.
– To edit a slice plane, select the “Edit Planes” icon. The defined planes will have a ‘handle’ in the Graphics window.
• Drag the handle to move the slice plane
• Click on one side of the bar to show capped slice display
• Select the handle, then hit the “Delete” key to remove plane
Move a slice plane by dragging handleHandles of 3 defined slice planes Click on one side of bar to cap view
August 26, 2005Inventory
#0022658-10
AN
SY
S W
ork
ben
ch
– Sim
ula
tion
AN
SY
S W
ork
ben
ch
– Sim
ula
tion
AN
SY
S W
ork
ben
ch
– Sim
ula
tion
AN
SY
S W
ork
ben
ch
– Sim
ula
tion
Training Manual
Results Postprocessing
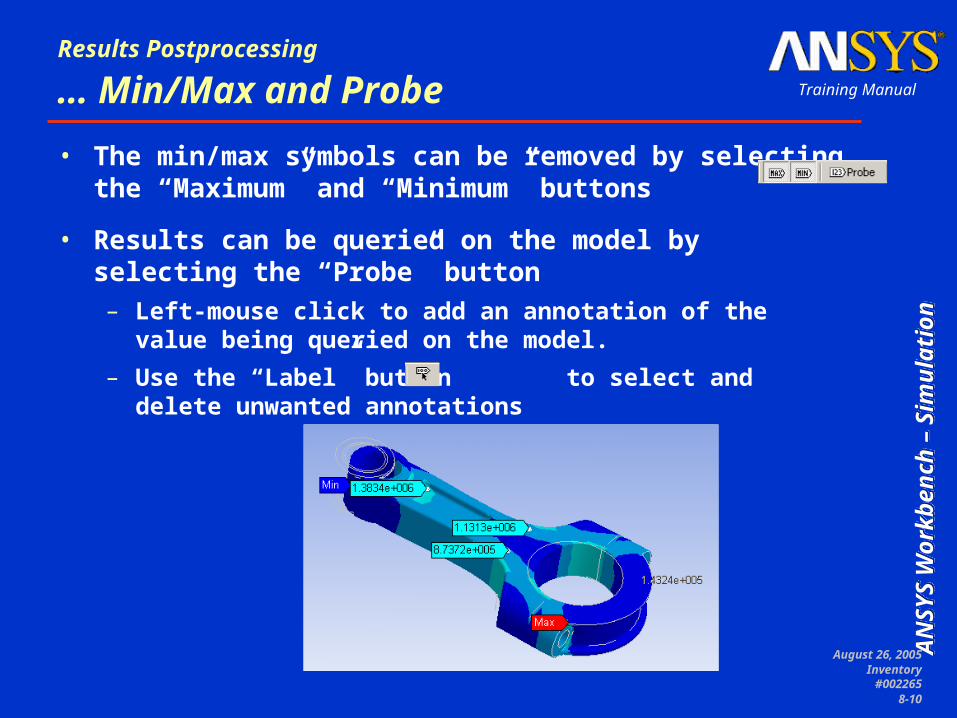
… Min/Max and Probe
• The min/max symbols can be removed by selectingthe “Maximum” and “Minimum” buttons
• Results can be queried on the model by selecting the “Probe” button– Left-mouse click to add an annotation of the value being
queried on the model.
– Use the “Label” button to select and delete unwanted annotations
August 26, 2005Inventory
#0022658-11
AN
SY
S W
ork
ben
ch
– Sim
ula
tion
AN
SY
S W
ork
ben
ch
– Sim
ula
tion
AN
SY
S W
ork
ben
ch
– Sim
ula
tion
AN
SY
S W
ork
ben
ch
– Sim
ula
tion
Training Manual
Results Postprocessing
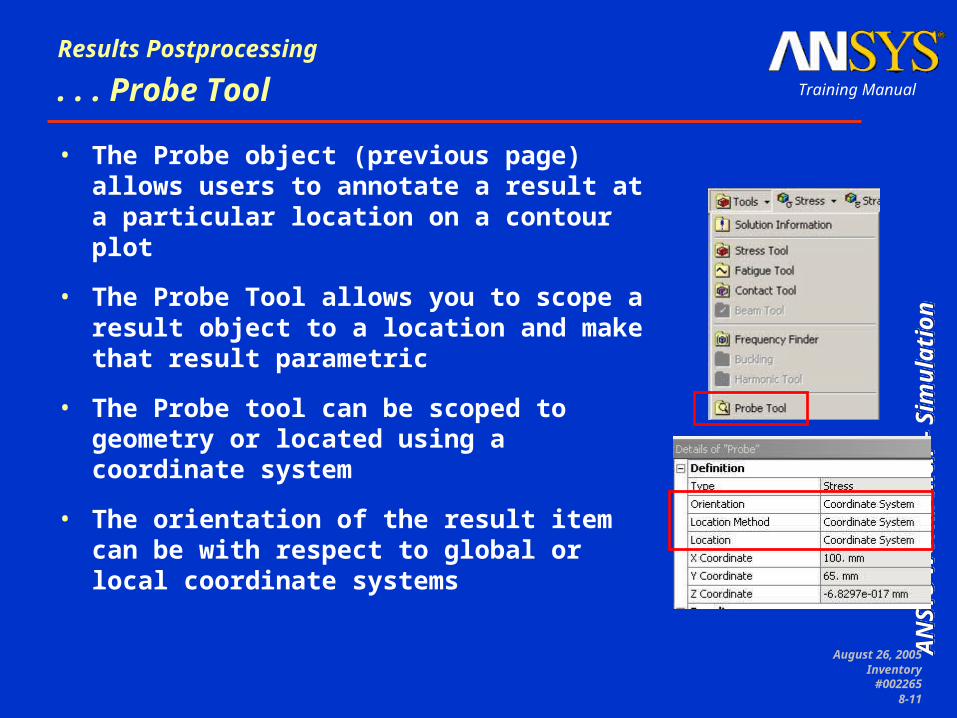
. . . Probe Tool
• The Probe object (previous page) allows users to annotate a result at a particular location on a contour plot
• The Probe Tool allows you to scope a result object to a location and make that result parametric
• The Probe tool can be scoped to geometry or located using a coordinate system
• The orientation of the result item can be with respect to global or local coordinate systems
August 26, 2005Inventory
#0022658-12
AN
SY
S W
ork
ben
ch
– Sim
ula
tion
AN
SY
S W
ork
ben
ch
– Sim
ula
tion
AN
SY
S W
ork
ben
ch
– Sim
ula
tion
AN
SY
S W
ork
ben
ch
– Sim
ula
tion
Training Manual
Results Postprocessing
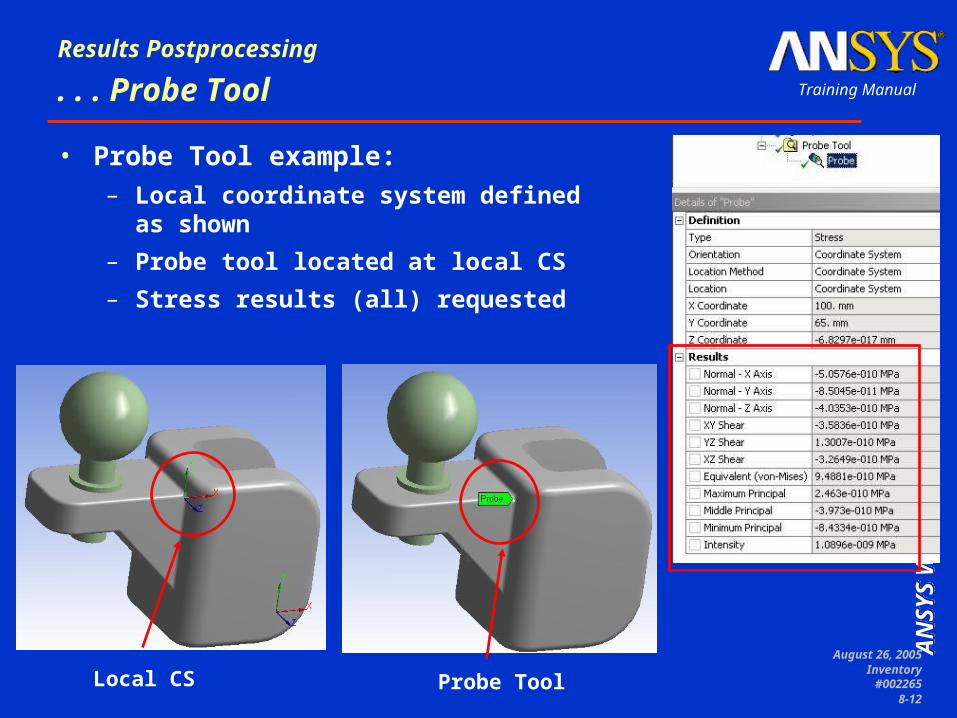
. . . Probe Tool
• Probe Tool example:– Local coordinate system defined as
shown
– Probe tool located at local CS
– Stress results (all) requested
Local CS Probe Tool
August 26, 2005Inventory
#0022658-13
AN
SY
S W
ork
ben
ch
– Sim
ula
tion
AN
SY
S W
ork
ben
ch
– Sim
ula
tion
AN
SY
S W
ork
ben
ch
– Sim
ula
tion
AN
SY
S W
ork
ben
ch
– Sim
ula
tion
Training Manual
Results Postprocessing
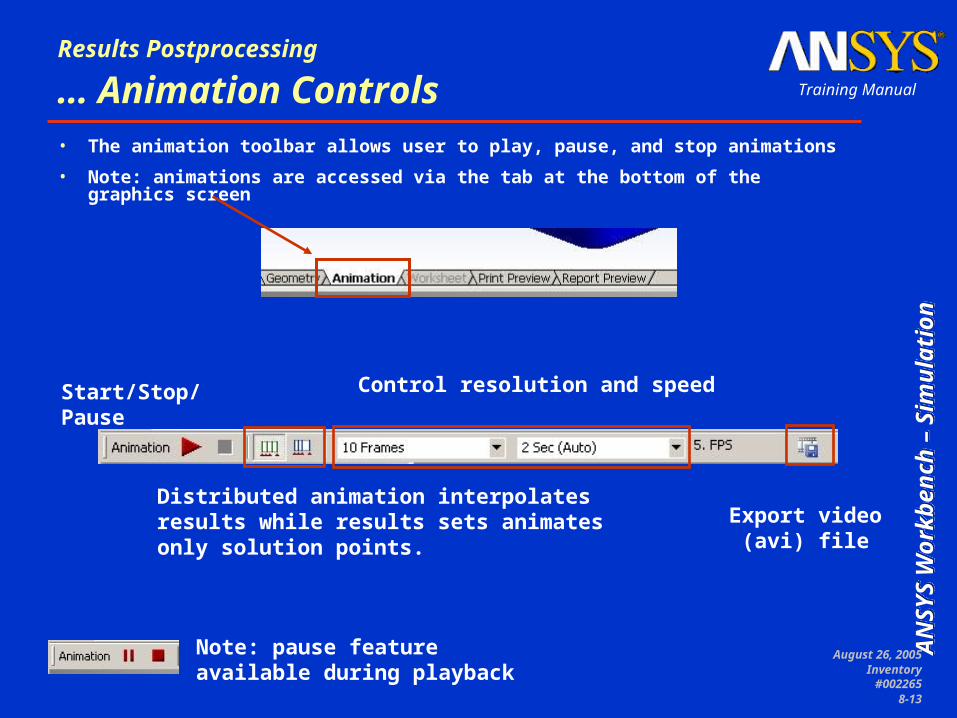
… Animation Controls• The animation toolbar allows user to play, pause, and stop animations
• Note: animations are accessed via the tab at the bottom of the graphics screen
Note: pause feature available during playback
Start/Stop/Pause
Distributed animation interpolates results while results sets animates only solution points.
Export video (avi) file
Control resolution and speed
August 26, 2005Inventory
#0022658-14
AN
SY
S W
ork
ben
ch
– Sim
ula
tion
AN
SY
S W
ork
ben
ch
– Sim
ula
tion
AN
SY
S W
ork
ben
ch
– Sim
ula
tion
AN
SY
S W
ork
ben
ch
– Sim
ula
tion
Training Manual
Results Postprocessing
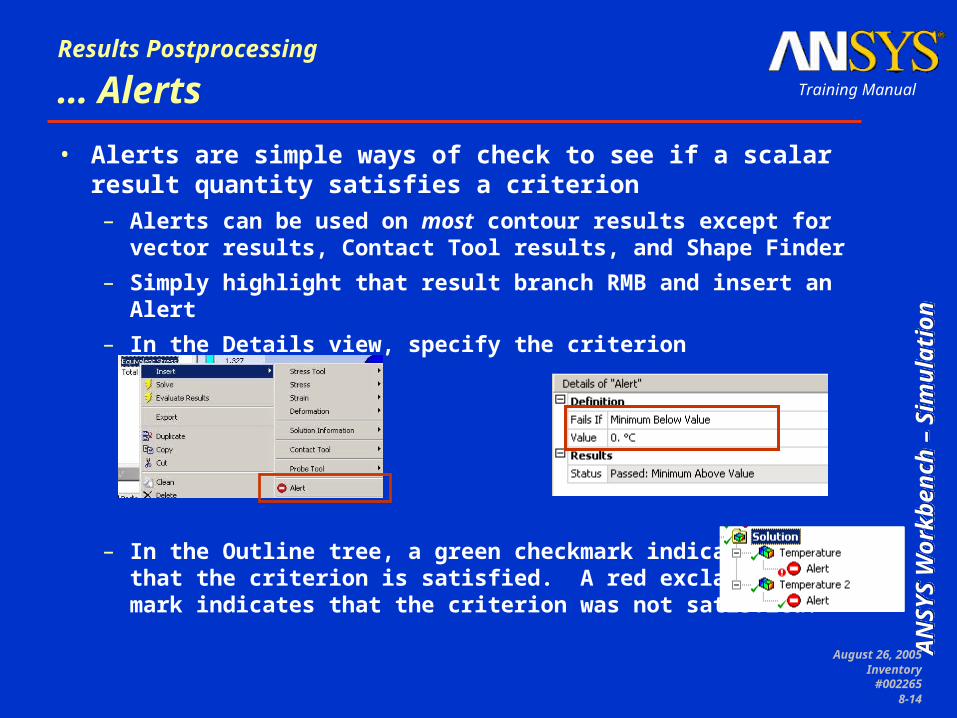
… Alerts
• Alerts are simple ways of check to see if a scalar result quantity satisfies a criterion– Alerts can be used on most contour results except for vector
results, Contact Tool results, and Shape Finder
– Simply highlight that result branch RMB and insert an Alert
– In the Details view, specify the criterion
– In the Outline tree, a green checkmark indicates that the criterion is satisfied. A red exclamation mark indicates that the criterion was not satisfied.
August 26, 2005Inventory
#0022658-15
AN
SY
S W
ork
ben
ch
– Sim
ula
tion
AN
SY
S W
ork
ben
ch
– Sim
ula
tion
AN
SY
S W
ork
ben
ch
– Sim
ula
tion
AN
SY
S W
ork
ben
ch
– Sim
ula
tion
Training Manual
Results Postprocessing
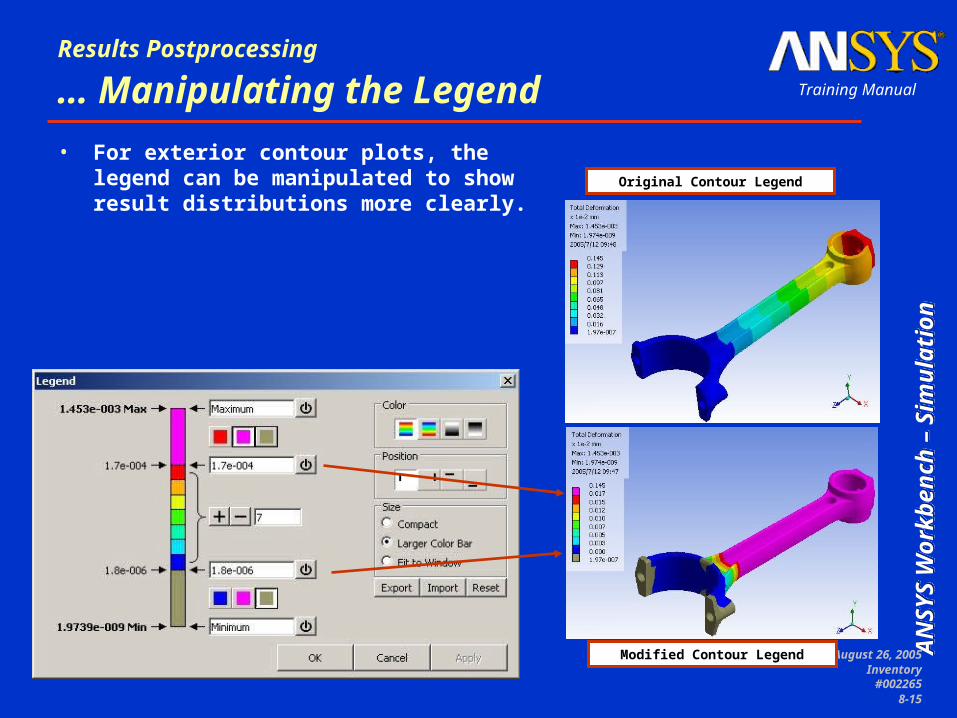
… Manipulating the Legend
• For exterior contour plots, the legend can be manipulated to show result distributions more clearly.
Original Contour Legend
Modified Contour Legend
August 26, 2005Inventory
#0022658-16
AN
SY
S W
ork
ben
ch
– Sim
ula
tion
AN
SY
S W
ork
ben
ch
– Sim
ula
tion
AN
SY
S W
ork
ben
ch
– Sim
ula
tion
AN
SY
S W
ork
ben
ch
– Sim
ula
tion
Training Manual
Results Postprocessing
… Manipulating the Legend
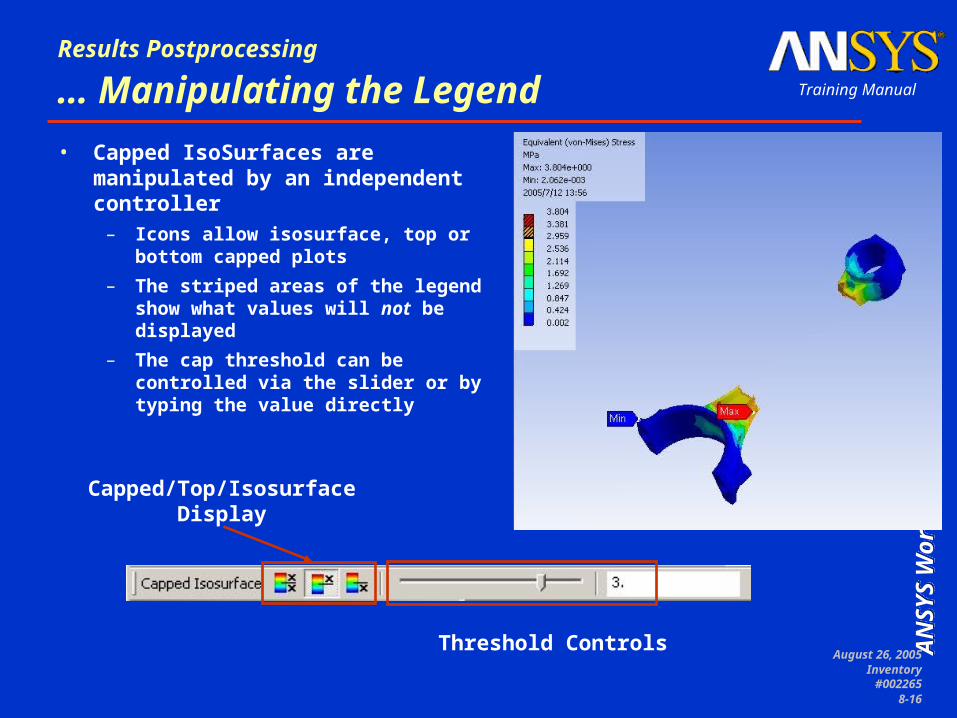
• Capped IsoSurfaces are manipulated by an independent controller
– Icons allow isosurface, top or bottom capped plots
– The striped areas of the legend show what values will not be displayed
– The cap threshold can be controlled via the slider or by typing the value directly
Capped/Top/Isosurface Display
Threshold Controls
August 26, 2005Inventory
#0022658-17
AN
SY
S W
ork
ben
ch
– Sim
ula
tion
AN
SY
S W
ork
ben
ch
– Sim
ula
tion
AN
SY
S W
ork
ben
ch
– Sim
ula
tion
AN
SY
S W
ork
ben
ch
– Sim
ula
tion
Training Manual
Results Postprocessing
… Vector Plots
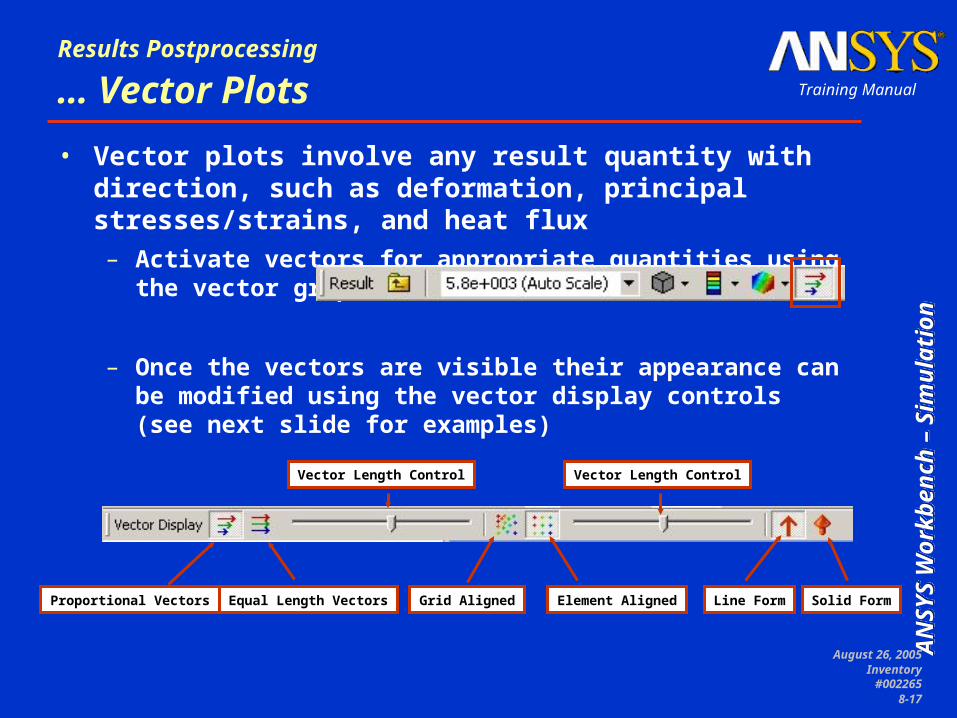
• Vector plots involve any result quantity with direction, such as deformation, principal stresses/strains, and heat flux– Activate vectors for appropriate quantities using the vector
graphics icon
– Once the vectors are visible their appearance can be modified using the vector display controls (see next slide for examples)
Proportional Vectors Equal Length Vectors
Vector Length Control
Element AlignedGrid Aligned Line Form Solid Form
Vector Length Control
August 26, 2005Inventory
#0022658-18
AN
SY
S W
ork
ben
ch
– Sim
ula
tion
AN
SY
S W
ork
ben
ch
– Sim
ula
tion
AN
SY
S W
ork
ben
ch
– Sim
ula
tion
AN
SY
S W
ork
ben
ch
– Sim
ula
tion
Training Manual
Results Postprocessing
… Vector Plots
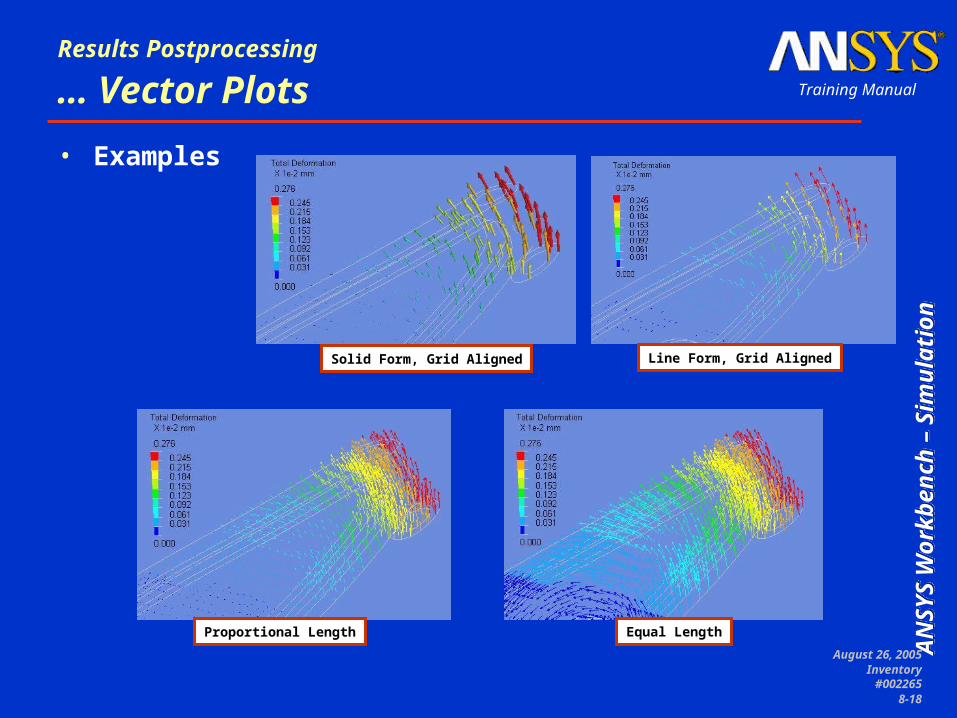
• Examples
Solid Form, Grid Aligned Line Form, Grid Aligned
Proportional Length Equal Length
August 26, 2005Inventory
#0022658-19
AN
SY
S W
ork
ben
ch
– Sim
ula
tion
AN
SY
S W
ork
ben
ch
– Sim
ula
tion
AN
SY
S W
ork
ben
ch
– Sim
ula
tion
AN
SY
S W
ork
ben
ch
– Sim
ula
tion
Training Manual
Results Postprocessing
… Multiple Viewports
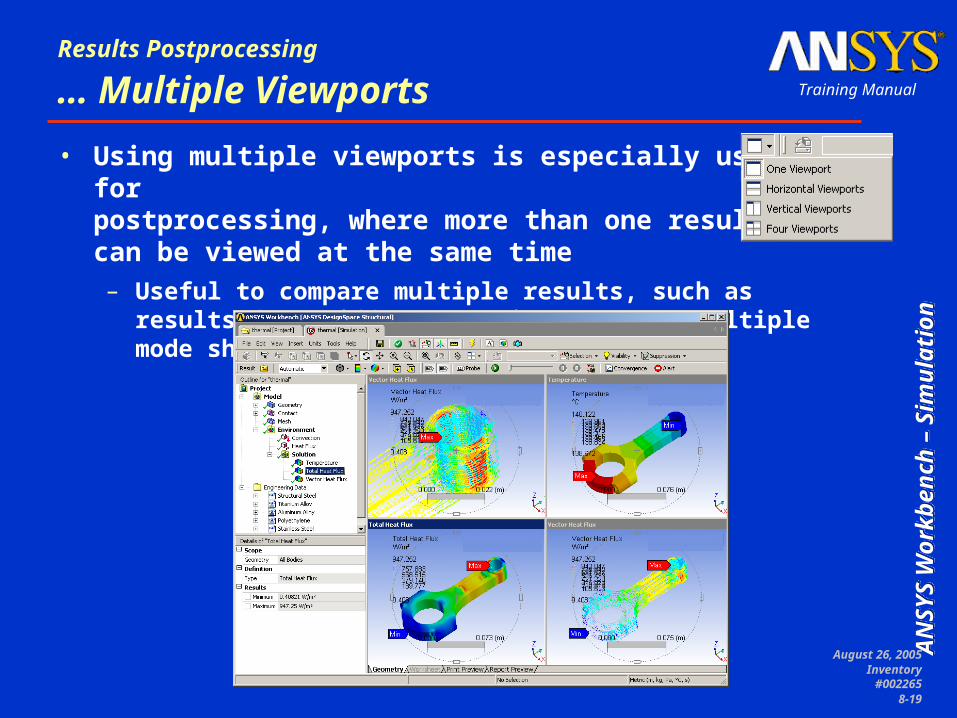
• Using multiple viewports is especially useful forpostprocessing, where more than one resultcan be viewed at the same time– Useful to compare multiple results, such as results from
different environments or multiple mode shapes
August 26, 2005Inventory
#0022658-20
AN
SY
S W
ork
ben
ch
– Sim
ula
tion
AN
SY
S W
ork
ben
ch
– Sim
ula
tion
AN
SY
S W
ork
ben
ch
– Sim
ula
tion
AN
SY
S W
ork
ben
ch
– Sim
ula
tion
Training Manual
Results Postprocessing
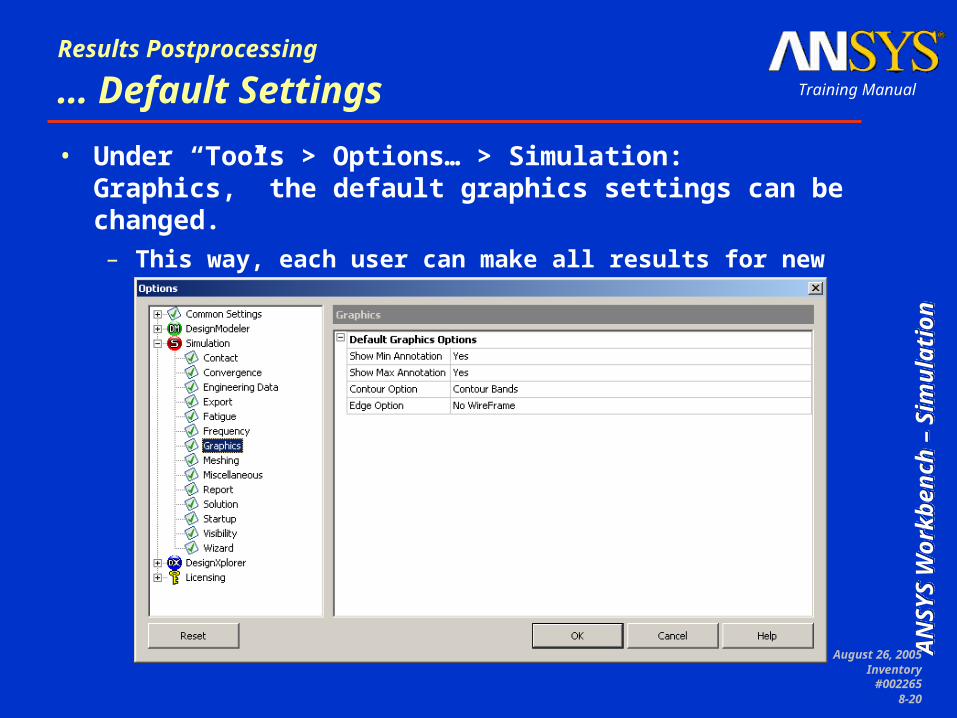
… Default Settings
• Under “Tools > Options… > Simulation: Graphics,” the default graphics settings can be changed.– This way, each user can make all results for new simulations
be displayed to his/her preference
August 26, 2005Inventory
#0022658-21
AN
SY
S W
ork
ben
ch
– Sim
ula
tion
AN
SY
S W
ork
ben
ch
– Sim
ula
tion
AN
SY
S W
ork
ben
ch
– Sim
ula
tion
AN
SY
S W
ork
ben
ch
– Sim
ula
tion
Training Manual
Results Postprocessing
B. Scoping Results
• Sometimes, limiting the display of results is useful when postprocessing– Scoping automatically scales the legend and only shows the
applicable surface(s) or part(s), making result viewing easier
– Scoping results on edges produces a path plot, allowing users to see detailed results along selected edges
– Results scoping is very useful for convergence controls (discussed later in this chapter)
– When using Contact Tool, Simulation automatically scopes contact results to contact regions.
• Results scoping can be performed on any result item in the Solution branch for any type of geometric quantity
August 26, 2005Inventory
#0022658-22
AN
SY
S W
ork
ben
ch
– Sim
ula
tion
AN
SY
S W
ork
ben
ch
– Sim
ula
tion
AN
SY
S W
ork
ben
ch
– Sim
ula
tion
AN
SY
S W
ork
ben
ch
– Sim
ula
tion
Training Manual
Results Postprocessing
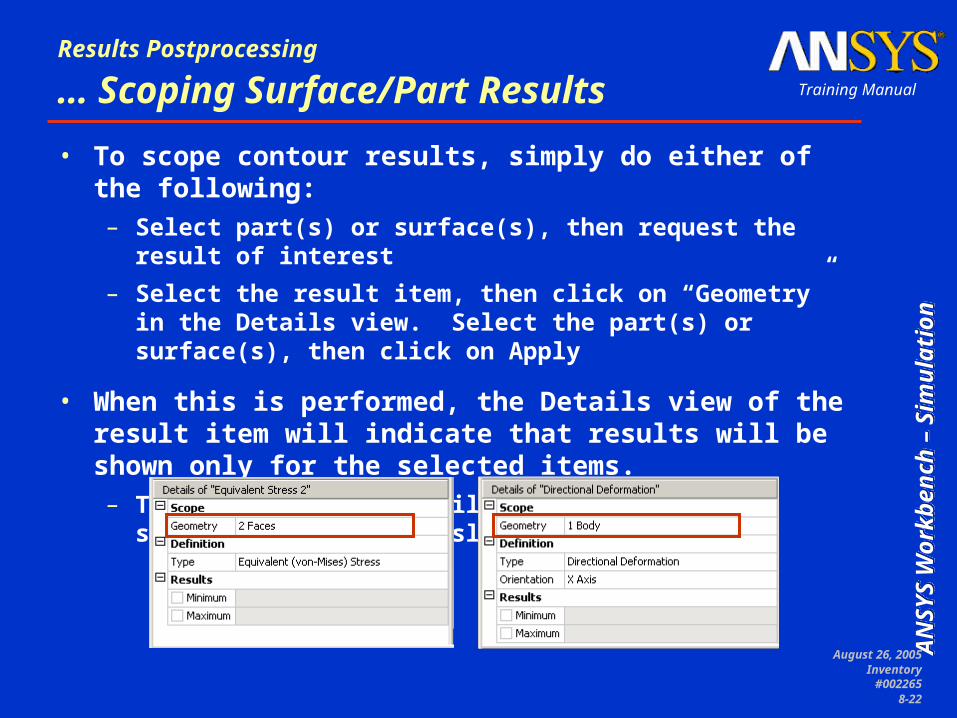
… Scoping Surface/Part Results
• To scope contour results, simply do either of the following:– Select part(s) or surface(s), then request the result of interest
– Select the result item, then click on “Geometry” in the Details view. Select the part(s) or surface(s), then click on Apply
• When this is performed, the Details view of the result item will indicate that results will be shown only for the selected items.– The displayed values will show non-selected surfaces/parts as
translucent.
August 26, 2005Inventory
#0022658-23
AN
SY
S W
ork
ben
ch
– Sim
ula
tion
AN
SY
S W
ork
ben
ch
– Sim
ula
tion
AN
SY
S W
ork
ben
ch
– Sim
ula
tion
AN
SY
S W
ork
ben
ch
– Sim
ula
tion
Training Manual
Results Postprocessing
… Scoping Surface/Part Results
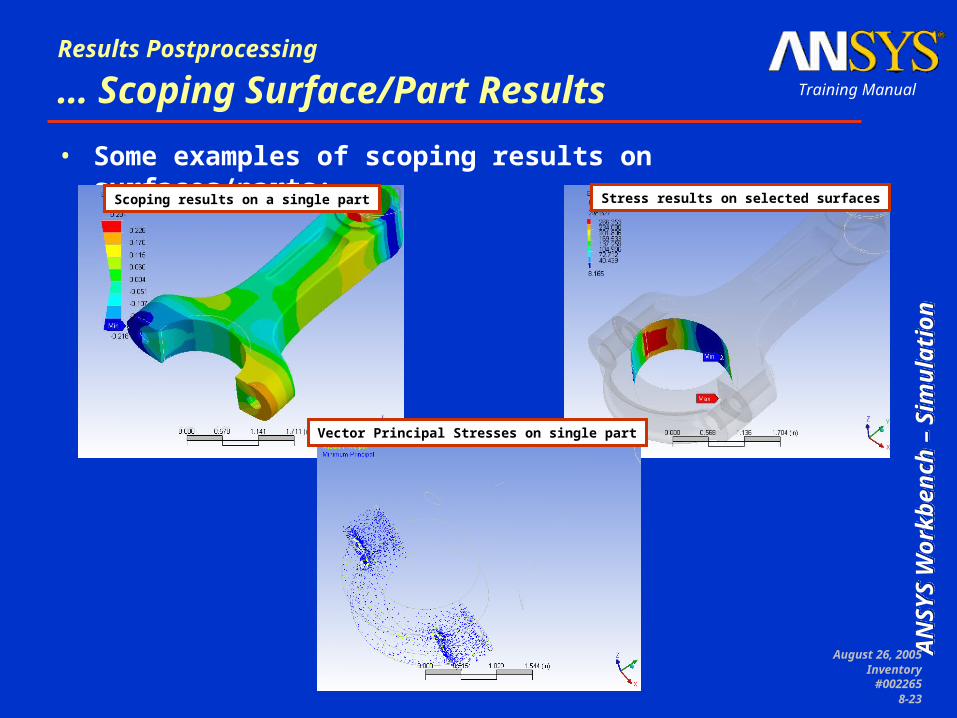
• Some examples of scoping results on surfaces/parts:
Scoping results on a single part Stress results on selected surfaces
Vector Principal Stresses on single part
August 26, 2005Inventory
#0022658-24
AN
SY
S W
ork
ben
ch
– Sim
ula
tion
AN
SY
S W
ork
ben
ch
– Sim
ula
tion
AN
SY
S W
ork
ben
ch
– Sim
ula
tion
AN
SY
S W
ork
ben
ch
– Sim
ula
tion
Training Manual
Results Postprocessing
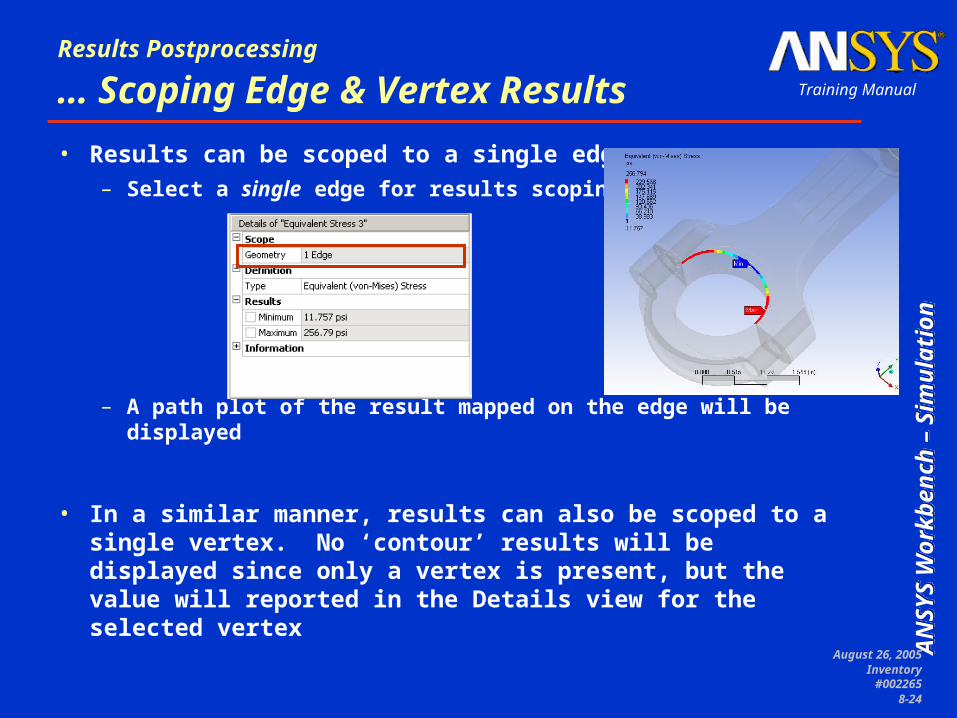
… Scoping Edge & Vertex Results
• Results can be scoped to a single edge– Select a single edge for results scoping
– A path plot of the result mapped on the edge will be displayed
• In a similar manner, results can also be scoped to a single vertex. No ‘contour’ results will be displayed since only a vertex is present, but the value will reported in the Details view for the selected vertex
August 26, 2005Inventory
#0022658-25
AN
SY
S W
ork
ben
ch
– Sim
ula
tion
AN
SY
S W
ork
ben
ch
– Sim
ula
tion
AN
SY
S W
ork
ben
ch
– Sim
ula
tion
AN
SY
S W
ork
ben
ch
– Sim
ula
tion
Training Manual
Results Postprocessing
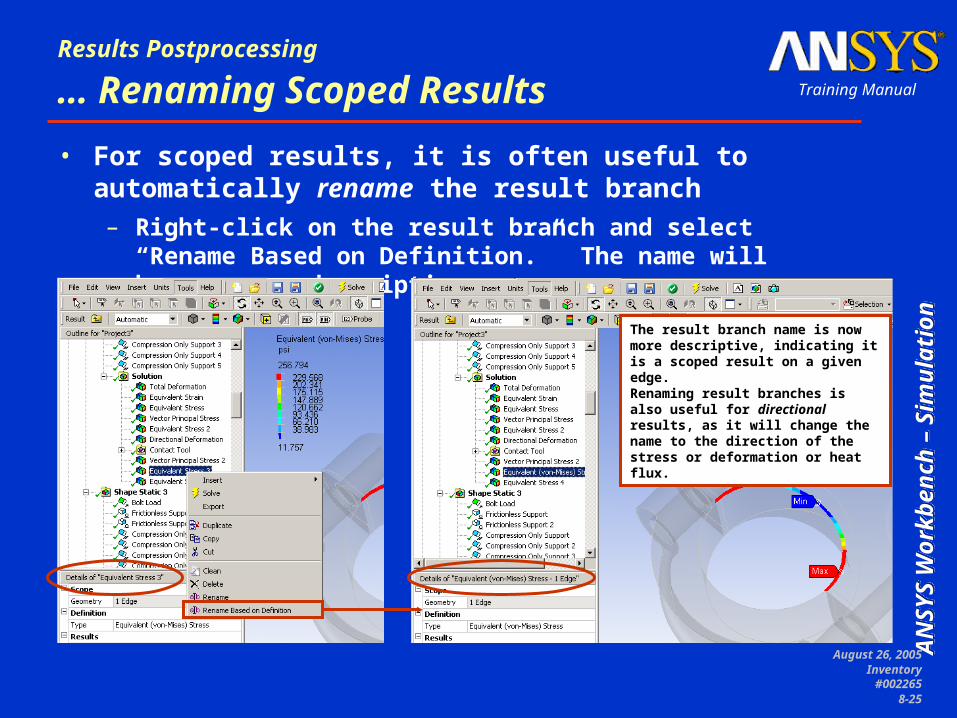
… Renaming Scoped Results
• For scoped results, it is often useful to automatically rename the result branch– Right-click on the result branch and select “Rename Based on
Definition.” The name will become more descriptive.
The result branch name is now more descriptive, indicating it is a scoped result on a given edge.Renaming result branches is also useful for directional results, as it will change the name to the direction of the stress or deformation or heat flux.
August 26, 2005Inventory
#0022658-26
AN
SY
S W
ork
ben
ch
– Sim
ula
tion
AN
SY
S W
ork
ben
ch
– Sim
ula
tion
AN
SY
S W
ork
ben
ch
– Sim
ula
tion
AN
SY
S W
ork
ben
ch
– Sim
ula
tion
Training Manual
Results Postprocessing
C. Exporting Results
• Tabular data from Simulation can be exported to Excel for further data manipulation
• To export Worksheet tab information, do the following:– Select the branch and click on the Worksheet tab
– Right-click the same branch and select “Export”
– This can be used for Geometry, Contact, Environment, Frequency Finder, Buckling, and Harmonic Worksheets
• To export Contour Results– Right-click on the result branch of interest and select “Export”
– This can be used for any result item of interest
– Node numbers and result quantities will be exported
– Exporting large amounts of data can take some CPU time
August 26, 2005Inventory
#0022658-27
AN
SY
S W
ork
ben
ch
– Sim
ula
tion
AN
SY
S W
ork
ben
ch
– Sim
ula
tion
AN
SY
S W
ork
ben
ch
– Sim
ula
tion
AN
SY
S W
ork
ben
ch
– Sim
ula
tion
Training Manual
Results Postprocessing
… Exporting Results
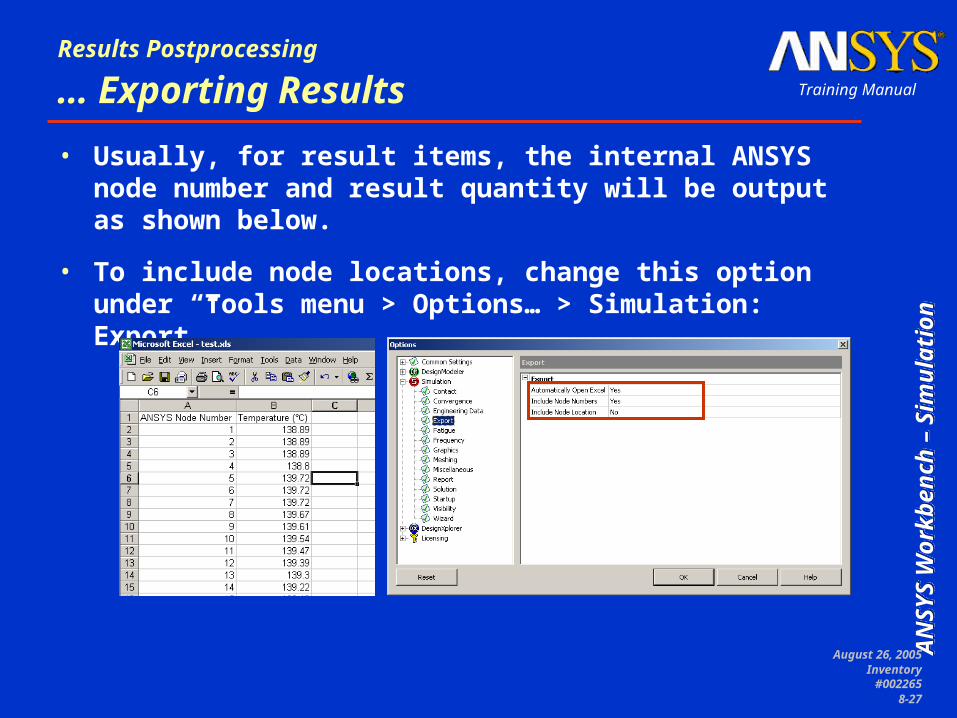
• Usually, for result items, the internal ANSYS node number and result quantity will be output as shown below.
• To include node locations, change this option under “Tools menu > Options… > Simulation: Export”
August 26, 2005Inventory
#0022658-28
AN
SY
S W
ork
ben
ch
– Sim
ula
tion
AN
SY
S W
ork
ben
ch
– Sim
ula
tion
AN
SY
S W
ork
ben
ch
– Sim
ula
tion
AN
SY
S W
ork
ben
ch
– Sim
ula
tion
Training Manual
Results Postprocessing
… Exporting Results
• For principal stresses and strains, additional information of the orientation needs to be included when export to .XLS:– The generated Excel file will have 6 fields:
• The first three correspond to the maximum, middle and minimum principal quantities (stresses or strains).
• The last three correspond to the ANSYS Euler angle sequence (CLOCAL command in ANSYS) required to produce a coordinate system whose X, Y and Z-axis are the directions of maximum, middle and minimum principal quantities, respectively. This Euler angle sequence is ThetaXY, ThetaYZ and ThetaZX and orients the principal coordinate system relative to the global system.
August 26, 2005Inventory
#0022658-29
AN
SY
S W
ork
ben
ch
– Sim
ula
tion
AN
SY
S W
ork
ben
ch
– Sim
ula
tion
AN
SY
S W
ork
ben
ch
– Sim
ula
tion
AN
SY
S W
ork
ben
ch
– Sim
ula
tion
Training Manual
Results Postprocessing
D. Coordinate Systems
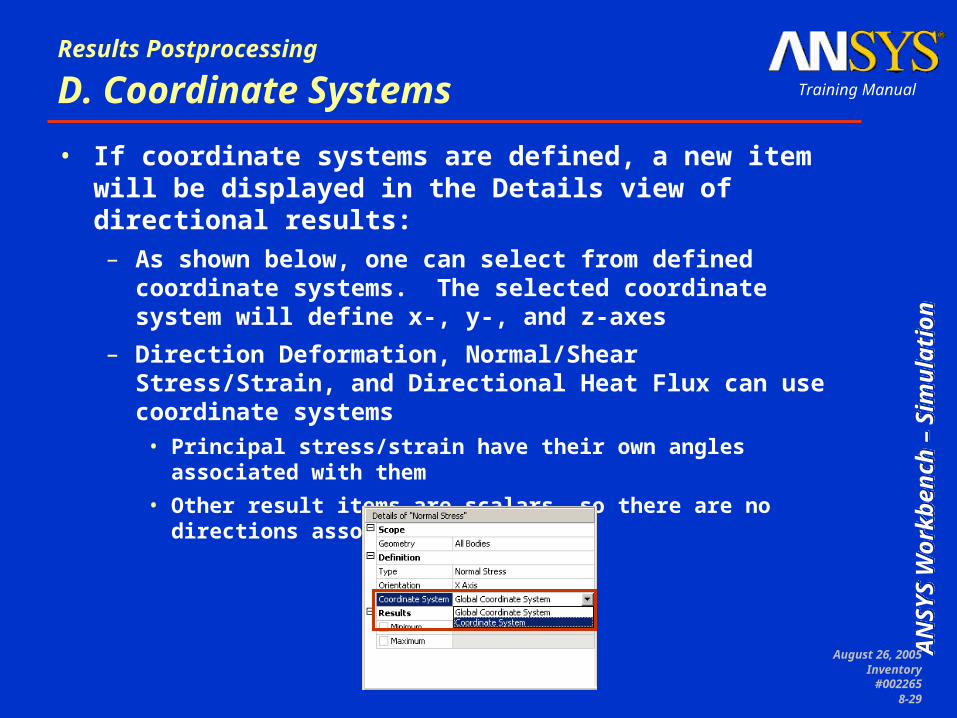
• If coordinate systems are defined, a new item will be displayed in the Details view of directional results:– As shown below, one can select from defined coordinate
systems. The selected coordinate system will define x-, y-, and z-axes
– Direction Deformation, Normal/Shear Stress/Strain, and Directional Heat Flux can use coordinate systems
• Principal stress/strain have their own angles associated with them
• Other result items are scalars, so there are no directions associated with it
August 26, 2005Inventory
#0022658-30
AN
SY
S W
ork
ben
ch
– Sim
ula
tion
AN
SY
S W
ork
ben
ch
– Sim
ula
tion
AN
SY
S W
ork
ben
ch
– Sim
ula
tion
AN
SY
S W
ork
ben
ch
– Sim
ula
tion
Training Manual
Results Postprocessing
… Coordinate Systems
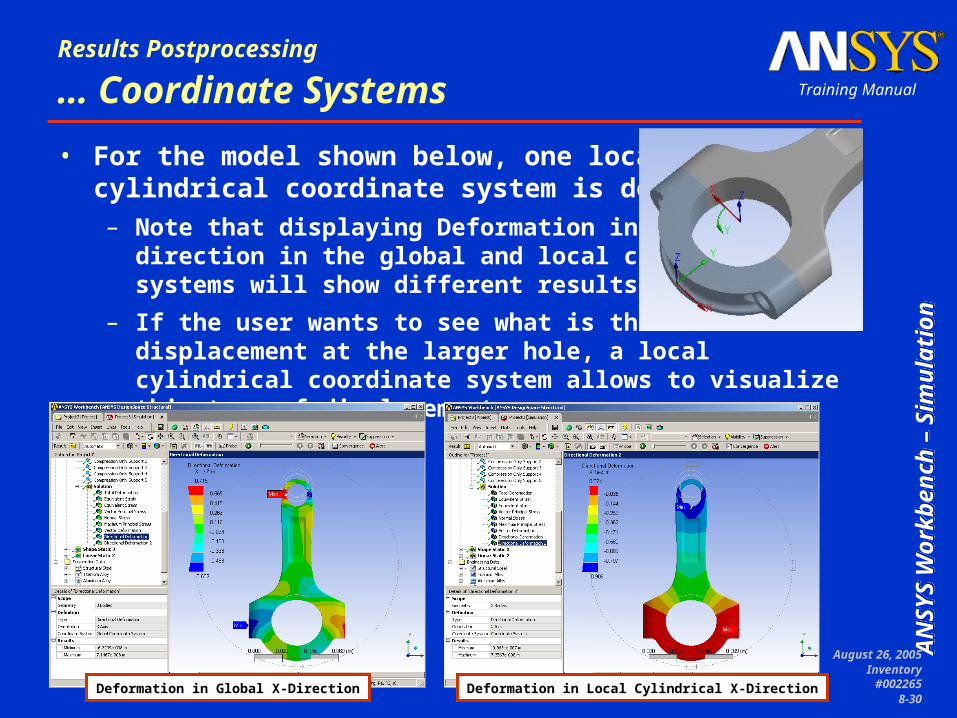
• For the model shown below, one localcylindrical coordinate system is defined– Note that displaying Deformation in the x-
direction in the global and local coordinatesystems will show different results.
– If the user wants to see what is the radialdisplacement at the larger hole, a local cylindrical coordinate system allows to visualize this type of displacement.
Deformation in Global X-Direction Deformation in Local Cylindrical X-Direction
August 26, 2005Inventory
#0022658-31
AN
SY
S W
ork
ben
ch
– Sim
ula
tion
AN
SY
S W
ork
ben
ch
– Sim
ula
tion
AN
SY
S W
ork
ben
ch
– Sim
ula
tion
AN
SY
S W
ork
ben
ch
– Sim
ula
tion
Training Manual
Results Postprocessing
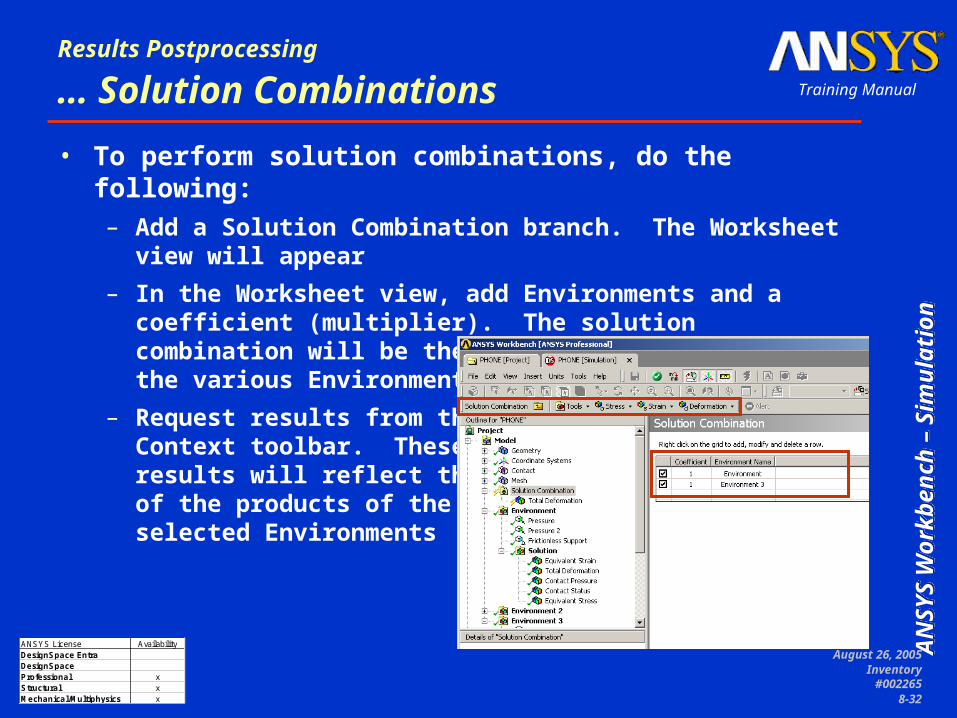
E. Solution Combinations
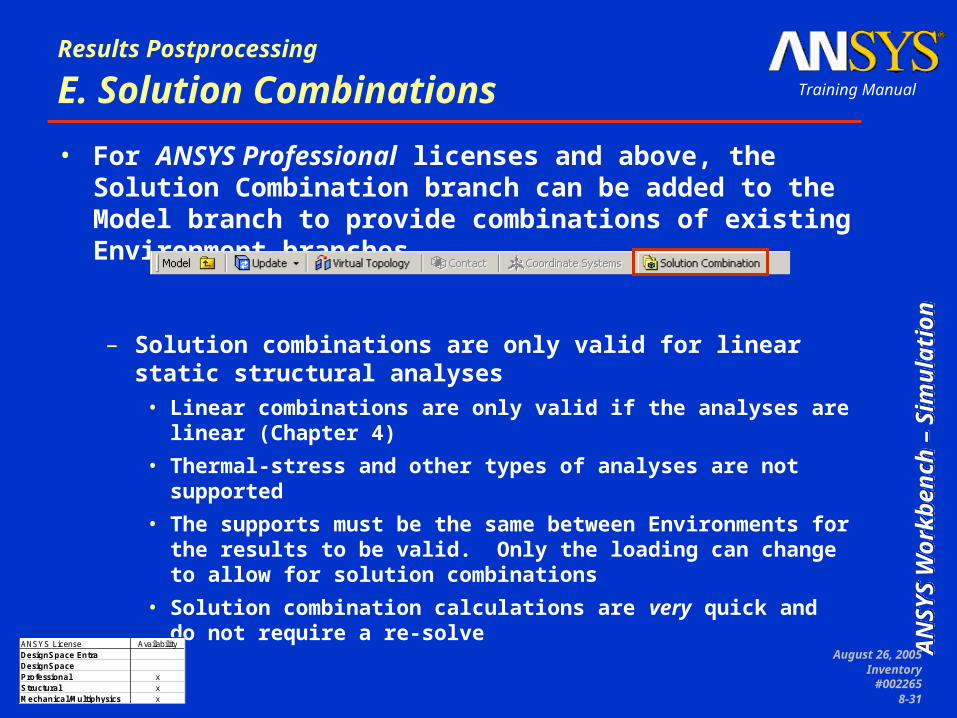
• For ANSYS Professional licenses and above, the Solution Combination branch can be added to the Model branch to provide combinations of existing Environment branches
– Solution combinations are only valid for linear static structural analyses
• Linear combinations are only valid if the analyses are linear (Chapter 4)
• Thermal-stress and other types of analyses are not supported
• The supports must be the same between Environments for the results to be valid. Only the loading can change to allow for solution combinations
• Solution combination calculations are very quick and do not require a re-solve
ANSYS License AvailabilityDesignSpace EntraDesignSpaceProfessional xStructural xMechanical/Multiphysics x
August 26, 2005Inventory
#0022658-32
AN
SY
S W
ork
ben
ch
– Sim
ula
tion
AN
SY
S W
ork
ben
ch
– Sim
ula
tion
AN
SY
S W
ork
ben
ch
– Sim
ula
tion
AN
SY
S W
ork
ben
ch
– Sim
ula
tion
Training Manual
Results Postprocessing
… Solution Combinations
• To perform solution combinations, do the following:– Add a Solution Combination branch. The Worksheet view will
appear
– In the Worksheet view, add Environments and a coefficient (multiplier). The solution combination will be the sum of the multiples of the various Environments selected.
– Request results from the Context toolbar. These results will reflect the sum of the products of the selected Environments
ANSYS License AvailabilityDesignSpace EntraDesignSpaceProfessional xStructural xMechanical/Multiphysics x
August 26, 2005Inventory
#0022658-33
AN
SY
S W
ork
ben
ch
– Sim
ula
tion
AN
SY
S W
ork
ben
ch
– Sim
ula
tion
AN
SY
S W
ork
ben
ch
– Sim
ula
tion
AN
SY
S W
ork
ben
ch
– Sim
ula
tion
Training Manual
Results Postprocessing
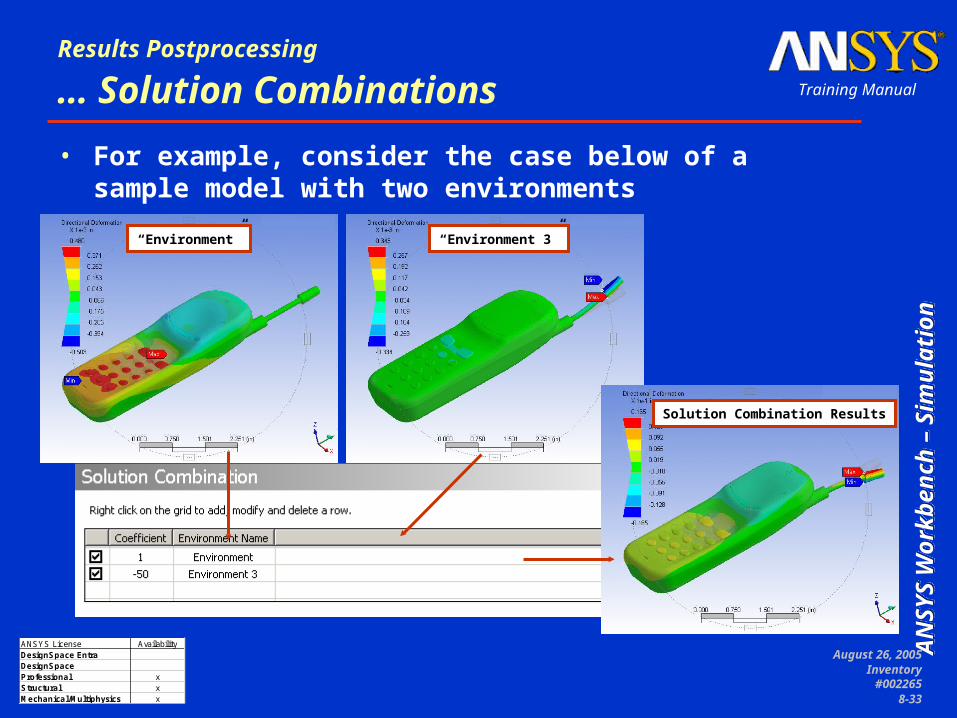
… Solution Combinations
• For example, consider the case below of a sample model with two environments
ANSYS License AvailabilityDesignSpace EntraDesignSpaceProfessional xStructural xMechanical/Multiphysics x
“Environment” “Environment 3”
Solution Combination Results
August 26, 2005Inventory
#0022658-34
AN
SY
S W
ork
ben
ch
– Sim
ula
tion
AN
SY
S W
ork
ben
ch
– Sim
ula
tion
AN
SY
S W
ork
ben
ch
– Sim
ula
tion
AN
SY
S W
ork
ben
ch
– Sim
ula
tion
Training Manual
Results Postprocessing
F. Stress Singularities
• In most finite-element analyses as the mesh is refined one expects to get mathematically more precise results.– Quantities directly solved for (degrees of freedom) such as
displacements and temperatures, converge without problems
– Derived quantities, such as stresses, strains, and heat flux, should also converge as the mesh is refined, but not as fast or smooth as DOF
– In some cases derived quantities such as stresses and heat flux will not converge as the mesh is refined. These are situations where these values are artificially high
August 26, 2005Inventory
#0022658-35
AN
SY
S W
ork
ben
ch
– Sim
ula
tion
AN
SY
S W
ork
ben
ch
– Sim
ula
tion
AN
SY
S W
ork
ben
ch
– Sim
ula
tion
AN
SY
S W
ork
ben
ch
– Sim
ula
tion
Training Manual
Results Postprocessing
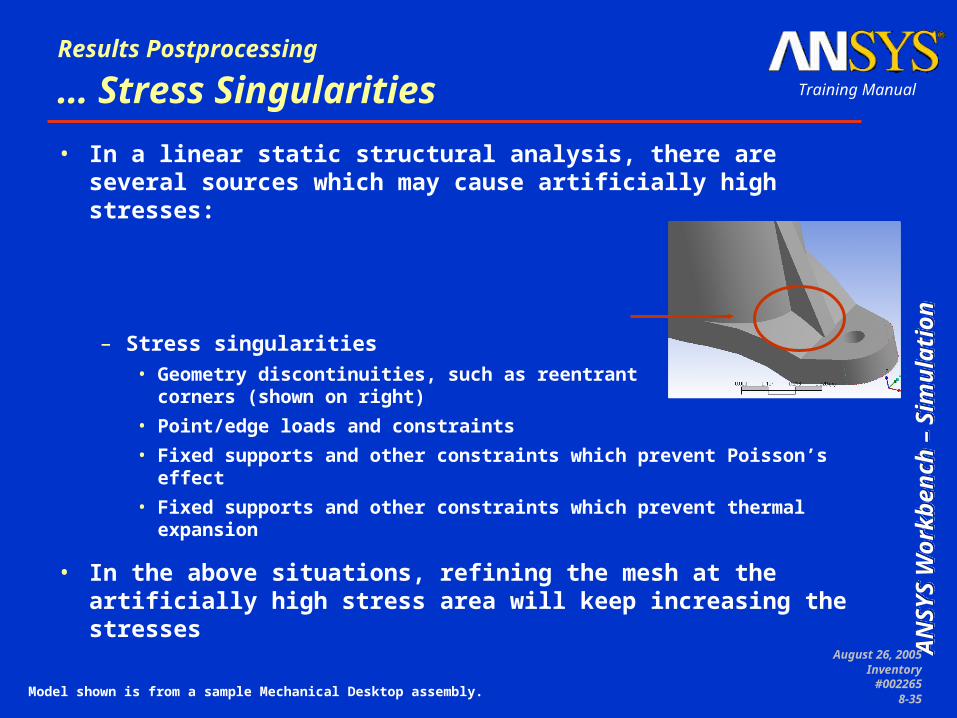
… Stress Singularities
• In a linear static structural analysis, there are several sources which may cause artificially high stresses:
– Stress singularities• Geometry discontinuities, such as reentrant
corners (shown on right)
• Point/edge loads and constraints
• Fixed supports and other constraints which prevent Poisson’s effect
• Fixed supports and other constraints which prevent thermal expansion
• In the above situations, refining the mesh at the artificially high stress area will keep increasing the stresses
Model shown is from a sample Mechanical Desktop assembly.
August 26, 2005Inventory
#0022658-36
AN
SY
S W
ork
ben
ch
– Sim
ula
tion
AN
SY
S W
ork
ben
ch
– Sim
ula
tion
AN
SY
S W
ork
ben
ch
– Sim
ula
tion
AN
SY
S W
ork
ben
ch
– Sim
ula
tion
Training Manual
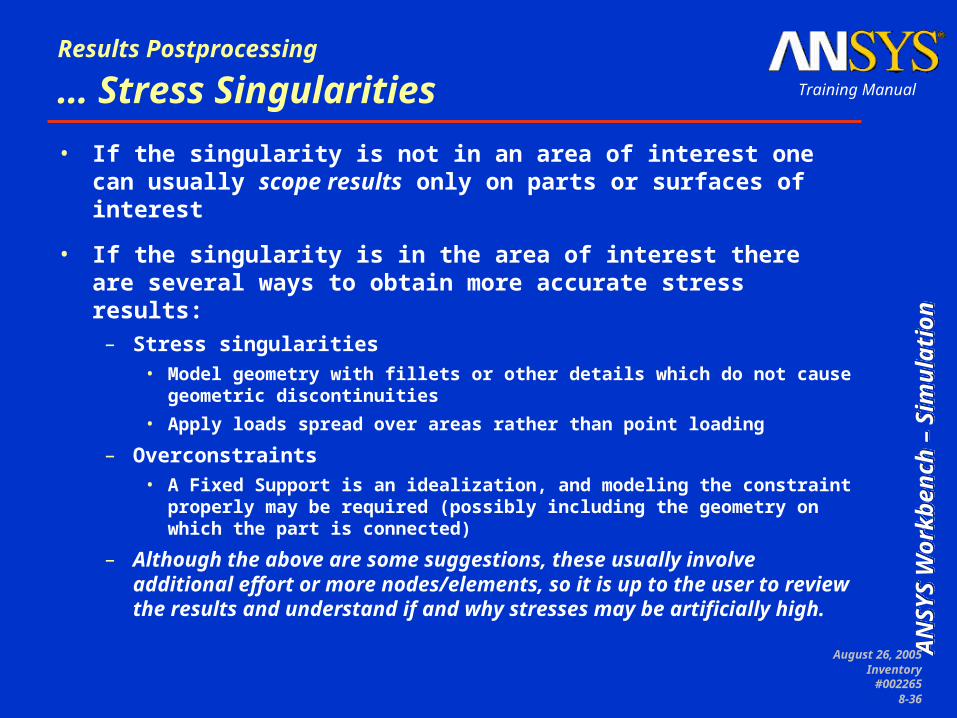
Results Postprocessing
… Stress Singularities
• If the singularity is not in an area of interest one can usually scope results only on parts or surfaces of interest
• If the singularity is in the area of interest there are several ways to obtain more accurate stress results:
– Stress singularities• Model geometry with fillets or other details which do not cause geometric
discontinuities
• Apply loads spread over areas rather than point loading
– Overconstraints• A Fixed Support is an idealization, and modeling the constraint properly
may be required (possibly including the geometry on which the part is connected)
– Although the above are some suggestions, these usually involve additional effort or more nodes/elements, so it is up to the user to review the results and understand if and why stresses may be artificially high.

August 26, 2005Inventory
#0022658-37
AN
SY
S W
ork
ben
ch
– Sim
ula
tion
AN
SY
S W
ork
ben
ch
– Sim
ula
tion
AN
SY
S W
ork
ben
ch
– Sim
ula
tion
AN
SY
S W
ork
ben
ch
– Sim
ula
tion
Training Manual
Results Postprocessing
G. Error Estimation
• You can insert an Error result based on stresses (structural), or heat flux (thermal) to help identify regions of high error (see example next page)
• These regions show where the model would benefit from a more refined mesh in order to get a more accurate answer
• Regions of high error also indicate where refinement will take place if convergence is used
August 26, 2005Inventory
#0022658-38
AN
SY
S W
ork
ben
ch
– Sim
ula
tion
AN
SY
S W
ork
ben
ch
– Sim
ula
tion
AN
SY
S W
ork
ben
ch
– Sim
ula
tion
AN
SY
S W
ork
ben
ch
– Sim
ula
tion
Training Manual
Results Postprocessing
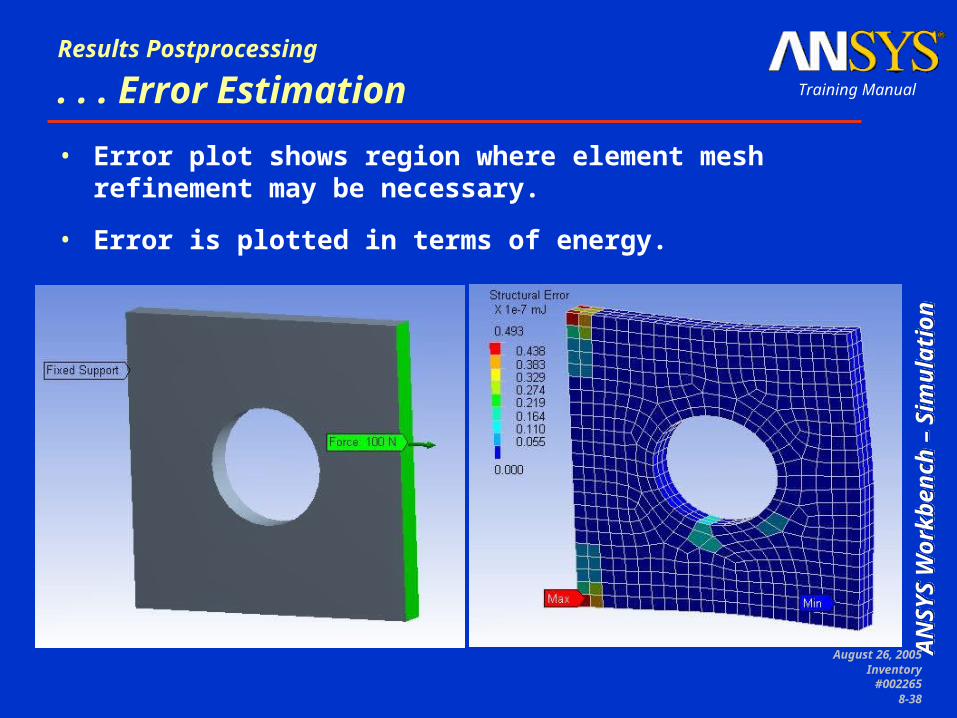
. . . Error Estimation
• Error plot shows region where element mesh refinement may be necessary.
• Error is plotted in terms of energy.
August 26, 2005Inventory
#0022658-39
AN
SY
S W
ork
ben
ch
– Sim
ula
tion
AN
SY
S W
ork
ben
ch
– Sim
ula
tion
AN
SY
S W
ork
ben
ch
– Sim
ula
tion
AN
SY
S W
ork
ben
ch
– Sim
ula
tion
Training Manual
Results Postprocessing
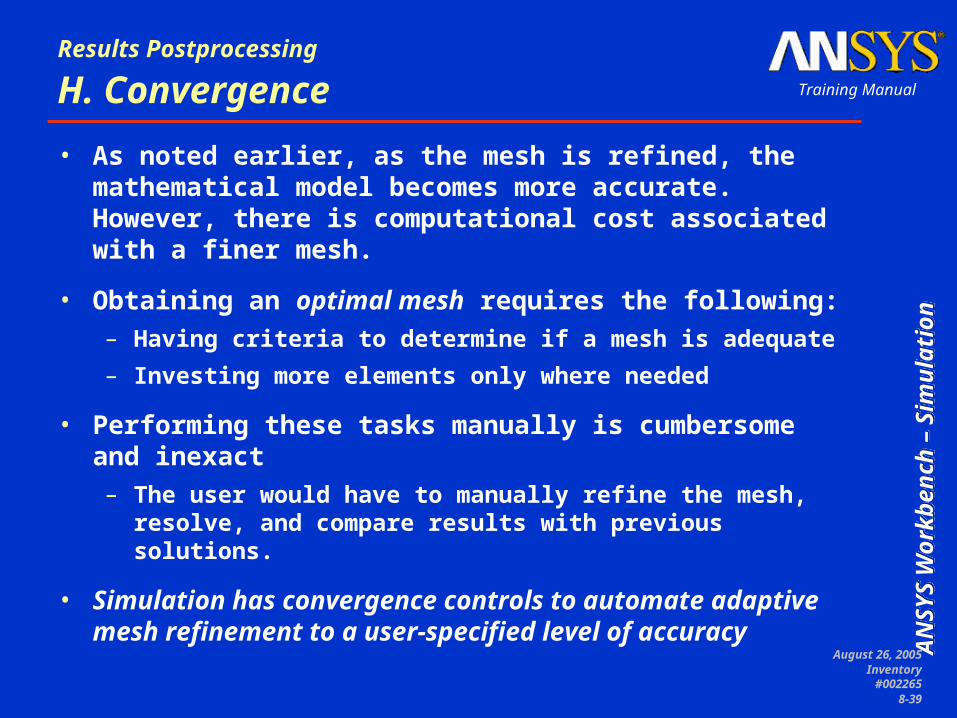
H. Convergence
• As noted earlier, as the mesh is refined, the mathematical model becomes more accurate. However, there is computational cost associated with a finer mesh.
• Obtaining an optimal mesh requires the following:– Having criteria to determine if a mesh is adequate
– Investing more elements only where needed
• Performing these tasks manually is cumbersome and inexact– The user would have to manually refine the mesh, resolve, and
compare results with previous solutions.
• Simulation has convergence controls to automate adaptive mesh refinement to a user-specified level of accuracy
August 26, 2005Inventory
#0022658-40
AN
SY
S W
ork
ben
ch
– Sim
ula
tion
AN
SY
S W
ork
ben
ch
– Sim
ula
tion
AN
SY
S W
ork
ben
ch
– Sim
ula
tion
AN
SY
S W
ork
ben
ch
– Sim
ula
tion
Training Manual
Results Postprocessing
… Convergence
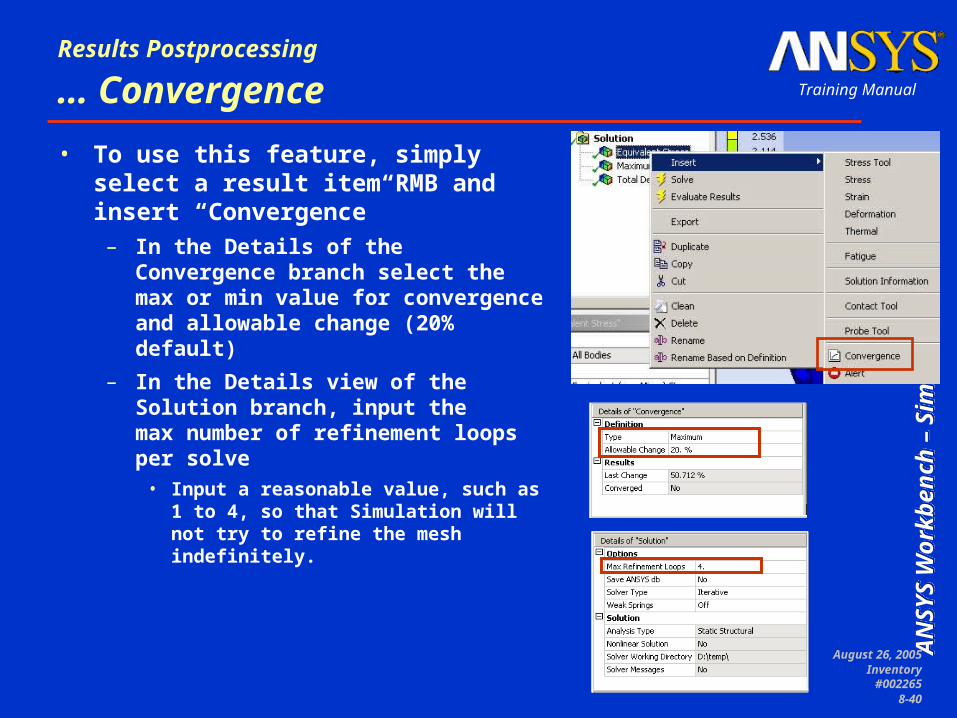
• To use this feature, simply select a result item RMB and insert “Convergence”
– In the Details of the Convergence branch select the max or min value for convergence and allowable change (20% default)
– In the Details view of the Solution branch, input the max number of refinement loops per solve
• Input a reasonable value, such as 1 to 4, so that Simulation will not try to refine the mesh indefinitely.
August 26, 2005Inventory
#0022658-41
AN
SY
S W
ork
ben
ch
– Sim
ula
tion
AN
SY
S W
ork
ben
ch
– Sim
ula
tion
AN
SY
S W
ork
ben
ch
– Sim
ula
tion
AN
SY
S W
ork
ben
ch
– Sim
ula
tion
Training Manual
Results Postprocessing
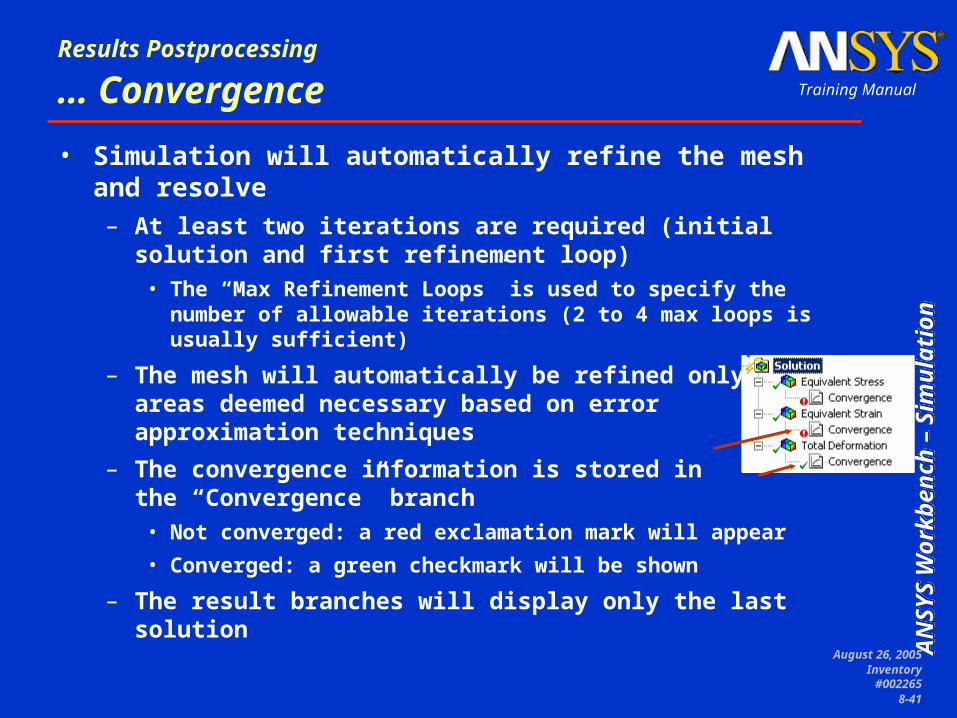
… Convergence
• Simulation will automatically refine the mesh and resolve– At least two iterations are required (initial solution and first
refinement loop)• The “Max Refinement Loops” is used to specify the number of
allowable iterations (2 to 4 max loops is usually sufficient)
– The mesh will automatically be refined only in areas deemed necessary based on error approximation techniques
– The convergence information is stored in the “Convergence” branch
• Not converged: a red exclamation mark will appear
• Converged: a green checkmark will be shown
– The result branches will display only the last solution
August 26, 2005Inventory
#0022658-42
AN
SY
S W
ork
ben
ch
– Sim
ula
tion
AN
SY
S W
ork
ben
ch
– Sim
ula
tion
AN
SY
S W
ork
ben
ch
– Sim
ula
tion
AN
SY
S W
ork
ben
ch
– Sim
ula
tion
Training Manual
Results Postprocessing
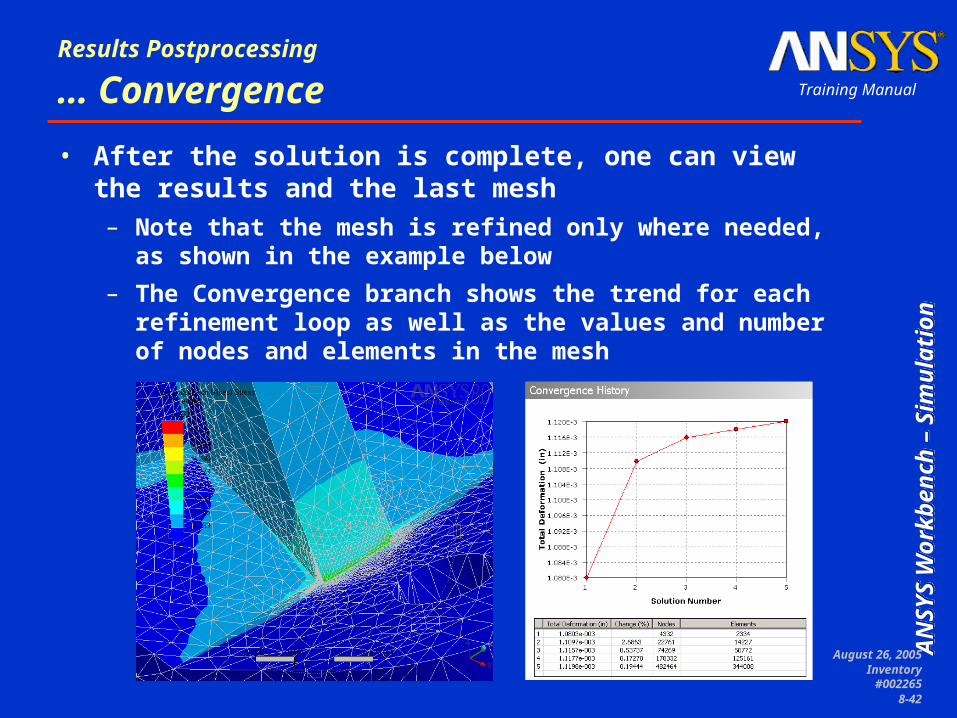
… Convergence
• After the solution is complete, one can view the results and the last mesh– Note that the mesh is refined only where needed, as shown in
the example below
– The Convergence branch shows the trend for each refinement loop as well as the values and number of nodes and elements in the mesh
August 26, 2005Inventory
#0022658-43
AN
SY
S W
ork
ben
ch
– Sim
ula
tion
AN
SY
S W
ork
ben
ch
– Sim
ula
tion
AN
SY
S W
ork
ben
ch
– Sim
ula
tion
AN
SY
S W
ork
ben
ch
– Sim
ula
tion
Training Manual
Results Postprocessing
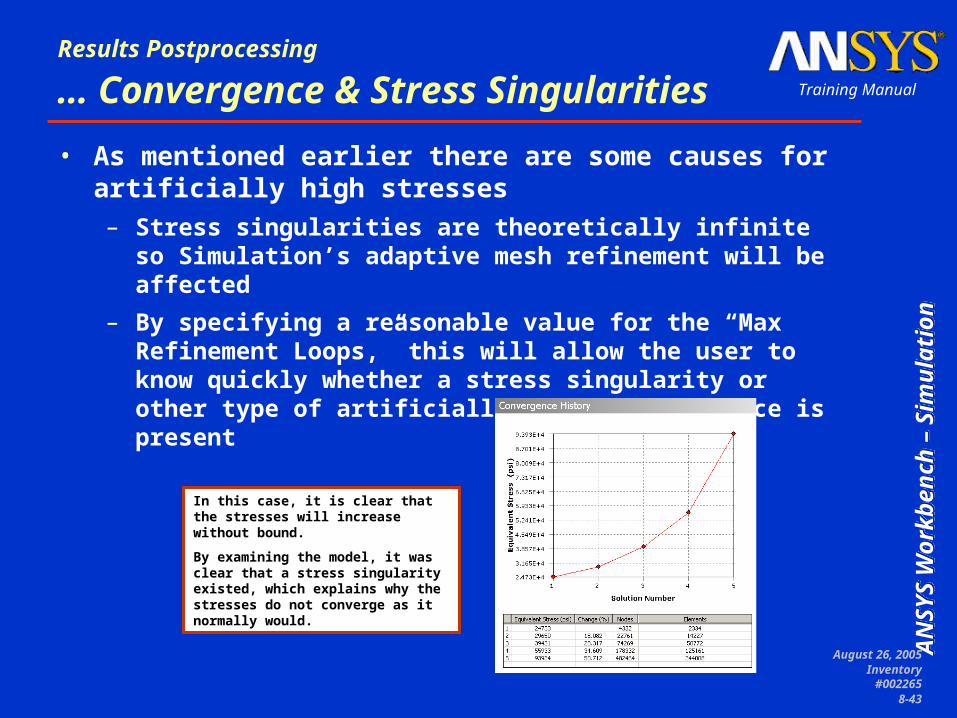
… Convergence & Stress Singularities
• As mentioned earlier there are some causes for artificially high stresses– Stress singularities are theoretically infinite so Simulation’s
adaptive mesh refinement will be affected
– By specifying a reasonable value for the “Max Refinement Loops,” this will allow the user to know quickly whether a stress singularity or other type of artificially high stress source is present
In this case, it is clear that the stresses will increase without bound.
By examining the model, it was clear that a stress singularity existed, which explains why the stresses do not converge as it normally would.
August 26, 2005Inventory
#0022658-44
AN
SY
S W
ork
ben
ch
– Sim
ula
tion
AN
SY
S W
ork
ben
ch
– Sim
ula
tion
AN
SY
S W
ork
ben
ch
– Sim
ula
tion
AN
SY
S W
ork
ben
ch
– Sim
ula
tion
Training Manual
Results Postprocessing
… Convergence & Scoping
• Besides adding details to remove stress singularities, one can also converge on scoped results– If the artificially high stress region is not of interest, one can
scope results on selected part(s) or surface(s) and add convergence controls to those results only
• This provides the user with control on where to perform mesh refinement
• This also allows the user to ignore areas of artificially high stresses which are not of interest
August 26, 2005Inventory
#0022658-45
AN
SY
S W
ork
ben
ch
– Sim
ula
tion
AN
SY
S W
ork
ben
ch
– Sim
ula
tion
AN
SY
S W
ork
ben
ch
– Sim
ula
tion
AN
SY
S W
ork
ben
ch
– Sim
ula
tion
Training Manual
Results Postprocessing
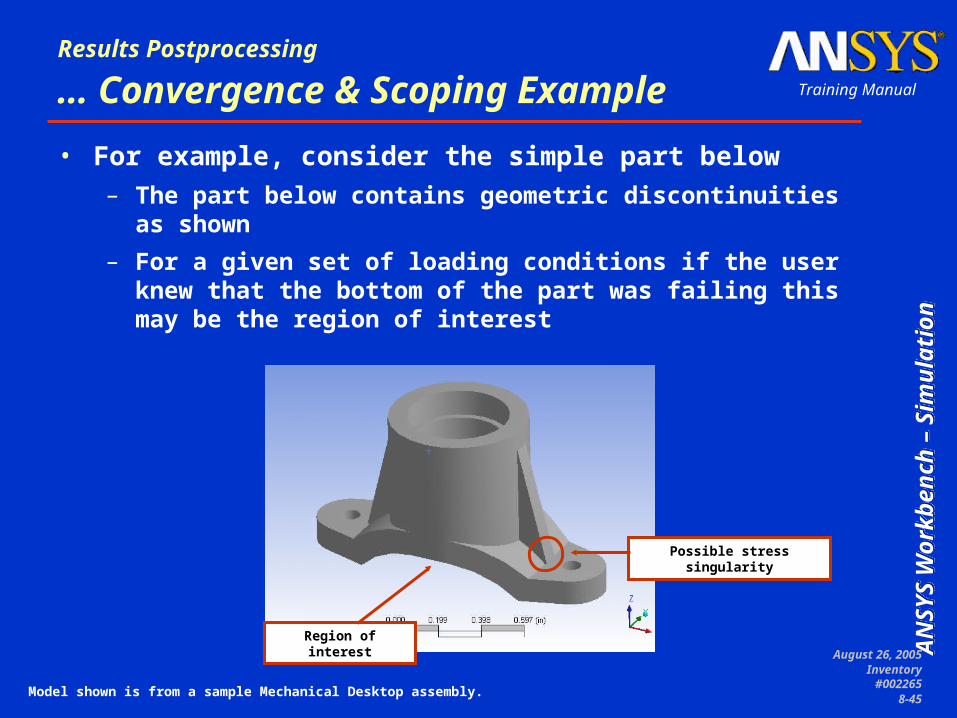
… Convergence & Scoping Example
• For example, consider the simple part below– The part below contains geometric discontinuities as shown
– For a given set of loading conditions if the user knew that the bottom of the part was failing this may be the region of interest
Model shown is from a sample Mechanical Desktop assembly.
Possible stress singularity
Region of interest
August 26, 2005Inventory
#0022658-46
AN
SY
S W
ork
ben
ch
– Sim
ula
tion
AN
SY
S W
ork
ben
ch
– Sim
ula
tion
AN
SY
S W
ork
ben
ch
– Sim
ula
tion
AN
SY
S W
ork
ben
ch
– Sim
ula
tion
Training Manual
Results Postprocessing
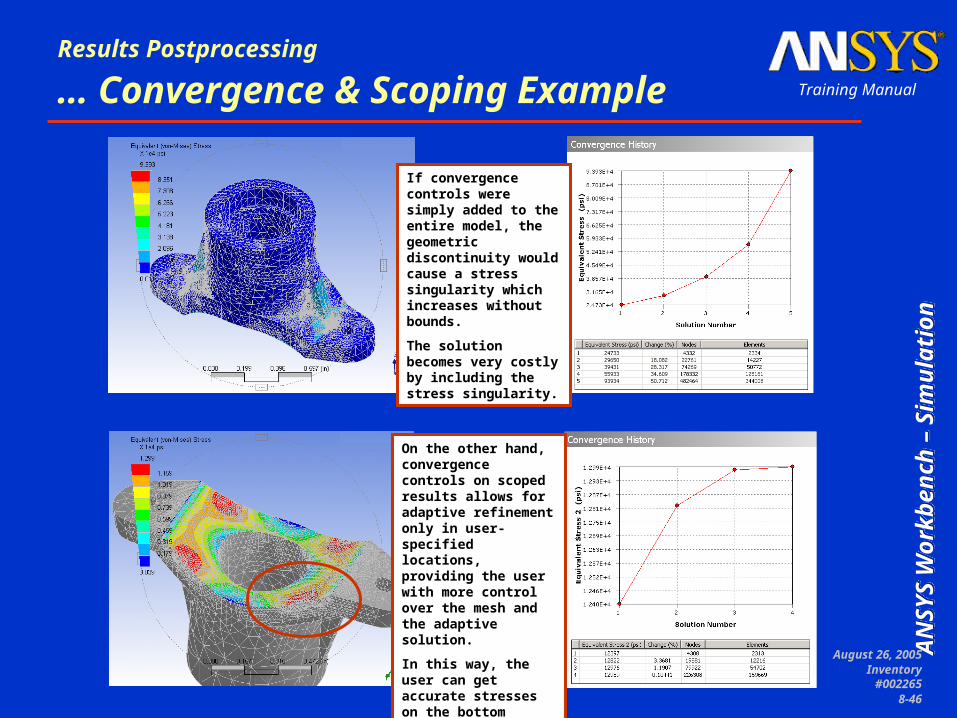
… Convergence & Scoping Example
If convergence controls were simply added to the entire model, the geometric discontinuity would cause a stress singularity which increases without bounds.
The solution becomes very costly by including the stress singularity.
On the other hand, convergence controls on scoped results allows for adaptive refinement only in user-specified locations, providing the user with more control over the mesh and the adaptive solution.
In this way, the user can get accurate stresses on the bottom surface of the part.
August 26, 2005Inventory
#0022658-47
AN
SY
S W
ork
ben
ch
– Sim
ula
tion
AN
SY
S W
ork
ben
ch
– Sim
ula
tion
AN
SY
S W
ork
ben
ch
– Sim
ula
tion
AN
SY
S W
ork
ben
ch
– Sim
ula
tion
Training Manual
Results Postprocessing
… Results Not Used with Convergence
• Convergence cannot be used on the following result quantities:– Any type of vector result
– Contact Tool results
– Frequency Finder stress/strain results
– Buckling stress/strain results
– Harmonic analysis results
– Shape Finder results
– Fatigue Tool graph results
August 26, 2005Inventory
#0022658-48
AN
SY
S W
ork
ben
ch
– Sim
ula
tion
AN
SY
S W
ork
ben
ch
– Sim
ula
tion
AN
SY
S W
ork
ben
ch
– Sim
ula
tion
AN
SY
S W
ork
ben
ch
– Sim
ula
tion
Training Manual
Results Postprocessing
… Convergence Summary
• Convergence Details:– the “percent change” is related to the previous solution. This
is not “percent error”
– Convergence controls do not compensate for inaccurate assumptions
– Convergence controls trigger adaptive mesh refinement. Each solution will take longer than the previous one
• Scoping results which contain convergence controls helps to minimize mesh density by isolating the areas of interest
August 26, 2005Inventory
#0022658-49
AN
SY
S W
ork
ben
ch
– Sim
ula
tion
AN
SY
S W
ork
ben
ch
– Sim
ula
tion
AN
SY
S W
ork
ben
ch
– Sim
ula
tion
AN
SY
S W
ork
ben
ch
– Sim
ula
tion
Training Manual
Results Postprocessing
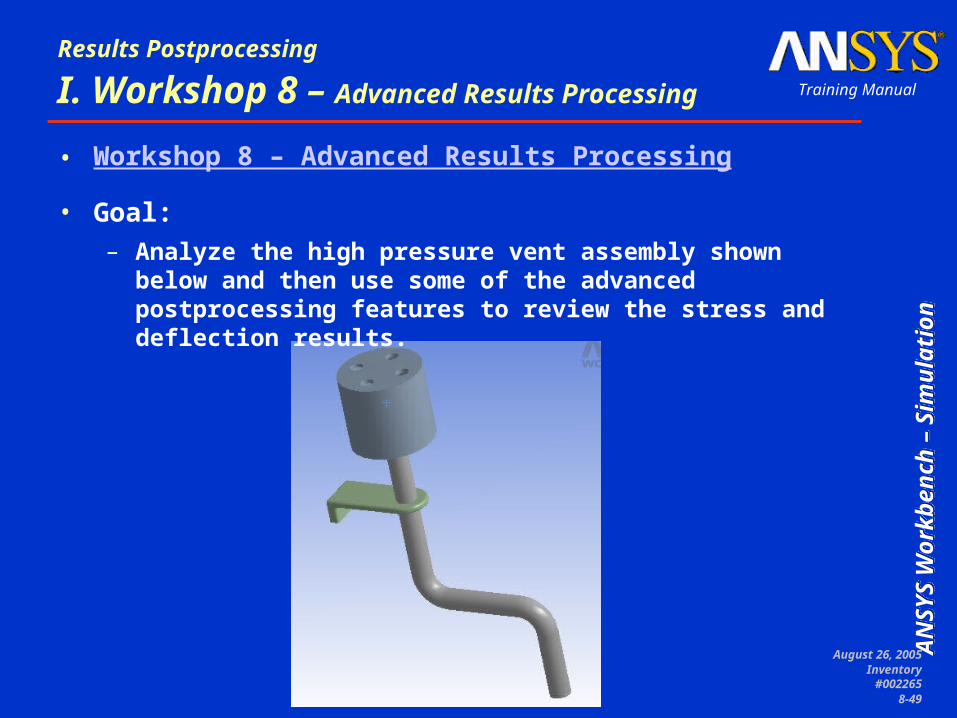
• Workshop 8 – Advanced Results Processing
• Goal:– Analyze the high pressure vent assembly shown below and
then use some of the advanced postprocessing features to review the stress and deflection results.
I. Workshop 8 – Advanced Results Processing