Embed Size (px)
Citation preview
RESULTS OF THE UNIVERSAL SECONDARY EDUCATION (USE/UPPET) & UNIVERSAL POST O’ LEVEL EDUCATION & TRAINING (UPOLET) NATIONAL HEAD COUNT EXERCISE CONDUCTED ON 19 JULY 2016
Statistics Section Education Planning and Policy Analysis Department
2 USE/UPPET July 2016 Headcount Preliminary Results
Table of Contents
Table of Contents ................................................................................................ 2
List of tables ........................................................................................................ 3
List of figures ....................................................................................................... 3
List of Acronyms ................................................................................................. 4
Executive Summary ............................................................................................. 5
2.0 Objective of the exercise ............................................................................. 7
3.0 Methodology ............................................................................................... 8
4.0 Preliminary Findings of the 2016 Headcount exercise .................................... 8
6.0 Policy Issues revealed by the Headcount ................................................... 16
7.0 Recommendations: .................................................................................... 16
ANNEXES ........................................................................................................ 16
Annex 1: USE/UPPET cohort analysis 2007-2016 ................................... 16
Annex 2: BTVET/UPPET cohort analysis 2007-2016.............................. 16
Annex 3: preliminary results summary ...................................................... 16
Annex 3: USE UPPET headcount 2016 preliminary results summary....... 19
Annex 4: BTVET UPPET and UPOLET headcount 2016 preliminary
results summary ........................................................................................ 28
3 USE/UPPET July 2016 Headcount Preliminary Results
List of tables
Table 1.1: Number of expected Schools/Institutions against the response
Table 1.2: Funds required to pay capitation for eligible USE students per term in FY 2016/17 (2nd&3rd term 2015 and 1st term 2016)
Table 1.3: Funds required to pay capitation for eligible UPOLET (S5) students per term in FY 2016/17 (2nd&3rd term 2014 and 1st term 2015)
Table 1.4: Funds required to pay capitation for eligible P.7 enrolling BTVET students per term 2016
Table 1.5: Funds required to pay capitation for eligible S.4 enrolling BTVET students in technical institutes per term
Table 1.6: Funds required to pay capitation for eligible S.4 enrolling BTVET students in health institutions per term
List of figures
Figure 1.1: USE S.1 intake 2007-2016
Figure 1.2: Year One Intake in P.7 Enrolling BTVET Institutions 2007-2016
4 USE/UPPET July 2016 Headcount Preliminary Results
List of Acronyms
BTVET Business, Technical, Vocational Education and Training
DEO District Education Officer
DISO District Internal Security Officer
EFA Education For All
EMIS Education Management Information System
GISO Gombolola Internal Security Officer
HIV Human Immune Virus
MDG Millennium Development Goal
MoES Ministry of Education and Sports
MOES Ministry of Education and Sports
MOFPED Ministry of Finance, Planning and Economic Development
MOLG Ministry of Local Government
MTEF Medium Term Expenditure Framework
PEAP Poverty Eradication Action Plan
PLE Primary Leaving Education
PTA Parents and Teachers Association
S1 Senior One
S2 Senior Two
S3 Senior Three
UACE Uganda Advanced Certificate of Education
UCE Uganda Certificate of Education
UNEB Uganda National Examinations Board
UPE Universal Primary Education
UPOLET Universal Post O’Level Education and Training
UPPET Universal Post Primary Education and Training
USE Universal Secondary Education
USE Universal Secondary Education
UIS UNESCO Institute of Statistics
Y1 Year One
Y2 Year Two
Y3 Year Three
STR Student Teacher Ratio
SCR Student Classroom Ratio
5 USE/UPPET July 2016 Headcount Preliminary Results
Executive Summary
Every year the Government of Uganda (Ministry of Education and Sports) undertakes a headcount of
beneficiary students in the Universal Post Primary Education and Training schools and institutions.
The Headcount is an implementation strategy adopted at the inception of the USE programme in 2007
as a monitoring tool aimed at ensuring that only the target beneficiaries are served.
It is in this regard that the Ministry of Education and Sports on the 19th July 2016 (as part of the 2016
Comprehensive Education and Sports data collection exercise) conducted a National Headcount exercise. Like the
previous year 2015, the Headcount was done as a collaborative effort between the MoES and the Local
Governments. The actual enumeration was done by the Senior Assistant Secretaries(SASs) while the
head teachers/principals were the primary respondents during the exercise.
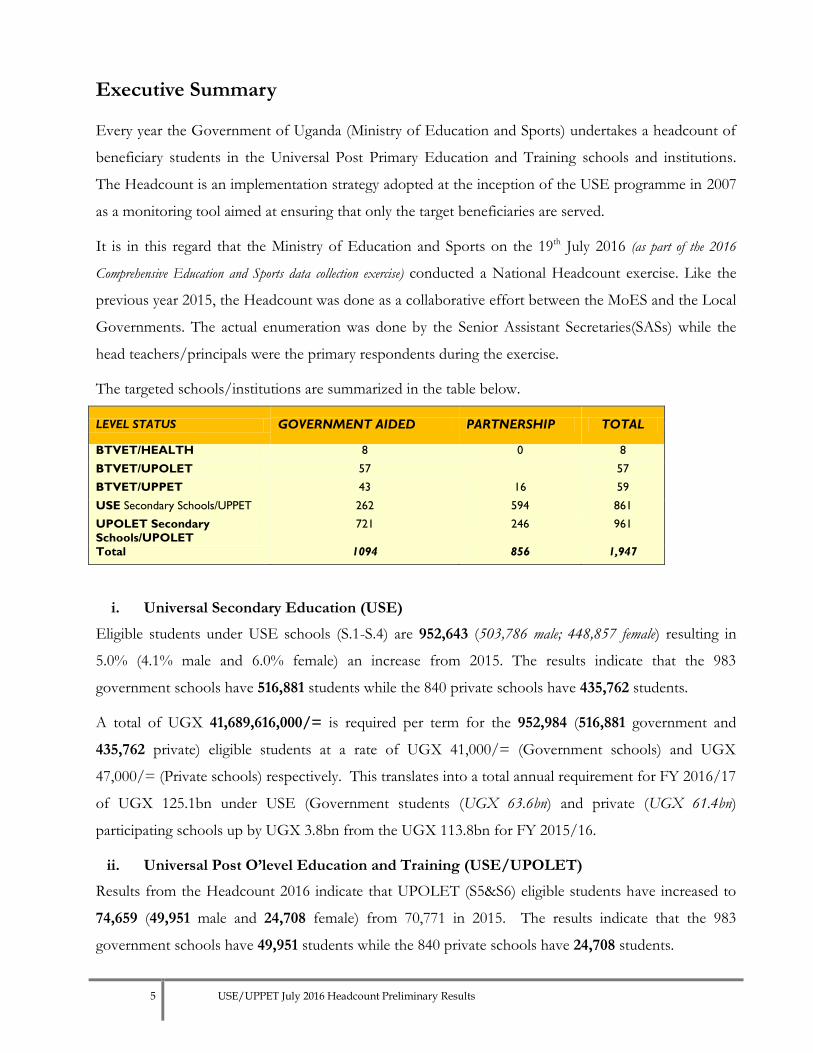
The targeted schools/institutions are summarized in the table below.
LEVEL STATUS GOVERNMENT AIDED PARTNERSHIP TOTAL
BTVET/HEALTH 8 0 8
BTVET/UPOLET 57 57
BTVET/UPPET 43 16 59
USE Secondary Schools/UPPET 262 594 861
UPOLET Secondary
Schools/UPOLET
721 246 961
Total 1094 856 1,947
i. Universal Secondary Education (USE)
Eligible students under USE schools (S.1-S.4) are 952,643 (503,786 male; 448,857 female) resulting in
5.0% (4.1% male and 6.0% female) an increase from 2015. The results indicate that the 983
government schools have 516,881 students while the 840 private schools have 435,762 students.
A total of UGX 41,689,616,000/= is required per term for the 952,984 (516,881 government and
435,762 private) eligible students at a rate of UGX 41,000/= (Government schools) and UGX
47,000/= (Private schools) respectively. This translates into a total annual requirement for FY 2016/17
of UGX 125.1bn under USE (Government students (UGX 63.6bn) and private (UGX 61.4bn)
participating schools up by UGX 3.8bn from the UGX 113.8bn for FY 2015/16.
ii. Universal Post O’level Education and Training (USE/UPOLET)
Results from the Headcount 2016 indicate that UPOLET (S5&S6) eligible students have increased to
74,659 (49,951 male and 24,708 female) from 70,771 in 2015. The results indicate that the 983
government schools have 49,951 students while the 840 private schools have 24,708 students.
6 USE/UPPET July 2016 Headcount Preliminary Results
A total of UGX 18,288,780,000/= of which UGX 11,988,240,000/= is required for the 49,951
government students and UGX 6,300,540,000/= for the 24,708 private students at a rate of UGX
80,000/= for government schools and UGX 85,000/= for private schools. This translates into an
increase of USE Program funds from UGX 17.3bn to UGX 18.3bn for the FY 2015/16 to FY
2016/17 respectively. This increase is explained by a lot of publicity to USE program and increased
number of both government and private schools/institutions.
iii. P.7 enrolling BTVET/UPPET
P.7 enrolling BTVET Institutions had a total count of 8,389 (6,896 Male and 1,493 Female) eligible
students representing a 4.1% increment from year (2015). However, the number of eligible female
students reduced from 1,742 to 1,493 in 2016.
A total of UGX 5,033,400,000 is required for FY2016/17 for the 8,389 (6,896 government and 1,493
private) eligible students at a rate of UGX 200,000/= (government schools and private schools)
resulting into an estimated budget requirement of UGX 5.03bn for both public and private
participating schools for FY 2016/17 up by 0.208bn compared to last Financial Year 2015/16.
iv. Universal Post O’level Education and Training (BTVET/UPOLET)
Eligible students in UPOLET technical institutions totaled 9,069 of whom 7,427 are male and 1,642
female. The results also indicate that there were 1,790 students in the UPOLET health institutions of
whom 542 are male and 1,248 female.
A total of UGX 6,515,400,000/= of which UGX 5,441,400,000/= is for Technical Institutes and
UGX 1,074,000,000/= is for Health Institutions per term is required for the 10,859 eligible students in
both technical and health post O’level institutions. The total annual budget requirement therefore is
UGX 6.5bn financial year 2016/17.
v. Key policy Issues and challenges revealed by the headcount
a) Drop-out/Transfer-out and repetition rates (9.3%) are still high, largely due to lack of a tracking mechanism for transfers. HIV/AIDS (prevalence to both teachers and students) is also still at-large and is considered to be one of the factors contributing to rising dropout rates, absenteeism, repetition and poor academic performance.
b) Congestion in UPPET schools is high with 34% of the schools accommodating over 60
students in a class. The policy is 60 students per class.
7 USE/UPPET July 2016 Headcount Preliminary Results
1. Background
In February 2007, Government of Uganda initiated the Universal Secondary Education (USE)/
Universal Post Primary Education (UPPET) with an objective of increasing access to quality secondary
education. The government committed itself to subsidizing costs at secondary school level by paying
school fees, providing textbooks and other instructional materials for both students and teachers,
meeting the costs of co-curricular activities, school administration and maintenance.
Following the success of the Universal Post Primary Education and Training (UPPET) for lower
Secondary and Post P7 Vocational Education and Training in 2007, Government of Uganda
introduced Universal Post O’Level Education and Training (UPOLET) programme in 2011. This
policy for free post O’ level is in line with the National Development Plan (NDP) provision under
Human Resource Development and a prolongation of the UPPET/USE programme to cater for
Ugandan students who successfully complete and pass their Uganda Certificate of Education (UCE).
As part of the implementation strategy for the two programmes, the Ministry of Education and Sports
held a national headcount exercise of eligible students in all schools and institutions that implement the
Universal Post Primary Education and Training (UPPET) and Universal Post O’Level Education and
Training (UPOLET) programme. The 2016 headcount exercise was undertaken on the 19th July 2016.
This report presents the preliminary results of the national headcount 2015 exercise.
2.0 Objective of the exercise
To establish the actual number of students enrolled under USE/UPPET and UPOLET programmes
for informed decision making and planning for resource allocation to the participating education
institutions i.e. private and government.
Main Goals of the UPPET Programme (i) Expanding access and improve attendance in secondary education and BTVET;
(ii) Adding value to the sustainability of UPE;
(iii) Introducing students to formal reasoning, problem-solving skills and occupationally relevant content and
application of knowledge;
(iv) Developing competencies that provide access to the global economy and the potential this offers for
national development;
(v) Reducing high cost of secondary education and BTVET;
(vi) Increasing equitable access to secondary education and BTVET for special groups; and,
(vii) Developing the value of UPPET through;
Enhancing positive attitudes and intrinsic value of education;
Contributing to human resource development and ability to generate income;
Increasing knowledge-based economies in the context of globalization; and,
Enhancing government policy on poverty eradication.
8 USE/UPPET July 2016 Headcount Preliminary Results
3.0 Methodology
The 2016 headcount exercise was undertaken on the 19th July 2016. Like the previous headcount
exercise, the 2016 Headcount exercise was planned and conducted in collaboration with the Ministry of
Local Governments. MoES was responsible for the following;
Providing technical support for day today planning and implementation of the headcount exercise;
Conducting Training of Trainers (ToT) Workshops;
Designing the headcount instruments (questionnaires and manuals) and software for headcount
data capture, and;
Coordinating and monitoring the headcount exercise countrywide.
The members of the Local Governments (i.e. Chief Administrative Officer (CAOs),Town Clerks (TCs)
District Education Officers (DEOs), Municipal Education Officers (MEOs), and Sub-County Chiefs
(SCCs) were in charge of the exercise in their respective Districts/ Municipalities. Specifically,
The CAOs/TCs were the overall overseers of the exercise within their respective
districts/municipalities.
The DEOs/MEOs were charged with managing the exercise within their respective districts and
municipalities and were also responsible among others for retrieval of returns from sub-counties,
verification and endorsement of returns and submission of district returns to their respective MoES
HC teams.
The Senior Assistant Secretaries / Sub County Chiefs (SCCs) were the enumerators and were thus
responsible for conducting physical Headcounts at respective USE/UPPET/UPOLET
participating secondary schools and BTVET institutions within their respective sub counties. They
were supported by the DEOs/MEOs and a team of MoES HC monitoring teams attached to the
14 district clusters countrywide.
For ease of implementation of the monitoring exercise, the country was divided into nineteen regions
to which technical officers of MoES were tagged to provide the very much need technical
backstopping and supervision of the entire exercise.
Like the previous headcount exercises more than one enumerator was required to enumerate schools
with high enrolments i.e. schools with enrolment of over 1,000 students.
4.0 Preliminary Findings of the 2016 Headcount exercise
9 USE/UPPET July 2016 Headcount Preliminary Results
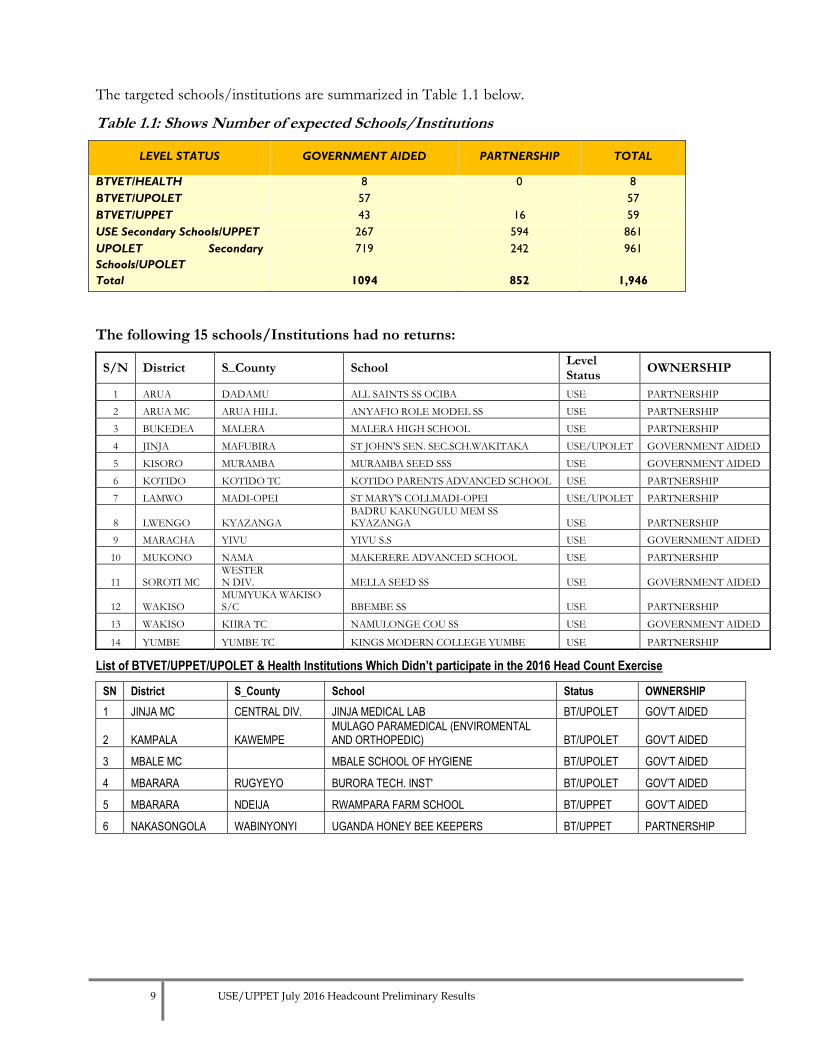
The targeted schools/institutions are summarized in Table 1.1 below.
Table 1.1: Shows Number of expected Schools/Institutions
LEVEL STATUS GOVERNMENT AIDED PARTNERSHIP TOTAL
BTVET/HEALTH 8 0 8
BTVET/UPOLET 57 57
BTVET/UPPET 43 16 59
USE Secondary Schools/UPPET 267 594 861
UPOLET Secondary
Schools/UPOLET
719 242 961
Total 1094 852 1,946
The following 15 schools/Institutions had no returns:
S/N District S_County School Level Status
OWNERSHIP
1 ARUA DADAMU ALL SAINTS SS OCIBA USE PARTNERSHIP
2 ARUA MC ARUA HILL ANYAFIO ROLE MODEL SS USE PARTNERSHIP
3 BUKEDEA MALERA MALERA HIGH SCHOOL USE PARTNERSHIP
4 JINJA MAFUBIRA ST JOHN'S SEN. SEC.SCH.WAKITAKA USE/UPOLET GOVERNMENT AIDED
5 KISORO MURAMBA MURAMBA SEED SSS USE GOVERNMENT AIDED
6 KOTIDO KOTIDO TC KOTIDO PARENTS ADVANCED SCHOOL USE PARTNERSHIP
7 LAMWO MADI-OPEI ST MARY'S COLLMADI-OPEI USE/UPOLET PARTNERSHIP
8 LWENGO KYAZANGA BADRU KAKUNGULU MEM SS KYAZANGA USE PARTNERSHIP
9 MARACHA YIVU YIVU S.S USE GOVERNMENT AIDED
10 MUKONO NAMA MAKERERE ADVANCED SCHOOL USE PARTNERSHIP
11 SOROTI MC WESTER N DIV. MELLA SEED SS USE GOVERNMENT AIDED
12 WAKISO MUMYUKA WAKISO S/C BBEMBE SS USE PARTNERSHIP
13 WAKISO KIIRA TC NAMULONGE COU SS USE GOVERNMENT AIDED
14 YUMBE YUMBE TC KINGS MODERN COLLEGE YUMBE USE PARTNERSHIP
List of BTVET/UPPET/UPOLET & Health Institutions Which Didn’t participate in the 2016 Head Count Exercise
SN District S_County School Status OWNERSHIP
1 JINJA MC CENTRAL DIV. JINJA MEDICAL LAB BT/UPOLET GOV’T AIDED
2 KAMPALA KAWEMPE MULAGO PARAMEDICAL (ENVIROMENTAL AND ORTHOPEDIC) BT/UPOLET GOV’T AIDED
3 MBALE MC MBALE SCHOOL OF HYGIENE BT/UPOLET GOV’T AIDED
4 MBARARA RUGYEYO BURORA TECH. INST' BT/UPOLET GOV’T AIDED
5 MBARARA NDEIJA RWAMPARA FARM SCHOOL BT/UPPET GOV’T AIDED
6 NAKASONGOLA WABINYONYI UGANDA HONEY BEE KEEPERS BT/UPPET PARTNERSHIP
10 USE/UPPET July 2016 Headcount Preliminary Results
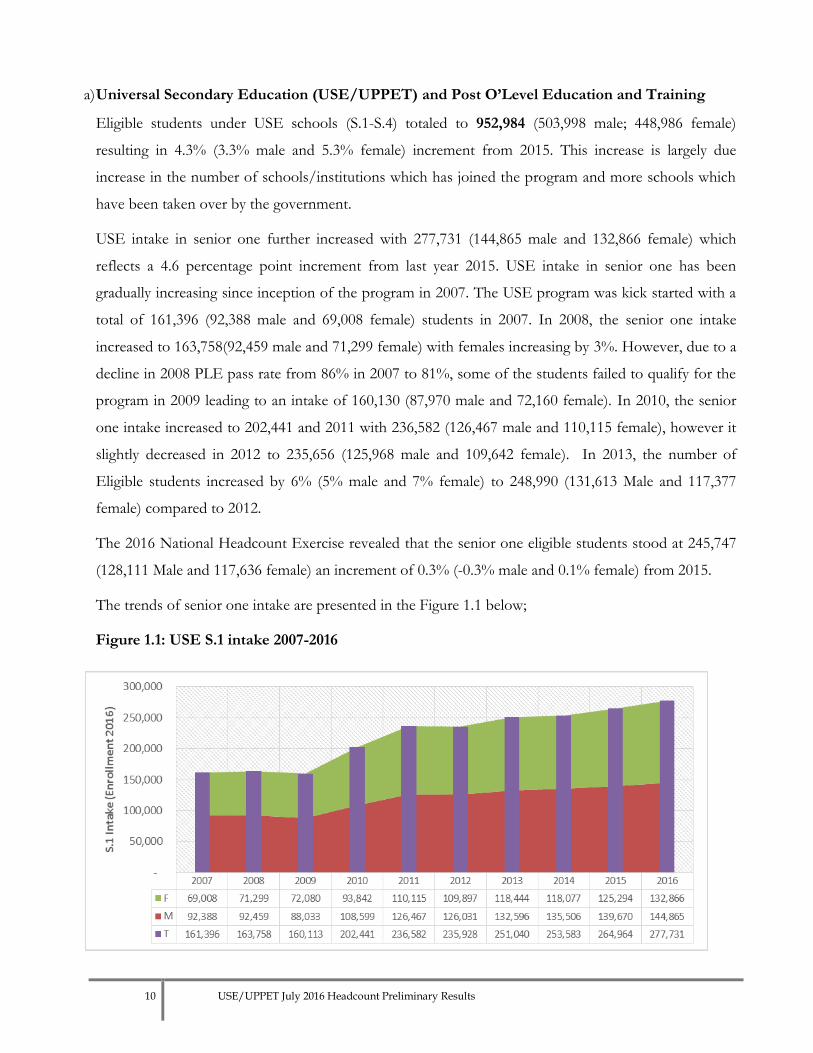
a) Universal Secondary Education (USE/UPPET) and Post O’Level Education and Training
Eligible students under USE schools (S.1-S.4) totaled to 952,984 (503,998 male; 448,986 female)
resulting in 4.3% (3.3% male and 5.3% female) increment from 2015. This increase is largely due
increase in the number of schools/institutions which has joined the program and more schools which
have been taken over by the government.
USE intake in senior one further increased with 277,731 (144,865 male and 132,866 female) which
reflects a 4.6 percentage point increment from last year 2015. USE intake in senior one has been
gradually increasing since inception of the program in 2007. The USE program was kick started with a
total of 161,396 (92,388 male and 69,008 female) students in 2007. In 2008, the senior one intake
increased to 163,758(92,459 male and 71,299 female) with females increasing by 3%. However, due to a
decline in 2008 PLE pass rate from 86% in 2007 to 81%, some of the students failed to qualify for the
program in 2009 leading to an intake of 160,130 (87,970 male and 72,160 female). In 2010, the senior
one intake increased to 202,441 and 2011 with 236,582 (126,467 male and 110,115 female), however it
slightly decreased in 2012 to 235,656 (125,968 male and 109,642 female). In 2013, the number of
Eligible students increased by 6% (5% male and 7% female) to 248,990 (131,613 Male and 117,377
female) compared to 2012.
The 2016 National Headcount Exercise revealed that the senior one eligible students stood at 245,747
(128,111 Male and 117,636 female) an increment of 0.3% (-0.3% male and 0.1% female) from 2015.
The trends of senior one intake are presented in the Figure 1.1 below;
Figure 1.1: USE S.1 intake 2007-2016
11 USE/UPPET July 2016 Headcount Preliminary Results
The 2016 headcount results reflect a transition rate of;
i. 92.2% (91.2% male and 93.2% female) from S.1 to S.2 a 5.4% (7.3% male and 3.5% female) decrement from
last year (2015);
ii. 91.0% (92.3% male and 89.6% female) from S.2 to S.3 this indicates a 1.2% decrement (2.2% male and 1.6%
female);
iii. 78.2% (80.0% male and 76.2% female) from S.3 to S.4. This also decreased by 6.9% (6.8% male and 7.0%
female)
Overall, 87.1% (87.8% male and 86.4% female) of the USE students that started S.1 in 2013 have managed to
make it to S.4. The remaining 12.9% of the students have either repeated a class, transferred to non-USE
schools or dropped out of school.
a) USE financial implication
A total of UGX 37,918,471,000 per term is required for the 952,316 (516,881 government and 435,762
private) eligible students at a rate of UGX 41,000/= (Government schools) and UGX 47,000/= (Private
schools). This translates into a total annual requirement for FY 2016/17 of UGX 125.3bn under USE
for both public (UGX 61.9bn) and private (UGX 63.3bn) participating schools up by UGX 5.3bn from
the UGX 119.9bn for FY 2015/16.
Table 1.2: Funds required to pay capitation for eligible USE students per term in FY
2016/17.
Category Enrolment Unit Cost Amount (UGX) Per Term Amount (UGX) Per Year
Govt 516,881 41,000 21,192,121,000 63,576,363,000
Private 435,762 47,000 20,480,814,000 61,442,442,000
Total 952,643 41,672,935,000 125,018,805,000
b) UPOLET (A’Level Secondary)
Results reveal that a total of UGX 6,108,695,000 per term is required for the 74,531 (50,127 government
and 25,995 private) eligible students at a rate of UGX 80,000/= (Government schools) and UGX
85,000/= (Private schools). It should be noted that for FY 2016/17 the estimated budget required is
UGX 18.8bn for UPOLET (Secondary schools).
12 USE/UPPET July 2016 Headcount Preliminary Results
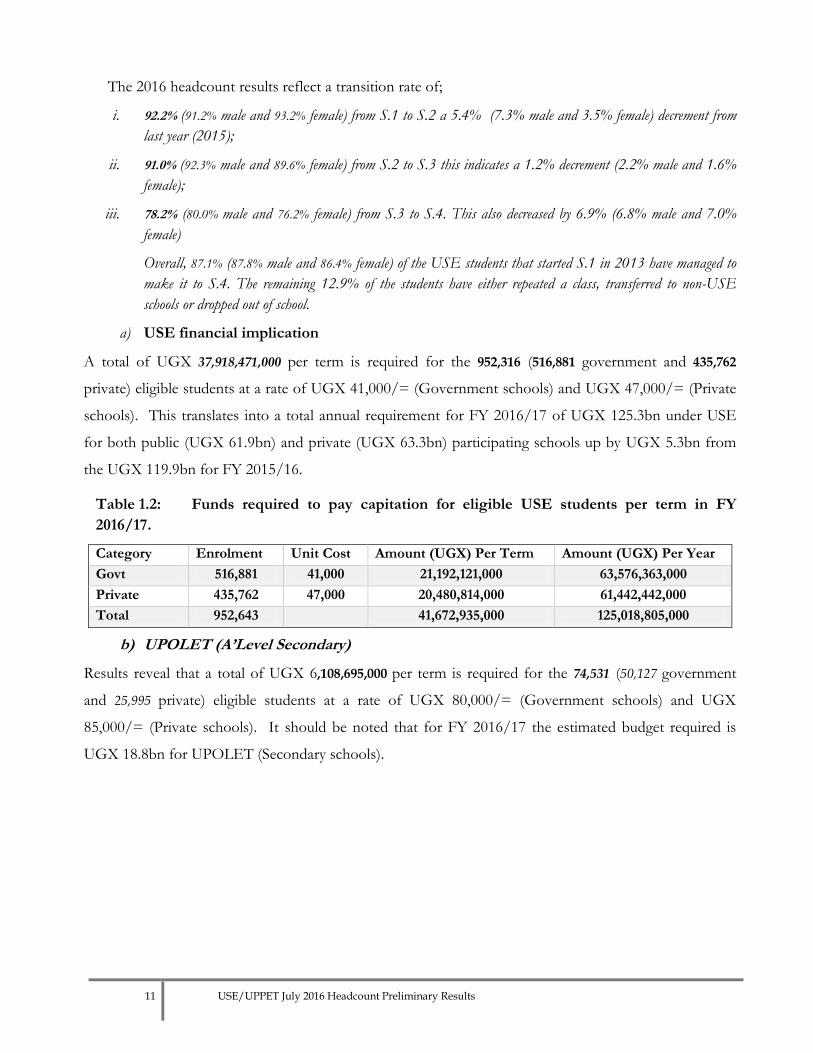
Table 1.3: Funds required to pay capitation for eligible UPOLET (S5) students per term in
FY 2015/16
Category Enrolment Unit (UGX) Amount (UGX) Per Term
Amount (UGX) FY 2016/17
Govt 49,951 80,000 3,996,080,000 11,988,240,000
Private 24,708 85,000 2,100,180,000 6,300,540,000
Total 74,659 6,096,260,000 18,288,780,000
b) P.7 enrolling BTVET and UPOLET
P.7 enrolling BTVET Institutions had a total count of 9,291 (7,162 Male and 2,129 Female) eligible
students representing a 5% increment from last year (7,647).
The 2016 National Headcount exercise recorded a total of 3,237 (Male 2,465 and female 772) eligible
students in year one. This translates into a decrement of 2.7% (-3.6% Male and 0.5% Female) from 2015.
The trends of year one intake are presented in the table below;
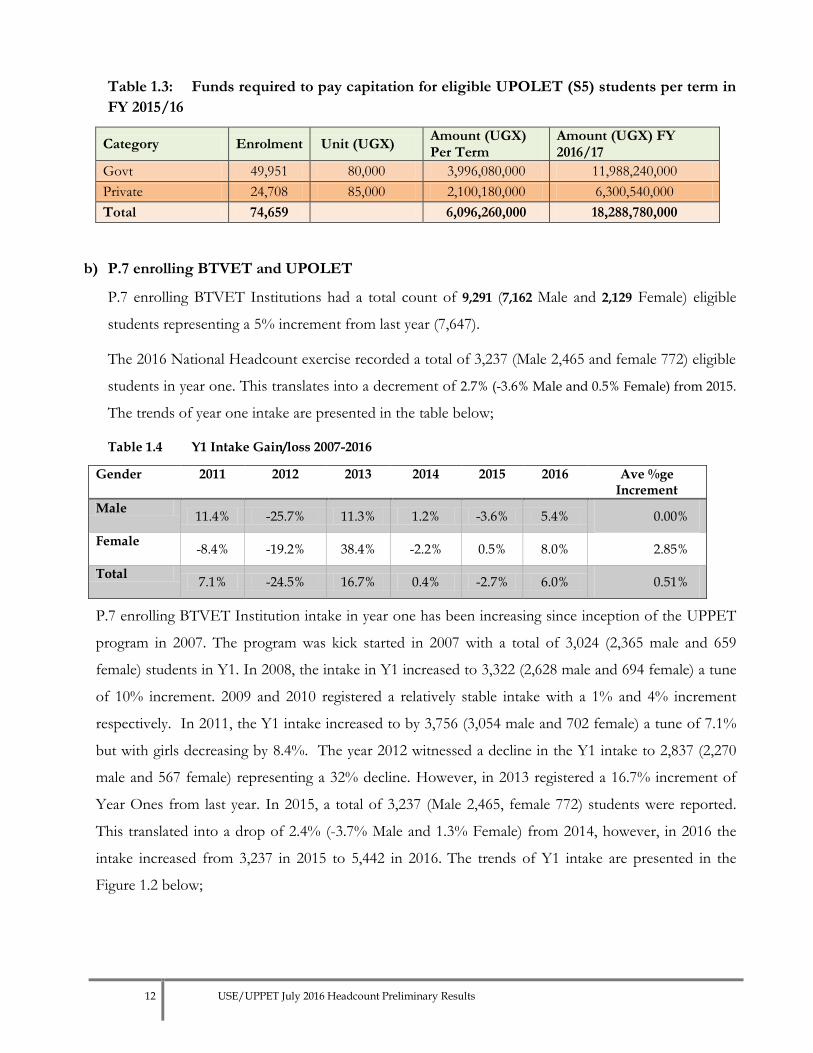
Table 1.4 Y1 Intake Gain/loss 2007-2016
Gender 2011 2012 2013 2014 2015 2016 Ave %ge Increment
Male 11.4% -25.7% 11.3% 1.2% -3.6% 5.4% 0.00%
Female -8.4% -19.2% 38.4% -2.2% 0.5% 8.0% 2.85%
Total 7.1% -24.5% 16.7% 0.4% -2.7% 6.0% 0.51%
P.7 enrolling BTVET Institution intake in year one has been increasing since inception of the UPPET
program in 2007. The program was kick started in 2007 with a total of 3,024 (2,365 male and 659
female) students in Y1. In 2008, the intake in Y1 increased to 3,322 (2,628 male and 694 female) a tune
of 10% increment. 2009 and 2010 registered a relatively stable intake with a 1% and 4% increment
respectively. In 2011, the Y1 intake increased to by 3,756 (3,054 male and 702 female) a tune of 7.1%
but with girls decreasing by 8.4%. The year 2012 witnessed a decline in the Y1 intake to 2,837 (2,270
male and 567 female) representing a 32% decline. However, in 2013 registered a 16.7% increment of
Year Ones from last year. In 2015, a total of 3,237 (Male 2,465, female 772) students were reported.
This translated into a drop of 2.4% (-3.7% Male and 1.3% Female) from 2014, however, in 2016 the
intake increased from 3,237 in 2015 to 5,442 in 2016. The trends of Y1 intake are presented in the
Figure 1.2 below;
13 USE/UPPET July 2016 Headcount Preliminary Results
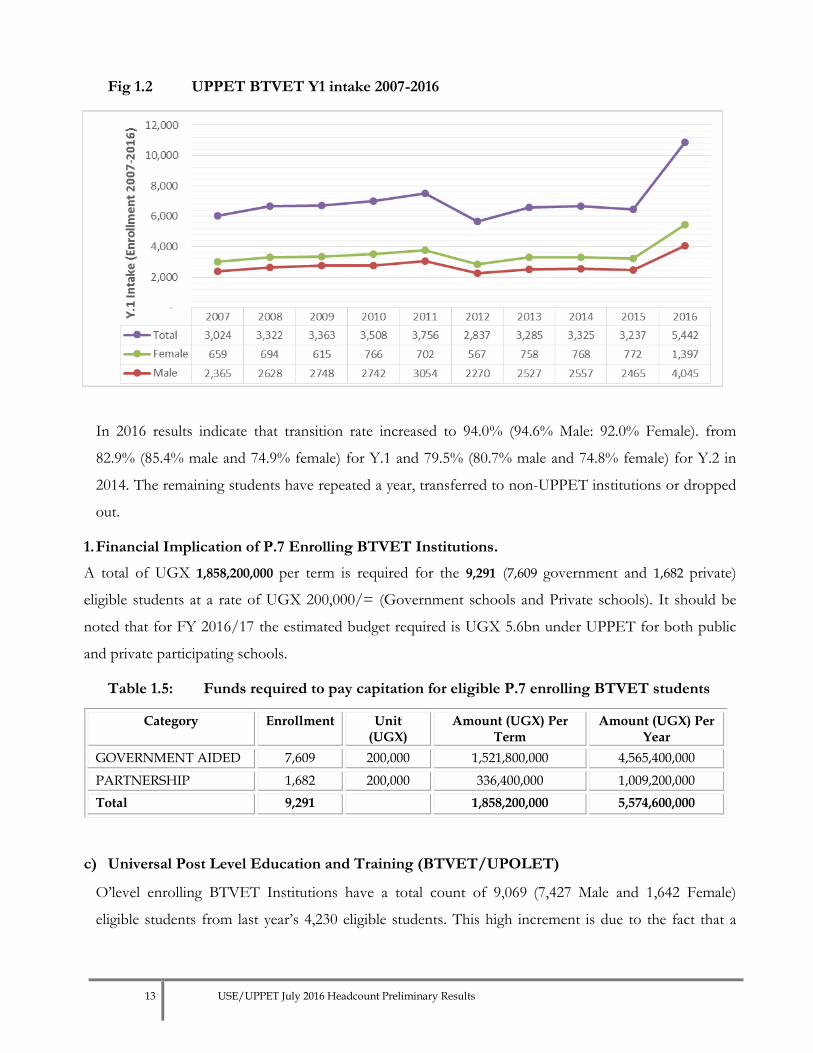
Fig 1.2 UPPET BTVET Y1 intake 2007-2016
In 2016 results indicate that transition rate increased to 94.0% (94.6% Male: 92.0% Female). from
82.9% (85.4% male and 74.9% female) for Y.1 and 79.5% (80.7% male and 74.8% female) for Y.2 in
2014. The remaining students have repeated a year, transferred to non-UPPET institutions or dropped
out.
1. Financial Implication of P.7 Enrolling BTVET Institutions.
A total of UGX 1,858,200,000 per term is required for the 9,291 (7,609 government and 1,682 private)
eligible students at a rate of UGX 200,000/= (Government schools and Private schools). It should be
noted that for FY 2016/17 the estimated budget required is UGX 5.6bn under UPPET for both public
and private participating schools.
Table 1.5: Funds required to pay capitation for eligible P.7 enrolling BTVET students
Category Enrollment Unit (UGX)
Amount (UGX) Per Term
Amount (UGX) Per Year
GOVERNMENT AIDED 7,609 200,000 1,521,800,000 4,565,400,000
PARTNERSHIP 1,682 200,000 336,400,000 1,009,200,000
Total 9,291 1,858,200,000 5,574,600,000
c) Universal Post Level Education and Training (BTVET/UPOLET)
O’level enrolling BTVET Institutions have a total count of 9,069 (7,427 Male and 1,642 Female)
eligible students from last year’s 4,230 eligible students. This high increment is due to the fact that a
14 USE/UPPET July 2016 Headcount Preliminary Results
second class i.e. Y2 has been acquired in the benefiting institutions. The drop is due to the non-
response of some institutions in the exercise.
15 USE/UPPET July 2016 Headcount Preliminary Results
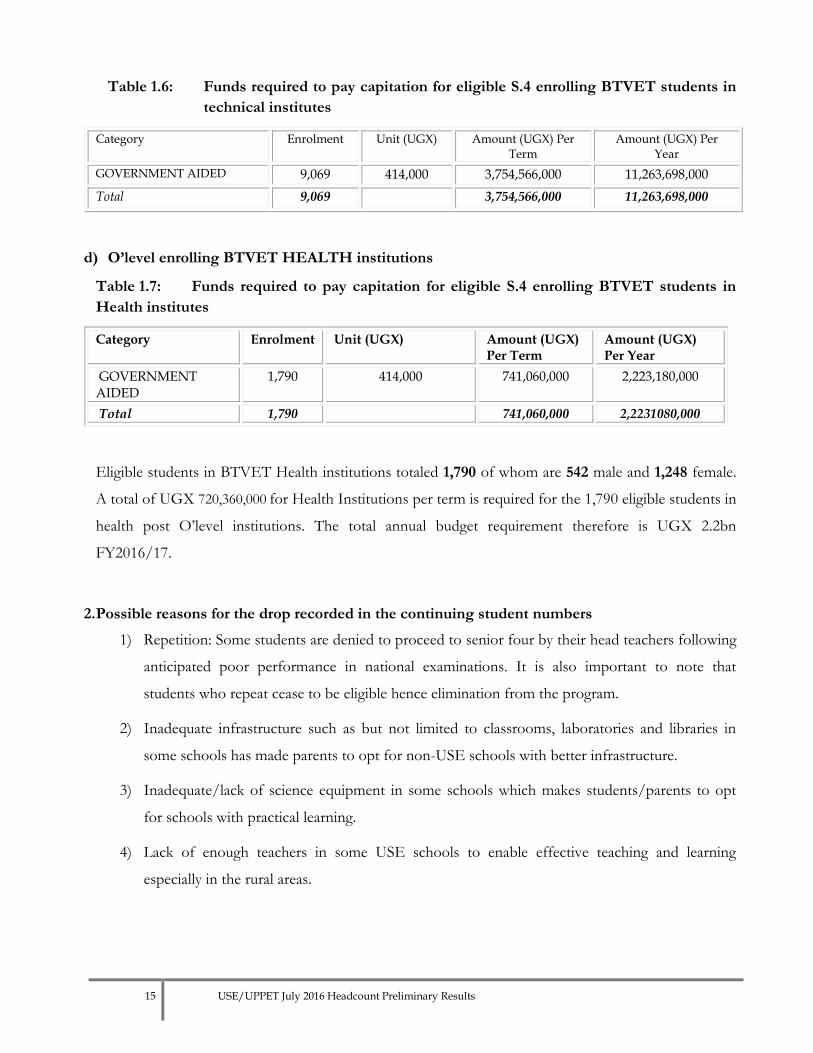
Table 1.6: Funds required to pay capitation for eligible S.4 enrolling BTVET students in
technical institutes
Category Enrolment Unit (UGX) Amount (UGX) Per Term
Amount (UGX) Per Year
GOVERNMENT AIDED 9,069 414,000 3,754,566,000 11,263,698,000
Total 9,069 3,754,566,000 11,263,698,000
d) O’level enrolling BTVET HEALTH institutions
Table 1.7: Funds required to pay capitation for eligible S.4 enrolling BTVET students in
Health institutes
Category Enrolment Unit (UGX) Amount (UGX) Per Term
Amount (UGX) Per Year
GOVERNMENT AIDED
1,790 414,000 741,060,000 2,223,180,000
Total 1,790 741,060,000 2,2231080,000
Eligible students in BTVET Health institutions totaled 1,790 of whom are 542 male and 1,248 female.
A total of UGX 720,360,000 for Health Institutions per term is required for the 1,790 eligible students in
health post O’level institutions. The total annual budget requirement therefore is UGX 2.2bn
FY2016/17.
2. Possible reasons for the drop recorded in the continuing student numbers
1) Repetition: Some students are denied to proceed to senior four by their head teachers following
anticipated poor performance in national examinations. It is also important to note that
students who repeat cease to be eligible hence elimination from the program.
2) Inadequate infrastructure such as but not limited to classrooms, laboratories and libraries in
some schools has made parents to opt for non-USE schools with better infrastructure.
3) Inadequate/lack of science equipment in some schools which makes students/parents to opt
for schools with practical learning.
4) Lack of enough teachers in some USE schools to enable effective teaching and learning
especially in the rural areas.

16 USE/UPPET July 2016 Headcount Preliminary Results
6.0 Policy Issues revealed by the Headcount
1) UPPET schools and institution admit continuing students from non UPPET schools and
institutions into the UPPET cohort. The policy is that only continuing students from a UPPET
school or institution can transfer into the programme in another school.
2) Repetition: Some students are denied to proceed to senior four by their head teachers following
anticipated poor performance in national examinations. It is also important to note that
students who repeat cease to be eligible hence elimination from the program.
3) Congestion in UPPET schools is high with some schools accommodating over 90 students in a
class. The policy is 40 students per class.
7.0 Recommendations:
1) Government needs to invest more in school infrastructure, teaching staff and learning
materials so as to match the growing demand for secondary education.
2) There should be verification and validation exercises of the data submitted to the
headquarters after headcount exercise to ensure the authenticity of the data submitted in
every school that is under the program.
3) There is need to conduct qualitative surveys to explain the issues (e.g. drop out) as
revealed by the headcount exercises.
4) Mechanisms should be put in place by MoES to ensure that all schools and institutions
participating in the program abide by the guidelines. Failure to do so should attract
punitive measures
ANNEXES
Annex 1: USE/UPPET cohort analysis 2007-2016 Annex 2: BTVET/UPPET cohort analysis 2007-2016 Annex 3: preliminary results summary
17 USE/UPPET July 2016 Headcount Preliminary Results
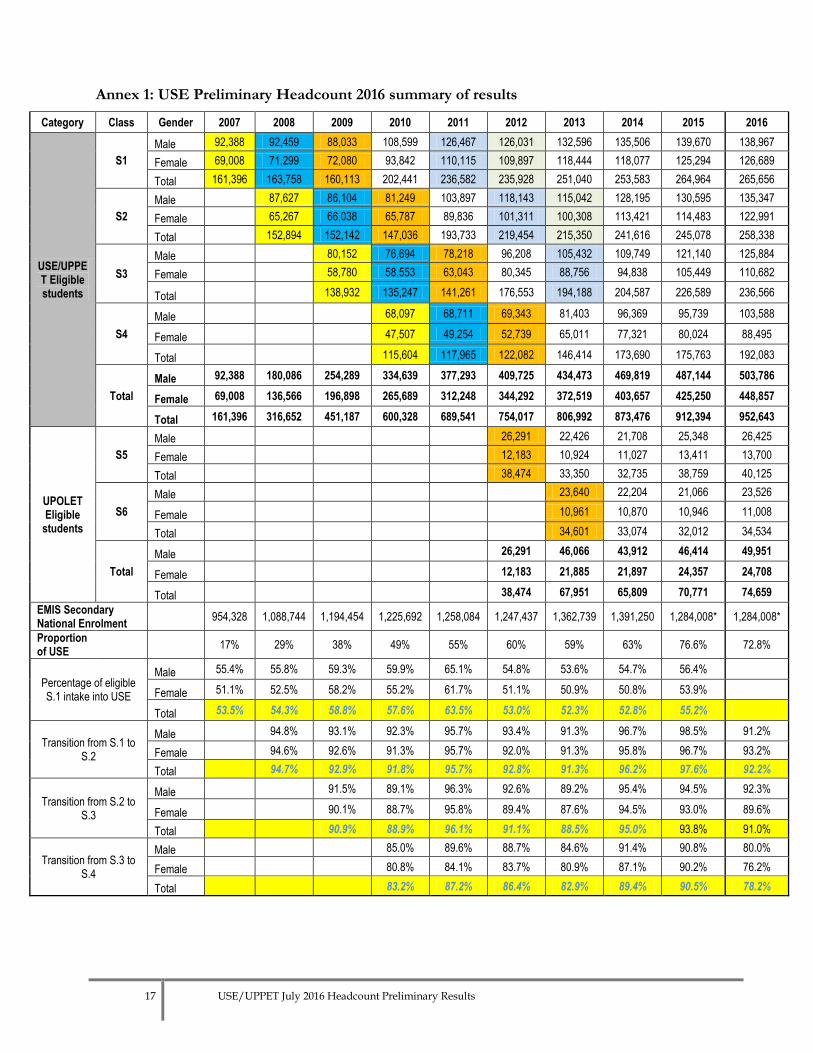
Annex 1: USE Preliminary Headcount 2016 summary of results
Category Class Gender 2007 2008 2009 2010 2011 2012 2013 2014 2015 2016
USE/UPPET Eligible students
S1
Male 92,388 92,459 88,033 108,599 126,467 126,031 132,596 135,506 139,670 138,967
Female 69,008 71,299 72,080 93,842 110,115 109,897 118,444 118,077 125,294 126,689
Total 161,396 163,758 160,113 202,441 236,582 235,928 251,040 253,583 264,964 265,656
S2
Male 87,627 86,104 81,249 103,897 118,143 115,042 128,195 130,595 135,347
Female 65,267 66,038 65,787 89,836 101,311 100,308 113,421 114,483 122,991
Total 152,894 152,142 147,036 193,733 219,454 215,350 241,616 245,078 258,338
S3
Male 80,152 76,694 78,218 96,208 105,432 109,749 121,140 125,884
Female 58,780 58,553 63,043 80,345 88,756 94,838 105,449 110,682
Total 138,932 135,247 141,261 176,553 194,188 204,587 226,589 236,566
S4
Male 68,097 68,711 69,343 81,403 96,369 95,739 103,588
Female 47,507 49,254 52,739 65,011 77,321 80,024 88,495
Total 115,604 117,965 122,082 146,414 173,690 175,763 192,083
Total
Male 92,388 180,086 254,289 334,639 377,293 409,725 434,473 469,819 487,144 503,786
Female 69,008 136,566 196,898 265,689 312,248 344,292 372,519 403,657 425,250 448,857
Total 161,396 316,652 451,187 600,328 689,541 754,017 806,992 873,476 912,394 952,643
UPOLET Eligible
students
S5
Male 26,291 22,426 21,708 25,348 26,425
Female 12,183 10,924 11,027 13,411 13,700
Total 38,474 33,350 32,735 38,759 40,125
S6
Male 23,640 22,204 21,066 23,526
Female 10,961 10,870 10,946 11,008
Total 34,601 33,074 32,012 34,534
Total
Male 26,291 46,066 43,912 46,414 49,951
Female 12,183 21,885 21,897 24,357 24,708
Total 38,474 67,951 65,809 70,771 74,659
EMIS Secondary National Enrolment
954,328 1,088,744 1,194,454 1,225,692 1,258,084 1,247,437 1,362,739 1,391,250 1,284,008* 1,284,008*
Proportion of USE
17% 29% 38% 49% 55% 60% 59% 63% 76.6% 72.8%
Percentage of eligible S.1 intake into USE
Male 55.4% 55.8% 59.3% 59.9% 65.1% 54.8% 53.6% 54.7% 56.4%
Female 51.1% 52.5% 58.2% 55.2% 61.7% 51.1% 50.9% 50.8% 53.9%
Total 53.5% 54.3% 58.8% 57.6% 63.5% 53.0% 52.3% 52.8% 55.2%
Transition from S.1 to S.2
Male 94.8% 93.1% 92.3% 95.7% 93.4% 91.3% 96.7% 98.5% 91.2%
Female 94.6% 92.6% 91.3% 95.7% 92.0% 91.3% 95.8% 96.7% 93.2%
Total 94.7% 92.9% 91.8% 95.7% 92.8% 91.3% 96.2% 97.6% 92.2%
Transition from S.2 to S.3
Male 91.5% 89.1% 96.3% 92.6% 89.2% 95.4% 94.5% 92.3%
Female 90.1% 88.7% 95.8% 89.4% 87.6% 94.5% 93.0% 89.6%
Total 90.9% 88.9% 96.1% 91.1% 88.5% 95.0% 93.8% 91.0%
Transition from S.3 to S.4
Male 85.0% 89.6% 88.7% 84.6% 91.4% 90.8% 80.0%
Female 80.8% 84.1% 83.7% 80.9% 87.1% 90.2% 76.2%
Total 83.2% 87.2% 86.4% 82.9% 89.4% 90.5% 78.2%
18 USE/UPPET July 2016 Headcount Preliminary Results
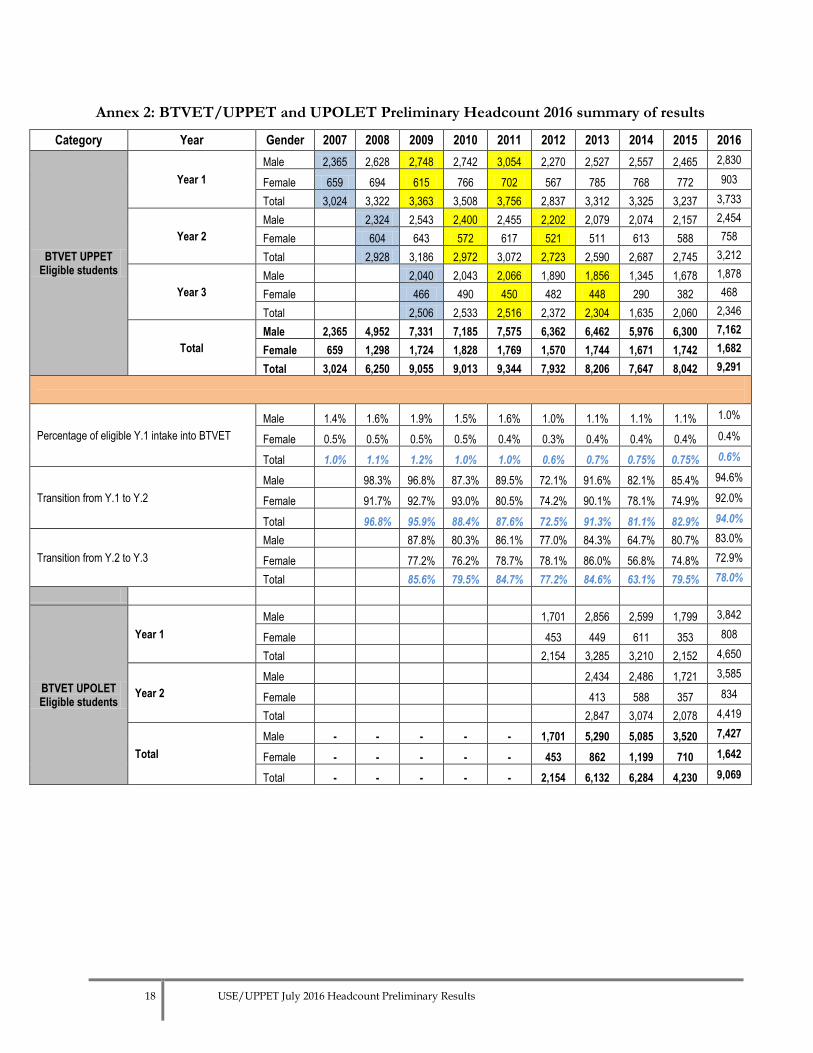
Annex 2: BTVET/UPPET and UPOLET Preliminary Headcount 2016 summary of results
Category Year Gender 2007 2008 2009 2010 2011 2012 2013 2014 2015 2016
BTVET UPPET Eligible students
Year 1
Male 2,365 2,628 2,748 2,742 3,054 2,270 2,527 2,557 2,465 2,830
Female 659 694 615 766 702 567 785 768 772 903
Total 3,024 3,322 3,363 3,508 3,756 2,837 3,312 3,325 3,237 3,733
Year 2
Male
2,324 2,543 2,400 2,455 2,202 2,079 2,074 2,157 2,454
Female
604 643 572 617 521 511 613 588 758
Total
2,928 3,186 2,972 3,072 2,723 2,590 2,687 2,745 3,212
Year 3
Male
2,040 2,043 2,066 1,890 1,856 1,345 1,678 1,878
Female
466 490 450 482 448 290 382 468
Total
2,506 2,533 2,516 2,372 2,304 1,635 2,060 2,346
Total
Male 2,365 4,952 7,331 7,185 7,575 6,362 6,462 5,976 6,300 7,162
Female 659 1,298 1,724 1,828 1,769 1,570 1,744 1,671 1,742 1,682
Total 3,024 6,250 9,055 9,013 9,344 7,932 8,206 7,647 8,042 9,291
Percentage of eligible Y.1 intake into BTVET
Male 1.4% 1.6% 1.9% 1.5% 1.6% 1.0% 1.1% 1.1% 1.1% 1.0%
Female 0.5% 0.5% 0.5% 0.5% 0.4% 0.3% 0.4% 0.4% 0.4% 0.4%
Total 1.0% 1.1% 1.2% 1.0% 1.0% 0.6% 0.7% 0.75% 0.75% 0.6%
Transition from Y.1 to Y.2
Male
98.3% 96.8% 87.3% 89.5% 72.1% 91.6% 82.1% 85.4% 94.6%
Female
91.7% 92.7% 93.0% 80.5% 74.2% 90.1% 78.1% 74.9% 92.0%
Total
96.8% 95.9% 88.4% 87.6% 72.5% 91.3% 81.1% 82.9% 94.0%
Transition from Y.2 to Y.3
Male
87.8% 80.3% 86.1% 77.0% 84.3% 64.7% 80.7% 83.0%
Female
77.2% 76.2% 78.7% 78.1% 86.0% 56.8% 74.8% 72.9%
Total
85.6% 79.5% 84.7% 77.2% 84.6% 63.1% 79.5% 78.0%
BTVET UPOLET Eligible students
Year 1
Male
1,701 2,856 2,599 1,799 3,842
Female
453 449 611 353 808
Total
2,154 3,285 3,210 2,152 4,650
Year 2
Male
2,434 2,486 1,721 3,585
Female
413 588 357 834
Total
2,847 3,074 2,078 4,419
Total
Male - - - - - 1,701 5,290 5,085 3,520 7,427
Female - - - - - 453 862 1,199 710 1,642
Total - - - - - 2,154 6,132 6,284 4,230 9,069
19 USE/UPPET July 2016 Headcount Preliminary Results
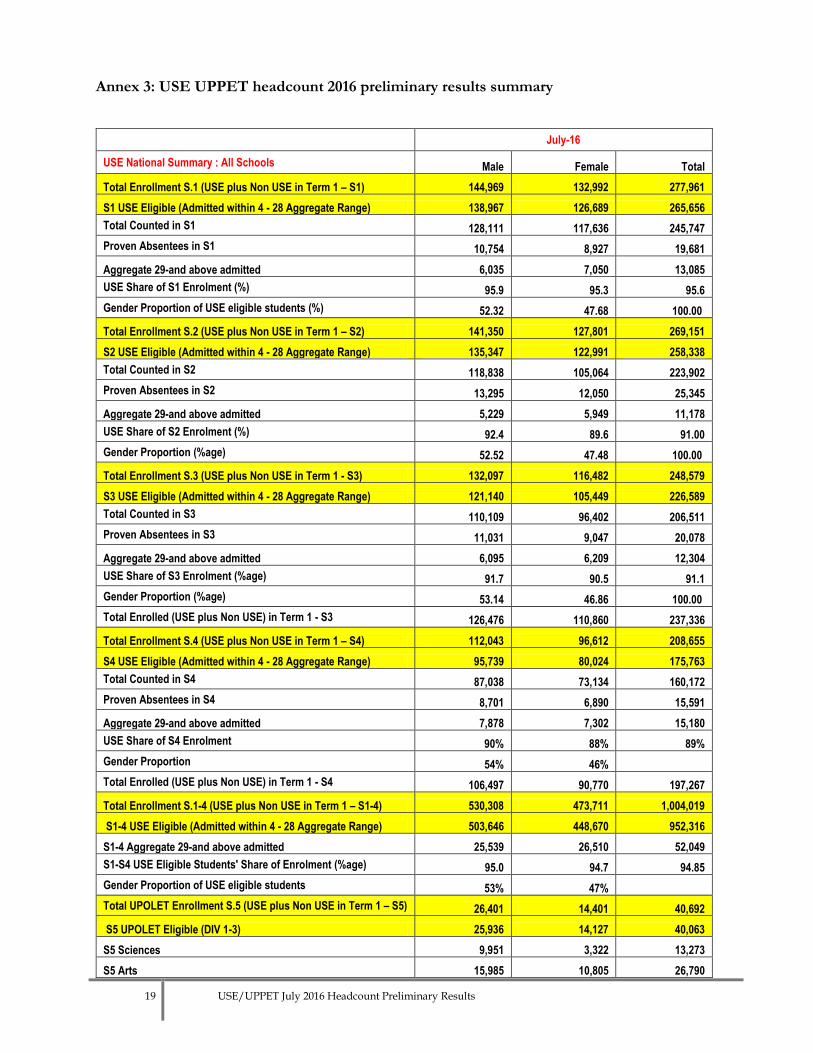
Annex 3: USE UPPET headcount 2016 preliminary results summary
July-16
USE National Summary : All Schools Male Female Total
Total Enrollment S.1 (USE plus Non USE in Term 1 – S1) 144,969 132,992 277,961
S1 USE Eligible (Admitted within 4 - 28 Aggregate Range) 138,967 126,689 265,656
Total Counted in S1 128,111 117,636 245,747
Proven Absentees in S1 10,754 8,927 19,681
Aggregate 29-and above admitted 6,035 7,050 13,085
USE Share of S1 Enrolment (%) 95.9 95.3 95.6
Gender Proportion of USE eligible students (%) 52.32 47.68 100.00
Total Enrollment S.2 (USE plus Non USE in Term 1 – S2) 141,350 127,801 269,151
S2 USE Eligible (Admitted within 4 - 28 Aggregate Range) 135,347 122,991 258,338
Total Counted in S2 118,838 105,064 223,902
Proven Absentees in S2 13,295 12,050 25,345
Aggregate 29-and above admitted 5,229 5,949 11,178
USE Share of S2 Enrolment (%) 92.4 89.6 91.00
Gender Proportion (%age) 52.52 47.48 100.00
Total Enrollment S.3 (USE plus Non USE in Term 1 - S3) 132,097 116,482 248,579
S3 USE Eligible (Admitted within 4 - 28 Aggregate Range) 121,140 105,449 226,589
Total Counted in S3 110,109 96,402 206,511
Proven Absentees in S3 11,031 9,047 20,078
Aggregate 29-and above admitted 6,095 6,209 12,304
USE Share of S3 Enrolment (%age) 91.7 90.5 91.1
Gender Proportion (%age) 53.14 46.86 100.00
Total Enrolled (USE plus Non USE) in Term 1 - S3 126,476 110,860 237,336
Total Enrollment S.4 (USE plus Non USE in Term 1 – S4) 112,043 96,612 208,655
S4 USE Eligible (Admitted within 4 - 28 Aggregate Range) 95,739 80,024 175,763
Total Counted in S4 87,038 73,134 160,172
Proven Absentees in S4 8,701 6,890 15,591
Aggregate 29-and above admitted 7,878 7,302 15,180
USE Share of S4 Enrolment 90% 88% 89%
Gender Proportion 54% 46%
Total Enrolled (USE plus Non USE) in Term 1 - S4 106,497 90,770 197,267
Total Enrollment S.1-4 (USE plus Non USE in Term 1 – S1-4) 530,308 473,711 1,004,019
S1-4 USE Eligible (Admitted within 4 - 28 Aggregate Range) 503,646 448,670 952,316
S1-4 Aggregate 29-and above admitted 25,539 26,510 52,049
S1-S4 USE Eligible Students' Share of Enrolment (%age) 95.0 94.7 94.85
Gender Proportion of USE eligible students 53% 47%
Total UPOLET Enrollment S.5 (USE plus Non USE in Term 1 – S5) 26,401 14,401 40,692
S5 UPOLET Eligible (DIV 1-3) 25,936 14,127 40,063
S5 Sciences 9,951 3,322 13,273
S5 Arts 15,985 10,805 26,790
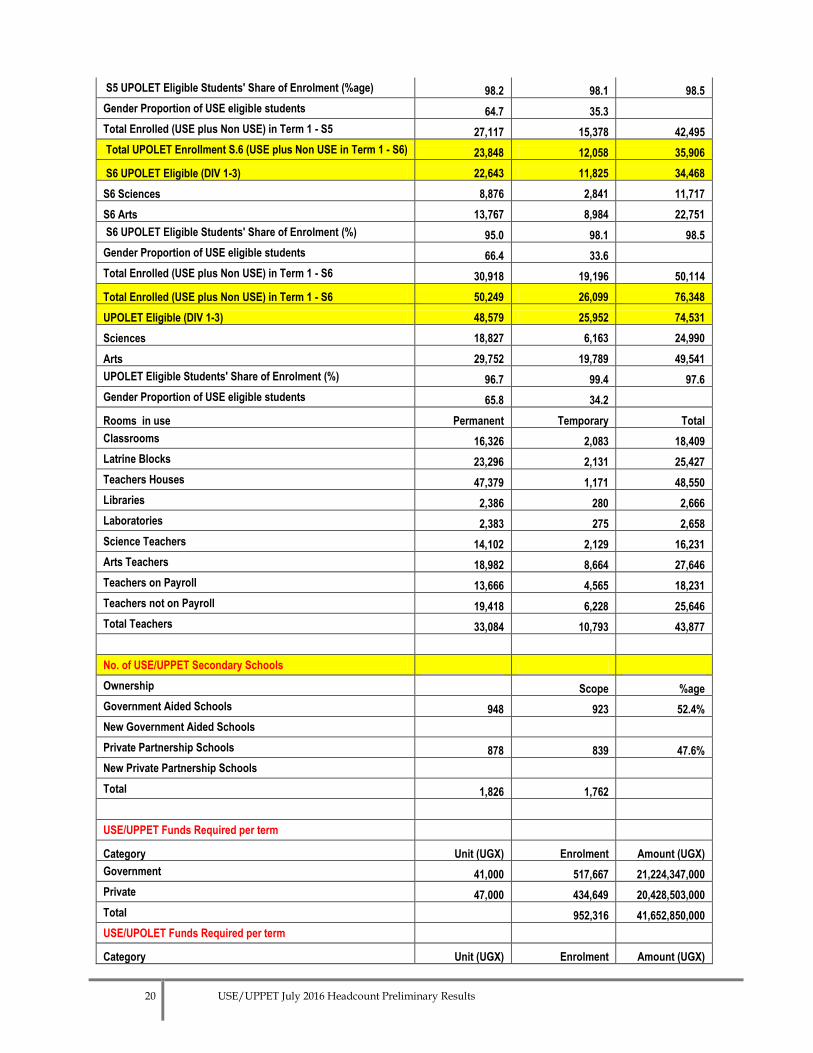
20 USE/UPPET July 2016 Headcount Preliminary Results
S5 UPOLET Eligible Students' Share of Enrolment (%age) 98.2 98.1 98.5
Gender Proportion of USE eligible students 64.7 35.3
Total Enrolled (USE plus Non USE) in Term 1 - S5 27,117 15,378 42,495
Total UPOLET Enrollment S.6 (USE plus Non USE in Term 1 - S6) 23,848 12,058 35,906
S6 UPOLET Eligible (DIV 1-3) 22,643 11,825 34,468
S6 Sciences 8,876 2,841 11,717
S6 Arts 13,767 8,984 22,751
S6 UPOLET Eligible Students' Share of Enrolment (%) 95.0 98.1 98.5
Gender Proportion of USE eligible students 66.4 33.6
Total Enrolled (USE plus Non USE) in Term 1 - S6 30,918 19,196 50,114
Total Enrolled (USE plus Non USE) in Term 1 - S6 50,249 26,099 76,348
UPOLET Eligible (DIV 1-3) 48,579 25,952 74,531
Sciences 18,827 6,163 24,990
Arts 29,752 19,789 49,541
UPOLET Eligible Students' Share of Enrolment (%) 96.7 99.4 97.6
Gender Proportion of USE eligible students 65.8 34.2
Rooms in use Permanent Temporary Total
Classrooms 16,326 2,083 18,409
Latrine Blocks 23,296 2,131 25,427
Teachers Houses 47,379 1,171 48,550
Libraries 2,386 280 2,666
Laboratories 2,383 275 2,658
Science Teachers 14,102 2,129 16,231
Arts Teachers 18,982 8,664 27,646
Teachers on Payroll 13,666 4,565 18,231
Teachers not on Payroll 19,418 6,228 25,646
Total Teachers 33,084 10,793 43,877
No. of USE/UPPET Secondary Schools
Ownership Scope %age
Government Aided Schools 948 923 52.4%
New Government Aided Schools
Private Partnership Schools 878 839 47.6%
New Private Partnership Schools
Total 1,826 1,762
USE/UPPET Funds Required per term
Category Unit (UGX) Enrolment Amount (UGX)
Government 41,000 517,667 21,224,347,000
Private 47,000 434,649 20,428,503,000
Total 952,316 41,652,850,000
USE/UPOLET Funds Required per term
Category Unit (UGX) Enrolment Amount (UGX)
21 USE/UPPET July 2016 Headcount Preliminary Results
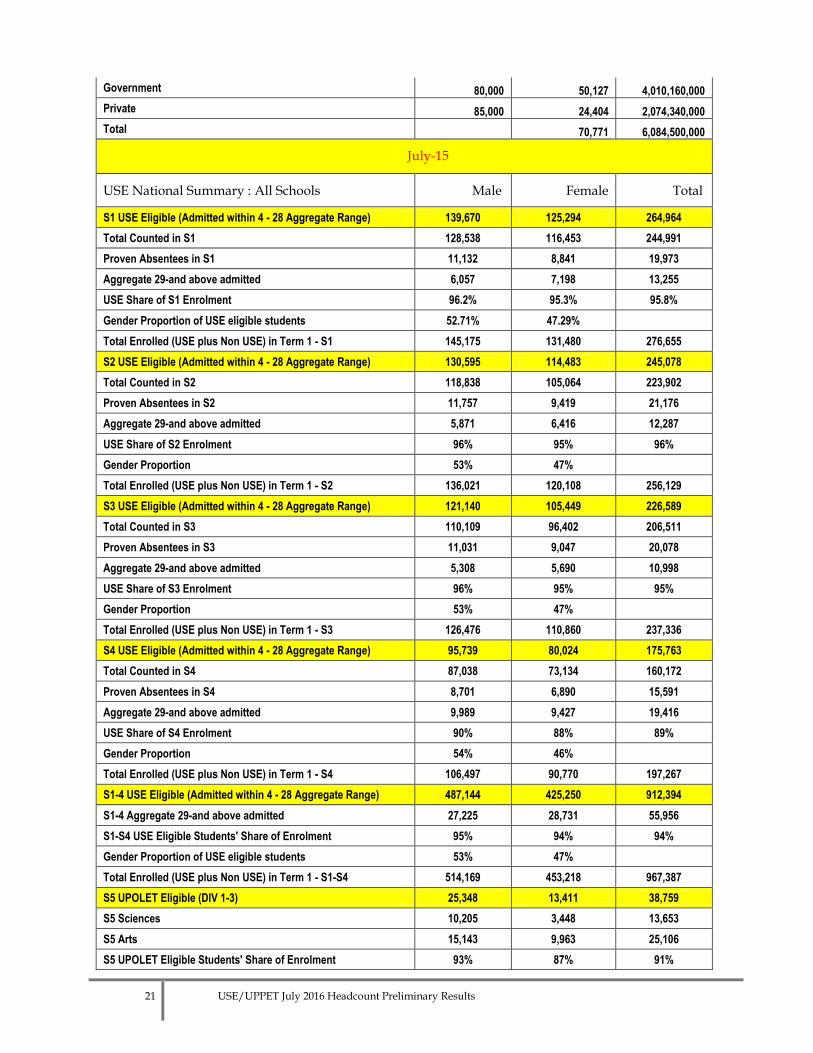
Government 80,000 50,127 4,010,160,000
Private 85,000 24,404 2,074,340,000
Total 70,771 6,084,500,000
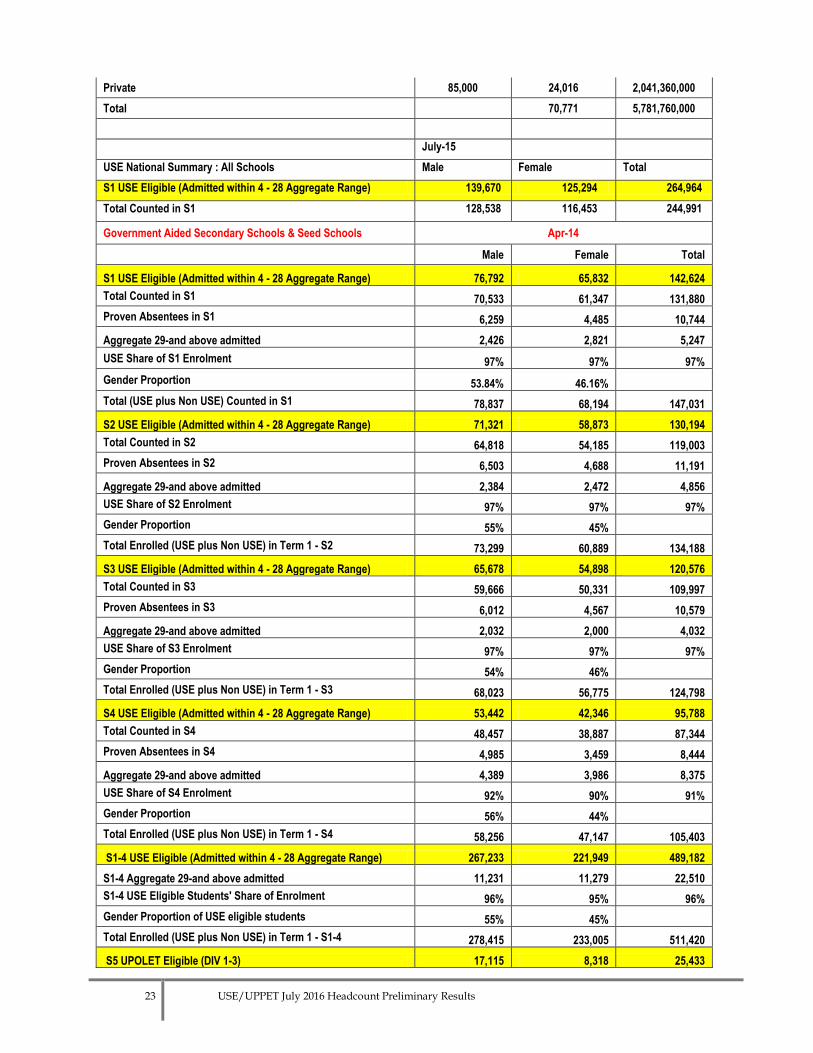
July-15
USE National Summary : All Schools Male Female Total
S1 USE Eligible (Admitted within 4 - 28 Aggregate Range) 139,670 125,294 264,964
Total Counted in S1 128,538 116,453 244,991
Proven Absentees in S1 11,132 8,841 19,973
Aggregate 29-and above admitted 6,057 7,198 13,255
USE Share of S1 Enrolment 96.2% 95.3% 95.8%
Gender Proportion of USE eligible students 52.71% 47.29%
Total Enrolled (USE plus Non USE) in Term 1 - S1 145,175 131,480 276,655
S2 USE Eligible (Admitted within 4 - 28 Aggregate Range) 130,595 114,483 245,078
Total Counted in S2 118,838 105,064 223,902
Proven Absentees in S2 11,757 9,419 21,176
Aggregate 29-and above admitted 5,871 6,416 12,287
USE Share of S2 Enrolment 96% 95% 96%
Gender Proportion 53% 47%
Total Enrolled (USE plus Non USE) in Term 1 - S2 136,021 120,108 256,129
S3 USE Eligible (Admitted within 4 - 28 Aggregate Range) 121,140 105,449 226,589
Total Counted in S3 110,109 96,402 206,511
Proven Absentees in S3 11,031 9,047 20,078
Aggregate 29-and above admitted 5,308 5,690 10,998
USE Share of S3 Enrolment 96% 95% 95%
Gender Proportion 53% 47%
Total Enrolled (USE plus Non USE) in Term 1 - S3 126,476 110,860 237,336
S4 USE Eligible (Admitted within 4 - 28 Aggregate Range) 95,739 80,024 175,763
Total Counted in S4 87,038 73,134 160,172
Proven Absentees in S4 8,701 6,890 15,591
Aggregate 29-and above admitted 9,989 9,427 19,416
USE Share of S4 Enrolment 90% 88% 89%
Gender Proportion 54% 46%
Total Enrolled (USE plus Non USE) in Term 1 - S4 106,497 90,770 197,267
S1-4 USE Eligible (Admitted within 4 - 28 Aggregate Range) 487,144 425,250 912,394
S1-4 Aggregate 29-and above admitted 27,225 28,731 55,956
S1-S4 USE Eligible Students' Share of Enrolment 95% 94% 94%
Gender Proportion of USE eligible students 53% 47%
Total Enrolled (USE plus Non USE) in Term 1 - S1-S4 514,169 453,218 967,387
S5 UPOLET Eligible (DIV 1-3) 25,348 13,411 38,759
S5 Sciences 10,205 3,448 13,653
S5 Arts 15,143 9,963 25,106
S5 UPOLET Eligible Students' Share of Enrolment 93% 87% 91%
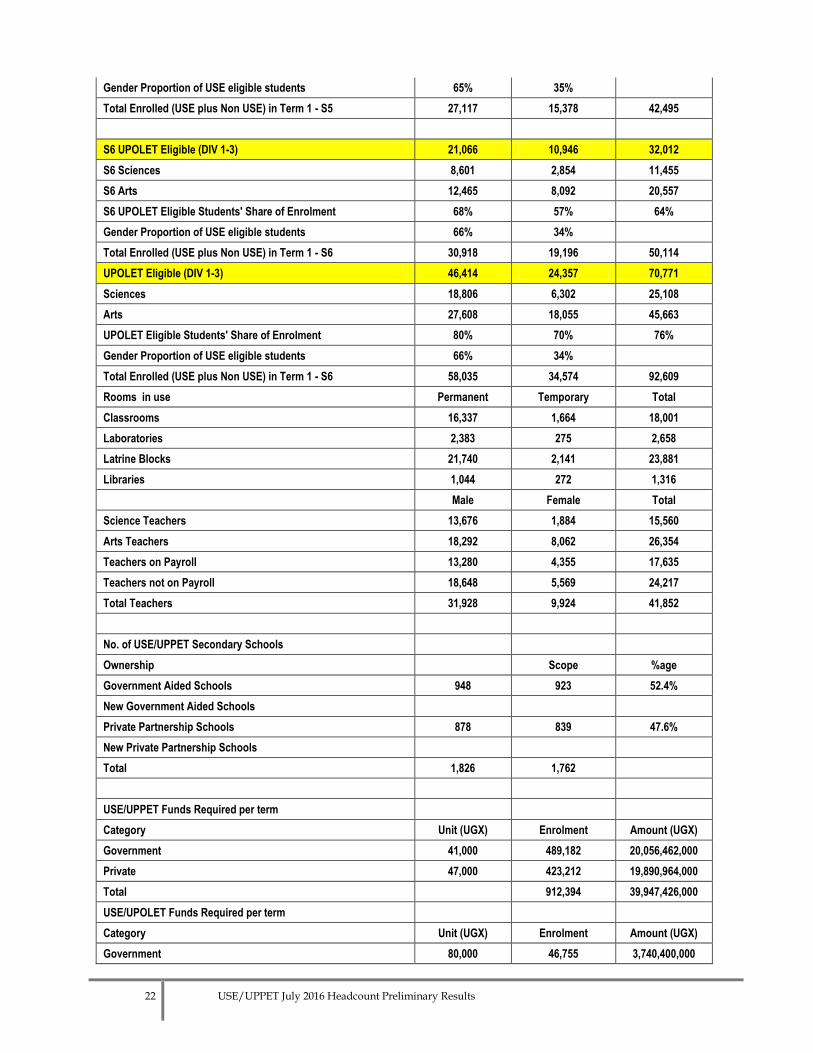
22 USE/UPPET July 2016 Headcount Preliminary Results
Gender Proportion of USE eligible students 65% 35%
Total Enrolled (USE plus Non USE) in Term 1 - S5 27,117 15,378 42,495
S6 UPOLET Eligible (DIV 1-3) 21,066 10,946 32,012
S6 Sciences 8,601 2,854 11,455
S6 Arts 12,465 8,092 20,557
S6 UPOLET Eligible Students' Share of Enrolment 68% 57% 64%
Gender Proportion of USE eligible students 66% 34%
Total Enrolled (USE plus Non USE) in Term 1 - S6 30,918 19,196 50,114
UPOLET Eligible (DIV 1-3) 46,414 24,357 70,771
Sciences 18,806 6,302 25,108
Arts 27,608 18,055 45,663
UPOLET Eligible Students' Share of Enrolment 80% 70% 76%
Gender Proportion of USE eligible students 66% 34%
Total Enrolled (USE plus Non USE) in Term 1 - S6 58,035 34,574 92,609
Rooms in use Permanent Temporary Total
Classrooms 16,337 1,664 18,001
Laboratories 2,383 275 2,658
Latrine Blocks 21,740 2,141 23,881
Libraries 1,044 272 1,316
Male Female Total
Science Teachers 13,676 1,884 15,560
Arts Teachers 18,292 8,062 26,354
Teachers on Payroll 13,280 4,355 17,635
Teachers not on Payroll 18,648 5,569 24,217
Total Teachers 31,928 9,924 41,852
No. of USE/UPPET Secondary Schools
Ownership Scope %age
Government Aided Schools 948 923 52.4%
New Government Aided Schools
Private Partnership Schools 878 839 47.6%
New Private Partnership Schools
Total 1,826 1,762
USE/UPPET Funds Required per term
Category Unit (UGX) Enrolment Amount (UGX)
Government 41,000 489,182 20,056,462,000
Private 47,000 423,212 19,890,964,000
Total 912,394 39,947,426,000
USE/UPOLET Funds Required per term
Category Unit (UGX) Enrolment Amount (UGX)
Government 80,000 46,755 3,740,400,000
23 USE/UPPET July 2016 Headcount Preliminary Results
Private 85,000 24,016 2,041,360,000
Total 70,771 5,781,760,000
July-15
USE National Summary : All Schools Male Female Total
S1 USE Eligible (Admitted within 4 - 28 Aggregate Range) 139,670 125,294 264,964
Total Counted in S1 128,538 116,453 244,991
Government Aided Secondary Schools & Seed Schools Apr-14
Male Female Total
S1 USE Eligible (Admitted within 4 - 28 Aggregate Range) 76,792 65,832 142,624
Total Counted in S1 70,533 61,347 131,880
Proven Absentees in S1 6,259 4,485 10,744
Aggregate 29-and above admitted 2,426 2,821 5,247
USE Share of S1 Enrolment 97% 97% 97%
Gender Proportion 53.84% 46.16%
Total (USE plus Non USE) Counted in S1 78,837 68,194 147,031
S2 USE Eligible (Admitted within 4 - 28 Aggregate Range) 71,321 58,873 130,194
Total Counted in S2 64,818 54,185 119,003
Proven Absentees in S2 6,503 4,688 11,191
Aggregate 29-and above admitted 2,384 2,472 4,856
USE Share of S2 Enrolment 97% 97% 97%
Gender Proportion 55% 45%
Total Enrolled (USE plus Non USE) in Term 1 - S2 73,299 60,889 134,188
S3 USE Eligible (Admitted within 4 - 28 Aggregate Range) 65,678 54,898 120,576
Total Counted in S3 59,666 50,331 109,997
Proven Absentees in S3 6,012 4,567 10,579
Aggregate 29-and above admitted 2,032 2,000 4,032
USE Share of S3 Enrolment 97% 97% 97%
Gender Proportion 54% 46%
Total Enrolled (USE plus Non USE) in Term 1 - S3 68,023 56,775 124,798
S4 USE Eligible (Admitted within 4 - 28 Aggregate Range) 53,442 42,346 95,788
Total Counted in S4 48,457 38,887 87,344
Proven Absentees in S4 4,985 3,459 8,444
Aggregate 29-and above admitted 4,389 3,986 8,375
USE Share of S4 Enrolment 92% 90% 91%
Gender Proportion 56% 44%
Total Enrolled (USE plus Non USE) in Term 1 - S4 58,256 47,147 105,403
S1-4 USE Eligible (Admitted within 4 - 28 Aggregate Range) 267,233 221,949 489,182
S1-4 Aggregate 29-and above admitted 11,231 11,279 22,510
S1-4 USE Eligible Students' Share of Enrolment 96% 95% 96%
Gender Proportion of USE eligible students 55% 45%
Total Enrolled (USE plus Non USE) in Term 1 - S1-4 278,415 233,005 511,420
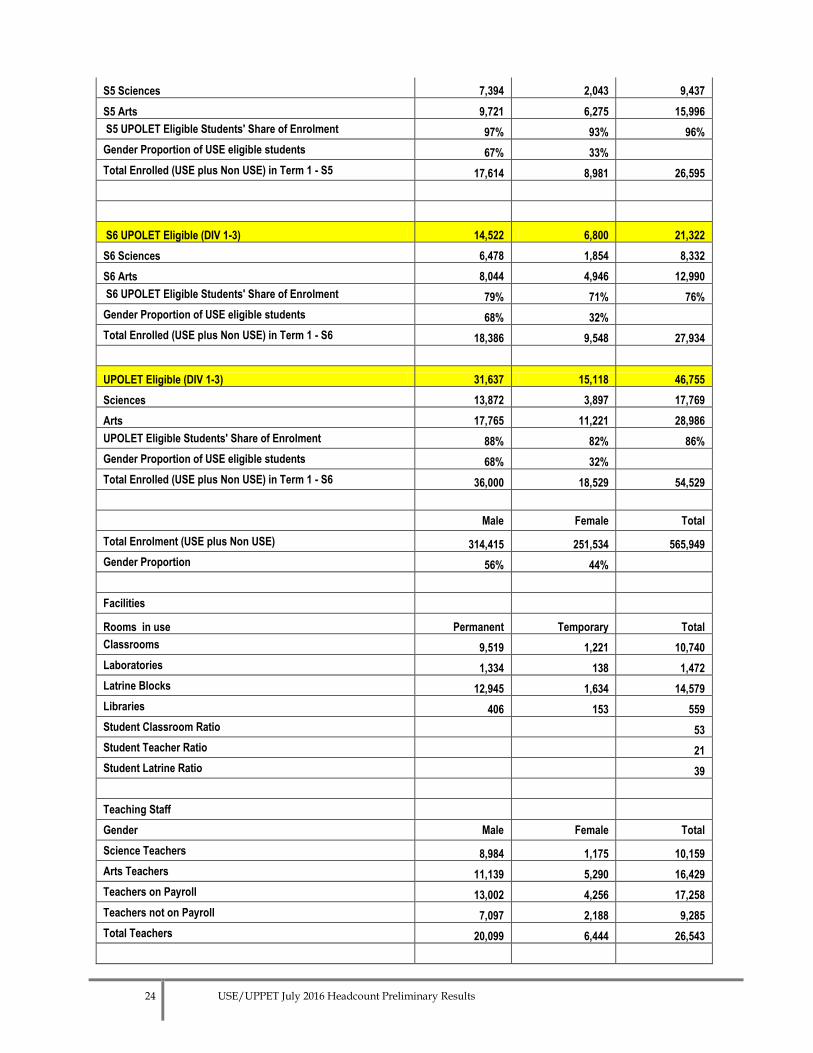
S5 UPOLET Eligible (DIV 1-3) 17,115 8,318 25,433
24 USE/UPPET July 2016 Headcount Preliminary Results
S5 Sciences 7,394 2,043 9,437
S5 Arts 9,721 6,275 15,996
S5 UPOLET Eligible Students' Share of Enrolment 97% 93% 96%
Gender Proportion of USE eligible students 67% 33%
Total Enrolled (USE plus Non USE) in Term 1 - S5 17,614 8,981 26,595
S6 UPOLET Eligible (DIV 1-3) 14,522 6,800 21,322
S6 Sciences 6,478 1,854 8,332
S6 Arts 8,044 4,946 12,990
S6 UPOLET Eligible Students' Share of Enrolment 79% 71% 76%
Gender Proportion of USE eligible students 68% 32%
Total Enrolled (USE plus Non USE) in Term 1 - S6 18,386 9,548 27,934
UPOLET Eligible (DIV 1-3) 31,637 15,118 46,755
Sciences 13,872 3,897 17,769
Arts 17,765 11,221 28,986
UPOLET Eligible Students' Share of Enrolment 88% 82% 86%
Gender Proportion of USE eligible students 68% 32%
Total Enrolled (USE plus Non USE) in Term 1 - S6 36,000 18,529 54,529
Male Female Total
Total Enrolment (USE plus Non USE) 314,415 251,534 565,949
Gender Proportion 56% 44%
Facilities
Rooms in use Permanent Temporary Total
Classrooms 9,519 1,221 10,740
Laboratories 1,334 138 1,472
Latrine Blocks 12,945 1,634 14,579
Libraries 406 153 559
Student Classroom Ratio 53
Student Teacher Ratio 21
Student Latrine Ratio 39
Teaching Staff
Gender Male Female Total
Science Teachers 8,984 1,175 10,159
Arts Teachers 11,139 5,290 16,429
Teachers on Payroll 13,002 4,256 17,258
Teachers not on Payroll 7,097 2,188 9,285
Total Teachers 20,099 6,444 26,543
25 USE/UPPET July 2016 Headcount Preliminary Results
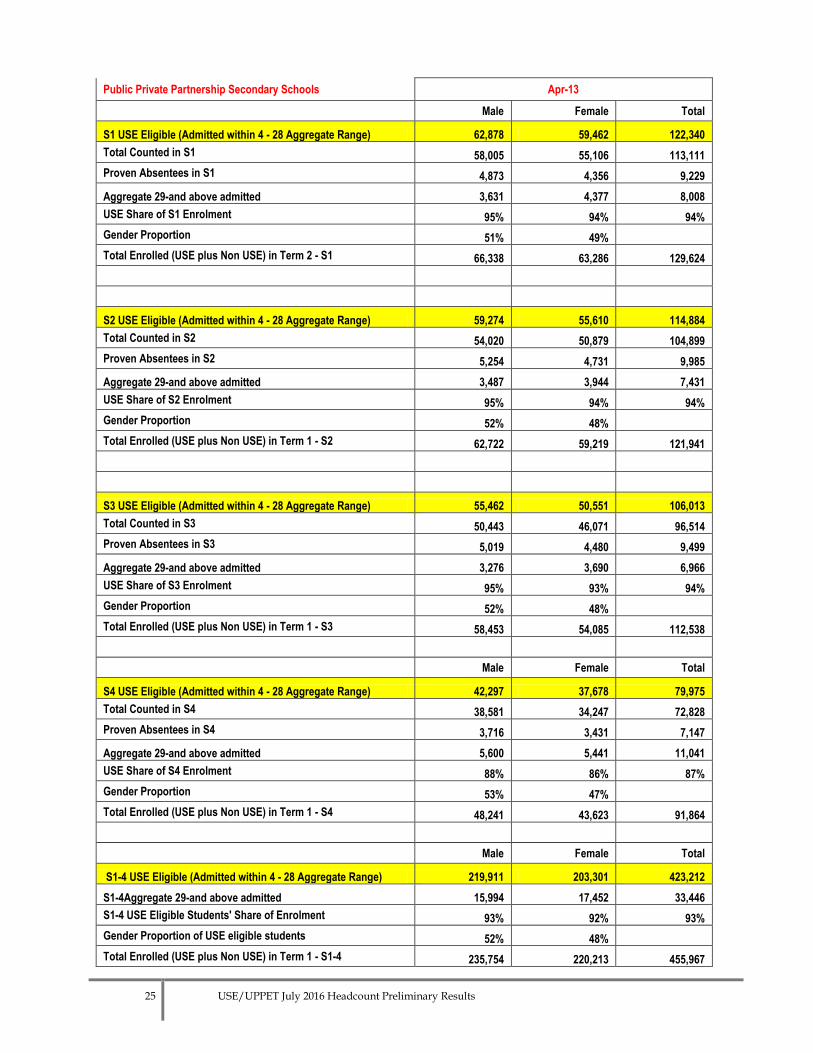
Public Private Partnership Secondary Schools Apr-13
Male Female Total
S1 USE Eligible (Admitted within 4 - 28 Aggregate Range) 62,878 59,462 122,340
Total Counted in S1 58,005 55,106 113,111
Proven Absentees in S1 4,873 4,356 9,229
Aggregate 29-and above admitted 3,631 4,377 8,008
USE Share of S1 Enrolment 95% 94% 94%
Gender Proportion 51% 49%
Total Enrolled (USE plus Non USE) in Term 2 - S1 66,338 63,286 129,624
S2 USE Eligible (Admitted within 4 - 28 Aggregate Range) 59,274 55,610 114,884
Total Counted in S2 54,020 50,879 104,899
Proven Absentees in S2 5,254 4,731 9,985
Aggregate 29-and above admitted 3,487 3,944 7,431
USE Share of S2 Enrolment 95% 94% 94%
Gender Proportion 52% 48%
Total Enrolled (USE plus Non USE) in Term 1 - S2 62,722 59,219 121,941
S3 USE Eligible (Admitted within 4 - 28 Aggregate Range) 55,462 50,551 106,013
Total Counted in S3 50,443 46,071 96,514
Proven Absentees in S3 5,019 4,480 9,499
Aggregate 29-and above admitted 3,276 3,690 6,966
USE Share of S3 Enrolment 95% 93% 94%
Gender Proportion 52% 48%
Total Enrolled (USE plus Non USE) in Term 1 - S3 58,453 54,085 112,538
Male Female Total
S4 USE Eligible (Admitted within 4 - 28 Aggregate Range) 42,297 37,678 79,975
Total Counted in S4 38,581 34,247 72,828
Proven Absentees in S4 3,716 3,431 7,147
Aggregate 29-and above admitted 5,600 5,441 11,041
USE Share of S4 Enrolment 88% 86% 87%
Gender Proportion 53% 47%
Total Enrolled (USE plus Non USE) in Term 1 - S4 48,241 43,623 91,864
Male Female Total
S1-4 USE Eligible (Admitted within 4 - 28 Aggregate Range) 219,911 203,301 423,212
S1-4Aggregate 29-and above admitted 15,994 17,452 33,446
S1-4 USE Eligible Students' Share of Enrolment 93% 92% 93%
Gender Proportion of USE eligible students 52% 48%
Total Enrolled (USE plus Non USE) in Term 1 - S1-4 235,754 220,213 455,967
26 USE/UPPET July 2016 Headcount Preliminary Results
Male Female Total
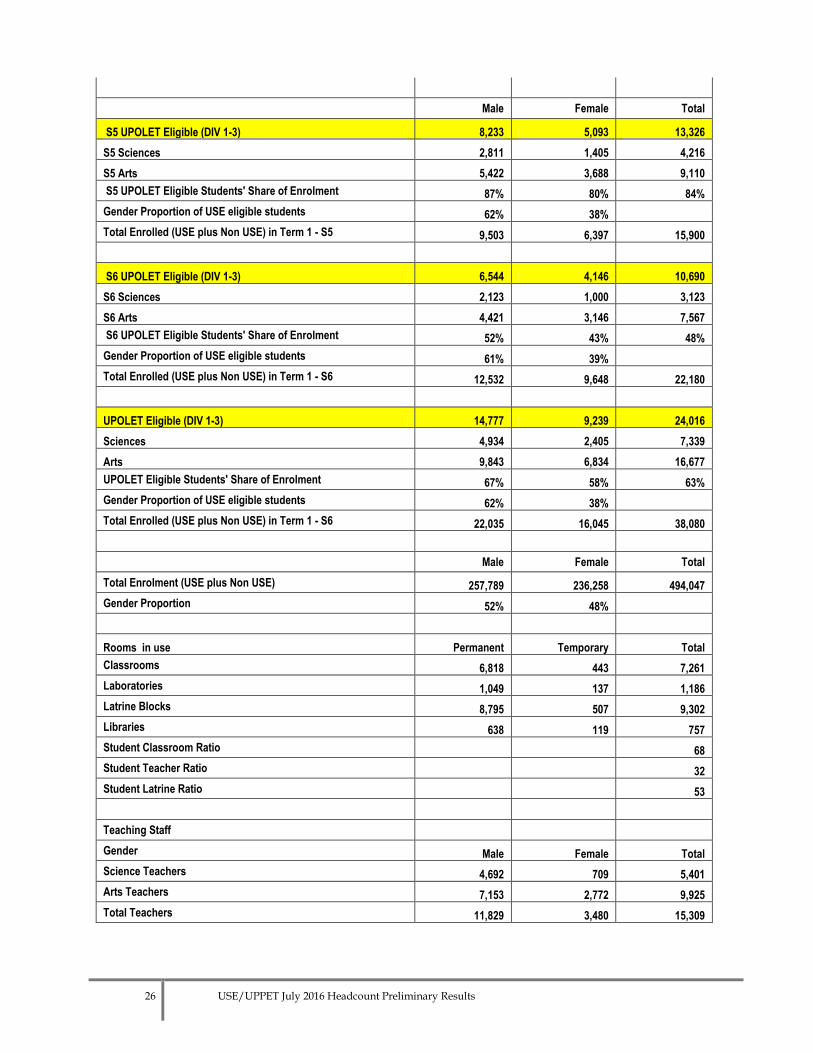
S5 UPOLET Eligible (DIV 1-3) 8,233 5,093 13,326
S5 Sciences 2,811 1,405 4,216
S5 Arts 5,422 3,688 9,110
S5 UPOLET Eligible Students' Share of Enrolment 87% 80% 84%
Gender Proportion of USE eligible students 62% 38%
Total Enrolled (USE plus Non USE) in Term 1 - S5 9,503 6,397 15,900
S6 UPOLET Eligible (DIV 1-3) 6,544 4,146 10,690
S6 Sciences 2,123 1,000 3,123
S6 Arts 4,421 3,146 7,567
S6 UPOLET Eligible Students' Share of Enrolment 52% 43% 48%
Gender Proportion of USE eligible students 61% 39%
Total Enrolled (USE plus Non USE) in Term 1 - S6 12,532 9,648 22,180
UPOLET Eligible (DIV 1-3) 14,777 9,239 24,016
Sciences 4,934 2,405 7,339
Arts 9,843 6,834 16,677
UPOLET Eligible Students' Share of Enrolment 67% 58% 63%
Gender Proportion of USE eligible students 62% 38%
Total Enrolled (USE plus Non USE) in Term 1 - S6 22,035 16,045 38,080
Male Female Total
Total Enrolment (USE plus Non USE) 257,789 236,258 494,047
Gender Proportion 52% 48%
Rooms in use Permanent Temporary Total
Classrooms 6,818 443 7,261
Laboratories 1,049 137 1,186
Latrine Blocks 8,795 507 9,302
Libraries 638 119 757
Student Classroom Ratio 68
Student Teacher Ratio 32
Student Latrine Ratio 53
Teaching Staff
Gender Male Female Total
Science Teachers 4,692 709 5,401
Arts Teachers 7,153 2,772 9,925
Total Teachers 11,829 3,480 15,309

27 USE/UPPET July 2016 Headcount Preliminary Results
28 USE/UPPET July 2016 Headcount Preliminary Results
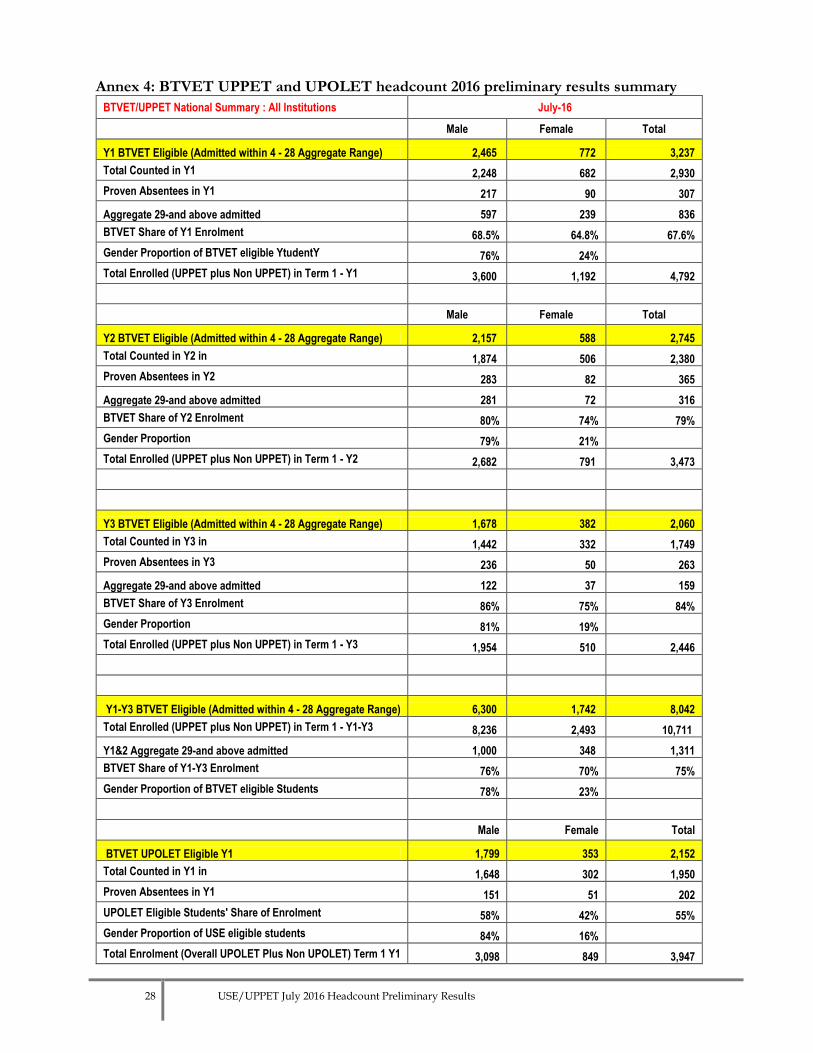
Annex 4: BTVET UPPET and UPOLET headcount 2016 preliminary results summary
BTVET/UPPET National Summary : All Institutions July-16
Male Female Total
Y1 BTVET Eligible (Admitted within 4 - 28 Aggregate Range) 2,465 772 3,237
Total Counted in Y1 2,248 682 2,930
Proven Absentees in Y1 217 90 307
Aggregate 29-and above admitted 597 239 836
BTVET Share of Y1 Enrolment 68.5% 64.8% 67.6%
Gender Proportion of BTVET eligible YtudentY 76% 24%
Total Enrolled (UPPET plus Non UPPET) in Term 1 - Y1 3,600 1,192 4,792
Male Female Total
Y2 BTVET Eligible (Admitted within 4 - 28 Aggregate Range) 2,157 588 2,745
Total Counted in Y2 in 1,874 506 2,380
Proven Absentees in Y2 283 82 365
Aggregate 29-and above admitted 281 72 316
BTVET Share of Y2 Enrolment 80% 74% 79%
Gender Proportion 79% 21%
Total Enrolled (UPPET plus Non UPPET) in Term 1 - Y2 2,682 791 3,473
Y3 BTVET Eligible (Admitted within 4 - 28 Aggregate Range) 1,678 382 2,060
Total Counted in Y3 in 1,442 332 1,749
Proven Absentees in Y3 236 50 263
Aggregate 29-and above admitted 122 37 159
BTVET Share of Y3 Enrolment 86% 75% 84%
Gender Proportion 81% 19%
Total Enrolled (UPPET plus Non UPPET) in Term 1 - Y3 1,954 510 2,446
Y1-Y3 BTVET Eligible (Admitted within 4 - 28 Aggregate Range) 6,300 1,742 8,042
Total Enrolled (UPPET plus Non UPPET) in Term 1 - Y1-Y3 8,236 2,493 10,711
Y1&2 Aggregate 29-and above admitted 1,000 348 1,311
BTVET Share of Y1-Y3 Enrolment 76% 70% 75%
Gender Proportion of BTVET eligible Students 78% 23%
Male Female Total
BTVET UPOLET Eligible Y1 1,799 353 2,152
Total Counted in Y1 in 1,648 302 1,950
Proven Absentees in Y1 151 51 202
UPOLET Eligible Students' Share of Enrolment 58% 42% 55%
Gender Proportion of USE eligible students 84% 16%
Total Enrolment (Overall UPOLET Plus Non UPOLET) Term 1 Y1 3,098 849 3,947
29 USE/UPPET July 2016 Headcount Preliminary Results
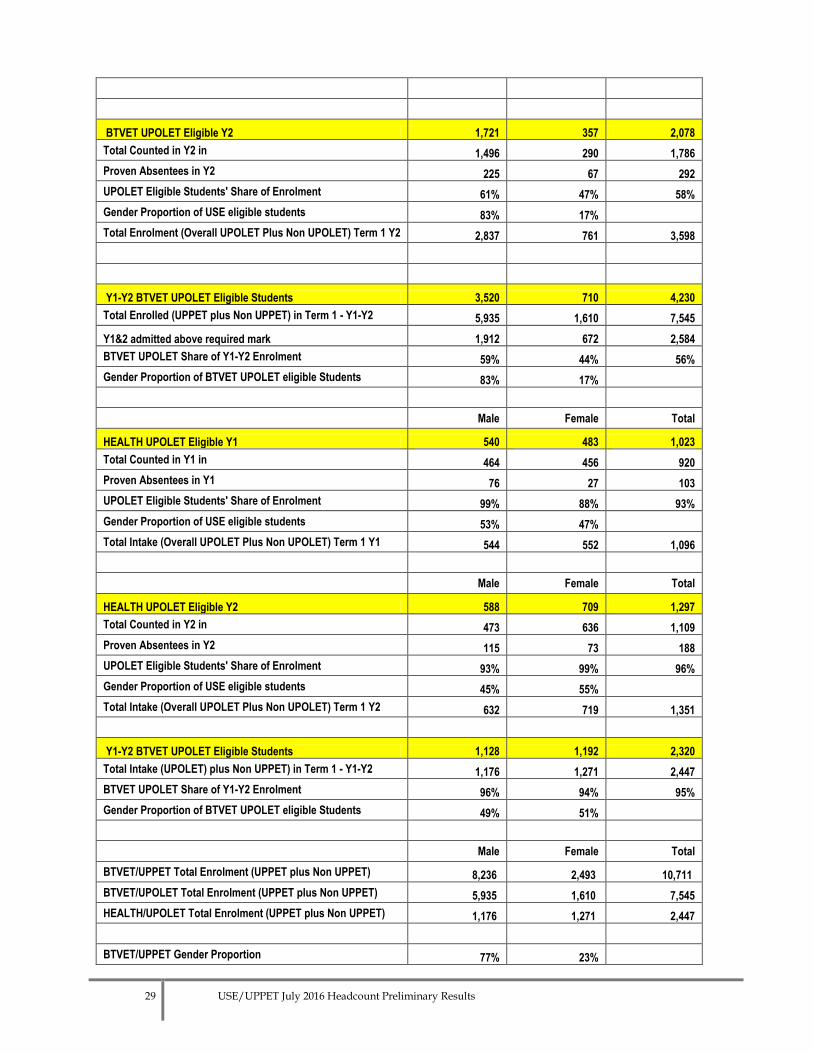
BTVET UPOLET Eligible Y2 1,721 357 2,078
Total Counted in Y2 in 1,496 290 1,786
Proven Absentees in Y2 225 67 292
UPOLET Eligible Students' Share of Enrolment 61% 47% 58%
Gender Proportion of USE eligible students 83% 17%
Total Enrolment (Overall UPOLET Plus Non UPOLET) Term 1 Y2 2,837 761 3,598
Y1-Y2 BTVET UPOLET Eligible Students 3,520 710 4,230
Total Enrolled (UPPET plus Non UPPET) in Term 1 - Y1-Y2 5,935 1,610 7,545
Y1&2 admitted above required mark 1,912 672 2,584
BTVET UPOLET Share of Y1-Y2 Enrolment 59% 44% 56%
Gender Proportion of BTVET UPOLET eligible Students 83% 17%
Male Female Total
HEALTH UPOLET Eligible Y1 540 483 1,023
Total Counted in Y1 in 464 456 920
Proven Absentees in Y1 76 27 103
UPOLET Eligible Students' Share of Enrolment 99% 88% 93%
Gender Proportion of USE eligible students 53% 47%
Total Intake (Overall UPOLET Plus Non UPOLET) Term 1 Y1 544 552 1,096
Male Female Total
HEALTH UPOLET Eligible Y2 588 709 1,297
Total Counted in Y2 in 473 636 1,109
Proven Absentees in Y2 115 73 188
UPOLET Eligible Students' Share of Enrolment 93% 99% 96%
Gender Proportion of USE eligible students 45% 55%
Total Intake (Overall UPOLET Plus Non UPOLET) Term 1 Y2 632 719 1,351
Y1-Y2 BTVET UPOLET Eligible Students 1,128 1,192 2,320
Total Intake (UPOLET) plus Non UPPET) in Term 1 - Y1-Y2 1,176 1,271 2,447
BTVET UPOLET Share of Y1-Y2 Enrolment 96% 94% 95%
Gender Proportion of BTVET UPOLET eligible Students 49% 51%
Male Female Total
BTVET/UPPET Total Enrolment (UPPET plus Non UPPET) 8,236 2,493 10,711
BTVET/UPOLET Total Enrolment (UPPET plus Non UPPET) 5,935 1,610 7,545
HEALTH/UPOLET Total Enrolment (UPPET plus Non UPPET) 1,176 1,271 2,447
BTVET/UPPET Gender Proportion 77% 23%
30 USE/UPPET July 2016 Headcount Preliminary Results
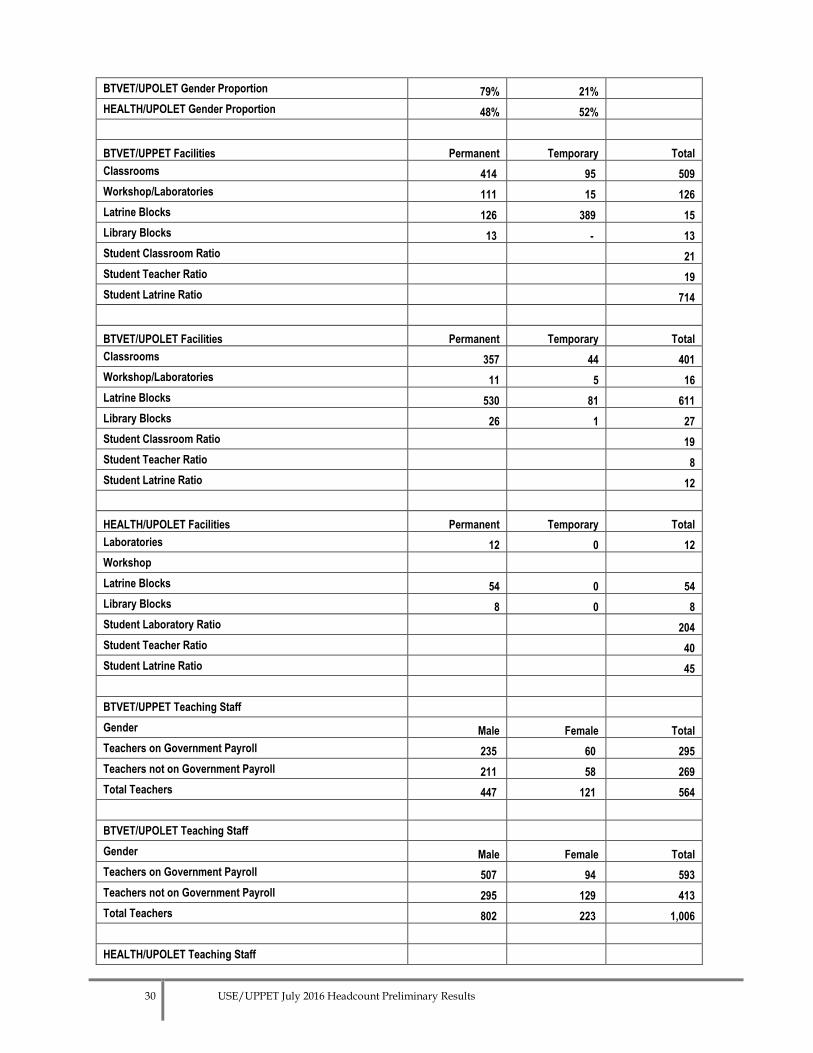
BTVET/UPOLET Gender Proportion 79% 21%
HEALTH/UPOLET Gender Proportion 48% 52%
BTVET/UPPET Facilities Permanent Temporary Total
Classrooms 414 95 509
Workshop/Laboratories 111 15 126
Latrine Blocks 126 389 15
Library Blocks 13 - 13
Student Classroom Ratio 21
Student Teacher Ratio 19
Student Latrine Ratio 714
BTVET/UPOLET Facilities Permanent Temporary Total
Classrooms 357 44 401
Workshop/Laboratories 11 5 16
Latrine Blocks 530 81 611
Library Blocks 26 1 27
Student Classroom Ratio 19
Student Teacher Ratio 8
Student Latrine Ratio 12
HEALTH/UPOLET Facilities Permanent Temporary Total
Laboratories 12 0 12
Workshop
Latrine Blocks 54 0 54
Library Blocks 8 0 8
Student Laboratory Ratio 204
Student Teacher Ratio 40
Student Latrine Ratio 45
BTVET/UPPET Teaching Staff
Gender Male Female Total
Teachers on Government Payroll 235 60 295
Teachers not on Government Payroll 211 58 269
Total Teachers 447 121 564
BTVET/UPOLET Teaching Staff
Gender Male Female Total
Teachers on Government Payroll 507 94 593
Teachers not on Government Payroll 295 129 413
Total Teachers 802 223 1,006
HEALTH/UPOLET Teaching Staff
31 USE/UPPET July 2016 Headcount Preliminary Results
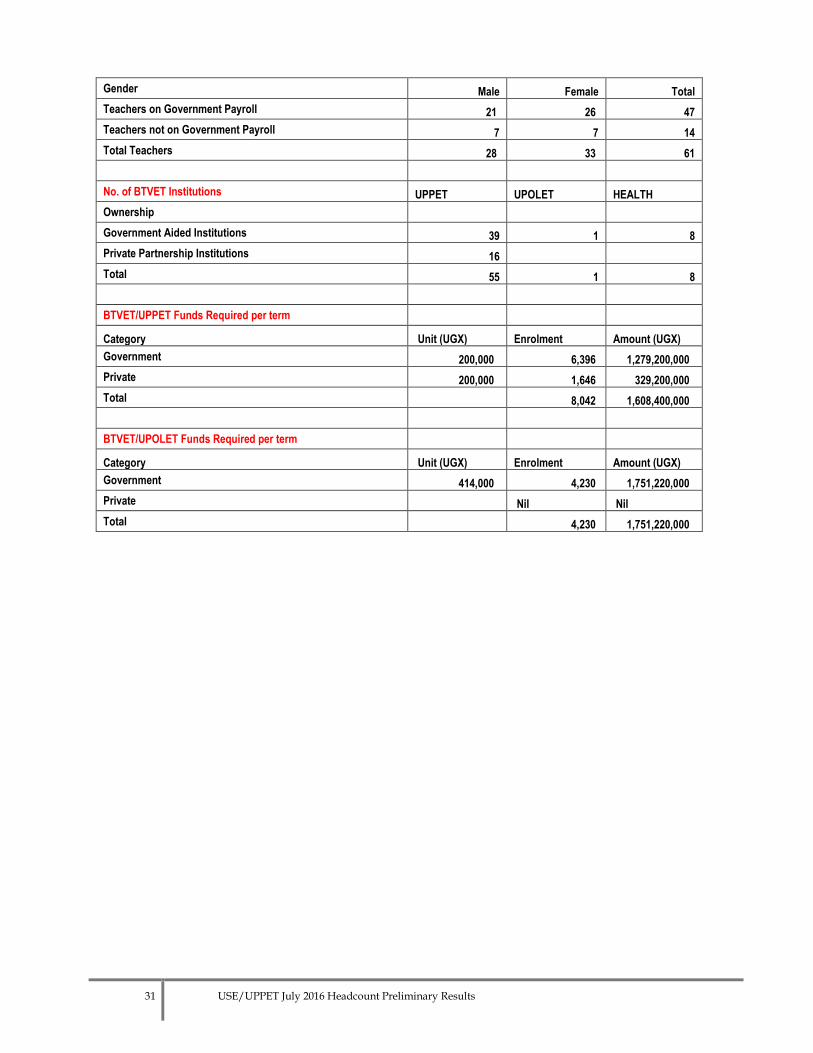
Gender Male Female Total
Teachers on Government Payroll 21 26 47
Teachers not on Government Payroll 7 7 14
Total Teachers 28 33 61
No. of BTVET Institutions UPPET UPOLET HEALTH
Ownership
Government Aided Institutions 39 1 8
Private Partnership Institutions 16
Total 55 1 8
BTVET/UPPET Funds Required per term
Category Unit (UGX) Enrolment Amount (UGX)
Government 200,000 6,396 1,279,200,000
Private 200,000 1,646 329,200,000
Total 8,042 1,608,400,000
BTVET/UPOLET Funds Required per term
Category Unit (UGX) Enrolment Amount (UGX)
Government 414,000 4,230 1,751,220,000
Private Nil Nil
Total 4,230 1,751,220,000