Embed Size (px)
Citation preview
ResultsoftheEarlyMathProject–Scale‐UpCross‐SiteResults
WorkingPaper
KerryG.Hofer,Ph.D.MarkW.Lipsey,Ph.D.NianboDong,Ph.D.DaleC.Farran,Ph.D.
June2013
PeabodyResearchInstitute,VanderbiltUniversity
1
Director MarkW.Lipsey,Ph.D.
SeniorAssociateDirector AssociateDirectorDaleC.Farran,Ph.D. SandraJoWilson,Ph.D.
PeabodyResearchInstitute
VanderbiltUniversity
Ourmissionistoconductresearchaimedatimprovingtheeffectivenessofprogramsforchildren,youth,andfamilies.Usingfieldresearch,programevaluation,andresearchsynthesis(meta‐analysis),ourfacultyandstaffhelpdeterminewhichprogramsareactuallymakingadifferenceinthelivesofthepeopletheyserve.PRIresearchaddressesmanyaspectsofchildandfamilyprograms,suchastheirimplementation,costs,dissemination,andsocialorpoliticalsupport.Butthemainfocusforallofourworkistheeffectsofprogramsonchildrenandfamilies.
RecommendedCitation:Hofer,K.G.,Lipsey,M.W.,Dong,N.,&Farran,D.C.(2013).ResultsoftheEarlyMathProject
–Scale‐UpCross‐SiteResults(WorkingPaper).Nashville,TN:VanderbiltUniversity,PeabodyResearchInstitute.
FundingSource:ThisresearchwasconductedinpartnershipwithDougClementsandJulieSaramaattheUniversityatBuffaloSUNY(recentlymovedtotheUniversityofColorado).Thisreportincludesdatafromthethreesitesoftheproject–Tennessee,NewYork,andMassachusetts.ThelattertwositescontributedtheirdataforthisreportthroughClementsandSarama,andalldataweresynthesizedandanalyzedattheTennesseesite.TheprojectwasfundedthroughtheInstituteofEducationSciencesandwasawardedtoPrincipalInvestigatorsDougClementsandJulieSarama(Technology‐enhancedResearch‐basedInstruction,Assessment,andProfessionalDevelopment,#R305K050157),withasubcontracttoDaleFarranandMarkLipsey,VanderbiltUniversity.ContactUs:Phone:615.322.8540 Fax:615.322.0293
http://peabody.vanderbilt.edu/research/priDisclaimerTheopinionsexpressedinthisreportaretheauthors’anddonotnecessarilyrepresenttheopinionsandpositionsoftheInstituteofEducationSciencesoftheU.S.DepartmentofEducation.
MailingAddress: DeliveryAddress:PeabodyResearchInstitute230AppletonPlacePMB181Nashville,TN37203‐5721
PeabodyResearchInstitute1930SouthDriveRoom410ANashville,TN37212
PeabodyResearchInstitute,VanderbiltUniversity
2
TRIADProjectTennesseeStaff,2006‐2012
PrincipalInvestigator:DaleC.Farran,SeniorAssociateDirector,PeabodyResearch
InstituteandProfessor,Dept.ofTeachingandLearning;[email protected].
Co‐PrincipalInvestigator:MarkW.Lipsey,Director,PeabodyResearchInstitute;[email protected].
ProjectCoordinators:CarolBilbreyandRachaelTanner‐Smith.DataManagers/Analysts:KerryG.Hofer,NianboDong,andSandraWilson.ResearchAssistants:BethVorhaus,IlknurSekmen,ChristyPlummer,CatherineFleming, andMarianneReale.GraduateResearchAssistants:KarenAnthony,CananAydogan,TracyCummings,Linda Dake,KelleyDrennan,SarahShufelt,FilizVarol,andBetsyWatson.Facilitators:SusanBrown(MetroActionCouncil),AnitaConn(MetroActionCouncil), PennyFranklin(MetropolitanNashvillePublicSchools),andPattyTurner (MetropolitanNashvillePublicSchools).AssessorsandObserversacrossMiddleTennessee.
PeabodyResearchInstitute,VanderbiltUniversity
3
ResultsoftheEarlyMathProject–Scale‐UpCross‐SiteResults
TableofContents PageStaffandContactInformation...............................................................................................................2TableofContents........................................................................................................................................3ListofTables.................................................................................................................................................4ListofFigures...............................................................................................................................................7Summary........................................................................................................................................................8StudyDesign.................................................................................................................................................8InterventionDescription...................................................................................................................8ProfessionalDevelopmentandCoaching...................................................................................9Sample.............................................................................................................................................................9Children..................................................................................................................................................10Measures.....................................................................................................................................................10DirectAssessments...........................................................................................................................10ClassroomandChildObservationMeasures..........................................................................10DataAnalysisandResults....................................................................................................................11Descriptives..........................................................................................................................................11MissingData.........................................................................................................................................11BaselineEquivalence........................................................................................................................11ResearchQuestion1:ImmediateandLongitudinalInterventionEffects................15ResearchQuestion2:VariationinEffectsacrossSites.....................................................15ResearchQuestion3:CurricularEffectsforSubgroupsofChildren...........................18ResearchQuestion4:EffectsofMathEnvironmentandFidelityofImplementationonGain.....................................................................................................................................................19
SummaryofResultsbyResearchQuestion..................................................................................27References..................................................................................................................................................29Appendices.................................................................................................................................................30AppendixA............................................................................................................................................31AppendixB............................................................................................................................................73
PeabodyResearchInstitute,VanderbiltUniversity
4
ListofTables
1:SampleofSchoolsandClassroomsbySiteandCondition2:REMAT‐ScoreDescriptiveStatistics(Unadjusted,Unimputed)byConditionandSite, CompleteSample3:CompleteandCommonSamples:BaselineCovariateComparisonacrossConditions4:CompleteandCommonSamples:BaselineREMAPretestRandomizationCheck(Overall andbySite)5:CompleteandCommonSamples:MainEffectsResultsforEachTimePoint6:IndividualSiteContrastsfromtheModelIncludingtheSitexConditionInteraction (CompleteSample)7:ConditionEffectsonREMAScoresforSitesAnalyzedSeparately8:ConditionxChildCharacteristicInteractionsintheCompleteSample(eachmoderator examinedinaseparateanalysis)9:DescriptiveStatisticsforPre‐KClassroomsontheCOEMETbyConditionandSite10:DescriptiveStatisticsforTreatmentClassroomsontheNearFidelitySubscalesbySite11:NearFidelityAdditiveScoreDescriptivesbySiteandOverall12:PredictingPre‐KgainfromSeparateNearFidelitySettingFactorScores13:CorrelationsbetweentheCOEMETCompositeandNearFidelityCompositeacross TreatmentClassrooms(OverallandbySite)
A1:SampleSizesbyTime(Series1–completesample)A2:DescriptiveStatisticsbyCondition:ChildLevelVariables(Series1)A3:DescriptiveStatisticsbySiteandCondition:ChildLevelVariables(Series1)A4:FixedandRandomEffectsAnalysisforREMAOutcome‐CompleteSample:Time2
(Series1)A5:FixedandRandomEffectsAnalysisforREMAOutcome‐CompleteSample:Time3
(Series1)A6:FixedandRandomEffectsAnalysisforREMAOutcome‐CompleteSample:Time4
(Series1)A7:FixedandRandomEffectsAnalysisforREMAOutcome‐CompleteSamplewith
ConditionxSiteInteraction:Time2(Series1)A8:FixedandRandomEffectsAnalysisforREMAOutcome‐CompleteSamplewith
ConditionxSiteInteraction:Time3(Series1)A9:FixedandRandomEffectsAnalysisforREMAOutcome‐CompleteSamplewith
ConditionxSiteInteraction:Time4(Series1)A10:FixedandRandomEffectsAnalysisforREMAOutcome‐Bysite:Time2(Series1)A11:FixedandRandomEffectsAnalysisforREMAOutcome‐Bysite:Time3(Series1)A12:FixedandRandomEffectsAnalysisforREMAOutcome‐Bysite:Time4(Series1)A13:SummaryofModeratorAnalysesforREMAOutcome:Time2(Series1)A14:SummaryofModeratorAnalysesforREMAOutcome:Time3(Series1)A15:SummaryofModeratorAnalysesforREMAOutcome:Time4(Series1)A16:3‐wayInteractionofPretestbyConditionbySiteforREMAOutcome(Complete
Sample)A17:Pretest(site‐meancentering)asaModeratorbySiteforREMAOutcome(Complete
Sample:Time2)
PeabodyResearchInstitute,VanderbiltUniversity
5
A18:Pretest(site‐meancentering)asaModeratorbySiteforREMAOutcome(CompleteSample:Time3)
A19:Pretest(site‐meancentering)asaModeratorbySiteforREMAOutcome(CompleteSample:Time4)
A20:P‐valuesofTestingDifferencesofCOEMETMeasuresacrossSiteandConditionA21:DetailedResultsofTestingDifferencesofCOEMETMeasuresacrossSiteand
ConditionA22:FactorLoadingsoftheCOEMETCompositeVariableA23:COEMETCompositeVariablePredictingPre‐KREMAGain(Series1:Time2)A24:COEMETSite‐CenteredSubscalesPredictingREMAPre‐KGain(Series1:Time2)A25:COEMETCompositeVariablePredictingREMAGainthroughK(Series1:Time3)A26:COEMETSite‐CenteredSubscalesPredictingREMAGainthroughK(Series1:Time3)A27:COEMETCompositeVariablePredictingREMAGainthrough1stGrade(Series1:Time
4)A28:COEMETSite‐CenteredSubscalesPredictingREMAGainthrough1stGrade(Series1:
Time4)A29:TheCOEMETCompositeVariableasaModeratoroftheEffectsofConditiononREMA
GainDuringPre‐K(Series1:Time2)A30:AnalysisoftheCOEMETCompositeVariableasaMediatortheEffectsofConditionon
theREMADuringPre‐K.Part1:SampleSizeandModelFitStatistics(Series1:Time2)
A31:AnalysisoftheCOEMETCompositeVariableasaMediatortheEffectsofConditiononREMADuringPre‐K.Part2:Level1WithinClassroomResults(Series1:Time2)
A32:AnalysisoftheCOEMETCompositeVariableasaMediatortheEffectsofConditiononREMADuringPre‐K.Part3:Level2BetweenSchoolResults(Series1:Time2)
A33:FactorLoadingsoftheNearFidelityItemsWithinSettingA34:Zero‐orderCorrelationsamongNearFidelityScoresandClassroomMean ResidualizedGainA35:FixedandRandomEffectsofNearFidelityComposite:Time2A36:FixedEffectsofNearFidelitySettingVariables:Time2(FullTreatment Sample)A37:FixedEffectsofNearFidelitySettingVariables:Time2(ReducedSample)A38:FixedEffectsofNearFidelityAdditiveCompositeonREMAGain,controllingforCOEMETComposite:Time2
B1:SampleSizesbyTime(Series2–CommonSample)B2:DescriptiveStatisticsbyConditionacrosstime:ChildLevelVariables(Series2)B3:DescriptiveStatisticsbySiteandCondition:ChildLevelVariables(Series2)B4:FixedandRandomEffectsfortheREMAOutcome–CommonSample:Time2(Series2)B5:FixedandRandomEffectsfortheREMAOutcome‐CommonSample:Time3(Series2)B6:FixedandRandomEffectsfortheREMAOutcome‐CommonSample:Time4(Series2)B7:FixedandRandomEffectsfortheREMAOutcome–CommonSamplewithConditionx
SiteInteraction:Time2(Series2)
PeabodyResearchInstitute,VanderbiltUniversity
6
B8:FixedandRandomEffectsfortheREMAOutcome‐CommonSamplewithConditionxSiteInteraction:Time3(Series2)
B9:FixedandRandomEffectsfortheREMAOutcome‐CommonSamplewithConditionxSiteInteraction:Time4(Series2)
B10:FixedandRandomEffectsfortheREMAOutcome‐Bysite:Time2(Series2)B11:FixedandRandomEffectsfortheREMAOutcome‐Bysite:Time3(Series2)B12:FixedandRandomEffectsfortheREMAOutcome‐Bysite:Time4(Series2)B13:SummaryofModeratorAnalysesforREMAOutcome:Time2(Series2)B14:SummaryofModeratorAnalysesforREMAOutcome:Time3(Series2)B15:SummaryofModeratorAnalysesforREMAOutcome:Time4(Series2)
PeabodyResearchInstitute,VanderbiltUniversity
7
ListofFigures
1:Covariate‐adjustedREMAt‐scoresacrosstimebysettingandcondition2.Level1ofSEMMediationAnalysis:ClassroomswithinSchools3.Level2ofSEMMediationAnalysis:BetweenSchools
A1:LeastSquareREMAMeansbyConditionandTime(Series1)A2:EffectSizeontheREMAbyConditionandTime(Series1)A3:LeastSquareREMAMeansbySite,Condition,andTime(Series1)
B1:LeastSquareREMAMeansbyConditionandTime(Series2)B2:EffectSizeontheREMAbyConditionandTime(Series2)B3:LeastSquareREMAMeansbySite,Condition,andTime(Series2)

PeabodyResearchInstitute,VanderbiltUniversity
8
ResultsoftheEarlyMathProject–Scale‐UpCross‐SiteResults
Summary
Thisreportsummarizestheresultsofascale‐upprojectfundedbytheInstituteofEducationSciencesin2006.ScalingupTRIAD:TeachingEarlyMathematicsforUnderstandingwithTrajectoriesandTechnologieswasaprojectthattookapreschoolmathematicsinterventiontoscaleacrossthreesites,followingchildrenfromtheirPrekindergartenyear‐‐inwhichtheinterventionwasdelivered‐‐throughfirstgrade.
Thisstudywasdesignedtoexplorethefollowingresearchquestions:
1. Whataretheimmediateandlong‐termeffectsoftheinterventiononchildren’smathskills?
2. Howmuchvariationwasthereineffectsacrosssites?3. Werecurriculareffectsdifferentfordifferentsubgroupsofchildren?4. Whataretheeffectsofthemathenvironmentandthefidelityofimplementationon
children’simmediateandlongtermmathgains,overallandacrosssites?
StudyDesign
Inordertoanswertheresearchquestionsofinterest,weconductedaclusterrandomizedcontrolledtrialinwhichschoolswererandomlyassignedeithertoparticipateinthetreatmentconditionorinthecounterfactualcondition(businessasusual).Thisscale‐upinterventiontookplaceinpreschoolclassroomsinthreeurbanschooldistricts:twoNortherncityschoolsystems(Boston,MAandBuffalo,NY)andacombinationofametropolitanpublicschoolsystem(referredtofromthispointasMetro)andaHeadStartprogram(hereafterreferredtoasHeadStart)inNashville,TN.Thisreportincludesonlypublicschoolprograms,asthosewerecommonacrossallthreesites.TheoriginalsitewherethecurriculumwasdevelopedandthedeveloperslivedwasBuffalo,NY.BostonandNashvillewerethedistantsites,withNashvillebeingthemostindependent.
InterventionDescription.Thisprojectwasdesignedtoevaluatethecross‐siteexecutionofTechnology‐enhancedResearch‐basedInstruction,Assessment,andProfessionalDevelopment(TRIAD),amodelfortheimplementationofanearlymathematicscurriculum(Clements&Sarama,2006).Generally,TRIADfocusesonthemathenvironmentsthatthechildrenareexposedtoathomeandintheclassroom,withacomprehensiveprofessionaldevelopmentpackageforteachers.TheinterventioninvolvedthetrainingofPre‐Kteachersintheirownearlymathknowledgeandinthecurricularcomponents,thecoachingofthoseteachersthroughoutthestudy,theimplementationofthecurriculuminreal‐lifeclassrooms,thesupplyingoftheclassroomswithneededmaterials,andtheevaluationoftheclassroom,teachers,andstudentsinvolved.Thecurriculumitself,BuildingBlocks,approacheschildren’smathematicallearningasaseriesofresearch‐basedlearningtrajectories.Theprogramattemptstofacilitatechildren’sgrowthinthosetrajectoriesbyhelpingthem“mathematizetheireverydayactivities,frombuildingblocks

PeabodyResearchInstitute,VanderbiltUniversity
9
toartandstoriestopuzzlesandgames”(Clements&Sarama,2011,p.969).Acomprehensivecurriculum,BuildingBlocksincorporates30weeklylessonplansthroughsmallgroupstructures,computeractivities,center‐basedlearning,wholegroupinstruction,familyletters,andteachertrackingofchildren’sprogressalongthemathtrajectories.
IntheMassachusettsandNewYorksites,childrenwereinitiallyrandomizedintooneofthreeconditions,withthethirduniqueconditionbeingaBuildingBlocksfollow‐throughgroup(BBFT).ThisgroupreceivedthesamePre‐Kinterventionastheone‐year‐onlyBuildingBlockscondition.However,theyreceivedadditionalBuildingBlocksinstructioninKindergartenand1stgrade.BecausethisconditionwasnotusedintheTennesseesite,thesechildrenwereonlyincludedintheanalysesinvolvingPre‐Kyeareffects,butthisisdescribedingreaterdetailfurtherinthisreport.
ProfessionalDevelopmentandCoaching.Theprofessionaldevelopmentofteachersintheexperimentalconditionincludedworkshops,in‐classroommentoring,andcontinuedsupportthroughanonlineresource.AllBuildingBlocksteachers(unlesstheycametotheprojectlate)participatedinthreeBuildingBlocksWorkshopsheldthroughouttheyear,4daysinAugustof2006,2daysinJanuary2007,and1dayinAprilof2007.
Sample
Thescale‐upstudyinvolved139publicPre‐Kclassrooms,describedinnumberbysiteandconditioninTable1.TheinterventionintheTennesseesitelaggedtheothertwositesbyoneyear.However,thesameprotocolwasfollowedinallthreesites:oneyearofteachertrainingfollowedbyfullimplementationoftheinterventioninthesecondyearinPre‐Kclassrooms,withanadditionalfollow‐upofchildrenastheyprogressedintoKindergartenandfirstgrade.Teachersinthecontrolclassroomspracticedbusiness‐as‐usualinstructionandwerepromisedtrainingintheBuildingBlockscurriculumaftertheevaluationendediftheirschoolsystemswishedthemtoreceiveit.Table1.SampleofSchoolsandClassroomsbySiteandCondition
Classrooms SchoolsBuffalo 75 25
Treatment 51 15Control 24 10
Boston 31 18Treatment 21 12Control 10 6
Nashville 33 16Treatment 16 8Control 17 8
PeabodyResearchInstitute,VanderbiltUniversity
10
Children.Datausedinthesecross‐siteanalyseswerelimitedtopublicPre‐KfromTN(noHeadStartcases)sothat,forconsistency,onlypublicPre‐Kchildrenwererepresentedinalltheanalyses.Additionally,BBFTchildreninBuffalowereonlyusedforanalysesinvolvingPre‐Keffectsbutwerenotincludedinanalysesafterthepointwheretheyparticipatedadifferentexperimentalcondition,i.e.,inKindergartenand1stgrade.Webeganwithadatasetof1828children,1827ofwhomhadvalidpretestscores.
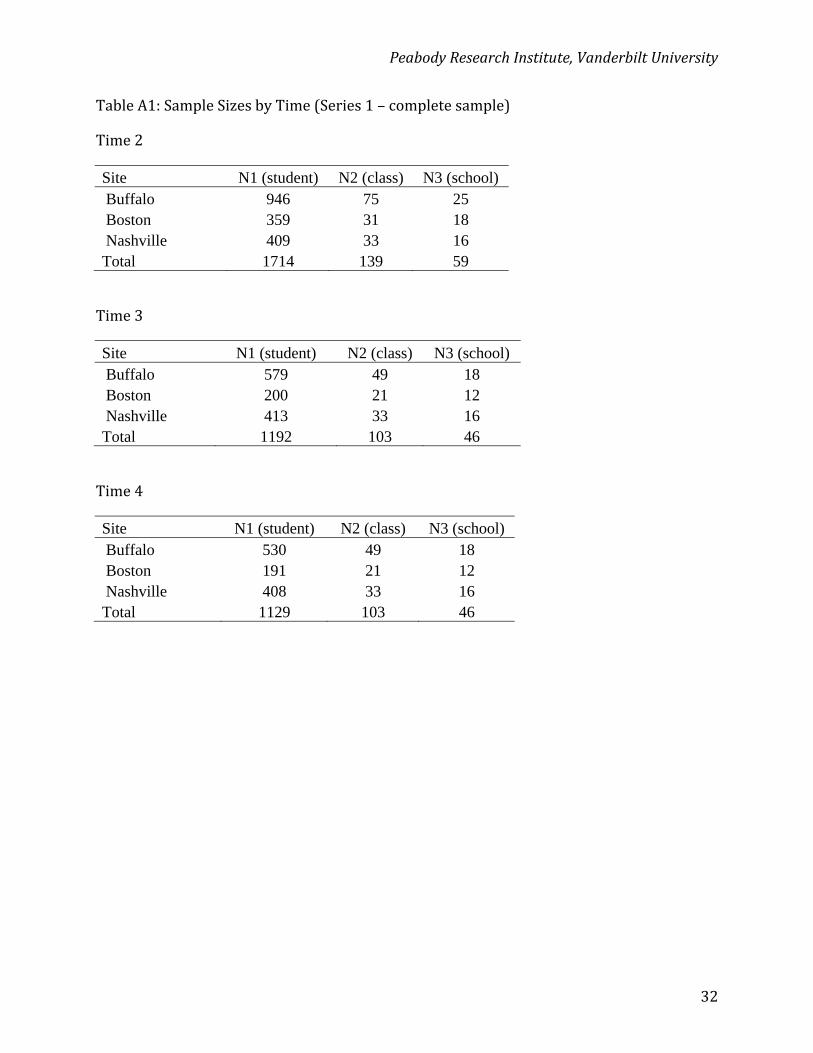
TheCompleteSamplewasdefinedasthosechildrenwhohadposttestdataatthetimepointtobeanalyzed.ThissamplewasanalyzedatTimes2(endofPre‐K),3(endofK),and4(endof1stgrade).ThesamplesizevariedacrossTime—attheendofPre‐K1714childrenin139classroomsin59schoolswereincluded;atKindergartenand1stgrade,1192and1129childrenwereincludedrespectivelyfrom103oftheoriginalPre‐Kclassroomsin46schools.(ThechildrenwereinmanymoreKand1stgradeclassrooms.)ThenumbersintheCompleteSample,brokenoutbysite,canbefoundinTableA1inAppendixA.
AsecondCommonSamplewasdefinedasthosechildrenwhowerenotintheBBFTconditionandhadvalidoutcomedataateachtimepoint.Thissampleallowedeffectstobeexaminedacrossthetimepointswiththesamechildrenrepresentedateachtime.ThisCommonSampleincluded1105childrenfrom103Pre‐Kclassroomsin46schools;thenumbersinthissamplearebrokenoutbysiteinTableB1inAppendixB
Measures
DirectAssessments. Allchildreninthecross‐sitestudyweredirectlyassessedwithanon‐standardizedmeasuredescribedingreaterdetailbelow.Childrenwereindividuallyassessedoutsidetheclassroombytrainedassessorsinaquietlocationwithintheschool.TestswereadministeredatthebeginningofPre‐K,attheendofPre‐K,attheendofKindergarten,andattheendoffirstgrade.
Research‐basedElementaryMathAssessment(REMA).TheREMA(Clements,Sarama,&Liu,2008)isaproximalmeasureofchildren’searlymathskills,onethatiscloselyalignedwiththeBuildingBlockscurriculumanddesignedbythecurriculumdevelopers.Itincludesbothnumbersenseandgeometry/measurementcomponentsthatwerecombinedthroughRaschmodelingtoyieldonetotalscore(Clements,Sarama,&Liu).TheREMAwasoriginallydevelopedforPrekindergartenbutitemswereaddedtoextenditssuitabilitytoKindergartenandfirstgrade.TheREMAassessesachild’sdevelopmentalprogressioninskillslikeverbalcounting,subitizing,numbercomparison,numbercomposition,shaperecognition,patterning,spatialimagery,geometricmeasurement,etc.
ClassroomandChildObservationMeasures.EachparticipatingPre‐Kclassroomwasobservedbytrainedandreliableprojectstaffusingmultipleinstruments.ClassroomswereobservedtwoorthreedifferenttimesduringthePre‐Kyear,dependingonsite(nearthebeginningoftheyear,nearthemiddleoftheyear,andneartheendoftheyear).Observersusedtwomeasuresofinstruction–onefocusedongeneralmathinstructionusedinbothtreatmentandcomparisonclassroomsandonespecifictothecurriculumusedonlyin
PeabodyResearchInstitute,VanderbiltUniversity
11
treatmentclassrooms.Theseinstrumentsaredescribedingreaterdetailbelow.Finalscoresonallvariablesofinterest,unlessotherwiseindicated,wereaveragedacrossobservationperiodsyieldingamorestablemeasure.
ClassroomObservationofEarlyMathematics–EnvironmentandTeaching(COEMET).Usedinbothtreatmentandcontrolclassrooms,theCOEMET(Sarama&Clements,2007)isaninstrumentthatassessestheinstructionalenvironmentoftheclassroom,focusingonthemathcontentspecifically.Itiscomprisedofseveralparts.TheClassroomCultureportion,whichrangesfrom1‐5(5beingthebest),thegeneralmathenvironmentthroughouttheobservation;itincludesquestionsabouthowactivelytheteacherinteractswiththechildren,howtheteacherusesteachablemathmoments,howmathisdisplayedinthephysicalenvironmentaloftheroom,howconfidenttheteacherappearedaboutmath,etc.
EachdifferentinstanceofmathinstructionconductedbytheteacherduringtheobservationiscatalogedasaSpecificMathActivity,orSMA.TheSMAportionoftheCOEMETuseseventsampling;eachtimeamathactivityisobserved,questionsaboutitslength,instructionalquality,teacherinvolvement,childengagement,andothercharacteristicsareansweredbytheobserver,yieldingacountforthenumberofobservedinstances,anoverallqualityscoreaveragedacrossincidents(alsorangingfrom1‐5),andthetimelengthforeachSMA.AnexampleofanSMAmightbewhenateacherengagesthewholeclassaspartofthemorningmeetingtimeinaguidedactivitythatisfocusedonmath(countingstudentspresent,discussingthedaysinschoolanddaysleftuntiltheweekend,usingthecalendartotalkaboutnumbercomposition,etc.).AteachingincidenthadtooccurforatleastaminutetobeconsideredanSMA.
AsoftenhappensinaPre‐Kclassroom,ateachermightorganizeasmallgroupactivityandrotatestudentsthroughtheactivityingroupsof3‐4.Whenthisoccurredduringanobservation,itwascodedasonesinglemathactivityratherthanseparateactivitiesforeachgroupofchildren.
Finally,thosemathactivitiesthatwereveryshortintime(30secondsorless)ordidnotincludedirectinvolvementbytheteacherwerecatalogedasMiniatureSpecificMathActivities,orminiSMAs,andwerecodedfortopicandorganizationalmakeup.BothtreatmentandcontrolclassroomswereevaluatedusingtheCOEMET.ThescoringfortheCOEMETisdescribedintheappropriatesectionlaterinthisreport.
NearFidelity.TheNearFidelity(Sarama,Clements,Starkey,Klein,&Wakeley,2008)instrumentassessesthedegreetowhichteachersintheexperimentalclassroomsimplementedcomponentsoftheBuildingBlockscurriculum.Itincludesitemsinfiveseparatesettings–GeneralCurriculum,Hands‐OnCenters,WholeGroup,SmallGroup,&Computers–primarilyusing5‐optionLikertscales.UnliketheCOEMET,thisfidelityinstrumentwas
PeabodyResearchInstitute,VanderbiltUniversity
12
onlyusedinthetreatmentclassrooms.ThescoringfortheNearFidelityisdescribedintheappropriatesectionlaterinthisreport.
DataAnalysis&Results
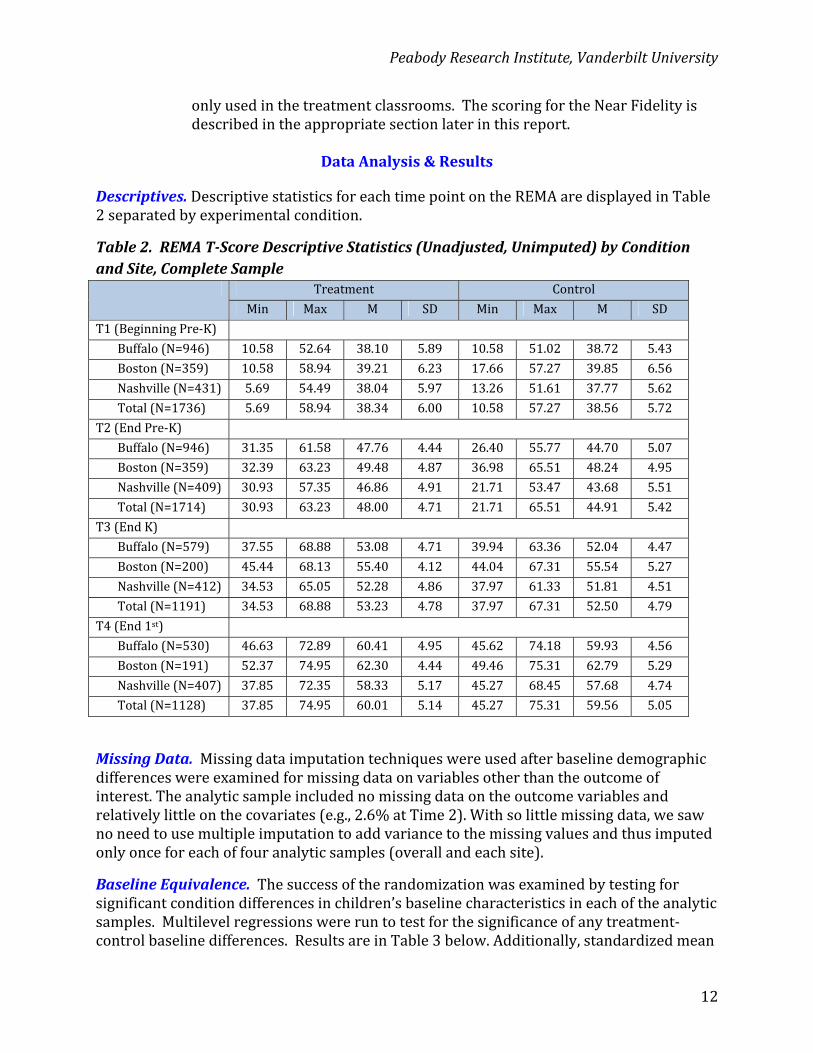
Descriptives.DescriptivestatisticsforeachtimepointontheREMAaredisplayedinTable2separatedbyexperimentalcondition.
Table2.REMAT‐ScoreDescriptiveStatistics(Unadjusted,Unimputed)byConditionandSite,CompleteSample Treatment Control
Min Max M SD Min Max M SD
T1(BeginningPre‐K)
Buffalo(N=946) 10.58 52.64 38.10 5.89 10.58 51.02 38.72 5.43
Boston(N=359) 10.58 58.94 39.21 6.23 17.66 57.27 39.85 6.56
Nashville(N=431) 5.69 54.49 38.04 5.97 13.26 51.61 37.77 5.62
Total(N=1736) 5.69 58.94 38.34 6.00 10.58 57.27 38.56 5.72
T2(EndPre‐K)
Buffalo(N=946) 31.35 61.58 47.76 4.44 26.40 55.77 44.70 5.07
Boston(N=359) 32.39 63.23 49.48 4.87 36.98 65.51 48.24 4.95
Nashville(N=409) 30.93 57.35 46.86 4.91 21.71 53.47 43.68 5.51
Total(N=1714) 30.93 63.23 48.00 4.71 21.71 65.51 44.91 5.42
T3(EndK)
Buffalo(N=579) 37.55 68.88 53.08 4.71 39.94 63.36 52.04 4.47
Boston(N=200) 45.44 68.13 55.40 4.12 44.04 67.31 55.54 5.27
Nashville(N=412) 34.53 65.05 52.28 4.86 37.97 61.33 51.81 4.51
Total(N=1191) 34.53 68.88 53.23 4.78 37.97 67.31 52.50 4.79
T4(End1st)
Buffalo(N=530) 46.63 72.89 60.41 4.95 45.62 74.18 59.93 4.56
Boston(N=191) 52.37 74.95 62.30 4.44 49.46 75.31 62.79 5.29
Nashville(N=407) 37.85 72.35 58.33 5.17 45.27 68.45 57.68 4.74
Total(N=1128) 37.85 74.95 60.01 5.14 45.27 75.31 59.56 5.05
MissingData.Missingdataimputationtechniqueswereusedafterbaselinedemographicdifferenceswereexaminedformissingdataonvariablesotherthantheoutcomeofinterest.Theanalyticsampleincludednomissingdataontheoutcomevariablesandrelativelylittleonthecovariates(e.g.,2.6%atTime2).Withsolittlemissingdata,wesawnoneedtousemultipleimputationtoaddvariancetothemissingvaluesandthusimputedonlyonceforeachoffouranalyticsamples(overallandeachsite).
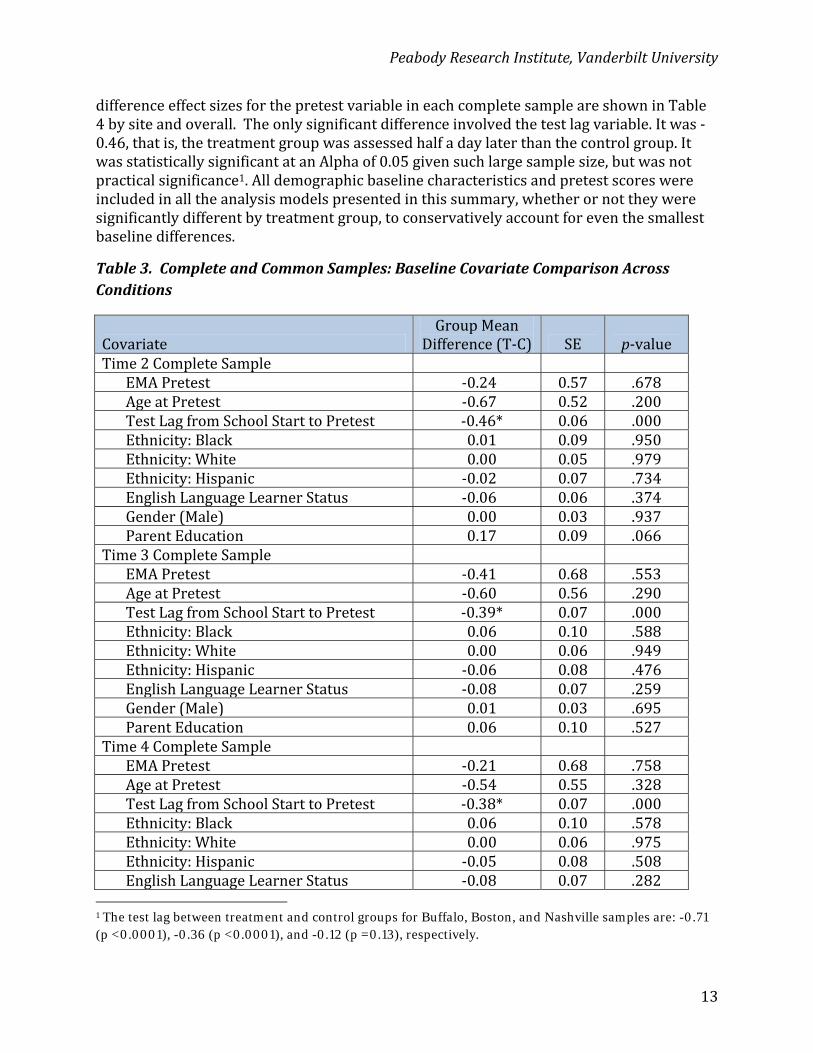
BaselineEquivalence.Thesuccessoftherandomizationwasexaminedbytestingforsignificantconditiondifferencesinchildren’sbaselinecharacteristicsineachoftheanalyticsamples.Multilevelregressionswereruntotestforthesignificanceofanytreatment‐controlbaselinedifferences.ResultsareinTable3below.Additionally,standardizedmean
PeabodyResearchInstitute,VanderbiltUniversity
13
differenceeffectsizesforthepretestvariableineachcompletesampleareshowninTable4bysiteandoverall.Theonlysignificantdifferenceinvolvedthetestlagvariable.Itwas‐0.46,thatis,thetreatmentgroupwasassessedhalfadaylaterthanthecontrolgroup.ItwasstatisticallysignificantatanAlphaof0.05givensuchlargesamplesize,butwasnotpracticalsignificance1.Alldemographicbaselinecharacteristicsandpretestscoreswereincludedinalltheanalysismodelspresentedinthissummary,whetherornottheyweresignificantlydifferentbytreatmentgroup,toconservativelyaccountforeventhesmallestbaselinedifferences.
Table3.CompleteandCommonSamples:BaselineCovariateComparisonAcrossConditions
CovariateGroupMean
Difference(T‐C) SE p‐valueTime2CompleteSample
EMAPretest ‐0.24 0.57 .678AgeatPretest ‐0.67 0.52 .200TestLagfromSchoolStarttoPretest ‐0.46* 0.06 .000Ethnicity:Black 0.01 0.09 .950Ethnicity:White 0.00 0.05 .979Ethnicity:Hispanic ‐0.02 0.07 .734EnglishLanguageLearnerStatus ‐0.06 0.06 .374Gender(Male) 0.00 0.03 .937ParentEducation 0.17 0.09 .066
Time3CompleteSampleEMAPretest ‐0.41 0.68 .553AgeatPretest ‐0.60 0.56 .290TestLagfromSchoolStarttoPretest ‐0.39* 0.07 .000Ethnicity:Black 0.06 0.10 .588Ethnicity:White 0.00 0.06 .949Ethnicity:Hispanic ‐0.06 0.08 .476EnglishLanguageLearnerStatus ‐0.08 0.07 .259Gender(Male) 0.01 0.03 .695ParentEducation 0.06 0.10 .527
Time4CompleteSample EMAPretest ‐0.21 0.68 .758AgeatPretest ‐0.54 0.55 .328TestLagfromSchoolStarttoPretest ‐0.38* 0.07 .000Ethnicity:Black 0.06 0.10 .578Ethnicity:White 0.00 0.06 .975Ethnicity:Hispanic ‐0.05 0.08 .508EnglishLanguageLearnerStatus ‐0.08 0.07 .282
1 The test lag between treatment and control groups for Buffalo, Boston, and Nashville samples are: -0.71 (p <0.0001), -0.36 (p <0.0001), and -0.12 (p =0.13), respectively.
PeabodyResearchInstitute,VanderbiltUniversity
14
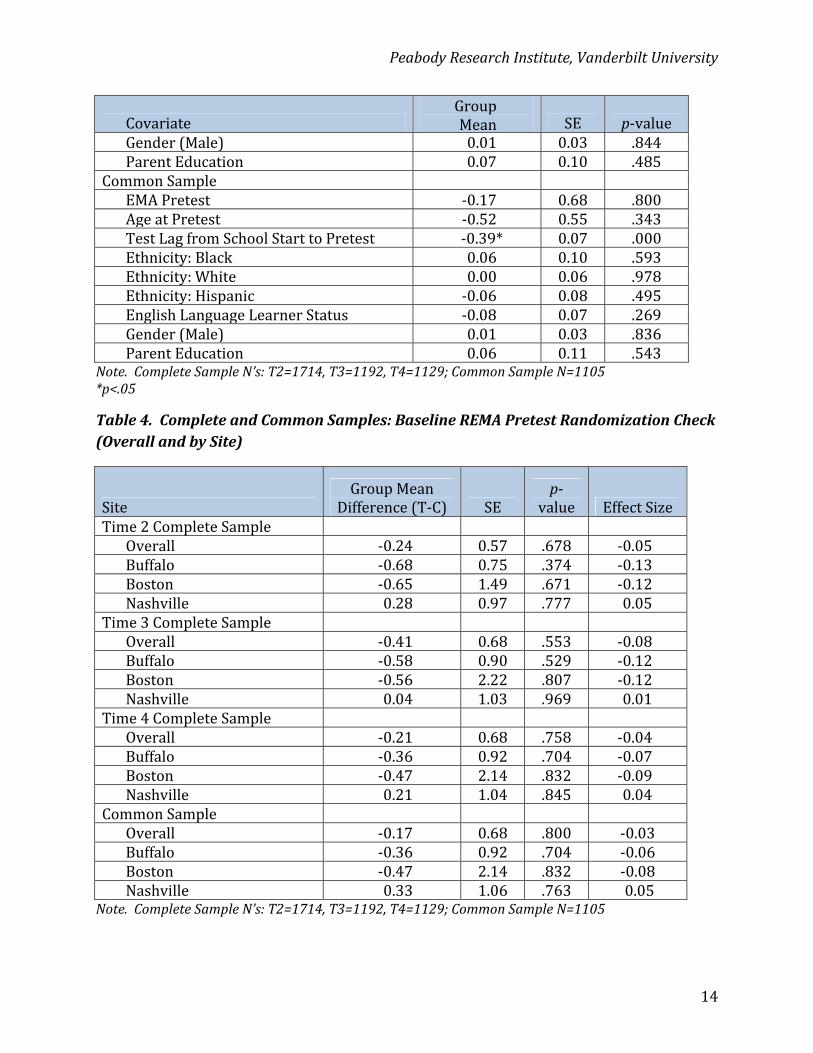
CovariateGroupMean SE p‐value
Gender(Male) 0.01 0.03 .844ParentEducation 0.07 0.10 .485
CommonSample EMAPretest ‐0.17 0.68 .800AgeatPretest ‐0.52 0.55 .343TestLagfromSchoolStarttoPretest ‐0.39* 0.07 .000Ethnicity:Black 0.06 0.10 .593Ethnicity:White 0.00 0.06 .978Ethnicity:Hispanic ‐0.06 0.08 .495EnglishLanguageLearnerStatus ‐0.08 0.07 .269Gender(Male) 0.01 0.03 .836ParentEducation 0.06 0.11 .543
Note.CompleteSampleN’s:T2=1714,T3=1192,T4=1129;CommonSampleN=1105*p<.05
Table4.CompleteandCommonSamples:BaselineREMAPretestRandomizationCheck(OverallandbySite)
SiteGroupMean
Difference(T‐C) SEp‐
value EffectSizeTime2CompleteSample
Overall ‐0.24 0.57 .678 ‐0.05Buffalo ‐0.68 0.75 .374 ‐0.13Boston ‐0.65 1.49 .671 ‐0.12Nashville 0.28 0.97 .777 0.05
Time3CompleteSampleOverall ‐0.41 0.68 .553 ‐0.08Buffalo ‐0.58 0.90 .529 ‐0.12Boston ‐0.56 2.22 .807 ‐0.12Nashville 0.04 1.03 .969 0.01
Time4CompleteSample Overall ‐0.21 0.68 .758 ‐0.04Buffalo ‐0.36 0.92 .704 ‐0.07Boston ‐0.47 2.14 .832 ‐0.09Nashville 0.21 1.04 .845 0.04
CommonSample Overall ‐0.17 0.68 .800 ‐0.03Buffalo ‐0.36 0.92 .704 ‐0.06Boston ‐0.47 2.14 .832 ‐0.08Nashville 0.33 1.06 .763 0.05
Note.CompleteSampleN’s:T2=1714,T3=1192,T4=1129;CommonSampleN=1105
PeabodyResearchInstitute,VanderbiltUniversity
15
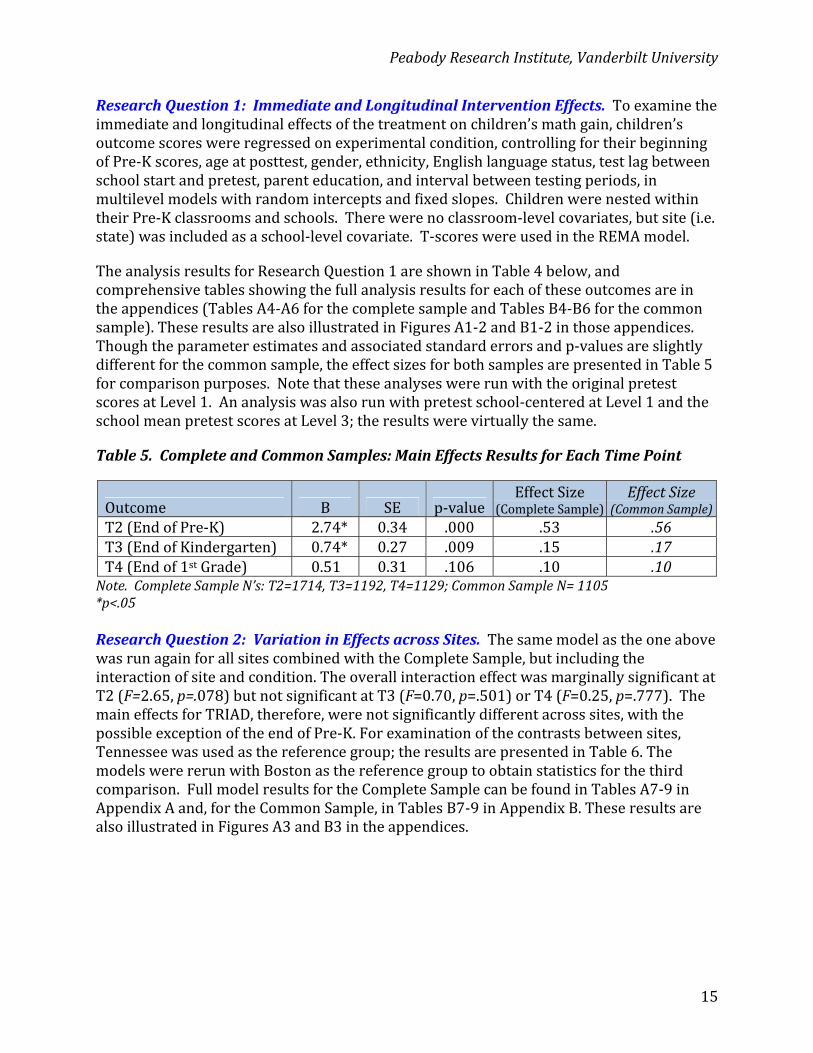
ResearchQuestion1:ImmediateandLongitudinalInterventionEffects.Toexaminetheimmediateandlongitudinaleffectsofthetreatmentonchildren’smathgain,children’soutcomescoreswereregressedonexperimentalcondition,controllingfortheirbeginningofPre‐Kscores,ageatposttest,gender,ethnicity,Englishlanguagestatus,testlagbetweenschoolstartandpretest,parenteducation,andintervalbetweentestingperiods,inmultilevelmodelswithrandominterceptsandfixedslopes.ChildrenwerenestedwithintheirPre‐Kclassroomsandschools.Therewerenoclassroom‐levelcovariates,butsite(i.e.state)wasincludedasaschool‐levelcovariate.T‐scoreswereusedintheREMAmodel.
TheanalysisresultsforResearchQuestion1areshowninTable4below,andcomprehensivetablesshowingthefullanalysisresultsforeachoftheseoutcomesareintheappendices(TablesA4‐A6forthecompletesampleandTablesB4‐B6forthecommonsample).TheseresultsarealsoillustratedinFiguresA1‐2andB1‐2inthoseappendices.Thoughtheparameterestimatesandassociatedstandarderrorsandp‐valuesareslightlydifferentforthecommonsample,theeffectsizesforbothsamplesarepresentedinTable5forcomparisonpurposes.NotethattheseanalyseswererunwiththeoriginalpretestscoresatLevel1.Ananalysiswasalsorunwithpretestschool‐centeredatLevel1andtheschoolmeanpretestscoresatLevel3;theresultswerevirtuallythesame.
Table5.CompleteandCommonSamples:MainEffectsResultsforEachTimePoint
Outcome B SE p‐valueEffectSize
(CompleteSample)EffectSize
(CommonSample)T2(EndofPre‐K) 2.74* 0.34 .000 .53 .56T3(EndofKindergarten) 0.74* 0.27 .009 .15 .17T4(Endof1stGrade) 0.51 0.31 .106 .10 .10Note.CompleteSampleN’s:T2=1714,T3=1192,T4=1129;CommonSampleN=1105*p<.05
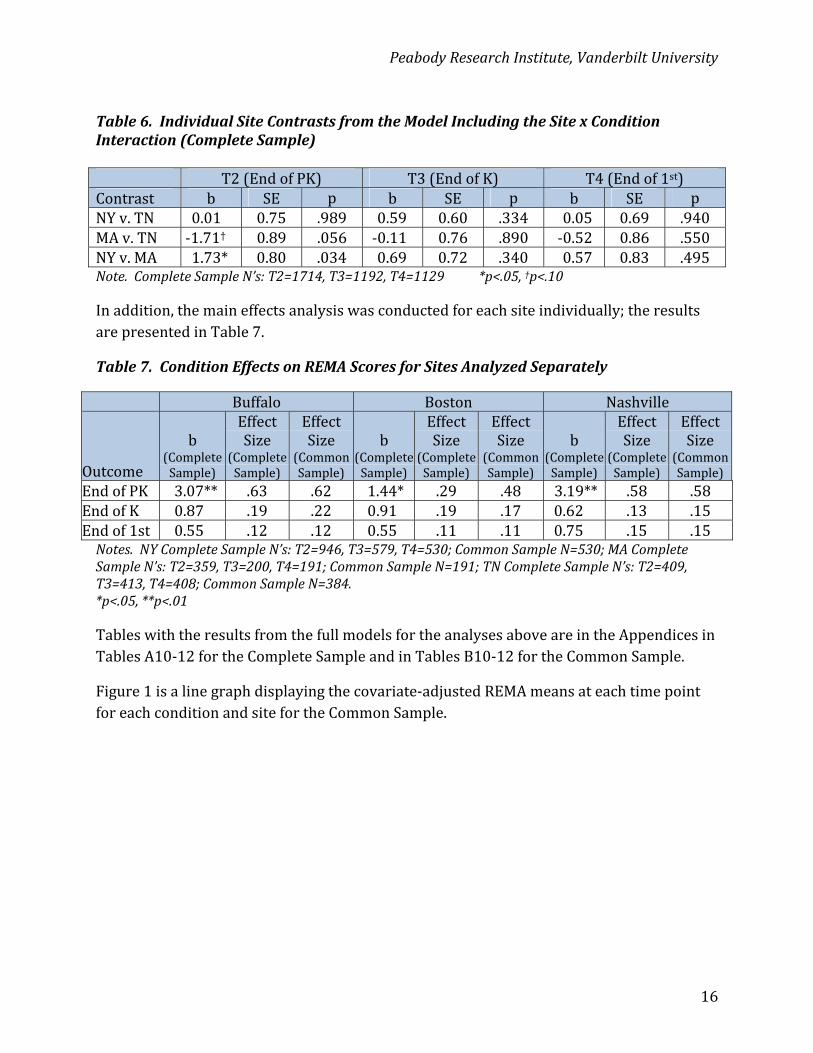
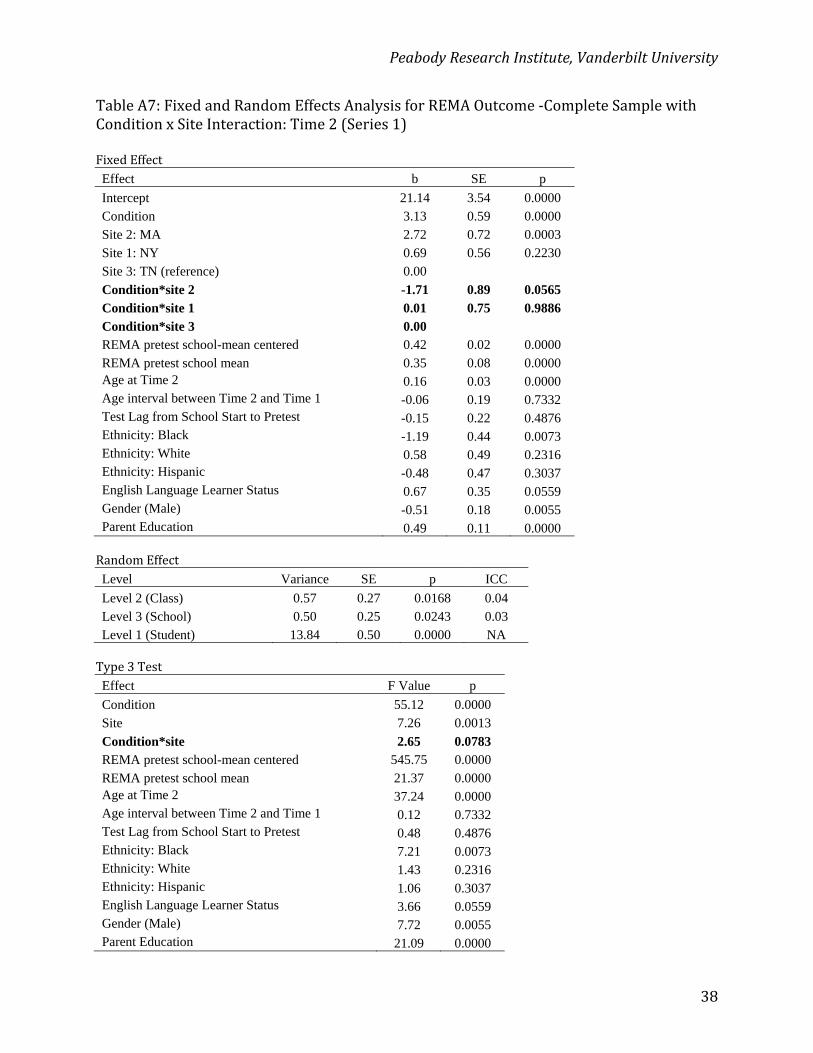
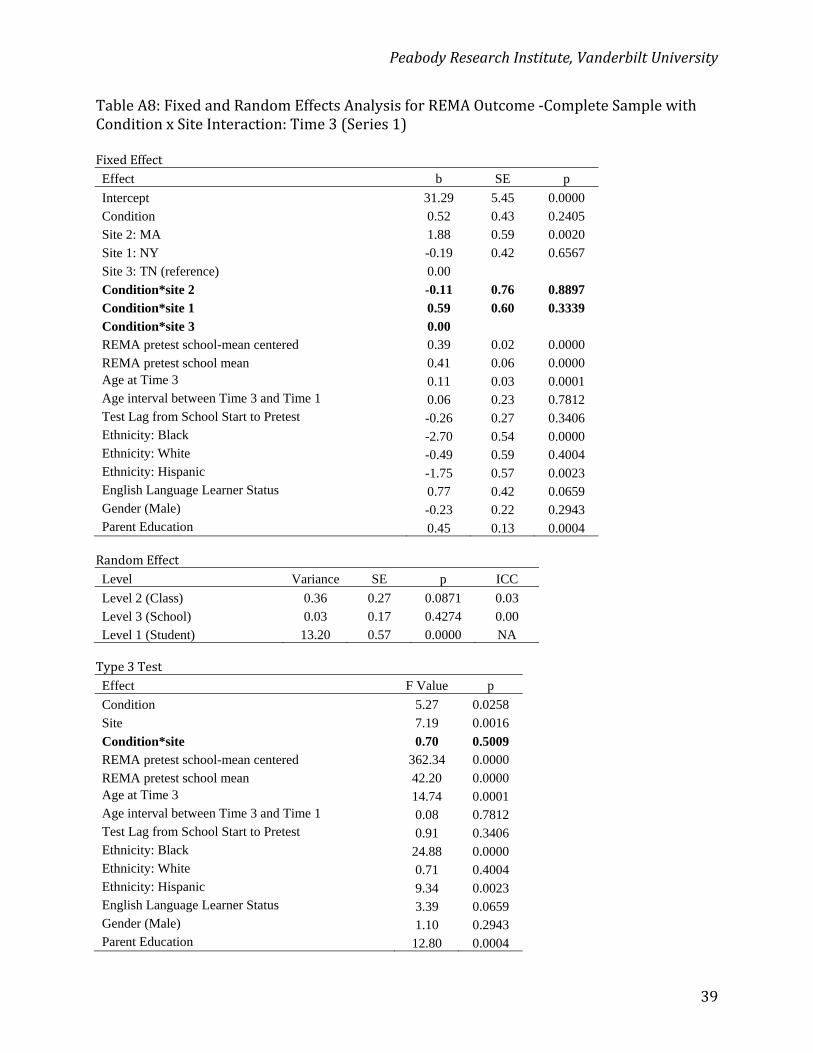
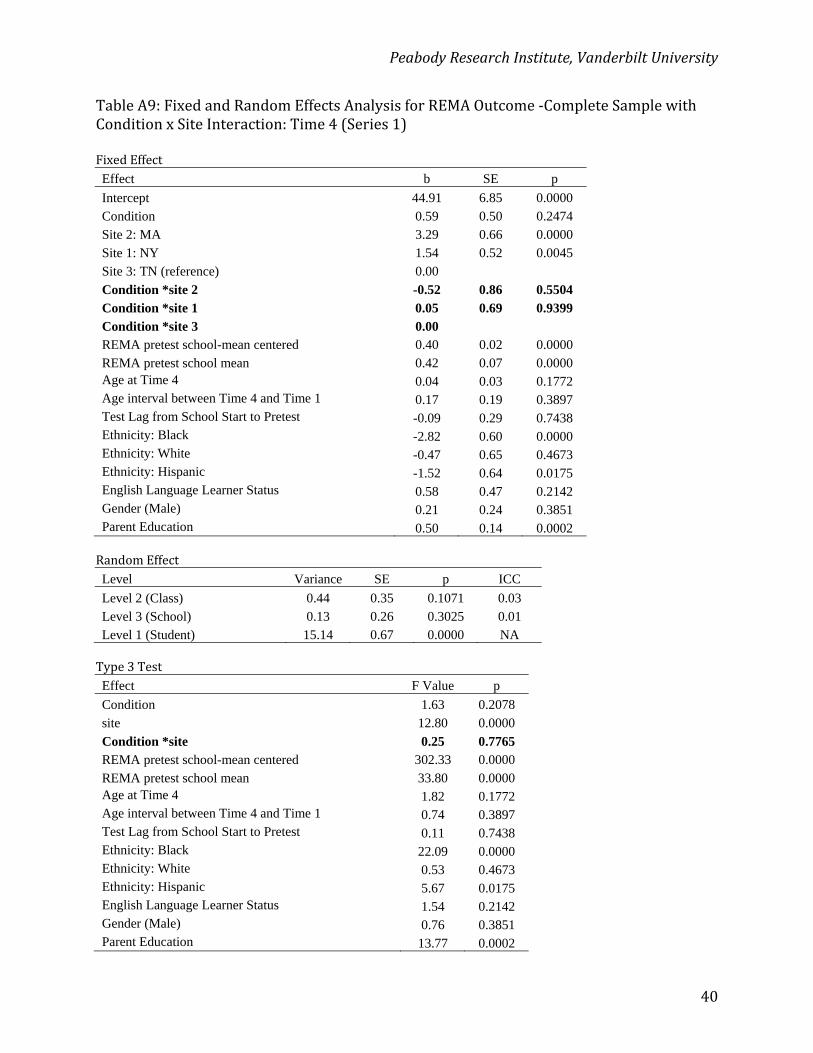
ResearchQuestion2:VariationinEffectsacrossSites.ThesamemodelastheoneabovewasrunagainforallsitescombinedwiththeCompleteSample,butincludingtheinteractionofsiteandcondition.TheoverallinteractioneffectwasmarginallysignificantatT2(F=2.65,p=.078)butnotsignificantatT3(F=0.70,p=.501)orT4(F=0.25,p=.777).ThemaineffectsforTRIAD,therefore,werenotsignificantlydifferentacrosssites,withthepossibleexceptionoftheendofPre‐K.Forexaminationofthecontrastsbetweensites,Tennesseewasusedasthereferencegroup;theresultsarepresentedinTable6.ThemodelswerererunwithBostonasthereferencegrouptoobtainstatisticsforthethirdcomparison.FullmodelresultsfortheCompleteSamplecanbefoundinTablesA7‐9inAppendixAand,fortheCommonSample,inTablesB7‐9inAppendixB.TheseresultsarealsoillustratedinFiguresA3andB3intheappendices.
PeabodyResearchInstitute,VanderbiltUniversity
16
Table6.IndividualSiteContrastsfromtheModelIncludingtheSitexConditionInteraction(CompleteSample)
T2(EndofPK) T3(EndofK) T4(Endof1st)Contrast b SE p b SE p b SE pNYv.TN 0.01 0.75 .989 0.59 0.60 .334 0.05 0.69 .940MAv.TN ‐1.71† 0.89 .056 ‐0.11 0.76 .890 ‐0.52 0.86 .550NYv.MA 1.73* 0.80 .034 0.69 0.72 .340 0.57 0.83 .495Note.CompleteSampleN’s:T2=1714,T3=1192,T4=1129 *p<.05,†p<.10
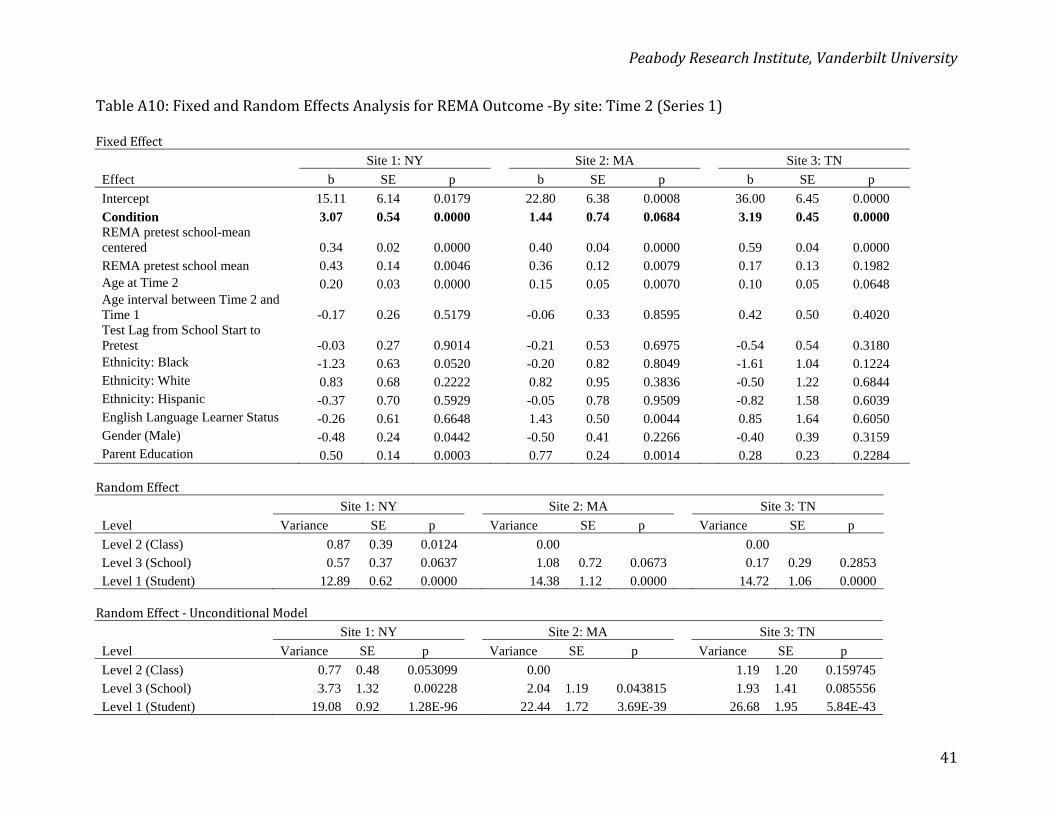
Inaddition,themaineffectsanalysiswasconductedforeachsiteindividually;theresultsarepresentedinTable7.
Table7.ConditionEffectsonREMAScoresforSitesAnalyzedSeparately
Buffalo Boston Nashville
Outcome
b(CompleteSample)
EffectSize
(CompleteSample)
EffectSize
(CommonSample)
b(CompleteSample)
EffectSize
(CompleteSample)
EffectSize
(CommonSample)
b(CompleteSample)
EffectSize
(CompleteSample)
EffectSize
(CommonSample)
EndofPK 3.07** .63 .62 1.44* .29 .48 3.19** .58 .58EndofK 0.87 .19 .22 0.91 .19 .17 0.62 .13 .15Endof1st 0.55 .12 .12 0.55 .11 .11 0.75 .15 .15Notes.NYCompleteSampleN’s:T2=946,T3=579,T4=530;CommonSampleN=530;MACompleteSampleN’s:T2=359,T3=200,T4=191;CommonSampleN=191;TNCompleteSampleN’s:T2=409,T3=413,T4=408;CommonSampleN=384. *p<.05,**p<.01
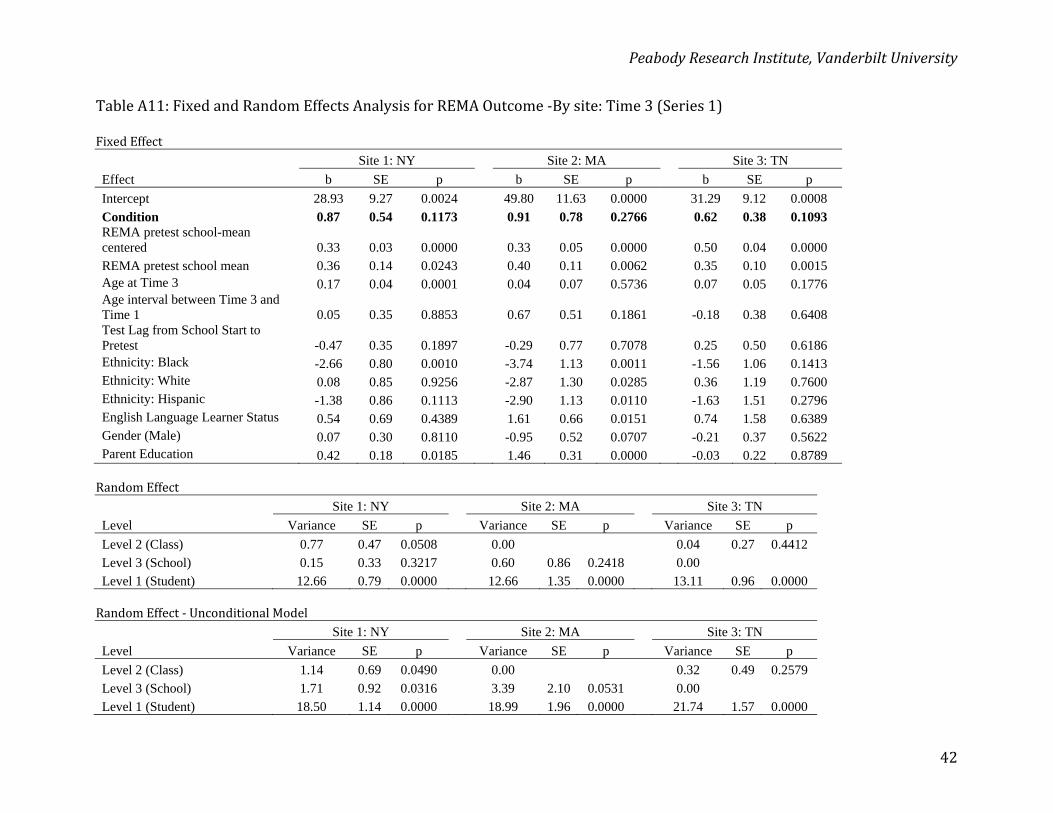
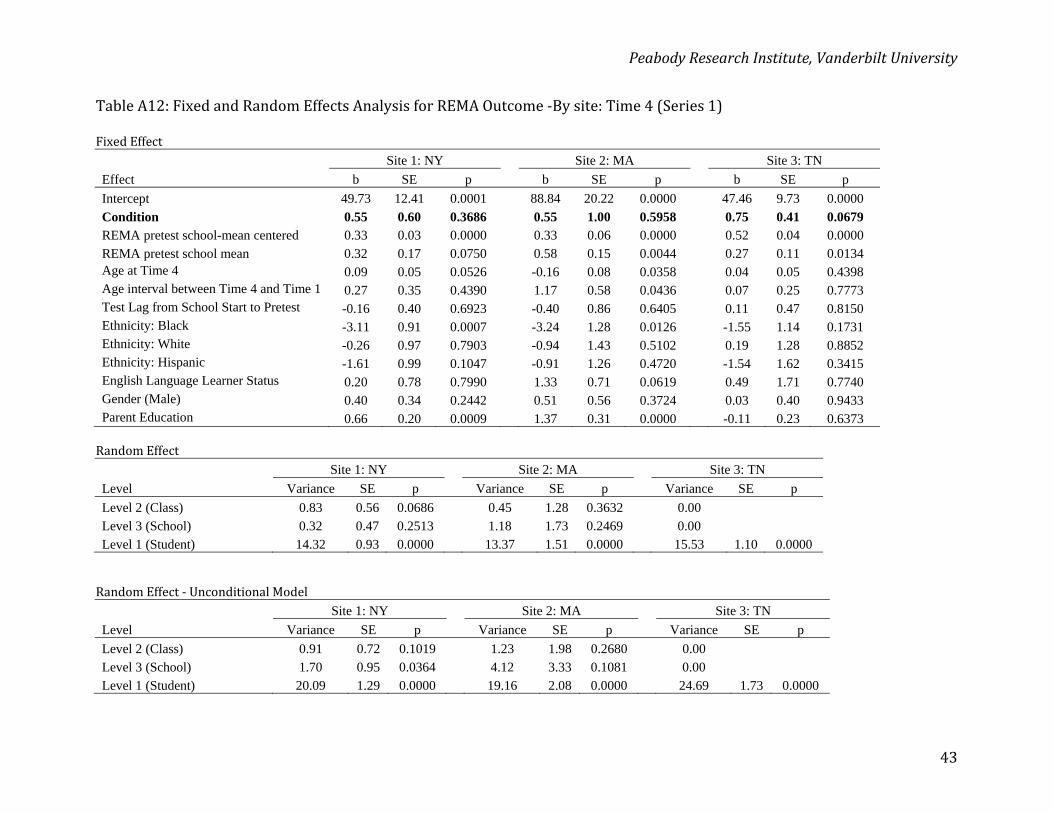
TableswiththeresultsfromthefullmodelsfortheanalysesaboveareintheAppendicesinTablesA10‐12fortheCompleteSampleandinTablesB10‐12fortheCommonSample.
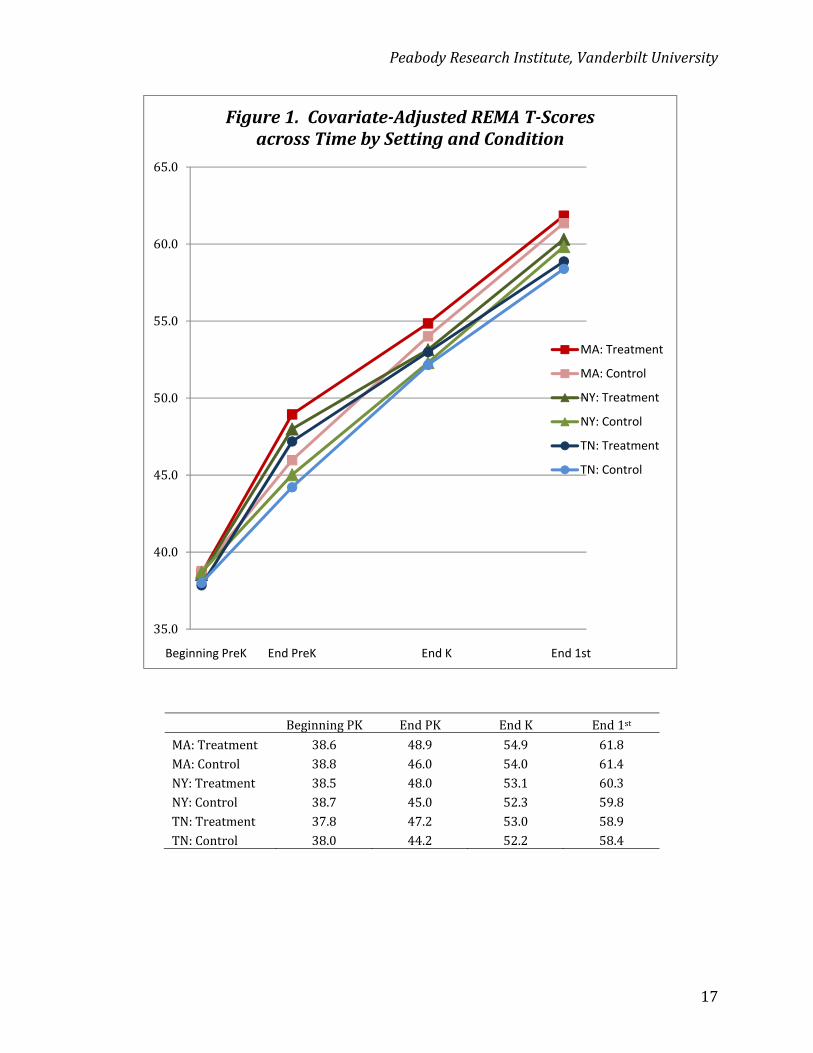
Figure1isalinegraphdisplayingthecovariate‐adjustedREMAmeansateachtimepointforeachconditionandsitefortheCommonSample.
PeabodyResearchInstitute,VanderbiltUniversity
17
35.0
40.0
45.0
50.0
55.0
60.0
65.0
Figure1.Covariate‐AdjustedREMAT‐ScoresacrossTimebySettingandCondition
MA: Treatment
MA: Control
NY: Treatment
NY: Control
TN: Treatment
TN: Control
Beginning PreK End PreK End K End 1st
BeginningPK EndPK EndK End1st
MA:Treatment 38.6 48.9 54.9 61.8MA:Control 38.8 46.0 54.0 61.4NY:Treatment 38.5 48.0 53.1 60.3NY:Control 38.7 45.0 52.3 59.8TN:Treatment 37.8 47.2 53.0 58.9TN:Control 38.0 44.2 52.2 58.4
PeabodyResearchInstitute,VanderbiltUniversity
18
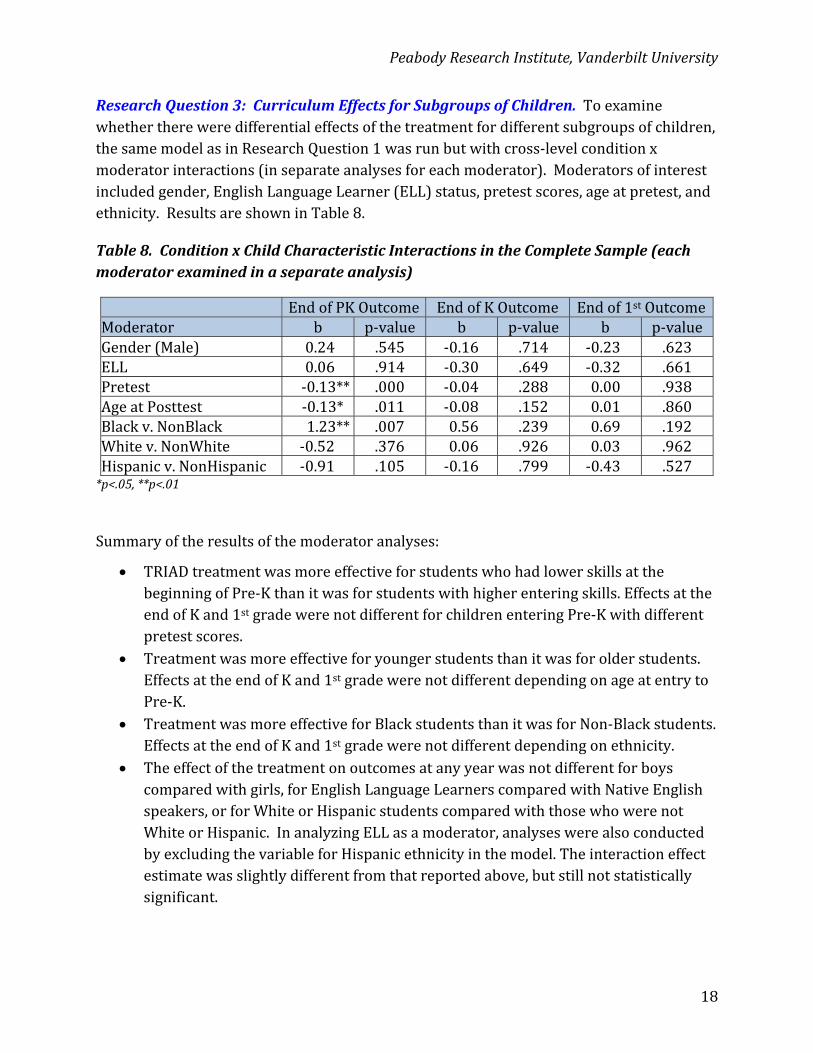
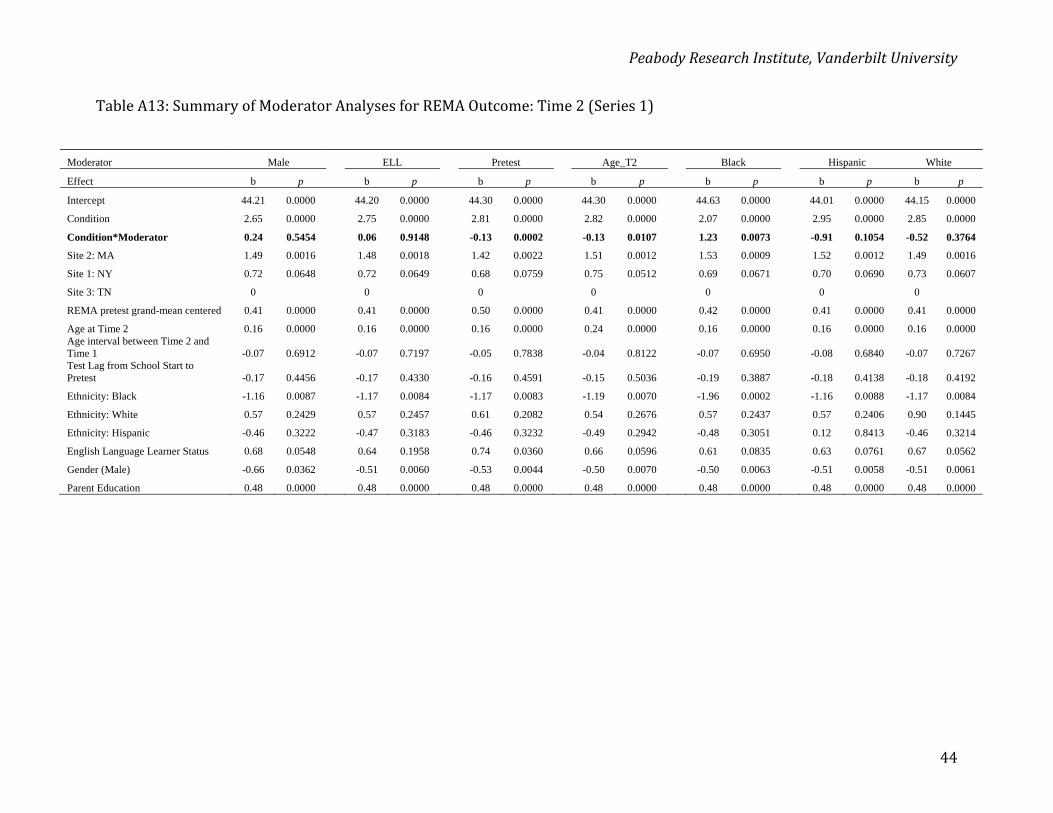
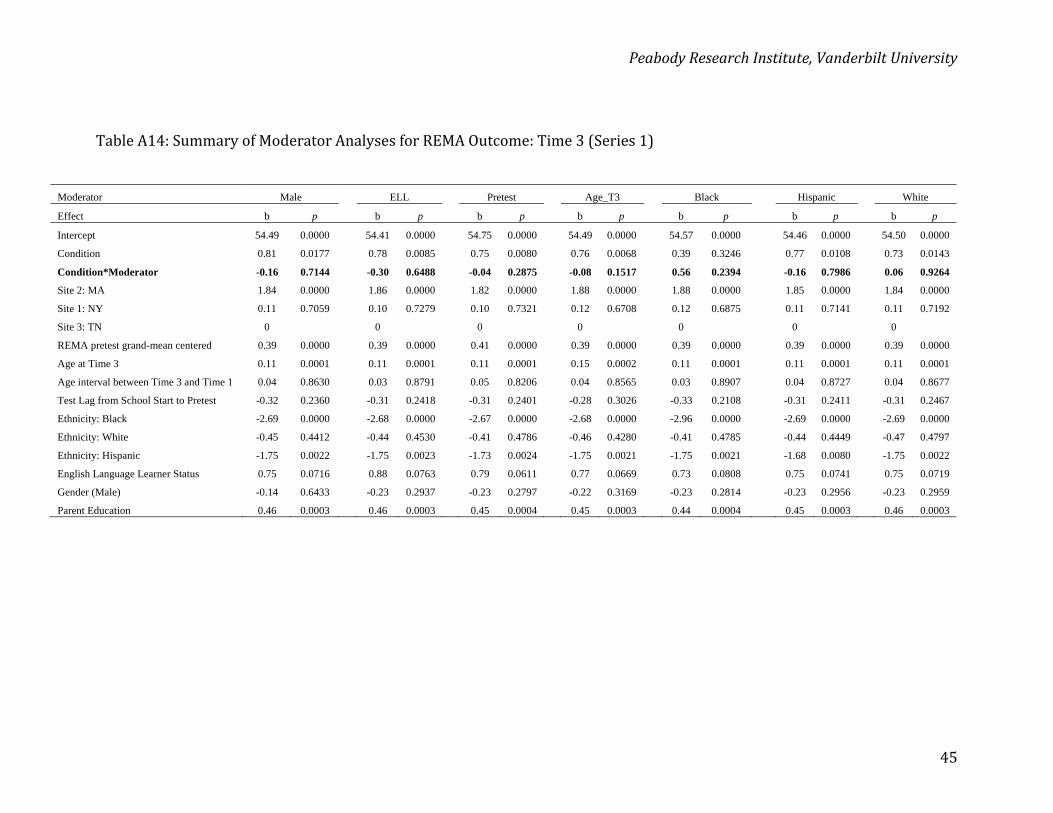
ResearchQuestion3:CurriculumEffectsforSubgroupsofChildren.Toexaminewhetherthereweredifferentialeffectsofthetreatmentfordifferentsubgroupsofchildren,thesamemodelasinResearchQuestion1wasrunbutwithcross‐levelconditionxmoderatorinteractions(inseparateanalysesforeachmoderator).Moderatorsofinterestincludedgender,EnglishLanguageLearner(ELL)status,pretestscores,ageatpretest,andethnicity.ResultsareshowninTable8.
Table8.ConditionxChildCharacteristicInteractionsintheCompleteSample(eachmoderatorexaminedinaseparateanalysis)
EndofPKOutcome EndofKOutcome Endof1stOutcomeModerator b p‐value b p‐value b p‐valueGender(Male) 0.24 .545 ‐0.16 .714 ‐0.23 .623ELL 0.06 .914 ‐0.30 .649 ‐0.32 .661Pretest ‐0.13** .000 ‐0.04 .288 0.00 .938AgeatPosttest ‐0.13* .011 ‐0.08 .152 0.01 .860Blackv.NonBlack 1.23** .007 0.56 .239 0.69 .192Whitev.NonWhite ‐0.52 .376 0.06 .926 0.03 .962Hispanicv.NonHispanic ‐0.91 .105 ‐0.16 .799 ‐0.43 .527*p<.05,**p<.01
Summaryoftheresultsofthemoderatoranalyses:
TRIADtreatmentwasmoreeffectiveforstudentswhohadlowerskillsatthebeginningofPre‐Kthanitwasforstudentswithhigherenteringskills.EffectsattheendofKand1stgradewerenotdifferentforchildrenenteringPre‐Kwithdifferentpretestscores.
Treatmentwasmoreeffectiveforyoungerstudentsthanitwasforolderstudents.EffectsattheendofKand1stgradewerenotdifferentdependingonageatentrytoPre‐K.
TreatmentwasmoreeffectiveforBlackstudentsthanitwasforNon‐Blackstudents.EffectsattheendofKand1stgradewerenotdifferentdependingonethnicity.
Theeffectofthetreatmentonoutcomesatanyyearwasnotdifferentforboyscomparedwithgirls,forEnglishLanguageLearnerscomparedwithNativeEnglishspeakers,orforWhiteorHispanicstudentscomparedwiththosewhowerenotWhiteorHispanic.InanalyzingELLasamoderator,analyseswerealsoconductedbyexcludingthevariableforHispanicethnicityinthemodel.Theinteractioneffectestimatewasslightlydifferentfromthatreportedabove,butstillnotstatisticallysignificant.
PeabodyResearchInstitute,VanderbiltUniversity
19
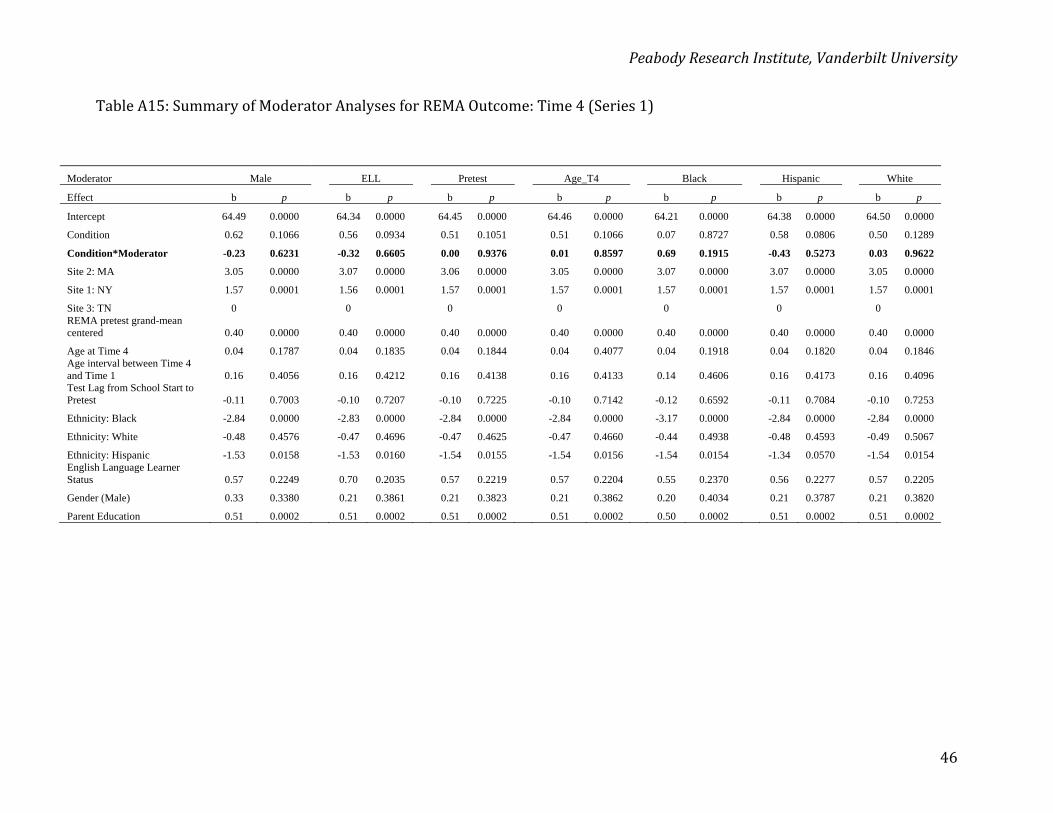
TablesincludingtheresultsfromthefullmodelsfortheanalysesofthecompletesamplesabovecanbefoundinTablesA13‐A15intheAppendixA.ThemoderatoranalysisresultsforthecommonsamplesareinTablesB13‐B15intheAppendixBandaresubstantiallysimilartothosefoundforthecompletesamples.
Wealsotestedthree‐wayinteractionsforconditionxsitexeachofthesignificantmoderatorsfromtheaboveanalyses(pretest,age,andBlackv.Non‐Black)inseparateanalysestodeterminewhetherthemoderatoreffectsdifferedacrosssites.Theonlyanalysisinwhichthethree‐wayinteractionwassignificantwasforthepretestmoderator(fullresultsinTableA16inAppendixA).Theresultsindicatedthatthemoderatoreffectofpretestvariedsignificantlybysiteatallthreetimepoints.Toexplorethisfurther,weanalyzedthemoderatoreffectofpretestwithineachsiteseparately.AtTime2,therelationshipbetweenconditionandPre‐KoutcomedifferedsignificantlydependingonpretestscoresintheNashvillesite(b=‐0.18,SE=0.07,p=.010)andmarginallyfortheBuffalosite(b=‐0.09,SE=0.05,p=.053),butnotfortheBostonsite(b=0.00,SE=0.08,p=.999).ThedirectionoftheeffectforboththeNashvilleandBuffalositeswasthesameasinthecombinedanalysis—childrenwithlowerpretestscoresshowedlargergainsduringthePre‐Kyear.FullmodelresultsforeachtimepointcanbefoundinTablesA17‐19inAppendixA.
ResearchQuestion4:EffectsofMathEnvironmentandFidelityofImplementationonGain.ThetwomeasuresofinterestweretheCOEMET,usedinbothtreatmentandcontrolclassrooms,andtheNearFidelitymeasure,usedonlyinthetreatmentclassrooms.
COEMETExploration
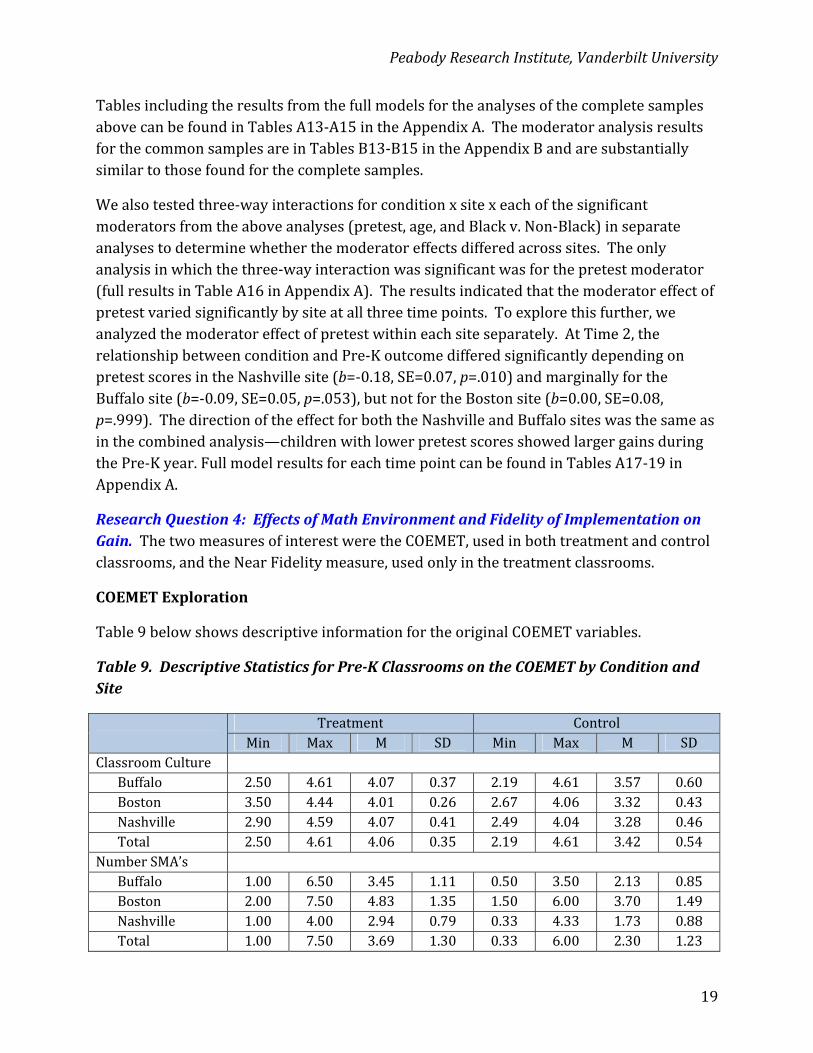
Table9belowshowsdescriptiveinformationfortheoriginalCOEMETvariables.
Table9.DescriptiveStatisticsforPre‐KClassroomsontheCOEMETbyConditionandSite
Treatment ControlMin Max M SD Min Max M SD
ClassroomCultureBuffalo 2.50 4.61 4.07 0.37 2.19 4.61 3.57 0.60Boston 3.50 4.44 4.01 0.26 2.67 4.06 3.32 0.43Nashville 2.90 4.59 4.07 0.41 2.49 4.04 3.28 0.46Total 2.50 4.61 4.06 0.35 2.19 4.61 3.42 0.54
NumberSMA’sBuffalo 1.00 6.50 3.45 1.11 0.50 3.50 2.13 0.85Boston 2.00 7.50 4.83 1.35 1.50 6.00 3.70 1.49Nashville 1.00 4.00 2.94 0.79 0.33 4.33 1.73 0.88Total 1.00 7.50 3.69 1.30 0.33 6.00 2.30 1.23
PeabodyResearchInstitute,VanderbiltUniversity
20
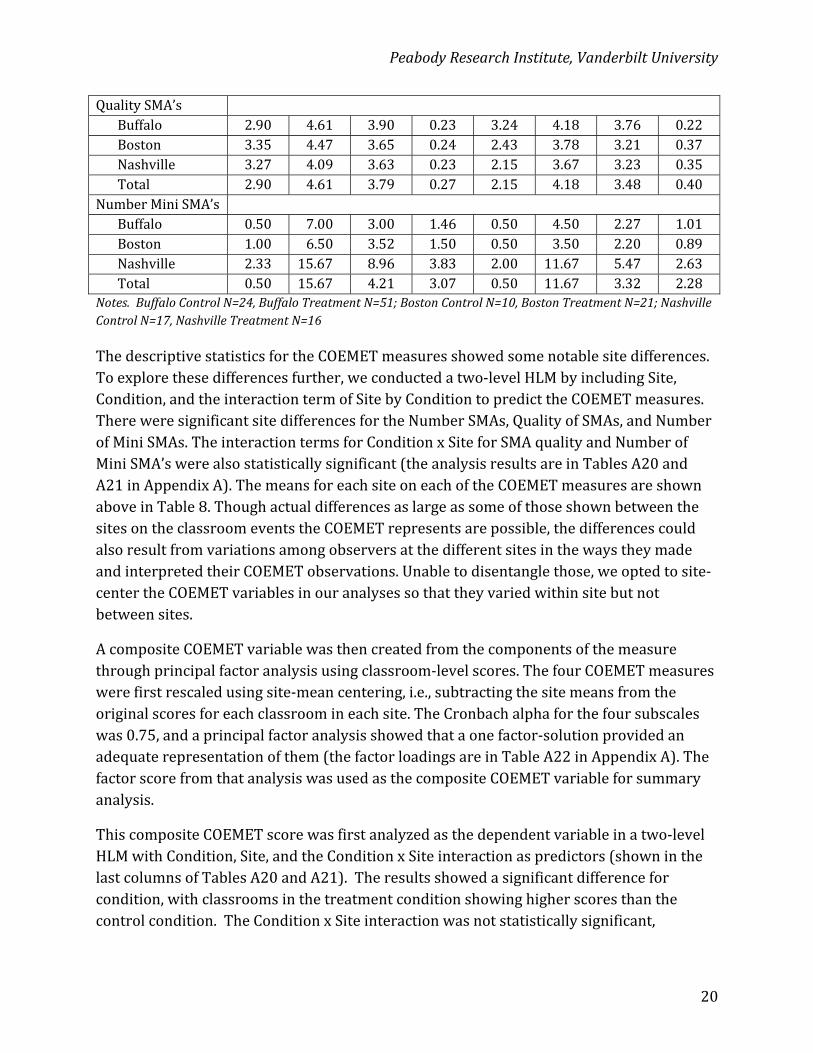
QualitySMA’sBuffalo 2.90 4.61 3.90 0.23 3.24 4.18 3.76 0.22Boston 3.35 4.47 3.65 0.24 2.43 3.78 3.21 0.37Nashville 3.27 4.09 3.63 0.23 2.15 3.67 3.23 0.35Total 2.90 4.61 3.79 0.27 2.15 4.18 3.48 0.40
NumberMiniSMA’sBuffalo 0.50 7.00 3.00 1.46 0.50 4.50 2.27 1.01Boston 1.00 6.50 3.52 1.50 0.50 3.50 2.20 0.89Nashville 2.33 15.67 8.96 3.83 2.00 11.67 5.47 2.63Total 0.50 15.67 4.21 3.07 0.50 11.67 3.32 2.28
Notes.BuffaloControlN=24,BuffaloTreatmentN=51;BostonControlN=10,BostonTreatmentN=21;NashvilleControlN=17,NashvilleTreatmentN=16
ThedescriptivestatisticsfortheCOEMETmeasuresshowedsomenotablesitedifferences.Toexplorethesedifferencesfurther,weconductedatwo‐levelHLMbyincludingSite,Condition,andtheinteractiontermofSitebyConditiontopredicttheCOEMETmeasures.ThereweresignificantsitedifferencesfortheNumberSMAs,QualityofSMAs,andNumberofMiniSMAs.TheinteractiontermsforConditionxSiteforSMAqualityandNumberofMiniSMA’swerealsostatisticallysignificant(theanalysisresultsareinTablesA20andA21inAppendixA).ThemeansforeachsiteoneachoftheCOEMETmeasuresareshownaboveinTable8.ThoughactualdifferencesaslargeassomeofthoseshownbetweenthesitesontheclassroomeventstheCOEMETrepresentsarepossible,thedifferencescouldalsoresultfromvariationsamongobserversatthedifferentsitesinthewaystheymadeandinterpretedtheirCOEMETobservations.Unabletodisentanglethose,weoptedtosite‐centertheCOEMETvariablesinouranalysessothattheyvariedwithinsitebutnotbetweensites.
AcompositeCOEMETvariablewasthencreatedfromthecomponentsofthemeasurethroughprincipalfactoranalysisusingclassroom‐levelscores.ThefourCOEMETmeasureswerefirstrescaledusingsite‐meancentering,i.e.,subtractingthesitemeansfromtheoriginalscoresforeachclassroomineachsite.TheCronbachalphaforthefoursubscaleswas0.75,andaprincipalfactoranalysisshowedthataonefactor‐solutionprovidedanadequaterepresentationofthem(thefactorloadingsareinTableA22inAppendixA).ThefactorscorefromthatanalysiswasusedasthecompositeCOEMETvariableforsummaryanalysis.
ThiscompositeCOEMETscorewasfirstanalyzedasthedependentvariableinatwo‐levelHLMwithCondition,Site,andtheConditionxSiteinteractionaspredictors(showninthelastcolumnsofTablesA20andA21).Theresultsshowedasignificantdifferenceforcondition,withclassroomsinthetreatmentconditionshowinghigherscoresthanthecontrolcondition.TheConditionxSiteinteractionwasnotstatisticallysignificant,
PeabodyResearchInstitute,VanderbiltUniversity
21
indicatingnoreliabledifferencebetweensitesinthestrengthoftherelationshipbetweenConditionandtheCOEMETcompositevariable.
Toexaminetheeffectofgeneralmathematicsinstructiononchildren’smathperformance,thesameanalysisusedtoinvestigateResearchQuestion1wasrunagain,butwiththeCOEMETcompositeasthekeypredictorinplaceofexperimentalcondition.TheCOEMETcompositewassignificantlyandpositivelyrelatedtochildren’sREMAgainsduringPre‐Kwithchild‐leveldemographiccharacteristicscontrolled(F=35.11,p<.0001)(TableA23inAppendixA).Moreover,theSitexCOEMETinteractionwasnotsignificant,indicatingthattheinfluenceoftheCOEMETwassimilaracrosssites.Usingthefoursite‐centeredsubscalesoftheCOEMETinplaceofthecompositeinthatanalysisshowedthatstrongestindependentrelationshiptoREMAgainwasmadebytheQualityofSMAsubscale,theonlyoneofthefourtoshowastatisticallysignificantindividualrelationship.TheweakestindependentrelationshipwasshownbythenumberofSMAs(TableA24inAppendixA).
ThePre‐KCOEMETcompositealsosignificantlyandpositivelypredictedchildren’sREMAgainsthroughKindergarten(F=5.51,p=.013;TableA25inAppendixA).Onceagain,thestrongestindependentcontributiontotheeffectcamefromtheSMAqualityrating(TableA26inAppendixA).Thoughpositivelyrelated,Pre‐KCOEMETscoreswerenotsignificantlypredictiveofchildren’sgainthroughfirstgrade(TablesA27andA28inAppendixA).
AnadditionalanalysiswasdonetoexaminetheextenttowhichthePre‐KCOEMETcompositescoremoderatedthetreatmenteffectonREMAgainthroughPre‐K(Time2).Thatis,thisanalysisaskedwhetherthetreatmenteffectvarieddependingontheoverallCOEMETscore.Inathree‐levelHLMincludingCondition,COEMETComposite,andtheConditionxCOEMETinteraction,theinteractiontermwasnotstatisticallysignificant(TableA29inAppendixA),indicatingthattheeffectsoftheinterventiononPre‐KgaindidnotdependonCOEMETCompositescores.
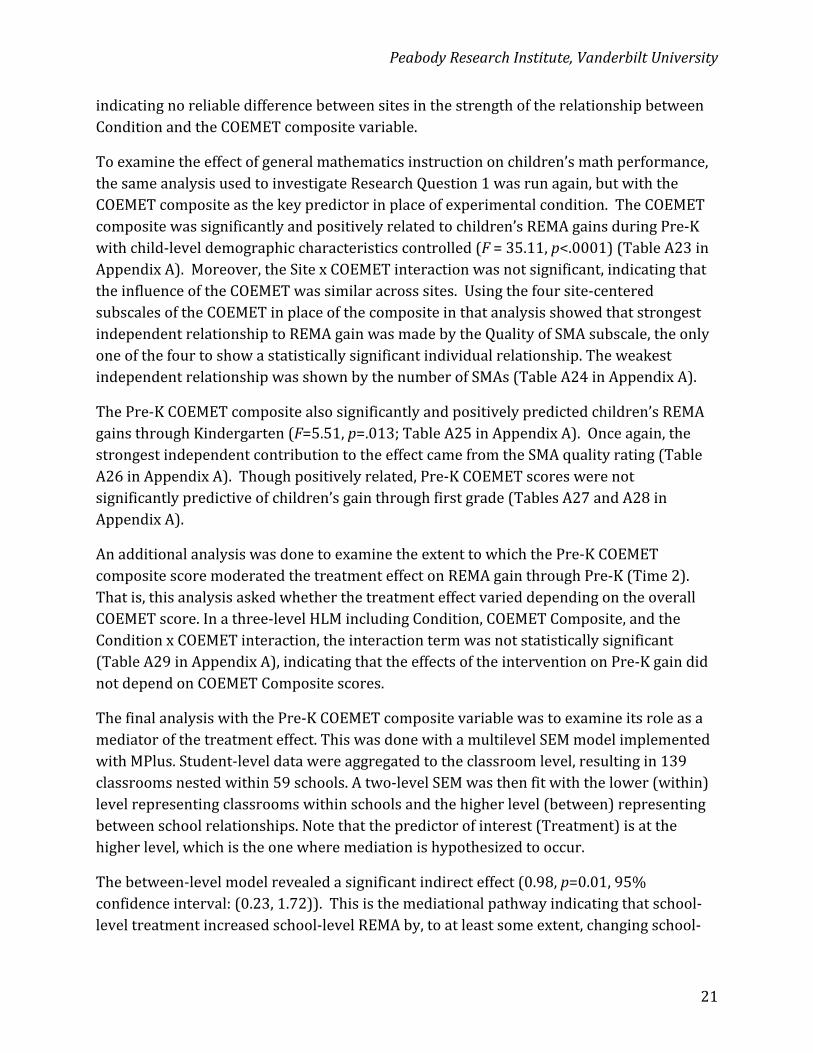
ThefinalanalysiswiththePre‐KCOEMETcompositevariablewastoexamineitsroleasamediatorofthetreatmenteffect.ThiswasdonewithamultilevelSEMmodelimplementedwithMPlus.Student‐leveldatawereaggregatedtotheclassroomlevel,resultingin139classroomsnestedwithin59schools.Atwo‐levelSEMwasthenfitwiththelower(within)levelrepresentingclassroomswithinschoolsandthehigherlevel(between)representingbetweenschoolrelationships.Notethatthepredictorofinterest(Treatment)isatthehigherlevel,whichistheonewheremediationishypothesizedtooccur.
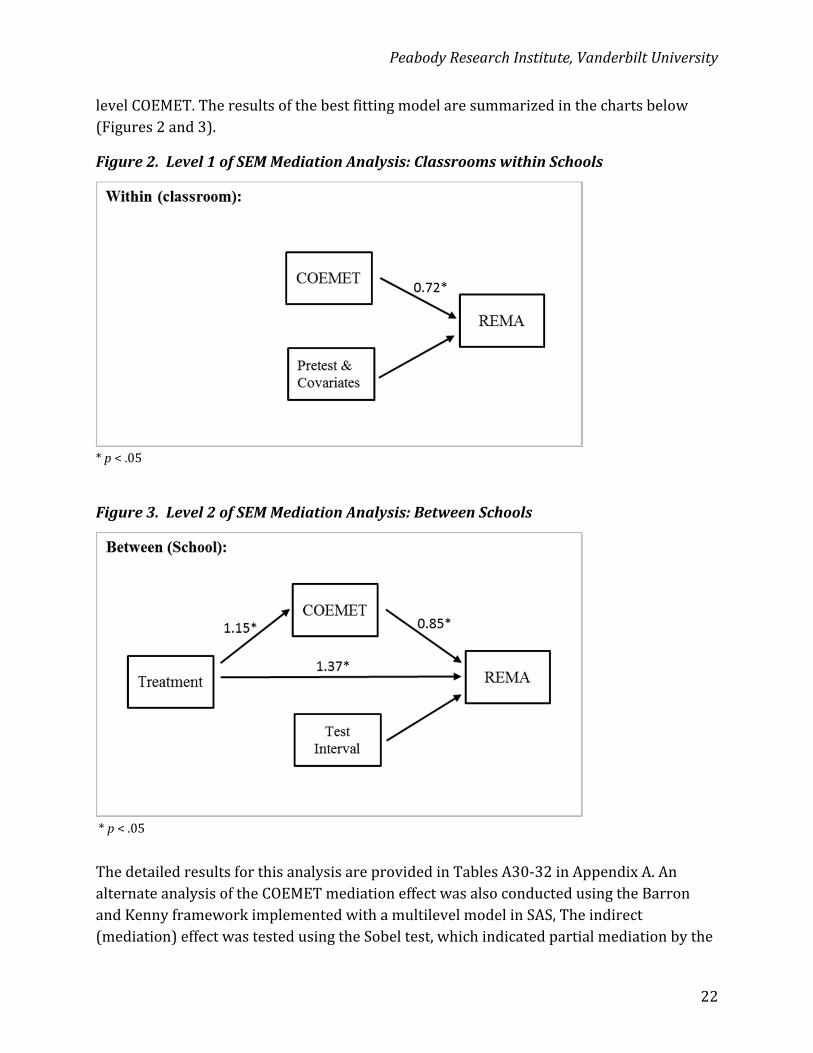
Thebetween‐levelmodelrevealedasignificantindirecteffect(0.98,p=0.01,95%confidenceinterval:(0.23,1.72)).Thisisthemediationalpathwayindicatingthatschool‐leveltreatmentincreasedschool‐levelREMAby,toatleastsomeextent,changingschool‐
PeabodyResearchInstitute,VanderbiltUniversity
22
levelCOEMET.Theresultsofthebestfittingmodelaresummarizedinthechartsbelow(Figures2and3).
Figure2.Level1ofSEMMediationAnalysis:ClassroomswithinSchools
*p<.05
Figure3.Level2ofSEMMediationAnalysis:BetweenSchools
*p<.05
ThedetailedresultsforthisanalysisareprovidedinTablesA30‐32inAppendixA.AnalternateanalysisoftheCOEMETmediationeffectwasalsoconductedusingtheBarronandKennyframeworkimplementedwithamultilevelmodelinSAS,Theindirect(mediation)effectwastestedusingtheSobeltest,whichindicatedpartialmediationbythe
PeabodyResearchInstitute,VanderbiltUniversity
23
COEMET(indirecteffectestimate=1.19,p<0.0001,95%confidenceinterval:(0.18,2.21)).ThisestimateoftheindirecteffectissomewhatlargerthanthatfoundintheMPlusSEManalysis,butstillsubstantiallysimilarandalsostatisticallysignificant.NearFidelityExploration
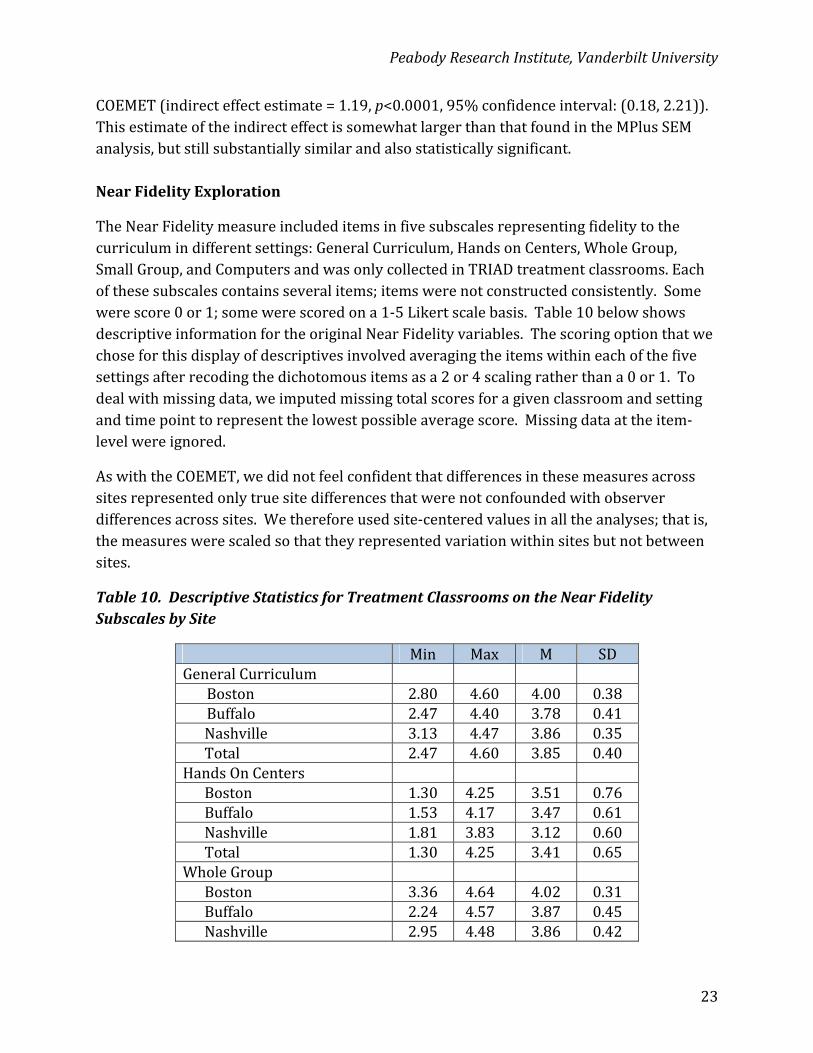
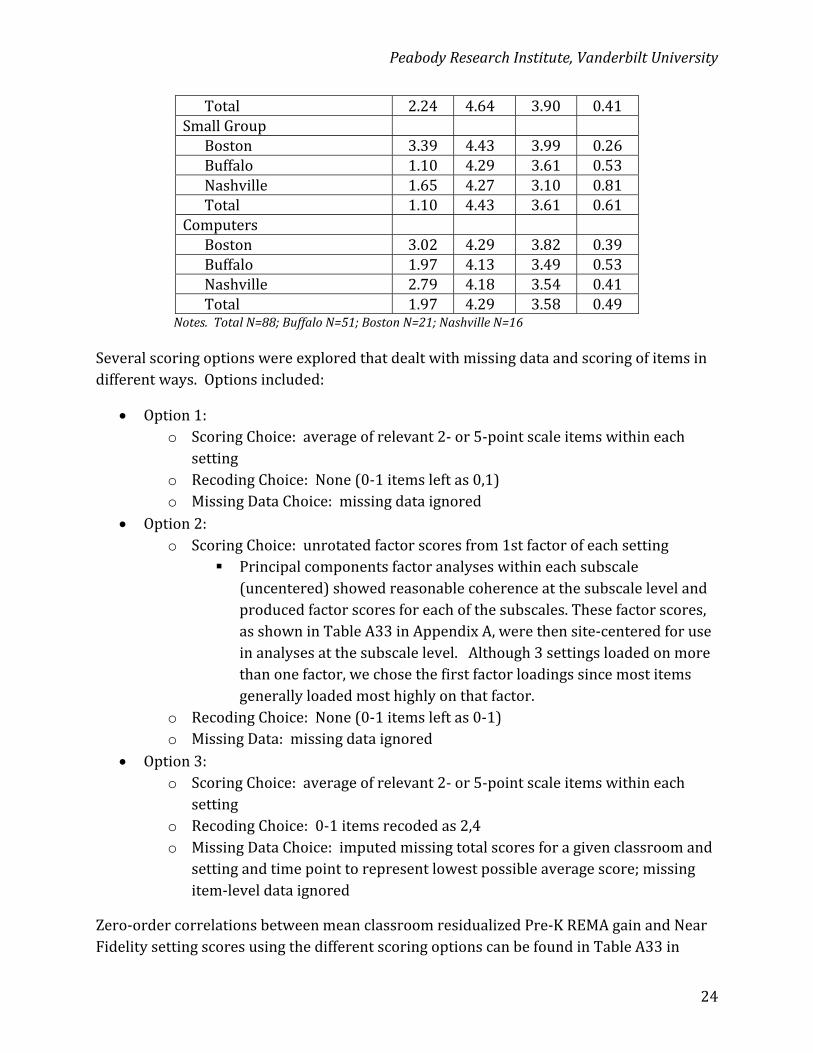
TheNearFidelitymeasureincludeditemsinfivesubscalesrepresentingfidelitytothecurriculumindifferentsettings:GeneralCurriculum,HandsonCenters,WholeGroup,SmallGroup,andComputersandwasonlycollectedinTRIADtreatmentclassrooms.Eachofthesesubscalescontainsseveralitems;itemswerenotconstructedconsistently.Somewerescore0or1;somewerescoredona1‐5Likertscalebasis.Table10belowshowsdescriptiveinformationfortheoriginalNearFidelityvariables.Thescoringoptionthatwechoseforthisdisplayofdescriptivesinvolvedaveragingtheitemswithineachofthefivesettingsafterrecodingthedichotomousitemsasa2or4scalingratherthana0or1.Todealwithmissingdata,weimputedmissingtotalscoresforagivenclassroomandsettingandtimepointtorepresentthelowestpossibleaveragescore.Missingdataattheitem‐levelwereignored.
AswiththeCOEMET,wedidnotfeelconfidentthatdifferencesinthesemeasuresacrosssitesrepresentedonlytruesitedifferencesthatwerenotconfoundedwithobserverdifferencesacrosssites.Wethereforeusedsite‐centeredvaluesinalltheanalyses;thatis,themeasureswerescaledsothattheyrepresentedvariationwithinsitesbutnotbetweensites.
Table10.DescriptiveStatisticsforTreatmentClassroomsontheNearFidelitySubscalesbySite
Min Max M SDGeneralCurriculum
Boston 2.80 4.60 4.00 0.38Buffalo 2.47 4.40 3.78 0.41Nashville 3.13 4.47 3.86 0.35Total 2.47 4.60 3.85 0.40
HandsOnCenters Boston 1.30 4.25 3.51 0.76Buffalo 1.53 4.17 3.47 0.61Nashville 1.81 3.83 3.12 0.60Total 1.30 4.25 3.41 0.65
WholeGroup Boston 3.36 4.64 4.02 0.31Buffalo 2.24 4.57 3.87 0.45Nashville 2.95 4.48 3.86 0.42
PeabodyResearchInstitute,VanderbiltUniversity
24
Total 2.24 4.64 3.90 0.41SmallGroup
Boston 3.39 4.43 3.99 0.26Buffalo 1.10 4.29 3.61 0.53Nashville 1.65 4.27 3.10 0.81Total 1.10 4.43 3.61 0.61
Computers Boston 3.02 4.29 3.82 0.39Buffalo 1.97 4.13 3.49 0.53Nashville 2.79 4.18 3.54 0.41Total 1.97 4.29 3.58 0.49
Notes.TotalN=88;BuffaloN=51;BostonN=21;NashvilleN=16
Severalscoringoptionswereexploredthatdealtwithmissingdataandscoringofitemsindifferentways.Optionsincluded:
Option1:o ScoringChoice:averageofrelevant2‐or5‐pointscaleitemswithineach
settingo RecodingChoice:None(0‐1itemsleftas0,1)o MissingDataChoice:missingdataignored
Option2:o ScoringChoice:unrotatedfactorscoresfrom1stfactorofeachsetting
Principalcomponentsfactoranalyseswithineachsubscale(uncentered)showedreasonablecoherenceatthesubscalelevelandproducedfactorscoresforeachofthesubscales.Thesefactorscores,asshowninTableA33inAppendixA,werethensite‐centeredforuseinanalysesatthesubscalelevel.Although3settingsloadedonmorethanonefactor,wechosethefirstfactorloadingssincemostitemsgenerallyloadedmosthighlyonthatfactor.
o RecodingChoice:None(0‐1itemsleftas0‐1)o MissingData:missingdataignored
Option3:o ScoringChoice:averageofrelevant2‐or5‐pointscaleitemswithineach
settingo RecodingChoice:0‐1itemsrecodedas2,4o MissingDataChoice:imputedmissingtotalscoresforagivenclassroomand
settingandtimepointtorepresentlowestpossibleaveragescore;missingitem‐leveldataignored
Zero‐ordercorrelationsbetweenmeanclassroomresidualizedPre‐KREMAgainandNearFidelitysettingscoresusingthedifferentscoringoptionscanbefoundinTableA33in
PeabodyResearchInstitute,VanderbiltUniversity
25
AppendixA.Neitherscoringmethod(averagev.factorscores)norrecoding(0,1or2,4fordichotomousitems)mademuchofadifferenceincorrelationswithgain.Howmissingdatawastreatedmadeaslightdifferenceincorrelationswithgain.Byasmallmargin,theOption2scoringshowedthelargestcorrelationwithgain,andweselecteditforuseinfurtheranalyses.
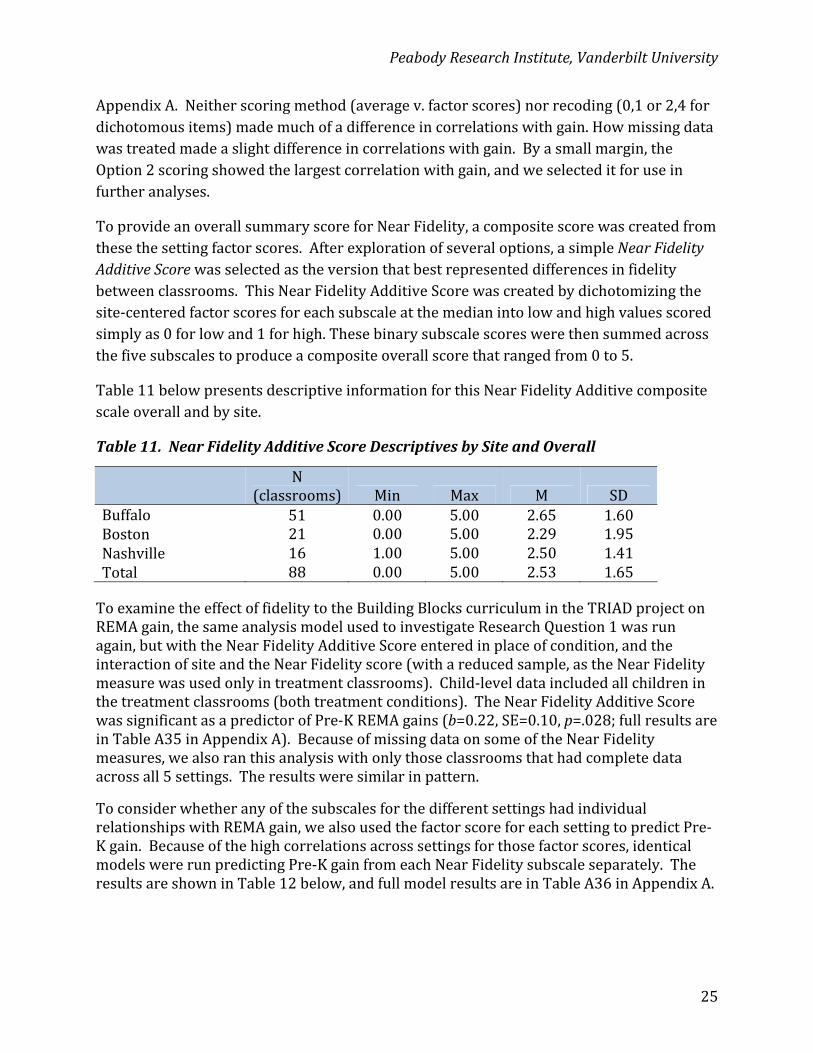
ToprovideanoverallsummaryscoreforNearFidelity,acompositescorewascreatedfromthesethesettingfactorscores.Afterexplorationofseveraloptions,asimpleNearFidelityAdditiveScorewasselectedastheversionthatbestrepresenteddifferencesinfidelitybetweenclassrooms.ThisNearFidelityAdditiveScorewascreatedbydichotomizingthesite‐centeredfactorscoresforeachsubscaleatthemedianintolowandhighvaluesscoredsimplyas0forlowand1forhigh.Thesebinarysubscalescoreswerethensummedacrossthefivesubscalestoproduceacompositeoverallscorethatrangedfrom0to5.
Table11belowpresentsdescriptiveinformationforthisNearFidelityAdditivecompositescaleoverallandbysite.
Table11.NearFidelityAdditiveScoreDescriptivesbySiteandOverall
N(classrooms) Min Max M SD
Buffalo 51 0.00 5.00 2.65 1.60Boston 21 0.00 5.00 2.29 1.95Nashville 16 1.00 5.00 2.50 1.41Total 88 0.00 5.00 2.53 1.65
ToexaminetheeffectoffidelitytotheBuildingBlockscurriculumintheTRIADprojectonREMAgain,thesameanalysismodelusedtoinvestigateResearchQuestion1wasrunagain,butwiththeNearFidelityAdditiveScoreenteredinplaceofcondition,andtheinteractionofsiteandtheNearFidelityscore(withareducedsample,astheNearFidelitymeasurewasusedonlyintreatmentclassrooms).Child‐leveldataincludedallchildreninthetreatmentclassrooms(bothtreatmentconditions).TheNearFidelityAdditiveScorewassignificantasapredictorofPre‐KREMAgains(b=0.22,SE=0.10,p=.028;fullresultsareinTableA35inAppendixA).BecauseofmissingdataonsomeoftheNearFidelitymeasures,wealsoranthisanalysiswithonlythoseclassroomsthathadcompletedataacrossall5settings.Theresultsweresimilarinpattern.
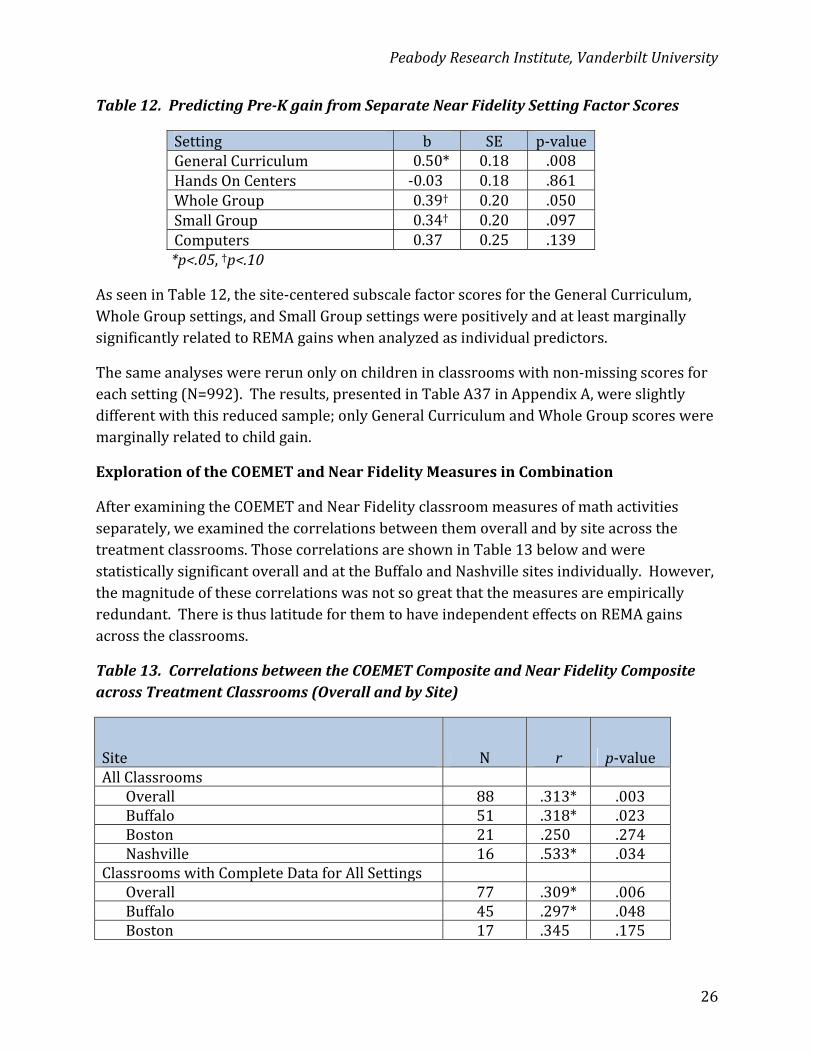
ToconsiderwhetheranyofthesubscalesforthedifferentsettingshadindividualrelationshipswithREMAgain,wealsousedthefactorscoreforeachsettingtopredictPre‐Kgain.Becauseofthehighcorrelationsacrosssettingsforthosefactorscores,identicalmodelswererunpredictingPre‐KgainfromeachNearFidelitysubscaleseparately.TheresultsareshowninTable12below,andfullmodelresultsareinTableA36inAppendixA.
PeabodyResearchInstitute,VanderbiltUniversity
26
Table12.PredictingPre‐KgainfromSeparateNearFidelitySettingFactorScores
Setting b SE p‐valueGeneralCurriculum 0.50* 0.18 .008HandsOnCenters ‐0.03 0.18 .861WholeGroup 0.39† 0.20 .050SmallGroup 0.34† 0.20 .097Computers 0.37 0.25 .139*p<.05,†p<.10
AsseeninTable12,thesite‐centeredsubscalefactorscoresfortheGeneralCurriculum,WholeGroupsettings,andSmallGroupsettingswerepositivelyandatleastmarginallysignificantlyrelatedtoREMAgainswhenanalyzedasindividualpredictors.
Thesameanalyseswerererunonlyonchildreninclassroomswithnon‐missingscoresforeachsetting(N=992).Theresults,presentedinTableA37inAppendixA,wereslightlydifferentwiththisreducedsample;onlyGeneralCurriculumandWholeGroupscoresweremarginallyrelatedtochildgain.
ExplorationoftheCOEMETandNearFidelityMeasuresinCombination
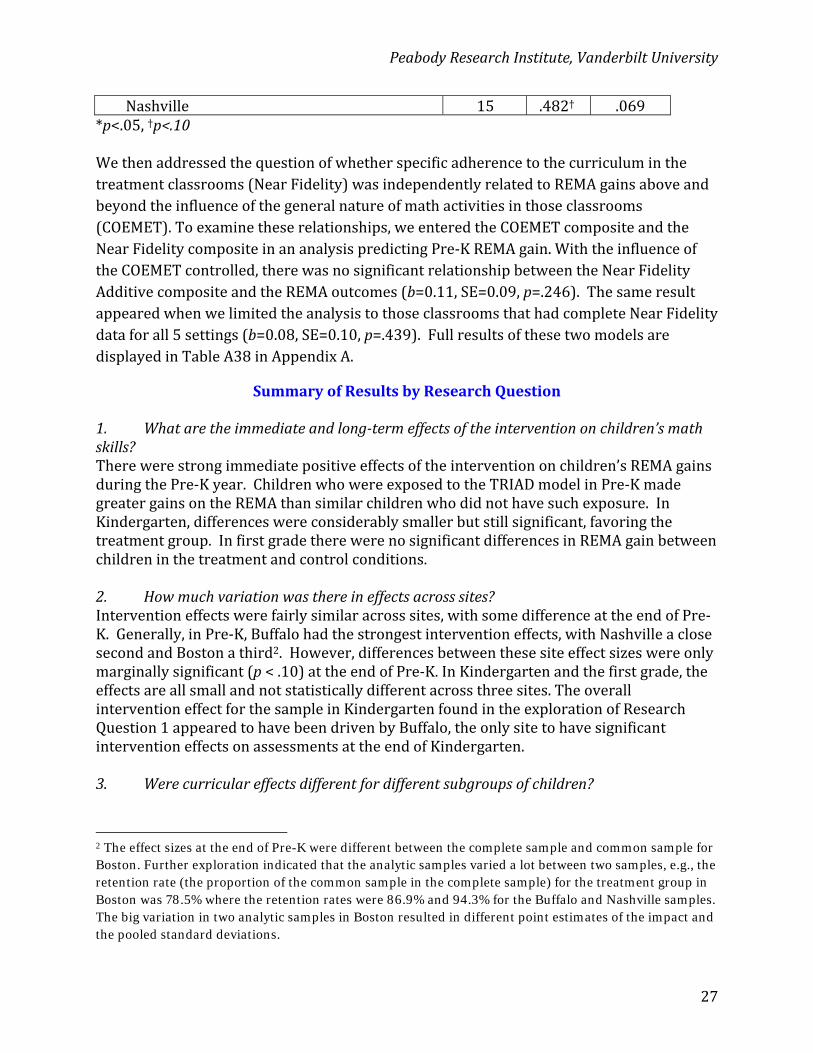
AfterexaminingtheCOEMETandNearFidelityclassroommeasuresofmathactivitiesseparately,weexaminedthecorrelationsbetweenthemoverallandbysiteacrossthetreatmentclassrooms.ThosecorrelationsareshowninTable13belowandwerestatisticallysignificantoverallandattheBuffaloandNashvillesitesindividually.However,themagnitudeofthesecorrelationswasnotsogreatthatthemeasuresareempiricallyredundant.ThereisthuslatitudeforthemtohaveindependenteffectsonREMAgainsacrosstheclassrooms.
Table13.CorrelationsbetweentheCOEMETCompositeandNearFidelityCompositeacrossTreatmentClassrooms(OverallandbySite)
Site N r p‐valueAllClassrooms
Overall 88 .313* .003Buffalo 51 .318* .023Boston 21 .250 .274Nashville 16 .533* .034
ClassroomswithCompleteDataforAllSettings Overall 77 .309* .006Buffalo 45 .297* .048Boston 17 .345 .175
PeabodyResearchInstitute,VanderbiltUniversity
27
Nashville 15 .482† .069*p<.05,†p<.10
Wethenaddressedthequestionofwhetherspecificadherencetothecurriculuminthetreatmentclassrooms(NearFidelity)wasindependentlyrelatedtoREMAgainsaboveandbeyondtheinfluenceofthegeneralnatureofmathactivitiesinthoseclassrooms(COEMET).Toexaminetheserelationships,weenteredtheCOEMETcompositeandtheNearFidelitycompositeinananalysispredictingPre‐KREMAgain.WiththeinfluenceoftheCOEMETcontrolled,therewasnosignificantrelationshipbetweentheNearFidelityAdditivecompositeandtheREMAoutcomes(b=0.11,SE=0.09,p=.246).ThesameresultappearedwhenwelimitedtheanalysistothoseclassroomsthathadcompleteNearFidelitydataforall5settings(b=0.08,SE=0.10,p=.439).FullresultsofthesetwomodelsaredisplayedinTableA38inAppendixA.
SummaryofResultsbyResearchQuestion
1. Whataretheimmediateandlong‐termeffectsoftheinterventiononchildren’smathskills?Therewerestrongimmediatepositiveeffectsoftheinterventiononchildren’sREMAgainsduringthePre‐Kyear.ChildrenwhowereexposedtotheTRIADmodelinPre‐KmadegreatergainsontheREMAthansimilarchildrenwhodidnothavesuchexposure.InKindergarten,differenceswereconsiderablysmallerbutstillsignificant,favoringthetreatmentgroup.InfirstgradetherewerenosignificantdifferencesinREMAgainbetweenchildreninthetreatmentandcontrolconditions.
2. Howmuchvariationwasthereineffectsacrosssites?Interventioneffectswerefairlysimilaracrosssites,withsomedifferenceattheendofPre‐K.Generally,inPre‐K,Buffalohadthestrongestinterventioneffects,withNashvilleaclosesecondandBostonathird2.However,differencesbetweenthesesiteeffectsizeswereonlymarginallysignificant(p<.10)attheendofPre‐K.InKindergartenandthefirstgrade,theeffectsareallsmallandnotstatisticallydifferentacrossthreesites.TheoverallinterventioneffectforthesampleinKindergartenfoundintheexplorationofResearchQuestion1appearedtohavebeendrivenbyBuffalo,theonlysitetohavesignificantinterventioneffectsonassessmentsattheendofKindergarten.3. Werecurriculareffectsdifferentfordifferentsubgroupsofchildren?
2 The effect sizes at the end of Pre-K were different between the complete sample and common sample for Boston. Further exploration indicated that the analytic samples varied a lot between two samples, e.g., the retention rate (the proportion of the common sample in the complete sample) for the treatment group in Boston was 78.5% where the retention rates were 86.9% and 94.3% for the Buffalo and Nashville samples. The big variation in two analytic samples in Boston resulted in different point estimates of the impact and the pooled standard deviations.
PeabodyResearchInstitute,VanderbiltUniversity
28
Severalchild‐levelmoderatorsweretestedtoevaluatewhethertheeffectsoftheinterventionweredifferentiallyrelatedtochildcharacteristics.Curriculareffectsdidnotdiffersignificantlydependingongender,ELLstatus,WhiteversusNon‐White,orHispaniccomparedtoNon‐Hispanic.However,differenceswerefoundregardingpretestscores,age,andBlackversusNon‐Black.Theinterventionwasmoreeffectiveforchildrenwithlowpretestscorescomparedtothosewithhigherpretests,childrenwhoenteredPre‐Katayoungeragecomparedtothosewhowereolderatthestartofschool,andBlackchildrencomparedtoNon‐Blackchildren.Thesemoderatoreffectsweregenerallytrueacrossallthesiteswiththeexceptionofpretest;inBoston,therewerenosignificantlydifferentcurriculareffectsdependingonachild’senteringscores.4. Whataretheeffectsofthemathenvironmentandthefidelityofimplementationonchildren’simmediateandlongtermmathgains,overallandacrosssites?Wefoundpositiverelationshipsbetweenclassroom‐levelvariablesrelatedtohowmuchmathematicswasobservedandchildren’sgain.Highermathenvironment(COEMET)compositescores,measuredinbothtreatmentandcontrolclassrooms,werecorrelatedwithgreaterREMAgainduringPre‐KandKindergarteninallthreesites.WhiletheactualnumberofmathactivitieshadtheweakestrelationshipwithclassroomREMAgain,thequalityofactivitiesobservedhadthestrongestrelationshiptogains.
Inadditiontothemaineffectofmathenvironment,weexaminedtheinterplaybetweenmathenvironmentqualityandtreatment.AlthoughCOEMETscorespredictedgreaterREMAgain,theywerenotfoundtomoderatetheeffectsofthecurriculum.TheeffectoftheinterventiononREMAgainwasnotdifferentdependingonclassroomCOEMETscores.However,COEMETscoreswereasignificantmediatorofmeanREMAgain.MediatoranalysesshowedthattheinterventionwasrelatedtogreaterREMAgainatleastpartiallythroughitseffectonmathenvironmentqualityscores.
WealsoexaminedfidelityofimplementationintreatmentclassroomswiththeNearFidelityinstrument.NearFidelitycompositescoressignificantlypredictedgreaterREMAgaininPre‐K.Bylookingattheindividualsettingsoftheinstrument,wefoundthatscoresinGeneralCurriculum,SmallGroups,andComputersettingsweredrivingtheoverallpositiveprediction.Itshouldbenoted,however,thatmissingdatamadesomeslightdifferences.TherewereseveralmissingdataissueswiththeNearFidelitymeasure,bothattheitemlevelandthesettinglevel.Whenweconsideredonlythoseclassroomsthathadvaliddataforallsettings,theoveralleffectoftheNearFidelitycompositewasthesame,butthelookbysettingwasdifferent.WhenwetestedthepredictionofNearFidelityscorestoPre‐KREMAgaincontrollingforCOEMETscores,implementationfidelitynolongersignificantlypredictedgain.
PeabodyResearchInstitute,VanderbiltUniversity
29
References
Clements,D.&Sarama,J.(June2006).ScalingUpTRIAD:TeachingEarlyMathematicsforUnderstandingwithTrajectoriesandTechnology,proposalfundedbytheInstituteforEducationSciences.
Clements,D.,&Sarama,J.(2011).Earlychildhoodmathematicsintervention.Science,333,968‐970.S
Clements,D.,Sarama,J.,&Liu,X.(July2008).DevelopmentofameasureofearlymathematicsachievementusingtheRaschmodel:theResearch‐BasedEarlyMathAssessment.EducationalPsychology,28(4),457‐482.
Sarama,J.,&Clements,D.H.(2007).Manualforclassroomobservation(COEMET)–Version3.Unpublishedversion.
Sarama,J.,Clements,D.H.,Starkey,P.,Klein,A.,&Wakeley,A.(2008).Scalinguptheimplementationofapre‐kindergartenmathematicscurriculum:Teachingforunderstandingwithtrajectoriesandtechnologies.JournalofResearchonEducationalEffectiveness,1,89‐119.

PeabodyResearchInstitute,VanderbiltUniversity
30
Appendices
PeabodyResearchInstitute,VanderbiltUniversity
31
AppendixA
PeabodyResearchInstitute,VanderbiltUniversity
32
TableA1:SampleSizesbyTime(Series1–completesample)
Time2
Site N1 (student) N2 (class) N3 (school) Buffalo 946 75 25 Boston 359 31 18 Nashville 409 33 16 Total 1714 139 59
Time3
Site N1 (student) N2 (class) N3 (school) Buffalo 579 49 18 Boston 200 21 12 Nashville 413 33 16 Total 1192 103 46
Time4
Site N1 (student) N2 (class) N3 (school) Buffalo 530 49 18 Boston 191 21 12 Nashville 408 33 16 Total 1129 103 46
PeabodyResearchInstitute,VanderbiltUniversity
33
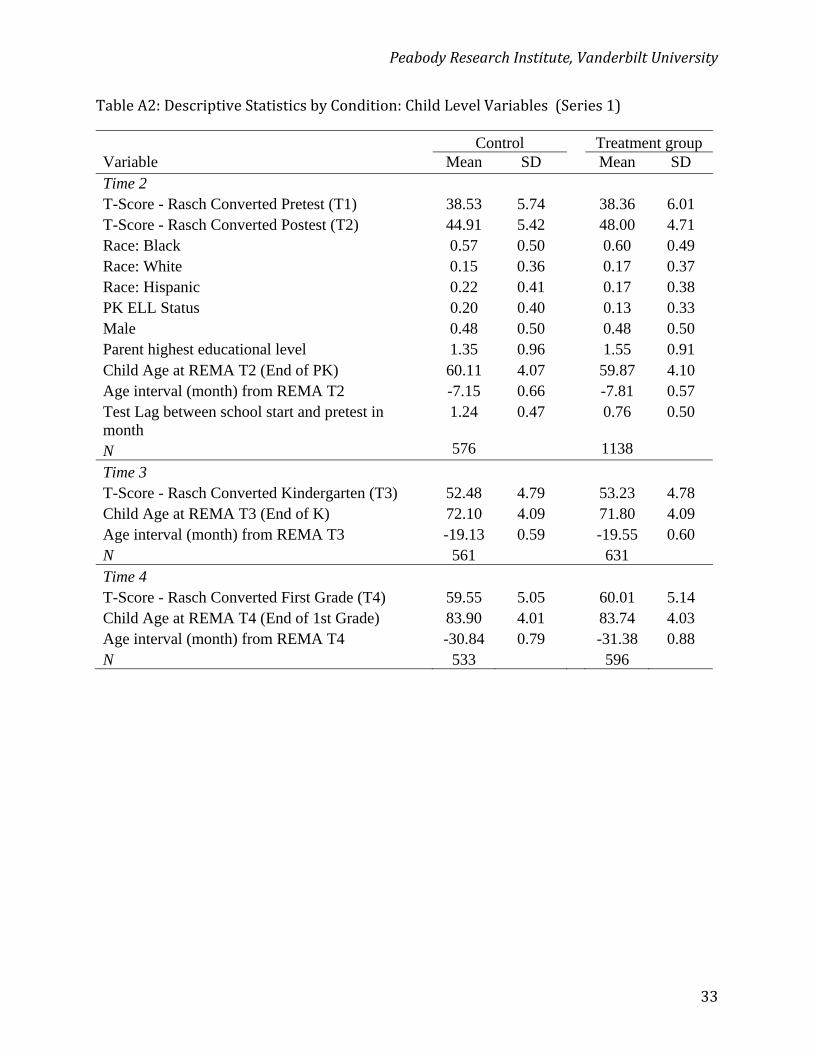
TableA2:DescriptiveStatisticsbyCondition:ChildLevelVariables(Series1)
Control Treatment group Variable Mean SD Mean SD Time 2 T-Score - Rasch Converted Pretest (T1) 38.53 5.74 38.36 6.01 T-Score - Rasch Converted Postest (T2) 44.91 5.42 48.00 4.71 Race: Black 0.57 0.50 0.60 0.49 Race: White 0.15 0.36 0.17 0.37 Race: Hispanic 0.22 0.41 0.17 0.38 PK ELL Status 0.20 0.40 0.13 0.33 Male 0.48 0.50 0.48 0.50 Parent highest educational level 1.35 0.96 1.55 0.91 Child Age at REMA T2 (End of PK) 60.11 4.07 59.87 4.10 Age interval (month) from REMA T2 -7.15 0.66 -7.81 0.57 Test Lag between school start and pretest in month
1.24 0.47 0.76 0.50
N 576 1138 Time 3 T-Score - Rasch Converted Kindergarten (T3) 52.48 4.79 53.23 4.78 Child Age at REMA T3 (End of K) 72.10 4.09 71.80 4.09 Age interval (month) from REMA T3 -19.13 0.59 -19.55 0.60 N 561 631 Time 4 T-Score - Rasch Converted First Grade (T4) 59.55 5.05 60.01 5.14 Child Age at REMA T4 (End of 1st Grade) 83.90 4.01 83.74 4.03 Age interval (month) from REMA T4 -30.84 0.79 -31.38 0.88 N 533 596
PeabodyResearchInstitute,VanderbiltUniversity
34
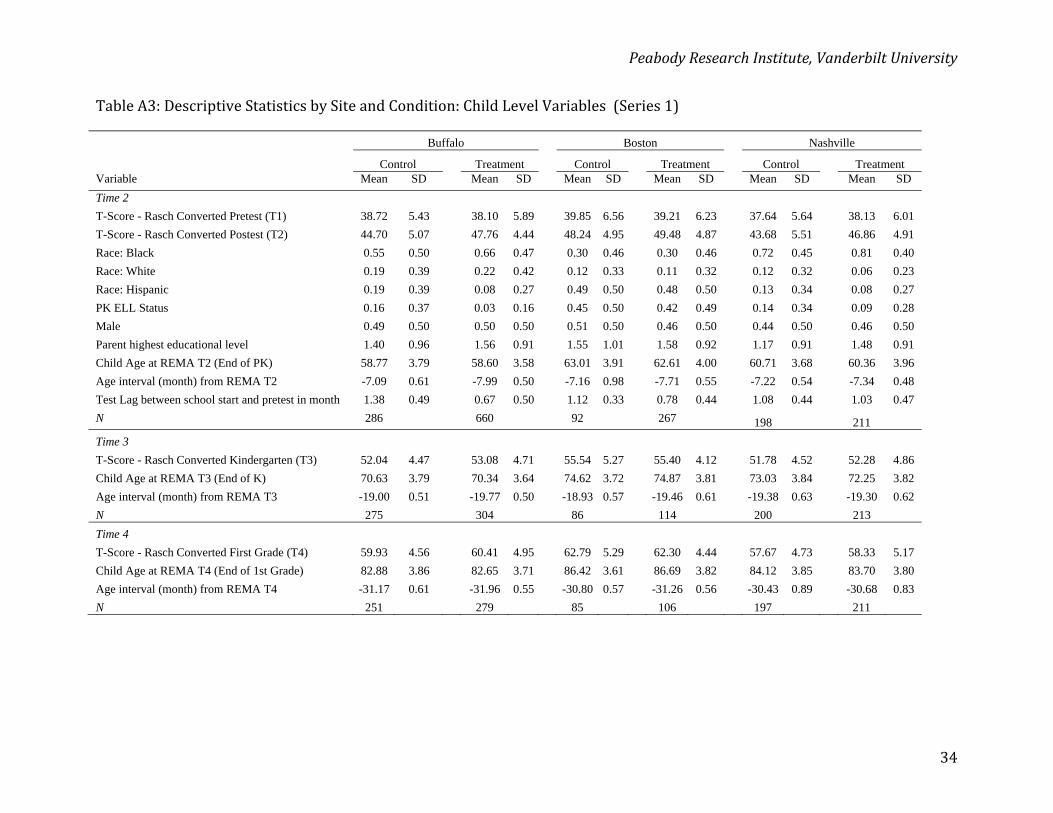
TableA3:DescriptiveStatisticsbySiteandCondition:ChildLevelVariables(Series1)
Buffalo Boston Nashville
Control Treatment Control Treatment Control Treatment Variable Mean SD Mean SD Mean SD Mean SD Mean SD Mean SD
Time 2
T-Score - Rasch Converted Pretest (T1) 38.72 5.43 38.10 5.89 39.85 6.56 39.21 6.23 37.64 5.64 38.13 6.01
T-Score - Rasch Converted Postest (T2) 44.70 5.07 47.76 4.44 48.24 4.95 49.48 4.87 43.68 5.51 46.86 4.91
Race: Black 0.55 0.50 0.66 0.47 0.30 0.46 0.30 0.46 0.72 0.45 0.81 0.40
Race: White 0.19 0.39 0.22 0.42 0.12 0.33 0.11 0.32 0.12 0.32 0.06 0.23
Race: Hispanic 0.19 0.39 0.08 0.27 0.49 0.50 0.48 0.50 0.13 0.34 0.08 0.27
PK ELL Status 0.16 0.37 0.03 0.16 0.45 0.50 0.42 0.49 0.14 0.34 0.09 0.28
Male 0.49 0.50 0.50 0.50 0.51 0.50 0.46 0.50 0.44 0.50 0.46 0.50
Parent highest educational level 1.40 0.96 1.56 0.91 1.55 1.01 1.58 0.92 1.17 0.91 1.48 0.91
Child Age at REMA T2 (End of PK) 58.77 3.79 58.60 3.58 63.01 3.91 62.61 4.00 60.71 3.68 60.36 3.96
Age interval (month) from REMA T2 -7.09 0.61 -7.99 0.50 -7.16 0.98 -7.71 0.55 -7.22 0.54 -7.34 0.48
Test Lag between school start and pretest in month 1.38 0.49 0.67 0.50 1.12 0.33 0.78 0.44 1.08 0.44 1.03 0.47
N 286 660 92 267 198 211
Time 3
T-Score - Rasch Converted Kindergarten (T3) 52.04 4.47 53.08 4.71 55.54 5.27 55.40 4.12 51.78 4.52 52.28 4.86
Child Age at REMA T3 (End of K) 70.63 3.79 70.34 3.64 74.62 3.72 74.87 3.81 73.03 3.84 72.25 3.82
Age interval (month) from REMA T3 -19.00 0.51 -19.77 0.50 -18.93 0.57 -19.46 0.61 -19.38 0.63 -19.30 0.62
N 275 304 86 114 200 213
Time 4
T-Score - Rasch Converted First Grade (T4) 59.93 4.56 60.41 4.95 62.79 5.29 62.30 4.44 57.67 4.73 58.33 5.17
Child Age at REMA T4 (End of 1st Grade) 82.88 3.86 82.65 3.71 86.42 3.61 86.69 3.82 84.12 3.85 83.70 3.80
Age interval (month) from REMA T4 -31.17 0.61 -31.96 0.55 -30.80 0.57 -31.26 0.56 -30.43 0.89 -30.68 0.83
N 251 279 85 106 197 211

PeabodyResearchInstitute,VanderbiltUniversity
35
TableA4:FixedandRandomEffectsAnalysisforREMAOutcome‐CompleteSample:Time2(Series1)
FixedEffect
Effect b SE p Intercept 21.27 3.59 0.0000 Condition 2.74 0.34 0.0000 Site 2: MA 1.60 0.48 0.0013 Site 1: NY 0.75 0.39 0.0564 Site 3: TN (reference) 0.00REMA pretest school-mean centered 0.42 0.02 0.0000 REMA pretest school mean 0.35 0.08 0.0000 Age at Time 2 0.16 0.03 0.0000 Age interval between Time 2 and Time 1 -0.06 0.19 0.7451 Test Lag from School Start to Pretest -0.17 0.22 0.4453 Ethnicity: Black -1.18 0.44 0.0080 Ethnicity: White 0.59 0.49 0.2298 Ethnicity: Hispanic -0.49 0.47 0.2969 English Language Learner Status 0.66 0.35 0.0617 Gender (Male) -0.51 0.18 0.0061 Parent Education 0.49 0.11 0.0000
RandomEffect
Level Variance SE p ICC Level 2 (Class) 0.58 0.27 0.0162 0.04 Level 3 (School) 0.56 0.27 0.0183 0.04 Level 1 (Student) 13.85 0.50 0.0000 NA
RandomEffect‐UnconditionalModel
Level Variance SE p ICC Level 2 (Class) 0.64 0.40 0.0550 0.02 Level 3 (School) 4.73 1.13 0.0000 0.18 Level 1 (Student) 21.64 0.77 0.0000 NA
PeabodyResearchInstitute,VanderbiltUniversity
36
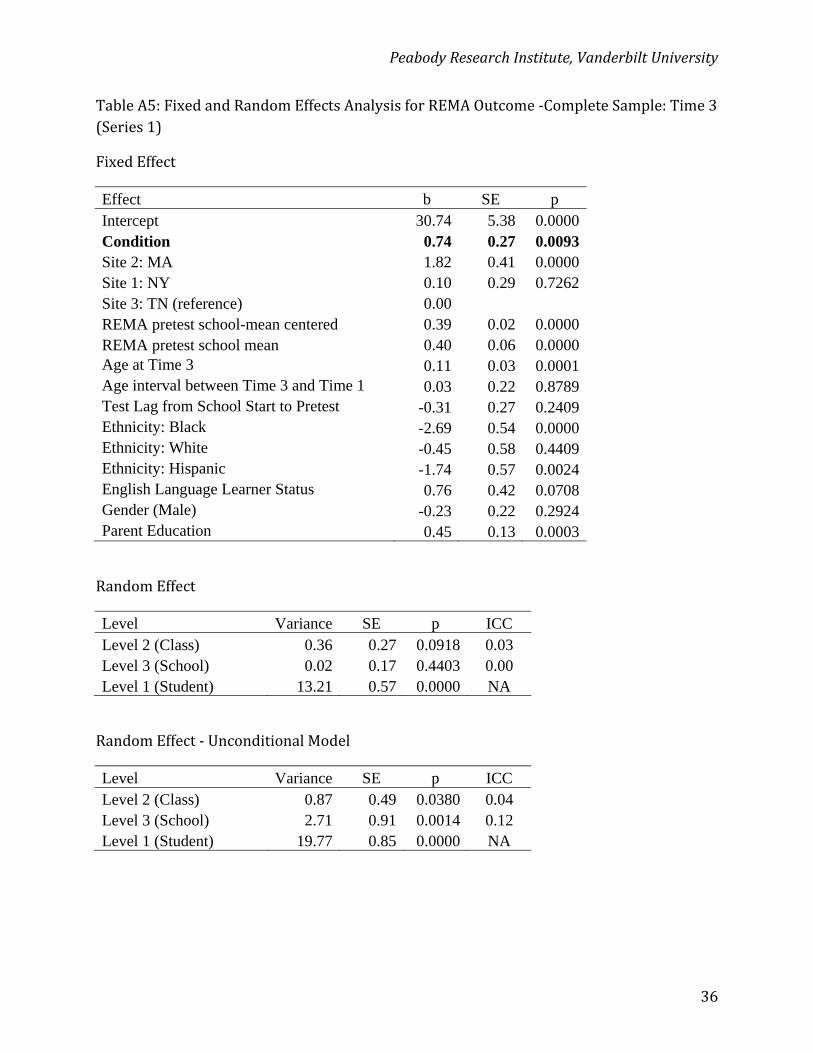
TableA5:FixedandRandomEffectsAnalysisforREMAOutcome‐CompleteSample:Time3(Series1)
FixedEffect
Effect b SE p Intercept 30.74 5.38 0.0000 Condition 0.74 0.27 0.0093 Site 2: MA 1.82 0.41 0.0000 Site 1: NY 0.10 0.29 0.7262 Site 3: TN (reference) 0.00REMA pretest school-mean centered 0.39 0.02 0.0000 REMA pretest school mean 0.40 0.06 0.0000 Age at Time 3 0.11 0.03 0.0001 Age interval between Time 3 and Time 1 0.03 0.22 0.8789 Test Lag from School Start to Pretest -0.31 0.27 0.2409 Ethnicity: Black -2.69 0.54 0.0000 Ethnicity: White -0.45 0.58 0.4409 Ethnicity: Hispanic -1.74 0.57 0.0024 English Language Learner Status 0.76 0.42 0.0708 Gender (Male) -0.23 0.22 0.2924 Parent Education 0.45 0.13 0.0003
RandomEffect
Level Variance SE p ICC Level 2 (Class) 0.36 0.27 0.0918 0.03 Level 3 (School) 0.02 0.17 0.4403 0.00 Level 1 (Student) 13.21 0.57 0.0000 NA
RandomEffect‐UnconditionalModel
Level Variance SE p ICC Level 2 (Class) 0.87 0.49 0.0380 0.04 Level 3 (School) 2.71 0.91 0.0014 0.12 Level 1 (Student) 19.77 0.85 0.0000 NA
PeabodyResearchInstitute,VanderbiltUniversity
37
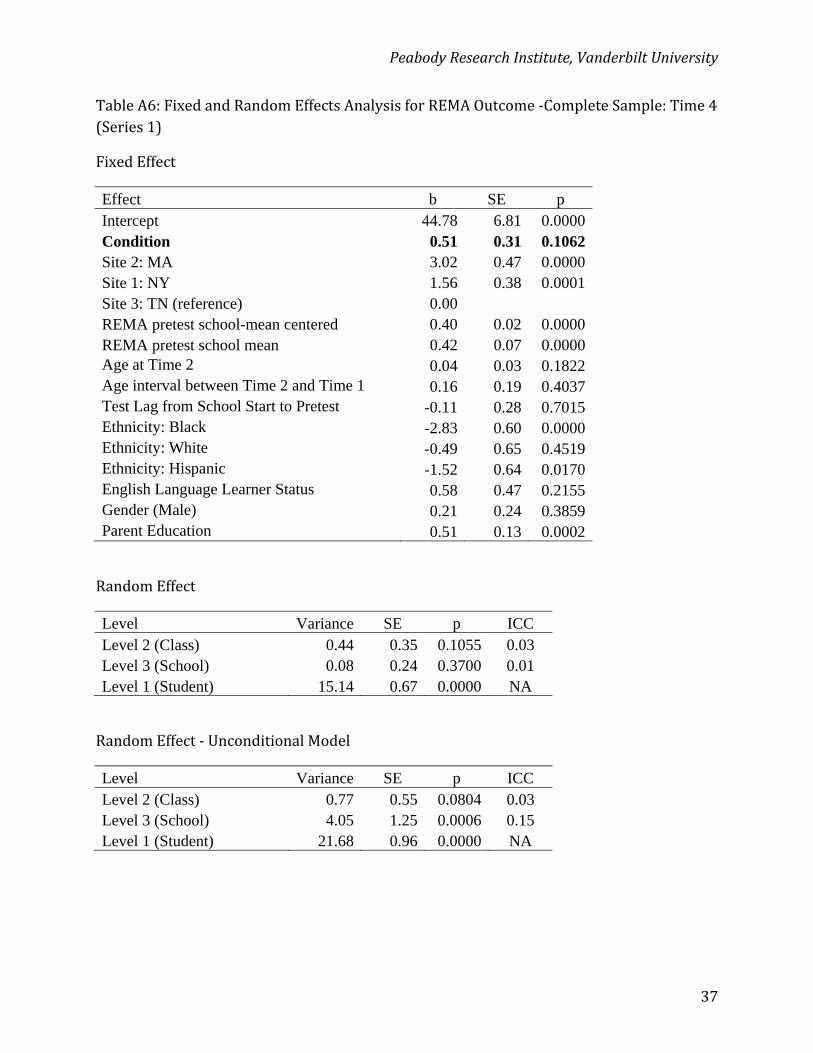
TableA6:FixedandRandomEffectsAnalysisforREMAOutcome‐CompleteSample:Time4(Series1)
FixedEffect
Effect b SE p Intercept 44.78 6.81 0.0000 Condition 0.51 0.31 0.1062 Site 2: MA 3.02 0.47 0.0000 Site 1: NY 1.56 0.38 0.0001 Site 3: TN (reference) 0.00REMA pretest school-mean centered 0.40 0.02 0.0000 REMA pretest school mean 0.42 0.07 0.0000 Age at Time 2 0.04 0.03 0.1822 Age interval between Time 2 and Time 1 0.16 0.19 0.4037 Test Lag from School Start to Pretest -0.11 0.28 0.7015 Ethnicity: Black -2.83 0.60 0.0000 Ethnicity: White -0.49 0.65 0.4519 Ethnicity: Hispanic -1.52 0.64 0.0170 English Language Learner Status 0.58 0.47 0.2155 Gender (Male) 0.21 0.24 0.3859 Parent Education 0.51 0.13 0.0002
RandomEffect
Level Variance SE p ICC Level 2 (Class) 0.44 0.35 0.1055 0.03 Level 3 (School) 0.08 0.24 0.3700 0.01 Level 1 (Student) 15.14 0.67 0.0000 NA
RandomEffect‐UnconditionalModel
Level Variance SE p ICC Level 2 (Class) 0.77 0.55 0.0804 0.03 Level 3 (School) 4.05 1.25 0.0006 0.15 Level 1 (Student) 21.68 0.96 0.0000 NA
PeabodyResearchInstitute,VanderbiltUniversity
38
TableA7:FixedandRandomEffectsAnalysisforREMAOutcome‐CompleteSamplewithConditionxSiteInteraction:Time2(Series1)FixedEffectEffect b SE p
Intercept 21.14 3.54 0.0000 Condition 3.13 0.59 0.0000 Site 2: MA 2.72 0.72 0.0003 Site 1: NY 0.69 0.56 0.2230 Site 3: TN (reference) 0.00
Condition*site 2 -1.71 0.89 0.0565 Condition*site 1 0.01 0.75 0.9886 Condition*site 3 0.00 REMA pretest school-mean centered 0.42 0.02 0.0000 REMA pretest school mean 0.35 0.08 0.0000 Age at Time 2 0.16 0.03 0.0000 Age interval between Time 2 and Time 1 -0.06 0.19 0.7332 Test Lag from School Start to Pretest -0.15 0.22 0.4876 Ethnicity: Black -1.19 0.44 0.0073 Ethnicity: White 0.58 0.49 0.2316 Ethnicity: Hispanic -0.48 0.47 0.3037 English Language Learner Status 0.67 0.35 0.0559 Gender (Male) -0.51 0.18 0.0055 Parent Education 0.49 0.11 0.0000 RandomEffectLevel Variance SE p ICC
Level 2 (Class) 0.57 0.27 0.0168 0.04 Level 3 (School) 0.50 0.25 0.0243 0.03 Level 1 (Student) 13.84 0.50 0.0000 NA Type3TestEffect F Value p
Condition 55.12 0.0000 Site 7.26 0.0013
Condition*site 2.65 0.0783 REMA pretest school-mean centered 545.75 0.0000 REMA pretest school mean 21.37 0.0000 Age at Time 2 37.24 0.0000 Age interval between Time 2 and Time 1 0.12 0.7332 Test Lag from School Start to Pretest 0.48 0.4876 Ethnicity: Black 7.21 0.0073 Ethnicity: White 1.43 0.2316 Ethnicity: Hispanic 1.06 0.3037 English Language Learner Status 3.66 0.0559 Gender (Male) 7.72 0.0055 Parent Education 21.09 0.0000
PeabodyResearchInstitute,VanderbiltUniversity
39
TableA8:FixedandRandomEffectsAnalysisforREMAOutcome‐CompleteSamplewithConditionxSiteInteraction:Time3(Series1)FixedEffectEffect b SE p
Intercept 31.29 5.45 0.0000 Condition 0.52 0.43 0.2405 Site 2: MA 1.88 0.59 0.0020 Site 1: NY -0.19 0.42 0.6567 Site 3: TN (reference) 0.00
Condition*site 2 -0.11 0.76 0.8897 Condition*site 1 0.59 0.60 0.3339 Condition*site 3 0.00 REMA pretest school-mean centered 0.39 0.02 0.0000 REMA pretest school mean 0.41 0.06 0.0000 Age at Time 3 0.11 0.03 0.0001 Age interval between Time 3 and Time 1 0.06 0.23 0.7812 Test Lag from School Start to Pretest -0.26 0.27 0.3406 Ethnicity: Black -2.70 0.54 0.0000 Ethnicity: White -0.49 0.59 0.4004 Ethnicity: Hispanic -1.75 0.57 0.0023 English Language Learner Status 0.77 0.42 0.0659 Gender (Male) -0.23 0.22 0.2943 Parent Education 0.45 0.13 0.0004 RandomEffectLevel Variance SE p ICC
Level 2 (Class) 0.36 0.27 0.0871 0.03 Level 3 (School) 0.03 0.17 0.4274 0.00 Level 1 (Student) 13.20 0.57 0.0000 NA Type3TestEffect F Value p
Condition 5.27 0.0258 Site 7.19 0.0016
Condition*site 0.70 0.5009 REMA pretest school-mean centered 362.34 0.0000 REMA pretest school mean 42.20 0.0000 Age at Time 3 14.74 0.0001 Age interval between Time 3 and Time 1 0.08 0.7812 Test Lag from School Start to Pretest 0.91 0.3406 Ethnicity: Black 24.88 0.0000 Ethnicity: White 0.71 0.4004 Ethnicity: Hispanic 9.34 0.0023 English Language Learner Status 3.39 0.0659 Gender (Male) 1.10 0.2943 Parent Education 12.80 0.0004
PeabodyResearchInstitute,VanderbiltUniversity
40
TableA9:FixedandRandomEffectsAnalysisforREMAOutcome‐CompleteSamplewithConditionxSiteInteraction:Time4(Series1)FixedEffectEffect b SE p
Intercept 44.91 6.85 0.0000 Condition 0.59 0.50 0.2474 Site 2: MA 3.29 0.66 0.0000 Site 1: NY 1.54 0.52 0.0045 Site 3: TN (reference) 0.00
Condition *site 2 -0.52 0.86 0.5504 Condition *site 1 0.05 0.69 0.9399 Condition *site 3 0.00 REMA pretest school-mean centered 0.40 0.02 0.0000 REMA pretest school mean 0.42 0.07 0.0000 Age at Time 4 0.04 0.03 0.1772 Age interval between Time 4 and Time 1 0.17 0.19 0.3897 Test Lag from School Start to Pretest -0.09 0.29 0.7438 Ethnicity: Black -2.82 0.60 0.0000 Ethnicity: White -0.47 0.65 0.4673 Ethnicity: Hispanic -1.52 0.64 0.0175 English Language Learner Status 0.58 0.47 0.2142 Gender (Male) 0.21 0.24 0.3851 Parent Education 0.50 0.14 0.0002 RandomEffectLevel Variance SE p ICC
Level 2 (Class) 0.44 0.35 0.1071 0.03 Level 3 (School) 0.13 0.26 0.3025 0.01 Level 1 (Student) 15.14 0.67 0.0000 NA Type3TestEffect F Value p
Condition 1.63 0.2078 site 12.80 0.0000
Condition *site 0.25 0.7765 REMA pretest school-mean centered 302.33 0.0000 REMA pretest school mean 33.80 0.0000 Age at Time 4 1.82 0.1772 Age interval between Time 4 and Time 1 0.74 0.3897 Test Lag from School Start to Pretest 0.11 0.7438 Ethnicity: Black 22.09 0.0000 Ethnicity: White 0.53 0.4673 Ethnicity: Hispanic 5.67 0.0175 English Language Learner Status 1.54 0.2142 Gender (Male) 0.76 0.3851 Parent Education 13.77 0.0002
PeabodyResearchInstitute,VanderbiltUniversity
41
TableA10:FixedandRandomEffectsAnalysisforREMAOutcome‐Bysite:Time2(Series1)FixedEffect Site 1: NY Site 2: MA Site 3: TN
Effect b SE p b SE p b SE p
Intercept 15.11 6.14 0.0179 22.80 6.38 0.0008 36.00 6.45 0.0000
Condition 3.07 0.54 0.0000 1.44 0.74 0.0684 3.19 0.45 0.0000 REMA pretest school-mean centered 0.34 0.02 0.0000 0.40 0.04 0.0000 0.59 0.04 0.0000 REMA pretest school mean 0.43 0.14 0.0046 0.36 0.12 0.0079 0.17 0.13 0.1982 Age at Time 2 0.20 0.03 0.0000 0.15 0.05 0.0070 0.10 0.05 0.0648 Age interval between Time 2 and Time 1 -0.17 0.26 0.5179 -0.06 0.33 0.8595 0.42 0.50 0.4020 Test Lag from School Start to Pretest -0.03 0.27 0.9014 -0.21 0.53 0.6975 -0.54 0.54 0.3180 Ethnicity: Black -1.23 0.63 0.0520 -0.20 0.82 0.8049 -1.61 1.04 0.1224 Ethnicity: White 0.83 0.68 0.2222 0.82 0.95 0.3836 -0.50 1.22 0.6844 Ethnicity: Hispanic -0.37 0.70 0.5929 -0.05 0.78 0.9509 -0.82 1.58 0.6039 English Language Learner Status -0.26 0.61 0.6648 1.43 0.50 0.0044 0.85 1.64 0.6050 Gender (Male) -0.48 0.24 0.0442 -0.50 0.41 0.2266 -0.40 0.39 0.3159 Parent Education 0.50 0.14 0.0003 0.77 0.24 0.0014 0.28 0.23 0.2284 RandomEffect
Level
Site 1: NY Site 2: MA Site 3: TN
Variance SE p Variance SE p Variance SE p
Level 2 (Class) 0.87 0.39 0.0124 0.00 0.00 Level 3 (School) 0.57 0.37 0.0637 1.08 0.72 0.0673 0.17 0.29 0.2853 Level 1 (Student) 12.89 0.62 0.0000 14.38 1.12 0.0000 14.72 1.06 0.0000 RandomEffect‐UnconditionalModel
Level
Site 1: NY Site 2: MA Site 3: TN
Variance SE p Variance SE p Variance SE p
Level 2 (Class) 0.77 0.48 0.053099 0.00 1.19 1.20 0.159745 Level 3 (School) 3.73 1.32 0.00228 2.04 1.19 0.043815 1.93 1.41 0.085556 Level 1 (Student) 19.08 0.92 1.28E-96 22.44 1.72 3.69E-39 26.68 1.95 5.84E-43
PeabodyResearchInstitute,VanderbiltUniversity
42
TableA11:FixedandRandomEffectsAnalysisforREMAOutcome‐Bysite:Time3(Series1)FixedEffect Site 1: NY Site 2: MA Site 3: TN
Effect b SE p b SE p b SE p
Intercept 28.93 9.27 0.0024 49.80 11.63 0.0000 31.29 9.12 0.0008
Condition 0.87 0.54 0.1173 0.91 0.78 0.2766 0.62 0.38 0.1093 REMA pretest school-mean centered 0.33 0.03 0.0000 0.33 0.05 0.0000 0.50 0.04 0.0000 REMA pretest school mean 0.36 0.14 0.0243 0.40 0.11 0.0062 0.35 0.10 0.0015 Age at Time 3 0.17 0.04 0.0001 0.04 0.07 0.5736 0.07 0.05 0.1776 Age interval between Time 3 and Time 1 0.05 0.35 0.8853 0.67 0.51 0.1861 -0.18 0.38 0.6408 Test Lag from School Start to Pretest -0.47 0.35 0.1897 -0.29 0.77 0.7078 0.25 0.50 0.6186 Ethnicity: Black -2.66 0.80 0.0010 -3.74 1.13 0.0011 -1.56 1.06 0.1413 Ethnicity: White 0.08 0.85 0.9256 -2.87 1.30 0.0285 0.36 1.19 0.7600 Ethnicity: Hispanic -1.38 0.86 0.1113 -2.90 1.13 0.0110 -1.63 1.51 0.2796 English Language Learner Status 0.54 0.69 0.4389 1.61 0.66 0.0151 0.74 1.58 0.6389 Gender (Male) 0.07 0.30 0.8110 -0.95 0.52 0.0707 -0.21 0.37 0.5622 Parent Education 0.42 0.18 0.0185 1.46 0.31 0.0000 -0.03 0.22 0.8789 RandomEffect
Level
Site 1: NY Site 2: MA Site 3: TN
Variance SE p Variance SE p Variance SE p
Level 2 (Class) 0.77 0.47 0.0508 0.00 0.04 0.27 0.4412 Level 3 (School) 0.15 0.33 0.3217 0.60 0.86 0.2418 0.00 Level 1 (Student) 12.66 0.79 0.0000 12.66 1.35 0.0000 13.11 0.96 0.0000 RandomEffect‐UnconditionalModel
Level
Site 1: NY Site 2: MA Site 3: TN
Variance SE p Variance SE p Variance SE p
Level 2 (Class) 1.14 0.69 0.0490 0.00 0.32 0.49 0.2579 Level 3 (School) 1.71 0.92 0.0316 3.39 2.10 0.0531 0.00 Level 1 (Student) 18.50 1.14 0.0000 18.99 1.96 0.0000 21.74 1.57 0.0000
PeabodyResearchInstitute,VanderbiltUniversity
43
TableA12:FixedandRandomEffectsAnalysisforREMAOutcome‐Bysite:Time4(Series1)FixedEffect Site 1: NY Site 2: MA Site 3: TN
Effect b SE p b SE p b SE p
Intercept 49.73 12.41 0.0001 88.84 20.22 0.0000 47.46 9.73 0.0000
Condition 0.55 0.60 0.3686 0.55 1.00 0.5958 0.75 0.41 0.0679 REMA pretest school-mean centered 0.33 0.03 0.0000 0.33 0.06 0.0000 0.52 0.04 0.0000 REMA pretest school mean 0.32 0.17 0.0750 0.58 0.15 0.0044 0.27 0.11 0.0134 Age at Time 4 0.09 0.05 0.0526 -0.16 0.08 0.0358 0.04 0.05 0.4398 Age interval between Time 4 and Time 1 0.27 0.35 0.4390 1.17 0.58 0.0436 0.07 0.25 0.7773 Test Lag from School Start to Pretest -0.16 0.40 0.6923 -0.40 0.86 0.6405 0.11 0.47 0.8150 Ethnicity: Black -3.11 0.91 0.0007 -3.24 1.28 0.0126 -1.55 1.14 0.1731 Ethnicity: White -0.26 0.97 0.7903 -0.94 1.43 0.5102 0.19 1.28 0.8852 Ethnicity: Hispanic -1.61 0.99 0.1047 -0.91 1.26 0.4720 -1.54 1.62 0.3415 English Language Learner Status 0.20 0.78 0.7990 1.33 0.71 0.0619 0.49 1.71 0.7740 Gender (Male) 0.40 0.34 0.2442 0.51 0.56 0.3724 0.03 0.40 0.9433 Parent Education 0.66 0.20 0.0009 1.37 0.31 0.0000 -0.11 0.23 0.6373 RandomEffect
Level
Site 1: NY Site 2: MA Site 3: TN
Variance SE p Variance SE p Variance SE p
Level 2 (Class) 0.83 0.56 0.0686 0.45 1.28 0.3632 0.00 Level 3 (School) 0.32 0.47 0.2513 1.18 1.73 0.2469 0.00 Level 1 (Student) 14.32 0.93 0.0000 13.37 1.51 0.0000 15.53 1.10 0.0000 RandomEffect‐UnconditionalModel
Level
Site 1: NY Site 2: MA Site 3: TN
Variance SE p Variance SE p Variance SE p
Level 2 (Class) 0.91 0.72 0.1019 1.23 1.98 0.2680 0.00 Level 3 (School) 1.70 0.95 0.0364 4.12 3.33 0.1081 0.00 Level 1 (Student) 20.09 1.29 0.0000 19.16 2.08 0.0000 24.69 1.73 0.0000
PeabodyResearchInstitute,VanderbiltUniversity
44
TableA13:SummaryofModeratorAnalysesforREMAOutcome:Time2(Series1)
Moderator Male ELL Pretest Age_T2 Black Hispanic White
Effect b p b p b p b p b p b p b p
Intercept 44.21 0.0000 44.20 0.0000 44.30 0.0000 44.30 0.0000 44.63 0.0000 44.01 0.0000 44.15 0.0000
Condition 2.65 0.0000 2.75 0.0000 2.81 0.0000 2.82 0.0000 2.07 0.0000 2.95 0.0000 2.85 0.0000
Condition*Moderator 0.24 0.5454 0.06 0.9148 -0.13 0.0002 -0.13 0.0107 1.23 0.0073 -0.91 0.1054 -0.52 0.3764
Site 2: MA 1.49 0.0016 1.48 0.0018 1.42 0.0022 1.51 0.0012 1.53 0.0009 1.52 0.0012 1.49 0.0016
Site 1: NY 0.72 0.0648 0.72 0.0649 0.68 0.0759 0.75 0.0512 0.69 0.0671 0.70 0.0690 0.73 0.0607
Site 3: TN 0 0 0 0 0 0 0
REMA pretest grand-mean centered 0.41 0.0000 0.41 0.0000 0.50 0.0000 0.41 0.0000 0.42 0.0000 0.41 0.0000 0.41 0.0000
Age at Time 2 0.16 0.0000 0.16 0.0000 0.16 0.0000 0.24 0.0000 0.16 0.0000 0.16 0.0000 0.16 0.0000 Age interval between Time 2 and Time 1 -0.07 0.6912 -0.07 0.7197 -0.05 0.7838 -0.04 0.8122 -0.07 0.6950 -0.08 0.6840 -0.07 0.7267 Test Lag from School Start to Pretest -0.17 0.4456 -0.17 0.4330 -0.16 0.4591 -0.15 0.5036 -0.19 0.3887 -0.18 0.4138 -0.18 0.4192
Ethnicity: Black -1.16 0.0087 -1.17 0.0084 -1.17 0.0083 -1.19 0.0070 -1.96 0.0002 -1.16 0.0088 -1.17 0.0084
Ethnicity: White 0.57 0.2429 0.57 0.2457 0.61 0.2082 0.54 0.2676 0.57 0.2437 0.57 0.2406 0.90 0.1445
Ethnicity: Hispanic -0.46 0.3222 -0.47 0.3183 -0.46 0.3232 -0.49 0.2942 -0.48 0.3051 0.12 0.8413 -0.46 0.3214
English Language Learner Status 0.68 0.0548 0.64 0.1958 0.74 0.0360 0.66 0.0596 0.61 0.0835 0.63 0.0761 0.67 0.0562
Gender (Male) -0.66 0.0362 -0.51 0.0060 -0.53 0.0044 -0.50 0.0070 -0.50 0.0063 -0.51 0.0058 -0.51 0.0061
Parent Education 0.48 0.0000 0.48 0.0000 0.48 0.0000 0.48 0.0000 0.48 0.0000 0.48 0.0000 0.48 0.0000
PeabodyResearchInstitute,VanderbiltUniversity
45
TableA14:SummaryofModeratorAnalysesforREMAOutcome:Time3(Series1)
Moderator Male ELL Pretest Age_T3 Black Hispanic White
Effect b p b p b p b p b p b p b p
Intercept 54.49 0.0000 54.41 0.0000 54.75 0.0000 54.49 0.0000 54.57 0.0000 54.46 0.0000 54.50 0.0000
Condition 0.81 0.0177 0.78 0.0085 0.75 0.0080 0.76 0.0068 0.39 0.3246 0.77 0.0108 0.73 0.0143
Condition*Moderator -0.16 0.7144 -0.30 0.6488 -0.04 0.2875 -0.08 0.1517 0.56 0.2394 -0.16 0.7986 0.06 0.9264
Site 2: MA 1.84 0.0000 1.86 0.0000 1.82 0.0000 1.88 0.0000 1.88 0.0000 1.85 0.0000 1.84 0.0000
Site 1: NY 0.11 0.7059 0.10 0.7279 0.10 0.7321 0.12 0.6708 0.12 0.6875 0.11 0.7141 0.11 0.7192
Site 3: TN 0 0 0 0 0 0 0
REMA pretest grand-mean centered 0.39 0.0000 0.39 0.0000 0.41 0.0000 0.39 0.0000 0.39 0.0000 0.39 0.0000 0.39 0.0000
Age at Time 3 0.11 0.0001 0.11 0.0001 0.11 0.0001 0.15 0.0002 0.11 0.0001 0.11 0.0001 0.11 0.0001
Age interval between Time 3 and Time 1 0.04 0.8630 0.03 0.8791 0.05 0.8206 0.04 0.8565 0.03 0.8907 0.04 0.8727 0.04 0.8677
Test Lag from School Start to Pretest -0.32 0.2360 -0.31 0.2418 -0.31 0.2401 -0.28 0.3026 -0.33 0.2108 -0.31 0.2411 -0.31 0.2467
Ethnicity: Black -2.69 0.0000 -2.68 0.0000 -2.67 0.0000 -2.68 0.0000 -2.96 0.0000 -2.69 0.0000 -2.69 0.0000
Ethnicity: White -0.45 0.4412 -0.44 0.4530 -0.41 0.4786 -0.46 0.4280 -0.41 0.4785 -0.44 0.4449 -0.47 0.4797
Ethnicity: Hispanic -1.75 0.0022 -1.75 0.0023 -1.73 0.0024 -1.75 0.0021 -1.75 0.0021 -1.68 0.0080 -1.75 0.0022
English Language Learner Status 0.75 0.0716 0.88 0.0763 0.79 0.0611 0.77 0.0669 0.73 0.0808 0.75 0.0741 0.75 0.0719
Gender (Male) -0.14 0.6433 -0.23 0.2937 -0.23 0.2797 -0.22 0.3169 -0.23 0.2814 -0.23 0.2956 -0.23 0.2959
Parent Education 0.46 0.0003 0.46 0.0003 0.45 0.0004 0.45 0.0003 0.44 0.0004 0.45 0.0003 0.46 0.0003
PeabodyResearchInstitute,VanderbiltUniversity
46
TableA15:SummaryofModeratorAnalysesforREMAOutcome:Time4(Series1)
Moderator Male ELL Pretest Age_T4 Black Hispanic White
Effect b p b p b p b p b p b p b p
Intercept 64.49 0.0000 64.34 0.0000 64.45 0.0000 64.46 0.0000 64.21 0.0000 64.38 0.0000 64.50 0.0000
Condition 0.62 0.1066 0.56 0.0934 0.51 0.1051 0.51 0.1066 0.07 0.8727 0.58 0.0806 0.50 0.1289
Condition*Moderator -0.23 0.6231 -0.32 0.6605 0.00 0.9376 0.01 0.8597 0.69 0.1915 -0.43 0.5273 0.03 0.9622
Site 2: MA 3.05 0.0000 3.07 0.0000 3.06 0.0000 3.05 0.0000 3.07 0.0000 3.07 0.0000 3.05 0.0000
Site 1: NY 1.57 0.0001 1.56 0.0001 1.57 0.0001 1.57 0.0001 1.57 0.0001 1.57 0.0001 1.57 0.0001
Site 3: TN 0 0 0 0 0 0 0 REMA pretest grand-mean centered 0.40 0.0000 0.40 0.0000 0.40 0.0000 0.40 0.0000 0.40 0.0000 0.40 0.0000 0.40 0.0000
Age at Time 4 0.04 0.1787 0.04 0.1835 0.04 0.1844 0.04 0.4077 0.04 0.1918 0.04 0.1820 0.04 0.1846 Age interval between Time 4 and Time 1 0.16 0.4056 0.16 0.4212 0.16 0.4138 0.16 0.4133 0.14 0.4606 0.16 0.4173 0.16 0.4096 Test Lag from School Start to Pretest -0.11 0.7003 -0.10 0.7207 -0.10 0.7225 -0.10 0.7142 -0.12 0.6592 -0.11 0.7084 -0.10 0.7253
Ethnicity: Black -2.84 0.0000 -2.83 0.0000 -2.84 0.0000 -2.84 0.0000 -3.17 0.0000 -2.84 0.0000 -2.84 0.0000
Ethnicity: White -0.48 0.4576 -0.47 0.4696 -0.47 0.4625 -0.47 0.4660 -0.44 0.4938 -0.48 0.4593 -0.49 0.5067
Ethnicity: Hispanic -1.53 0.0158 -1.53 0.0160 -1.54 0.0155 -1.54 0.0156 -1.54 0.0154 -1.34 0.0570 -1.54 0.0154 English Language Learner Status 0.57 0.2249 0.70 0.2035 0.57 0.2219 0.57 0.2204 0.55 0.2370 0.56 0.2277 0.57 0.2205
Gender (Male) 0.33 0.3380 0.21 0.3861 0.21 0.3823 0.21 0.3862 0.20 0.4034 0.21 0.3787 0.21 0.3820
Parent Education 0.51 0.0002 0.51 0.0002 0.51 0.0002 0.51 0.0002 0.50 0.0002 0.51 0.0002 0.51 0.0002
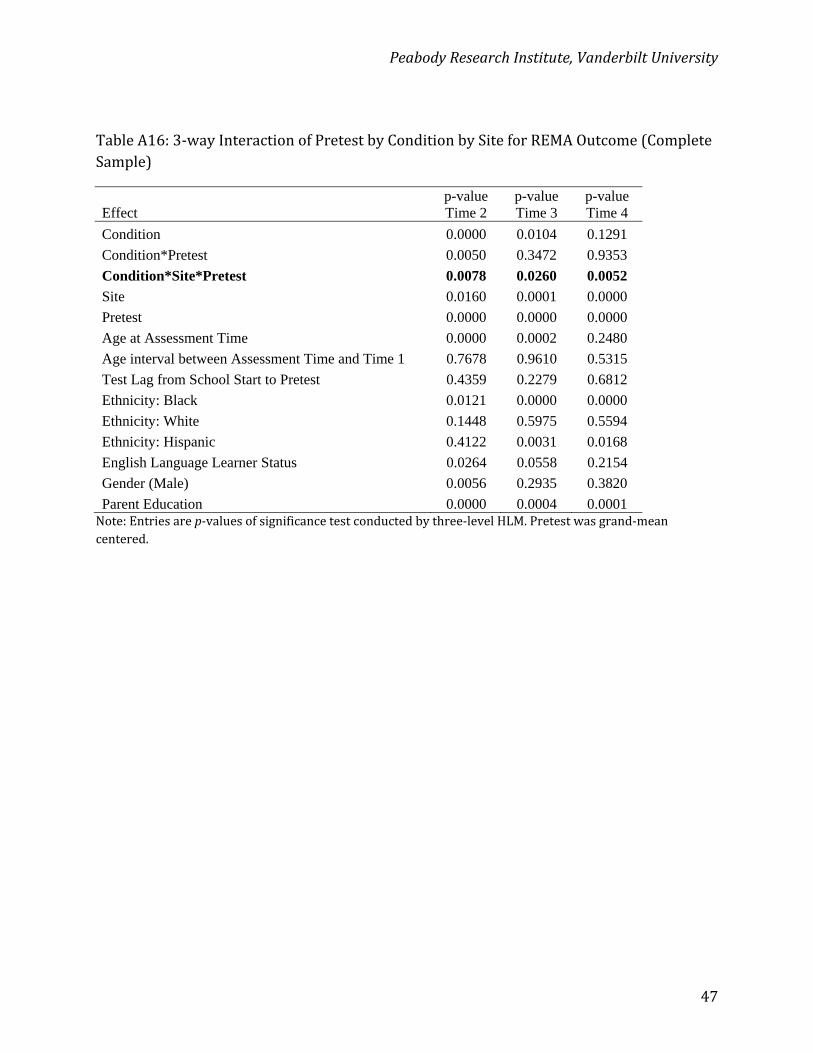
PeabodyResearchInstitute,VanderbiltUniversity
47
TableA16:3‐wayInteractionofPretestbyConditionbySiteforREMAOutcome(CompleteSample)
Effect p-value Time 2
p-value Time 3
p-value Time 4
Condition 0.0000 0.0104 0.1291
Condition*Pretest 0.0050 0.3472 0.9353
Condition*Site*Pretest 0.0078 0.0260 0.0052
Site 0.0160 0.0001 0.0000
Pretest 0.0000 0.0000 0.0000
Age at Assessment Time 0.0000 0.0002 0.2480
Age interval between Assessment Time and Time 1 0.7678 0.9610 0.5315
Test Lag from School Start to Pretest 0.4359 0.2279 0.6812
Ethnicity: Black 0.0121 0.0000 0.0000
Ethnicity: White 0.1448 0.5975 0.5594
Ethnicity: Hispanic 0.4122 0.0031 0.0168
English Language Learner Status 0.0264 0.0558 0.2154
Gender (Male) 0.0056 0.2935 0.3820
Parent Education 0.0000 0.0004 0.0001 Note:Entriesarep‐valuesofsignificancetestconductedbythree‐levelHLM.Pretestwasgrand‐meancentered.
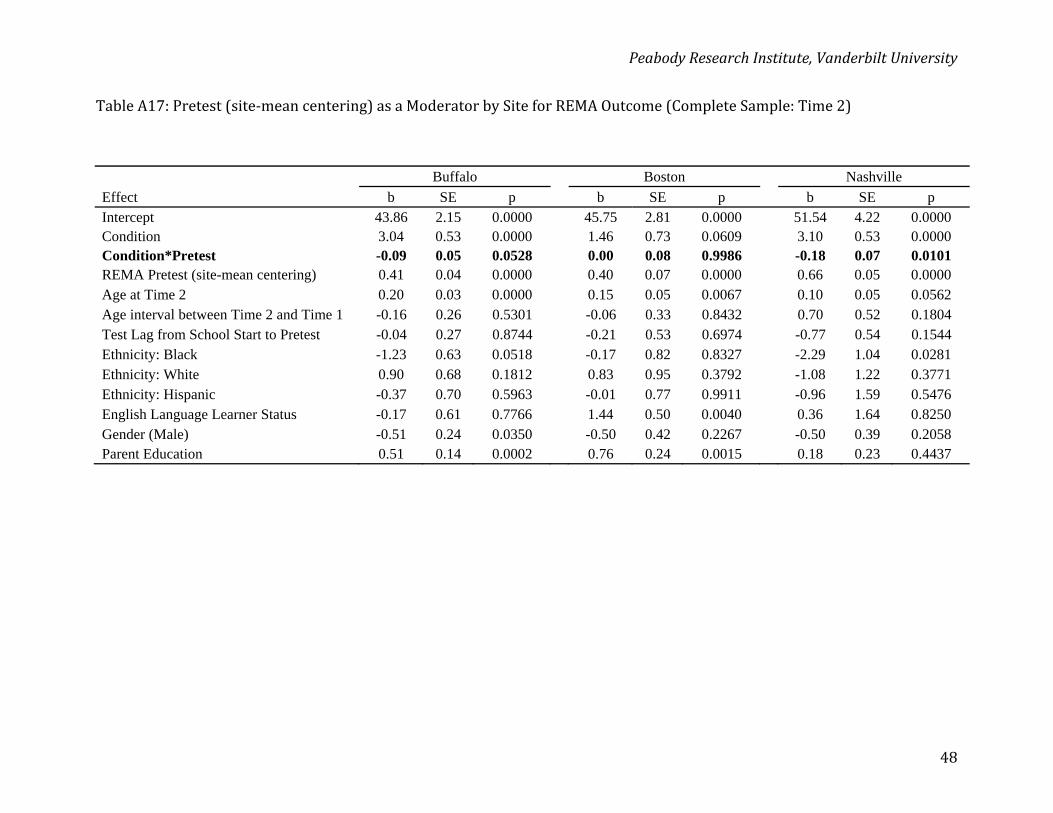
PeabodyResearchInstitute,VanderbiltUniversity
48
TableA17:Pretest(site‐meancentering)asaModeratorbySiteforREMAOutcome(CompleteSample:Time2)
Buffalo Boston Nashville
Effect b SE p b SE p b SE p Intercept 43.86 2.15 0.0000 45.75 2.81 0.0000 51.54 4.22 0.0000 Condition 3.04 0.53 0.0000 1.46 0.73 0.0609 3.10 0.53 0.0000 Condition*Pretest -0.09 0.05 0.0528 0.00 0.08 0.9986 -0.18 0.07 0.0101 REMA Pretest (site-mean centering) 0.41 0.04 0.0000 0.40 0.07 0.0000 0.66 0.05 0.0000 Age at Time 2 0.20 0.03 0.0000 0.15 0.05 0.0067 0.10 0.05 0.0562 Age interval between Time 2 and Time 1 -0.16 0.26 0.5301 -0.06 0.33 0.8432 0.70 0.52 0.1804 Test Lag from School Start to Pretest -0.04 0.27 0.8744 -0.21 0.53 0.6974 -0.77 0.54 0.1544 Ethnicity: Black -1.23 0.63 0.0518 -0.17 0.82 0.8327 -2.29 1.04 0.0281 Ethnicity: White 0.90 0.68 0.1812 0.83 0.95 0.3792 -1.08 1.22 0.3771 Ethnicity: Hispanic -0.37 0.70 0.5963 -0.01 0.77 0.9911 -0.96 1.59 0.5476 English Language Learner Status -0.17 0.61 0.7766 1.44 0.50 0.0040 0.36 1.64 0.8250 Gender (Male) -0.51 0.24 0.0350 -0.50 0.42 0.2267 -0.50 0.39 0.2058 Parent Education 0.51 0.14 0.0002 0.76 0.24 0.0015 0.18 0.23 0.4437
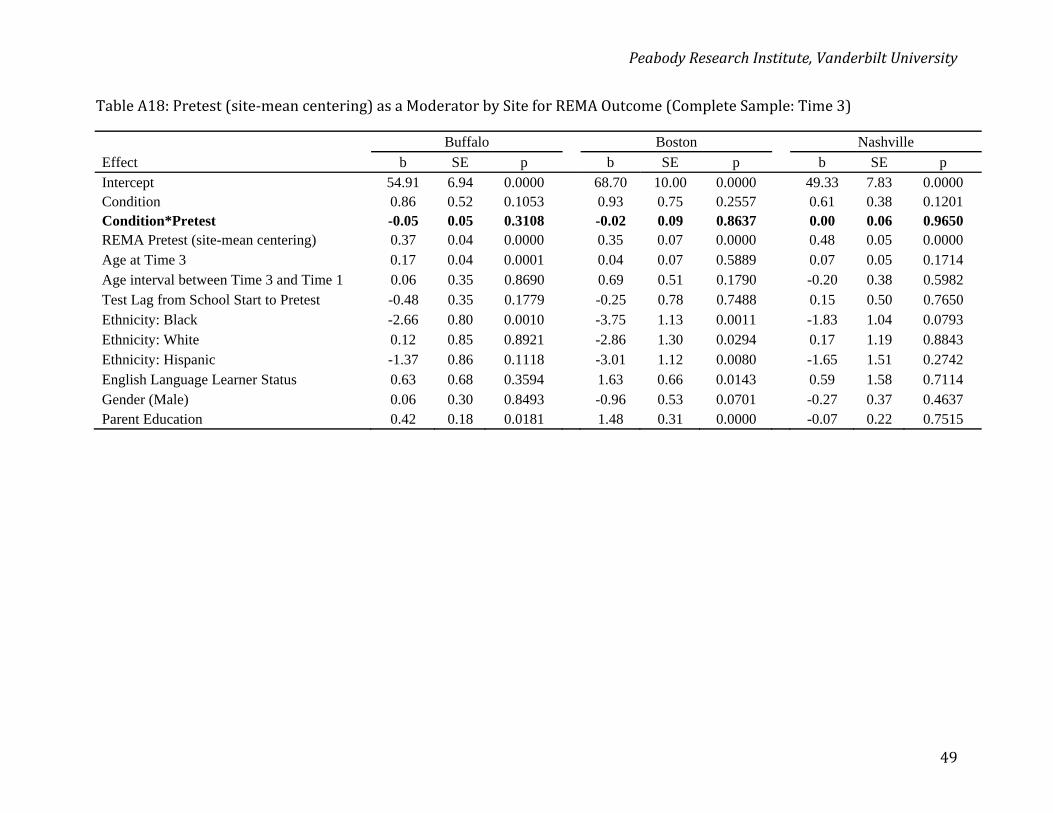
PeabodyResearchInstitute,VanderbiltUniversity
49
TableA18:Pretest(site‐meancentering)asaModeratorbySiteforREMAOutcome(CompleteSample:Time3)
Buffalo Boston Nashville
Effect b SE p b SE p b SE p Intercept 54.91 6.94 0.0000 68.70 10.00 0.0000 49.33 7.83 0.0000 Condition 0.86 0.52 0.1053 0.93 0.75 0.2557 0.61 0.38 0.1201 Condition*Pretest -0.05 0.05 0.3108 -0.02 0.09 0.8637 0.00 0.06 0.9650 REMA Pretest (site-mean centering) 0.37 0.04 0.0000 0.35 0.07 0.0000 0.48 0.05 0.0000 Age at Time 3 0.17 0.04 0.0001 0.04 0.07 0.5889 0.07 0.05 0.1714 Age interval between Time 3 and Time 1 0.06 0.35 0.8690 0.69 0.51 0.1790 -0.20 0.38 0.5982 Test Lag from School Start to Pretest -0.48 0.35 0.1779 -0.25 0.78 0.7488 0.15 0.50 0.7650 Ethnicity: Black -2.66 0.80 0.0010 -3.75 1.13 0.0011 -1.83 1.04 0.0793 Ethnicity: White 0.12 0.85 0.8921 -2.86 1.30 0.0294 0.17 1.19 0.8843 Ethnicity: Hispanic -1.37 0.86 0.1118 -3.01 1.12 0.0080 -1.65 1.51 0.2742 English Language Learner Status 0.63 0.68 0.3594 1.63 0.66 0.0143 0.59 1.58 0.7114 Gender (Male) 0.06 0.30 0.8493 -0.96 0.53 0.0701 -0.27 0.37 0.4637 Parent Education 0.42 0.18 0.0181 1.48 0.31 0.0000 -0.07 0.22 0.7515
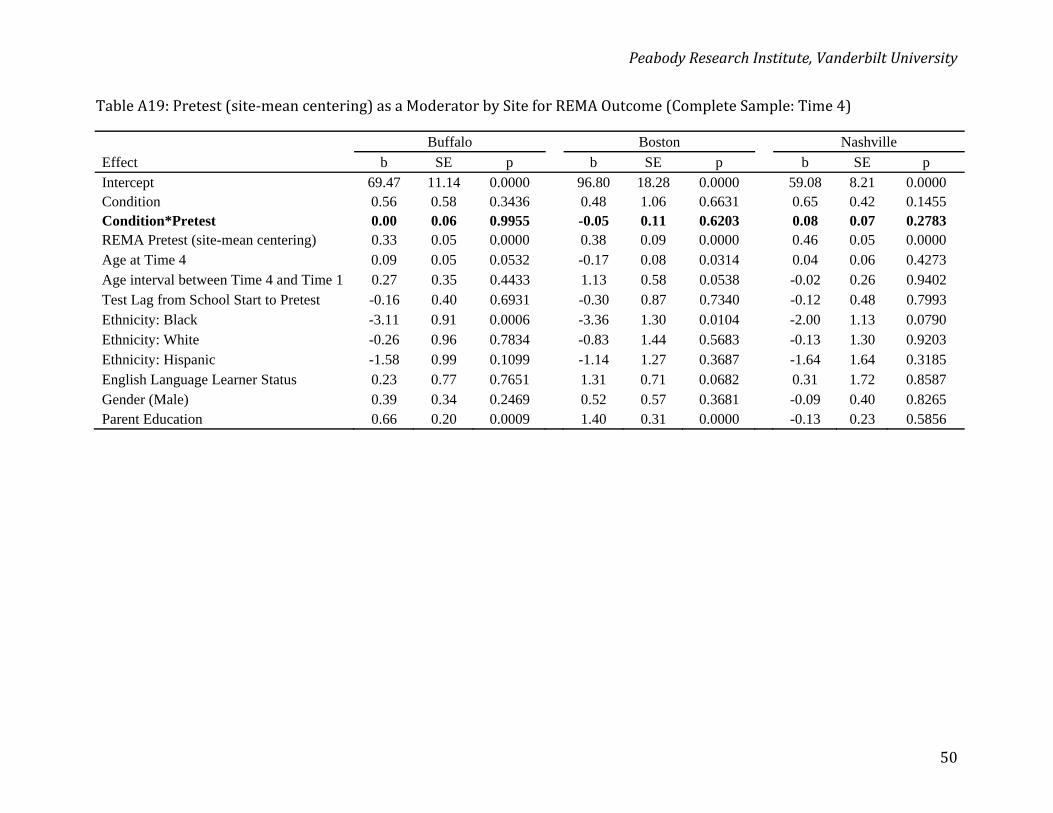
PeabodyResearchInstitute,VanderbiltUniversity
50
TableA19:Pretest(site‐meancentering)asaModeratorbySiteforREMAOutcome(CompleteSample:Time4)
Buffalo Boston Nashville
Effect b SE p b SE p b SE p Intercept 69.47 11.14 0.0000 96.80 18.28 0.0000 59.08 8.21 0.0000 Condition 0.56 0.58 0.3436 0.48 1.06 0.6631 0.65 0.42 0.1455 Condition*Pretest 0.00 0.06 0.9955 -0.05 0.11 0.6203 0.08 0.07 0.2783 REMA Pretest (site-mean centering) 0.33 0.05 0.0000 0.38 0.09 0.0000 0.46 0.05 0.0000 Age at Time 4 0.09 0.05 0.0532 -0.17 0.08 0.0314 0.04 0.06 0.4273 Age interval between Time 4 and Time 1 0.27 0.35 0.4433 1.13 0.58 0.0538 -0.02 0.26 0.9402 Test Lag from School Start to Pretest -0.16 0.40 0.6931 -0.30 0.87 0.7340 -0.12 0.48 0.7993 Ethnicity: Black -3.11 0.91 0.0006 -3.36 1.30 0.0104 -2.00 1.13 0.0790 Ethnicity: White -0.26 0.96 0.7834 -0.83 1.44 0.5683 -0.13 1.30 0.9203 Ethnicity: Hispanic -1.58 0.99 0.1099 -1.14 1.27 0.3687 -1.64 1.64 0.3185 English Language Learner Status 0.23 0.77 0.7651 1.31 0.71 0.0682 0.31 1.72 0.8587 Gender (Male) 0.39 0.34 0.2469 0.52 0.57 0.3681 -0.09 0.40 0.8265 Parent Education 0.66 0.20 0.0009 1.40 0.31 0.0000 -0.13 0.23 0.5856
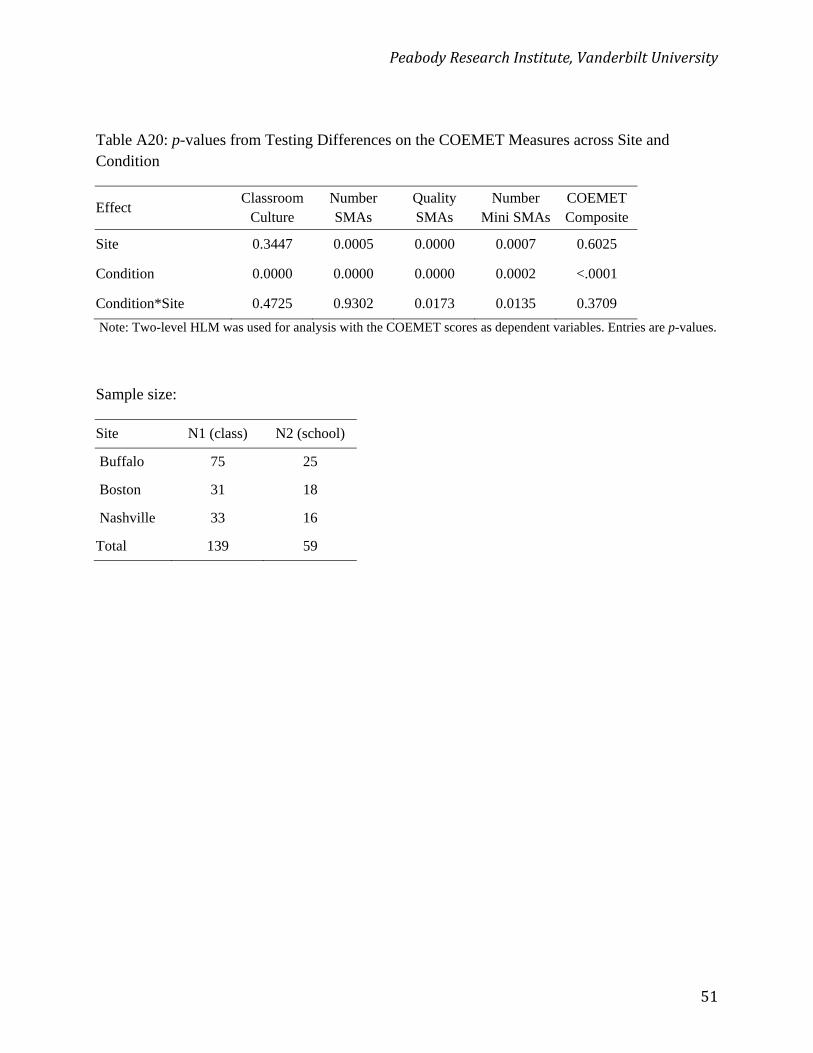
PeabodyResearchInstitute,VanderbiltUniversity
51
Table A20: p-values from Testing Differences on the COEMET Measures across Site and Condition
Effect Classroom
Culture Number SMAs
Quality SMAs
Number Mini SMAs
COEMET Composite
Site 0.3447 0.0005 0.0000 0.0007 0.6025
Condition 0.0000 0.0000 0.0000 0.0002 <.0001
Condition*Site 0.4725 0.9302 0.0173 0.0135 0.3709
Note: Two-level HLM was used for analysis with the COEMET scores as dependent variables. Entries are p-values.
Sample size:
Site N1 (class) N2 (school)
Buffalo 75 25
Boston 31 18
Nashville 33 16
Total 139 59
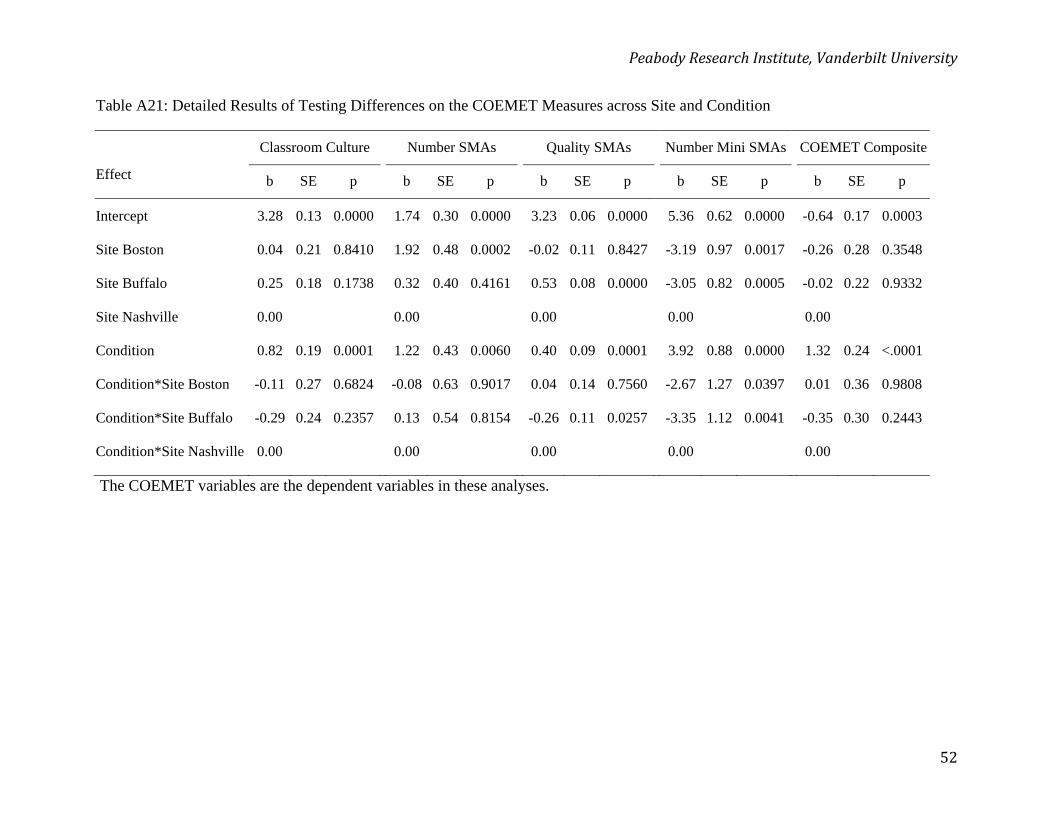
PeabodyResearchInstitute,VanderbiltUniversity
52
Table A21: Detailed Results of Testing Differences on the COEMET Measures across Site and Condition
Classroom Culture Number SMAs Quality SMAs Number Mini SMAs COEMET Composite
Effect b SE p b SE p b SE p b SE p b SE p
Intercept 3.28 0.13 0.0000 1.74 0.30 0.0000 3.23 0.06 0.0000 5.36 0.62 0.0000 -0.64 0.17 0.0003
Site Boston 0.04 0.21 0.8410 1.92 0.48 0.0002 -0.02 0.11 0.8427 -3.19 0.97 0.0017 -0.26 0.28 0.3548
Site Buffalo 0.25 0.18 0.1738 0.32 0.40 0.4161 0.53 0.08 0.0000 -3.05 0.82 0.0005 -0.02 0.22 0.9332
Site Nashville 0.00
0.00 0.00
0.00 0.00
Condition 0.82 0.19 0.0001 1.22 0.43 0.0060 0.40 0.09 0.0001 3.92 0.88 0.0000 1.32 0.24 <.0001
Condition*Site Boston -0.11 0.27 0.6824 -0.08 0.63 0.9017 0.04 0.14 0.7560 -2.67 1.27 0.0397 0.01 0.36 0.9808
Condition*Site Buffalo -0.29 0.24 0.2357 0.13 0.54 0.8154 -0.26 0.11 0.0257 -3.35 1.12 0.0041 -0.35 0.30 0.2443
Condition*Site Nashville 0.00
0.00 0.00
0.00 0.00
The COEMET variables are the dependent variables in these analyses.
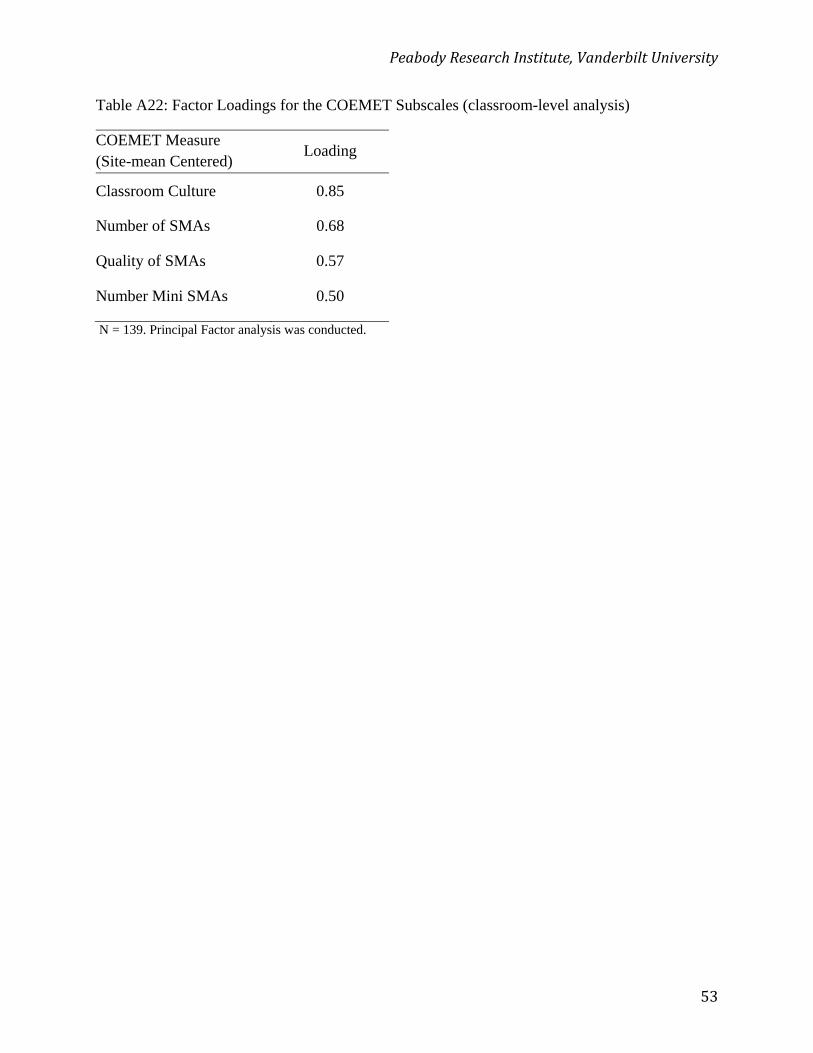
PeabodyResearchInstitute,VanderbiltUniversity
53
Table A22: Factor Loadings for the COEMET Subscales (classroom-level analysis)
COEMET Measure (Site-mean Centered)
Loading
Classroom Culture 0.85
Number of SMAs 0.68
Quality of SMAs 0.57
Number Mini SMAs 0.50
N = 139. Principal Factor analysis was conducted.
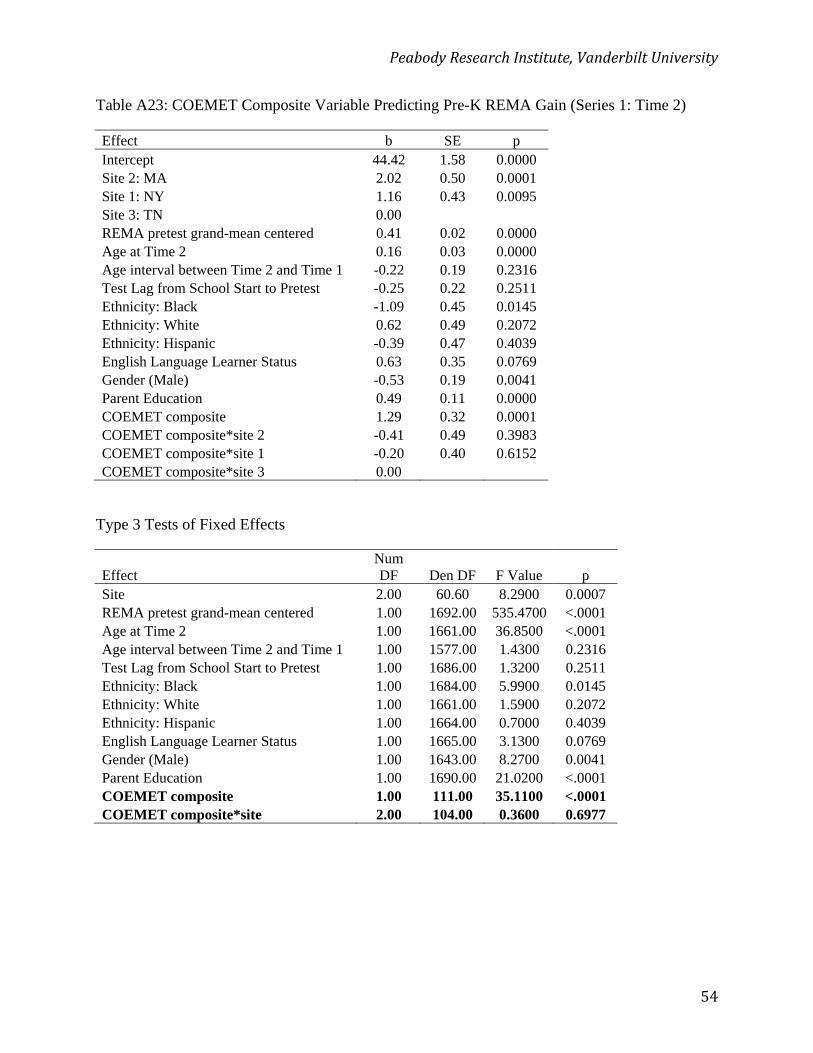
PeabodyResearchInstitute,VanderbiltUniversity
54
Table A23: COEMET Composite Variable Predicting Pre-K REMA Gain (Series 1: Time 2)
Effect b SE p Intercept 44.42 1.58 0.0000 Site 2: MA 2.02 0.50 0.0001 Site 1: NY 1.16 0.43 0.0095 Site 3: TN 0.00 REMA pretest grand-mean centered 0.41 0.02 0.0000 Age at Time 2 0.16 0.03 0.0000 Age interval between Time 2 and Time 1 -0.22 0.19 0.2316 Test Lag from School Start to Pretest -0.25 0.22 0.2511 Ethnicity: Black -1.09 0.45 0.0145 Ethnicity: White 0.62 0.49 0.2072 Ethnicity: Hispanic -0.39 0.47 0.4039 English Language Learner Status 0.63 0.35 0.0769 Gender (Male) -0.53 0.19 0.0041 Parent Education 0.49 0.11 0.0000 COEMET composite 1.29 0.32 0.0001 COEMET composite*site 2 -0.41 0.49 0.3983 COEMET composite*site 1 -0.20 0.40 0.6152 COEMET composite*site 3 0.00
Type 3 Tests of Fixed Effects
Effect Num DF Den DF F Value p
Site 2.00 60.60 8.2900 0.0007 REMA pretest grand-mean centered 1.00 1692.00 535.4700 <.0001 Age at Time 2 1.00 1661.00 36.8500 <.0001 Age interval between Time 2 and Time 1 1.00 1577.00 1.4300 0.2316 Test Lag from School Start to Pretest 1.00 1686.00 1.3200 0.2511 Ethnicity: Black 1.00 1684.00 5.9900 0.0145 Ethnicity: White 1.00 1661.00 1.5900 0.2072 Ethnicity: Hispanic 1.00 1664.00 0.7000 0.4039 English Language Learner Status 1.00 1665.00 3.1300 0.0769 Gender (Male) 1.00 1643.00 8.2700 0.0041 Parent Education 1.00 1690.00 21.0200 <.0001 COEMET composite 1.00 111.00 35.1100 <.0001 COEMET composite*site 2.00 104.00 0.3600 0.6977
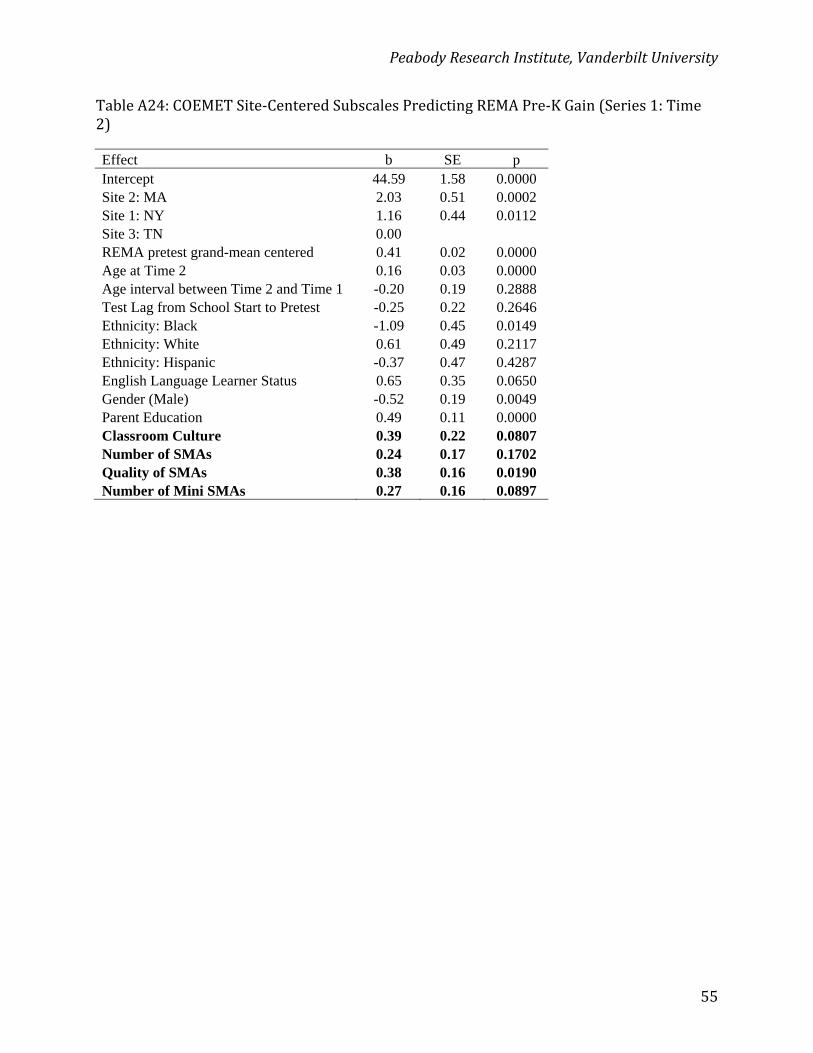
PeabodyResearchInstitute,VanderbiltUniversity
55
TableA24:COEMETSite‐CenteredSubscalesPredictingREMAPre‐KGain(Series1:Time2)
Effect b SE p Intercept 44.59 1.58 0.0000 Site 2: MA 2.03 0.51 0.0002 Site 1: NY 1.16 0.44 0.0112 Site 3: TN 0.00 REMA pretest grand-mean centered 0.41 0.02 0.0000 Age at Time 2 0.16 0.03 0.0000 Age interval between Time 2 and Time 1 -0.20 0.19 0.2888 Test Lag from School Start to Pretest -0.25 0.22 0.2646 Ethnicity: Black -1.09 0.45 0.0149 Ethnicity: White 0.61 0.49 0.2117 Ethnicity: Hispanic -0.37 0.47 0.4287 English Language Learner Status 0.65 0.35 0.0650 Gender (Male) -0.52 0.19 0.0049 Parent Education 0.49 0.11 0.0000 Classroom Culture 0.39 0.22 0.0807 Number of SMAs 0.24 0.17 0.1702 Quality of SMAs 0.38 0.16 0.0190 Number of Mini SMAs 0.27 0.16 0.0897
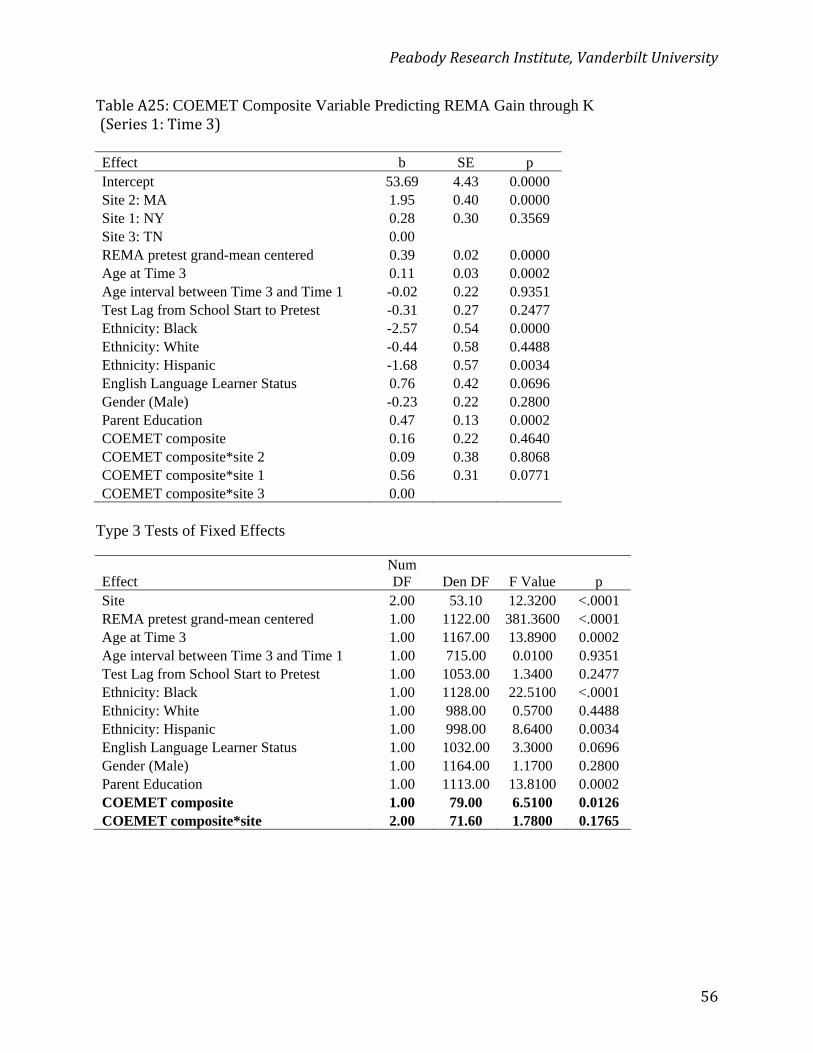
PeabodyResearchInstitute,VanderbiltUniversity
56
TableA25:COEMET Composite Variable Predicting REMA Gain through K (Series1:Time3)Effect b SE p Intercept 53.69 4.43 0.0000 Site 2: MA 1.95 0.40 0.0000 Site 1: NY 0.28 0.30 0.3569 Site 3: TN 0.00 REMA pretest grand-mean centered 0.39 0.02 0.0000 Age at Time 3 0.11 0.03 0.0002 Age interval between Time 3 and Time 1 -0.02 0.22 0.9351 Test Lag from School Start to Pretest -0.31 0.27 0.2477 Ethnicity: Black -2.57 0.54 0.0000 Ethnicity: White -0.44 0.58 0.4488 Ethnicity: Hispanic -1.68 0.57 0.0034 English Language Learner Status 0.76 0.42 0.0696 Gender (Male) -0.23 0.22 0.2800 Parent Education 0.47 0.13 0.0002 COEMET composite 0.16 0.22 0.4640 COEMET composite*site 2 0.09 0.38 0.8068 COEMET composite*site 1 0.56 0.31 0.0771 COEMET composite*site 3 0.00 Type 3 Tests of Fixed Effects
Effect Num DF Den DF F Value p
Site 2.00 53.10 12.3200 <.0001 REMA pretest grand-mean centered 1.00 1122.00 381.3600 <.0001 Age at Time 3 1.00 1167.00 13.8900 0.0002 Age interval between Time 3 and Time 1 1.00 715.00 0.0100 0.9351 Test Lag from School Start to Pretest 1.00 1053.00 1.3400 0.2477 Ethnicity: Black 1.00 1128.00 22.5100 <.0001 Ethnicity: White 1.00 988.00 0.5700 0.4488 Ethnicity: Hispanic 1.00 998.00 8.6400 0.0034 English Language Learner Status 1.00 1032.00 3.3000 0.0696 Gender (Male) 1.00 1164.00 1.1700 0.2800 Parent Education 1.00 1113.00 13.8100 0.0002 COEMET composite 1.00 79.00 6.5100 0.0126 COEMET composite*site 2.00 71.60 1.7800 0.1765
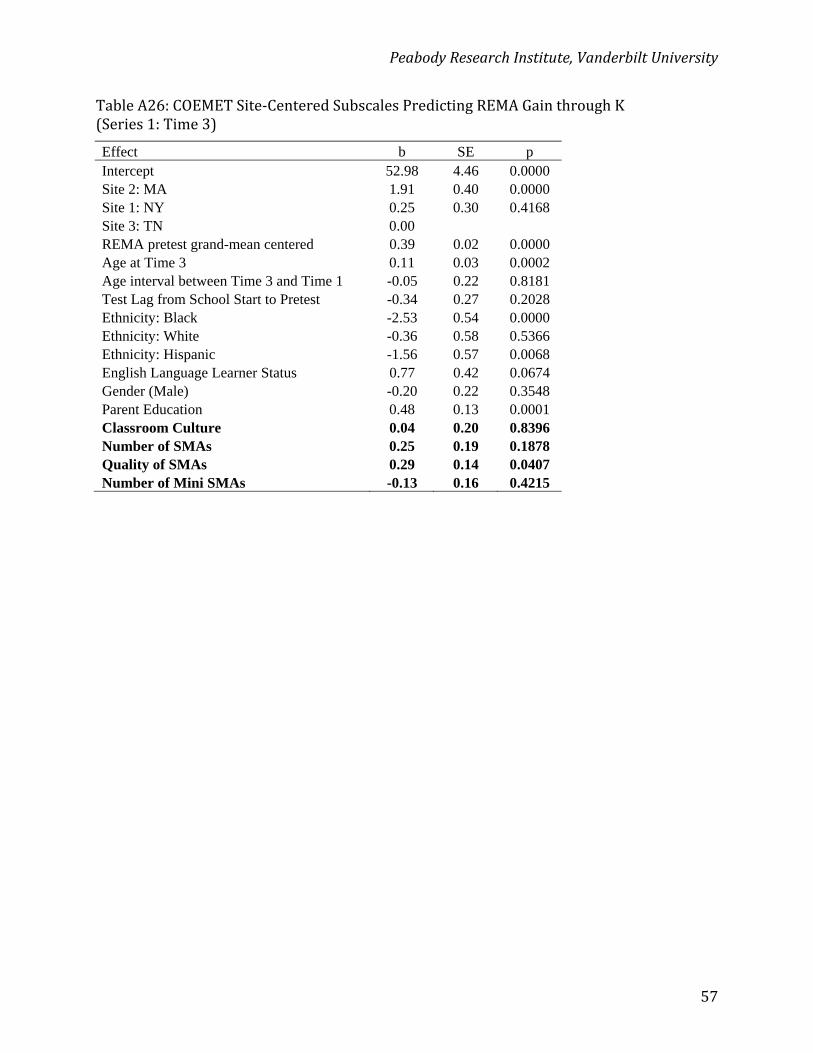
PeabodyResearchInstitute,VanderbiltUniversity
57
TableA26:COEMETSite‐CenteredSubscalesPredictingREMAGainthroughK(Series1:Time3)
Effect b SE p Intercept 52.98 4.46 0.0000 Site 2: MA 1.91 0.40 0.0000 Site 1: NY 0.25 0.30 0.4168 Site 3: TN 0.00 REMA pretest grand-mean centered 0.39 0.02 0.0000 Age at Time 3 0.11 0.03 0.0002 Age interval between Time 3 and Time 1 -0.05 0.22 0.8181 Test Lag from School Start to Pretest -0.34 0.27 0.2028 Ethnicity: Black -2.53 0.54 0.0000 Ethnicity: White -0.36 0.58 0.5366 Ethnicity: Hispanic -1.56 0.57 0.0068 English Language Learner Status 0.77 0.42 0.0674 Gender (Male) -0.20 0.22 0.3548 Parent Education 0.48 0.13 0.0001 Classroom Culture 0.04 0.20 0.8396 Number of SMAs 0.25 0.19 0.1878 Quality of SMAs 0.29 0.14 0.0407 Number of Mini SMAs -0.13 0.16 0.4215
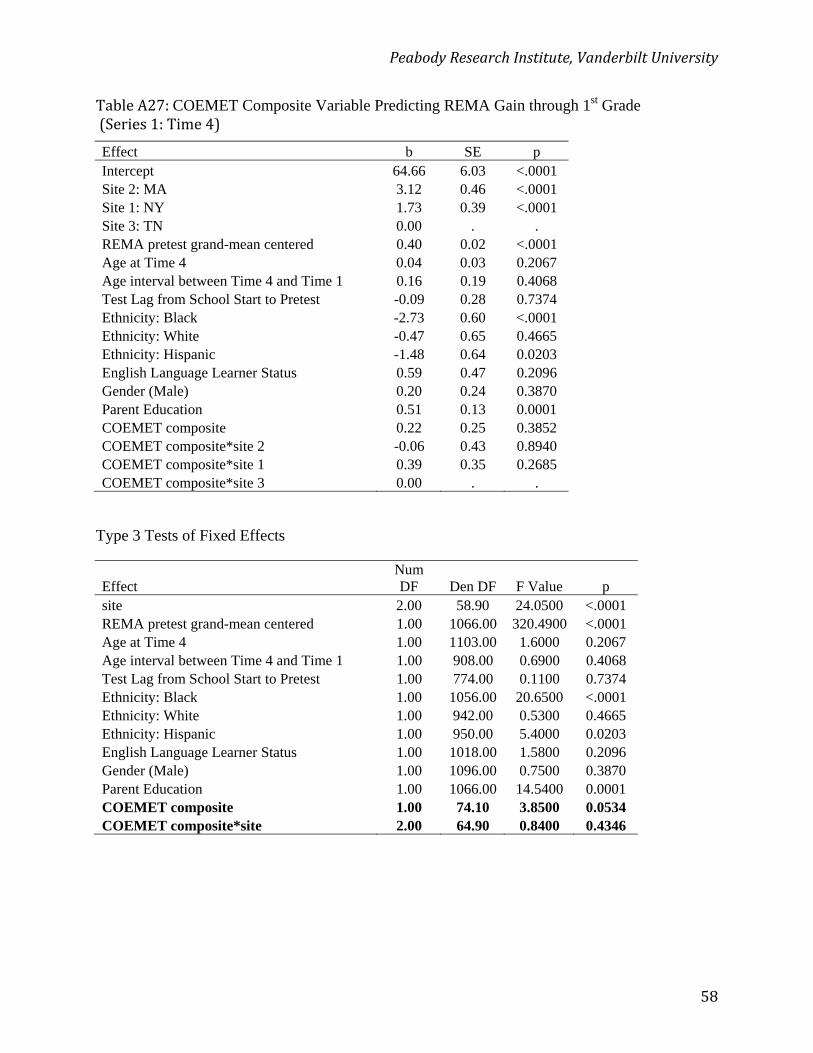
PeabodyResearchInstitute,VanderbiltUniversity
58
TableA27:COEMET Composite Variable Predicting REMA Gain through 1st Grade (Series1:Time4)
Effect b SE p Intercept 64.66 6.03 <.0001 Site 2: MA 3.12 0.46 <.0001 Site 1: NY 1.73 0.39 <.0001 Site 3: TN 0.00 . . REMA pretest grand-mean centered 0.40 0.02 <.0001 Age at Time 4 0.04 0.03 0.2067 Age interval between Time 4 and Time 1 0.16 0.19 0.4068 Test Lag from School Start to Pretest -0.09 0.28 0.7374 Ethnicity: Black -2.73 0.60 <.0001 Ethnicity: White -0.47 0.65 0.4665 Ethnicity: Hispanic -1.48 0.64 0.0203 English Language Learner Status 0.59 0.47 0.2096 Gender (Male) 0.20 0.24 0.3870 Parent Education 0.51 0.13 0.0001 COEMET composite 0.22 0.25 0.3852 COEMET composite*site 2 -0.06 0.43 0.8940 COEMET composite*site 1 0.39 0.35 0.2685 COEMET composite*site 3 0.00 . .
Type 3 Tests of Fixed Effects
Effect Num DF Den DF F Value p
site 2.00 58.90 24.0500 <.0001 REMA pretest grand-mean centered 1.00 1066.00 320.4900 <.0001 Age at Time 4 1.00 1103.00 1.6000 0.2067 Age interval between Time 4 and Time 1 1.00 908.00 0.6900 0.4068 Test Lag from School Start to Pretest 1.00 774.00 0.1100 0.7374 Ethnicity: Black 1.00 1056.00 20.6500 <.0001 Ethnicity: White 1.00 942.00 0.5300 0.4665 Ethnicity: Hispanic 1.00 950.00 5.4000 0.0203 English Language Learner Status 1.00 1018.00 1.5800 0.2096 Gender (Male) 1.00 1096.00 0.7500 0.3870 Parent Education 1.00 1066.00 14.5400 0.0001 COEMET composite 1.00 74.10 3.8500 0.0534 COEMET composite*site 2.00 64.90 0.8400 0.4346
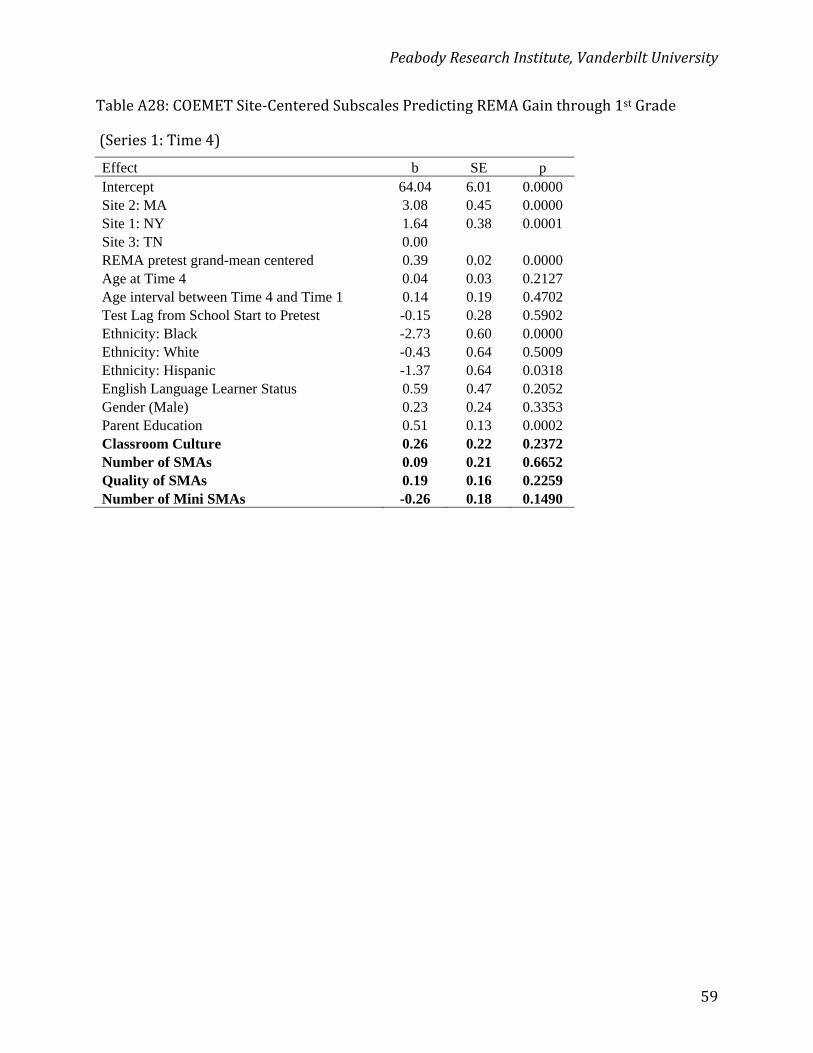
PeabodyResearchInstitute,VanderbiltUniversity
59
TableA28:COEMETSite‐CenteredSubscalesPredictingREMAGainthrough1stGrade
(Series1:Time4)
Effect b SE p Intercept 64.04 6.01 0.0000 Site 2: MA 3.08 0.45 0.0000 Site 1: NY 1.64 0.38 0.0001 Site 3: TN 0.00 REMA pretest grand-mean centered 0.39 0.02 0.0000 Age at Time 4 0.04 0.03 0.2127 Age interval between Time 4 and Time 1 0.14 0.19 0.4702 Test Lag from School Start to Pretest -0.15 0.28 0.5902 Ethnicity: Black -2.73 0.60 0.0000 Ethnicity: White -0.43 0.64 0.5009 Ethnicity: Hispanic -1.37 0.64 0.0318 English Language Learner Status 0.59 0.47 0.2052 Gender (Male) 0.23 0.24 0.3353 Parent Education 0.51 0.13 0.0002 Classroom Culture 0.26 0.22 0.2372 Number of SMAs 0.09 0.21 0.6652 Quality of SMAs 0.19 0.16 0.2259 Number of Mini SMAs -0.26 0.18 0.1490
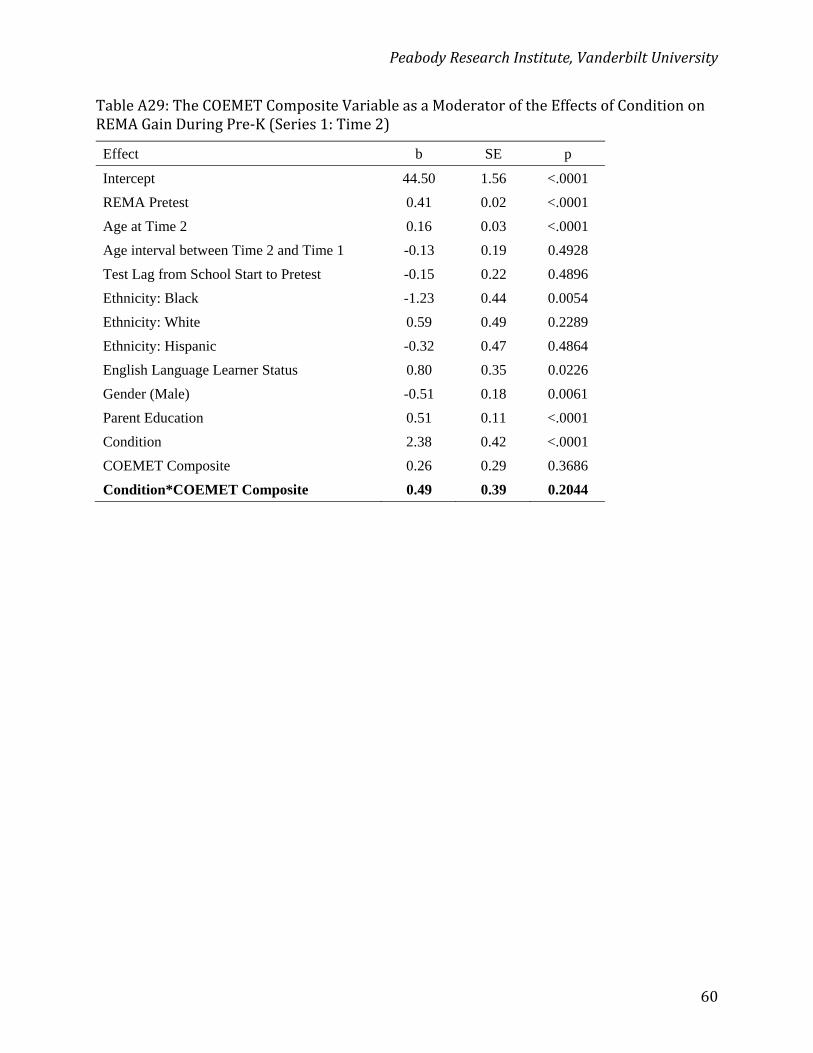
PeabodyResearchInstitute,VanderbiltUniversity
60
TableA29:TheCOEMETCompositeVariableasaModeratoroftheEffectsofConditiononREMAGainDuringPre‐K(Series1:Time2)
Effect b SE p
Intercept 44.50 1.56 <.0001
REMA Pretest 0.41 0.02 <.0001
Age at Time 2 0.16 0.03 <.0001
Age interval between Time 2 and Time 1 -0.13 0.19 0.4928
Test Lag from School Start to Pretest -0.15 0.22 0.4896
Ethnicity: Black -1.23 0.44 0.0054
Ethnicity: White 0.59 0.49 0.2289
Ethnicity: Hispanic -0.32 0.47 0.4864
English Language Learner Status 0.80 0.35 0.0226
Gender (Male) -0.51 0.18 0.0061
Parent Education 0.51 0.11 <.0001
Condition 2.38 0.42 <.0001
COEMET Composite 0.26 0.29 0.3686
Condition*COEMET Composite 0.49 0.39 0.2044
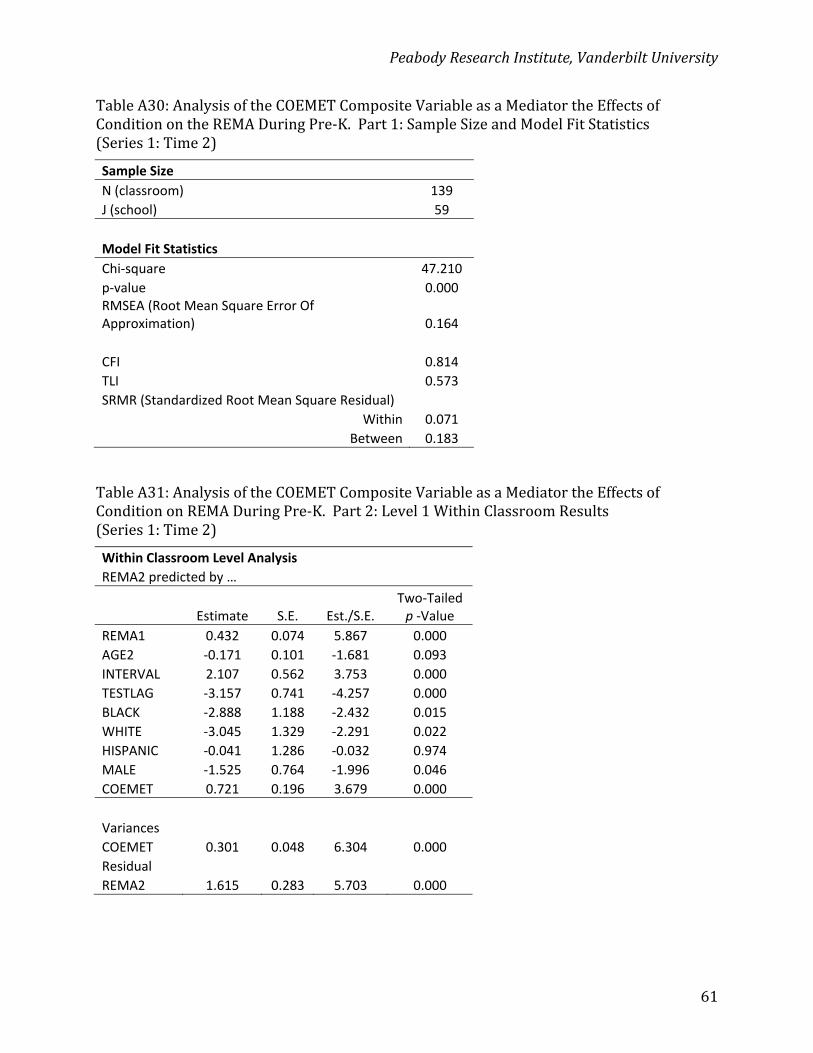
PeabodyResearchInstitute,VanderbiltUniversity
61
TableA30:AnalysisoftheCOEMETCompositeVariableasaMediatortheEffectsofConditionontheREMADuringPre‐K.Part1:SampleSizeandModelFitStatistics(Series1:Time2)
Sample Size
N (classroom) 139
J (school) 59
Model Fit Statistics
Chi‐square 47.210
p‐value 0.000 RMSEA (Root Mean Square Error Of Approximation) 0.164
CFI 0.814
TLI 0.573
SRMR (Standardized Root Mean Square Residual)
Within 0.071
Between 0.183
TableA31:AnalysisoftheCOEMETCompositeVariableasaMediatortheEffectsofConditiononREMADuringPre‐K.Part2:Level1WithinClassroomResults(Series1:Time2)
Within Classroom Level Analysis
REMA2 predicted by …
Estimate S.E. Est./S.E. Two‐Tailed p ‐Value
REMA1 0.432 0.074 5.867 0.000
AGE2 ‐0.171 0.101 ‐1.681 0.093
INTERVAL 2.107 0.562 3.753 0.000
TESTLAG ‐3.157 0.741 ‐4.257 0.000
BLACK ‐2.888 1.188 ‐2.432 0.015
WHITE ‐3.045 1.329 ‐2.291 0.022
HISPANIC ‐0.041 1.286 ‐0.032 0.974
MALE ‐1.525 0.764 ‐1.996 0.046
COEMET 0.721 0.196 3.679 0.000
Variances
COEMET 0.301 0.048 6.304 0.000
Residual
REMA2 1.615 0.283 5.703 0.000
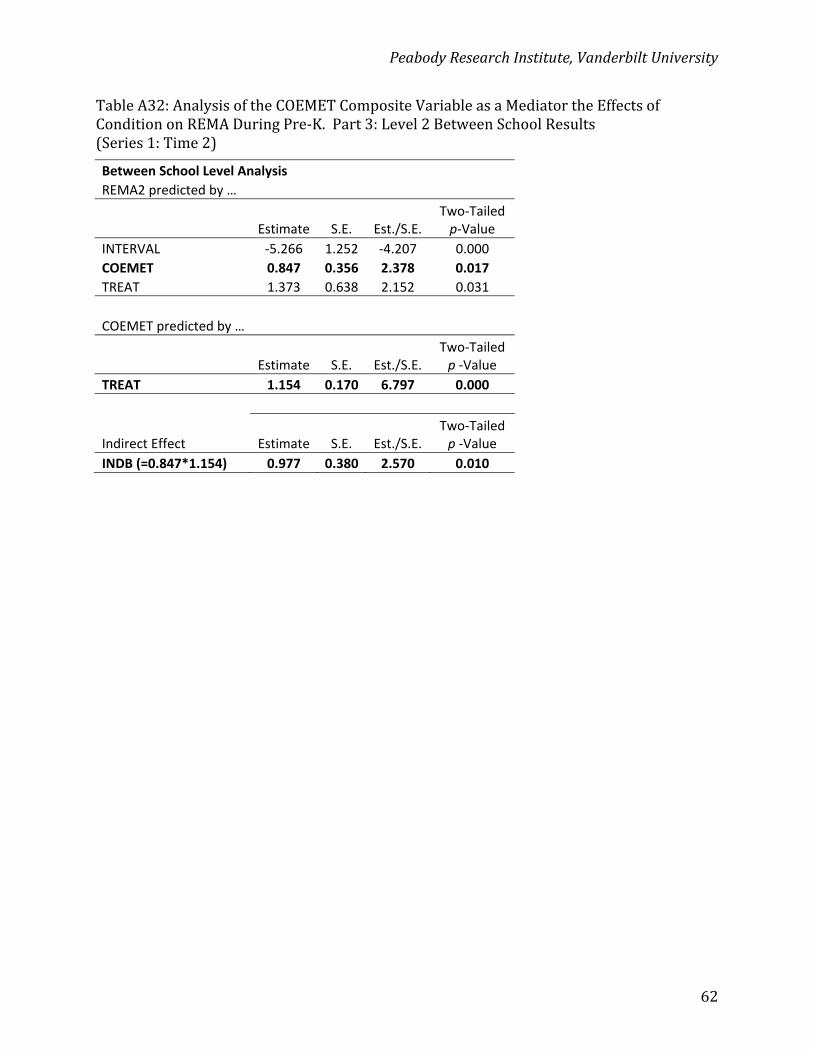
PeabodyResearchInstitute,VanderbiltUniversity
62
TableA32:AnalysisoftheCOEMETCompositeVariableasaMediatortheEffectsofConditiononREMADuringPre‐K.Part3:Level2BetweenSchoolResults(Series1:Time2)
Between School Level Analysis
REMA2 predicted by …
Estimate S.E. Est./S.E. Two‐Tailed p‐Value
INTERVAL ‐5.266 1.252 ‐4.207 0.000
COEMET 0.847 0.356 2.378 0.017
TREAT 1.373 0.638 2.152 0.031
COEMET predicted by …
Estimate S.E. Est./S.E. Two‐Tailed p ‐Value
TREAT 1.154 0.170 6.797 0.000
Indirect Effect Estimate S.E. Est./S.E. Two‐Tailed p ‐Value
INDB (=0.847*1.154) 0.977 0.380 2.570 0.010
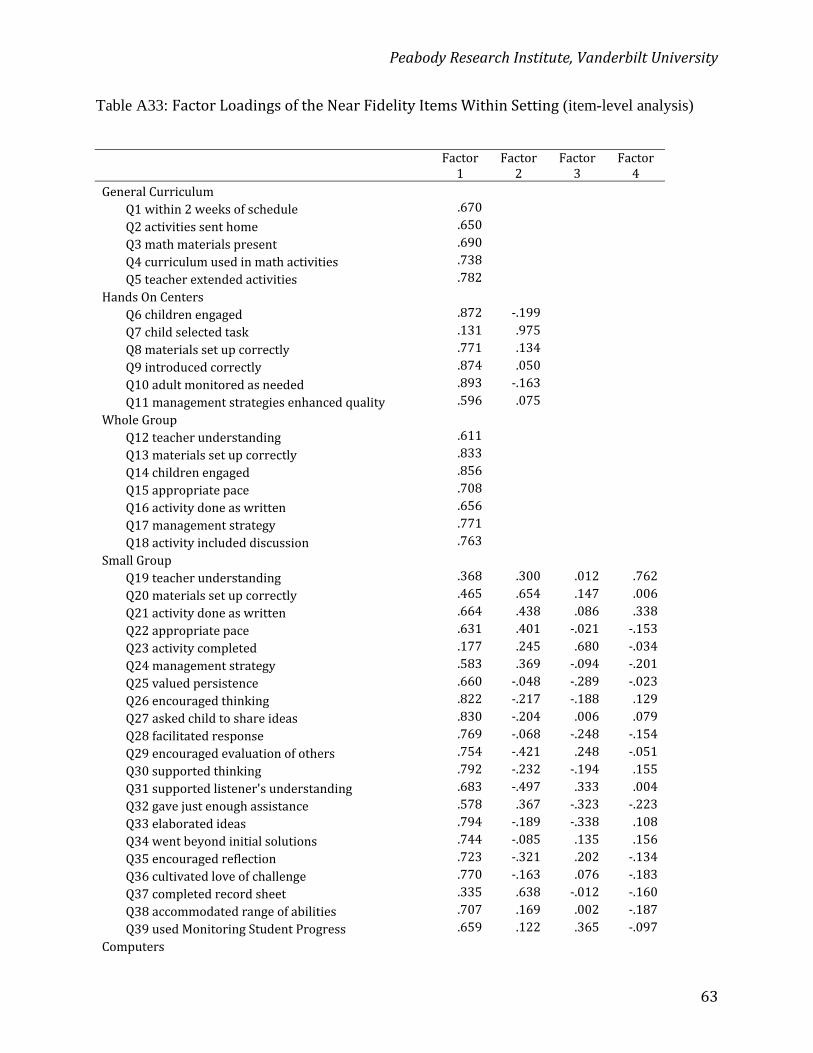
PeabodyResearchInstitute,VanderbiltUniversity
63
Table A33: FactorLoadingsoftheNearFidelityItemsWithinSetting (item-level analysis)
Factor1
Factor2
Factor3
Factor4
GeneralCurriculumQ1within2weeksofschedule .670
Q2activitiessenthome .650
Q3mathmaterialspresent .690
Q4curriculumusedinmathactivities .738
Q5teacherextendedactivities .782
HandsOnCentersQ6childrenengaged .872 ‐.199
Q7childselectedtask .131 .975
Q8materialssetupcorrectly .771 .134
Q9introducedcorrectly .874 .050
Q10adultmonitoredasneeded .893 ‐.163
Q11managementstrategiesenhancedquality .596 .075
WholeGroupQ12teacherunderstanding .611
Q13materialssetupcorrectly .833
Q14childrenengaged .856
Q15appropriatepace .708
Q16activitydoneaswritten .656
Q17managementstrategy .771
Q18activityincludeddiscussion .763
SmallGroupQ19teacherunderstanding .368 .300 .012 .762
Q20materialssetupcorrectly .465 .654 .147 .006
Q21activitydoneaswritten .664 .438 .086 .338
Q22appropriatepace .631 .401 ‐.021 ‐.153
Q23activitycompleted .177 .245 .680 ‐.034
Q24managementstrategy .583 .369 ‐.094 ‐.201
Q25valuedpersistence .660 ‐.048 ‐.289 ‐.023
Q26encouragedthinking .822 ‐.217 ‐.188 .129
Q27askedchildtoshareideas .830 ‐.204 .006 .079
Q28facilitatedresponse .769 ‐.068 ‐.248 ‐.154
Q29encouragedevaluationofothers .754 ‐.421 .248 ‐.051
Q30supportedthinking .792 ‐.232 ‐.194 .155
Q31supportedlistener'sunderstanding .683 ‐.497 .333 .004
Q32gavejustenoughassistance .578 .367 ‐.323 ‐.223
Q33elaboratedideas .794 ‐.189 ‐.338 .108
Q34wentbeyondinitialsolutions .744 ‐.085 .135 .156
Q35encouragedreflection .723 ‐.321 .202 ‐.134
Q36cultivatedloveofchallenge .770 ‐.163 .076 ‐.183
Q37completedrecordsheet .335 .638 ‐.012 ‐.160
Q38accommodatedrangeofabilities .707 .169 .002 ‐.187
Q39usedMonitoringStudentProgress .659 .122 .365 ‐.097
Computers
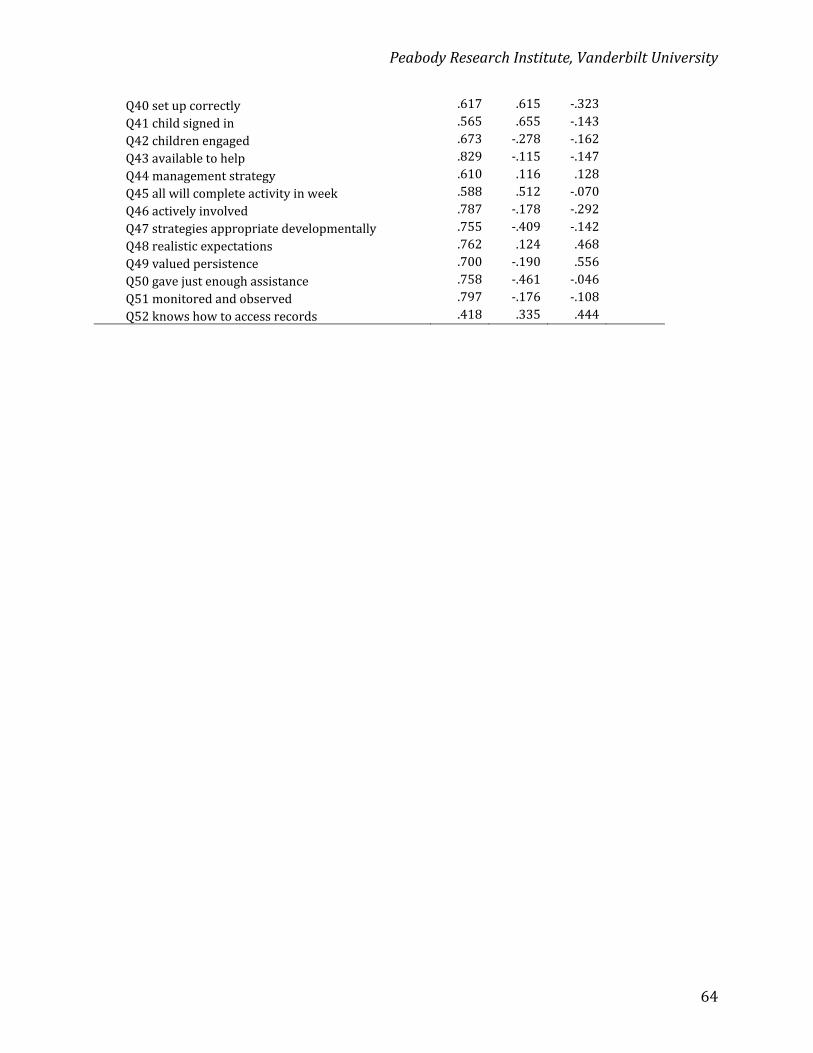
PeabodyResearchInstitute,VanderbiltUniversity
64
Q40setupcorrectly .617 .615 ‐.323
Q41childsignedin .565 .655 ‐.143
Q42childrenengaged .673 ‐.278 ‐.162
Q43availabletohelp .829 ‐.115 ‐.147
Q44managementstrategy .610 .116 .128
Q45allwillcompleteactivityinweek .588 .512 ‐.070
Q46activelyinvolved .787 ‐.178 ‐.292
Q47strategiesappropriatedevelopmentally .755 ‐.409 ‐.142
Q48realisticexpectations .762 .124 .468
Q49valuedpersistence .700 ‐.190 .556
Q50gavejustenoughassistance .758 ‐.461 ‐.046
Q51monitoredandobserved .797 ‐.176 ‐.108
Q52knowshowtoaccessrecords .418 .335 .444
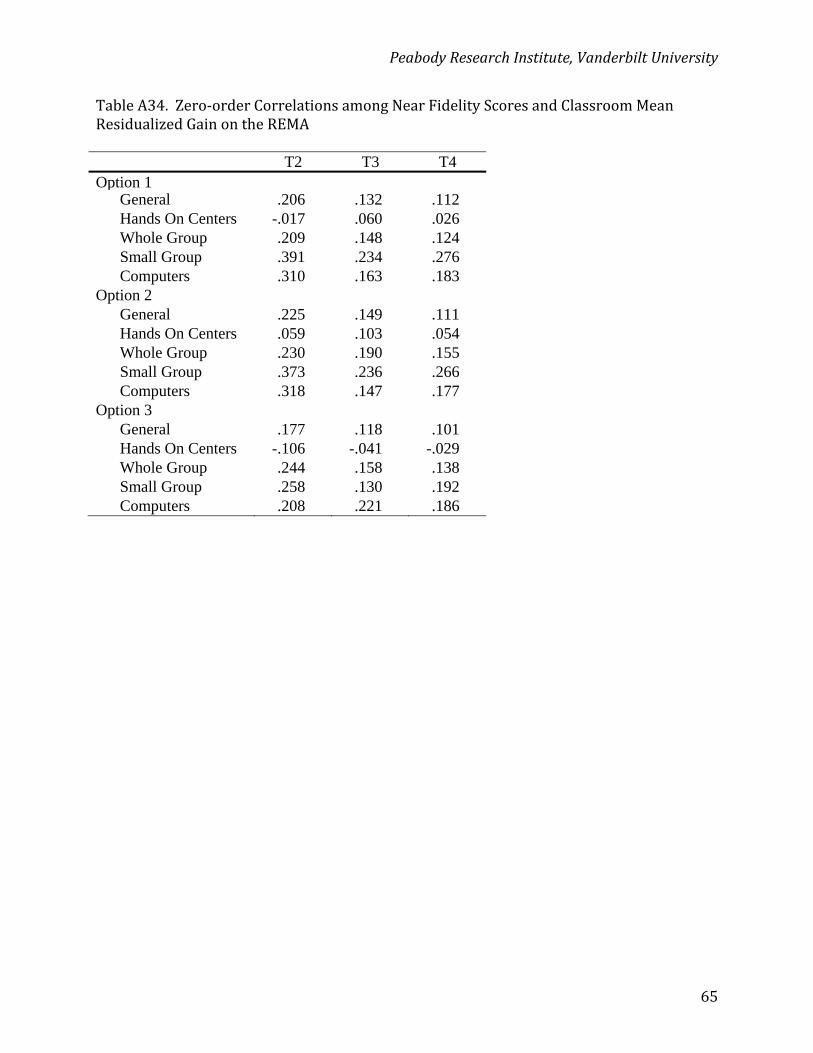
PeabodyResearchInstitute,VanderbiltUniversity
65
TableA34.Zero‐orderCorrelationsamongNearFidelityScoresandClassroomMeanResidualizedGainontheREMA T2 T3 T4 Option 1
General .206 .132 .112 Hands On Centers -.017 .060 .026 Whole Group .209 .148 .124 Small Group .391 .234 .276 Computers .310 .163 .183
Option 2 General .225 .149 .111 Hands On Centers .059 .103 .054 Whole Group .230 .190 .155 Small Group .373 .236 .266 Computers .318 .147 .177
Option 3 General .177 .118 .101 Hands On Centers -.106 -.041 -.029 Whole Group .244 .158 .138 Small Group .258 .130 .192 Computers .208 .221 .186
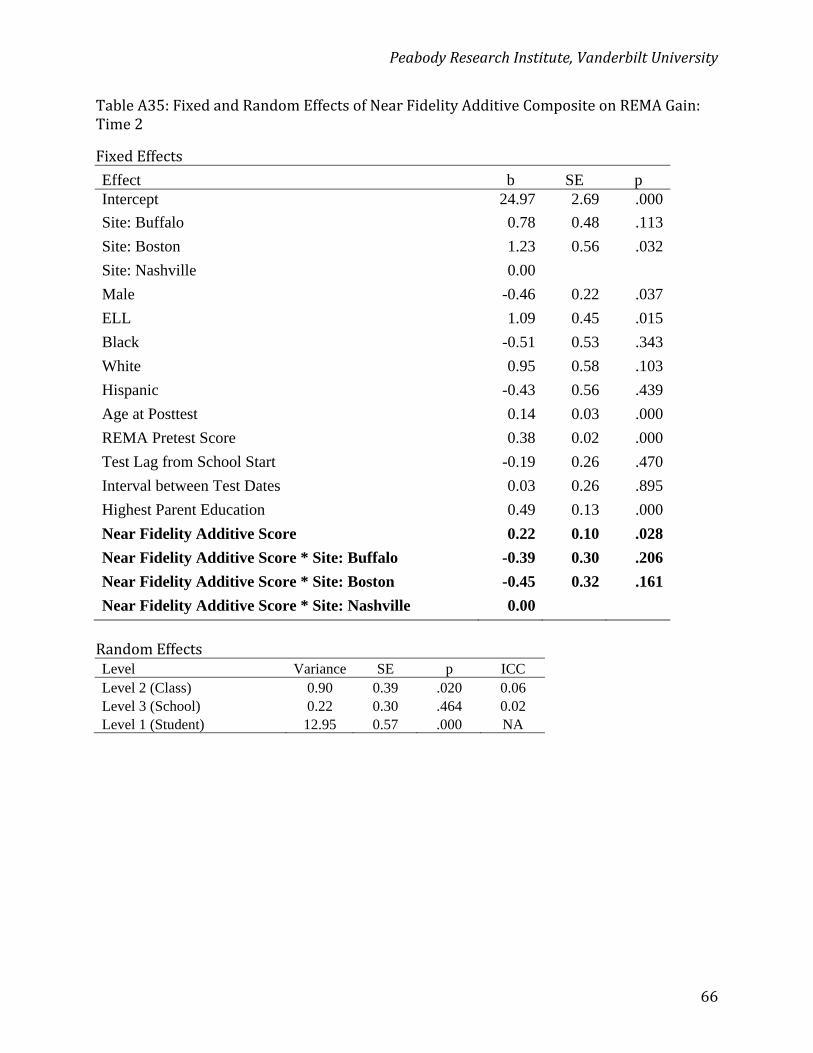
PeabodyResearchInstitute,VanderbiltUniversity
66
TableA35:FixedandRandomEffectsofNearFidelityAdditiveCompositeonREMAGain:Time2
FixedEffects
Effect b SE p Intercept 24.97 2.69 .000
Site: Buffalo 0.78 0.48 .113
Site: Boston 1.23 0.56 .032
Site: Nashville 0.00
Male -0.46 0.22 .037
ELL 1.09 0.45 .015
Black -0.51 0.53 .343
White 0.95 0.58 .103
Hispanic -0.43 0.56 .439
Age at Posttest 0.14 0.03 .000
REMA Pretest Score 0.38 0.02 .000
Test Lag from School Start -0.19 0.26 .470
Interval between Test Dates 0.03 0.26 .895
Highest Parent Education 0.49 0.13 .000
Near Fidelity Additive Score 0.22 0.10 .028
Near Fidelity Additive Score * Site: Buffalo -0.39 0.30 .206
Near Fidelity Additive Score * Site: Boston -0.45 0.32 .161
Near Fidelity Additive Score * Site: Nashville 0.00
RandomEffectsLevel Variance SE p ICC Level 2 (Class) 0.90 0.39 .020 0.06 Level 3 (School) 0.22 0.30 .464 0.02 Level 1 (Student) 12.95 0.57 .000 NA
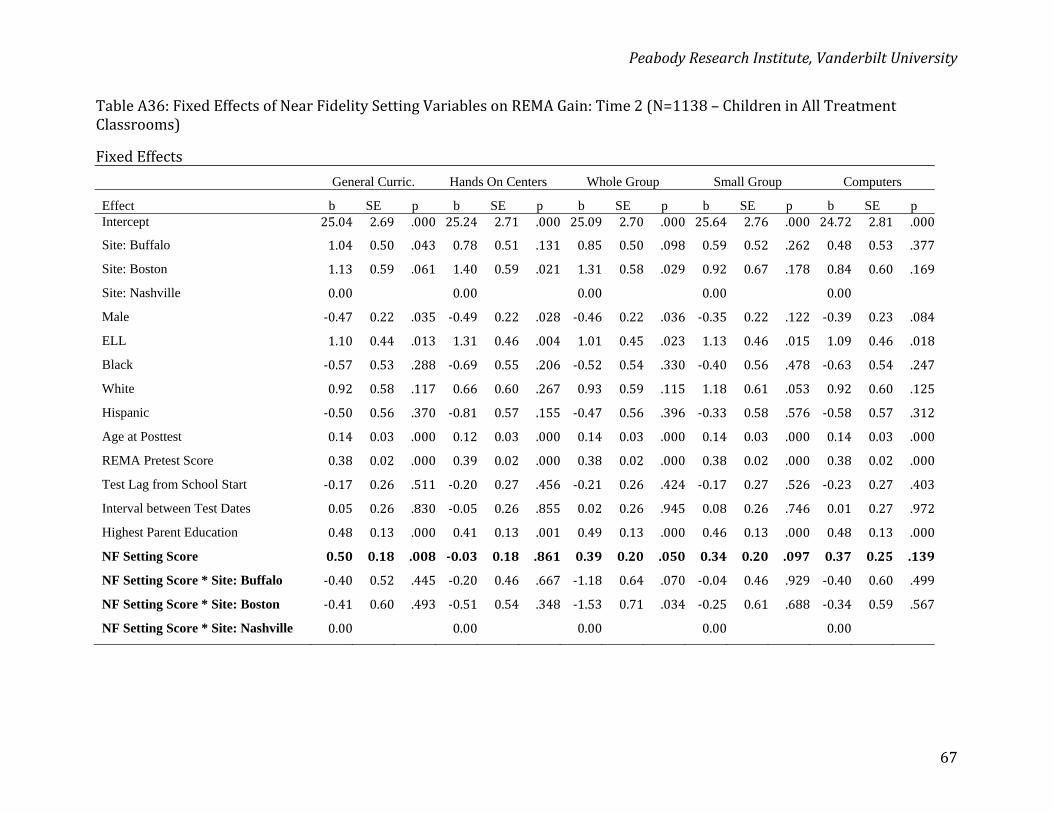
PeabodyResearchInstitute,VanderbiltUniversity
67
TableA36:FixedEffectsofNearFidelitySettingVariablesonREMAGain:Time2(N=1138–ChildreninAllTreatmentClassrooms)
FixedEffects
General Curric. Hands On Centers Whole Group Small Group Computers
Effect b SE p b SE p b SE p b SE p b SE p Intercept 25.04 2.69 .000 25.24 2.71 .000 25.09 2.70 .000 25.64 2.76 .000 24.72 2.81 .000
Site: Buffalo 1.04 0.50 .043 0.78 0.51 .131 0.85 0.50 .098 0.59 0.52 .262 0.48 0.53 .377
Site: Boston 1.13 0.59 .061 1.40 0.59 .021 1.31 0.58 .029 0.92 0.67 .178 0.84 0.60 .169
Site: Nashville 0.00 0.00 0.00 0.00 0.00
Male ‐0.47 0.22 .035 ‐0.49 0.22 .028 ‐0.46 0.22 .036 ‐0.35 0.22 .122 ‐0.39 0.23 .084
ELL 1.10 0.44 .013 1.31 0.46 .004 1.01 0.45 .023 1.13 0.46 .015 1.09 0.46 .018
Black ‐0.57 0.53 .288 ‐0.69 0.55 .206 ‐0.52 0.54 .330 ‐0.40 0.56 .478 ‐0.63 0.54 .247
White 0.92 0.58 .117 0.66 0.60 .267 0.93 0.59 .115 1.18 0.61 .053 0.92 0.60 .125
Hispanic ‐0.50 0.56 .370 ‐0.81 0.57 .155 ‐0.47 0.56 .396 ‐0.33 0.58 .576 ‐0.58 0.57 .312
Age at Posttest 0.14 0.03 .000 0.12 0.03 .000 0.14 0.03 .000 0.14 0.03 .000 0.14 0.03 .000
REMA Pretest Score 0.38 0.02 .000 0.39 0.02 .000 0.38 0.02 .000 0.38 0.02 .000 0.38 0.02 .000
Test Lag from School Start ‐0.17 0.26 .511 ‐0.20 0.27 .456 ‐0.21 0.26 .424 ‐0.17 0.27 .526 ‐0.23 0.27 .403
Interval between Test Dates 0.05 0.26 .830 ‐0.05 0.26 .855 0.02 0.26 .945 0.08 0.26 .746 0.01 0.27 .972
Highest Parent Education 0.48 0.13 .000 0.41 0.13 .001 0.49 0.13 .000 0.46 0.13 .000 0.48 0.13 .000
NF Setting Score 0.50 0.18 .008 ‐0.03 0.18 .861 0.39 0.20 .050 0.34 0.20 .097 0.37 0.25 .139
NF Setting Score * Site: Buffalo ‐0.40 0.52 .445 ‐0.20 0.46 .667 ‐1.18 0.64 .070 ‐0.04 0.46 .929 ‐0.40 0.60 .499
NF Setting Score * Site: Boston ‐0.41 0.60 .493 ‐0.51 0.54 .348 ‐1.53 0.71 .034 ‐0.25 0.61 .688 ‐0.34 0.59 .567
NF Setting Score * Site: Nashville 0.00 0.00 0.00 0.00 0.00
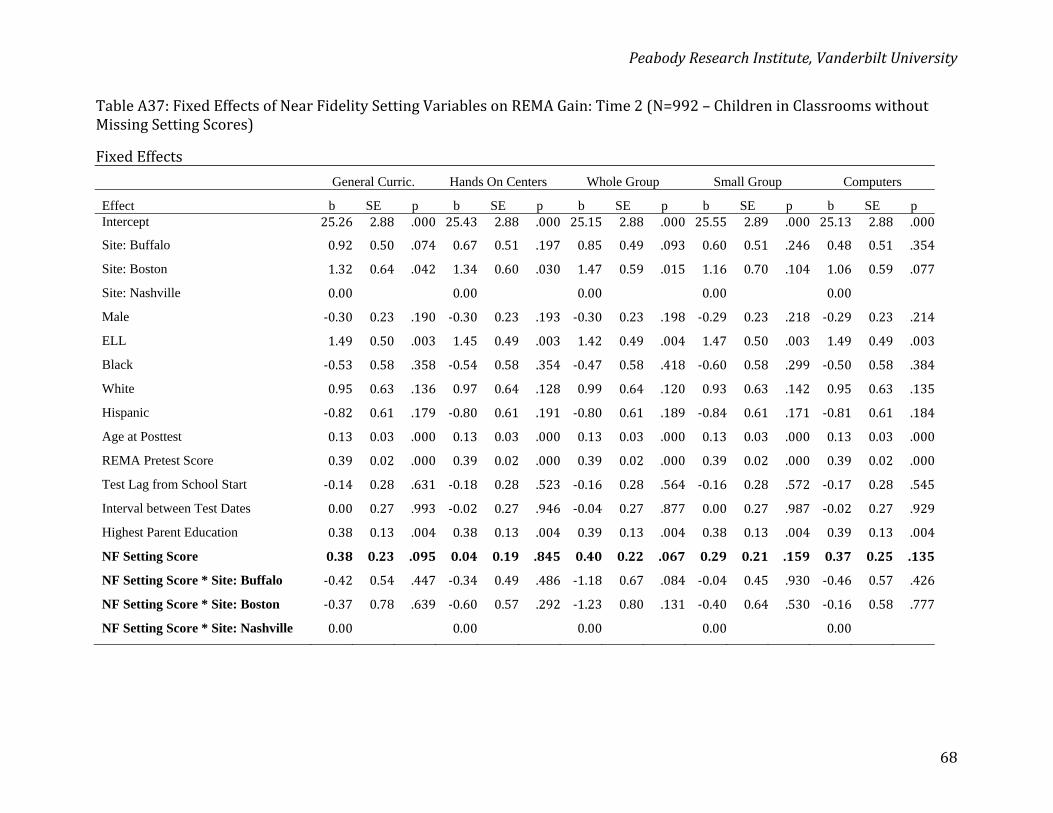
PeabodyResearchInstitute,VanderbiltUniversity
68
TableA37:FixedEffectsofNearFidelitySettingVariablesonREMAGain:Time2(N=992–ChildreninClassroomswithoutMissingSettingScores)
FixedEffects
General Curric. Hands On Centers Whole Group Small Group Computers
Effect b SE p b SE p b SE p b SE p b SE p Intercept 25.26 2.88 .000 25.43 2.88 .000 25.15 2.88 .000 25.55 2.89 .000 25.13 2.88 .000
Site: Buffalo 0.92 0.50 .074 0.67 0.51 .197 0.85 0.49 .093 0.60 0.51 .246 0.48 0.51 .354
Site: Boston 1.32 0.64 .042 1.34 0.60 .030 1.47 0.59 .015 1.16 0.70 .104 1.06 0.59 .077
Site: Nashville 0.00 0.00 0.00 0.00 0.00
Male ‐0.30 0.23 .190 ‐0.30 0.23 .193 ‐0.30 0.23 .198 ‐0.29 0.23 .218 ‐0.29 0.23 .214
ELL 1.49 0.50 .003 1.45 0.49 .003 1.42 0.49 .004 1.47 0.50 .003 1.49 0.49 .003
Black ‐0.53 0.58 .358 ‐0.54 0.58 .354 ‐0.47 0.58 .418 ‐0.60 0.58 .299 ‐0.50 0.58 .384
White 0.95 0.63 .136 0.97 0.64 .128 0.99 0.64 .120 0.93 0.63 .142 0.95 0.63 .135
Hispanic ‐0.82 0.61 .179 ‐0.80 0.61 .191 ‐0.80 0.61 .189 ‐0.84 0.61 .171 ‐0.81 0.61 .184
Age at Posttest 0.13 0.03 .000 0.13 0.03 .000 0.13 0.03 .000 0.13 0.03 .000 0.13 0.03 .000
REMA Pretest Score 0.39 0.02 .000 0.39 0.02 .000 0.39 0.02 .000 0.39 0.02 .000 0.39 0.02 .000
Test Lag from School Start ‐0.14 0.28 .631 ‐0.18 0.28 .523 ‐0.16 0.28 .564 ‐0.16 0.28 .572 ‐0.17 0.28 .545
Interval between Test Dates 0.00 0.27 .993 ‐0.02 0.27 .946 ‐0.04 0.27 .877 0.00 0.27 .987 ‐0.02 0.27 .929
Highest Parent Education 0.38 0.13 .004 0.38 0.13 .004 0.39 0.13 .004 0.38 0.13 .004 0.39 0.13 .004
NF Setting Score 0.38 0.23 .095 0.04 0.19 .845 0.40 0.22 .067 0.29 0.21 .159 0.37 0.25 .135
NF Setting Score * Site: Buffalo ‐0.42 0.54 .447 ‐0.34 0.49 .486 ‐1.18 0.67 .084 ‐0.04 0.45 .930 ‐0.46 0.57 .426
NF Setting Score * Site: Boston ‐0.37 0.78 .639 ‐0.60 0.57 .292 ‐1.23 0.80 .131 ‐0.40 0.64 .530 ‐0.16 0.58 .777
NF Setting Score * Site: Nashville 0.00 0.00 0.00 0.00 0.00
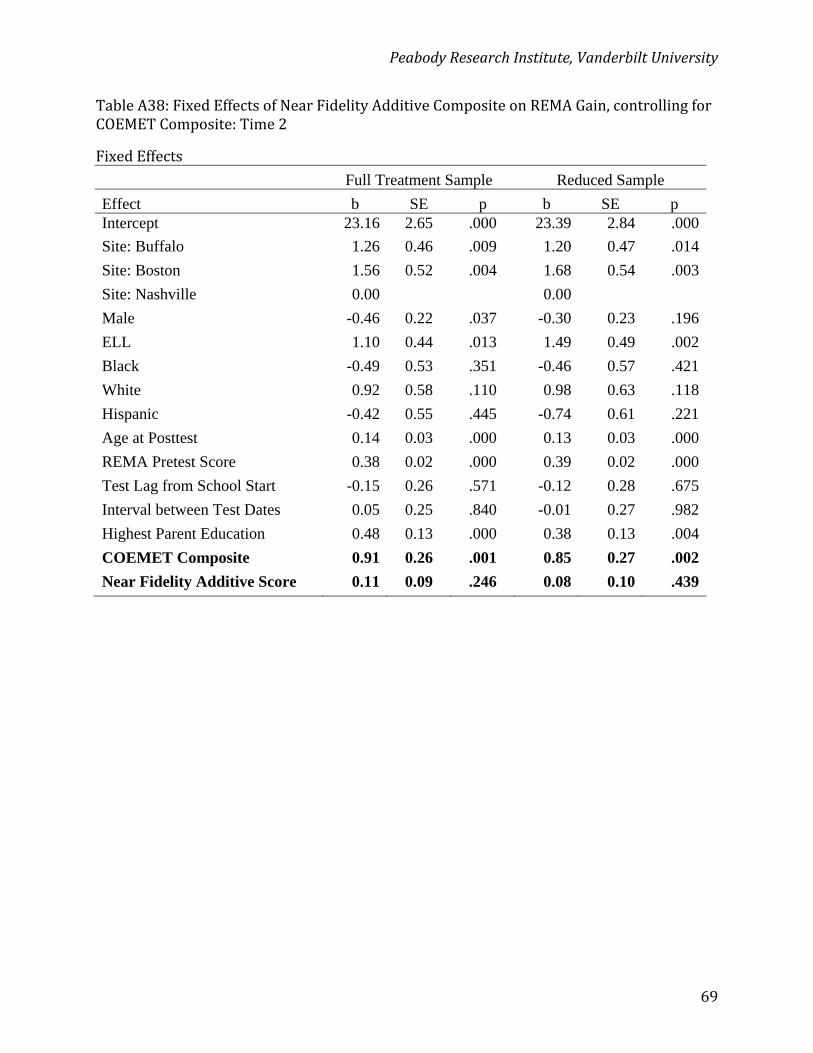
PeabodyResearchInstitute,VanderbiltUniversity
69
TableA38:FixedEffectsofNearFidelityAdditiveCompositeonREMAGain,controllingforCOEMETComposite:Time2
FixedEffects
Full Treatment Sample Reduced Sample
Effect b SE p b SE p Intercept 23.16 2.65 .000 23.39 2.84 .000
Site: Buffalo 1.26 0.46 .009 1.20 0.47 .014
Site: Boston 1.56 0.52 .004 1.68 0.54 .003
Site: Nashville 0.00 0.00
Male -0.46 0.22 .037 -0.30 0.23 .196
ELL 1.10 0.44 .013 1.49 0.49 .002
Black -0.49 0.53 .351 -0.46 0.57 .421
White 0.92 0.58 .110 0.98 0.63 .118
Hispanic -0.42 0.55 .445 -0.74 0.61 .221
Age at Posttest 0.14 0.03 .000 0.13 0.03 .000
REMA Pretest Score 0.38 0.02 .000 0.39 0.02 .000
Test Lag from School Start -0.15 0.26 .571 -0.12 0.28 .675
Interval between Test Dates 0.05 0.25 .840 -0.01 0.27 .982
Highest Parent Education 0.48 0.13 .000 0.38 0.13 .004
COEMET Composite 0.91 0.26 .001 0.85 0.27 .002
Near Fidelity Additive Score 0.11 0.09 .246 0.08 0.10 .439
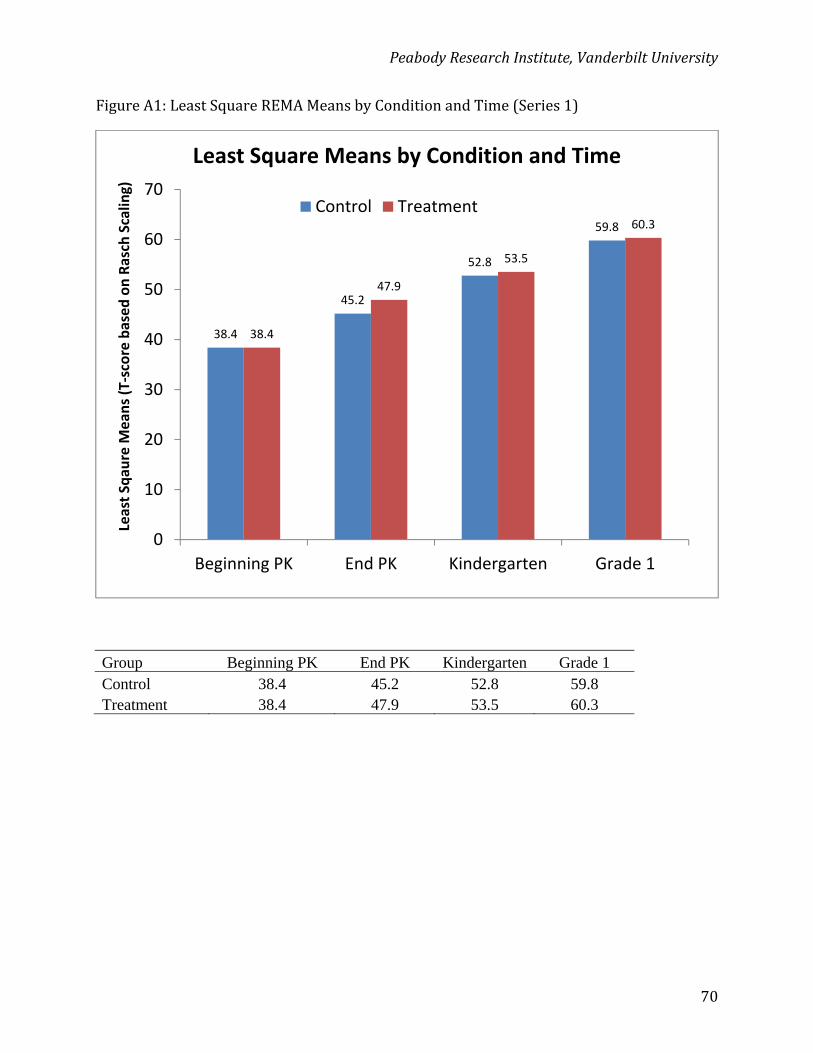
PeabodyResearchInstitute,VanderbiltUniversity
70
FigureA1:LeastSquareREMAMeansbyConditionandTime(Series1)
Group Beginning PK End PK Kindergarten Grade 1 Control 38.4 45.2 52.8 59.8 Treatment 38.4 47.9 53.5 60.3
38.4
45.2
52.8
59.8
38.4
47.9
53.5
60.3
0
10
20
30
40
50
60
70
Beginning PK End PK Kindergarten Grade 1
Least Sqau
re M
ean
s (T‐score based on Rasch Scalin
g)
Least Square Means by Condition and Time
Control Treatment
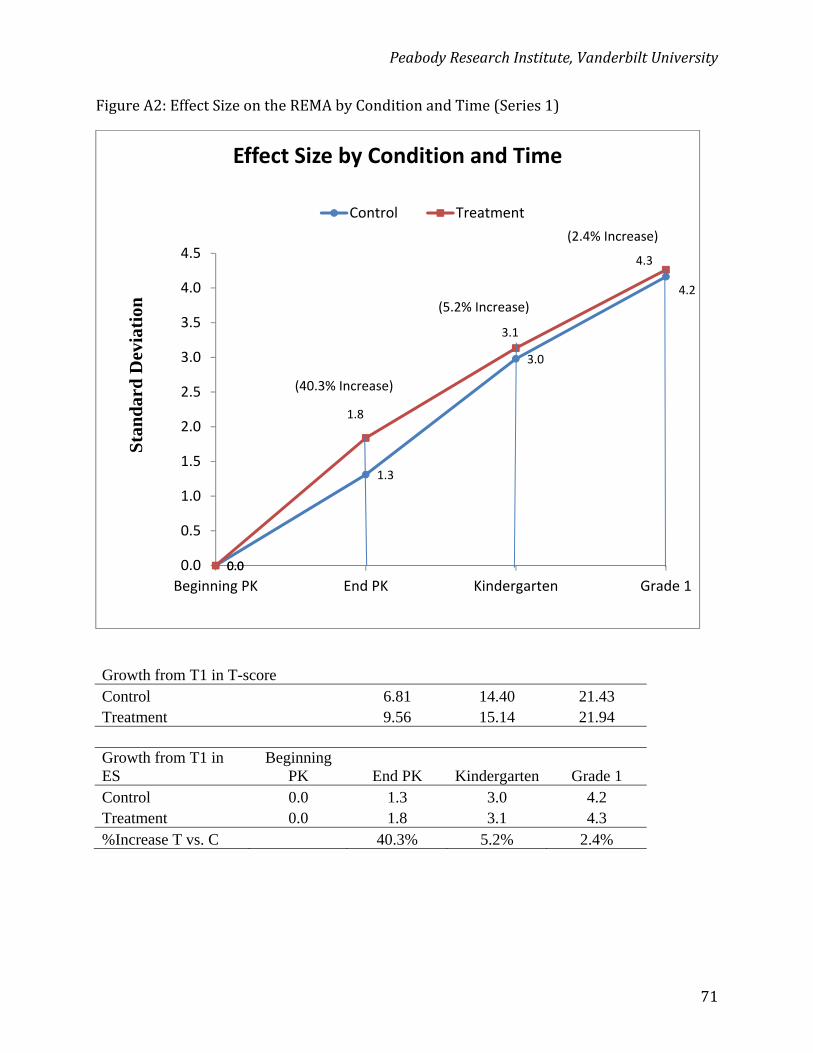
PeabodyResearchInstitute,VanderbiltUniversity
71
FigureA2:EffectSizeontheREMAbyConditionandTime(Series1)
Growth from T1 in T-score Control 6.81 14.40 21.43 Treatment 9.56 15.14 21.94
Growth from T1 in ES
Beginning PK End PK Kindergarten Grade 1
Control 0.0 1.3 3.0 4.2 Treatment 0.0 1.8 3.1 4.3 %Increase T vs. C 40.3% 5.2% 2.4%
0.0
1.3
3.0
4.2
0.0
1.8
3.1
4.3
0.0
0.5
1.0
1.5
2.0
2.5
3.0
3.5
4.0
4.5
Beginning PK End PK Kindergarten Grade 1
Sta
nd
ard
Dev
iati
onEffect Size by Condition and Time
Control Treatment
(40.3% Increase)
(5.2% Increase)
(2.4% Increase)
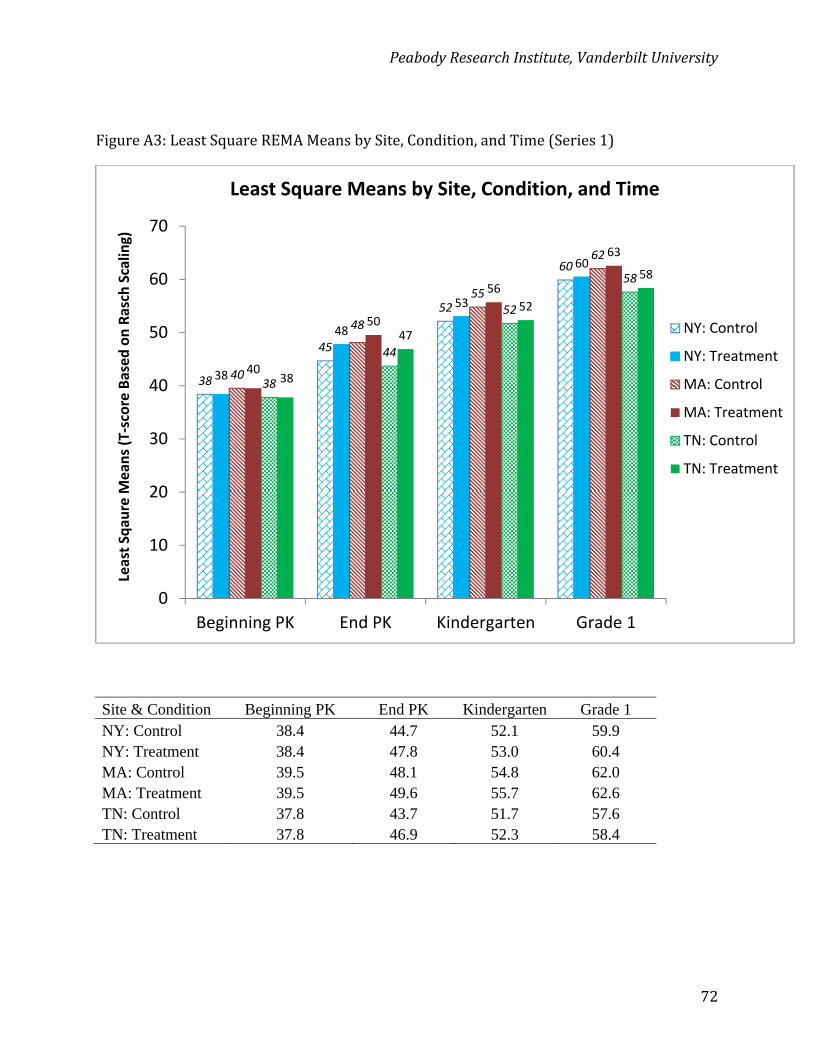
PeabodyResearchInstitute,VanderbiltUniversity
72
FigureA3:LeastSquareREMAMeansbySite,Condition,andTime(Series1)
Site & Condition Beginning PK End PK Kindergarten Grade 1 NY: Control 38.4 44.7 52.1 59.9 NY: Treatment 38.4 47.8 53.0 60.4 MA: Control 39.5 48.1 54.8 62.0 MA: Treatment 39.5 49.6 55.7 62.6 TN: Control 37.8 43.7 51.7 57.6 TN: Treatment 37.8 46.9 52.3 58.4
38
45
52
60
38
48
53
60
40
48
55
62
40
50
56
63
38
44
52
58
38
47
52
58
0
10
20
30
40
50
60
70
Beginning PK End PK Kindergarten Grade 1
Least Sqau
re M
ean
s (T‐score Based on Rasch Scalin
g)
Least Square Means by Site, Condition, and Time
NY: Control
NY: Treatment
MA: Control
MA: Treatment
TN: Control
TN: Treatment
PeabodyResearchInstitute,VanderbiltUniversity
73
AppendixB
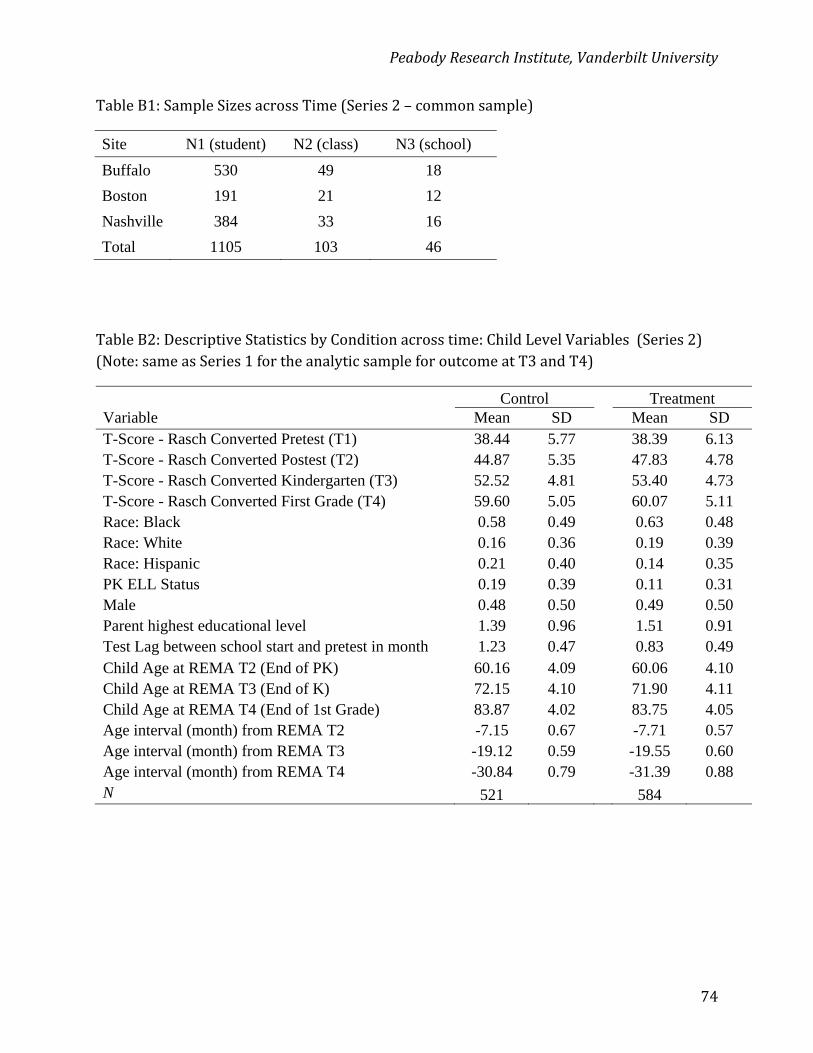
PeabodyResearchInstitute,VanderbiltUniversity
74
TableB1:SampleSizesacrossTime(Series2–commonsample)
Site N1 (student) N2 (class) N3 (school)
Buffalo 530 49 18
Boston 191 21 12
Nashville 384 33 16
Total 1105 103 46
TableB2:DescriptiveStatisticsbyConditionacrosstime:ChildLevelVariables(Series2)(Note:sameasSeries1fortheanalyticsampleforoutcomeatT3andT4)
Control Treatment Variable Mean SD Mean SD T-Score - Rasch Converted Pretest (T1) 38.44 5.77 38.39 6.13 T-Score - Rasch Converted Postest (T2) 44.87 5.35 47.83 4.78 T-Score - Rasch Converted Kindergarten (T3) 52.52 4.81 53.40 4.73 T-Score - Rasch Converted First Grade (T4) 59.60 5.05 60.07 5.11 Race: Black 0.58 0.49 0.63 0.48 Race: White 0.16 0.36 0.19 0.39 Race: Hispanic 0.21 0.40 0.14 0.35 PK ELL Status 0.19 0.39 0.11 0.31 Male 0.48 0.50 0.49 0.50 Parent highest educational level 1.39 0.96 1.51 0.91 Test Lag between school start and pretest in month 1.23 0.47 0.83 0.49 Child Age at REMA T2 (End of PK) 60.16 4.09 60.06 4.10 Child Age at REMA T3 (End of K) 72.15 4.10 71.90 4.11 Child Age at REMA T4 (End of 1st Grade) 83.87 4.02 83.75 4.05 Age interval (month) from REMA T2 -7.15 0.67 -7.71 0.57 Age interval (month) from REMA T3 -19.12 0.59 -19.55 0.60 Age interval (month) from REMA T4 -30.84 0.79 -31.39 0.88 N 521 584
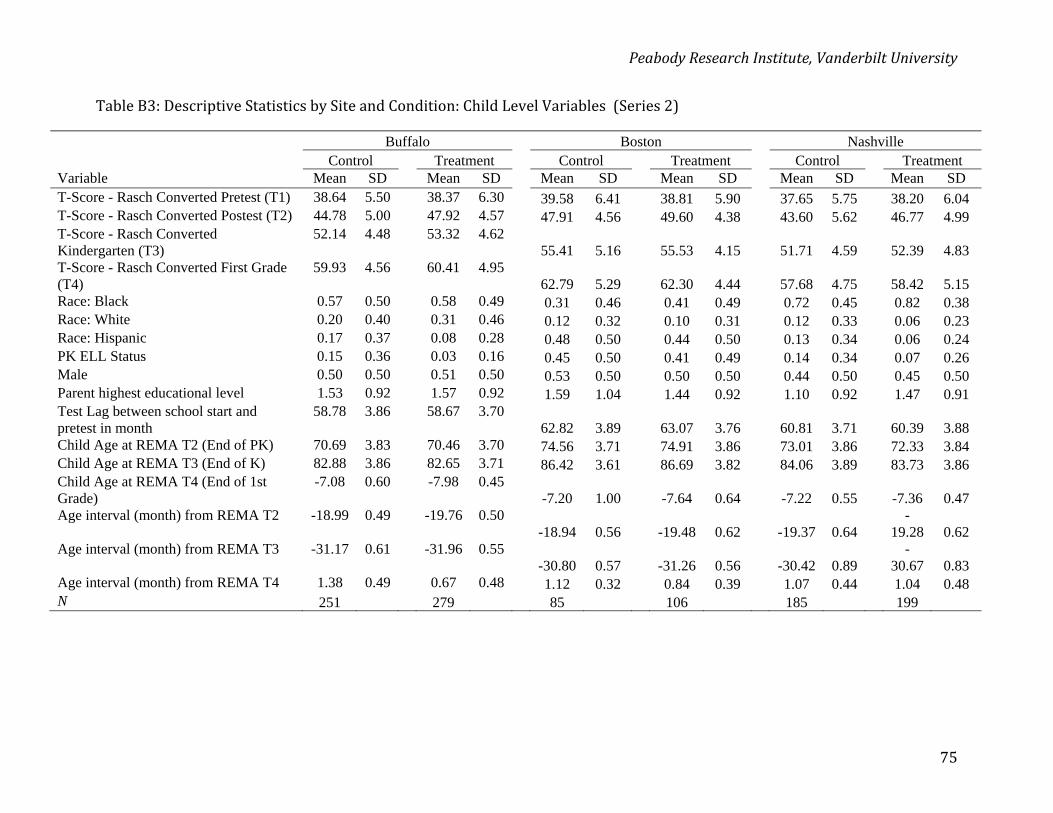
PeabodyResearchInstitute,VanderbiltUniversity
75
TableB3:DescriptiveStatisticsbySiteandCondition:ChildLevelVariables(Series2)
Buffalo Boston Nashville Control Treatment Control Treatment Control Treatment
Variable Mean SD Mean SD Mean SD Mean SD Mean SD Mean SD T-Score - Rasch Converted Pretest (T1) 38.64 5.50 38.37 6.30 39.58 6.41 38.81 5.90 37.65 5.75 38.20 6.04 T-Score - Rasch Converted Postest (T2) 44.78 5.00 47.92 4.57 47.91 4.56 49.60 4.38 43.60 5.62 46.77 4.99 T-Score - Rasch Converted Kindergarten (T3)
52.14 4.48 53.32 4.62 55.41 5.16 55.53 4.15 51.71 4.59 52.39 4.83
T-Score - Rasch Converted First Grade (T4)
59.93 4.56 60.41 4.95 62.79 5.29 62.30 4.44 57.68 4.75 58.42 5.15
Race: Black 0.57 0.50 0.58 0.49 0.31 0.46 0.41 0.49 0.72 0.45 0.82 0.38 Race: White 0.20 0.40 0.31 0.46 0.12 0.32 0.10 0.31 0.12 0.33 0.06 0.23 Race: Hispanic 0.17 0.37 0.08 0.28 0.48 0.50 0.44 0.50 0.13 0.34 0.06 0.24 PK ELL Status 0.15 0.36 0.03 0.16 0.45 0.50 0.41 0.49 0.14 0.34 0.07 0.26 Male 0.50 0.50 0.51 0.50 0.53 0.50 0.50 0.50 0.44 0.50 0.45 0.50 Parent highest educational level 1.53 0.92 1.57 0.92 1.59 1.04 1.44 0.92 1.10 0.92 1.47 0.91 Test Lag between school start and pretest in month
58.78 3.86 58.67 3.70 62.82 3.89 63.07 3.76 60.81 3.71 60.39 3.88
Child Age at REMA T2 (End of PK) 70.69 3.83 70.46 3.70 74.56 3.71 74.91 3.86 73.01 3.86 72.33 3.84 Child Age at REMA T3 (End of K) 82.88 3.86 82.65 3.71 86.42 3.61 86.69 3.82 84.06 3.89 83.73 3.86 Child Age at REMA T4 (End of 1st Grade)
-7.08 0.60 -7.98 0.45 -7.20 1.00 -7.64 0.64 -7.22 0.55 -7.36 0.47
Age interval (month) from REMA T2 -18.99 0.49 -19.76 0.50 -18.94 0.56 -19.48 0.62 -19.37 0.64
-19.28 0.62
Age interval (month) from REMA T3 -31.17 0.61 -31.96 0.55 -30.80 0.57 -31.26 0.56 -30.42 0.89
-30.67 0.83
Age interval (month) from REMA T4 1.38 0.49 0.67 0.48 1.12 0.32 0.84 0.39 1.07 0.44 1.04 0.48 N 251 279 85 106 185 199
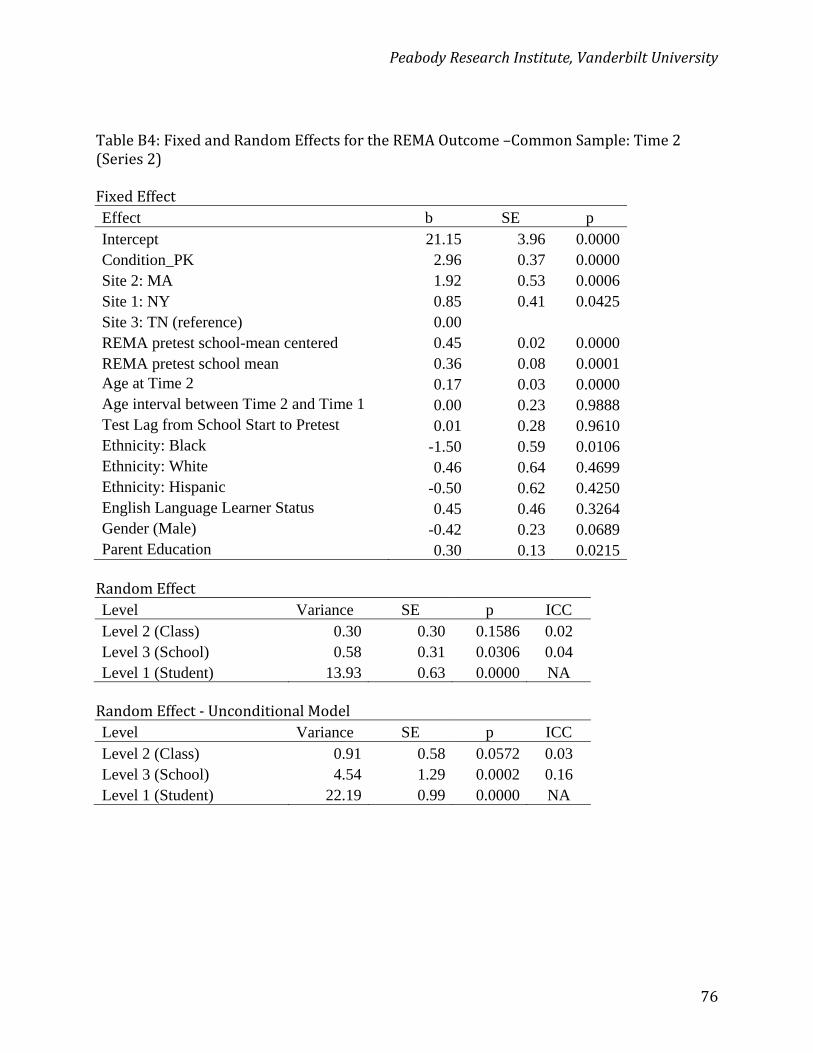
PeabodyResearchInstitute,VanderbiltUniversity
76
TableB4:FixedandRandomEffectsfortheREMAOutcome–CommonSample:Time2(Series2)FixedEffectEffect b SE p Intercept 21.15 3.96 0.0000 Condition_PK 2.96 0.37 0.0000 Site 2: MA 1.92 0.53 0.0006 Site 1: NY 0.85 0.41 0.0425 Site 3: TN (reference) 0.00REMA pretest school-mean centered 0.45 0.02 0.0000 REMA pretest school mean 0.36 0.08 0.0001 Age at Time 2 0.17 0.03 0.0000 Age interval between Time 2 and Time 1 0.00 0.23 0.9888 Test Lag from School Start to Pretest 0.01 0.28 0.9610 Ethnicity: Black -1.50 0.59 0.0106 Ethnicity: White 0.46 0.64 0.4699 Ethnicity: Hispanic -0.50 0.62 0.4250 English Language Learner Status 0.45 0.46 0.3264 Gender (Male) -0.42 0.23 0.0689 Parent Education 0.30 0.13 0.0215 RandomEffectLevel Variance SE p ICC Level 2 (Class) 0.30 0.30 0.1586 0.02 Level 3 (School) 0.58 0.31 0.0306 0.04 Level 1 (Student) 13.93 0.63 0.0000 NA RandomEffect‐UnconditionalModelLevel Variance SE p ICC Level 2 (Class) 0.91 0.58 0.0572 0.03 Level 3 (School) 4.54 1.29 0.0002 0.16 Level 1 (Student) 22.19 0.99 0.0000 NA
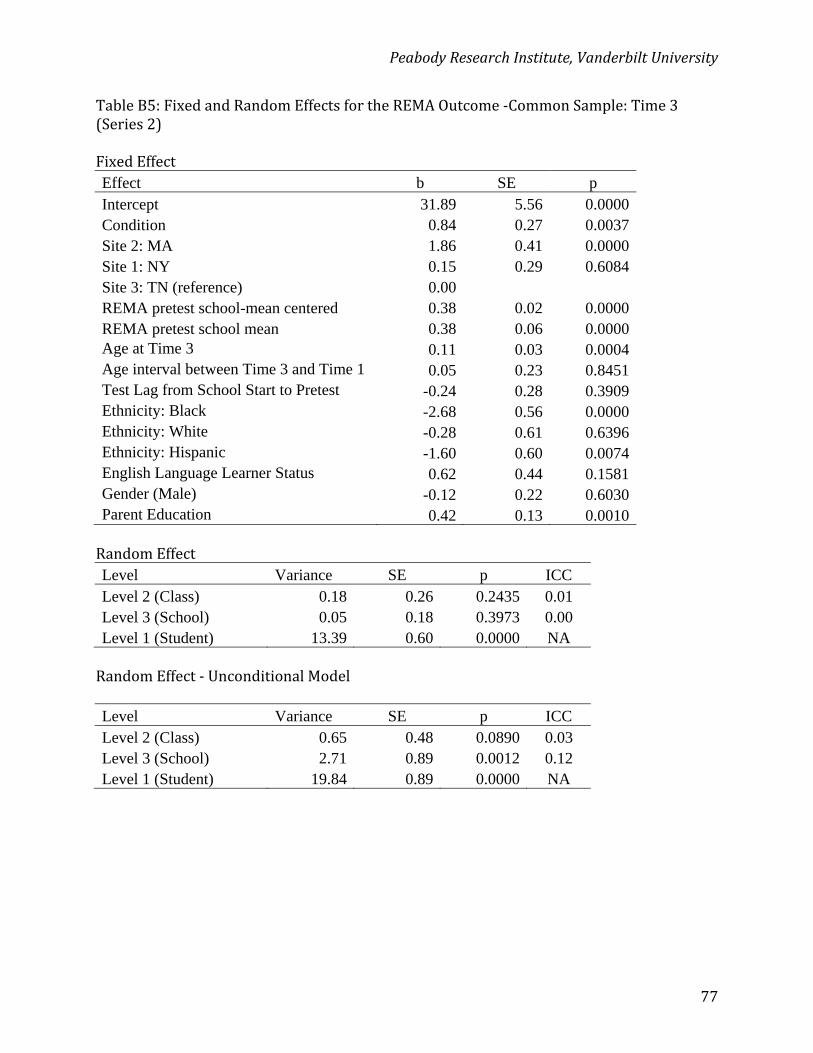
PeabodyResearchInstitute,VanderbiltUniversity
77
TableB5:FixedandRandomEffectsfortheREMAOutcome‐CommonSample:Time3(Series2)FixedEffectEffect b SE p Intercept 31.89 5.56 0.0000 Condition 0.84 0.27 0.0037 Site 2: MA 1.86 0.41 0.0000 Site 1: NY 0.15 0.29 0.6084 Site 3: TN (reference) 0.00REMA pretest school-mean centered 0.38 0.02 0.0000 REMA pretest school mean 0.38 0.06 0.0000 Age at Time 3 0.11 0.03 0.0004 Age interval between Time 3 and Time 1 0.05 0.23 0.8451 Test Lag from School Start to Pretest -0.24 0.28 0.3909 Ethnicity: Black -2.68 0.56 0.0000 Ethnicity: White -0.28 0.61 0.6396 Ethnicity: Hispanic -1.60 0.60 0.0074 English Language Learner Status 0.62 0.44 0.1581 Gender (Male) -0.12 0.22 0.6030 Parent Education 0.42 0.13 0.0010 RandomEffectLevel Variance SE p ICC Level 2 (Class) 0.18 0.26 0.2435 0.01 Level 3 (School) 0.05 0.18 0.3973 0.00 Level 1 (Student) 13.39 0.60 0.0000 NA RandomEffect‐UnconditionalModelLevel Variance SE p ICC Level 2 (Class) 0.65 0.48 0.0890 0.03 Level 3 (School) 2.71 0.89 0.0012 0.12 Level 1 (Student) 19.84 0.89 0.0000 NA
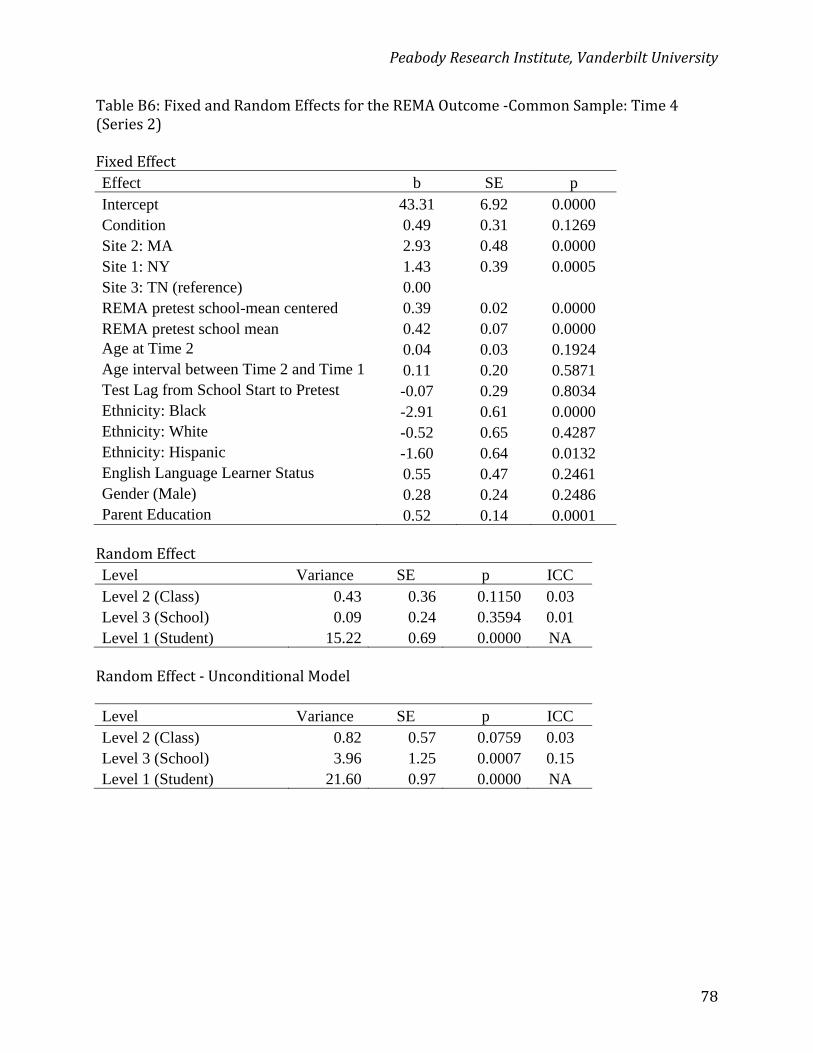
PeabodyResearchInstitute,VanderbiltUniversity
78
TableB6:FixedandRandomEffectsfortheREMAOutcome‐CommonSample:Time4(Series2)FixedEffectEffect b SE p Intercept 43.31 6.92 0.0000 Condition 0.49 0.31 0.1269 Site 2: MA 2.93 0.48 0.0000 Site 1: NY 1.43 0.39 0.0005 Site 3: TN (reference) 0.00 REMA pretest school-mean centered 0.39 0.02 0.0000 REMA pretest school mean 0.42 0.07 0.0000 Age at Time 2 0.04 0.03 0.1924 Age interval between Time 2 and Time 1 0.11 0.20 0.5871 Test Lag from School Start to Pretest -0.07 0.29 0.8034 Ethnicity: Black -2.91 0.61 0.0000 Ethnicity: White -0.52 0.65 0.4287 Ethnicity: Hispanic -1.60 0.64 0.0132 English Language Learner Status 0.55 0.47 0.2461 Gender (Male) 0.28 0.24 0.2486 Parent Education 0.52 0.14 0.0001 RandomEffectLevel Variance SE p ICC Level 2 (Class) 0.43 0.36 0.1150 0.03 Level 3 (School) 0.09 0.24 0.3594 0.01 Level 1 (Student) 15.22 0.69 0.0000 NA RandomEffect‐UnconditionalModelLevel Variance SE p ICC Level 2 (Class) 0.82 0.57 0.0759 0.03 Level 3 (School) 3.96 1.25 0.0007 0.15 Level 1 (Student) 21.60 0.97 0.0000 NA
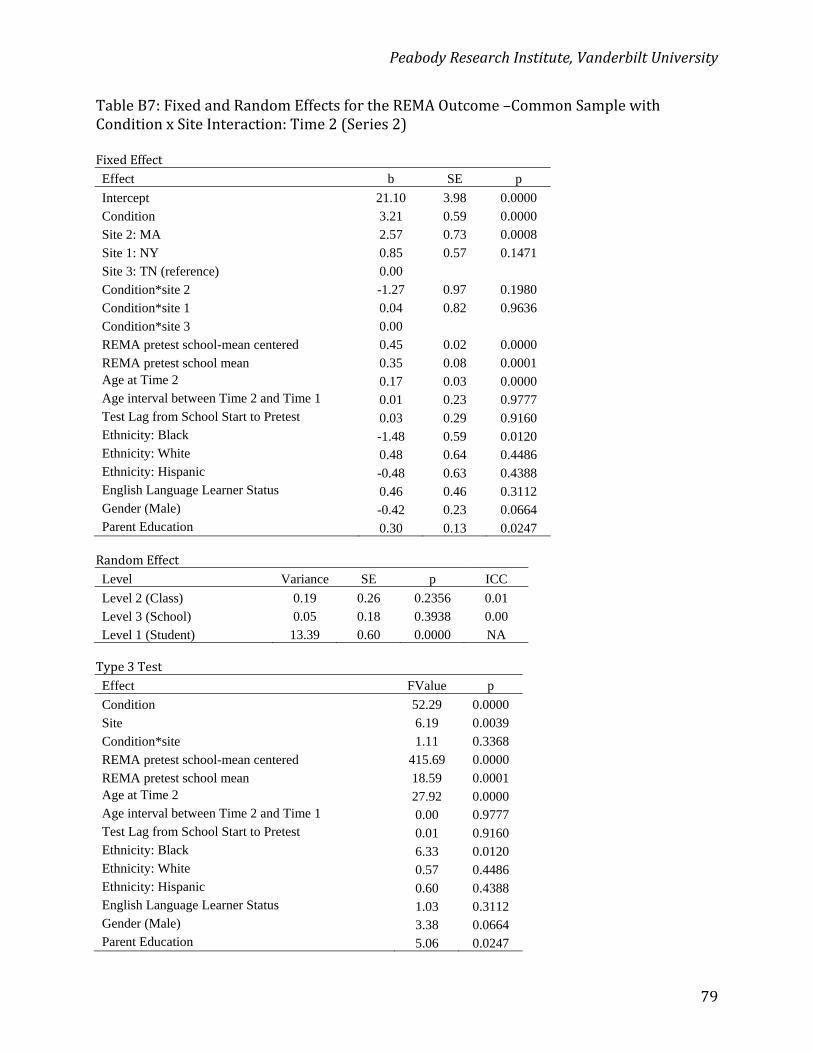
PeabodyResearchInstitute,VanderbiltUniversity
79
TableB7:FixedandRandomEffectsfortheREMAOutcome–CommonSamplewithConditionxSiteInteraction:Time2(Series2)FixedEffectEffect b SE p
Intercept 21.10 3.98 0.0000 Condition 3.21 0.59 0.0000 Site 2: MA 2.57 0.73 0.0008 Site 1: NY 0.85 0.57 0.1471 Site 3: TN (reference) 0.00 Condition*site 2 -1.27 0.97 0.1980 Condition*site 1 0.04 0.82 0.9636 Condition*site 3 0.00 REMA pretest school-mean centered 0.45 0.02 0.0000 REMA pretest school mean 0.35 0.08 0.0001 Age at Time 2 0.17 0.03 0.0000 Age interval between Time 2 and Time 1 0.01 0.23 0.9777 Test Lag from School Start to Pretest 0.03 0.29 0.9160 Ethnicity: Black -1.48 0.59 0.0120 Ethnicity: White 0.48 0.64 0.4486 Ethnicity: Hispanic -0.48 0.63 0.4388 English Language Learner Status 0.46 0.46 0.3112 Gender (Male) -0.42 0.23 0.0664 Parent Education 0.30 0.13 0.0247 RandomEffectLevel Variance SE p ICC
Level 2 (Class) 0.19 0.26 0.2356 0.01 Level 3 (School) 0.05 0.18 0.3938 0.00 Level 1 (Student) 13.39 0.60 0.0000 NA Type3TestEffect FValue p
Condition 52.29 0.0000 Site 6.19 0.0039 Condition*site 1.11 0.3368 REMA pretest school-mean centered 415.69 0.0000 REMA pretest school mean 18.59 0.0001 Age at Time 2 27.92 0.0000 Age interval between Time 2 and Time 1 0.00 0.9777 Test Lag from School Start to Pretest 0.01 0.9160 Ethnicity: Black 6.33 0.0120 Ethnicity: White 0.57 0.4486 Ethnicity: Hispanic 0.60 0.4388 English Language Learner Status 1.03 0.3112 Gender (Male) 3.38 0.0664 Parent Education 5.06 0.0247
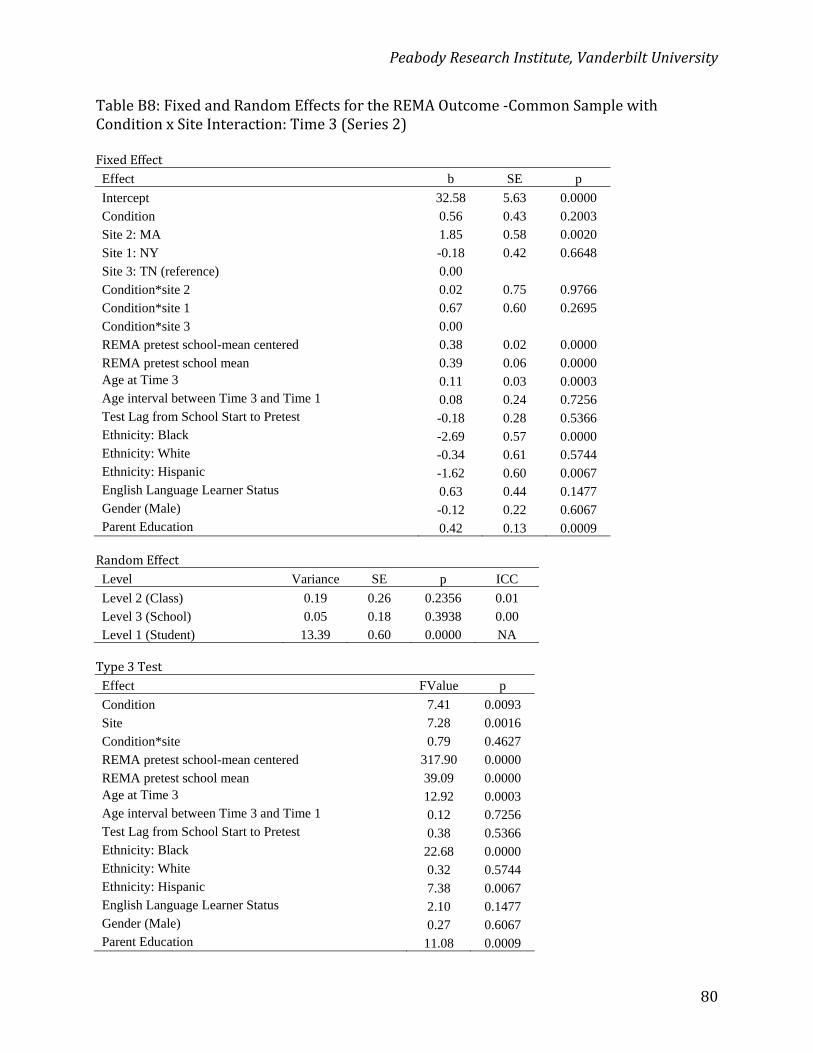
PeabodyResearchInstitute,VanderbiltUniversity
80
TableB8:FixedandRandomEffectsfortheREMAOutcome‐CommonSamplewithConditionxSiteInteraction:Time3(Series2)FixedEffectEffect b SE p
Intercept 32.58 5.63 0.0000 Condition 0.56 0.43 0.2003 Site 2: MA 1.85 0.58 0.0020 Site 1: NY -0.18 0.42 0.6648 Site 3: TN (reference) 0.00 Condition*site 2 0.02 0.75 0.9766 Condition*site 1 0.67 0.60 0.2695 Condition*site 3 0.00 REMA pretest school-mean centered 0.38 0.02 0.0000 REMA pretest school mean 0.39 0.06 0.0000 Age at Time 3 0.11 0.03 0.0003 Age interval between Time 3 and Time 1 0.08 0.24 0.7256 Test Lag from School Start to Pretest -0.18 0.28 0.5366 Ethnicity: Black -2.69 0.57 0.0000 Ethnicity: White -0.34 0.61 0.5744 Ethnicity: Hispanic -1.62 0.60 0.0067 English Language Learner Status 0.63 0.44 0.1477 Gender (Male) -0.12 0.22 0.6067 Parent Education 0.42 0.13 0.0009 RandomEffectLevel Variance SE p ICC
Level 2 (Class) 0.19 0.26 0.2356 0.01 Level 3 (School) 0.05 0.18 0.3938 0.00 Level 1 (Student) 13.39 0.60 0.0000 NA Type3TestEffect FValue p
Condition 7.41 0.0093 Site 7.28 0.0016 Condition*site 0.79 0.4627 REMA pretest school-mean centered 317.90 0.0000 REMA pretest school mean 39.09 0.0000 Age at Time 3 12.92 0.0003 Age interval between Time 3 and Time 1 0.12 0.7256 Test Lag from School Start to Pretest 0.38 0.5366 Ethnicity: Black 22.68 0.0000 Ethnicity: White 0.32 0.5744 Ethnicity: Hispanic 7.38 0.0067 English Language Learner Status 2.10 0.1477 Gender (Male) 0.27 0.6067 Parent Education 11.08 0.0009
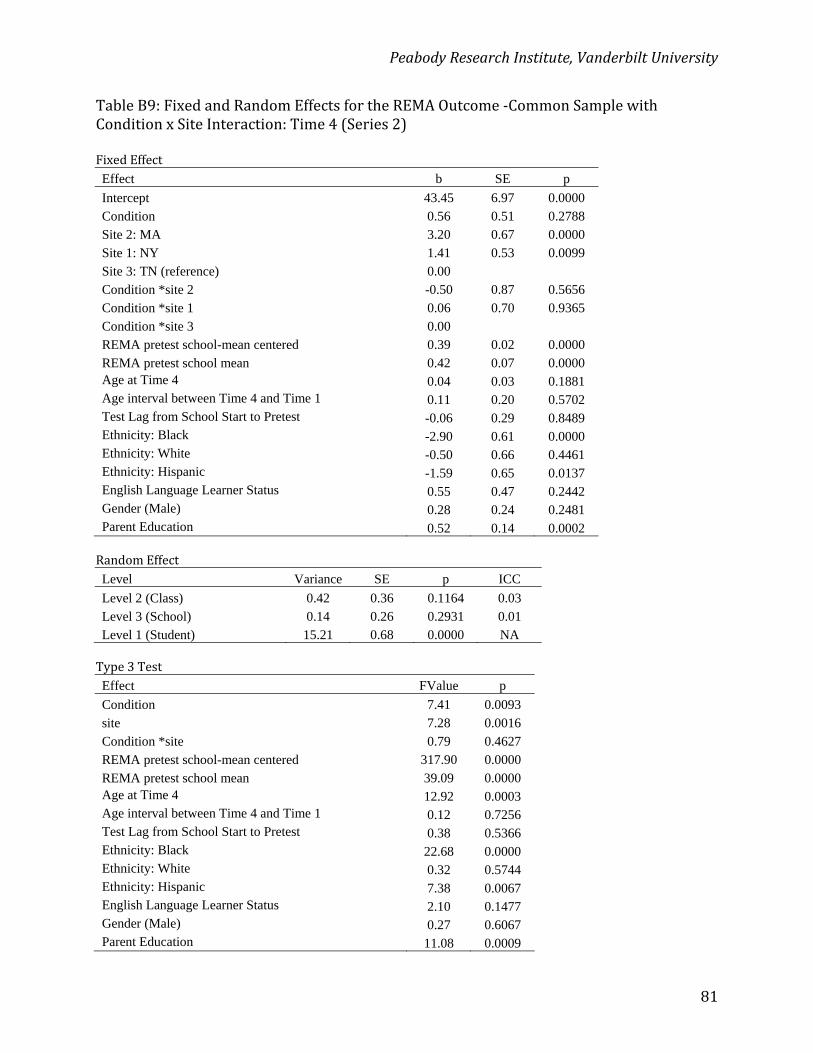
PeabodyResearchInstitute,VanderbiltUniversity
81
TableB9:FixedandRandomEffectsfortheREMAOutcome‐CommonSamplewithConditionxSiteInteraction:Time4(Series2)FixedEffectEffect b SE p
Intercept 43.45 6.97 0.0000 Condition 0.56 0.51 0.2788 Site 2: MA 3.20 0.67 0.0000 Site 1: NY 1.41 0.53 0.0099 Site 3: TN (reference) 0.00 Condition *site 2 -0.50 0.87 0.5656 Condition *site 1 0.06 0.70 0.9365 Condition *site 3 0.00 REMA pretest school-mean centered 0.39 0.02 0.0000 REMA pretest school mean 0.42 0.07 0.0000 Age at Time 4 0.04 0.03 0.1881 Age interval between Time 4 and Time 1 0.11 0.20 0.5702 Test Lag from School Start to Pretest -0.06 0.29 0.8489 Ethnicity: Black -2.90 0.61 0.0000 Ethnicity: White -0.50 0.66 0.4461 Ethnicity: Hispanic -1.59 0.65 0.0137 English Language Learner Status 0.55 0.47 0.2442 Gender (Male) 0.28 0.24 0.2481 Parent Education 0.52 0.14 0.0002 RandomEffectLevel Variance SE p ICC
Level 2 (Class) 0.42 0.36 0.1164 0.03 Level 3 (School) 0.14 0.26 0.2931 0.01 Level 1 (Student) 15.21 0.68 0.0000 NA Type3TestEffect FValue p
Condition 7.41 0.0093 site 7.28 0.0016 Condition *site 0.79 0.4627 REMA pretest school-mean centered 317.90 0.0000 REMA pretest school mean 39.09 0.0000 Age at Time 4 12.92 0.0003 Age interval between Time 4 and Time 1 0.12 0.7256 Test Lag from School Start to Pretest 0.38 0.5366 Ethnicity: Black 22.68 0.0000 Ethnicity: White 0.32 0.5744 Ethnicity: Hispanic 7.38 0.0067 English Language Learner Status 2.10 0.1477 Gender (Male) 0.27 0.6067 Parent Education 11.08 0.0009
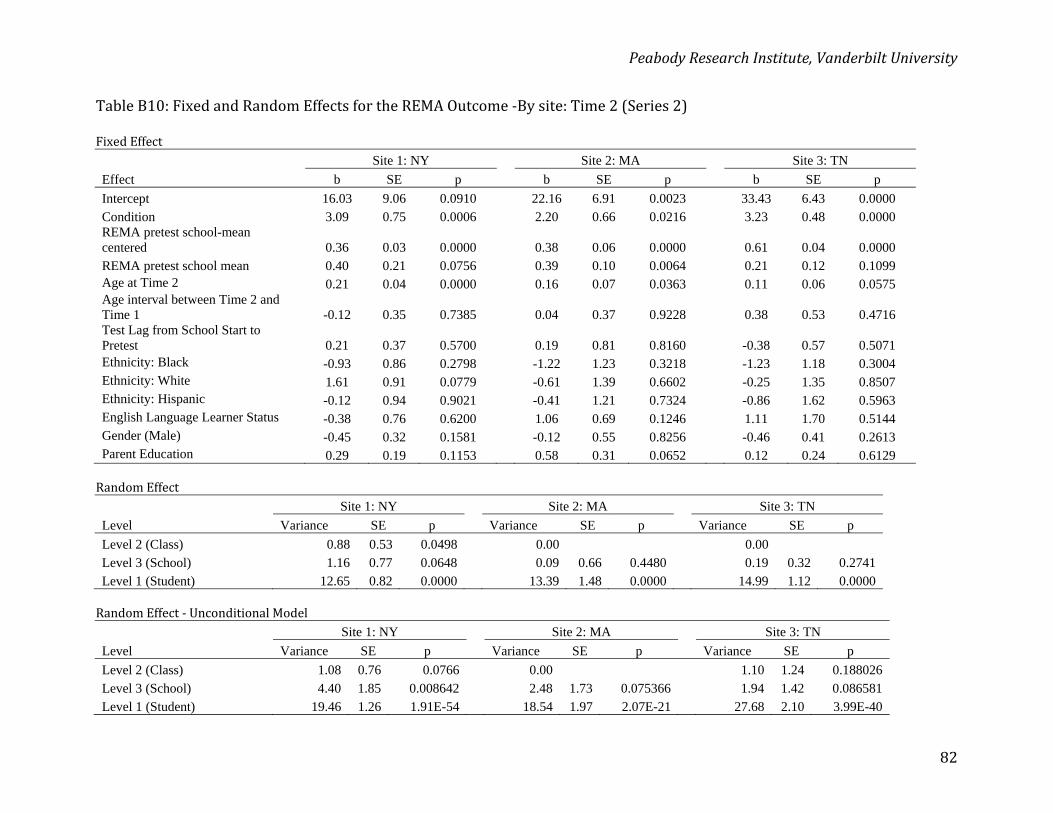
PeabodyResearchInstitute,VanderbiltUniversity
82
TableB10:FixedandRandomEffectsfortheREMAOutcome‐Bysite:Time2(Series2)FixedEffect Site 1: NY Site 2: MA Site 3: TN
Effect b SE p b SE p b SE p
Intercept 16.03 9.06 0.0910 22.16 6.91 0.0023 33.43 6.43 0.0000 Condition 3.09 0.75 0.0006 2.20 0.66 0.0216 3.23 0.48 0.0000 REMA pretest school-mean centered 0.36 0.03 0.0000 0.38 0.06 0.0000 0.61 0.04 0.0000 REMA pretest school mean 0.40 0.21 0.0756 0.39 0.10 0.0064 0.21 0.12 0.1099 Age at Time 2 0.21 0.04 0.0000 0.16 0.07 0.0363 0.11 0.06 0.0575 Age interval between Time 2 and Time 1 -0.12 0.35 0.7385 0.04 0.37 0.9228 0.38 0.53 0.4716 Test Lag from School Start to Pretest 0.21 0.37 0.5700 0.19 0.81 0.8160 -0.38 0.57 0.5071 Ethnicity: Black -0.93 0.86 0.2798 -1.22 1.23 0.3218 -1.23 1.18 0.3004 Ethnicity: White 1.61 0.91 0.0779 -0.61 1.39 0.6602 -0.25 1.35 0.8507 Ethnicity: Hispanic -0.12 0.94 0.9021 -0.41 1.21 0.7324 -0.86 1.62 0.5963 English Language Learner Status -0.38 0.76 0.6200 1.06 0.69 0.1246 1.11 1.70 0.5144 Gender (Male) -0.45 0.32 0.1581 -0.12 0.55 0.8256 -0.46 0.41 0.2613 Parent Education 0.29 0.19 0.1153 0.58 0.31 0.0652 0.12 0.24 0.6129 RandomEffect
Level
Site 1: NY Site 2: MA Site 3: TN
Variance SE p Variance SE p Variance SE p
Level 2 (Class) 0.88 0.53 0.0498 0.00 0.00 Level 3 (School) 1.16 0.77 0.0648 0.09 0.66 0.4480 0.19 0.32 0.2741 Level 1 (Student) 12.65 0.82 0.0000 13.39 1.48 0.0000 14.99 1.12 0.0000 RandomEffect‐UnconditionalModel
Level
Site 1: NY Site 2: MA Site 3: TN
Variance SE p Variance SE p Variance SE p
Level 2 (Class) 1.08 0.76 0.0766 0.00 1.10 1.24 0.188026 Level 3 (School) 4.40 1.85 0.008642 2.48 1.73 0.075366 1.94 1.42 0.086581 Level 1 (Student) 19.46 1.26 1.91E-54 18.54 1.97 2.07E-21 27.68 2.10 3.99E-40
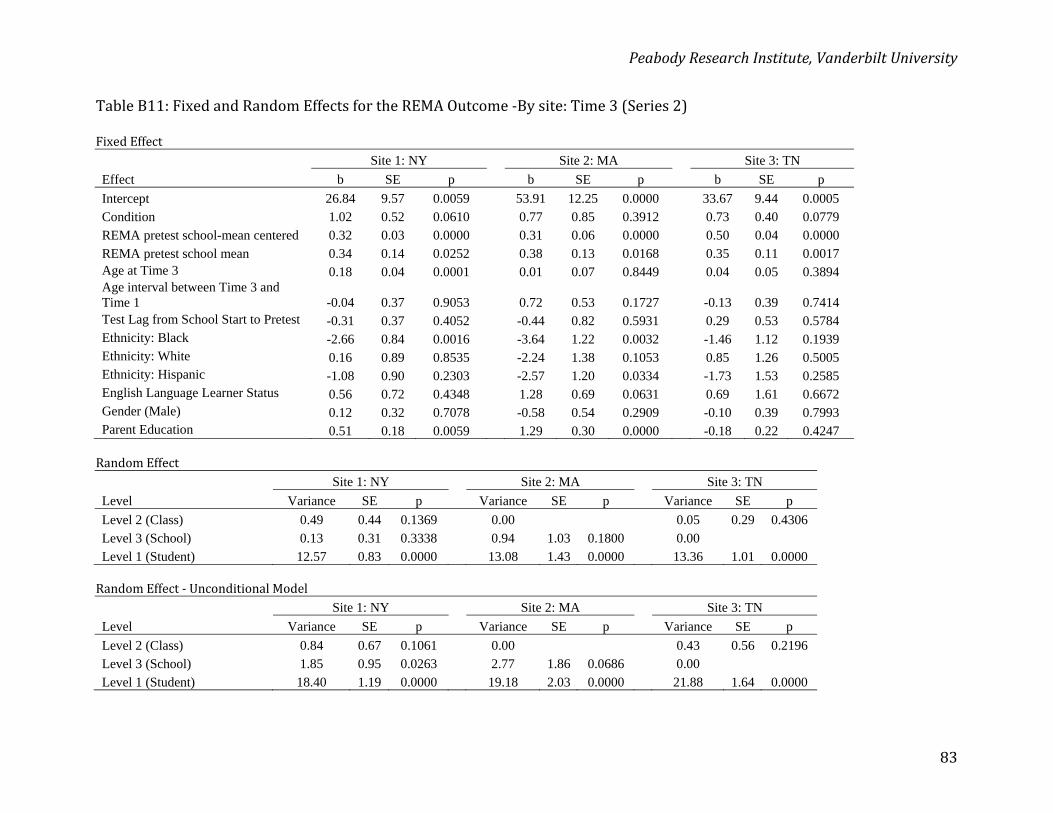
PeabodyResearchInstitute,VanderbiltUniversity
83
TableB11:FixedandRandomEffectsfortheREMAOutcome‐Bysite:Time3(Series2)FixedEffect Site 1: NY Site 2: MA Site 3: TN
Effect b SE p b SE p b SE p
Intercept 26.84 9.57 0.0059 53.91 12.25 0.0000 33.67 9.44 0.0005 Condition 1.02 0.52 0.0610 0.77 0.85 0.3912 0.73 0.40 0.0779 REMA pretest school-mean centered 0.32 0.03 0.0000 0.31 0.06 0.0000 0.50 0.04 0.0000 REMA pretest school mean 0.34 0.14 0.0252 0.38 0.13 0.0168 0.35 0.11 0.0017 Age at Time 3 0.18 0.04 0.0001 0.01 0.07 0.8449 0.04 0.05 0.3894 Age interval between Time 3 and Time 1 -0.04 0.37 0.9053 0.72 0.53 0.1727 -0.13 0.39 0.7414 Test Lag from School Start to Pretest -0.31 0.37 0.4052 -0.44 0.82 0.5931 0.29 0.53 0.5784 Ethnicity: Black -2.66 0.84 0.0016 -3.64 1.22 0.0032 -1.46 1.12 0.1939 Ethnicity: White 0.16 0.89 0.8535 -2.24 1.38 0.1053 0.85 1.26 0.5005 Ethnicity: Hispanic -1.08 0.90 0.2303 -2.57 1.20 0.0334 -1.73 1.53 0.2585 English Language Learner Status 0.56 0.72 0.4348 1.28 0.69 0.0631 0.69 1.61 0.6672 Gender (Male) 0.12 0.32 0.7078 -0.58 0.54 0.2909 -0.10 0.39 0.7993 Parent Education 0.51 0.18 0.0059 1.29 0.30 0.0000 -0.18 0.22 0.4247 RandomEffect
Level
Site 1: NY Site 2: MA Site 3: TN
Variance SE p Variance SE p Variance SE p
Level 2 (Class) 0.49 0.44 0.1369 0.00 0.05 0.29 0.4306 Level 3 (School) 0.13 0.31 0.3338 0.94 1.03 0.1800 0.00 Level 1 (Student) 12.57 0.83 0.0000 13.08 1.43 0.0000 13.36 1.01 0.0000 RandomEffect‐UnconditionalModel
Level
Site 1: NY Site 2: MA Site 3: TN
Variance SE p Variance SE p Variance SE p
Level 2 (Class) 0.84 0.67 0.1061 0.00 0.43 0.56 0.2196 Level 3 (School) 1.85 0.95 0.0263 2.77 1.86 0.0686 0.00 Level 1 (Student) 18.40 1.19 0.0000 19.18 2.03 0.0000 21.88 1.64 0.0000
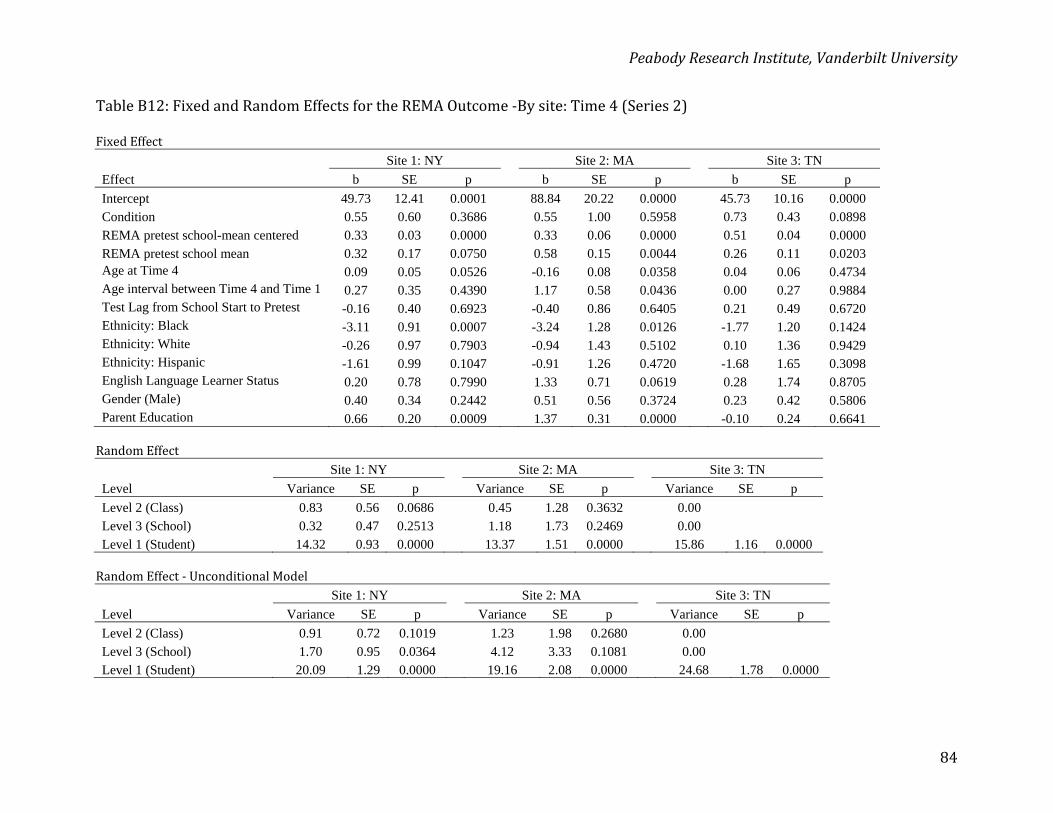
PeabodyResearchInstitute,VanderbiltUniversity
84
TableB12:FixedandRandomEffectsfortheREMAOutcome‐Bysite:Time4(Series2)FixedEffect Site 1: NY Site 2: MA Site 3: TN
Effect b SE p b SE p b SE p
Intercept 49.73 12.41 0.0001 88.84 20.22 0.0000 45.73 10.16 0.0000 Condition 0.55 0.60 0.3686 0.55 1.00 0.5958 0.73 0.43 0.0898 REMA pretest school-mean centered 0.33 0.03 0.0000 0.33 0.06 0.0000 0.51 0.04 0.0000 REMA pretest school mean 0.32 0.17 0.0750 0.58 0.15 0.0044 0.26 0.11 0.0203 Age at Time 4 0.09 0.05 0.0526 -0.16 0.08 0.0358 0.04 0.06 0.4734 Age interval between Time 4 and Time 1 0.27 0.35 0.4390 1.17 0.58 0.0436 0.00 0.27 0.9884 Test Lag from School Start to Pretest -0.16 0.40 0.6923 -0.40 0.86 0.6405 0.21 0.49 0.6720 Ethnicity: Black -3.11 0.91 0.0007 -3.24 1.28 0.0126 -1.77 1.20 0.1424 Ethnicity: White -0.26 0.97 0.7903 -0.94 1.43 0.5102 0.10 1.36 0.9429 Ethnicity: Hispanic -1.61 0.99 0.1047 -0.91 1.26 0.4720 -1.68 1.65 0.3098 English Language Learner Status 0.20 0.78 0.7990 1.33 0.71 0.0619 0.28 1.74 0.8705 Gender (Male) 0.40 0.34 0.2442 0.51 0.56 0.3724 0.23 0.42 0.5806 Parent Education 0.66 0.20 0.0009 1.37 0.31 0.0000 -0.10 0.24 0.6641 RandomEffect
Level
Site 1: NY Site 2: MA Site 3: TN
Variance SE p Variance SE p Variance SE p
Level 2 (Class) 0.83 0.56 0.0686 0.45 1.28 0.3632 0.00 Level 3 (School) 0.32 0.47 0.2513 1.18 1.73 0.2469 0.00 Level 1 (Student) 14.32 0.93 0.0000 13.37 1.51 0.0000 15.86 1.16 0.0000 RandomEffect‐UnconditionalModel
Level
Site 1: NY Site 2: MA Site 3: TN
Variance SE p Variance SE p Variance SE p
Level 2 (Class) 0.91 0.72 0.1019 1.23 1.98 0.2680 0.00 Level 3 (School) 1.70 0.95 0.0364 4.12 3.33 0.1081 0.00 Level 1 (Student) 20.09 1.29 0.0000 19.16 2.08 0.0000 24.68 1.78 0.0000
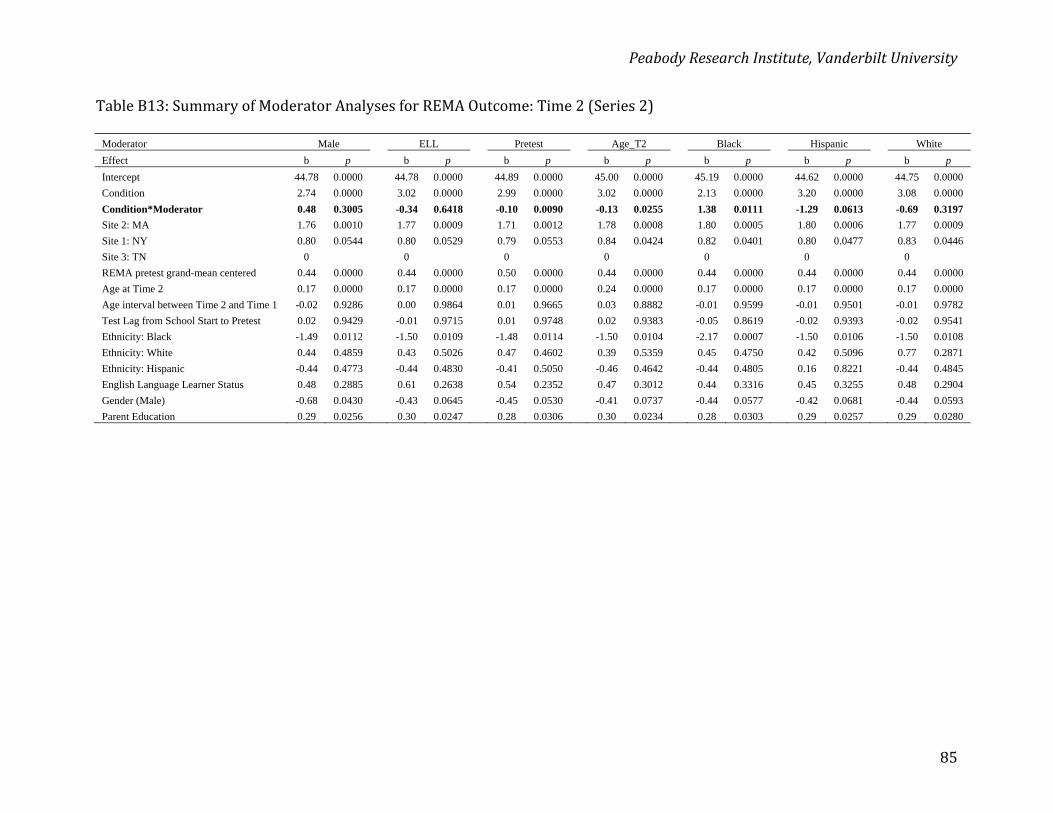
PeabodyResearchInstitute,VanderbiltUniversity
85
TableB13:SummaryofModeratorAnalysesforREMAOutcome:Time2(Series2)
Moderator Male ELL Pretest Age_T2 Black Hispanic White
Effect b p b p b p b p b p b p b p
Intercept 44.78 0.0000 44.78 0.0000 44.89 0.0000 45.00 0.0000 45.19 0.0000 44.62 0.0000 44.75 0.0000
Condition 2.74 0.0000 3.02 0.0000 2.99 0.0000 3.02 0.0000 2.13 0.0000 3.20 0.0000 3.08 0.0000
Condition*Moderator 0.48 0.3005 -0.34 0.6418 -0.10 0.0090 -0.13 0.0255 1.38 0.0111 -1.29 0.0613 -0.69 0.3197
Site 2: MA 1.76 0.0010 1.77 0.0009 1.71 0.0012 1.78 0.0008 1.80 0.0005 1.80 0.0006 1.77 0.0009
Site 1: NY 0.80 0.0544 0.80 0.0529 0.79 0.0553 0.84 0.0424 0.82 0.0401 0.80 0.0477 0.83 0.0446
Site 3: TN 0 0 0 0 0 0 0
REMA pretest grand-mean centered 0.44 0.0000 0.44 0.0000 0.50 0.0000 0.44 0.0000 0.44 0.0000 0.44 0.0000 0.44 0.0000
Age at Time 2 0.17 0.0000 0.17 0.0000 0.17 0.0000 0.24 0.0000 0.17 0.0000 0.17 0.0000 0.17 0.0000
Age interval between Time 2 and Time 1 -0.02 0.9286 0.00 0.9864 0.01 0.9665 0.03 0.8882 -0.01 0.9599 -0.01 0.9501 -0.01 0.9782
Test Lag from School Start to Pretest 0.02 0.9429 -0.01 0.9715 0.01 0.9748 0.02 0.9383 -0.05 0.8619 -0.02 0.9393 -0.02 0.9541
Ethnicity: Black -1.49 0.0112 -1.50 0.0109 -1.48 0.0114 -1.50 0.0104 -2.17 0.0007 -1.50 0.0106 -1.50 0.0108
Ethnicity: White 0.44 0.4859 0.43 0.5026 0.47 0.4602 0.39 0.5359 0.45 0.4750 0.42 0.5096 0.77 0.2871
Ethnicity: Hispanic -0.44 0.4773 -0.44 0.4830 -0.41 0.5050 -0.46 0.4642 -0.44 0.4805 0.16 0.8221 -0.44 0.4845
English Language Learner Status 0.48 0.2885 0.61 0.2638 0.54 0.2352 0.47 0.3012 0.44 0.3316 0.45 0.3255 0.48 0.2904
Gender (Male) -0.68 0.0430 -0.43 0.0645 -0.45 0.0530 -0.41 0.0737 -0.44 0.0577 -0.42 0.0681 -0.44 0.0593
Parent Education 0.29 0.0256 0.30 0.0247 0.28 0.0306 0.30 0.0234 0.28 0.0303 0.29 0.0257 0.29 0.0280
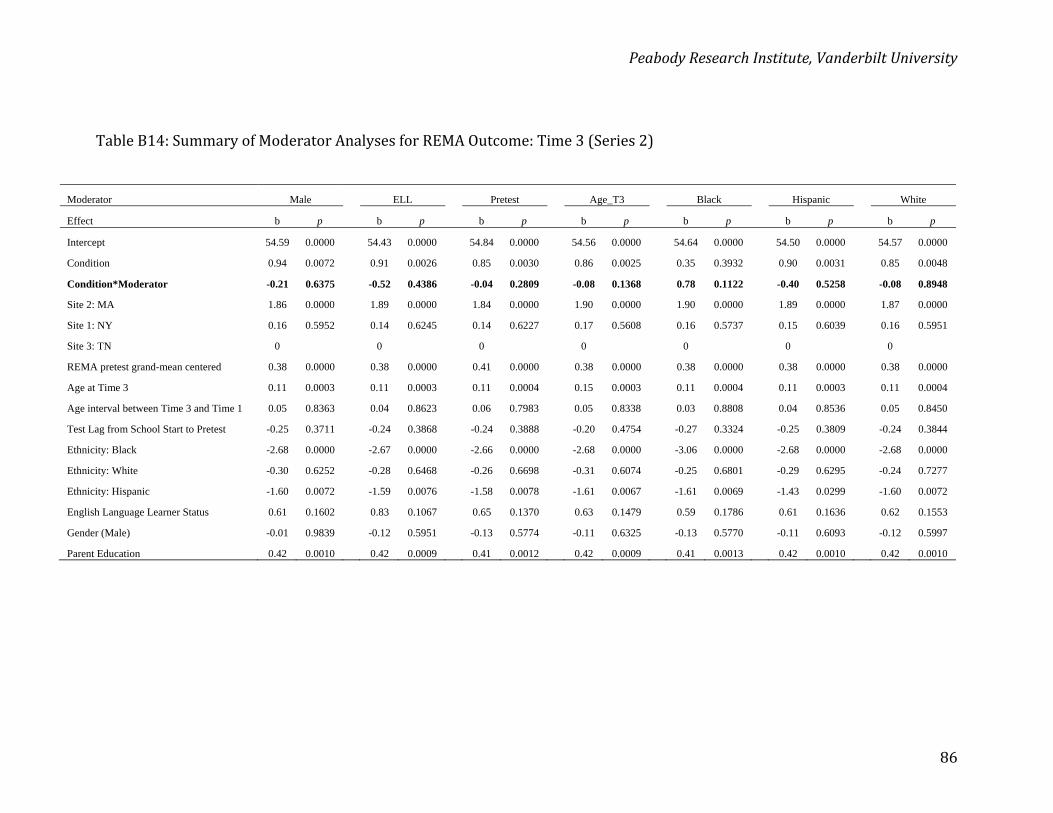
PeabodyResearchInstitute,VanderbiltUniversity
86
TableB14:SummaryofModeratorAnalysesforREMAOutcome:Time3(Series2)
Moderator Male ELL Pretest Age_T3 Black Hispanic White
Effect b p b p b p b p b p b p b p
Intercept 54.59 0.0000 54.43 0.0000 54.84 0.0000 54.56 0.0000 54.64 0.0000 54.50 0.0000 54.57 0.0000
Condition 0.94 0.0072 0.91 0.0026 0.85 0.0030 0.86 0.0025 0.35 0.3932 0.90 0.0031 0.85 0.0048
Condition*Moderator -0.21 0.6375 -0.52 0.4386 -0.04 0.2809 -0.08 0.1368 0.78 0.1122 -0.40 0.5258 -0.08 0.8948
Site 2: MA 1.86 0.0000 1.89 0.0000 1.84 0.0000 1.90 0.0000 1.90 0.0000 1.89 0.0000 1.87 0.0000
Site 1: NY 0.16 0.5952 0.14 0.6245 0.14 0.6227 0.17 0.5608 0.16 0.5737 0.15 0.6039 0.16 0.5951
Site 3: TN 0 0 0 0 0 0 0
REMA pretest grand-mean centered 0.38 0.0000 0.38 0.0000 0.41 0.0000 0.38 0.0000 0.38 0.0000 0.38 0.0000 0.38 0.0000
Age at Time 3 0.11 0.0003 0.11 0.0003 0.11 0.0004 0.15 0.0003 0.11 0.0004 0.11 0.0003 0.11 0.0004
Age interval between Time 3 and Time 1 0.05 0.8363 0.04 0.8623 0.06 0.7983 0.05 0.8338 0.03 0.8808 0.04 0.8536 0.05 0.8450
Test Lag from School Start to Pretest -0.25 0.3711 -0.24 0.3868 -0.24 0.3888 -0.20 0.4754 -0.27 0.3324 -0.25 0.3809 -0.24 0.3844
Ethnicity: Black -2.68 0.0000 -2.67 0.0000 -2.66 0.0000 -2.68 0.0000 -3.06 0.0000 -2.68 0.0000 -2.68 0.0000
Ethnicity: White -0.30 0.6252 -0.28 0.6468 -0.26 0.6698 -0.31 0.6074 -0.25 0.6801 -0.29 0.6295 -0.24 0.7277
Ethnicity: Hispanic -1.60 0.0072 -1.59 0.0076 -1.58 0.0078 -1.61 0.0067 -1.61 0.0069 -1.43 0.0299 -1.60 0.0072
English Language Learner Status 0.61 0.1602 0.83 0.1067 0.65 0.1370 0.63 0.1479 0.59 0.1786 0.61 0.1636 0.62 0.1553
Gender (Male) -0.01 0.9839 -0.12 0.5951 -0.13 0.5774 -0.11 0.6325 -0.13 0.5770 -0.11 0.6093 -0.12 0.5997
Parent Education 0.42 0.0010 0.42 0.0009 0.41 0.0012 0.42 0.0009 0.41 0.0013 0.42 0.0010 0.42 0.0010
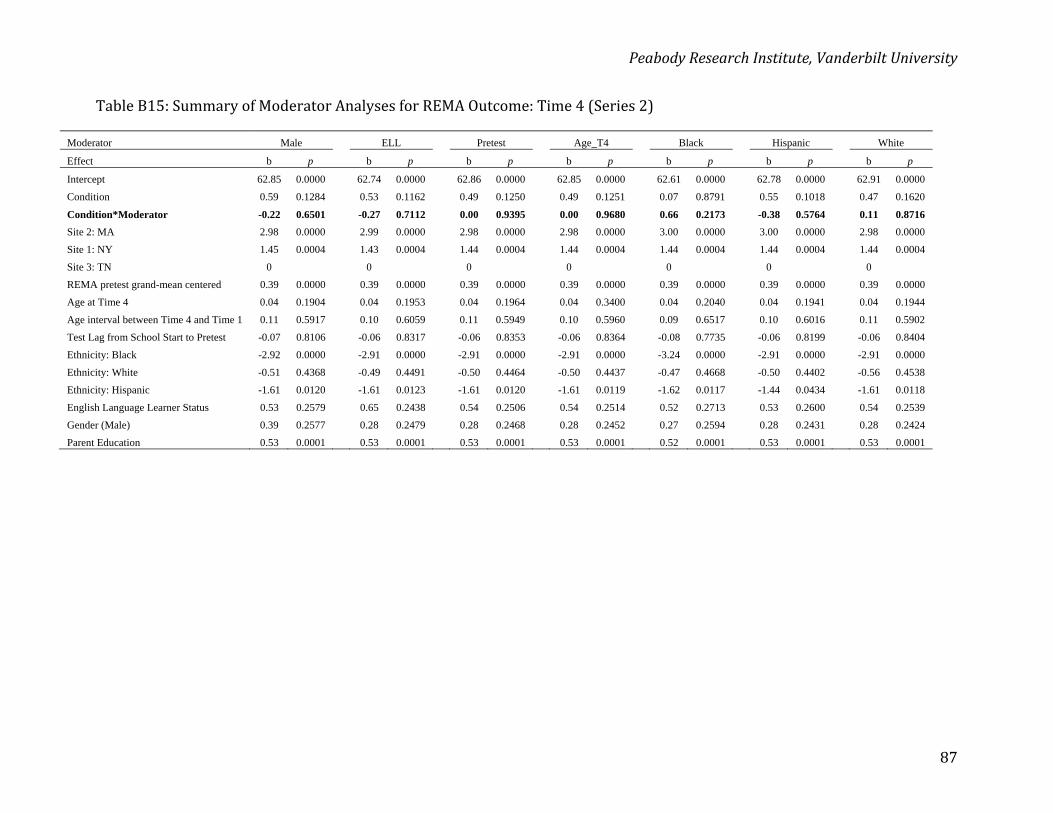
PeabodyResearchInstitute,VanderbiltUniversity
87
TableB15:SummaryofModeratorAnalysesforREMAOutcome:Time4(Series2)
Moderator Male ELL Pretest Age_T4 Black Hispanic White
Effect b p b p b p b p b p b p b p
Intercept 62.85 0.0000 62.74 0.0000 62.86 0.0000 62.85 0.0000 62.61 0.0000 62.78 0.0000 62.91 0.0000
Condition 0.59 0.1284 0.53 0.1162 0.49 0.1250 0.49 0.1251 0.07 0.8791 0.55 0.1018 0.47 0.1620
Condition*Moderator -0.22 0.6501 -0.27 0.7112 0.00 0.9395 0.00 0.9680 0.66 0.2173 -0.38 0.5764 0.11 0.8716
Site 2: MA 2.98 0.0000 2.99 0.0000 2.98 0.0000 2.98 0.0000 3.00 0.0000 3.00 0.0000 2.98 0.0000
Site 1: NY 1.45 0.0004 1.43 0.0004 1.44 0.0004 1.44 0.0004 1.44 0.0004 1.44 0.0004 1.44 0.0004
Site 3: TN 0 0 0 0 0 0 0
REMA pretest grand-mean centered 0.39 0.0000 0.39 0.0000 0.39 0.0000 0.39 0.0000 0.39 0.0000 0.39 0.0000 0.39 0.0000
Age at Time 4 0.04 0.1904 0.04 0.1953 0.04 0.1964 0.04 0.3400 0.04 0.2040 0.04 0.1941 0.04 0.1944
Age interval between Time 4 and Time 1 0.11 0.5917 0.10 0.6059 0.11 0.5949 0.10 0.5960 0.09 0.6517 0.10 0.6016 0.11 0.5902
Test Lag from School Start to Pretest -0.07 0.8106 -0.06 0.8317 -0.06 0.8353 -0.06 0.8364 -0.08 0.7735 -0.06 0.8199 -0.06 0.8404
Ethnicity: Black -2.92 0.0000 -2.91 0.0000 -2.91 0.0000 -2.91 0.0000 -3.24 0.0000 -2.91 0.0000 -2.91 0.0000
Ethnicity: White -0.51 0.4368 -0.49 0.4491 -0.50 0.4464 -0.50 0.4437 -0.47 0.4668 -0.50 0.4402 -0.56 0.4538
Ethnicity: Hispanic -1.61 0.0120 -1.61 0.0123 -1.61 0.0120 -1.61 0.0119 -1.62 0.0117 -1.44 0.0434 -1.61 0.0118
English Language Learner Status 0.53 0.2579 0.65 0.2438 0.54 0.2506 0.54 0.2514 0.52 0.2713 0.53 0.2600 0.54 0.2539
Gender (Male) 0.39 0.2577 0.28 0.2479 0.28 0.2468 0.28 0.2452 0.27 0.2594 0.28 0.2431 0.28 0.2424
Parent Education 0.53 0.0001 0.53 0.0001 0.53 0.0001 0.53 0.0001 0.52 0.0001 0.53 0.0001 0.53 0.0001
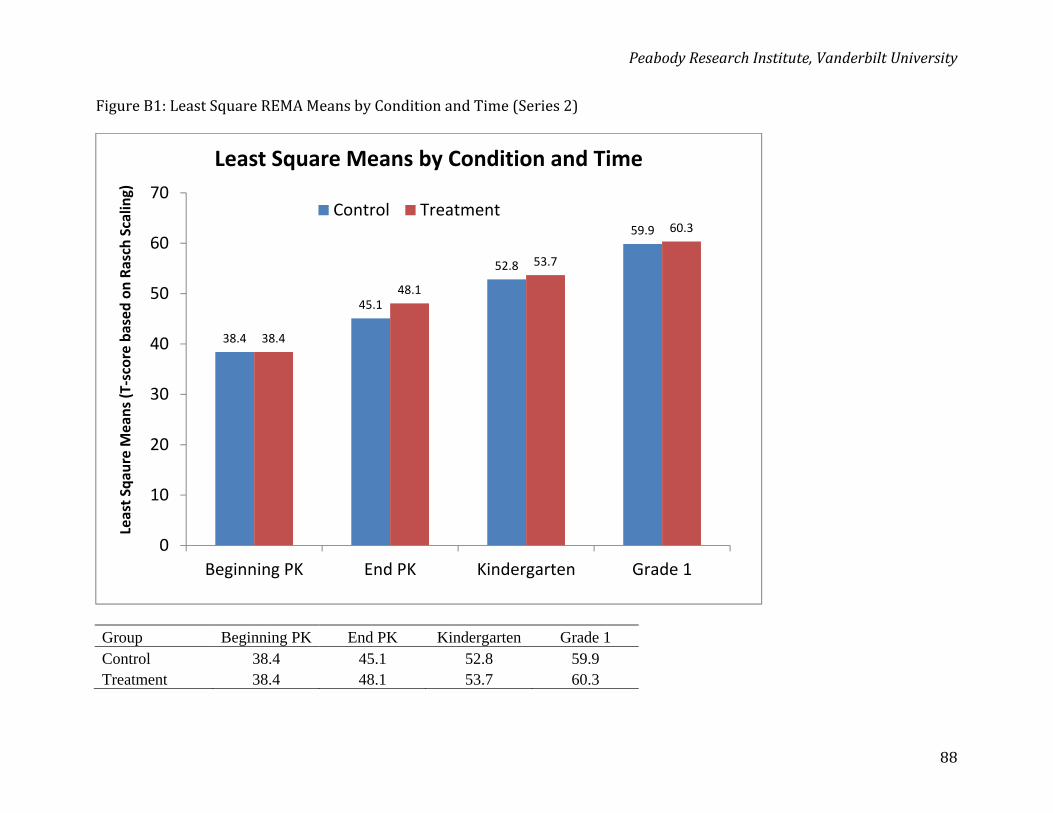
PeabodyResearchInstitute,VanderbiltUniversity
88
FigureB1:LeastSquareREMAMeansbyConditionandTime(Series2)
Group Beginning PK End PK Kindergarten Grade 1 Control 38.4 45.1 52.8 59.9 Treatment 38.4 48.1 53.7 60.3
38.4
45.1
52.8
59.9
38.4
48.1
53.7
60.3
0
10
20
30
40
50
60
70
Beginning PK End PK Kindergarten Grade 1
Least Sqau
re M
ean
s (T‐score based on Rasch Scalin
g)
Least Square Means by Condition and Time
Control Treatment
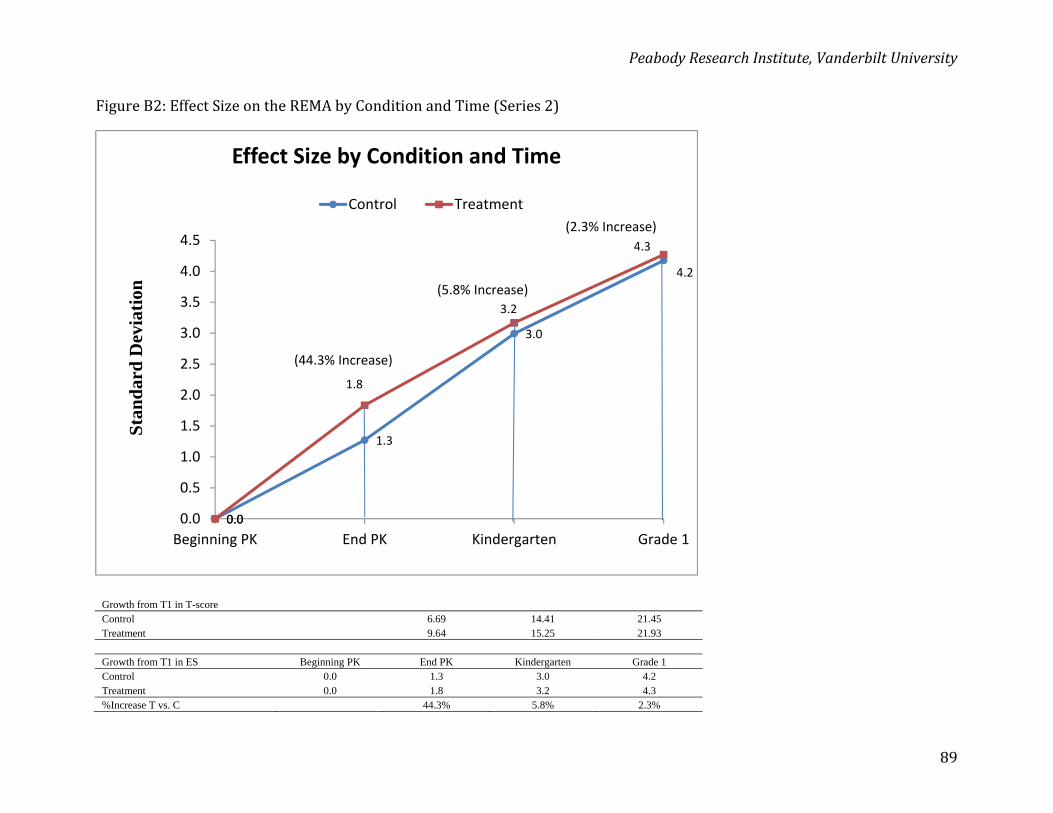
PeabodyResearchInstitute,VanderbiltUniversity
89
FigureB2:EffectSizeontheREMAbyConditionandTime(Series2)
Growth from T1 in T-score Control 6.69 14.41 21.45 Treatment 9.64 15.25 21.93
Growth from T1 in ES Beginning PK End PK Kindergarten Grade 1 Control 0.0 1.3 3.0 4.2 Treatment 0.0 1.8 3.2 4.3 %Increase T vs. C 44.3% 5.8% 2.3%
0.0
1.3
3.0
4.2
0.0
1.8
3.2
4.3
0.0
0.5
1.0
1.5
2.0
2.5
3.0
3.5
4.0
4.5
Beginning PK End PK Kindergarten Grade 1
Sta
nd
ard
Dev
iati
onEffect Size by Condition and Time
Control Treatment
(44.3% Increase)
(5.8% Increase)
(2.3% Increase)
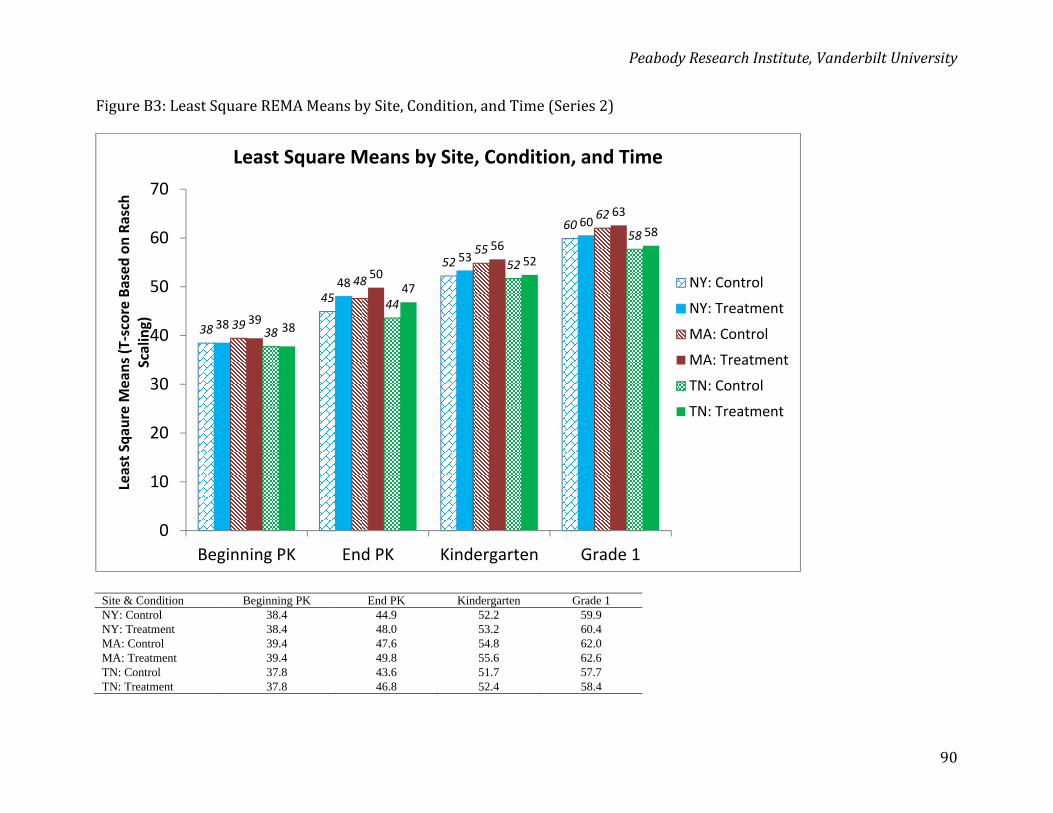
PeabodyResearchInstitute,VanderbiltUniversity
90
FigureB3:LeastSquareREMAMeansbySite,Condition,andTime(Series2)
Site & Condition Beginning PK End PK Kindergarten Grade 1 NY: Control 38.4 44.9 52.2 59.9NY: Treatment 38.4 48.0 53.2 60.4 MA: Control 39.4 47.6 54.8 62.0 MA: Treatment 39.4 49.8 55.6 62.6 TN: Control 37.8 43.6 51.7 57.7 TN: Treatment 37.8 46.8 52.4 58.4
38
45
52
60
38
48
53
60
39
48
55
62
39
50
56
63
38
44
52
58
38
47
52
58
0
10
20
30
40
50
60
70
Beginning PK End PK Kindergarten Grade 1
Least Sqau
re M
ean
s (T‐score Based on Rasch
Scaling)
Least Square Means by Site, Condition, and Time
NY: Control
NY: Treatment
MA: Control
MA: Treatment
TN: Control
TN: Treatment