Embed Size (px)
Citation preview
October 28, 2015
Results of PEMEX1 as of September 30, 20152
Third Quarter 2015 (net of IEPS)
2014 2015 Variation
2015 Highlights (MXN billion) (USD billion)
Total Sales 416.3 314.9 -24.4% 18.5 Total hydrocarbons production averaged 3.3 MMboed, and crude oil production decreased by 5.5%.
Operating Income 170.1 42.9 -74.8% 2.5 The average price of the Mexican crude oil basket decreased by 53.8%, from USD 90.42 to USD 41.75.
Net Income (Loss) (59.7) (167.6) 180.7% (9.9) EBITDA totaled MXN 119.9 billion (USD 7.1 billion).
Acronyms used: Special Tax on Production and Services (IEPS), thousand (M), million (MM), billion (MMM), thousand barrels per day (Mbd), thousand barrels of oil equivalent per day (Mboed), thousand cubic feet per day (Mcfd), thousand tons (Mt).
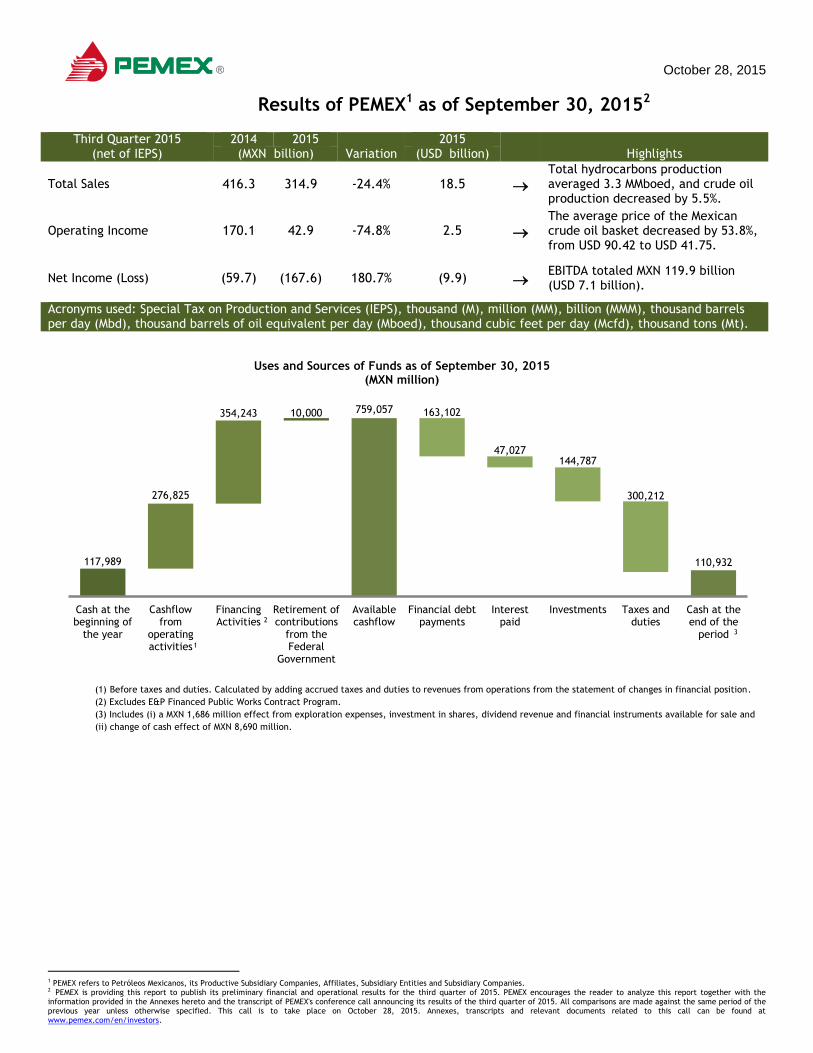
Uses and Sources of Funds as of September 30, 2015 (MXN million)
(1) Before taxes and duties. Calculated by adding accrued taxes and duties to revenues from operations from the statement of changes in financial position.
(2) Excludes E&P Financed Public Works Contract Program.
(3) Includes (i) a MXN 1,686 million effect from exploration expenses, investment in shares, dividend revenue and financial instruments available for sale and
(ii) change of cash effect of MXN 8,690 million.
1 PEMEX refers to Petróleos Mexicanos, its Productive Subsidiary Companies, Affiliates, Subsidiary Entities and Subsidiary Companies. 2 PEMEX is providing this report to publish its preliminary financial and operational results for the third quarter of 2015. PEMEX encourages the reader to analyze this report together with the information provided in the Annexes hereto and the transcript of PEMEX's conference call announcing its results of the third quarter of 2015. All comparisons are made against the same period of the previous year unless otherwise specified. This call is to take place on October 28, 2015. Annexes, transcripts and relevant documents related to this call can be found at www.pemex.com/en/investors.
117,989
276,825
354,243 10,000 759,057
110,932
163,102
47,027 144,787
300,212
Cash at thebeginning of
the year
Cashflowfrom
operatingactivities
FinancingActivities
Retirement ofcontributions
from theFederal
Government
Availablecashflow
Financial debtpayments
Interestpaid
Investments Taxes andduties
Cash at theend of the
period 3
2
1

PEMEX
PEMEX Results Report as of September 30, 2015 2 / 27 www.pemex.com
Operating Results
Exploration & Production 3Q15
Crude Oil Production During the third quarter of 2015, total crude oil production averaged 2,266 Mbd, a 5.5%, or 132 Mbd decrease as compared to the same period of 2014. This variation was primarily due to:
a 7.3% decrease in the production of heavy crude oil, as a result of the natural decline in production and an increase in the fractional water flow of wells in highly fractured deposits of the Cantarell business unit;
a 2.3% reduction in production of light crude oil, primarily due to a natural decline in production at the fields of the Bellota-Jujo business unit, as well as an increase in the fractional water flow of wells of the Samaria field in the Samaria-Luna business unit; and
a 7.1% decrease in extra-light crude oil production, mainly due to an increase in the fractional water flow of wells of the Sen and Terra fields of the Samaria-Luna business unit, a natural decline in production at the Pareto field of the Bellota-Jujo business unit, a natural decline in production at the Costero field, as well as an increase in the fractional water flow with high salt concentration of wells of the Teotleco and Juspí fields in the Macuspana-Muspac business unit of the Southern region. We would highlight the increase in production at the Xux field in the Southwestern Marine region that began production in June 2014, which increased production by 54% and contributed an average of 54 Mbd to total crude oil production during this quarter, as compared to the same period of 2014.
Moreover, the production volume deferred at fields of the Abkatún-Pol-Chuc business
Third quarter (Jul.-Sep.)
2014 2015 Change
Upstream
Total hydrocarbons (Mboed) 3,503 3,315 -5.4% (188)
Liquid hydrocarbons (Mbd) 2,441 2,306 -5.6% (136)
Crude oil (Mbd) 2,398 2,266 -5.5% (132)
Condensates (Mbd) 44 40 -8.9% (4)
Natural gas (MMcfd)(1) 6,513 6,405 -1.7% (108)
Downstream
Dry gas from plants (MMcfd)(2) 3,638 3,356 -7.8% (282)
Natural gas liquids (Mbd) 363 329 -9.3% (34)
Petroleum products (Mbd)(3) 1,329 1,207 -9.2% (122)
Petrochemical products (Mt) 1,244 1,058 -15.0% (187)
(1) Includes nitrogen.
PEMEX
Main Statistics of Production
(2) Does not include dry gas produced by Pemex-Refining and used as fuel by this subsidiary
entity.
(3) Includes LPG from Pemex-Gas and Basic Petrochemicals, Pemex-Exploration and
Production and Pemex-Refining.

PEMEX
PEMEX Results Report as of September 30, 2015 3 / 27 www.pemex.com
unit, as a result of the incident occurred at the Abkatún-A Permanente platform in April 2014, was completely restored.
Crude Oil Production (Mbd)
Crude Oil Production (Mbd)
Natural Gas Production
During the third quarter of 2015, total natural gas production decreased by 3.5%3, from 5,701 to 5,501 MMcfd, as a result of a 16.8% reduction in non-associated gas production during the period, mainly due to a scheduled reduction in drilling activities and the completion of wells in the Veracruz business unit of the Northern region, and a natural decline in production of fields in the Macuspana-Muspac business unit of the Southern Region. This decline was partially offset by a 2.7% increase in associated gas production, primarily due to:
a 199 MMcfd increase in associated gas production during the period at the Cantarell business unit in the Northeastern Marine region, and;
a 152 MMcfd increase in associated gas production at the Litoral de Tabasco business unit in the Southwestern Marine region, primarily driven by the development of the Tsimín and Xux fields.
Natural Gas Production
(MMcfd)
3 Does not include nitrogen.
51.4% 51.3% 50.6% 52.5% 50.4%
35.8% 37.0% 37.7% 35.8% 37.0%
12.8% 11.8% 11.8% 11.7% 12.5%
2,398 2,360 2,300 2,225 2,266
3Q14 4Q14 1Q15 2Q15 3Q15
Heavy Light Extra-light
78%
22%
Offshore Onshore
68.4% 68.7% 69.8% 70.2% 72.7%
31.6% 31.3% 30.2% 29.8% 27.3%
5,701 5,761 5,753 5,399 5,501
3Q14 4Q14 1Q15 2Q15 3Q15
Associated Non-Associated

PEMEX
PEMEX Results Report as of September 30, 2015 4 / 27 www.pemex.com
Natural Gas by Asset (MMcfd)
Natural Gas Production by Type of Field
3Q15
Gas Flaring During the third quarter of 2015, gas flaring increased by 509 MMcfd, primarily as a result of the incident that occurred at the Abkatún-A Permanente platform and delays in the completion of works for gas utilization on marine rigs. As a result, natural gas use as a percentage of production during the period amounted to 90.8%.
Gas Flaring
-
800
1,600
2,400
3,200
4,000
4,800
5,600
6,400
3Q14 4Q14 1Q15 2Q15 3Q15
Other
Cantarell
Abkatún-Pol Chuc
Veracruz
Samaria-Luna
Litoral de Tabasco
Burgos
26%
16%
16%
6%
21%
7%
8%
6,405
276 304 261
530 509
4.8% 5.3% 4.5%
9.8% 9.2%
3Q14 4Q14 1Q15 2Q15 3Q15
Gas Flaring (MMcfd) Gas Flaring / Total Gas Produced
47%
53%
Offshore Onshore
PEMEX
PEMEX Results Report as of September 30, 2015 5 / 27 www.pemex.com
Operational Infrastructure
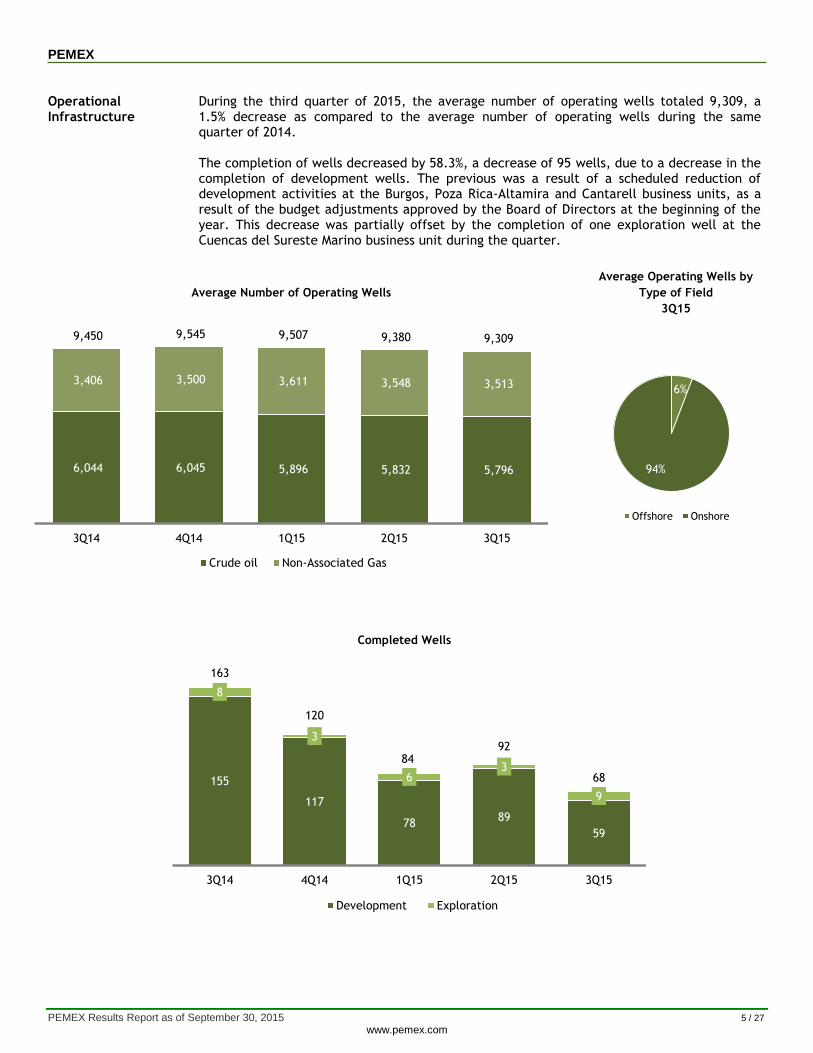
During the third quarter of 2015, the average number of operating wells totaled 9,309, a 1.5% decrease as compared to the average number of operating wells during the same quarter of 2014. The completion of wells decreased by 58.3%, a decrease of 95 wells, due to a decrease in the completion of development wells. The previous was a result of a scheduled reduction of development activities at the Burgos, Poza Rica-Altamira and Cantarell business units, as a result of the budget adjustments approved by the Board of Directors at the beginning of the year. This decrease was partially offset by the completion of one exploration well at the Cuencas del Sureste Marino business unit during the quarter.
Average Number of Operating Wells
Average Operating Wells by
Type of Field
3Q15
Completed Wells
6,044 6,045 5,896 5,832 5,796
3,406 3,500 3,611 3,548 3,513
9,450 9,545 9,507 9,380 9,309
3Q14 4Q14 1Q15 2Q15 3Q15
Crude oil Non-Associated Gas
6%
94%
Offshore Onshore
155
117
78 89
59
8
3
6 3
9
163
120
84 92
68
3Q14 4Q14 1Q15 2Q15 3Q15
Development Exploration
PEMEX
PEMEX Results Report as of September 30, 2015 6 / 27 www.pemex.com
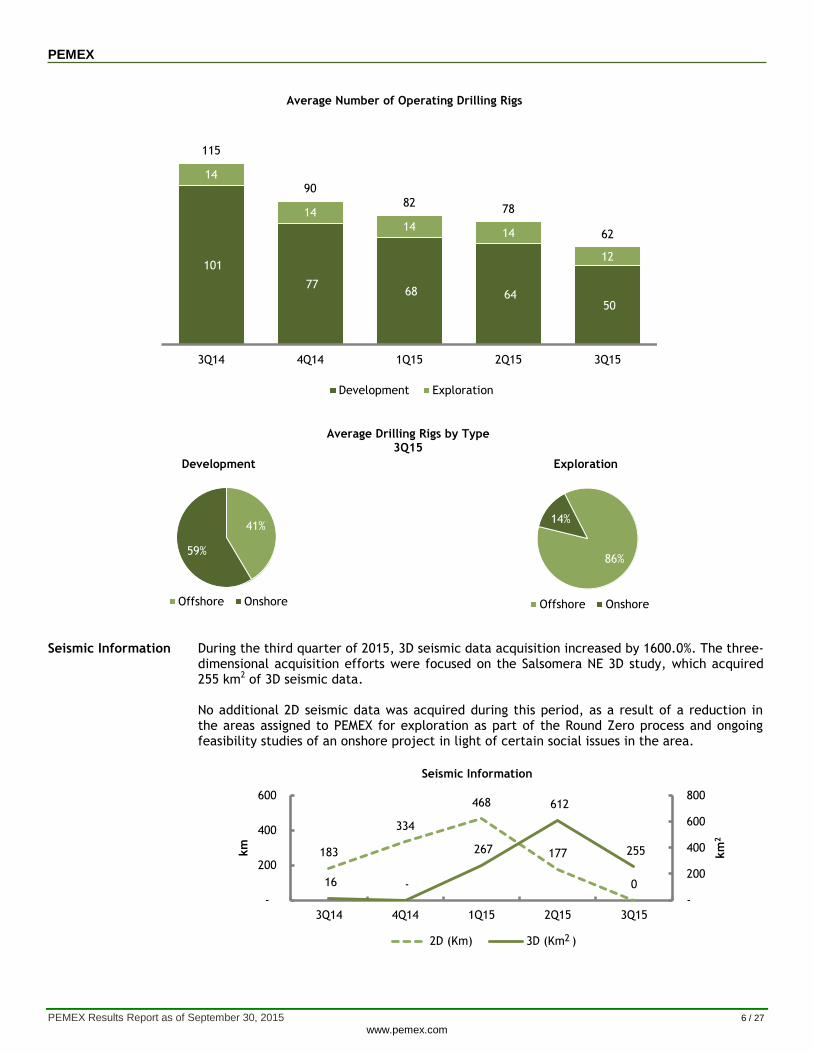
Average Number of Operating Drilling Rigs
Average Drilling Rigs by Type 3Q15
Seismic Information During the third quarter of 2015, 3D seismic data acquisition increased by 1600.0%. The three-dimensional acquisition efforts were focused on the Salsomera NE 3D study, which acquired 255 km2 of 3D seismic data. No additional 2D seismic data was acquired during this period, as a result of a reduction in the areas assigned to PEMEX for exploration as part of the Round Zero process and ongoing feasibility studies of an onshore project in light of certain social issues in the area.
Seismic Information
101
77 68 64
50
14
14
14 14
12
115
90
82 78
62
3Q14 4Q14 1Q15 2Q15 3Q15
Development Exploration
41%
59%
Development
Offshore Onshore
86%
14%
Exploration
Offshore Onshore
183
334
468
177
0 16 -
267
612
255
-
200
400
600
800
-
200
400
600
3Q14 4Q14 1Q15 2Q15 3Q15
km
2
km
2D (Km) 3D (Km )2
PEMEX
PEMEX Results Report as of September 30, 2015 7 / 27 www.pemex.com
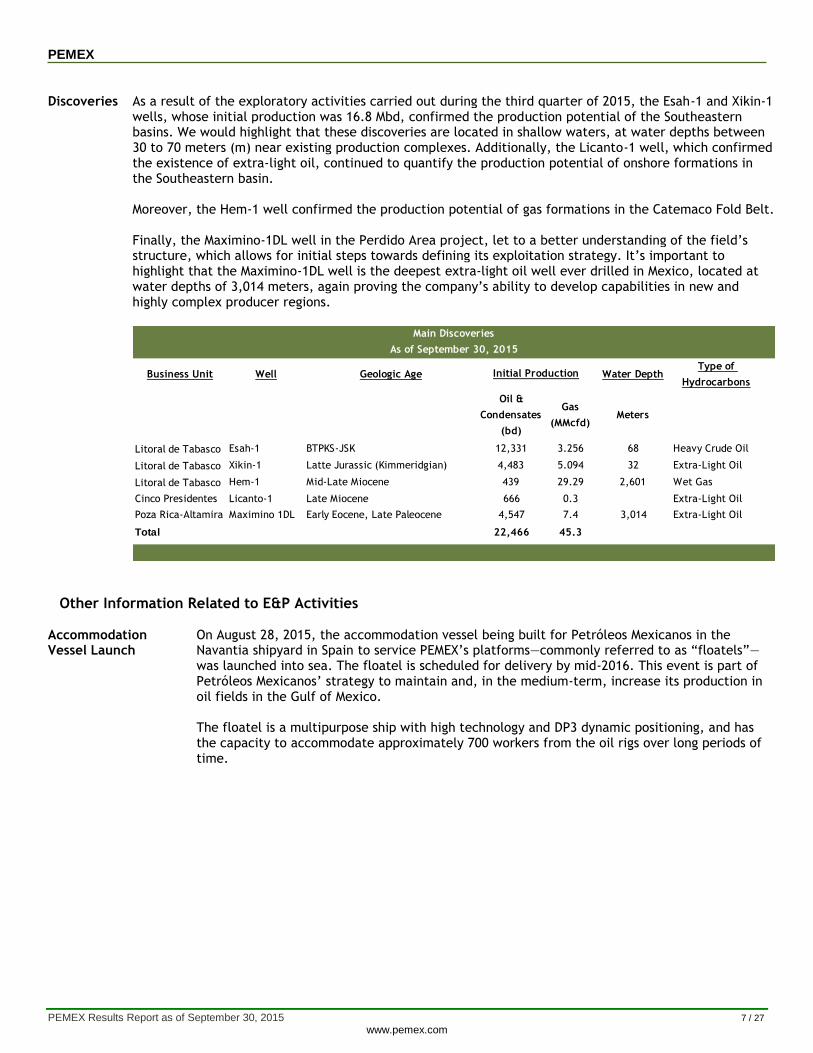
Discoveries
As a result of the exploratory activities carried out during the third quarter of 2015, the Esah-1 and Xikin-1 wells, whose initial production was 16.8 Mbd, confirmed the production potential of the Southeastern basins. We would highlight that these discoveries are located in shallow waters, at water depths between 30 to 70 meters (m) near existing production complexes. Additionally, the Licanto-1 well, which confirmed the existence of extra-light oil, continued to quantify the production potential of onshore formations in the Southeastern basin. Moreover, the Hem-1 well confirmed the production potential of gas formations in the Catemaco Fold Belt. Finally, the Maximino-1DL well in the Perdido Area project, let to a better understanding of the field’s structure, which allows for initial steps towards defining its exploitation strategy. It’s important to highlight that the Maximino-1DL well is the deepest extra-light oil well ever drilled in Mexico, located at water depths of 3,014 meters, again proving the company’s ability to develop capabilities in new and highly complex producer regions.
Other Information Related to E&P Activities
Accommodation Vessel Launch
On August 28, 2015, the accommodation vessel being built for Petróleos Mexicanos in the Navantia shipyard in Spain to service PEMEX’s platforms—commonly referred to as “floatels”—was launched into sea. The floatel is scheduled for delivery by mid-2016. This event is part of Petróleos Mexicanos’ strategy to maintain and, in the medium-term, increase its production in oil fields in the Gulf of Mexico. The floatel is a multipurpose ship with high technology and DP3 dynamic positioning, and has the capacity to accommodate approximately 700 workers from the oil rigs over long periods of time.
Business Unit Well Geologic Age Water DepthType of
Hydrocarbons
Oil &
Condensates
(bd)
Gas
(MMcfd)Meters
Litoral de Tabasco Esah-1 BTPKS-JSK 12,331 3.256 68 Heavy Crude Oil
Litoral de Tabasco Xikin-1 Latte Jurassic (Kimmeridgian) 4,483 5.094 32 Extra-Light Oil
Litoral de Tabasco Hem-1 Mid-Late Miocene 439 29.29 2,601 Wet Gas
Cinco Presidentes Licanto-1 Late Miocene 666 0.3 Extra-Light Oil
Poza Rica-Altamira Maximino 1DL Early Eocene, Late Paleocene 4,547 7.4 3,014 Extra-Light Oil
Total 22,466 45.3
Main Discoveries
As of September 30, 2015
Initial Production

PEMEX
PEMEX Results Report as of September 30, 2015 8 / 27 www.pemex.com
Industrial Transformation 3Q15
Crude Oil Processing During the third quarter of 2015, total crude oil processing decreased by 9.9%, to 1,061 Mbd, as compared to the same period of 2014, primarily due to scheduled maintenance cycles; non-scheduled maintenance and overhaul works and operational problems resulting from the quality of crude oil supplied by producing areas by year-end 2014. As a result, PEMEX’s usage of its primary distillation capacity decreased by 7.0 percentage points. The ratio of heavy crude oil to total crude oil processed by the National Refining System (NRS) increased by 5.1 percentage points, as part of an effort to take advantage of highly specialized equipment to convert residuals and maximize the output of gasoline.
Crude Oil Processing
(Mbd)
Production of Petroleum Products
During the third quarter of 2015, total petroleum products output decreased by 9.2%, as compared to the same period of 2014, to 1,207 Mbd, primarily due to a decrease in the amount of crude oil processed during this period.
Petroleum Products Production
(Mbd)
694 591 547 576 571
484 488 511 482 490
1,178 1,079 1,057 1,059 1,061
3Q14 4Q14 1Q15 2Q15 3Q15
Light Crude Heavy Crude
421 383 388 395 375
283 237 205 234 251
285 273 287 263 279
203 195 195 176 171
53 45 50 46 46
85 93 95 101 85
1,329 1,226 1,220 1,216 1,207
3Q14 4Q14 1Q15 2Q15 3Q15
Other*
Jet Fuel
LPG
Diesel
Fuel oil
Automotive gasolines
* Includes paraffins, furfural extract, aeroflex, asphalt, lubricants, coke and cyclical light oil.
PEMEX
PEMEX Results Report as of September 30, 2015 9 / 27 www.pemex.com
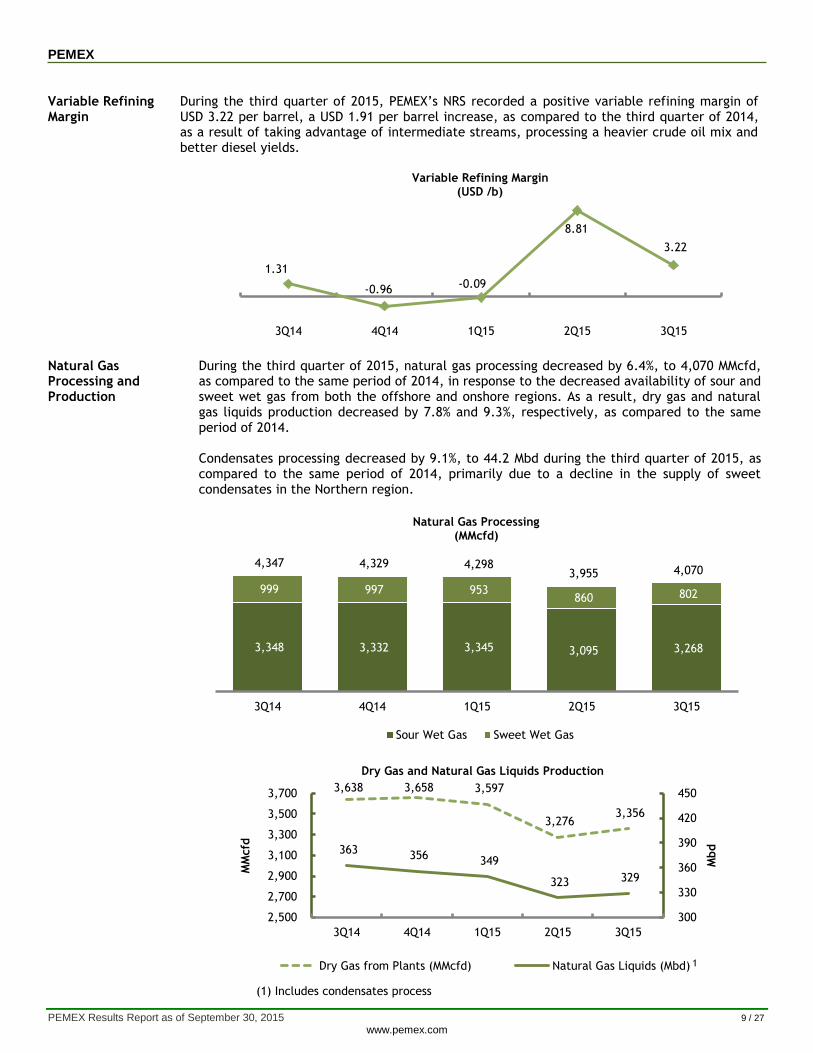
Variable Refining Margin
During the third quarter of 2015, PEMEX’s NRS recorded a positive variable refining margin of USD 3.22 per barrel, a USD 1.91 per barrel increase, as compared to the third quarter of 2014, as a result of taking advantage of intermediate streams, processing a heavier crude oil mix and better diesel yields.
Variable Refining Margin
(USD /b)
Natural Gas Processing and Production
During the third quarter of 2015, natural gas processing decreased by 6.4%, to 4,070 MMcfd, as compared to the same period of 2014, in response to the decreased availability of sour and sweet wet gas from both the offshore and onshore regions. As a result, dry gas and natural gas liquids production decreased by 7.8% and 9.3%, respectively, as compared to the same period of 2014. Condensates processing decreased by 9.1%, to 44.2 Mbd during the third quarter of 2015, as compared to the same period of 2014, primarily due to a decline in the supply of sweet condensates in the Northern region.
Natural Gas Processing
(MMcfd)
Dry Gas and Natural Gas Liquids Production
1.31
-0.96 -0.09
8.81
3.22
3Q14 4Q14 1Q15 2Q15 3Q15
3,348 3,332 3,345 3,095 3,268
999 997 953 860 802
4,347 4,329 4,298 3,955 4,070
3Q14 4Q14 1Q15 2Q15 3Q15
Sour Wet Gas Sweet Wet Gas
3,638 3,658 3,597
3,276 3,356
363 356 349
323 329
300
330
360
390
420
450
2,500
2,700
2,900
3,100
3,300
3,500
3,700
3Q14 4Q14 1Q15 2Q15 3Q15
Mbd
MM
cfd
Dry Gas from Plants (MMcfd) Natural Gas Liquids (Mbd)
(1) Includes condensates process
1
PEMEX
PEMEX Results Report as of September 30, 2015 10 / 27 www.pemex.com
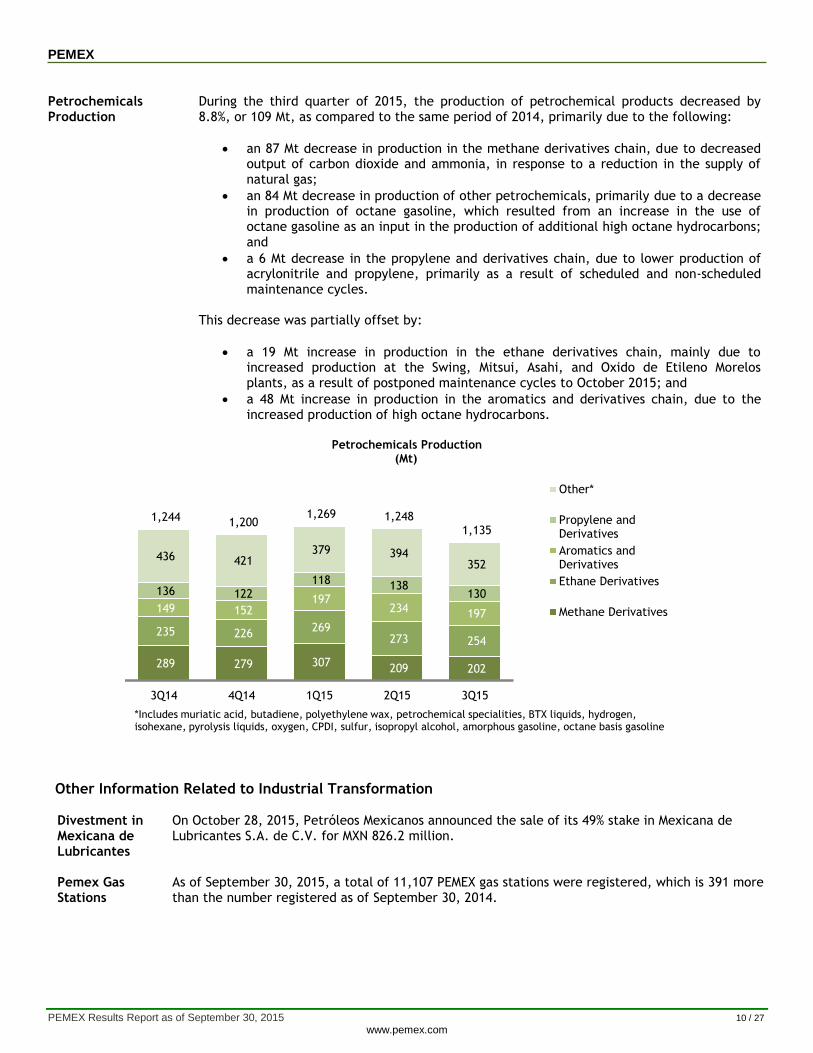
Petrochemicals Production
During the third quarter of 2015, the production of petrochemical products decreased by 8.8%, or 109 Mt, as compared to the same period of 2014, primarily due to the following:
an 87 Mt decrease in production in the methane derivatives chain, due to decreased output of carbon dioxide and ammonia, in response to a reduction in the supply of natural gas;
an 84 Mt decrease in production of other petrochemicals, primarily due to a decrease in production of octane gasoline, which resulted from an increase in the use of octane gasoline as an input in the production of additional high octane hydrocarbons; and
a 6 Mt decrease in the propylene and derivatives chain, due to lower production of acrylonitrile and propylene, primarily as a result of scheduled and non-scheduled maintenance cycles.
This decrease was partially offset by:
a 19 Mt increase in production in the ethane derivatives chain, mainly due to increased production at the Swing, Mitsui, Asahi, and Oxido de Etileno Morelos plants, as a result of postponed maintenance cycles to October 2015; and
a 48 Mt increase in production in the aromatics and derivatives chain, due to the increased production of high octane hydrocarbons.
Petrochemicals Production
(Mt)
Other Information Related to Industrial Transformation Divestment in Mexicana de Lubricantes
On October 28, 2015, Petróleos Mexicanos announced the sale of its 49% stake in Mexicana de Lubricantes S.A. de C.V. for MXN 826.2 million.
Pemex Gas Stations
As of September 30, 2015, a total of 11,107 PEMEX gas stations were registered, which is 391 more than the number registered as of September 30, 2014.
289 279 307 209 202
235 226 269
273 254
149 152 197
234 197
136 122 118 138
130
436 421 379 394
352
1,244 1,200 1,269 1,248
1,135
3Q14 4Q14 1Q15 2Q15 3Q15
Other*
Propylene andDerivatives
Aromatics andDerivatives
Ethane Derivatives
Methane Derivatives
*Includes muriatic acid, butadiene, polyethylene wax, petrochemical specialities, BTX liquids, hydrogen, isohexane, pyrolysis liquids, oxygen, CPDI, sulfur, isopropyl alcohol, amorphous gasoline, octane basis gasoline

PEMEX
PEMEX Results Report as of September 30, 2015 11 / 27 www.pemex.com
Industrial Safety
Frequency Index4
During the third 2015, the accumulated frequency index for PEMEX personnel was 0.43 injuries per million man-hours worked (MMhh), which represents a 7.2% reduction as compared to the same period of 2014, and is 7.5% higher than the International Association of Oil & Gas Producers (IOGP) standard for 2013, which was 0.40.
Severity Index5
By the end of the third quarter of 2015, the accumulated severity index was 30 days lost per MMhh, a 6.6% decrease as compared to the third quarter of 2014. To reverse the trend observed in severe accidents, Petróleos Mexicanos implemented a program for drilling activities, and another one for audit and advisory services for the effective implementation of the Safety, Health and Environmental Protection and Operational Reliability Systems in key working centers of both, Exploration and Production, and Industrial Transformation.
Environmental Protection
Sulfur Oxide Emissions
During the third quarter of 2015, sulfur oxide emissions increased by 25.1% as compared to the same period of 2014, primarily due to emissions produced as a result of the decline in wells that use nitrogen to increase production, which resulted in an increase in the generation of sour gas that is sent for flaring at the Northeastern Marine region, as well as, at the Akal C7/C8 Gas Processing Center.
Water Reuse During the third quarter of 2015, the reuse of water increased by 4.6% as compared to the same period of 2014, primarily due to the decrease in the utilization rates of residual water treatment plants in the NRS.
Global Water Development Partners
On October 1, 2015, and as a result of the MOU signed on May 12, 2015, PEMEX and Global Water Development Partners signed an agreement to invest in environmentally sustainable water and wastewater treatment infrastructure for upstream facilities.
Oil and Gas Climate Initiative
On October 16, 2015, Petróleos Mexicanos participated in the Oil & Gas Climate Initiative (OGCI) which aims to encourage actions leading to reaching the agreements of the COP21, the 21st session of the Conference of the Parties to the UN Framework on Climate Change (UNFCCC). The meeting gathered ten major oil & gas companies, with PEMEX being the only representative of the Americas. The initiative addresses issues such as greenhouse gas emissions, increased LNG use, and implementation of new technologies such as carbon sequestration, energy efficiency protocols and long term proposals for the consumption of biofuels.
4 Refers to the number of accidents with incapacitating injuries per million man-hours worked (MMhh) with risk exposure during the relevant period of time. An incapacitating injury is an injury, functional damage or death that is caused, either immediately or subsequently, by a sudden event at work or during work-related activities. Man-hours worked with risk exposure represent the number of hours worked by all personnel, including overtime hours. 5 Refers to the total number of days lost per million man-hours worked with risk exposure during the relevant period of time. The number of days lost is based on medical leaves of absence for injuries stemming from accidents at work, plus the number of corresponding days on which compensation is paid for partial or total disability or death.
PEMEX
PEMEX Results Report as of September 30, 2015 12 / 27 www.pemex.com
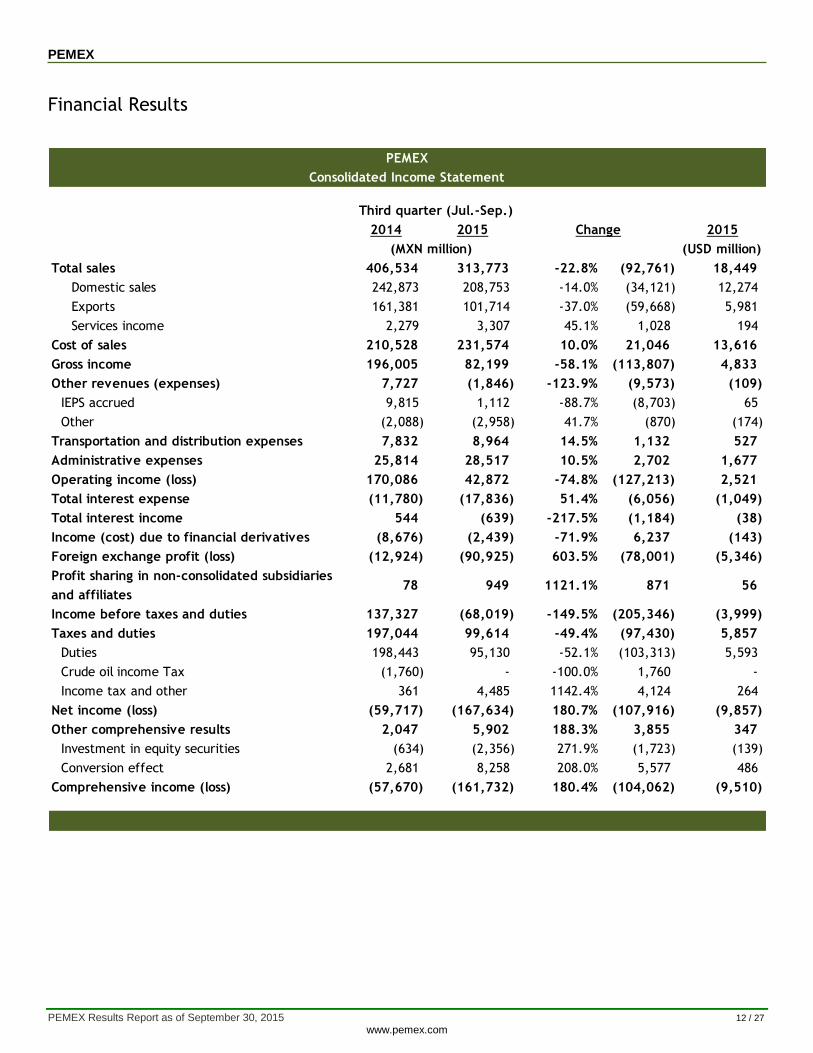
Financial Results
Third quarter (Jul.-Sep.)
2014 2015 Change 2015
(MXN million) (USD million)
Total sales 406,534 313,773 -22.8% (92,761) 18,449
Domestic sales 242,873 208,753 -14.0% (34,121) 12,274
Exports 161,381 101,714 -37.0% (59,668) 5,981
Services income 2,279 3,307 45.1% 1,028 194
Cost of sales 210,528 231,574 10.0% 21,046 13,616
Gross income 196,005 82,199 -58.1% (113,807) 4,833
Other revenues (expenses) 7,727 (1,846) -123.9% (9,573) (109)
IEPS accrued 9,815 1,112 -88.7% (8,703) 65
Other (2,088) (2,958) 41.7% (870) (174)
Transportation and distribution expenses 7,832 8,964 14.5% 1,132 527
Administrative expenses 25,814 28,517 10.5% 2,702 1,677
Operating income (loss) 170,086 42,872 -74.8% (127,213) 2,521
Total interest expense (11,780) (17,836) 51.4% (6,056) (1,049)
Total interest income 544 (639) -217.5% (1,184) (38)
Income (cost) due to financial derivatives (8,676) (2,439) -71.9% 6,237 (143)
Foreign exchange profit (loss) (12,924) (90,925) 603.5% (78,001) (5,346)
Profit sharing in non-consolidated subsidiaries
and affiliates78 949 1121.1% 871 56
Income before taxes and duties 137,327 (68,019) -149.5% (205,346) (3,999)
Taxes and duties 197,044 99,614 -49.4% (97,430) 5,857
Duties 198,443 95,130 -52.1% (103,313) 5,593
Crude oil income Tax (1,760) - -100.0% 1,760 -
Income tax and other 361 4,485 1142.4% 4,124 264
Net income (loss) (59,717) (167,634) 180.7% (107,916) (9,857)
Other comprehensive results 2,047 5,902 188.3% 3,855 347
Investment in equity securities (634) (2,356) 271.9% (1,723) (139)
Conversion effect 2,681 8,258 208.0% 5,577 486
Comprehensive income (loss) (57,670) (161,732) 180.4% (104,062) (9,510)
PEMEX
Consolidated Income Statement
PEMEX
PEMEX Results Report as of September 30, 2015 13 / 27 www.pemex.com
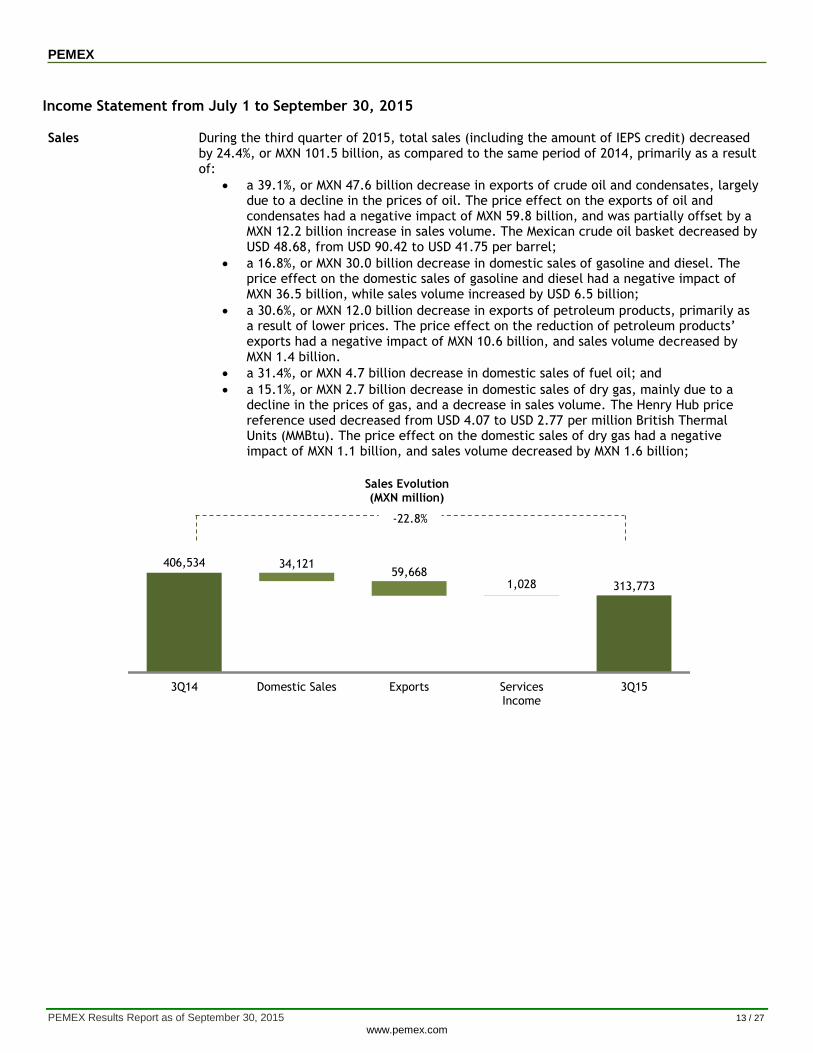
Income Statement from July 1 to September 30, 2015
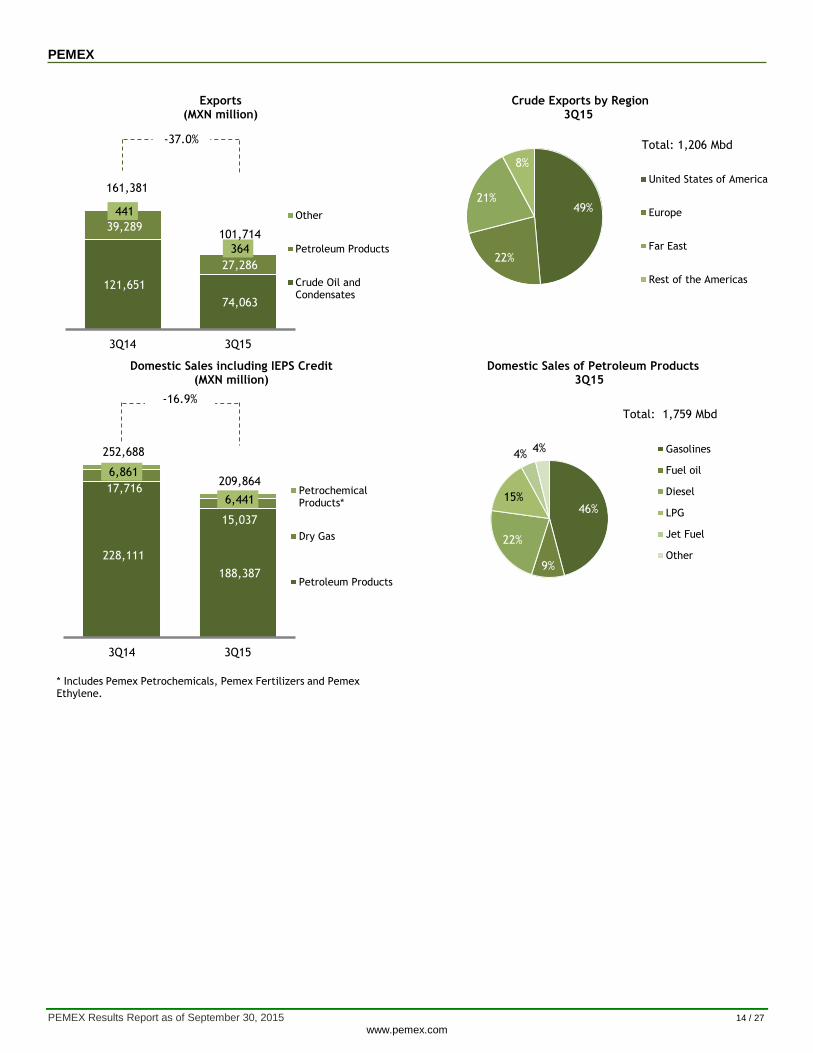
Sales During the third quarter of 2015, total sales (including the amount of IEPS credit) decreased by 24.4%, or MXN 101.5 billion, as compared to the same period of 2014, primarily as a result of:
a 39.1%, or MXN 47.6 billion decrease in exports of crude oil and condensates, largely due to a decline in the prices of oil. The price effect on the exports of oil and condensates had a negative impact of MXN 59.8 billion, and was partially offset by a MXN 12.2 billion increase in sales volume. The Mexican crude oil basket decreased by USD 48.68, from USD 90.42 to USD 41.75 per barrel;
a 16.8%, or MXN 30.0 billion decrease in domestic sales of gasoline and diesel. The price effect on the domestic sales of gasoline and diesel had a negative impact of MXN 36.5 billion, while sales volume increased by USD 6.5 billion;
a 30.6%, or MXN 12.0 billion decrease in exports of petroleum products, primarily as a result of lower prices. The price effect on the reduction of petroleum products’ exports had a negative impact of MXN 10.6 billion, and sales volume decreased by MXN 1.4 billion.
a 31.4%, or MXN 4.7 billion decrease in domestic sales of fuel oil; and
a 15.1%, or MXN 2.7 billion decrease in domestic sales of dry gas, mainly due to a decline in the prices of gas, and a decrease in sales volume. The Henry Hub price reference used decreased from USD 4.07 to USD 2.77 per million British Thermal Units (MMBtu). The price effect on the domestic sales of dry gas had a negative impact of MXN 1.1 billion, and sales volume decreased by MXN 1.6 billion;
Sales Evolution (MXN million)
406,534
313,773
34,121 59,668
1,028
3Q14 Domestic Sales Exports ServicesIncome
3Q15
-22.8%
PEMEX
PEMEX Results Report as of September 30, 2015 14 / 27 www.pemex.com
Exports (MXN million)
Crude Exports by Region 3Q15
Domestic Sales including IEPS Credit (MXN million)
Domestic Sales of Petroleum Products 3Q15
121,651
74,063
39,289
27,286
441
364
161,381
101,714
3Q14 3Q15
Other
Petroleum Products
Crude Oil andCondensates
-37.0%
49%
22%
21%
8%
United States of America
Europe
Far East
Rest of the Americas
Total: 1,206 Mbd
228,111
188,387
17,716
15,037
6,861
6,441
252,688
209,864
3Q14 3Q15
PetrochemicalProducts*
Dry Gas
Petroleum Products
-16.9%
* Includes Pemex Petrochemicals, Pemex Fertilizers and Pemex Ethylene.
46%
9%
22%
15%
4% 4% Gasolines
Fuel oil
Diesel
LPG
Jet Fuel
Other
Total: 1,759 Mbd

PEMEX
PEMEX Results Report as of September 30, 2015 15 / 27 www.pemex.com
Gross & Operating Income
During the third quarter of 2015, gross income, net of IEPS, decreased by 59.5%, or MXN 122.5 billion, as compared to the same period of 2014. We remind our readers that as of January 1, 2015, PEMEX’s tax regime was modified as established in the Hydrocarbons Revenue Law, which sets forth that direct taxes and duties should be recorded under the cost of sales: Hydrocarbon Exploration Taxes and Duties and Hydrocarbon Extraction Taxes and Duties. In addition, operating income decreased by 74.8%, or MXN 127.2 billion, as compared to the same period of 2014, to MXN 42.9 billion.
Operating Income Evolution
(MXN million) Net of IEPS
170,085
42,872
(122,510)
(870) 1,132 2,702
3Q14 Gross income Other revenues Transportationand distribution
expenses
Administrativeexpenses
3Q15
-74.8%
PEMEX
PEMEX Results Report as of September 30, 2015 16 / 27 www.pemex.com
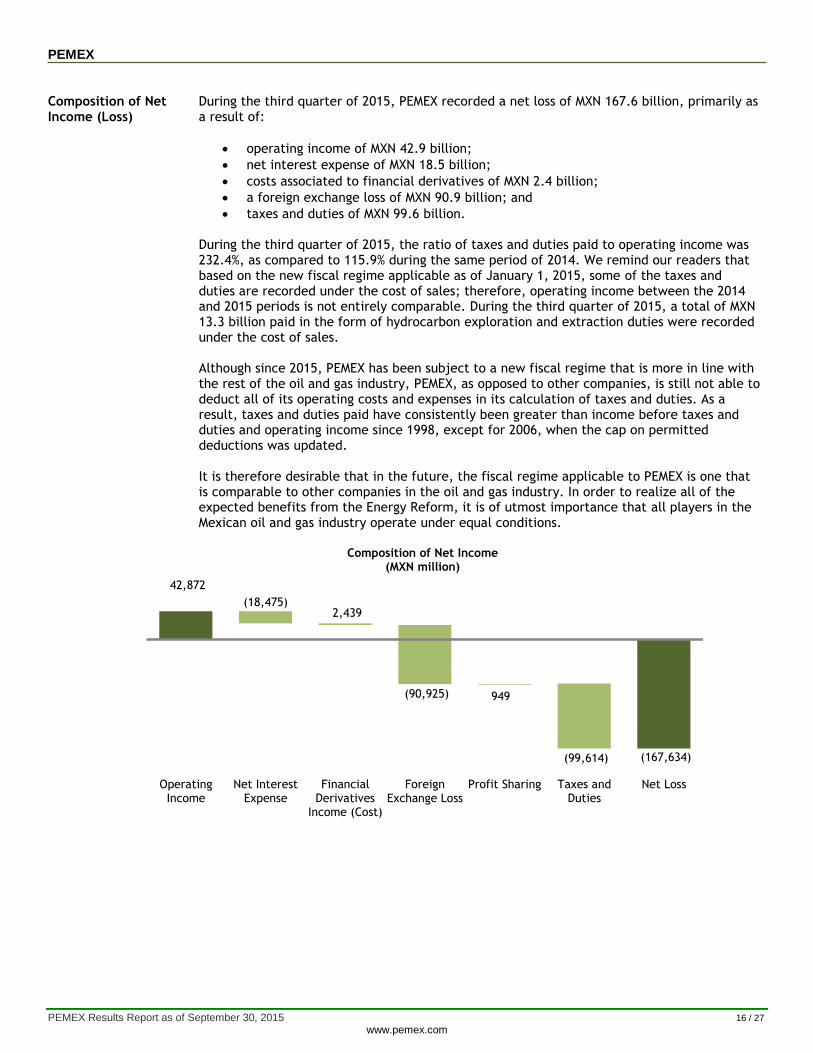
Composition of Net Income (Loss)
During the third quarter of 2015, PEMEX recorded a net loss of MXN 167.6 billion, primarily as a result of:
operating income of MXN 42.9 billion;
net interest expense of MXN 18.5 billion;
costs associated to financial derivatives of MXN 2.4 billion;
a foreign exchange loss of MXN 90.9 billion; and
taxes and duties of MXN 99.6 billion. During the third quarter of 2015, the ratio of taxes and duties paid to operating income was 232.4%, as compared to 115.9% during the same period of 2014. We remind our readers that based on the new fiscal regime applicable as of January 1, 2015, some of the taxes and duties are recorded under the cost of sales; therefore, operating income between the 2014 and 2015 periods is not entirely comparable. During the third quarter of 2015, a total of MXN 13.3 billion paid in the form of hydrocarbon exploration and extraction duties were recorded under the cost of sales. Although since 2015, PEMEX has been subject to a new fiscal regime that is more in line with the rest of the oil and gas industry, PEMEX, as opposed to other companies, is still not able to deduct all of its operating costs and expenses in its calculation of taxes and duties. As a result, taxes and duties paid have consistently been greater than income before taxes and duties and operating income since 1998, except for 2006, when the cap on permitted deductions was updated. It is therefore desirable that in the future, the fiscal regime applicable to PEMEX is one that is comparable to other companies in the oil and gas industry. In order to realize all of the expected benefits from the Energy Reform, it is of utmost importance that all players in the Mexican oil and gas industry operate under equal conditions.
Composition of Net Income
(MXN million)
42,872
(167,634)
(18,475) 2,439
(90,925) 949
(99,614)
OperatingIncome
Net InterestExpense
FinancialDerivatives
Income (Cost)
ForeignExchange Loss
Profit Sharing Taxes andDuties
Net Loss
PEMEX
PEMEX Results Report as of September 30, 2015 17 / 27 www.pemex.com
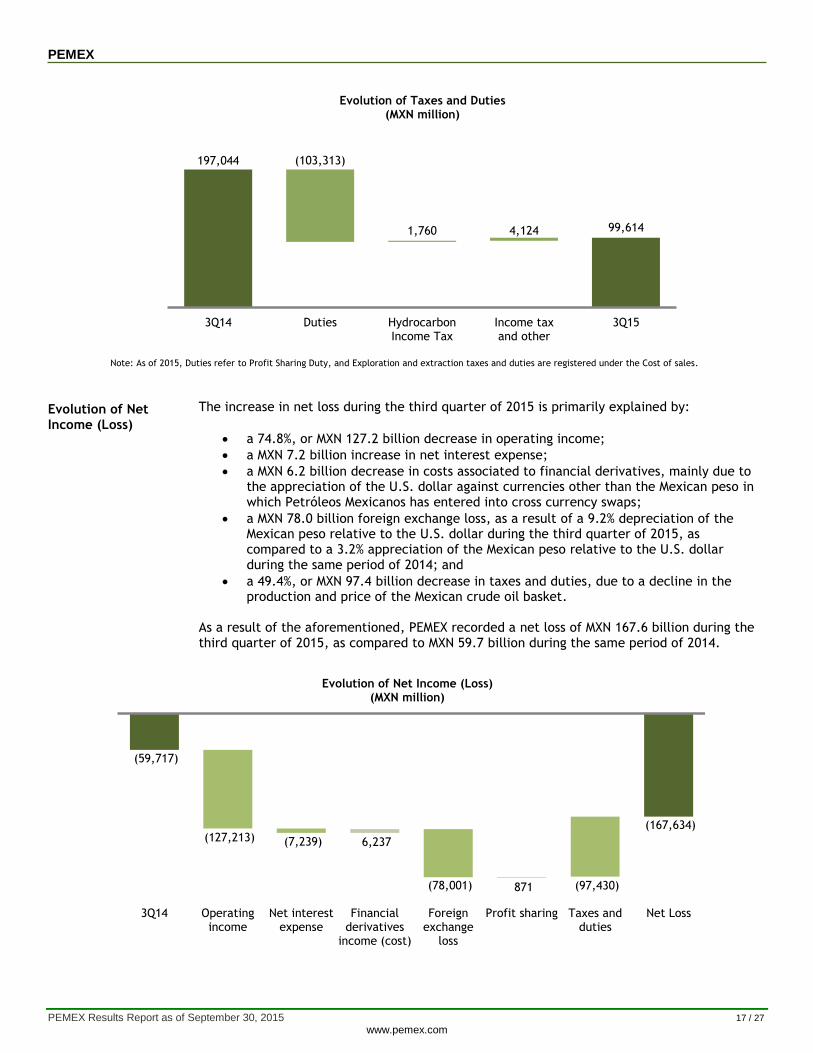
Evolution of Taxes and Duties (MXN million)
Note: As of 2015, Duties refer to Profit Sharing Duty, and Exploration and extraction taxes and duties are registered under the Cost of sales.
Evolution of Net Income (Loss)
The increase in net loss during the third quarter of 2015 is primarily explained by:
a 74.8%, or MXN 127.2 billion decrease in operating income;
a MXN 7.2 billion increase in net interest expense;
a MXN 6.2 billion decrease in costs associated to financial derivatives, mainly due to the appreciation of the U.S. dollar against currencies other than the Mexican peso in which Petróleos Mexicanos has entered into cross currency swaps;
a MXN 78.0 billion foreign exchange loss, as a result of a 9.2% depreciation of the Mexican peso relative to the U.S. dollar during the third quarter of 2015, as compared to a 3.2% appreciation of the Mexican peso relative to the U.S. dollar during the same period of 2014; and
a 49.4%, or MXN 97.4 billion decrease in taxes and duties, due to a decline in the production and price of the Mexican crude oil basket.
As a result of the aforementioned, PEMEX recorded a net loss of MXN 167.6 billion during the third quarter of 2015, as compared to MXN 59.7 billion during the same period of 2014.
Evolution of Net Income (Loss) (MXN million)
197,044
99,614
(103,313)
1,760 4,124
3Q14 Duties HydrocarbonIncome Tax
Income taxand other
3Q15
(59,717)
(167,634) (127,213) (7,239) 6,237
(78,001) 871 (97,430)
3Q14 Operatingincome
Net interestexpense
Financialderivatives
income (cost)
Foreignexchange
loss
Profit sharing Taxes andduties
Net Loss

PEMEX
PEMEX Results Report as of September 30, 2015 18 / 27 www.pemex.com
Comprehensive Income (Loss)
During the third quarter of 2015, other comprehensive results increased by MXN 3.9 billion, primarily as a result of a MXN 5.6 billion increase in currency translation effects. The previous was partially offset by a MXN 1.7 billion decrease in investment on assets available for sale, mainly from the sale of Repsol shares. As a result, the comprehensive loss amounted to MXN 161.7 billion.
Evolution of Comprehensive Income (MXN million)
(57,670)
(161,732) (107,916) 3,855
3Q14 NetIncome
OtherComprehensive
Results
3Q15

PEMEX
PEMEX Results Report as of September 30, 2015 19 / 27 www.pemex.com
Consolidated Balance Sheet as of September 30, 2015
Consolidated Balance Sheet
As of December 31, As of September 30,
2014 2015 Change 2015
(USD million)
Total assets 2,128,368 2,140,548 0.6% 12,180 125,861
Current assets 289,327 262,734 -9.2% (26,594) 15,448
Cash and cash equivalents 117,989 110,932 -6.0% (7,056) 6,523
Accounts, notes receivable and other 114,423 105,689 -7.6% (8,734) 6,214
Inventories 49,939 44,406 -11.1% (5,533) 2,611
Derivative financial instruments 1,563 1,707 9.2% 144 100
Permanent investment in shares of associates 22,015 27,161 23.4% 5,147 1,597
Property, plant and equipment 1,783,374 1,814,979 1.8% 31,605 106,718
Deferred taxes 4,143 1,818 -56.1% (2,324) 107
Restricted cash 6,884 9,257 34.5% 2,373 544
Other assets 22,625 20,475 -9.5% (2,151) 1,204
Available for sale financial assets 5,415 4,125 -23.8% (1,290) 243
Total liabilities 2,896,089 3,240,723 11.9% 344,634 190,549
Current liabilities 334,159 327,357 -2.0% (6,802) 19,248
Short-term financial debt 145,866 198,809 36.3% 52,943 11,690
Suppliers 116,178 58,026 -50.1% (58,153) 3,412
Accounts and accrued expenses payable 12,235 18,032 47.4% 5,797 1,060
Derivative financial instruments 17,460 24,642 41.1% 7,183 1,449
Taxes and duties payable 42,420 27,848 -34.4% (14,573) 1,637
Long-term liabilities 2,561,930 2,913,366 13.7% 351,436 171,301
Long-term financial debt 997,384 1,286,220 29.0% 288,836 75,628
Reserve for employee benefits 1,474,089 1,539,972 4.5% 65,883 90,548
Reserve for diverse credits 78,423 74,322 -5.2% (4,101) 4,370
Other liabilities 7,718 11,164 44.6% 3,446 656
Deferred taxes 4,316 1,688 -60.9% (2,628) 99
Total equity (767,721) (1,100,175) 43.3% (332,454) (64,688)
Holding (768,066) (1,100,355) 43.3% (332,289) (64,699)
Certificates of contribution "A" 134,605 144,605 7.4% 10,000 8,503
Federal Government Contributions 43,731 43,731 0.0% - 2,571
Legal Reserve 1,002 1,002 0.0% - 59
Comprehensive accumulated results (394,594) (384,267) -2.6% 10,328 (22,594)
Retained earnings (accumulated losses) (552,809) (905,426) 63.8% (352,617) (53,237)
From prior years (287,606) (552,809) 92.2% (265,203) (32,504)
For the year (265,203) (352,617) 33.0% (87,414) (20,733)
Participation of non-holding entities 345 180 -47.8% (165) 11
Total liabilities and equity 2,128,368 2,140,548 0.6% 12,180 125,861
PEMEX
(MXN million)
PEMEX
PEMEX Results Report as of September 30, 2015 20 / 27 www.pemex.com
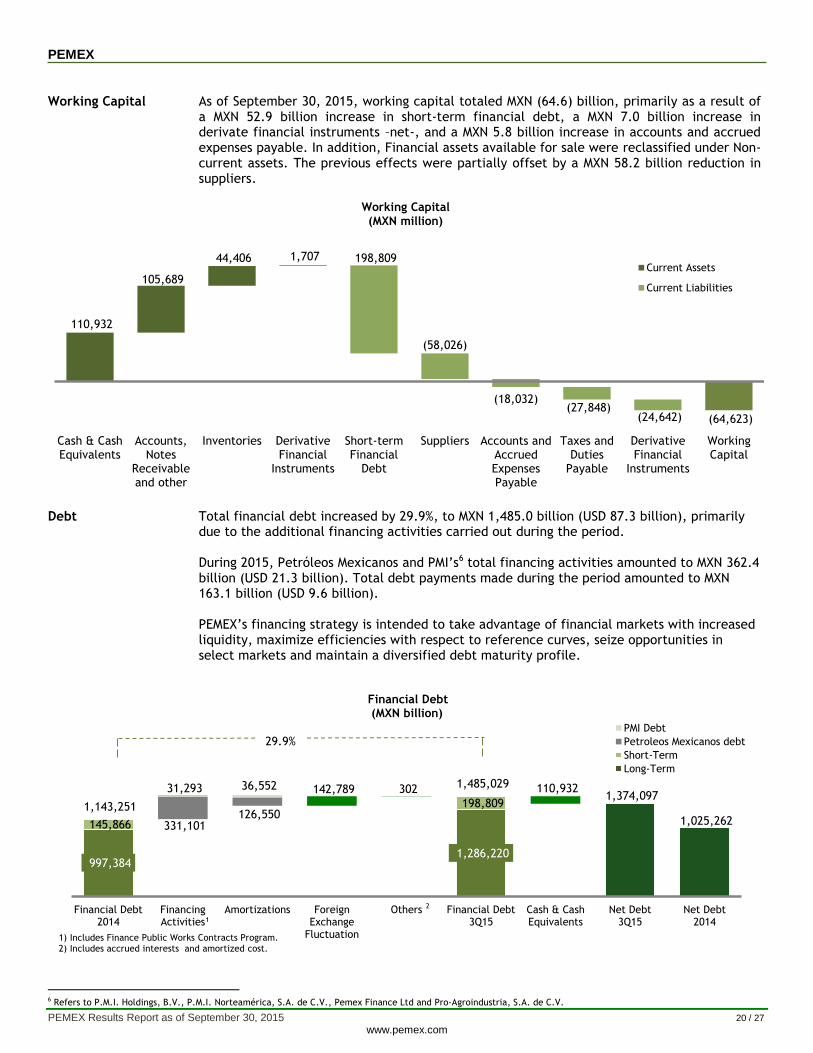
Working Capital As of September 30, 2015, working capital totaled MXN (64.6) billion, primarily as a result of a MXN 52.9 billion increase in short-term financial debt, a MXN 7.0 billion increase in derivate financial instruments –net-, and a MXN 5.8 billion increase in accounts and accrued expenses payable. In addition, Financial assets available for sale were reclassified under Non-current assets. The previous effects were partially offset by a MXN 58.2 billion reduction in suppliers.
Working Capital (MXN million)
Debt Total financial debt increased by 29.9%, to MXN 1,485.0 billion (USD 87.3 billion), primarily due to the additional financing activities carried out during the period. During 2015, Petróleos Mexicanos and PMI’s6 total financing activities amounted to MXN 362.4 billion (USD 21.3 billion). Total debt payments made during the period amounted to MXN 163.1 billion (USD 9.6 billion). PEMEX’s financing strategy is intended to take advantage of financial markets with increased liquidity, maximize efficiencies with respect to reference curves, seize opportunities in select markets and maintain a diversified debt maturity profile.
Financial Debt (MXN billion)
6 Refers to P.M.I. Holdings, B.V., P.M.I. Norteamérica, S.A. de C.V., Pemex Finance Ltd and Pro-Agroindustria, S.A. de C.V.
(64,623)
198,809
(58,026)
(18,032) (27,848)
(24,642)
110,932
105,689
44,406 1,707
Cash & CashEquivalents
Accounts,Notes
Receivableand other
Inventories DerivativeFinancial
Instruments
Short-termFinancial
Debt
Suppliers Accounts andAccruedExpensesPayable
Taxes andDuties
Payable
DerivativeFinancial
Instruments
WorkingCapital
Current Assets
Current Liabilities
997,384 1,286,220
1,374,097
1,025,262 331,101 145,866
198,809 126,550
142,789 110,932
1,143,251
1,485,029 302 31,293 36,552
Financial Debt2014
FinancingActivities
Amortizations ForeignExchange
Fluctuation
Others Financial Debt3Q15
Cash & CashEquivalents
Net Debt3Q15
Net Debt2014
PMI Debt
Petroleos Mexicanos debt
Short-Term
Long-Term
1) Includes Finance Public Works Contracts Program. 2) Includes accrued interests and amortized cost.
29.9%
2
1
PEMEX
PEMEX Results Report as of September 30, 2015 21 / 27 www.pemex.com
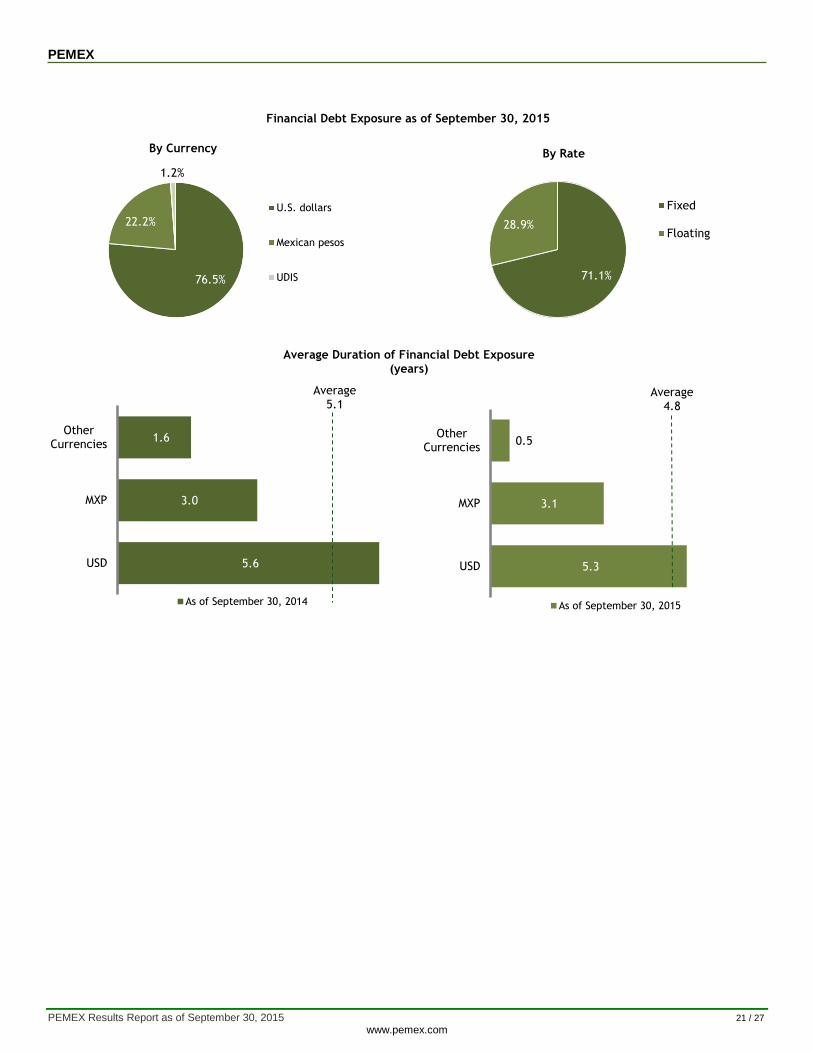
Financial Debt Exposure as of September 30, 2015
Average Duration of Financial Debt Exposure (years)
76.5%
22.2%
1.2%
By Currency
U.S. dollars
Mexican pesos
UDIS 71.1%
28.9%
By Rate
Fixed
Floating
5.6
3.0
1.6
USD
MXP
OtherCurrencies
As of September 30, 2014
Average 5.1
5.3
3.1
0.5
USD
MXP
OtherCurrencies
As of September 30, 2015
Average 4.8
PEMEX
PEMEX Results Report as of September 30, 2015 22 / 27 www.pemex.com
Investment Activities
Activity
During the first nine months of 2015, PEMEX spent MXN 265.0 billion (USD 17.0 billion)7 on investment activities, which represents 86.2% of the total investment of MXN 307.6 billion that were programmed for the year. These investments were allocated as follows:
MXN 225.0 billion to Pemex-Exploration and Production8, MXN 31.8 billion of which were allocated to exploration;
MXN 31.8 billion to Pemex-Refining;
MXN 4.6 billion to Pemex-Gas and Basic Petrochemicals;
MXN 2.3 billion to Pemex-Petrochemicals; and
MXN 1.3 billion to Petróleos Mexicanos Corporate.
Financing Activities
Capital Markets From July 1 to September 30, 2015, Petróleos Mexicanos issued a total of MXN 10.0 billion of short-term Certificados Bursátiles at fixed and floating rates and repaid MXN 12.5 billion. On September 30, 2015, Petróleos Mexicanos issued the following series of Certificados Bursátiles:
MXN 1.4 billion due in September 2018, at a floating rate of TIIE + 35 basis points; and
the equivalent of MXN 6.0 billion in UDIs, at a fixed rate of 5.23%, due in September 2035.
ECAs On July 31, 2015, Petróleos Mexicanos issued USD 525.0 million of its 2.46% Notes, due in
2025. These are structured bonds guaranteed by the U.S. Export Import Bank. Syndicated Revolving Credit Lines
As of September 30, 2015, Petróleos Mexicanos holds syndicated revolving credit lines for liquidity management in the amounts of USD 4.5 billion and MXN 23.5 billion, of which USD 130.0 million are available.
7 Convenience translation has been made at the established average exchange rate for the first nine months of 2015, of MXN 15.5486 = USD 1.00. 8 Includes maintenance expenditures.
PEMEX
PEMEX Results Report as of September 30, 2015 23 / 27 www.pemex.com
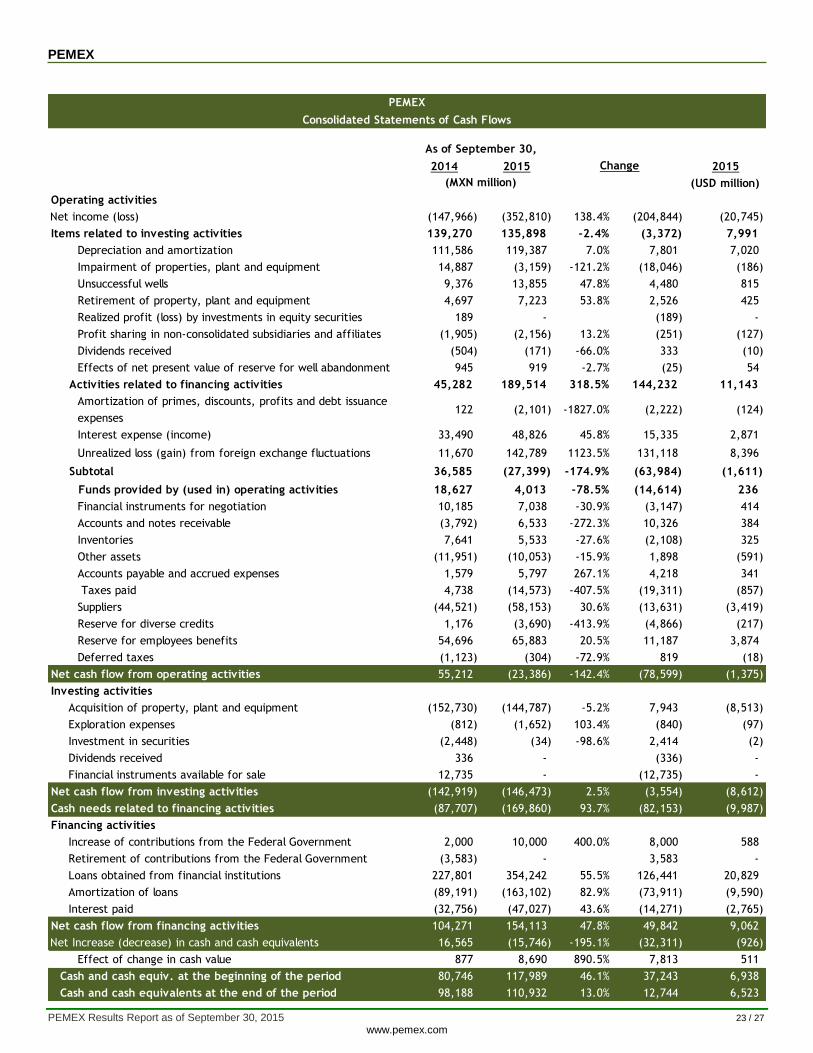
Consolidated Statements of Cash Flows
2014 2015 2015
(USD million)
Operating activities
Net income (loss) (147,966) (352,810) 138.4% (204,844) (20,745)
Items related to investing activities 139,270 135,898 -2.4% (3,372) 7,991
Depreciation and amortization 111,586 119,387 7.0% 7,801 7,020
Impairment of properties, plant and equipment 14,887 (3,159) -121.2% (18,046) (186)
Unsuccessful wells 9,376 13,855 47.8% 4,480 815
Retirement of property, plant and equipment 4,697 7,223 53.8% 2,526 425
Realized profit (loss) by investments in equity securities 189 - -100.0% (189) -
Profit sharing in non-consolidated subsidiaries and affiliates (1,905) (2,156) 13.2% (251) (127)
Dividends received (504) (171) -66.0% 333 (10)
Effects of net present value of reserve for well abandonment 945 919 -2.7% (25) 54
Activities related to financing activities 45,282 189,514 318.5% 144,232 11,143
Amortization of primes, discounts, profits and debt issuance
expenses122 (2,101) -1827.0% (2,222) (124)
Interest expense (income) 33,490 48,826 45.8% 15,335 2,871
Unrealized loss (gain) from foreign exchange fluctuations 11,670 142,789 1123.5% 131,118 8,396
Subtotal 36,585 (27,399) -174.9% (63,984) (1,611)
Funds provided by (used in) operating activities 18,627 4,013 -78.5% (14,614) 236
Financial instruments for negotiation 10,185 7,038 -30.9% (3,147) 414
Accounts and notes receivable (3,792) 6,533 -272.3% 10,326 384
Inventories 7,641 5,533 -27.6% (2,108) 325
Other assets (11,951) (10,053) -15.9% 1,898 (591)
Accounts payable and accrued expenses 1,579 5,797 267.1% 4,218 341
Taxes paid 4,738 (14,573) -407.5% (19,311) (857)
Suppliers (44,521) (58,153) 30.6% (13,631) (3,419)
Reserve for diverse credits 1,176 (3,690) -413.9% (4,866) (217)
Reserve for employees benefits 54,696 65,883 20.5% 11,187 3,874
Deferred taxes (1,123) (304) -72.9% 819 (18)
Net cash flow from operating activities 55,212 (23,386) -142.4% (78,599) (1,375)
Investing activities - - 0.0% - -
Acquisition of property, plant and equipment (152,730) (144,787) -5.2% 7,943 (8,513)
Exploration expenses (812) (1,652) 103.4% (840) (97)
Investment in securities (2,448) (34) -98.6% 2,414 (2)
Dividends received 336 - -100.0% (336) -
Financial instruments available for sale 12,735 - -100.0% (12,735) -
Net cash flow from investing activities (142,919) (146,473) 2.5% (3,554) (8,612)
Cash needs related to financing activities (87,707) (169,860) 93.7% (82,153) (9,987)
Financing activities
Increase of contributions from the Federal Government 2,000 10,000 400.0% 8,000 588
Retirement of contributions from the Federal Government (3,583) - -100.0% 3,583 -
Loans obtained from financial institutions 227,801 354,242 55.5% 126,441 20,829
Amortization of loans (89,191) (163,102) 82.9% (73,911) (9,590)
Interest paid (32,756) (47,027) 43.6% (14,271) (2,765)
Net cash flow from financing activities 104,271 154,113 47.8% 49,842 9,062
Net Increase (decrease) in cash and cash equivalents 16,565 (15,746) -195.1% (32,311) (926)
Effect of change in cash value 877 8,690 890.5% 7,813 511
Cash and cash equiv. at the beginning of the period 80,746 117,989 46.1% 37,243 6,938
Cash and cash equivalents at the end of the period 98,188 110,932 13.0% 12,744 6,523
Change
PEMEX
As of September 30,
(MXN million)

PEMEX
PEMEX Results Report as of September 30, 2015 24 / 27 www.pemex.com
Other Relevant Information
Corporate Reorganization
On August 1, 2015, the newly created productive state-owned subsidiaries, Pemex Perforación y Servicios (Pemex Drilling and Services), Pemex Fertilizantes (Pemex Fertilizers) and Pemex Etileno (Pemex Ethylene) began operations. Moreover, on September 4, 2015, their respective Boards of Directors approved each of their Organic Statutes. The Board of Directors of Pemex Drilling and Services made the following appointments:
José Serrano, General Director
José Gilberto Silva García, Deputy Director of Operations in Well Interventions; and
Pedro Virgilio Sánchez Soto, Deputy Director of Engineering of Wells and Business Development.
The Board of Directors of Pemex Fertilizers appointed Edgar Torres, as its General Director, additionally, the Board of Director of Pemex Ethylene appointed Javier Vergara, as General Director of this company. On September 11, 2015, the Board of Directors of PMI Comercio Internacional approved the appointment of Jorge Sánchez Santiago as its General Director. On September 15, 2015, Emilio Lozoya, PEMEX’s CEO, appointed Gustavo Escobar Carré, as Acting Corporate Director of Procurement and Supply. On September 24, 2015 the Board of Directors of Petróleos Mexicanos, approved the following appointments in Pemex Industrial Transformation:
Alejandro Martínez, General Director;
Miguel Tame, Director of Production;
Marcelo Parizot, Commercial Director; and
Leonardo Cornejo, Director of Projects. On October 15, 2015, the Board of Directors of Pemex Logistics and Services was installed, the Organic Statute of the subsidiary was approved, and the following appointments were made:
Francisco Fuentes, General Director;
Luis Sánchez, Deputy Director of Transportation;
Luis Alberto Núñez, Deputy Director of Operations; and
Adrián Brígido Moral, Deputy Director of Storage and Dispatch. Agreement with BlackRock
On July 31, 2015, and as a result of the MOU signed on June 1, 2015, PEMEX and BlackRock signed an agreement to accelerate the efficient development and financing of energy related infrastructure projects of strategic importance to PEMEX.
Divestment in Gasoductos de Chihuahua
On July 31, 2015, Petróleos Mexicanos announced the divestment of its stake—50 percent of the capital stock— in Gasoductos de Chihuahua. The transaction amounted to USD 1,325 million. The assets subject to the transaction are three natural gas pipelines, an ethane pipeline, an LP gas pipeline and an LP gas storage terminal. The transaction is expected to be completed in the following 120 days, once the corresponding corporate and regulatory approvals are obtained.

PEMEX
PEMEX Results Report as of September 30, 2015 25 / 27 www.pemex.com
Actions Against Conflicts of Interest
On August 6, 2015, PEMEX revealed that the Responsibilities Unit decided to dismiss and ban for ten years José Aroldo de Hoyos Morales, and submitted the corresponding accusation with the Attorney General’s Office. José Aroldo de Hoyos Morales, was responsible for overseeing the work of the contract between PEP and the consortium formed by Chamsa Grupo Corporativo S.A. de C.V. and Mava Group Inc., while being a partner of the subcontractor Encino Integrated Services LLC, along with Eduardo Javier Maqueda Natividad, who also serves as President of Mava Group.
Crude Oil Exchange On October 28, 2015, Petróleos Mexicanos announced it had received a one-year license from
the Bureau of Industry and Security of the Department of Commerce of the United States, to import up to 75 Mbd of light crude oil and condensates. Through this exchange, PEMEX anticipates the following improvements in its refining processes:
i. an increase in gasoline and diesel production; ii. a reduction in production of fuel oil and refined products with high sulfur content;
and iii. an improvement in installed utilization capacity.
PEMEX's Ratings Under Review for Downgrade
On August 25, 2015, Moody's Investors Service placed Petróleos Mexicanos’ global foreign currency and global local currency ratings under review for a possible downgrade. In its announcement, Moody’s indicated that these ratings are under review because of the effect that the sharp decline in international oil prices has had on PEMEX’s cash flow generation and PEMEX’s increase in debt over the past few years. To address the challenges associated with the fall in oil prices that began in July 2014 and the uncertainty of its duration, PEMEX will use every tool available by means of the Energy Reform to improve the financial situation of the company and minimize the effect of current economic conditions.
Transfer of Assets to Pemex Ethylene
On September 1, 2015, Petróleos Mexicanos transferred to Pemex Ethylene all petrochemical plants involved in the ethane and propylene derivatives chain, in the petrochemical complexes of Morelos and Cangrejera, located in the state of Veracruz.
Union Labor Contract Agreement
On September 9, 2015, Petróleos Mexicanos and the Petroleum Workers’ Union signed the Collective Bargaining Agreement for 2015-2017. The agreement reaffirms the company’s commitment to improve working conditions and increase productivity, and considers increases of 3.99% and 1.75% in wages and benefits, respectively. In addition, Petróleos Mexicanos and the Union reached an agreement on the pension liability, which will be applicable for all workers and will be announced jointly in the following days.

PEMEX
PEMEX Results Report as of September 30, 2015 26 / 27 www.pemex.com
MOUs The following table sets forth a brief description of the MOUs recently entered into by Petróleos Mexicanos:
MOU
Counterparty Date Purpose
Banco Santander July 28, 2015
Provide banking and credit-related services to gas stations in the country.
General Electric September 9, 2015
Find technological and financing solutions for gas compression, power generation and hydrocarbon production.
Modernization of PEMEX’s fertilizers plant in Coatzacoalcos.
Exchange of best practices in training and human resources.
Dominion Technologies
October 7, 2015
Constitute a partnership aimed at the combined execution of the cogeneration project, which will provide power to several Measuring and Regulation Stations of Natural Gas.

PEMEX
PEMEX Results Report as of September 30, 2015 27 / 27 www.pemex.com
If you would like to be included in our distribution list, please email the Investor Relations team at [email protected] or register on http://www.pemex.com/en/investors/Paginas/list-distribution-
signup.aspx
If you would like to contact us, please call us at (52 55) 1944 9700, (52 55) 1944 9702, (52 55) 1944 8015 or send an email to [email protected].
Follow us on: @PemexGlobal and @Pemex
Julio Valle Ana Lourdes Benavides Lucero Medina Robert Berg
[email protected] [email protected] [email protected] [email protected]
Mariana López Alejandro López
[email protected] [email protected]
Variations
Cumulative and quarterly variations are calculated comparing the period with the same one of the previous year; unless specified otherwise.
Rounding
Numbers may not total due to rounding.
Financial Information
Excluding budgetary and volumetric information, the financial information included in this report and the annexes hereto is based on unaudited consolidated financial statements prepared in accordance
with International Financial Reporting Standards as issued by the International Accounting Standards Board (“IFRS”), which PEMEX has adopted effective January 1, 2012. For more information regarding
the transition to IFRS, see Note 23 to the consolidated financial statements included in Petróleos Mexicanos’ 2012 Form 20-F filed with the Securities and Exchange Commission (SEC) and its Annual
Report filed with the Comisión Nacional Bancaria y de Valores (CNBV).
EBITDA is a non-IFRS measure. We show a reconciliation of EBITDA to net income in Table 33 of the annexes to this report. Budgetary information is based on standards from Mexican governmental
accounting; therefore, it does not include information from the subsidiary companies or affiliates of Petróleos Mexicanos. It is important to mention, that our current financing agreements do not include
financial covenants or events of default that would be triggered as a result of our having negative equity.
Methodology
We might change the methodology of the information disclosed in order to enhance its quality and usefulness, and/or to comply with international standards and best practices.
Foreign Exchange Conversions
Convenience translations into U.S. dollars of amounts in Mexican pesos have been made at the exchange rate at close for the corresponding period, unless otherwise noted. Due to market volatility, the
difference between the average exchange rate, the exchange rate at close and the spot exchange rate, or any other exchange rate used could be material. Such translations should not be construed as a
representation that the Mexican peso amounts have been or could be converted into U.S. dollars at the foregoing or any other rate. It is important to note that we maintain our consolidated financial
statements and accounting records in pesos. As of September 30, 2015, the exchange rate of MXN 17.0073 = USD 1.00 is used.
Fiscal Regime
Starting January 1, 2015, Petróleos Mexicanos’ fiscal regime is ruled by the Ley de Ingresos sobre Hidrocarburos (Hydrocarbons Income Law). Since January 1, 2006 and until December 31, 2014, PEP
was subject to a fiscal regime governed by the Federal Duties Law, while the tax regimes of the other Subsidiary Entities were governed by the Federal Revenue Law.
The Special Tax on Production and Services (IEPS) applicable to automotive gasoline and diesel is established in the Production and Services Special Tax Law “Ley del Impuesto Especial sobre
Producción y Servicios”. As an intermediary between the Ministry of Finance and Public Credit (SHCP) and the final consumer, PEMEX retains the amount of the IEPS and transfers it to the Mexican
Government. The IEPS rate is calculated as the difference between the retail or “final price,” and the “producer price” of products. If the “final price” is higher than the “producer price,” the IEPS is paid by
the final consumer. If the opposite occurs, the “negative IEPS” amount can be credited against certain of PEMEX’s tax liabilities and included in “Other income (expenses)” in its Income Statement.
PEMEX’s “producer price” is calculated in reference to that of an efficient refinery operating in the Gulf of Mexico. Until December 31, 2017, the Mexican Government may continue issuing pricing decrees
to regulate the maximum prices for the retail sale of gasoline and diesel fuel, taking into account transportation costs between regions, inflation and the volatility of international fuel prices, among other
factors. Beginning in 2018, the prices of gasoline and diesel fuel will be freely determined by market conditions. However the Federal Commission for Economic Competition, based on the existence of
effective competitive conditions, can declare that prices of gasoline and diesel fuel are to be freely determined by market conditions before 2018.
Hydrocarbon Reserves
In accordance with the Hydrocarbons Law, published in the Official Gazette of the Federation on August 11, 2014, the National Hydrocarbons Commission (CNH) will establish and will manage the
National Hydrocarbons Information Center, comprised by a system to obtain, safeguard, manage, use, analyze, keep updated and publish information and statistics related; which includes estimations,
valuation studies and certifications.
As of January 1, 2010, the Securities and Exchange Commission (SEC) changed its rules to permit oil and gas companies, in their filings with the SEC, to disclose not only proved reserves, but also
probable reserves and possible reserves. Nevertheless, any description of probable or possible reserves included herein may not meet the recoverability thresholds established by the SEC in its
definitions. Investors are urged to consider closely the disclosure in our Form 20-F and our Annual Report to the CNBV and SEC, available at http://www.pemex.com/.
Forward-looking Statements
This report contains forward-looking statements. We may also make written or oral forward-looking statements in our periodic reports to the CNBV and the SEC, in our annual reports, in our offering
circulars and prospectuses, in press releases and other written materials and in oral statements made by our officers, directors or employees to third parties. We may include forward-looking statements
that address, among other things, our:
exploration and production activities, including drilling;
activities relating to import, export, refining, petrochemicals and transportation of petroleum, natural gas and oil products;
activities relating to the generation of electrical energy;
projected and targeted capital expenditures and other costs, commitments and revenues, and
liquidity and sources of funding.
Actual results could differ materially from those projected in such forward-looking statements as a result of various factors that may be beyond our control. These factors include, but are not limited to:
changes in international crude oil and natural gas prices;
effects on us from competition, including on our ability to hire and retain skilled personnel;
limitations on our access to sources of financing on competitive terms;
our ability to find, acquire or have the right to access additional hydrocarbons reserves and to develop the reserves that we obtain successfully;
uncertainties inherent in making estimates of oil and gas reserves, including recently discovered oil and gas reserves;
technical difficulties;
significant developments in the global economy;
significant economic or political developments in Mexico, including developments relating to the implementation of the laws that implement the new legal framework contemplated by the
Energy Reform Decree (as described in our most recent Annual Report and Form 20-F);
developments affecting the energy sector; and
changes in our legal regime or regulatory environment, including tax and environmental regulations.
Accordingly, you should not place undue reliance on these forward-looking statements. In any event, these statements speak only as of their dates, and we undertake no obligation to update or revise any
of them, whether as a result of new information, future events or otherwise. These risks and uncertainties are more fully detailed in our most recent Annual Report filed with the CNBV and available
through the Mexican Stock Exchange (http://www.bmv.com.mx/) and our most recent Form 20-F filing filed with the SEC (http://www.sec.gov/). These factors could cause actual results to differ materially
from those contained in any forward-looking statement.