Embed Size (px)
Citation preview

Results of Oral Human Abuse Potential Study
1
James M. Tolliver, PhD Pharmacologist
Controlled Substance Staff Office of Center Director
CDER, FDA
Wei Liu, PhD Mathematical Statistician Division of Biometrics IV
Office of Biostatistics Office of Translational Studies
CDER, FDA
August 4, 2016 Joint Meeting of the Anesthetic and Analgesic Drug Products Advisory
Committee and the Drug Safety and Risk Management Advisory Committee

Oral Human Abuse Potential Study 067-EG-008
2
• Category 3 PK/PD Study • Submitted under NDA 208-603
• Support development of EG-001 (Morphine Sulfate) ER Tablets
In this presentation product will be referred to as EG-001 tablets and not Arymo tablets.
PK – Pharmacokinetic; PD - Pharmacodynamic

Pharmacodynamic Measures Drug Liking Visual Analog Scale (VAS) – 0-100-point Bipolar Scale (Primary Measure) (at-the-moment) • Question: “Do you like the drug effect you are feeling now?” • 0 = “Strong disliking” ; 50 = “Neither like nor dislike”; 100 = “Strong liking” High VAS – 0–100-point Unipolar Scale (Secondary Measure) (at-the-moment) • Question: “How high are you now?” • 0 = “Not at All”; 100 = “Extremely” Take Drug Again VAS - 0–100-point Bipolar Scale (Secondary Measure) • Question: “Would you want to take the drug you just received again, if given the
opportunity?” • 0 = “Definitely would not”; 50 = “Do not care”; 100 = “Definitely would” • Given only at 12 and 24 hours, post-dosing.
Overall Drug Liking VAS – 0-100 point Bipolar Scale (Secondary Measure) • Statement: “Overall, my liking for this drug is:” • 0 = “Strong Disliking”, 50 = “Neither Like nor Dislike”, 100 = “Strong Liking” • Given only at 12 and 24 hours post-dosing
3

Primary Endpoint and Statistical Model
• Pharmacodynamic Parameters included Emax (peak effect) and TEmax (time to peak effect).
• The primary endpoint was Emax of Drug Liking VAS. • Statistical analyses for pharmacodynamic measures were conducted by the
FDA CDER Office of Biostatistics. • Statistical tests were conducted using a mixed effect model with fixed effects
for sequence, period, and treatment, and a random effect for subject nested in sequence. Analyses used a one-sided test at a significance level of 0.025.
• Responder analysis (percentage reduction) for Drug Liking utilized a binomial proportion test at a significance level of 0.025 to ensure that a majority of subjects were responders.
• Comparisons of Interest – MS Contin Manipulated (Positive Comparator) versus Placebo – Validation – MS Contin Manipulated versus EG-001 Manipulated
4

Pharmacokinetics
• For purposes of assessing pharmacokinetic/pharmacodynamic relationships (PK/PD), focus will be on pharmacokinetics of morphine in plasma
• Relative bioavailability analysis was generated by the Sponsor using least square
mean ratio (test/reference) along with the corresponding 90% confidence intervals.
5
Relevant Pharmacokinetic Parameters: • Cmax – Maximum observed plasma concentration of morphine • Tmax – Time at which Cmax occurs

Oral Study 067-EG-008
• Single-center, randomized, double-blind, triple-dummy, 4-way, placebo-controlled, crossover study
• Primary objective : To compare the relative abuse potential of oral intact and oral manipulated formulations of EG-001 tablets vs. oral manipulated MS Contin.
• 38 subjects completed the study. • Oral Treatments:
o MS Contin 60 mg manipulated (positive comparator) o EG-001 60 mg manipulated o EG-001 60 mg intact o Placebo
• Methods of Manipulation for EG-001 and MS Contin were based on results of Category 1 studies.
6
Pharmacokinetics of Plasma Morphine
7
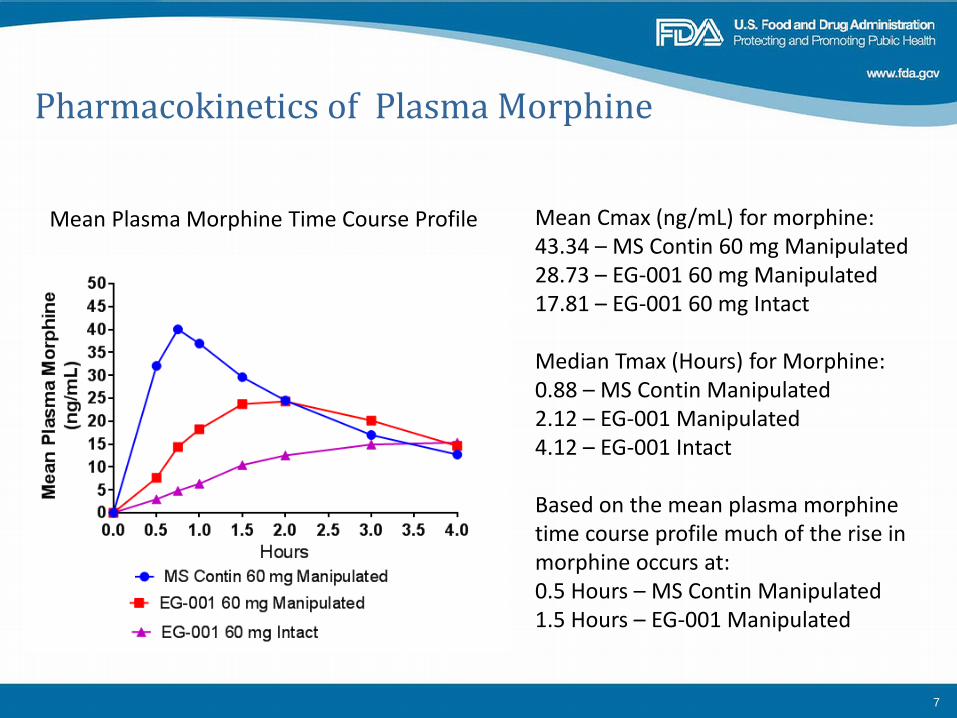
Mean Plasma Morphine Time Course Profile Mean Cmax (ng/mL) for morphine: 43.34 – MS Contin 60 mg Manipulated 28.73 – EG-001 60 mg Manipulated 17.81 – EG-001 60 mg Intact Median Tmax (Hours) for Morphine: 0.88 – MS Contin Manipulated 2.12 – EG-001 Manipulated 4.12 – EG-001 Intact Based on the mean plasma morphine time course profile much of the rise in morphine occurs at: 0.5 Hours – MS Contin Manipulated 1.5 Hours – EG-001 Manipulated

Mean Drug Liking Time Course Profile
8
Median TEmax (hrs): 1.02 – MS Contin Manipulated 1.99 – EG-001 Manipulated 3.00 – EG-001 Oral

Mean High Time Course Profile
9
Much of the rise in mean High was achieved within 0.75 hours following MS Contin Manipulated and 1.5 hrs following EG-001 manipulated. Median TEmax (Hours) 1.5 – MS Contin - Manipulated 3.0 – EG-001 Manipulated
Emax
Oral Treatments
Mean (SE) Emax (mm) (n = 38) Drug Liking
VAS (Primary)
High VAS
(Secondary)
Take Drug Again VAS (Secondary)
Overall Drug LikingVAS (Secondary)
MS Contin 60 mg Manipulated 73.3 (1.6) 51.9 (3.8) 70.1 (2.8) 69.8 (2.5) EG-001 60 mg Manipulated 68.3 (2.0) 38.8 (4.1) 62.9 (3.2) 65.1 (3.0) EG-001 60 mg Intact 63.2 (1.6) 26.8 (4.0) 54.8 (3.4) 55.7 (3.2) Placebo 53.3 (1.3) 5.3 (1.9) 51.0 (1.6) 52.2 (1.3)
10
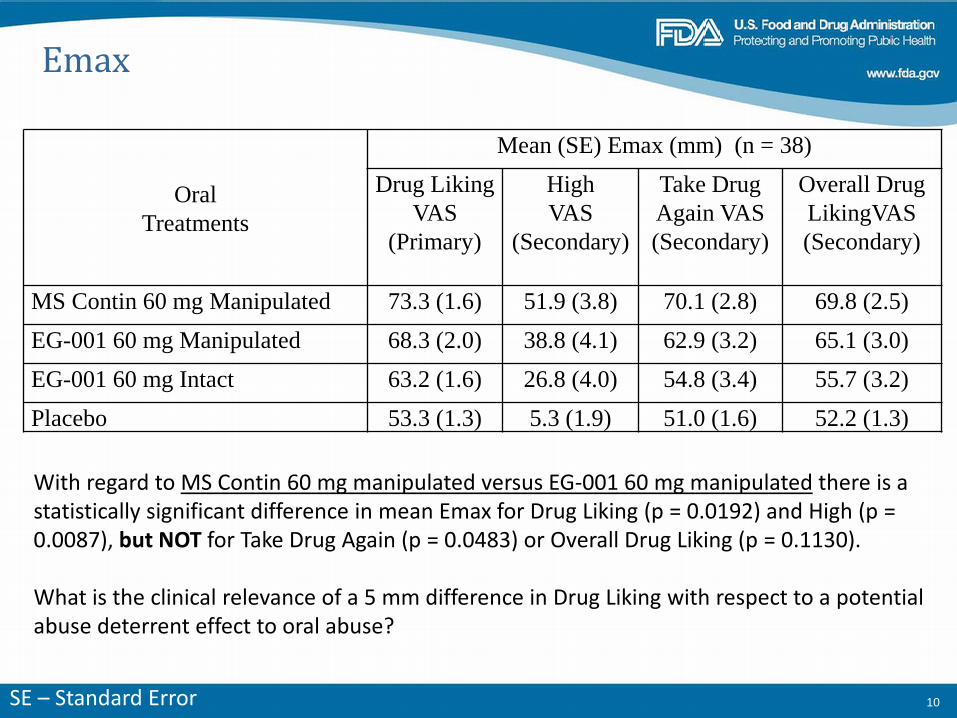
With regard to MS Contin 60 mg manipulated versus EG-001 60 mg manipulated there is a statistically significant difference in mean Emax for Drug Liking (p = 0.0192) and High (p = 0.0087), but NOT for Take Drug Again (p = 0.0483) or Overall Drug Liking (p = 0.1130). What is the clinical relevance of a 5 mm difference in Drug Liking with respect to a potential abuse deterrent effect to oral abuse?
SE – Standard Error

Responder Analysis for Emax of Drug Liking: EG-001 Manipulated Versus MS Contin Manipulated (N = 38 Subjects)
11
Number of Subjects
Percent (%)
p-value (Proportion
Test) Percent Reduction at least 0% 27 71.05 0.0047 Percent Reduction at least 5% 25 65.79 0.0258 Percent Reduction at least 10% 21 55.26 0.2582 Percent Reduction at least 20% 15 39.47 0.9028 Percent Reduction at least 30% 14 36.84 0.9476 Percent Reduction at least 40% 9 23.68 0.9994 Percent Reduction at least 50% 9 23.68 0.9994
Result: Majority of subjects did not demonstrate a 5% or greater reduction in Emax of Drug Liking following EG-001 manipulated compared to MS Contin manipulated.
Proportion test: for null hypothesis that 50% or fewer subjects are responders at a 2.5% significance level.

Summary
12
1. Oral EG-001 60 mg manipulated produced an “at-the-moment” Emax of Drug Liking that was statistically significantly lower than that produced by oral MS Contin 60 mg manipulated. The difference in Emax for these two treatments was 5 mm, raising the question of clinical significance with respect to abuse deterrent effects.
2. Oral EG-001 60 mg manipulated produced an “at-the-moment” mean Emax of High
that was significantly lower than that produced by MS Contin 60 mg manipulated. 3. As revealed by the Take Drug Again assessment, subjects, upon reflection of the
treatment experiences at 12 and 24 hours post-dosing, demonstrated a similar degree of willingness to take oral MS Contin 60 mg manipulated or EG-001 60 mg manipulated again, if given the opportunity to do so.

Summary
13
4. As revealed by the Overall Drug Liking assessment, subjects, upon reflection of the treatment experiences at 12 and 24 hours post-dosing, noted a similar degree of Drug Liking experience associated with taking either MS Contin 60 mg manipulated or EG-001 60 mg manipulated.
5. The number of subjects reporting a 5% or greater reduction in Emax of Drug Liking
following EG-001 Manipulated compared to MS Contin Manipulated was borderline statistically not significiant (p > 0.0258). So the majority of subjects did not have at least at 5% reduction in Emax of Drug Liking following EG-001 manipulated compare to following MS Contin manipulated.

Drug Utilization Patterns for Morphine ER and Other ER/LA Opioid
Analgesics 2011-2015
Joann H. Lee, PharmD Drug Utilization Data Analyst Division of Epidemiology II
Office of Pharmacovigilance and Epidemiology Office of Surveillance and Epidemiology
CDER, FDA
August 4, 2016 Joint Meeting of the Anesthetic and Analgesic Drug Products Advisory
Committee and the Drug Safety and Risk Management Advisory Committee

Outline
• Sales Distribution • Prescription Utilization • Prescriber Specialty • Limitations • Summary
2

Extended Release (ER)/ Long Acting (LA) Opioid Analgesics • Oral-dosage Forms:
– Morphine – Oxycodone – Methadone – Oxymorphone – Tapentadol – Hydromorphone – Hydrocodone
• Transdermal Delivery (TD) Systems: – Fentanyl – Buprenorphine
3

Sales Distribution Data
• IMS National Sales Perspectives Database™ • Captures sales of drug products from
manufacturers to all retail and non-retail settings – Retail chain pharmacies, mail-order
pharmacies, hospitals, etc. • Data are nationally projected • Does not represent actual patient use
4

Sales Distribution Data Year 2015
IMS Health, IMS National Sales Perspective™, Extracted June 2016
Morphine ER
Retail 86%
Non-Retail
13%
Mail Order 1%
5

• IMS Health, National Prescription Audit™(NPA)
Database • Measures dispensing of prescriptions out of
retail pharmacies into the hands of consumers • Data can be stratified by prescriber specialty
Database Descriptions Prescription Utilization and Prescriber Specialty Data :
6

Nationally estimated number of prescriptions dispensed for ER/LA opioid analgesics from U.S. outpatient retail pharmacies, 2011-2015
7
Source: IMS, National Prescription Audits (NPA). Data extracted March 2016.
Prescription Drug Utilization:
**No data for years 2011, 2012, and 2013 for hydrocodone products: Zohydro ER approved in 10/2013 and Hysingla ER approved 11/2014Source: IMS, National Prescription Audits (NPA) Data extracted March 2016. File: NPA 2016-950 Rx morphine ERLA AC June 2016.xlsx
Fentanyl TD
Morphine ER
Methadone
0.0
1.0
2.0
3.0
4.0
5.0
6.0
7.0
2011 2012 2013 2014 2015
Dis
pens
ed P
resc
ript
ions
(in
mill
ions
)
Year Morphine ER Fentanyl TD Oxycodone ERMethadone Morphine/Naltrexone ER Oxymorphone ERBuprenorphine TD Tapentadol ER Hydromorphone ERHydrocodone ER
Oxycodone ER
6.4 M

8
Top 10 prescriber specialties by the nationally estimated number of prescriptions dispensed for morphine ER from U.S. outpatient retail pharmacies
Top Prescriber Specialty: 2015
Source: IMS Health, National Prescription Audit (NPA). Year 2015. Extracted June 2016.
PRESCRIBER SPECIALTY Prescriptions (N) Share (%)Morphine ER Total Prescriptions 6,441,121 100.0%
Family Practice/General Practice/Osteopathy 1,706,226 26.5%Anesthesiology 863,681 13.4%Nurse Practitioner 811,374 12.6%Internal Medicine 709,509 11.0%Physician Assistant 619,726 9.6%Physical Medicine/Rehabilitation 524,352 8.1%Pain Medicine 362,184 5.6%Oncology 217,555 3.4%Neurology 96,472 1.5%Orthopedic Surgery 67,299 1.0%All Other Specialties 462,743 7.2%
Source: IMS, National Prescription Audit (NPA). Year 2015. Extracted June-2016. File: NPA 2016-950 specialty morphine ERLA AC June 2016.xlsx

Limitations:
• Only outpatient retail pharmacy use was
assessed • Top specialties captured as reported by the
prescription data
9
Summary: Morphine ER • Steady utilization from 2011-2015 • Most frequently dispensed ER/LA opioid
with 6.4 million prescriptions • One-quarter of prescriptions written by
family practice/general practice/osteopathy
10

Back‐UpSlidesShown
The in vitro data demonstrate that TRADENAME has physicochemical properties expected to make abuse via injection difficult. The data from the clinical study, along with support from the in vitro data, also indicate that TRADENAME has physicochemical properties that are expected to reduce abuse via the intranasal route. However, abuse of TRADENAME by these routes, as well as by the oral route, is still possible. Additional data, including epidemiological data, when available, may provide further information on the impact of the current formulation of TRADENAME on the abuse liability of the drug. Accordingly, this section may be updated in the future as appropriate.
TRADENAME contains “opioid”, an opioid agonist and Schedule II controlled substance with an abuse liability similar to other opioid agonists, legal or illicit, including fentanyl, hydromorphone, methadone, morphine, and oxymorphone. TRADENAME can be abused and is subject to misuse, addiction, and criminal diversion [see Warnings and Precautions (5.1) and Drug Abuse and Dependence (9.1)].