Embed Size (px)
Citation preview
Results of Operations of Fiscal 2008 and Business Strategies for Fiscal 2009
April 28, 2009Yasuyuki Abe
President & CEOSumisho Computer Systems Corporation
2
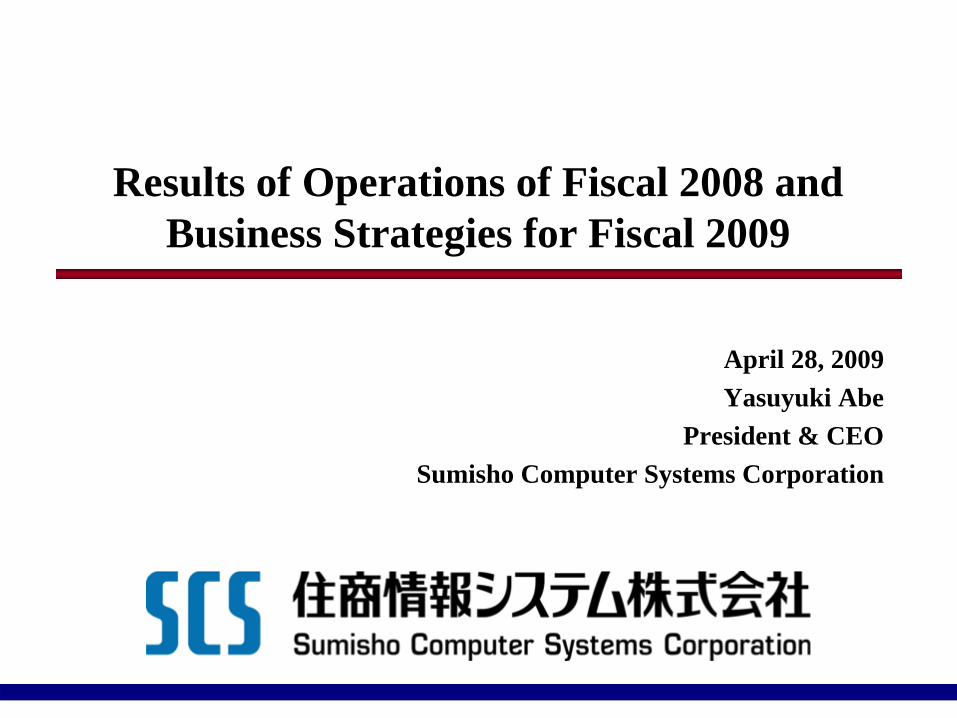
Overview of fiscal 2008 and basic policy for fiscal 2009
Securing of revenue base
Securing of revenue base
Fiscal 2007 Fiscal 2008 Fiscal 2009
Reconstruction of growth path
Reconstruction of growth path
Expansion of growth base
Expansion of growth base
Enhancement of revenue base
Enhancement of revenue base
Result ・Turmoil in financial markets・Deterioration in domestic economy
3
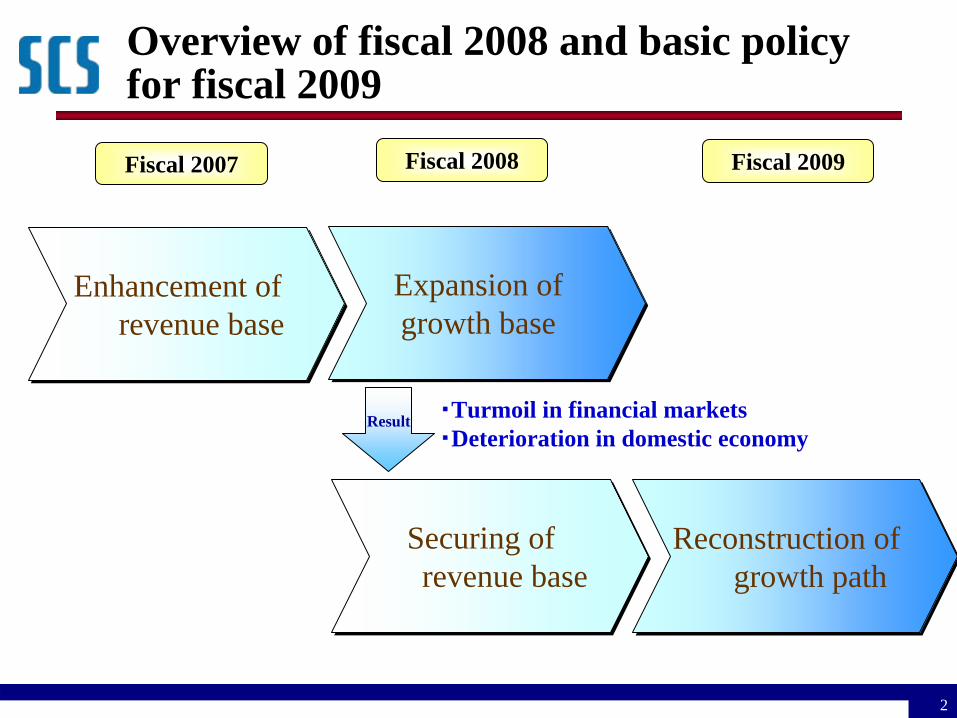
31.531.5 32.132.1Gross profit
Results of operations of fiscal 2008
Operating income
+0.6 △1.3
Sales
Consolidated
137.1 134.2
△2.9
10.310.3 9.09.0 Net income
△1.5
[Yen in billions]
Mar. 2008Actual
Mar. 2009ActualActual
5.45.4 3.93.9
4
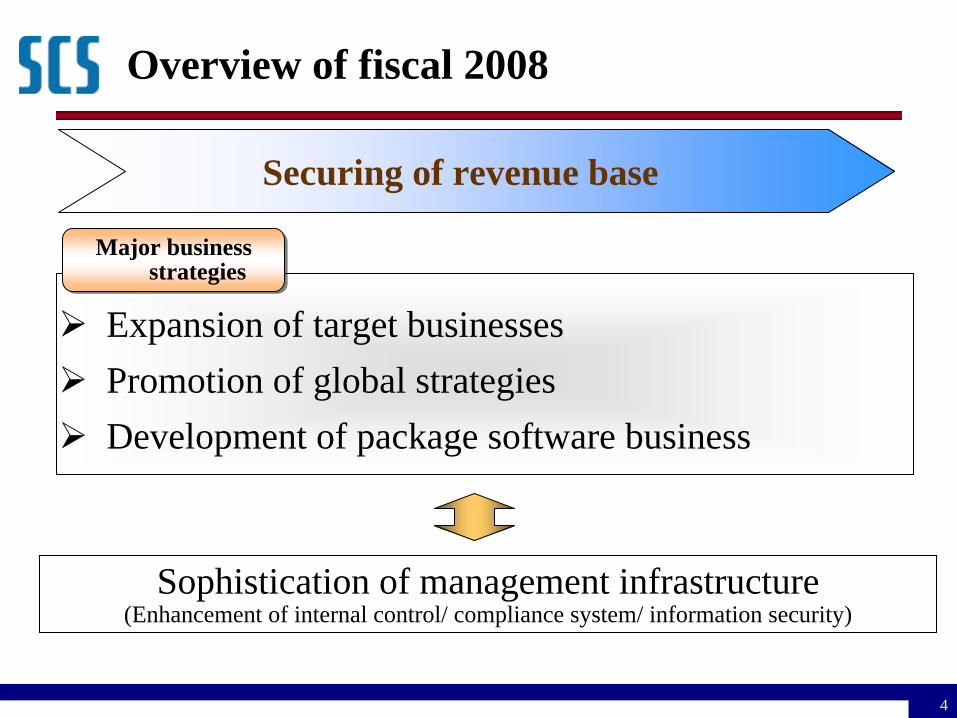
Overview of fiscal 2008
Sophistication of management infrastructure(Enhancement of internal control/ compliance system/ information security)
Expansion of target businessesPromotion of global strategiesDevelopment of package software business
Securing of revenue base
Major business strategies
Major business strategies
5
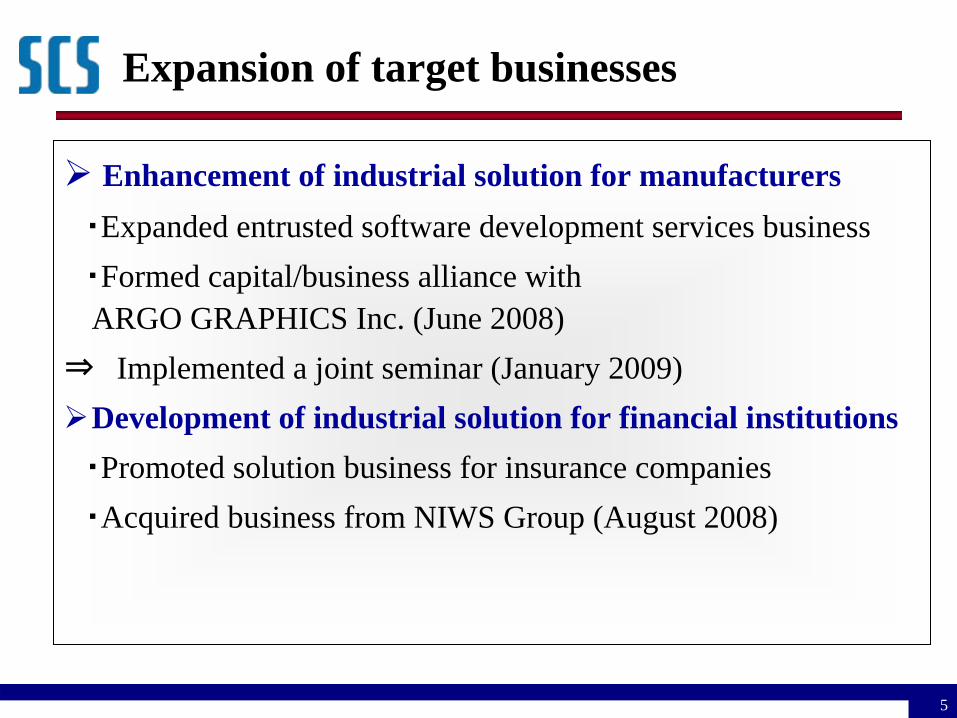
Expansion of target businesses
Enhancement of industrial solution for manufacturers・Expanded entrusted software development services business・Formed capital/business alliance with ARGO GRAPHICS Inc. (June 2008)
⇒
Implemented a joint seminar (January 2009)Development of industrial solution for financial institutions・Promoted solution business for insurance companies・Acquired business from NIWS Group (August 2008)
6
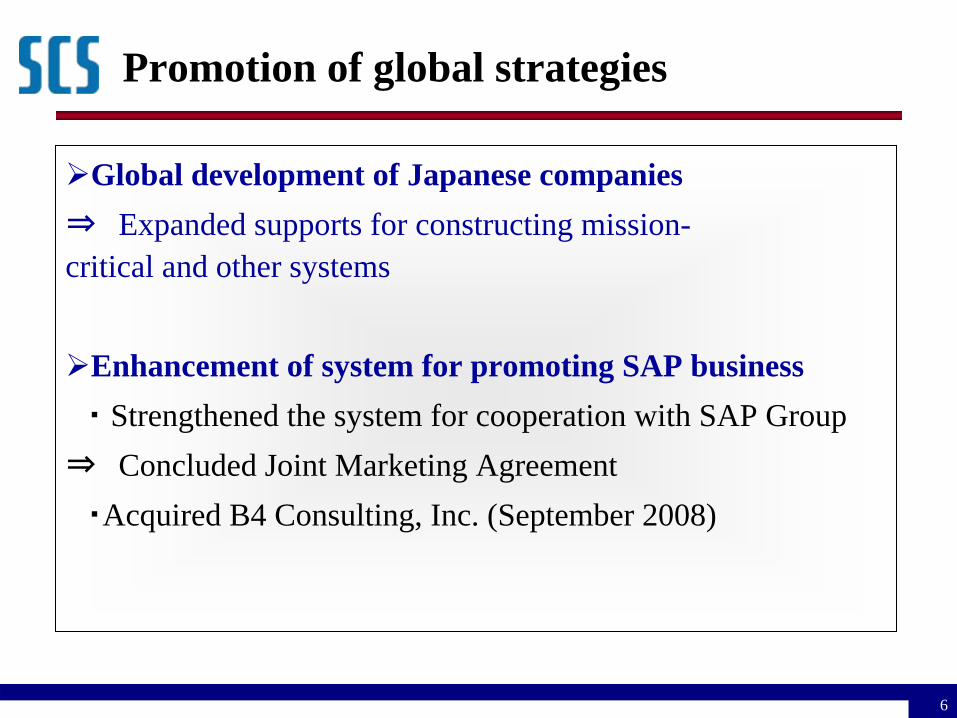
Global development of Japanese companies⇒
Expanded supports for constructing mission-
critical and other systems
Enhancement of system for promoting SAP business・
Strengthened the system for cooperation with SAP Group
⇒
Concluded Joint Marketing Agreement・Acquired B4 Consulting, Inc. (September 2008)
Promotion of global strategies
7
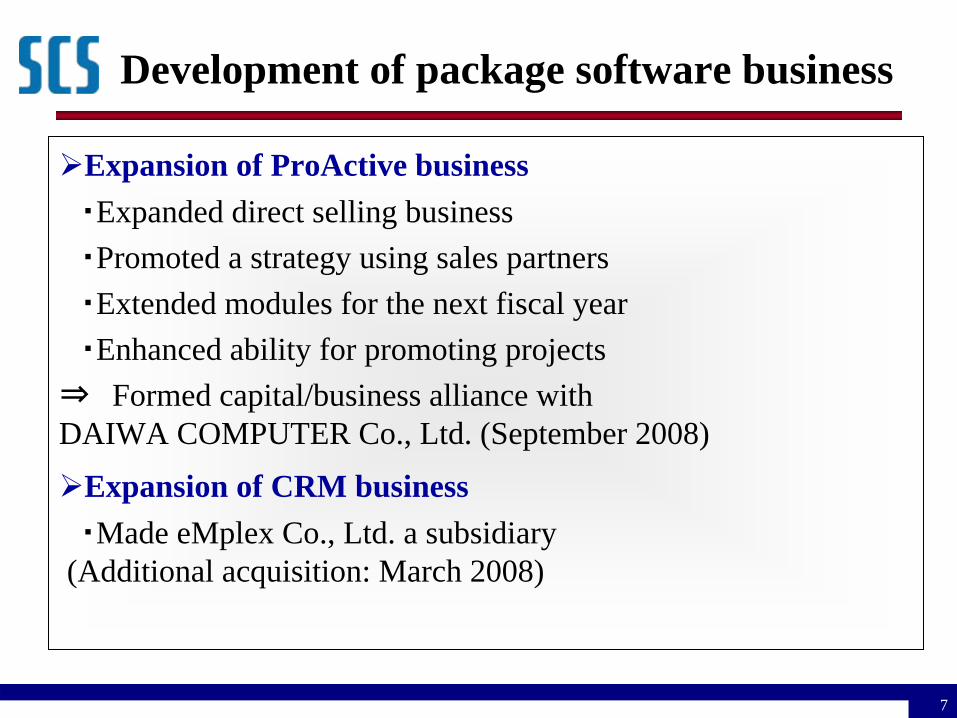
Expansion of ProActive business・Expanded direct selling business・Promoted a strategy using sales partners・Extended modules for the next fiscal year・Enhanced ability for promoting projects
⇒
Formed capital/business alliance with DAIWA COMPUTER Co., Ltd. (September 2008)
Expansion of CRM business・Made eMplex Co., Ltd. a subsidiary
(Additional acquisition: March 2008)
Development of package software business
8
Business Strategies for Fiscal 2009
9
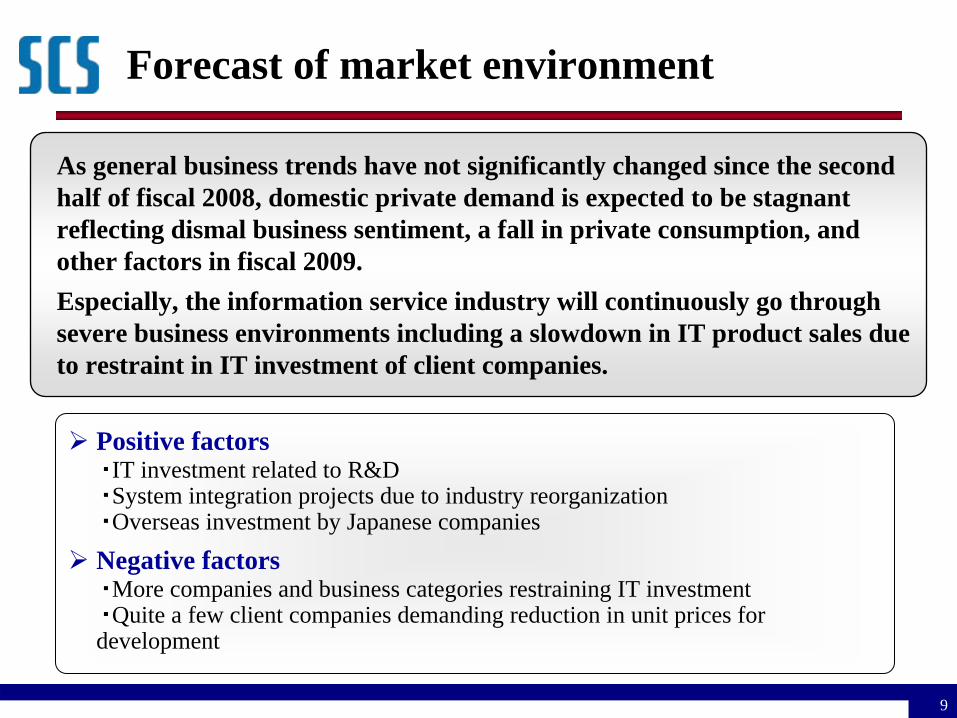
Forecast of market environment
Positive factors・IT investment related to R&D・System integration projects due to industry reorganization・Overseas investment by Japanese companies
Negative factors・More companies and business categories restraining IT investment・Quite a few client companies demanding reduction in unit prices for development
As general business trends have not significantly changed since the second half of fiscal 2008, domestic private demand is expected to be stagnant reflecting dismal business sentiment, a fall in private consumption, and other factors in fiscal 2009. Especially, the information service industry will continuously go through severe business environments including a slowdown in IT product sales due to restraint in IT investment of client companies.
10
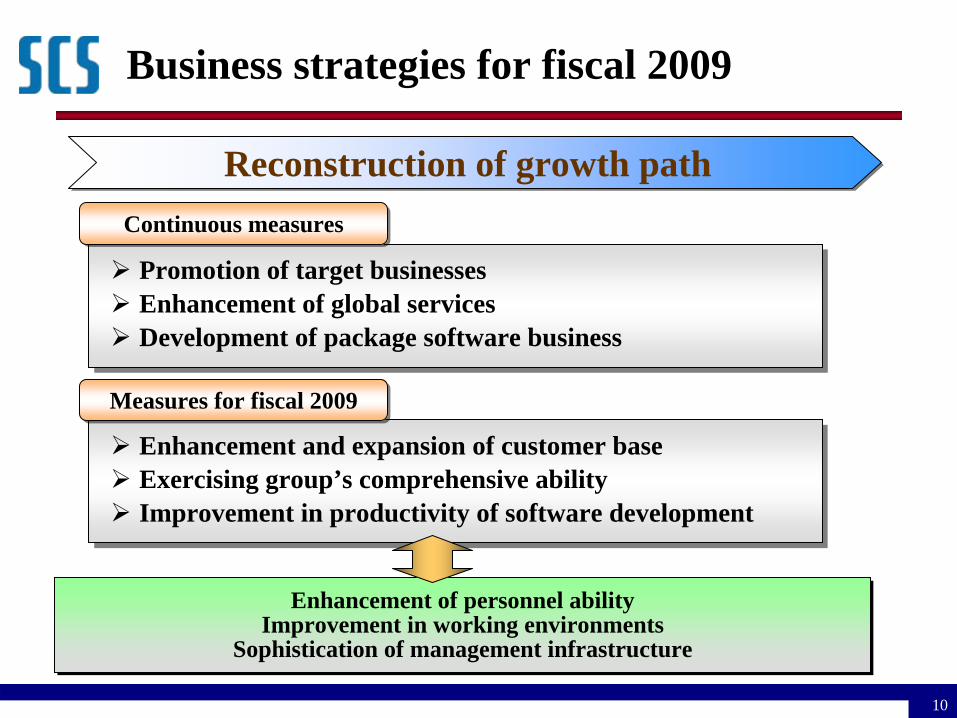
Business strategies for fiscal 2009
Reconstruction of growth pathReconstruction of growth path
Enhancement of personnel abilityImprovement in working environments
Sophistication of management infrastructure
Enhancement of personnel abilityImprovement in working environments
Sophistication of management infrastructure
Promotion of target businessesEnhancement of global servicesDevelopment of package software business
Promotion of target businessesEnhancement of global servicesDevelopment of package software business
Enhancement and expansion of customer baseExercising group’s comprehensive abilityImprovement in productivity of software development
Enhancement and expansion of customer baseExercising group’s comprehensive abilityImprovement in productivity of software development
Measures for fiscal 2009Measures for fiscal 2009
Continuous measuresContinuous measures
11
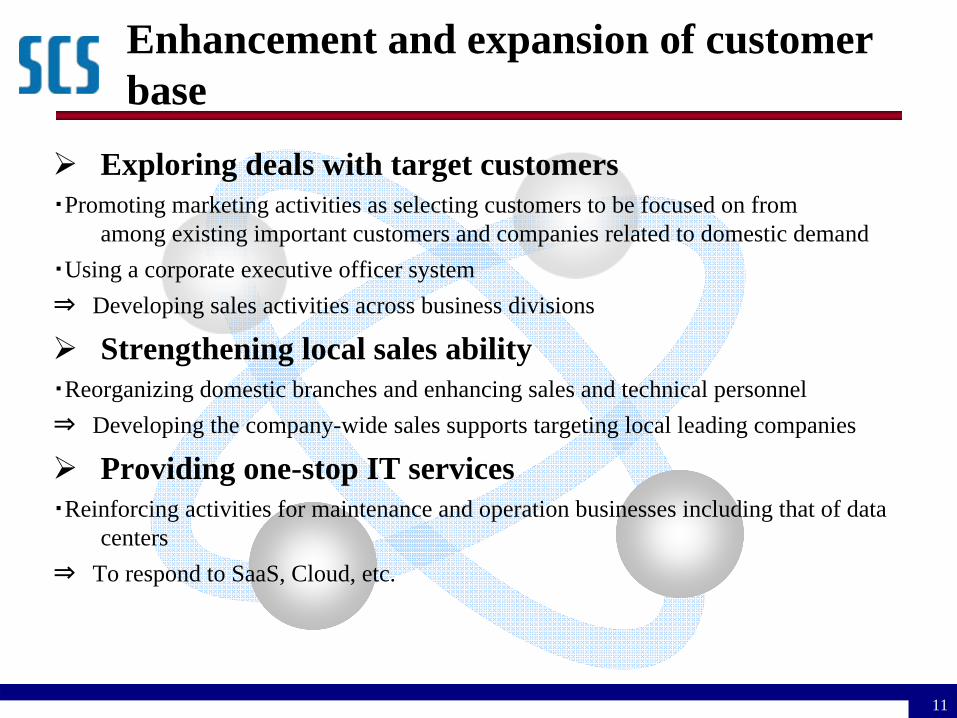
Enhancement and expansion of customer base
Exploring deals with target customers・Promoting marketing activities as selecting customers to be focused on from
among existing important customers and companies related to domestic demand・Using a corporate executive officer system⇒
Developing sales activities across business divisions
Strengthening local sales ability・Reorganizing domestic branches and enhancing sales and technical personnel⇒
Developing the company-wide sales supports targeting local leading companies
Providing one-stop IT services・Reinforcing activities for maintenance and operation businesses including that of data
centers⇒
To respond to SaaS, Cloud, etc.
12
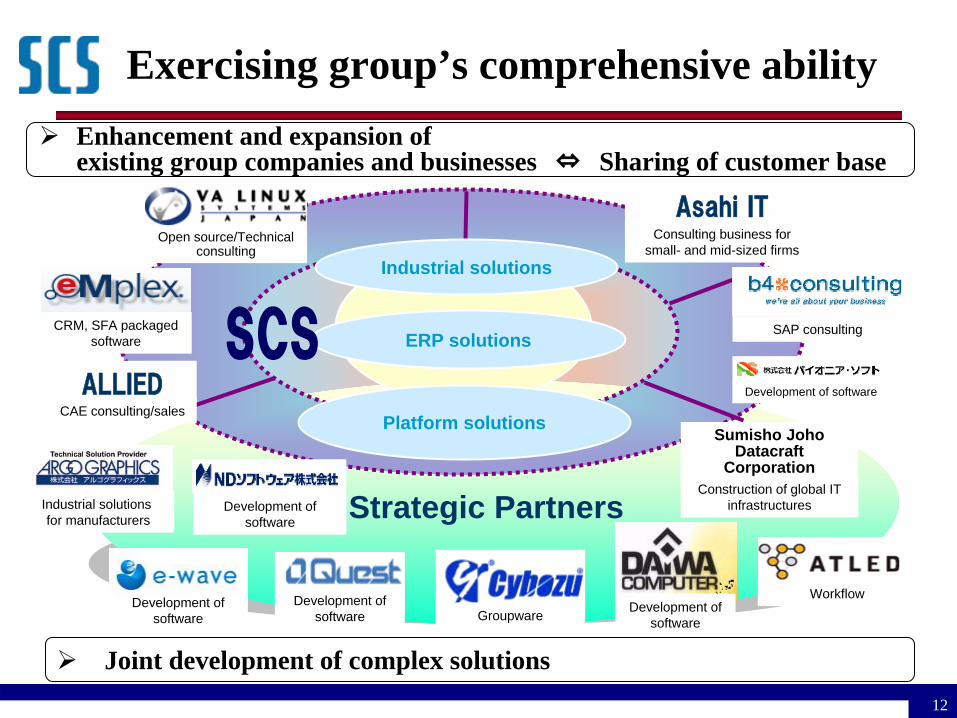
Exercising group’s comprehensive ability
Strategic Partners
SAP consulting
ALLIEDALLIEDCAE consulting/sales
Open source/Technical consulting
Groupwareソフト開発
Joint development of complex solutions
Enhancement and expansion ofexisting group companies and businesses ⇔ Sharing of customer base
Industrial solutions
ERP solutionsSCS
Industrial solutions for manufacturers
Development of software
Development of software
Development of software
Platform solutions
CRM, SFA packaged software
Workflow
Development of software
Development of software
Sumisho Joho Datacraft
CorporationConstruction of global IT
infrastructures
Asahi ITConsulting business for
small- and mid-sized firms
13
Singapore
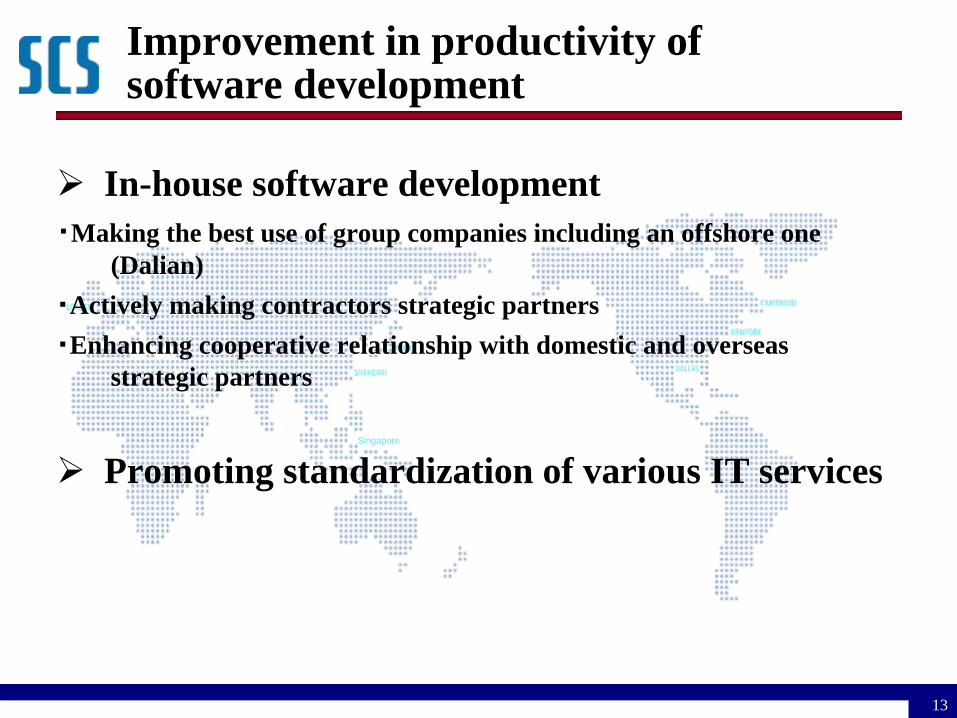
Improvement in productivity of software development
In-house software development・Making the best use of group companies including an offshore one
(Dalian)・Actively making contractors strategic partners・Enhancing cooperative relationship with domestic and overseas
strategic partners
Promoting standardization of various IT services
14
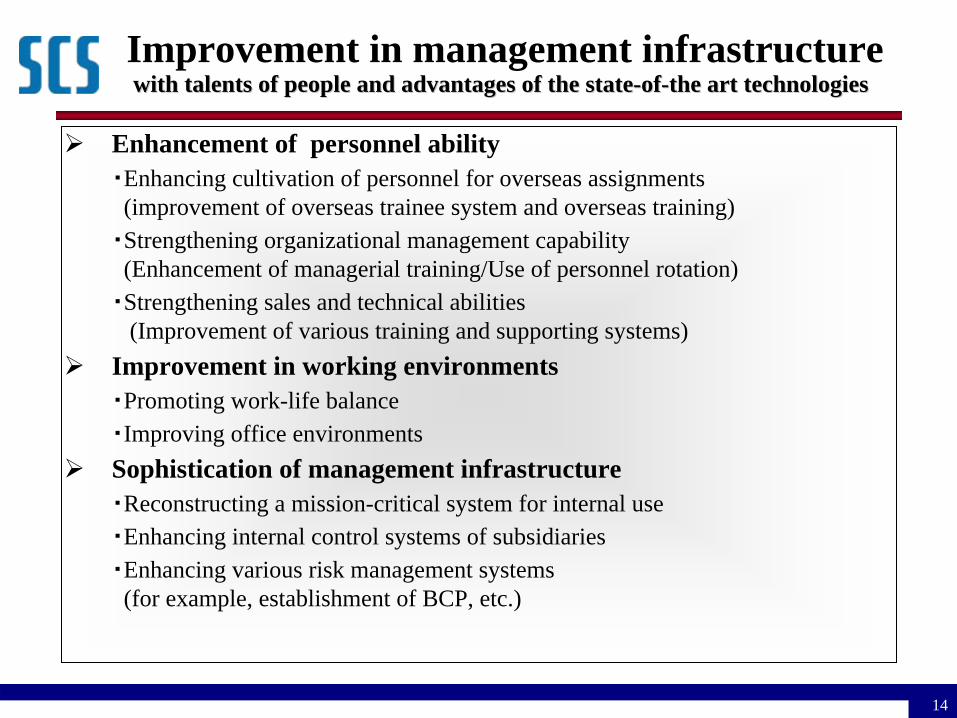
Improvement in management infrastructure with talents of people and advantages of the statewith talents of people and advantages of the state--ofof--the art technologiesthe art technologies
Enhancement of personnel ability・Enhancing cultivation of personnel for overseas assignments (improvement of overseas trainee system and overseas training)・Strengthening organizational management capability (Enhancement of managerial training/Use of personnel rotation)・Strengthening sales and technical abilities
(Improvement of various training and supporting systems)Improvement in working environments・Promoting work-life balance・Improving office environmentsSophistication of management infrastructure・Reconstructing a mission-critical system for internal use・Enhancing internal control systems of subsidiaries・Enhancing various risk management systems
(for example, establishment of BCP, etc.)
15
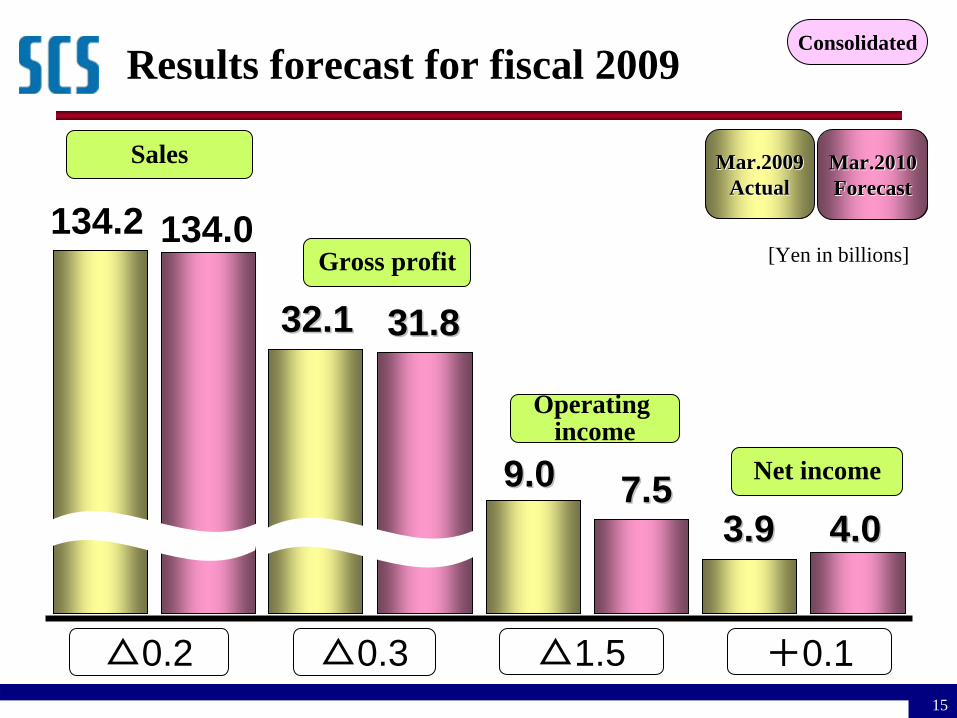
32.132.1 31.831.8
Gross profit
Results forecast for fiscal 2009
Operating income
△0.3 △1.5
Sales
Consolidated
134.2 134.0
△0.2
9.09.0 7.57.5 Net income
+0.1
[Yen in billions]
Mar.20Mar.200099ActualActual
Mar.2010Mar.2010ForecastForecast
3.93.9 4.04.0
16
Corporate vision
Global IT companyGlobal IT companyutilizing talents of people and utilizing talents of people and
advantages of the stateadvantages of the state--ofof--the art technologiesthe art technologiesto promote business valueto promote business value

Results of Operations (Consolidated) of Fiscal Year Ended March 2009
April 28, 2009Tetsuya Fukunaga
Director and Executive Vice PresidentSumisho Computer Systems Corporation
18
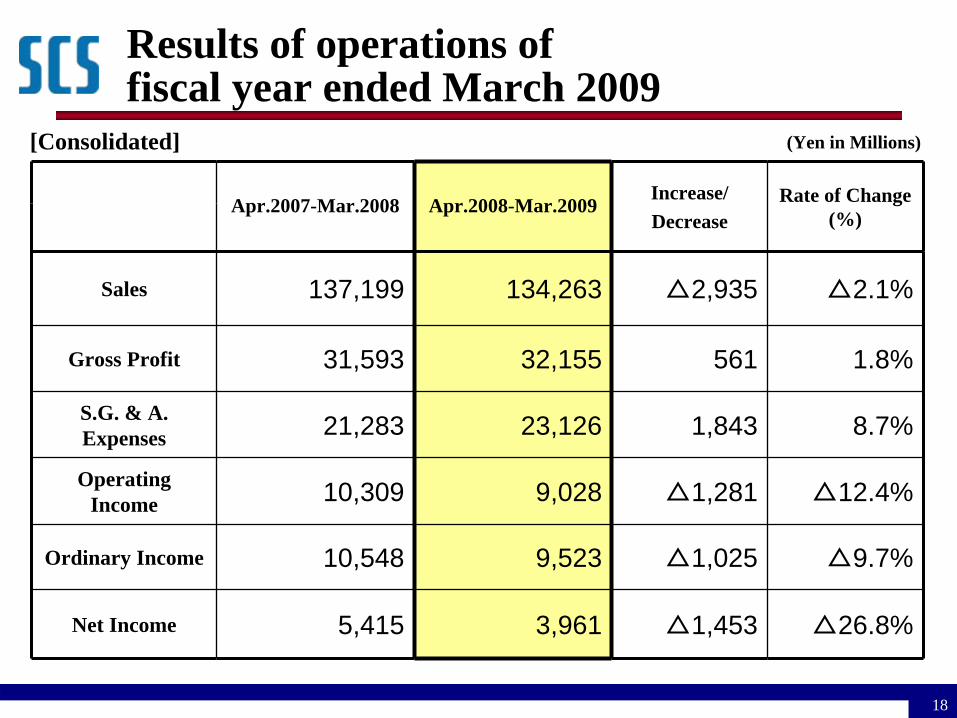
Results of operations of fiscal year ended March 2009
Apr.2007-Mar.2008 Apr.2008-Mar.2009 Increase/Decrease
Rate of Change (%)
Sales 137,199 134,263 △2,935 △2.1%
Gross Profit 31,593 32,155 561 1.8%
S.G. & A. Expenses 21,283 23,126 1,843 8.7%
Operating Income 10,309 9,028 △1,281 △12.4%
Ordinary Income 10,548 9,523 △1,025 △9.7%
Net Income 5,415 3,961 △1,453 △26.8%
(Yen in Millions)[Consolidated]
19
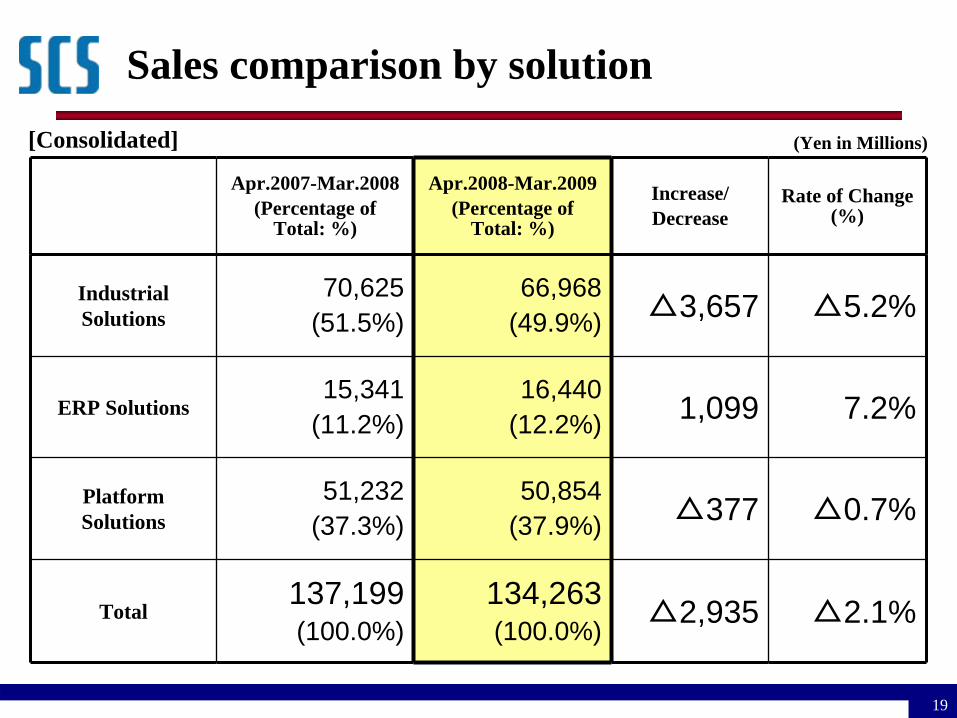
Sales comparison by solution
(Yen in Millions)[Consolidated]
Apr.2007-Mar.2008(Percentage of
Total: %)
Apr.2008-Mar.2009(Percentage of
Total: %)
Increase/Decrease
Rate of Change (%)
Industrial Solutions
70,625(51.5%)
66,968(49.9%) △3,657 △5.2%
ERP Solutions15,341
(11.2%)16,440
(12.2%) 1,099 7.2%
Platform Solutions
51,232(37.3%)
50,854(37.9%) △377 △0.7%
Total137,199(100.0%)
134,263(100.0%) △2,935 △2.1%
20
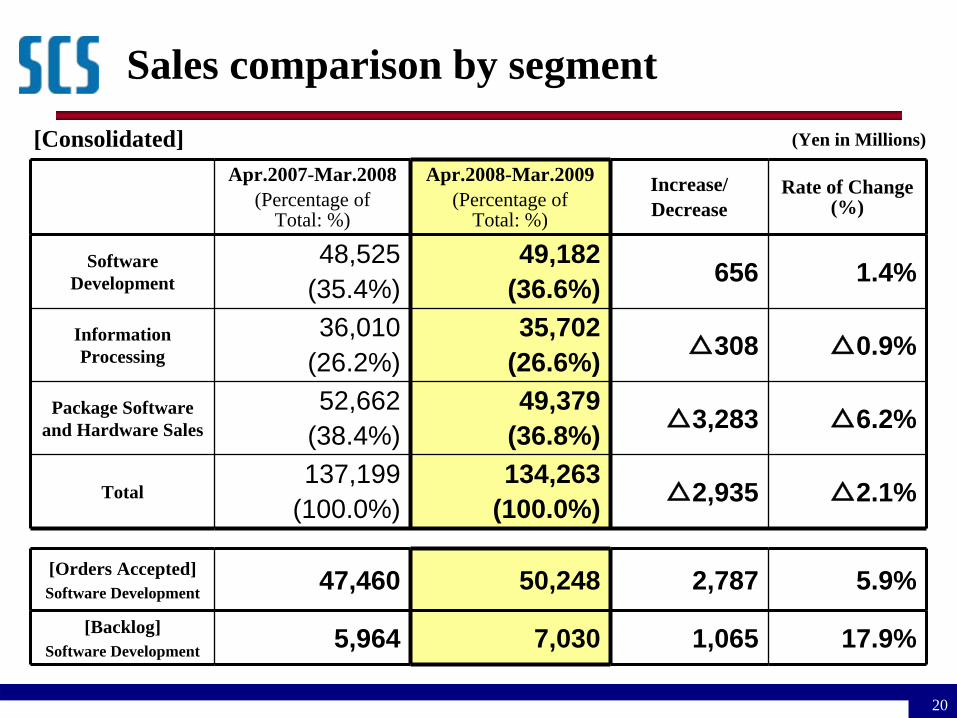
Sales comparison by segment(Yen in Millions)[Consolidated]
Apr.2007-Mar.2008(Percentage of
Total: %)
Apr.2008-Mar.2009(Percentage of
Total: %)
Increase/Decrease
Rate of Change (%)
Software Development
48,525(35.4%)
49,182(36.6%) 656 1.4%
Information Processing
36,010(26.2%)
35,702(26.6%) △308 △0.9%
Package Software and Hardware Sales
52,662(38.4%)
49,379(36.8%) △3,283 △6.2%
Total137,199
(100.0%)134,263
(100.0%) △2,935 △2.1%
[Orders Accepted]Software Development 47,460 50,248 2,787 5.9%
[Backlog]Software Development 5,964 7,030 1,065 17.9%
21
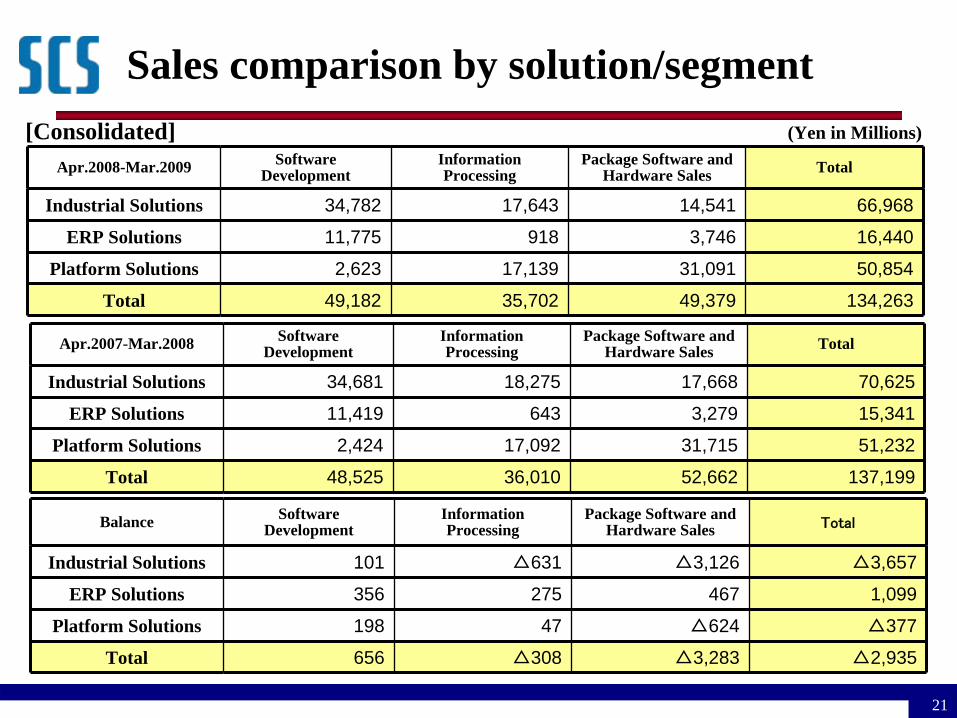
Apr.2007-Mar.2008 Software Development
Information Processing
Package Software and Hardware Sales Total
Industrial Solutions 34,681 18,275 17,668 70,625
ERP Solutions 11,419 643 3,279 15,341
Platform Solutions 2,424 17,092 31,715 51,232
Total 48,525 36,010 52,662 137,199
Apr.2008-Mar.2009 Software Development
Information Processing
Package Software and Hardware Sales Total
Industrial Solutions 34,782 17,643 14,541 66,968
ERP Solutions 11,775 918 3,746 16,440
Platform Solutions 2,623 17,139 31,091 50,854
Total 49,182 35,702 49,379 134,263
[Consolidated] (Yen in Millions)
Balance Software Development
Information Processing
Package Software and Hardware Sales Total
Industrial Solutions 101 △631 △3,126 △3,657
ERP Solutions 356 275 467 1,099
Platform Solutions 198 47 △624 △377
Total 656 △308 △3,283 △2,935
Sales comparison by solution/segment
22
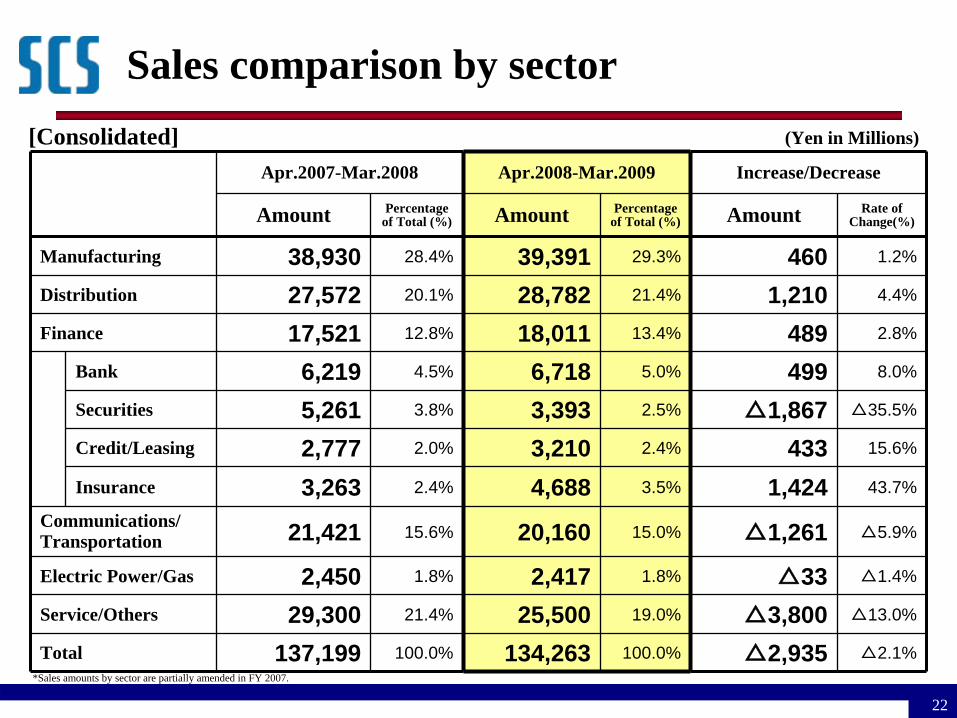
Sales comparison by sector(Yen in Millions)[Consolidated]
Apr.2007-Mar.2008 Apr.2008-Mar.2009 Increase/Decrease
Amount Percentage of Total (%) Amount Percentage
of Total (%) Amount Rate of Change(%)
Manufacturing 38,930 28.4% 39,391 29.3% 460 1.2%
Distribution 27,572 20.1% 28,782 21.4% 1,210 4.4%
Finance 17,521 12.8% 18,011 13.4% 489 2.8%
Bank 6,219 4.5% 6,718 5.0% 499 8.0%
Securities 5,261 3.8% 3,393 2.5% △1,867 △35.5%
Credit/Leasing 2,777 2.0% 3,210 2.4% 433 15.6%
Insurance 3,263 2.4% 4,688 3.5% 1,424 43.7%
Communications/Transportation 21,421 15.6% 20,160 15.0% △1,261 △5.9%
Electric Power/Gas 2,450 1.8% 2,417 1.8% △33 △1.4%
Service/Others 29,300 21.4% 25,500 19.0% △3,800 △13.0%
Total 137,199 100.0% 134,263 100.0% △2,935 △2.1%*Sales amounts by sector are partially amended in FY 2007.
23
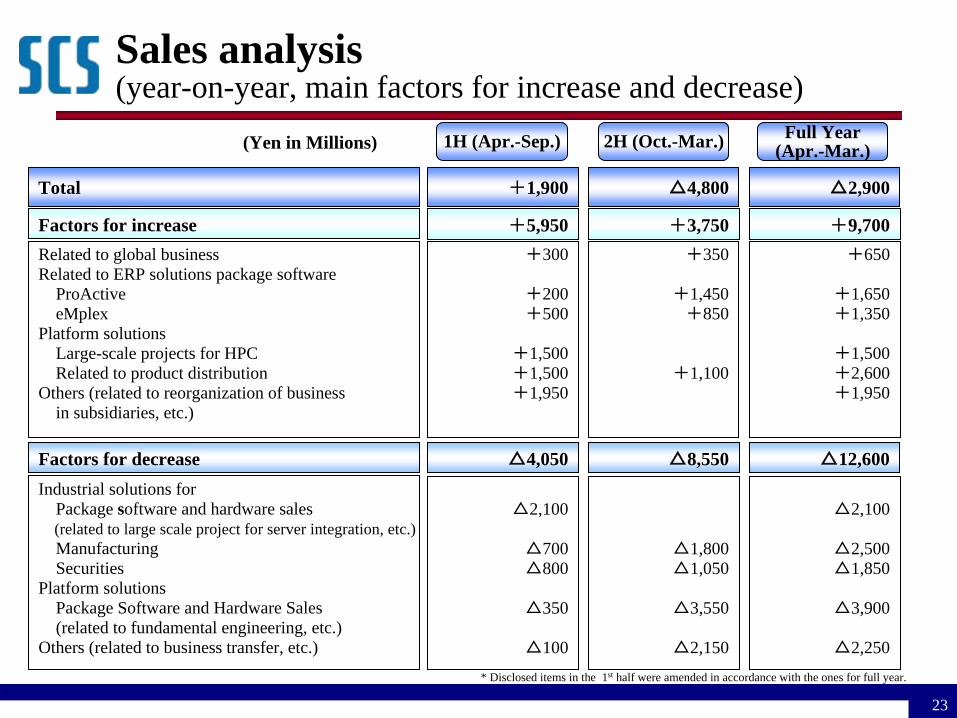
Related to global businessRelated to ERP solutions package software
ProActiveeMplex
Platform solutionsLarge-scale projects for HPCRelated to product distribution
Others (related to reorganization of business in subsidiaries, etc.)
Industrial solutions forPackage software and hardware sales(related to large scale project for server integration, etc.)ManufacturingSecurities
Platform solutionsPackage Software and Hardware Sales (related to fundamental engineering, etc.)
Others (related to business transfer, etc.)
Factors for decrease
Factors for increase
1H (Apr.-Sep.) 2H (Oct.-Mar.) Full Year(Apr.-Mar.)
+5,950+300
+200+500
+1,500+1,500+1,950
+650
+1,650+1,350
+1,500+2,600+1,950
+3,750 +9,700
△4,050 △8,550 △12,600
△2,100
△700△800
△350
△100
△1,800△1,050
△3,550
△2,150
△2,100
△2,500△1,850
△3,900
△2,250
+1,900 △4,800 △2,900Total
* Disclosed items in the 1st half were amended in accordance with the ones for full year.
+350
+1,450+850
+1,100
Sales analysis (year-on-year, main factors for increase and decrease)
(Yen in Millions)

24
Related to global businessRelated to ERP solutions package software
ProActiveeMplex
Platform solutionsRelated to product distribution
Unprofitable businessesOthers (related to reorganization of business
in subsidiaries, etc.)
Industrial solutions forPackage software and hardware sales(related to large scale project for server integration, etc.)ManufacturingSecurities
Platform solutionsPackage Software and Hardware Sales (related to fundamental engineering, etc.)
Others (related to business transfer, etc.)
Factors for decrease
Factors for increase
1H (Apr.-Sep.) 2H (Oct.-Mar.) Full Year(Apr.-Mar.)
+1,530+200
+300+150
+210+80+590
+360
+460+450
+450+250+620
+1,060 +2,590
△480 △1,550 △2,030
△ 110
△200△230
+70
△10
△730△230
△80
△510
△110
△930△460
△10
△520
+1,050 △490 +560Total
* Disclosed items in the 1st half were amended in accordance with the ones for full year.
+160
+160+300
+240+170+30
Gross profit analysis (year-on-year, main factors for increase and decrease)
(Yen in Millions)
25
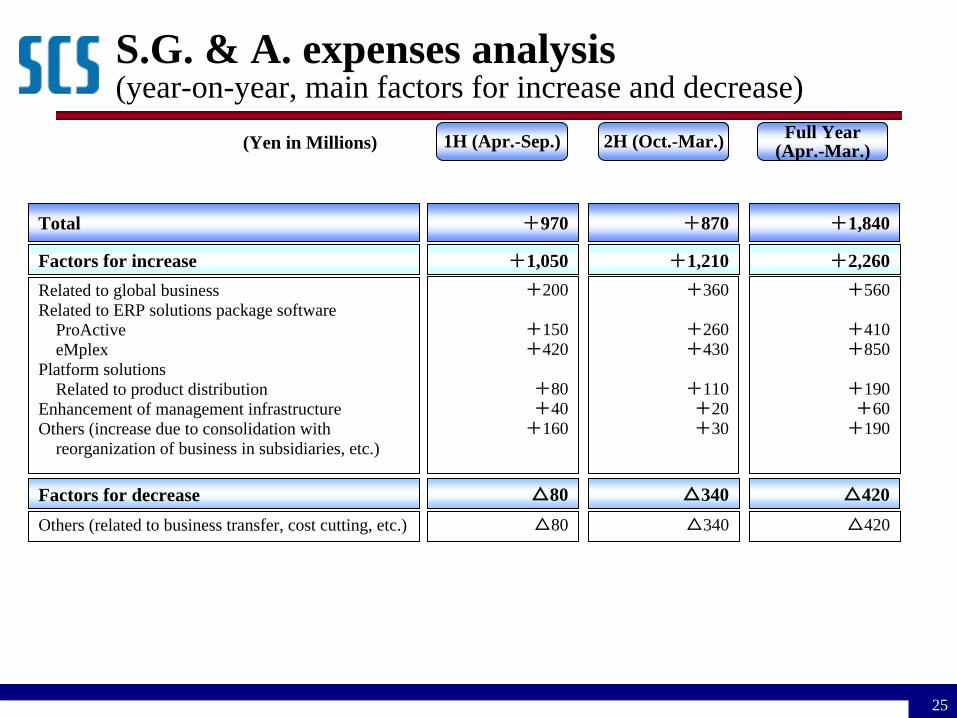
Related to global businessRelated to ERP solutions package software
ProActiveeMplex
Platform solutionsRelated to product distribution
Enhancement of management infrastructureOthers (increase due to consolidation with
reorganization of business in subsidiaries, etc.)
Others (related to business transfer, cost cutting, etc.)
Factors for decrease
Factors for increase
1H (Apr.-Sep.) 2H (Oct.-Mar.) Full Year(Apr.-Mar.)
+1,050+200
+150+420
+80+40+160
+560
+410+850
+190+60+190
+1,210 +2,260
△80 △340 △420△80 △340 △420
+970 +870 +1,840Total
+360
+260+430
+110+20+30
S.G. & A. expenses analysis (year-on-year, main factors for increase and decrease)
(Yen in Millions)
26
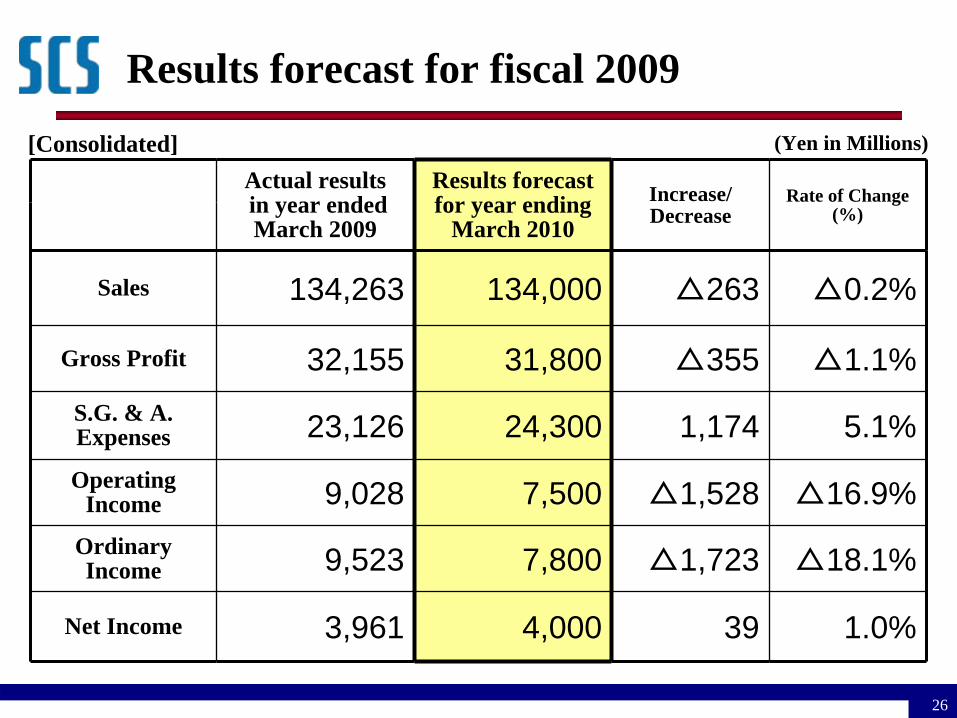
Results forecast for fiscal 2009(Yen in Millions)[Consolidated]
Actual results in year ended March 2009
Results forecast for year ending
March 2010Increase/ Decrease
Rate of Change (%)
Sales 134,263 134,000 △263 △0.2%
Gross Profit 32,155 31,800 △355 △1.1%S.G. & A. Expenses 23,126 24,300 1,174 5.1%Operating
Income 9,028 7,500 △1,528 △16.9%Ordinary Income 9,523 7,800 △1,723 △18.1%
Net Income 3,961 4,000 39 1.0%
27
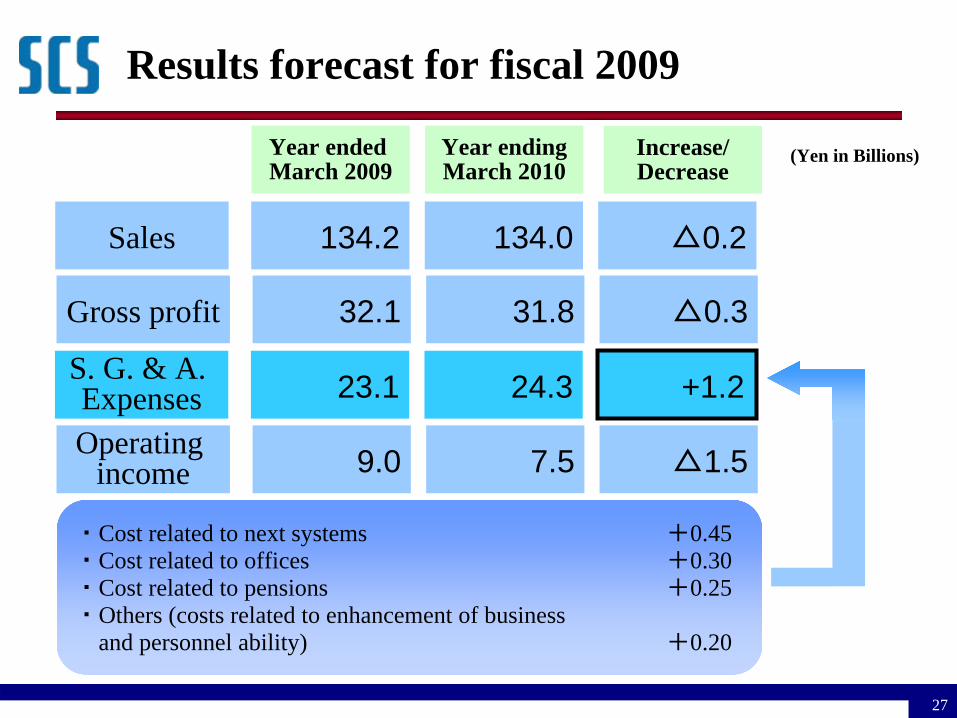
Results forecast for fiscal 2009
Year ended March 2009
Year endingMarch 2010
Increase/Decrease
Operating income 9.0 7.5 △1.5
・Cost related to next systems +0.45・Cost related to offices +0.30・Cost related to pensions +0.25・Others (costs related to enhancement of business
and personnel ability) +0.20
Sales 134.2 134.0 △0.2
32.1 31.8 △0.3Gross profit
S. G. & A. Expenses 23.1 24.3 +1.2
(Yen in Billions)
28
Your continued support and Your continued support and encouragement will be encouragement will be
greatly appreciatedgreatly appreciated
29
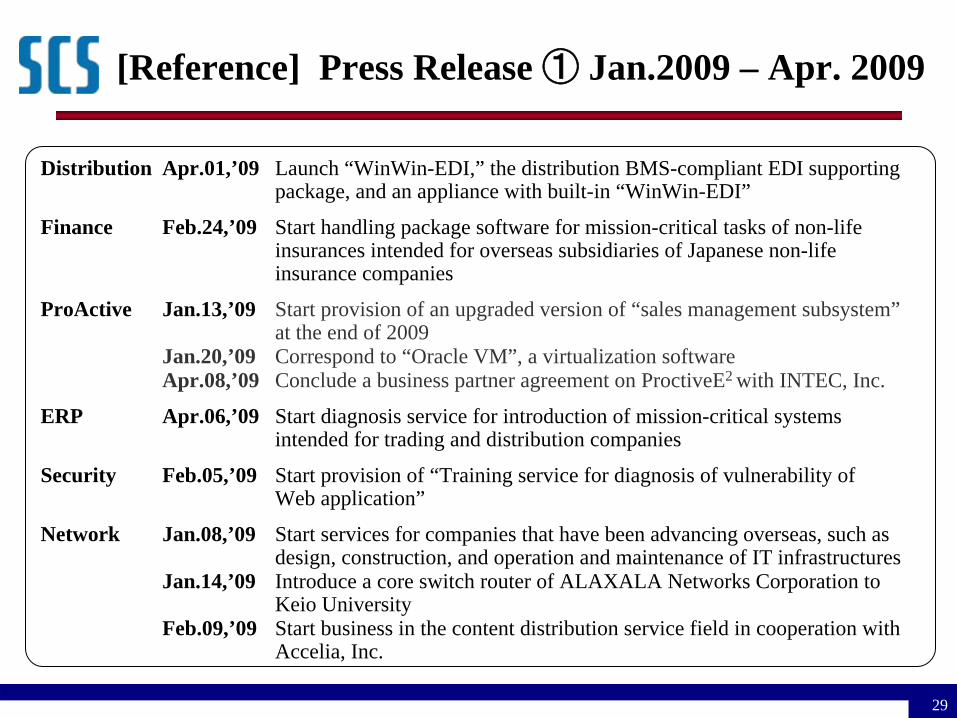
[Reference] Press Release ① Jan.2009 – Apr. 2009
Distribution Apr.01,’09 Launch “WinWin-EDI,” the distribution BMS-compliant EDI supporting package, and an appliance with built-in “WinWin-EDI”
Finance Feb.24,’09 Start handling package software for mission-critical tasks of non-life insurances intended for overseas subsidiaries of Japanese non-life insurance companies
ProActive Jan.13,’09 Start provision of an upgraded version of “sales management subsystem” at the end of 2009
Jan.20,’09 Correspond to “Oracle VM”, a virtualization softwareApr.08,’09 Conclude a business partner agreement on ProctiveE2 with INTEC, Inc.
ERP Apr.06,’09 Start diagnosis service for introduction of mission-critical systems intended for trading and distribution companies
Security Feb.05,’09 Start provision of “Training service for diagnosis of vulnerability of Web application”
Network Jan.08,’09 Start services for companies that have been advancing overseas, such as design, construction, and operation and maintenance of IT infrastructures
Jan.14,’09 Introduce a core switch router of ALAXALA Networks Corporation to Keio University
Feb.09,’09 Start business in the content distribution service field in cooperation with Accelia, Inc.
30
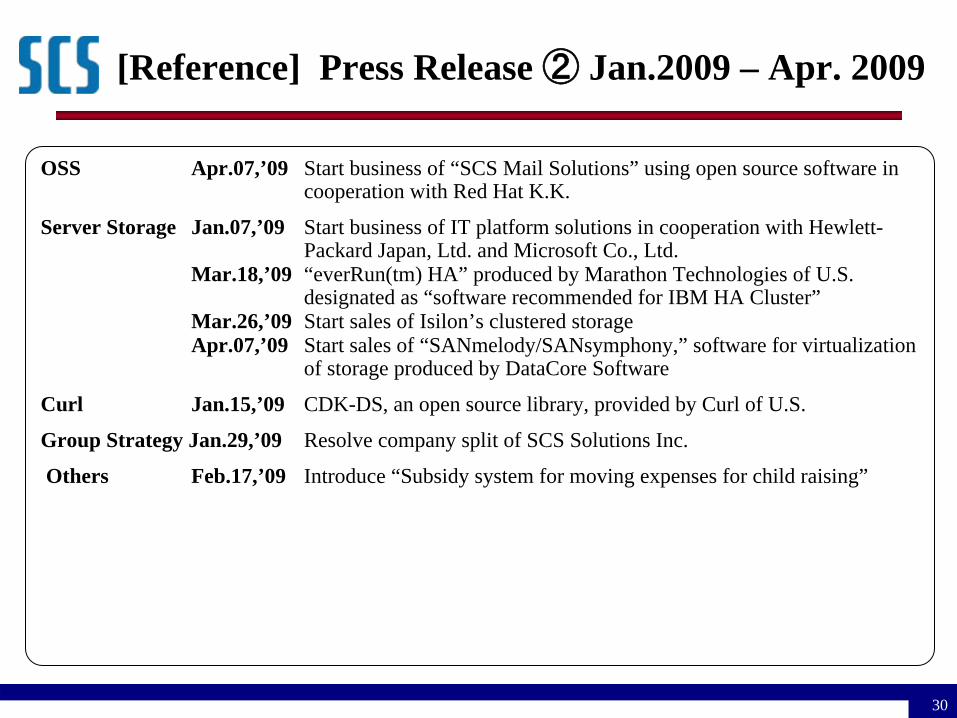
[Reference] Press Release ② Jan.2009 – Apr. 2009
OSS Apr.07,’09 Start business of “SCS Mail Solutions” using open source software in cooperation with Red Hat K.K.
Server Storage Jan.07,’09 Start business of IT platform solutions in cooperation with Hewlett- Packard Japan, Ltd. and Microsoft Co., Ltd.
Mar.18,’09 “everRun(tm) HA” produced by Marathon Technologies of U.S. designated as “software recommended for IBM HA Cluster”
Mar.26,’09 Start sales of Isilon’s clustered storageApr.07,’09 Start sales of “SANmelody/SANsymphony,” software for virtualization
of storage produced by DataCore Software
Curl Jan.15,’09 CDK-DS, an open source library, provided by Curl of U.S.
Group Strategy Jan.29,’09 Resolve company split of SCS Solutions Inc.
Others Feb.17,’09 Introduce “Subsidy system for moving expenses for child raising”